the msi2 protein expression positive correlation with...
TRANSCRIPT
Med & Health Jun 2017; 12(1): 66-82
ORIGINAL ARTICLE
66
https://doi.org/10.17576/MH.2017.1201.08
Address for correspondence and reprint requests: Omayma Saad Eldeen Bakheet, Department of Pathology, Faculty of Medicine, Universiti Kebangsaan Malaysia Medical Centre, Jalan Yaacob Latif, Bandar Tun Razak, 56000 Cheras, Kuala Lumpur, Malaysia. Tel: 603-91455373 Fax: 603-91456676 E-mail: [email protected]
The Msi2 Protein Expression Positive Correlation with Favorable Cytogenetics Findings in AML
OMAYMA SEB, NURASYIKIN Y, AZMA RZ, SURIA AA, CHANDRAMAYA S, NORAIDAH M
Department of Pathology, Faculty of Medicine, Universiti Kebangsaan Malaysia Medical Centre, Jalan Yaacob Latif, Bandar Tun Razak, 56000 Cheras, Kuala Lumpur, Malaysia.
ABSTRAK
Akut myeloid leukemia (AML) adalah sub-jenis akut leukemia yang kebiasaannya mempunyai prognosis yang tidak baik. Protein Msi2 merupakan penanda prognostik yang baru yang telah dianggap sebagai sasaran baru untuk terapi AML. Setakat ini, kajian ekpresi Msi2 protein di dalam kes AML belum pernah dijalankan lagi. Tujuan utama kajian ini adalah untuk melihat ekspresi Msi2 protein pada pesakit AML menggunakan teknik immunohistokimia (IHC) dan mengaitkan ekspresi tersebut dengan prognostik yang telah dikenalpasti dan parameter klinikal dalam AML beserta survival keseluruhan (OS). Enam puluh empat biopsi trephine tulang sum-sum telah melalui proses immunopewarnaan untuk Msi2 protein. Peratusan sel blast dengan reaksi positif dan intensiti pewarnaan cytoplasmic dan nuklear telah dinilai. Ekspresi Msi2 protein ditemui di dalam sejumlah 95.3% kes dengan corak Msi2 yang berbeza-beza antara kes. Dalam 71.9% kes, sel blast menunjukkan positivity selular secara keseluruhan dan 23.4% kes hanya menunjukkan positivity sitoplasma. Majoriti menunjukkan ekspresi Msi2 yang tinggi untuk pewarnaan cytoplasmic. Amat menariknya apabila terdapat korelasi yang signifikan antara jumlah pewarnaan selular total dan subkumpulan sitogenetik pertengahan (P = 0.04). Hasil kajian menunjukkan bahawa majoriti daripada pesakit mempunyai ekspresi Msi2 yang tinggi tetapi ia tidak menunjukkan korelasi dengan OS. Walau bagaimanapun, ekspresi Msi2 telah menunjukkan korelasi yang baik dengan penemuan sitogenetik. Keputusan ini menunjukkan penyelidikan secara meluas pada masa hadapan perlu dijalankan untuk menentukan dengan lebih tepat peranan sel-sel blast yang positif Msi2 dalam AML di kalangan populasi di Malaysia dan juga menentukan korelasinya terhadap prognosis and keseluruhan kesejahteraan pesakit.
Kata kunci: AML, sitogenetik, immunohistokimia, Msi2 protein
67
Msi2 Protein Expression in AML and Cytogenetics Med & Health Jun 2017;12(1): 66-82
patients (Kumar 2011). Cytogenetic abnormalities can be found in up to 60% of newly diagnosed AML cases (Kumar 2011). These cytogenetic aberrations permit patients’ risk to be categorised as favorable, intermediate, and adverse risk groups (Estey & Döhner 2006) depending on the presence or absence of specific chromosomal abnormalities (Kumar 2011). Patients with t(8;21), t(15;17), and inv(16) were allocated to the “favorable risk” group; patients lacking any of these abnormalities and established to have abn(3q), del(5q), -5/-7, or complex karyotype were assigned to the “adverse risk” group; and patients with normal
ABSTRACT
Acute myeloid leukaemia (AML) is the most common subtype of acute leukaemias with a poor outcome. Msi2 protein is a newly discovered prognostic marker and it has been considered as a new target for therapy in AML. The study of Msi2 protein expression in AML cases has not been performed in Malaysia, to date. The main aim of the present study was to observe the expression of Msi2 protein in AML patients by immunohistochemistry (IHC) and to correlate its expression with the well-established prognostic and clinical parameters in AML as well as the overall survival (OS). Sixty four bone marrow trephine biopsy sections were immunostained for Msi2 protein. The percentage of blasts with positive reaction and the intensity of the cytoplasmic and nuclear staining were evaluated. The expression of Msi2 protein was found in 95.3% cases with Msi2 pattern varying between the cases. In 71.9% of cases, the blasts showed total cellular positivity and 23.4% cases showed only cytoplasmic positivity. Majority showed high expression of Msi2 for cytoplasmic staining. Interestingly, there was significant correlation between total cellular staining and the intermediate cytogenetic subgroup (P= 0.04). In conclusion, the results showed that the majority of the patients had high expression of Msi2 but this did not correlate to OS. However, the Msi2 expression correlated to the cytogenetic findings. The results suggest future extensive research to be conducted in order to ascertain the exact role of Msi2 positive blast cells in AML in our population and their association with prognosis and outcome.
Keywords: AML, cytogenetics, immunohistochemistry, Msi2 protein
INTRODUCTION
Acute myeloid leukaemia (AML) is a group of clonal haematopoietic stem cell disorders, where failure to differentiate into mature cells and excessive proliferation in the bone marrow stem cells compartment, result in the accumulation of myeloblasts (Stone et al. 2004). In Malaysia, leukaemia is the seventh most common cancer, with an incidence of 2.9 per 100,000 population accounting for all leukaemias (Meng et al. 2013). It should be noted that cytogenetics is the most powerful prognostic factor for predicting remission rate, relapse and overall survival (OS) in AML
68
Med & Health Jun 2017;12(1): 66-82 Omayma S.E.B. et al.
karyotype and numerical or other structural abnormalities, comprised the "intermediate risk" group (Grimwade et al. 2010). Cytogenetically normal AML (CN-AML) patients constitute the largest (approximately 45%) group of all patients (Foran 2010). Rearrangements and mutations of several genes such as Fms-like tyrosine kinase 3 (FLT3), nucleophosmin 1 (NPM1), and CCAAT enhancer-binding protein-αα(CEBPA) were identified in this group of patients and shown to be important prognostic factors (Swerdlow et al. 2008, Foran 2010). The Musashi (Msi) gene family members, Msi1 and Msi2, are located on chromosome 12 and 17, respectively (Byers et al. 2011). They encoded for a group of RNA-binding proteins that bind, via 2 ribonucleoprotein-type RNA recognition motifs in their N-terminal, to consensus motifs in mRNAs to inhibit translation (Sakakibara et al. 2002; Barbouti et al. 2003; Kawahara et al. 2008). In haematopoietic stem cells (HSCs), Msi2 is the predominant form expressed and its knockdown leads to reduced engraftment and depletion of HSCs in vivo (Kharas et al. 2010). Also, its expression is associated with up-regulation of cell cycle genes (RAS, mitogen-activated protein kinase, cyclin D1, and MYC) and with homeobox genes, including MEISI, HOXA9, and HOXA1 (Byers et al. 2011). Recently, Park et al. (2015) demonstrated that Msi2 directly maintains the mixed-lineage leukemia (MLL) self-renewal program by interacting with and retaining efficient translation of HOXA9, MYC, and IKZF2 mRNAs. Furthermore, Msi2 is highly
expressed in human myeloid leukemia cell lines in which its depletion via inhibiton of Ki-67 expression leads to decreased proliferation and increased apoptosis (Kharas et al. 2010; Park et al. 2015; Han et al. 2015). Kharas et al. (2010) studied Msi2 expression data gained from 436 AML patients. The expression of Msi2 was significantly associated with specific cytogenetic and molecular genetic aberrations. Patients with inversion of chromosome 16 showed lower Msi2 levels comparative to other leukaemia subgroups, whereas Msi2 expression was higher in subjects harboring monosomy 7. Likewise, high Msi2 expression was associated with FLT3 internal tandem duplications and NPM1 mutations but not with mixed-lineage-leukemia 1 partial tandem duplication (MLL-PTD) and CEBPA (Kharas et al. 2010). Byers et al. (2011) measured Msi2 protein level by immunohistochemistry (IHC) in 120 AML patients. Their study concluded that Msi2 is highly expressed in myeloblasts which associated with decreased survival in AML, suggesting its use as a new prognostic marker (Byers et al. 2011). The objective of the study was to measure the expression of Msi2 protein in AML patients by IHC technique and to demonstrate the correlation between the Msi2 protein with several known prognostic parameters such as age of patients, white blood cell (WBC) count at diagnosis, French-American-British (FAB) subtypes, cytogenetic categories as well as the remission status post induction and finally to correlate the expression of Msi2
69
Msi2 Protein Expression in AML and Cytogenetics Med & Health Jun 2017;12(1): 66-82
with OS. Few previous studies have suggested that Msi2 protein is a useful new prognostic biomarker where high expression of this protein is associated with decreased survival in patients with AML. The knowledge gained not only to evaluate the effect of this protein in our local AML population, but it is also hoped to contribute to the strategies for the treatment of AML in order to improve our patients’ survival rate.
MATERIALS AND METHODS
SAMPLE SELECTION
All the available cases with histological diagnosis of AML in Universiti Kebangsaan Malaysia Medical Centre (UKMMC) for 6 yrs were selected by using universal sampling. A total of 64 cases of newly diagnosed AML were collected. Bone marrow (BM) trephine sections with at least 20% leukaemic blasts were selected as a part of the inclusion criteria to maintain adequacy of the specimen for evaluation. Meanwhile, all the hematoxylin and eosin (H&E) slides of BM trephine biopsy were reviewed and the paraffin embedded tissues were retrieved for whole tissue section and IHC for Msi2 expression.
IMMUNOHISTOCHEMISTRY
Primary antibody rabbit monoclonal [EP1305Y] antibody specific to Msi2 (Code No: ab76148, Abcam England) was diluted to optimal dilution 1:2000 using Dako Antibody Diluent (Code No. S080983, Dako Denmark). The whole BM trephine biopsy sections
were cut onto SuperfrostTM Plus coated slides (Thermo ScientificTM, USA). Furthermore, the staining was performed using the protocols from staining kit Dako REALTMEnvisionTM Detection System, Peroxidase/DAB+, Rabbit/Mouse (Code No. K5007, Dako Denmark). Washing steps between each reagent were performed using Lab Vision™ Tris-Buffered Saline and Tween™ 20 (20x) (Thermo Scientific™ USA). The DAB Substrate Working Solution was prepared by diluting the 50x concentrated Dako REALTM DAB+ chromogen with Dako REALTM Substrate Buffer (Code No. K5007, Dako Denmark). The tissue sections were initially incubated on a slide warmer at 65ºC for 30 mins. Next, tissue sections were dewaxed using 2-steps Xylene (Merck Germany) and rehydrated using decreasing alcohol solutions (100%, 80% and 70%) prepared from 100% Surgipath Reagent Alcohol (Leica Microsystems USA). Tissue sections were subsequently incubated with peroxidase blocking reagent H2O2 for 6 mins. Furthermore, tissue sections were pretreated using heat-induced antigen retrieval Citrate Buffer Solution, pH 6.1 (DAKO) in the Pascal Pressurized Chamber (Dako Cytomation, USA) at 96°C for 40 mins. Next, tissue sections were left to cool down at room temperature for 20 mins. Slides were then incubated with primary antibody for 60 mins at room temperature, followed by secondary antibody incubation with Dako REALTM EnvisionTM/HRP, Rabbit/Mouse (ENV) (Code No. K5007, Dako Denmark) for 30 mins. Tissue
70
Med & Health Jun 2017;12(1): 66-82 Omayma S.E.B. et al.
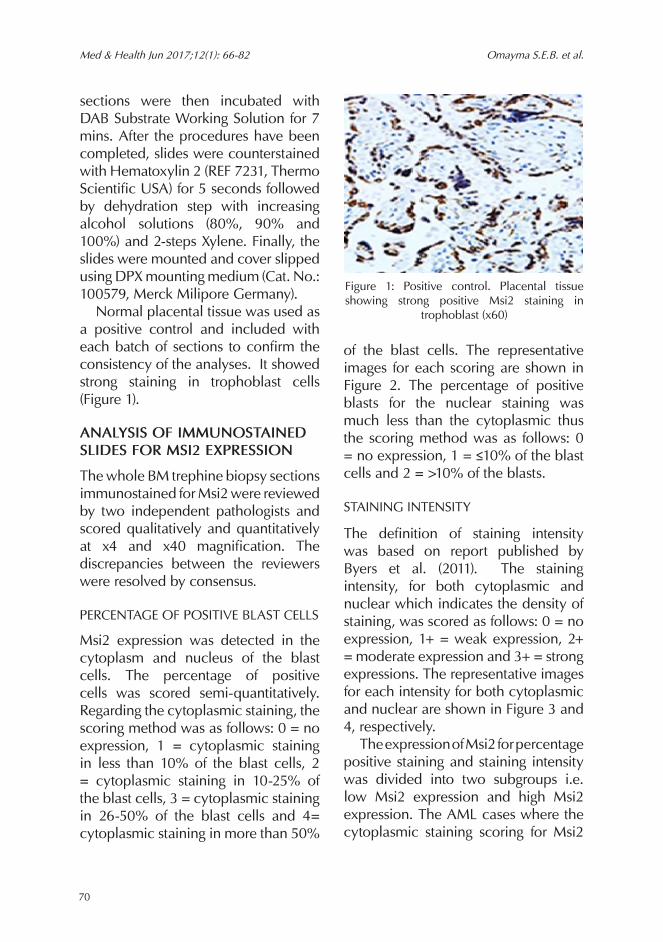
sections were then incubated with DAB Substrate Working Solution for 7 mins. After the procedures have been completed, slides were counterstained with Hematoxylin 2 (REF 7231, Thermo Scientific USA) for 5 seconds followed by dehydration step with increasing alcohol solutions (80%, 90% and 100%) and 2-steps Xylene. Finally, the slides were mounted and cover slipped using DPX mounting medium (Cat. No.: 100579, Merck Milipore Germany). Normal placental tissue was used as a positive control and included with each batch of sections to confirm the consistency of the analyses. It showed strong staining in trophoblast cells (Figure 1).
ANALYSIS OF IMMUNOSTAINED SLIDES FOR MSI2 EXPRESSION
The whole BM trephine biopsy sections immunostained for Msi2 were reviewed by two independent pathologists and scored qualitatively and quantitatively at x4 and x40 magnification. The discrepancies between the reviewers were resolved by consensus.
PERCENTAGE OF POSITIVE BLAST CELLS
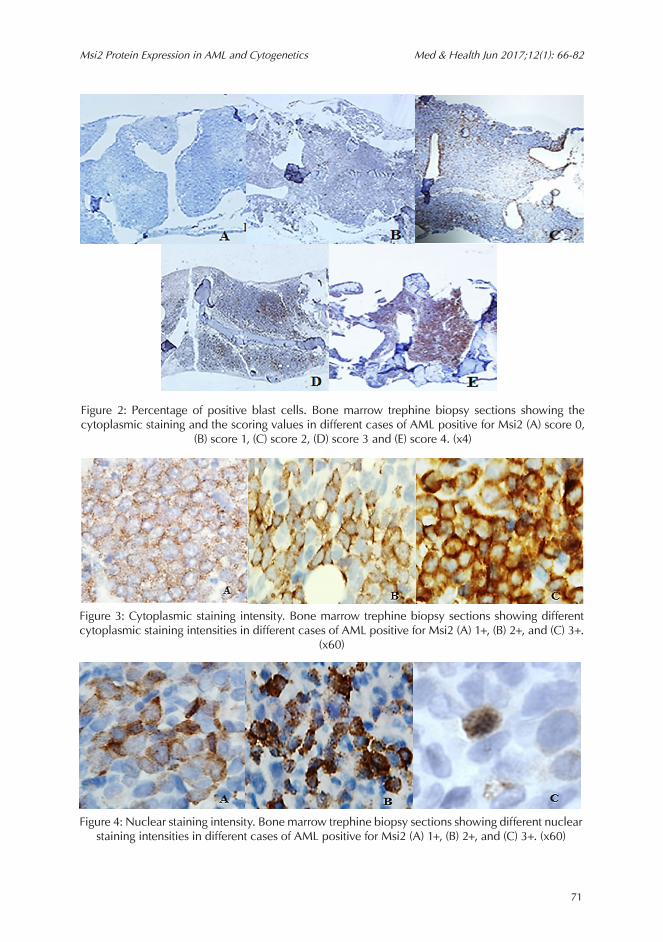
Msi2 expression was detected in the cytoplasm and nucleus of the blast cells. The percentage of positive cells was scored semi-quantitatively. Regarding the cytoplasmic staining, the scoring method was as follows: 0 = no expression, 1 = cytoplasmic staining in less than 10% of the blast cells, 2 = cytoplasmic staining in 10-25% of the blast cells, 3 = cytoplasmic staining in 26-50% of the blast cells and 4= cytoplasmic staining in more than 50%
of the blast cells. The representative images for each scoring are shown in Figure 2. The percentage of positive blasts for the nuclear staining was much less than the cytoplasmic thus the scoring method was as follows: 0 = no expression, 1 = ≤10% of the blast cells and 2 = >10% of the blasts.
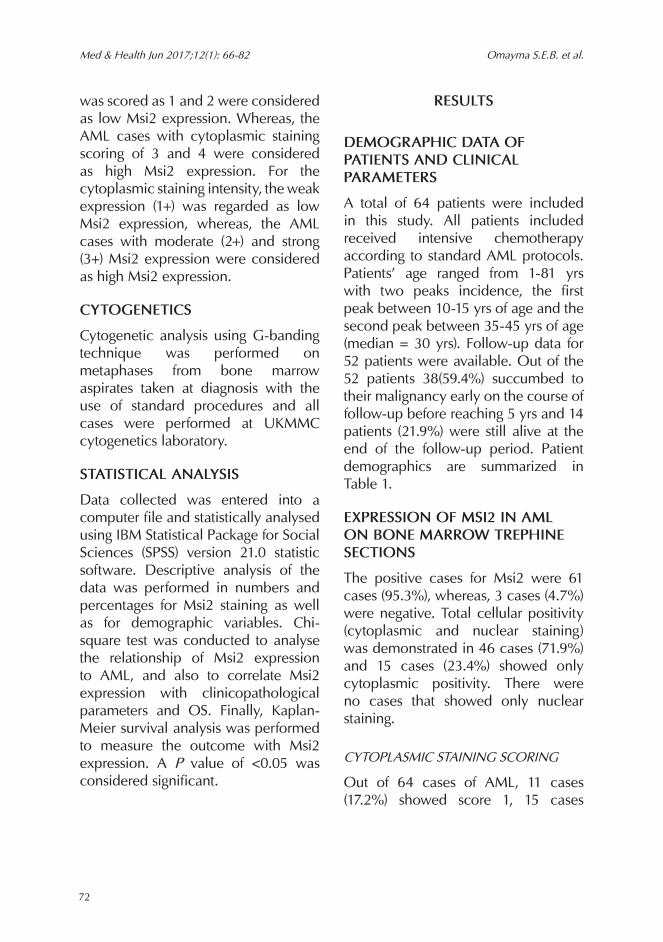
STAINING INTENSITY
The definition of staining intensity was based on report published by Byers et al. (2011). The staining intensity, for both cytoplasmic and nuclear which indicates the density of staining, was scored as follows: 0 = no expression, 1+ = weak expression, 2+ = moderate expression and 3+ = strong expressions. The representative images for each intensity for both cytoplasmic and nuclear are shown in Figure 3 and 4, respectively. The expression of Msi2 for percentage positive staining and staining intensity was divided into two subgroups i.e. low Msi2 expression and high Msi2 expression. The AML cases where the cytoplasmic staining scoring for Msi2
Figure 1: Positive control. Placental tissue showing strong positive Msi2 staining in
trophoblast (x60)
71
Msi2 Protein Expression in AML and Cytogenetics Med & Health Jun 2017;12(1): 66-82
Figure 2: Percentage of positive blast cells. Bone marrow trephine biopsy sections showing the cytoplasmic staining and the scoring values in different cases of AML positive for Msi2 (A) score 0,
(B) score 1, (C) score 2, (D) score 3 and (E) score 4. (x4)
Figure 3: Cytoplasmic staining intensity. Bone marrow trephine biopsy sections showing different cytoplasmic staining intensities in different cases of AML positive for Msi2 (A) 1+, (B) 2+, and (C) 3+.
(x60)
Figure 4: Nuclear staining intensity. Bone marrow trephine biopsy sections showing different nuclear staining intensities in different cases of AML positive for Msi2 (A) 1+, (B) 2+, and (C) 3+. (x60)
72
Med & Health Jun 2017;12(1): 66-82 Omayma S.E.B. et al.
was scored as 1 and 2 were considered as low Msi2 expression. Whereas, the AML cases with cytoplasmic staining scoring of 3 and 4 were considered as high Msi2 expression. For the cytoplasmic staining intensity, the weak expression (1+) was regarded as low Msi2 expression, whereas, the AML cases with moderate (2+) and strong (3+) Msi2 expression were considered as high Msi2 expression.
CYTOGENETICS
Cytogenetic analysis using G-banding technique was performed on metaphases from bone marrow aspirates taken at diagnosis with the use of standard procedures and all cases were performed at UKMMC cytogenetics laboratory.
STATISTICAL ANALYSIS
Data collected was entered into a computer file and statistically analysed using IBM Statistical Package for Social Sciences (SPSS) version 21.0 statistic software. Descriptive analysis of the data was performed in numbers and percentages for Msi2 staining as well as for demographic variables. Chi-square test was conducted to analyse the relationship of Msi2 expression to AML, and also to correlate Msi2 expression with clinicopathological parameters and OS. Finally, Kaplan-Meier survival analysis was performed to measure the outcome with Msi2 expression. A P value of <0.05 was considered significant.
RESULTS
DEMOGRAPHIC DATA OF PATIENTS AND CLINICAL PARAMETERS
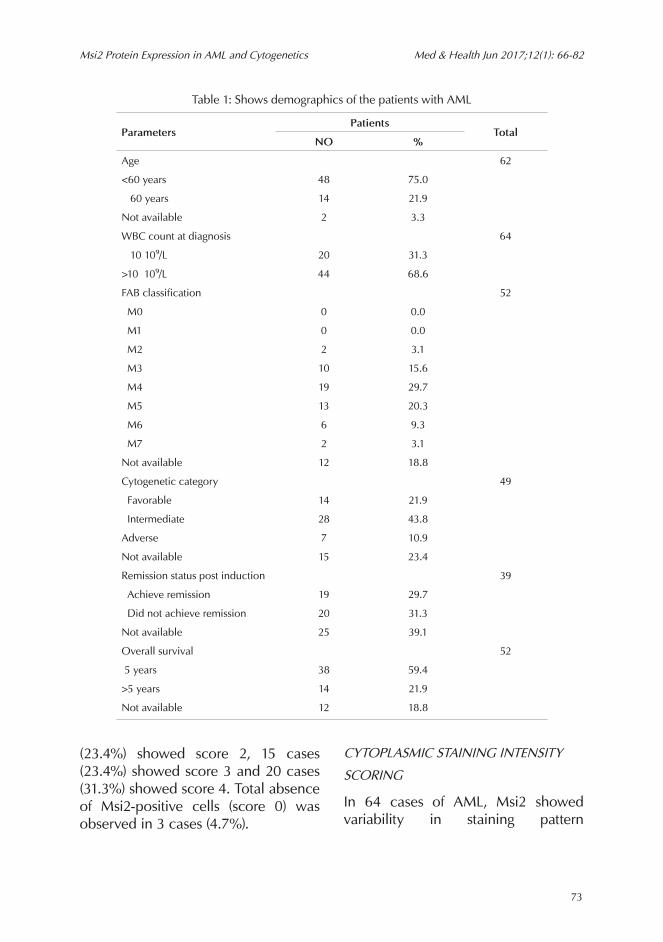
A total of 64 patients were included in this study. All patients included received intensive chemotherapy according to standard AML protocols. Patients’ age ranged from 1-81 yrs with two peaks incidence, the first peak between 10-15 yrs of age and the second peak between 35-45 yrs of age (median = 30 yrs). Follow-up data for 52 patients were available. Out of the 52 patients 38(59.4%) succumbed to their malignancy early on the course of follow-up before reaching 5 yrs and 14 patients (21.9%) were still alive at the end of the follow-up period. Patient demographics are summarized in Table 1.
EXPRESSION OF MSI2 IN AML ON BONE MARROW TREPHINE SECTIONS
The positive cases for Msi2 were 61 cases (95.3%), whereas, 3 cases (4.7%) were negative. Total cellular positivity (cytoplasmic and nuclear staining) was demonstrated in 46 cases (71.9%) and 15 cases (23.4%) showed only cytoplasmic positivity. There were no cases that showed only nuclear staining.
CYTOPLASMIC STAINING SCORING
Out of 64 cases of AML, 11 cases (17.2%) showed score 1, 15 cases
73
Msi2 Protein Expression in AML and Cytogenetics Med & Health Jun 2017;12(1): 66-82
(23.4%) showed score 2, 15 cases (23.4%) showed score 3 and 20 cases (31.3%) showed score 4. Total absence of Msi2-positive cells (score 0) was observed in 3 cases (4.7%).
CYTOPLASMIC STAINING INTENSITY
SCORING
In 64 cases of AML, Msi2 showed variability in staining pattern
Table 1: Shows demographics of the patients with AML
ParametersPatients
TotalNO %
Age 62
<60 years 48 75.0
≥60 years 14 21.9
Not available 2 3.3
WBC count at diagnosis 64
≤10×10⁹/L 20 31.3
>10× 10⁹/L 44 68.6
FAB classification 52
M0 0 0.0
M1 0 0.0
M2 2 3.1
M3 10 15.6
M4 19 29.7
M5 13 20.3
M6 6 9.3
M7 2 3.1
Not available 12 18.8
Cytogenetic category 49
Favorable 14 21.9
Intermediate 28 43.8
Adverse 7 10.9
Not available 15 23.4
Remission status post induction 39
Achieve remission 19 29.7
Did not achieve remission 20 31.3
Not available 25 39.1
Overall survival 52
≤5 years 38 59.4
>5 years 14 21.9
Not available 12 18.8
74
Med & Health Jun 2017;12(1): 66-82 Omayma S.E.B. et al.
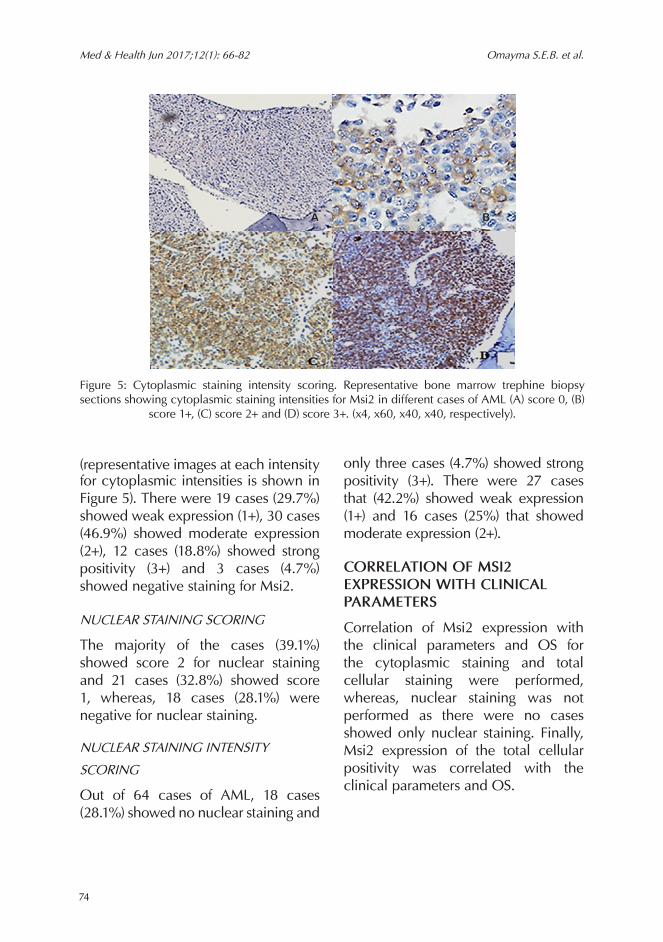
(representative images at each intensity for cytoplasmic intensities is shown in Figure 5). There were 19 cases (29.7%) showed weak expression (1+), 30 cases (46.9%) showed moderate expression (2+), 12 cases (18.8%) showed strong positivity (3+) and 3 cases (4.7%) showed negative staining for Msi2.
NUCLEAR STAINING SCORING
The majority of the cases (39.1%) showed score 2 for nuclear staining and 21 cases (32.8%) showed score 1, whereas, 18 cases (28.1%) were negative for nuclear staining.
NUCLEAR STAINING INTENSITY
SCORING
Out of 64 cases of AML, 18 cases (28.1%) showed no nuclear staining and
only three cases (4.7%) showed strong positivity (3+). There were 27 cases that (42.2%) showed weak expression (1+) and 16 cases (25%) that showed moderate expression (2+).
CORRELATION OF MSI2 EXPRESSION WITH CLINICAL PARAMETERS
Correlation of Msi2 expression with the clinical parameters and OS for the cytoplasmic staining and total cellular staining were performed, whereas, nuclear staining was not performed as there were no cases showed only nuclear staining. Finally, Msi2 expression of the total cellular positivity was correlated with the clinical parameters and OS.
Figure 5: Cytoplasmic staining intensity scoring. Representative bone marrow trephine biopsy sections showing cytoplasmic staining intensities for Msi2 in different cases of AML (A) score 0, (B)
score 1+, (C) score 2+ and (D) score 3+. (x4, x60, x40, x40, respectively).
A B
75
Msi2 Protein Expression in AML and Cytogenetics Med & Health Jun 2017;12(1): 66-82
CORRELATION OF THE CYTOPLASMIC STAINING SCORING AND CYTOPLASMIC STAINING INTENSITY OF MSI2 EXPRESSION WITH CLINICAL PARAMETERS
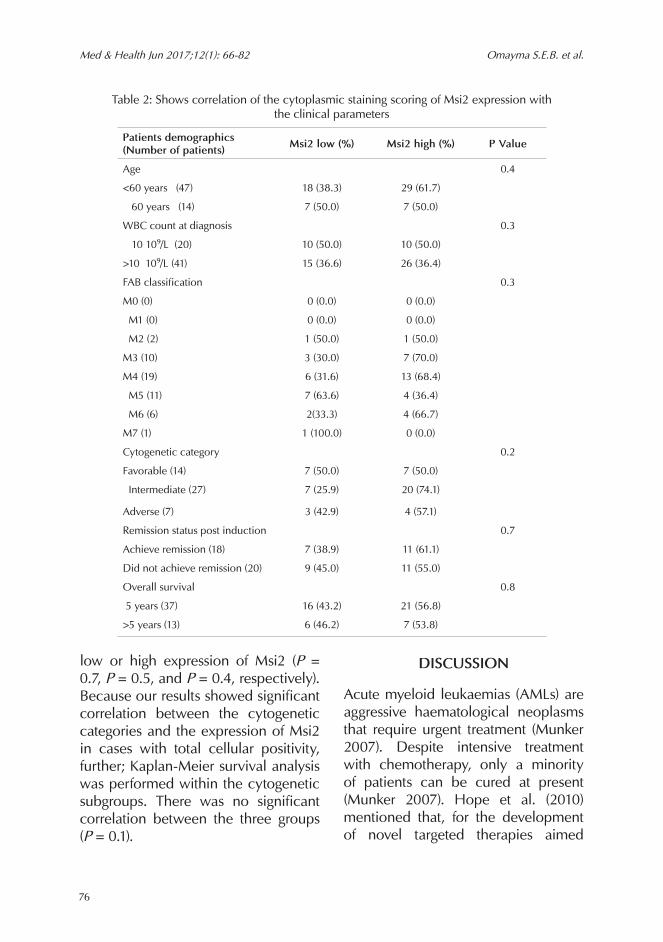
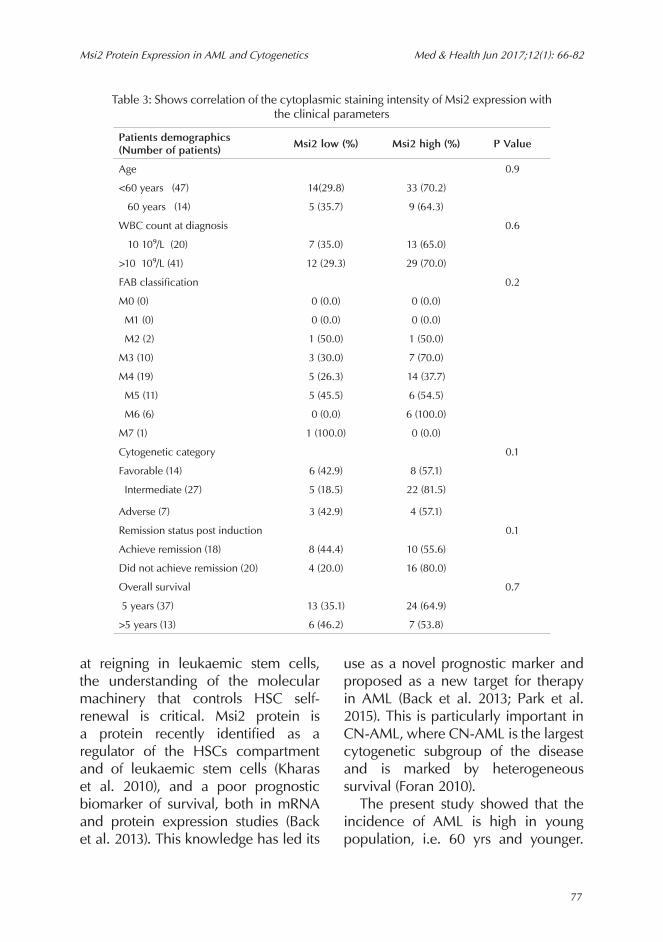
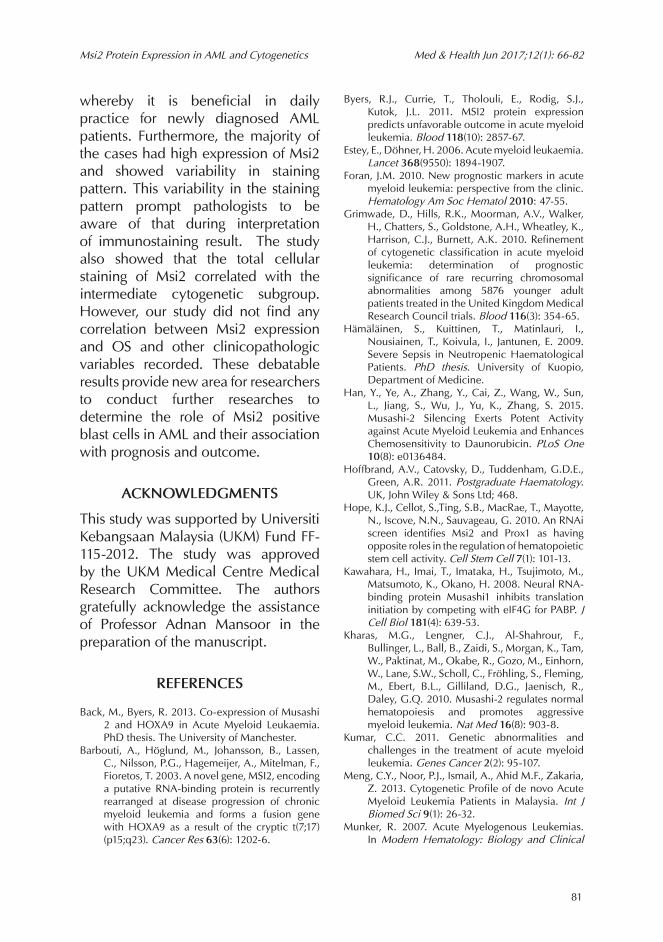
Regarding the correlation between the cytoplasmic staining scoring of Msi2 expression and the patients' age, low expression of Msi2 was observed in 25 (14.0%) cases and 36 (59.0%) cases showed high Msi2 expression. There was no significant correlation between the two age groups at any level of staining (P = 0.4). For WBC count, there was no significant correlation between the low and high Msi2 expression for the cytoplasmic staining scoring in the two groups (P = 0.3). Similarly, there were no significant correlations between the two subgroups of Msi2 expression and the eight FAB subtypes (P = 0.3), the three cytogenetic subtypes (P = 0.2), the two groups of the remission status post induction chemotherapy (P = 0.7) and the two groups of OS (P = 0.8). The correlation between the cytoplasmic staining scoring of Msi2 expression with clinical parameters is summarized in Table 2. For the correlation between the cytoplasmic staining intensity of Msi2 expression and the clinical parameters, our results showed there were no significant correlations at any level of staining. The results are summarized in Table 3.
CORRELATION OF THE TOTAL CELLULAR STAINING OF MSI2 EXPRESSION WITH CLINICAL PARAMETERS
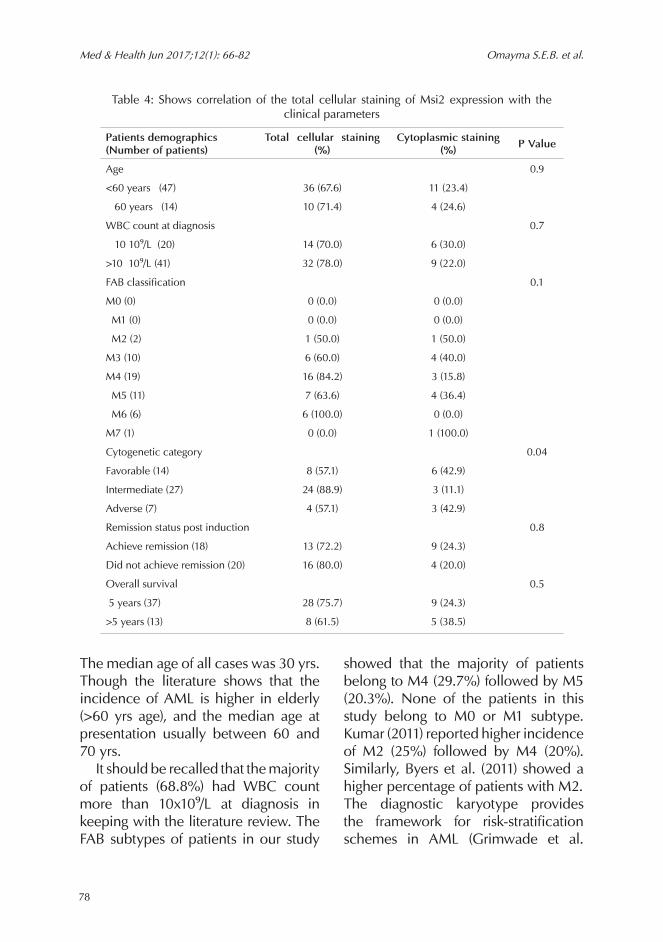
The information regarding patients’ age was available in 61 cases. Out of 61 cases 46 (75.4%) cases showed total cellular staining and 15 cases (24.6%) showed only cytoplasmic staining of Msi2. There was no significant correlation between the two groups (P = 0.9). Similarly, there were no significant correlations between both total cellular or cytoplasmic staining with WBC count or FAB subtypes (P = 0.7 and P = 0.1, respectively). Interestingly, our results showed significant correlation between the intermediate cytogenetic category and the Msi2 expression in the total cellular staining (P = 0.04). Neither total cellular nor cytoplasmic staining were significantly correlated with the remission status post induction chemotherapy or OS (P = 0.8 and P = 0.5, respectively). The correlation of the total cellular staining of Msi2 expression with the clinical parameters is summarized in Table 4.
KAPLAN-MEIER SURVIVAL ANALYSIS
Neither cytoplasmic staining scoring, nor cytoplasmic staining intensity of Msi2, nor total cellular staining were significantly associated with outcome by Kaplan-Meier analysis for values
76
Med & Health Jun 2017;12(1): 66-82 Omayma S.E.B. et al.
low or high expression of Msi2 (P = 0.7, P = 0.5, and P = 0.4, respectively). Because our results showed significant correlation between the cytogenetic categories and the expression of Msi2 in cases with total cellular positivity, further; Kaplan-Meier survival analysis was performed within the cytogenetic subgroups. There was no significant correlation between the three groups (P = 0.1).
DISCUSSION
Acute myeloid leukaemias (AMLs) are aggressive haematological neoplasms that require urgent treatment (Munker 2007). Despite intensive treatment with chemotherapy, only a minority of patients can be cured at present (Munker 2007). Hope et al. (2010) mentioned that, for the development of novel targeted therapies aimed
Table 2: Shows correlation of the cytoplasmic staining scoring of Msi2 expression with the clinical parameters
Patients demographics (Number of patients) Msi2 low (%) Msi2 high (%) P Value
Age 0.4
<60 years (47) 18 (38.3) 29 (61.7)
≥60 years (14) 7 (50.0) 7 (50.0)
WBC count at diagnosis 0.3
≤10×10⁹/L (20) 10 (50.0) 10 (50.0)
>10× 10⁹/L (41) 15 (36.6) 26 (36.4)
FAB classification 0.3
M0 (0) 0 (0.0) 0 (0.0)
M1 (0) 0 (0.0) 0 (0.0)
M2 (2) 1 (50.0) 1 (50.0)
M3 (10) 3 (30.0) 7 (70.0)
M4 (19) 6 (31.6) 13 (68.4)
M5 (11) 7 (63.6) 4 (36.4)
M6 (6) 2(33.3) 4 (66.7)
M7 (1) 1 (100.0) 0 (0.0)
Cytogenetic category 0.2
Favorable (14) 7 (50.0) 7 (50.0)
Intermediate (27) 7 (25.9) 20 (74.1)
Adverse (7) 3 (42.9) 4 (57.1)
Remission status post induction 0.7
Achieve remission (18) 7 (38.9) 11 (61.1)
Did not achieve remission (20) 9 (45.0) 11 (55.0)
Overall survival 0.8
≤5 years (37) 16 (43.2) 21 (56.8)
>5 years (13) 6 (46.2) 7 (53.8)
77
Msi2 Protein Expression in AML and Cytogenetics Med & Health Jun 2017;12(1): 66-82
at reigning in leukaemic stem cells, the understanding of the molecular machinery that controls HSC self-renewal is critical. Msi2 protein is a protein recently identified as a regulator of the HSCs compartment and of leukaemic stem cells (Kharas et al. 2010), and a poor prognostic biomarker of survival, both in mRNA and protein expression studies (Back et al. 2013). This knowledge has led its
use as a novel prognostic marker and proposed as a new target for therapy in AML (Back et al. 2013; Park et al. 2015). This is particularly important in CN-AML, where CN-AML is the largest cytogenetic subgroup of the disease and is marked by heterogeneous survival (Foran 2010). The present study showed that the incidence of AML is high in young population, i.e. 60 yrs and younger.
Table 3: Shows correlation of the cytoplasmic staining intensity of Msi2 expression with the clinical parameters
Patients demographics(Number of patients) Msi2 low (%) Msi2 high (%) P Value
Age 0.9
<60 years (47) 14(29.8) 33 (70.2)
≥60 years (14) 5 (35.7) 9 (64.3)
WBC count at diagnosis 0.6
≤10×10⁹/L (20) 7 (35.0) 13 (65.0)
>10× 10⁹/L (41) 12 (29.3) 29 (70.0)
FAB classification 0.2
M0 (0) 0 (0.0) 0 (0.0)
M1 (0) 0 (0.0) 0 (0.0)
M2 (2) 1 (50.0) 1 (50.0)
M3 (10) 3 (30.0) 7 (70.0)
M4 (19) 5 (26.3) 14 (37.7)
M5 (11) 5 (45.5) 6 (54.5)
M6 (6) 0 (0.0) 6 (100.0)
M7 (1) 1 (100.0) 0 (0.0)
Cytogenetic category 0.1
Favorable (14) 6 (42.9) 8 (57.1)
Intermediate (27) 5 (18.5) 22 (81.5)
Adverse (7) 3 (42.9) 4 (57.1)
Remission status post induction 0.1
Achieve remission (18) 8 (44.4) 10 (55.6)
Did not achieve remission (20) 4 (20.0) 16 (80.0)
Overall survival 0.7
≤5 years (37) 13 (35.1) 24 (64.9)
>5 years (13) 6 (46.2) 7 (53.8)
78
Med & Health Jun 2017;12(1): 66-82 Omayma S.E.B. et al.
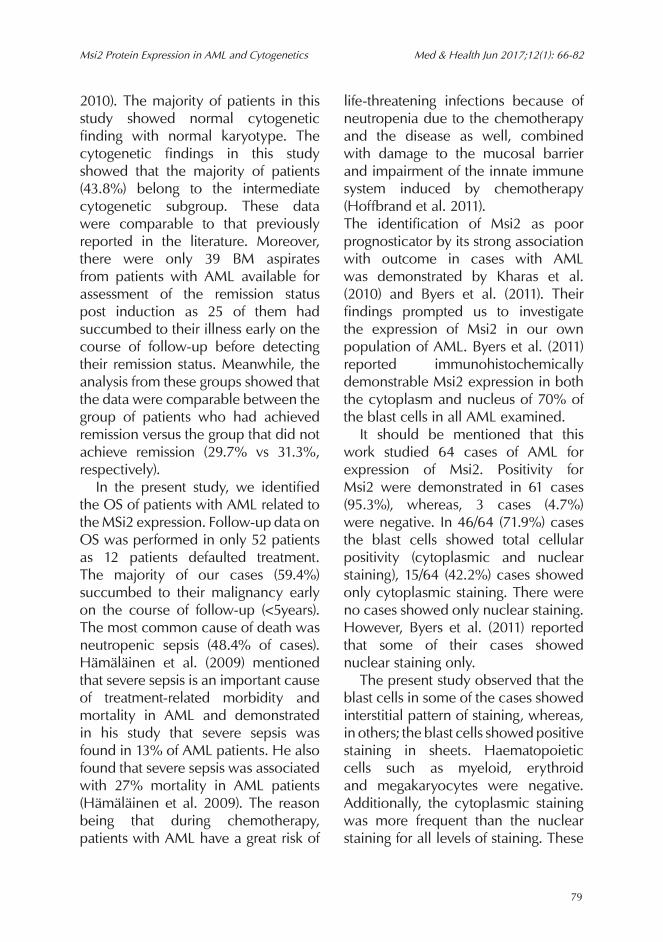
The median age of all cases was 30 yrs. Though the literature shows that the incidence of AML is higher in elderly (>60 yrs age), and the median age at presentation usually between 60 and 70 yrs. It should be recalled that the majority of patients (68.8%) had WBC count more than 10x10⁹/L at diagnosis in keeping with the literature review. The FAB subtypes of patients in our study
showed that the majority of patients belong to M4 (29.7%) followed by M5 (20.3%). None of the patients in this study belong to M0 or M1 subtype. Kumar (2011) reported higher incidence of M2 (25%) followed by M4 (20%). Similarly, Byers et al. (2011) showed a higher percentage of patients with M2.The diagnostic karyotype provides the framework for risk-stratification schemes in AML (Grimwade et al.
Table 4: Shows correlation of the total cellular staining of Msi2 expression with the clinical parameters
Patients demographics (Number of patients)
Total cellular staining (%)
Cytoplasmic staining (%) P Value
Age 0.9
<60 years (47) 36 (67.6) 11 (23.4)
≥60 years (14) 10 (71.4) 4 (24.6)
WBC count at diagnosis 0.7
≤10×10⁹/L (20) 14 (70.0) 6 (30.0)
>10× 10⁹/L (41) 32 (78.0) 9 (22.0)
FAB classification 0.1
M0 (0) 0 (0.0) 0 (0.0)
M1 (0) 0 (0.0) 0 (0.0)
M2 (2) 1 (50.0) 1 (50.0)
M3 (10) 6 (60.0) 4 (40.0)
M4 (19) 16 (84.2) 3 (15.8)
M5 (11) 7 (63.6) 4 (36.4)
M6 (6) 6 (100.0) 0 (0.0)
M7 (1) 0 (0.0) 1 (100.0)
Cytogenetic category 0.04
Favorable (14) 8 (57.1) 6 (42.9)
Intermediate (27) 24 (88.9) 3 (11.1)
Adverse (7) 4 (57.1) 3 (42.9)
Remission status post induction 0.8
Achieve remission (18) 13 (72.2) 9 (24.3)
Did not achieve remission (20) 16 (80.0) 4 (20.0)
Overall survival 0.5
≤5 years (37) 28 (75.7) 9 (24.3)
>5 years (13) 8 (61.5) 5 (38.5)
79
Msi2 Protein Expression in AML and Cytogenetics Med & Health Jun 2017;12(1): 66-82
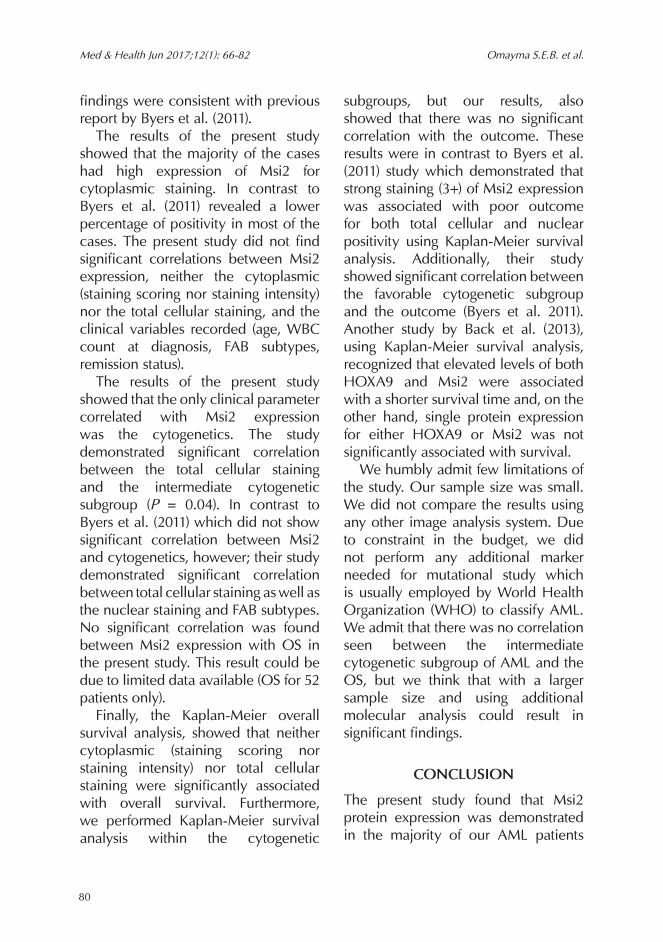
2010). The majority of patients in this study showed normal cytogenetic finding with normal karyotype. The cytogenetic findings in this study showed that the majority of patients (43.8%) belong to the intermediate cytogenetic subgroup. These data were comparable to that previously reported in the literature. Moreover, there were only 39 BM aspirates from patients with AML available for assessment of the remission status post induction as 25 of them had succumbed to their illness early on the course of follow-up before detecting their remission status. Meanwhile, the analysis from these groups showed that the data were comparable between the group of patients who had achieved remission versus the group that did not achieve remission (29.7% vs 31.3%, respectively). In the present study, we identified the OS of patients with AML related to the MSi2 expression. Follow-up data on OS was performed in only 52 patients as 12 patients defaulted treatment. The majority of our cases (59.4%) succumbed to their malignancy early on the course of follow-up (<5years). The most common cause of death was neutropenic sepsis (48.4% of cases). Hämäläinen et al. (2009) mentioned that severe sepsis is an important cause of treatment-related morbidity and mortality in AML and demonstrated in his study that severe sepsis was found in 13% of AML patients. He also found that severe sepsis was associated with 27% mortality in AML patients (Hämäläinen et al. 2009). The reason being that during chemotherapy, patients with AML have a great risk of
life-threatening infections because of neutropenia due to the chemotherapy and the disease as well, combined with damage to the mucosal barrier and impairment of the innate immune system induced by chemotherapy (Hoffbrand et al. 2011). The identification of Msi2 as poor prognosticator by its strong association with outcome in cases with AML was demonstrated by Kharas et al. (2010) and Byers et al. (2011). Their findings prompted us to investigate the expression of Msi2 in our own population of AML. Byers et al. (2011) reported immunohistochemically demonstrable Msi2 expression in both the cytoplasm and nucleus of 70% of the blast cells in all AML examined. It should be mentioned that this work studied 64 cases of AML for expression of Msi2. Positivity for Msi2 were demonstrated in 61 cases (95.3%), whereas, 3 cases (4.7%) were negative. In 46/64 (71.9%) cases the blast cells showed total cellular positivity (cytoplasmic and nuclear staining), 15/64 (42.2%) cases showed only cytoplasmic staining. There were no cases showed only nuclear staining. However, Byers et al. (2011) reported that some of their cases showed nuclear staining only. The present study observed that the blast cells in some of the cases showed interstitial pattern of staining, whereas, in others; the blast cells showed positive staining in sheets. Haematopoietic cells such as myeloid, erythroid and megakaryocytes were negative. Additionally, the cytoplasmic staining was more frequent than the nuclear staining for all levels of staining. These
80
Med & Health Jun 2017;12(1): 66-82 Omayma S.E.B. et al.
findings were consistent with previous report by Byers et al. (2011). The results of the present study showed that the majority of the cases had high expression of Msi2 for cytoplasmic staining. In contrast to Byers et al. (2011) revealed a lower percentage of positivity in most of the cases. The present study did not find significant correlations between Msi2 expression, neither the cytoplasmic (staining scoring nor staining intensity) nor the total cellular staining, and the clinical variables recorded (age, WBC count at diagnosis, FAB subtypes, remission status). The results of the present study showed that the only clinical parameter correlated with Msi2 expression was the cytogenetics. The study demonstrated significant correlation between the total cellular staining and the intermediate cytogenetic subgroup (P = 0.04). In contrast to Byers et al. (2011) which did not show significant correlation between Msi2 and cytogenetics, however; their study demonstrated significant correlation between total cellular staining as well as the nuclear staining and FAB subtypes. No significant correlation was found between Msi2 expression with OS in the present study. This result could be due to limited data available (OS for 52 patients only). Finally, the Kaplan-Meier overall survival analysis, showed that neither cytoplasmic (staining scoring nor staining intensity) nor total cellular staining were significantly associated with overall survival. Furthermore, we performed Kaplan-Meier survival analysis within the cytogenetic
subgroups, but our results, also showed that there was no significant correlation with the outcome. These results were in contrast to Byers et al. (2011) study which demonstrated that strong staining (3+) of Msi2 expression was associated with poor outcome for both total cellular and nuclear positivity using Kaplan-Meier survival analysis. Additionally, their study showed significant correlation between the favorable cytogenetic subgroup and the outcome (Byers et al. 2011). Another study by Back et al. (2013), using Kaplan-Meier survival analysis, recognized that elevated levels of both HOXA9 and Msi2 were associated with a shorter survival time and, on the other hand, single protein expression for either HOXA9 or Msi2 was not significantly associated with survival. We humbly admit few limitations of the study. Our sample size was small. We did not compare the results using any other image analysis system. Due to constraint in the budget, we did not perform any additional marker needed for mutational study which is usually employed by World Health Organization (WHO) to classify AML. We admit that there was no correlation seen between the intermediate cytogenetic subgroup of AML and the OS, but we think that with a larger sample size and using additional molecular analysis could result in significant findings.
CONCLUSION
The present study found that Msi2 protein expression was demonstrated in the majority of our AML patients
81
Msi2 Protein Expression in AML and Cytogenetics Med & Health Jun 2017;12(1): 66-82
whereby it is beneficial in daily practice for newly diagnosed AML patients. Furthermore, the majority of the cases had high expression of Msi2 and showed variability in staining pattern. This variability in the staining pattern prompt pathologists to be aware of that during interpretation of immunostaining result. The study also showed that the total cellular staining of Msi2 correlated with the intermediate cytogenetic subgroup. However, our study did not find any correlation between Msi2 expression and OS and other clinicopathologic variables recorded. These debatable results provide new area for researchers to conduct further researches to determine the role of Msi2 positive blast cells in AML and their association with prognosis and outcome.
ACKNOWLEDGMENTS
This study was supported by Universiti Kebangsaan Malaysia (UKM) Fund FF-115-2012. The study was approved by the UKM Medical Centre Medical Research Committee. The authors gratefully acknowledge the assistance of Professor Adnan Mansoor in the preparation of the manuscript.
REFERENCES
Back, M., Byers, R. 2013. Co-expression of Musashi 2 and HOXA9 in Acute Myeloid Leukaemia. PhD thesis. The University of Manchester.
Barbouti, A., Höglund, M., Johansson, B., Lassen, C., Nilsson, P.G., Hagemeijer, A., Mitelman, F., Fioretos, T. 2003. A novel gene, MSI2, encoding a putative RNA-binding protein is recurrently rearranged at disease progression of chronic myeloid leukemia and forms a fusion gene with HOXA9 as a result of the cryptic t(7;17)(p15;q23). Cancer Res 63(6): 1202-6.
Byers, R.J., Currie, T., Tholouli, E., Rodig, S.J., Kutok, J.L. 2011. MSI2 protein expression predicts unfavorable outcome in acute myeloid leukemia. Blood 118(10): 2857-67.
Estey, E., Döhner, H. 2006. Acute myeloid leukaemia. Lancet 368(9550): 1894-1907.
Foran, J.M. 2010. New prognostic markers in acute myeloid leukemia: perspective from the clinic. Hematology Am Soc Hematol 2010: 47-55.
Grimwade, D., Hills, R.K., Moorman, A.V., Walker, H., Chatters, S., Goldstone, A.H., Wheatley, K., Harrison, C.J., Burnett, A.K. 2010. Refinement of cytogenetic classification in acute myeloid leukemia: determination of prognostic significance of rare recurring chromosomal abnormalities among 5876 younger adult patients treated in the United Kingdom Medical Research Council trials. Blood 116(3): 354-65.
Hämäläinen, S., Kuittinen, T., Matinlauri, I., Nousiainen, T., Koivula, I., Jantunen, E. 2009. Severe Sepsis in Neutropenic Haematological Patients. PhD thesis. University of Kuopio, Department of Medicine.
Han, Y., Ye, A., Zhang, Y., Cai, Z., Wang, W., Sun, L., Jiang, S., Wu, J., Yu, K., Zhang, S. 2015. Musashi-2 Silencing Exerts Potent Activity against Acute Myeloid Leukemia and Enhances Chemosensitivity to Daunorubicin. PLoS One 10(8): e0136484.
Hoffbrand, A.V., Catovsky, D., Tuddenham, G.D.E., Green, A.R. 2011. Postgraduate Haematology. UK, John Wiley & Sons Ltd; 468.
Hope, K.J., Cellot, S.,Ting, S.B., MacRae, T., Mayotte, N., Iscove, N.N., Sauvageau, G. 2010. An RNAi screen identifies Msi2 and Prox1 as having opposite roles in the regulation of hematopoietic stem cell activity. Cell Stem Cell 7(1): 101-13.
Kawahara, H., Imai, T., Imataka, H., Tsujimoto, M., Matsumoto, K., Okano, H. 2008. Neural RNA-binding protein Musashi1 inhibits translation initiation by competing with eIF4G for PABP. J Cell Biol 181(4): 639-53.
Kharas, M.G., Lengner, C.J., Al-Shahrour, F., Bullinger, L., Ball, B., Zaidi, S., Morgan, K., Tam, W., Paktinat, M., Okabe, R., Gozo, M., Einhorn, W., Lane, S.W., Scholl, C., Fröhling, S., Fleming, M., Ebert, B.L., Gilliland, D.G., Jaenisch, R., Daley, G.Q. 2010. Musashi-2 regulates normal hematopoiesis and promotes aggressive myeloid leukemia. Nat Med 16(8): 903-8.
Kumar, C.C. 2011. Genetic abnormalities and challenges in the treatment of acute myeloid leukemia. Genes Cancer 2(2): 95-107.
Meng, C.Y., Noor, P.J., Ismail, A., Ahid M.F., Zakaria, Z. 2013. Cytogenetic Profile of de novo Acute Myeloid Leukemia Patients in Malaysia. Int J Biomed Sci 9(1): 26-32.
Munker, R. 2007. Acute Myelogenous Leukemias. In Modern Hematology: Biology and Clinical
82
Med & Health Jun 2017;12(1): 66-82 Omayma S.E.B. et al.
Management. 2nd edition. Edited by Munker, R., Hiller. E., Glass, J., Paquette, R. Totowa: Humana Press Inc; 155-72.
Park, S.M., Gönen, M., Vu, L., Minuesa, G., Tivnan, P., Barlowe, T.S., Taggart, J., Lu, Y., Deering, R.P., Hacohen, N., Figueroa, M.E., Paietta, E., Fernandez, H.F., Tallman, M.S., Melnick, A., Levine, R., Leslie, C., Lengner, C.J., Kharas, M.G. 2015. Musashi2 sustains the mixed-lineage leukemia–driven stem cell regulatory program. J Clin Invest 125(3): 1268-98.
Sakakibara, S., Nakamura, Y., Yoshida, T., Shibata, S., Koike, M., Takano, H., Ueda, S., Uchiyama, Y., Noda, T., Okano, H. 2002. RNA-binding protein Musashi family: roles for CNS stem
cells and a subpopulation of ependymal cells revealed by targeted disruption and antisense ablation. Proc Natl Acad Sci U S A 99(23): 15194-9.
Stone, R.M., O’Donnell, M.R., Sekeres, M.A. 2004. Acute myeloid leukemia. Hematology Am Soc Hematol Educ Program 2004: 98-117.
Swerdlow, S.H., Campo, E., Harris, N.L., Jaffe, E.S., Pileri, S.A., Stein, H., Thiele, J., Vardiman, J.W. 2008. WHO Classification of Tumors of the Hematopoietic and Lymphoid Tissue. Lyon, France: IARC Press; 118.
Received: 29 November 2016Accepted: 22 May 2017