water science l3 available soil water 150912ed
TRANSCRIPT
KANDUNGAN KELEMBAPAN AIR DALAM TANAH (SOIL MOISTURE CONTENT)
Jenis dan sifat fizik tanah serta hubungkaitnya dengan kandungan kelembapan air tanah.Ciri-ciri kelembapan air tanah (the moisture characteristics of soils) contohnya moisture curveKandungan serta kaedah pengambilan kelembapan air tanah untuk tanaman.Pengiraan keperluan dan jadual pengairan.Pergerakan air dalam tanah saperti seepage dan infiltration
Soil compositionWhen dry soil is crushed in the hand, it can be seen that it is composed of all kinds of particles of different sizes. Most of these particles originate from the degradation of rocks; they are called mineral particles. Some originate from residues of plants or animals (rotting leaves, pieces of bone, etc.), these are called organic particles (or organic matter). The soil particles seem to touch each other, but in reality have spaces in between. These spaces are called pores. When the soil is "dry", the pores are mainly filled with air. After irrigation or rainfall, the pores are mainly filled with water. Living material is found in the soil. It can be live roots as well as beetles, worms, larvae etc. They help to aerate the soil and thus create favourable growing conditions for the plant roots.
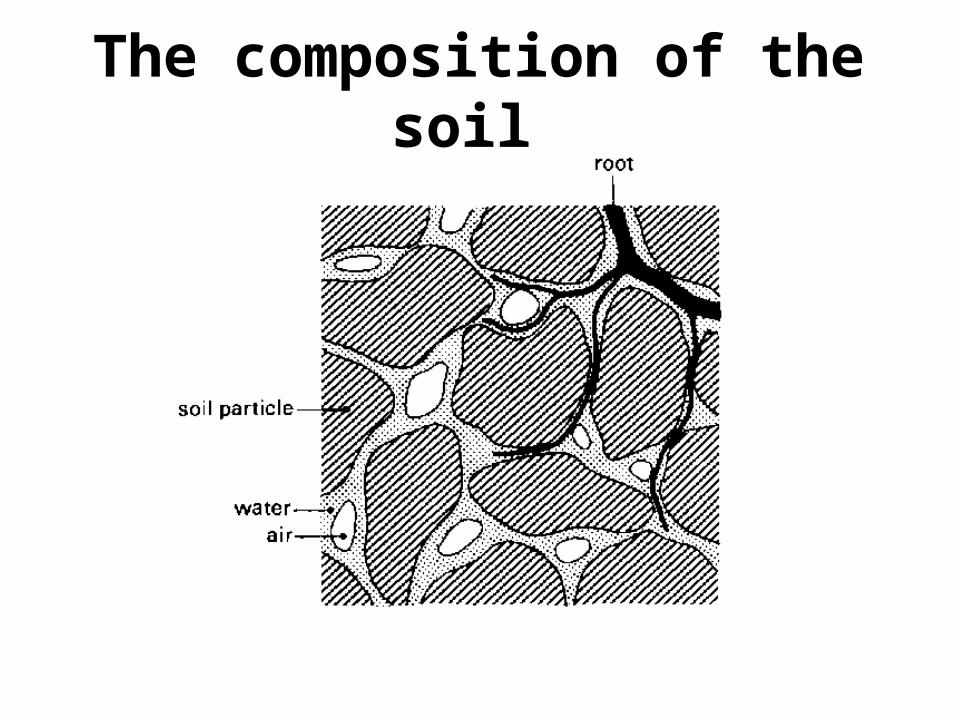
The composition of the soil
Theory of Measurements:Soil moisture content is the quantity of water contained in the soil.
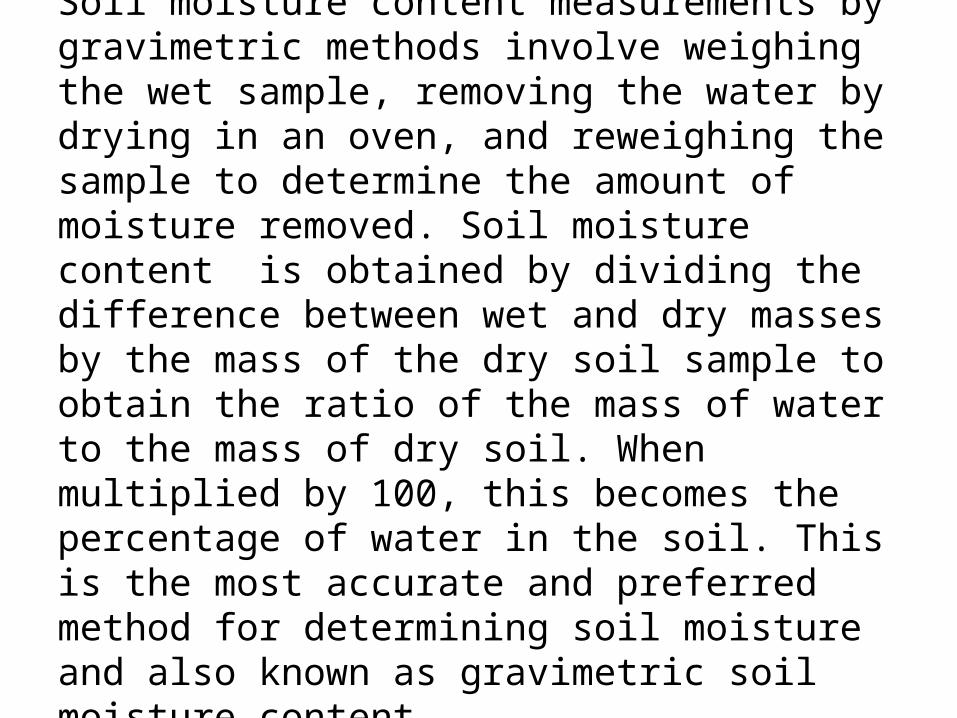
Soil moisture content measurements by gravimetric methods involve weighing the wet sample, removing the water by drying in an oven, and reweighing the sample to determine the amount of moisture removed. Soil moisture content is obtained by dividing the difference between wet and dry masses by the mass of the dry soil sample to obtain the ratio of the mass of water to the mass of dry soil. When multiplied by 100, this becomes the percentage of water in the soil. This is the most accurate and preferred method for determining soil moisture and also known as gravimetric soil moisture content.
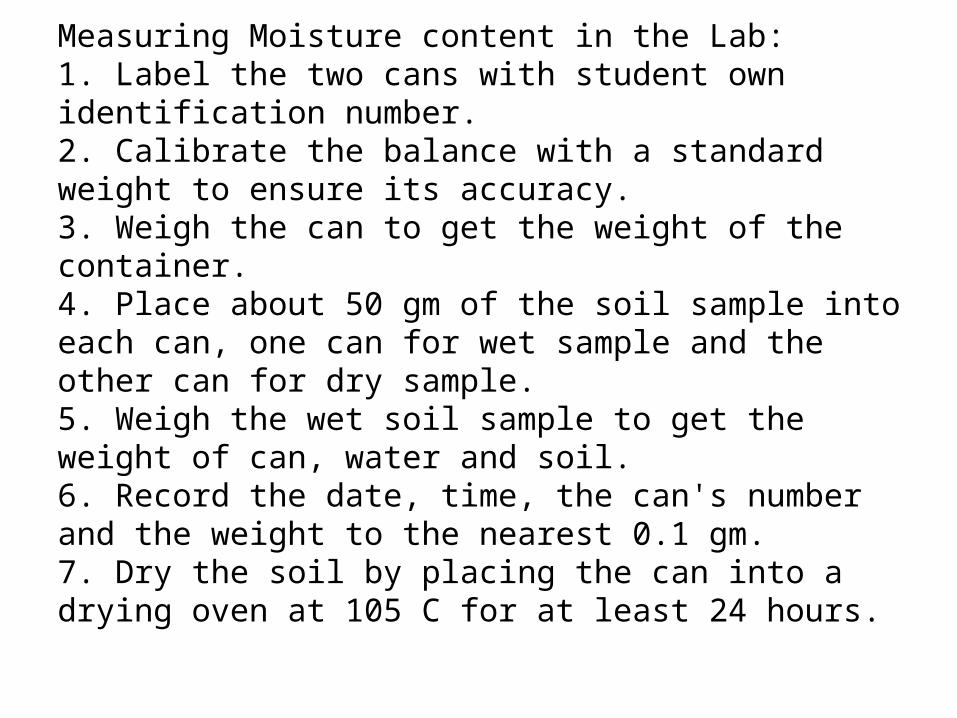
Measuring Moisture content in the Lab:1. Label the two cans with student own identification number.2. Calibrate the balance with a standard weight to ensure its accuracy.3. Weigh the can to get the weight of the container.4. Place about 50 gm of the soil sample into each can, one can for wet sample and the other can for dry sample.5. Weigh the wet soil sample to get the weight of can, water and soil.6. Record the date, time, the can's number and the weight to the nearest 0.1 gm.7. Dry the soil by placing the can into a drying oven at 105 C for at least 24 hours.
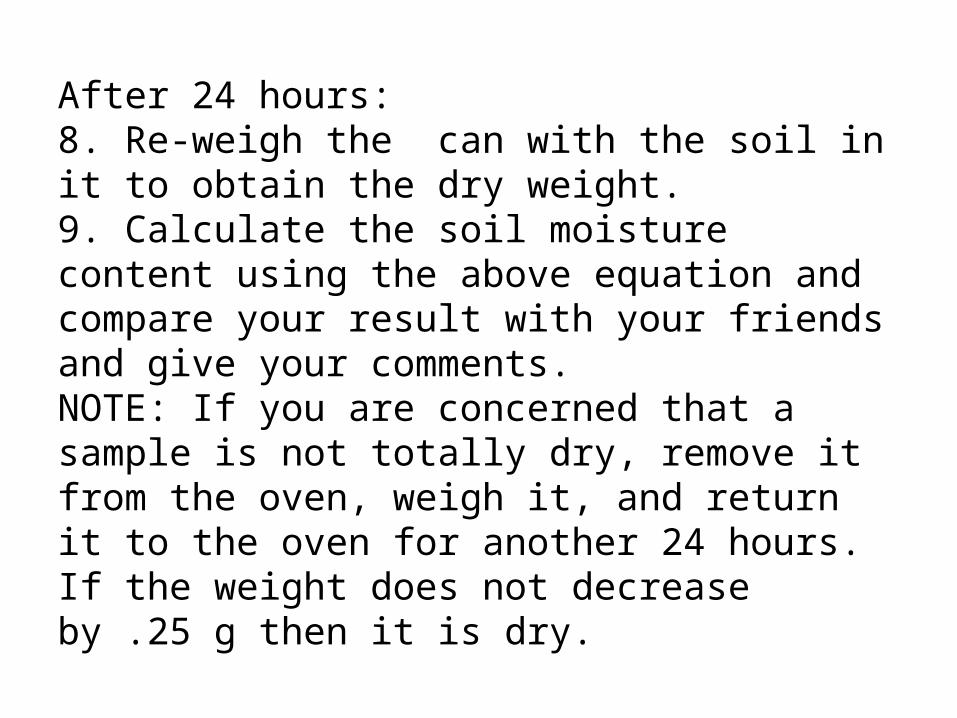
After 24 hours:8. Re-weigh the can with the soil in it to obtain the dry weight.9. Calculate the soil moisture content using the above equation and compare your result with your friends and give your comments.NOTE: If you are concerned that a sample is not totally dry, remove it from the oven, weigh it, and return it to the oven for another 24 hours. If the weight does not decrease by .25 g then it is dry.
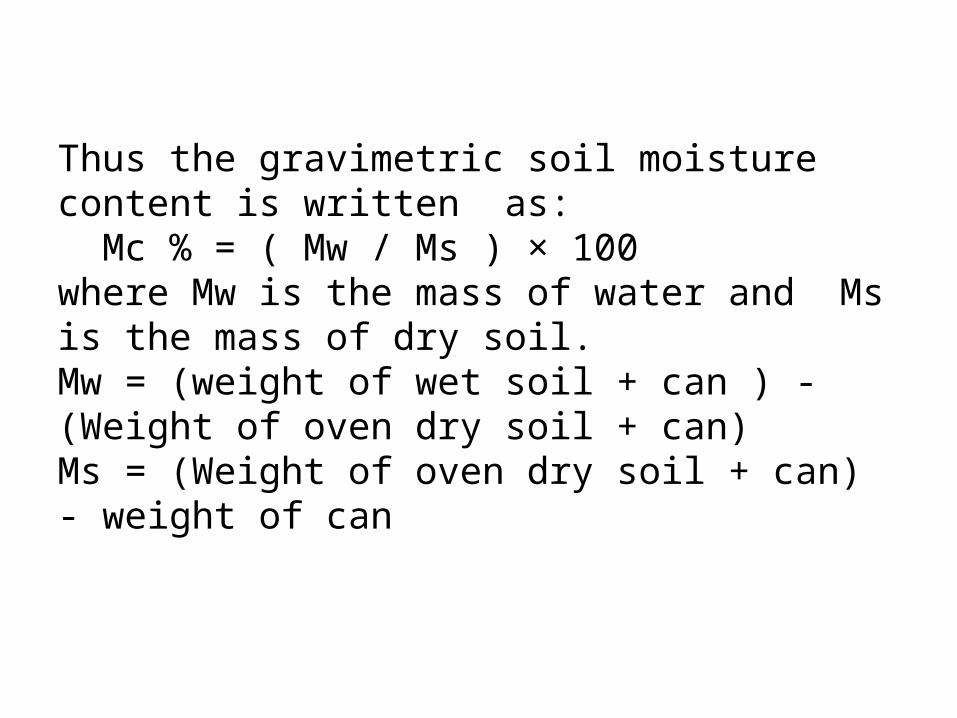
Thus the gravimetric soil moisture content is written as: Mc % = ( Mw / Ms ) × 100where Mw is the mass of water and Ms is the mass of dry soil. Mw = (weight of wet soil + can ) - (Weight of oven dry soil + can)Ms = (Weight of oven dry soil + can) - weight of can
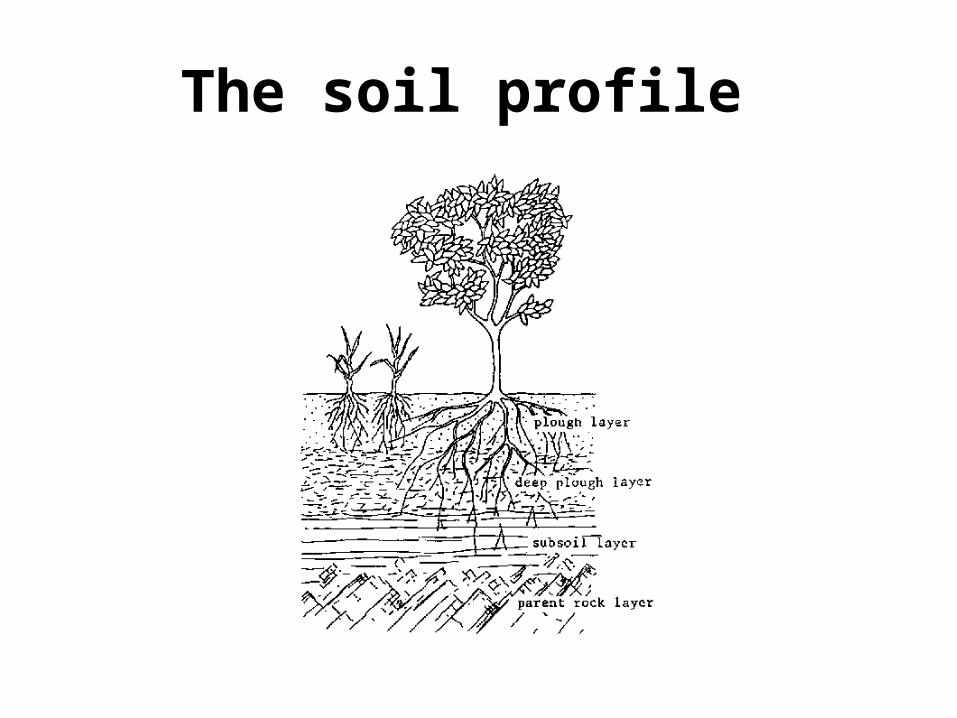
Soil profileIf a pit is dug in the soil, at least 1 m deep, various layers, different in colour and composition can be seen. These layers are called horizons. This succession of horizons is called the profile of the soil.
The soil profile
A very general and simplified soil profile can be described as follows: a. The plough layer (20 to 30 cm thick): is rich in organic matter and contains many live roots. This layer is subject to land preparation (e.g. ploughing, harrowing etc.) and often has a dark colour (brown to black).
b. The deep plough layer: contains much less organic matter and live roots. This layer is hardly affected by normal land preparation activities. The colour is lighter, often grey, and sometimes mottled with yellowish or reddish spots. c. The subsoil layer: hardly any organic matter or live roots are to be found. This layer is not very important for plant growth as only a few roots will reach it. d. The parent rock layer: consists of rock, from the degradation of which the soil was formed. This rock is sometimes called parent material. The depth of the different layers varies widely: some layers may be missing altogether.
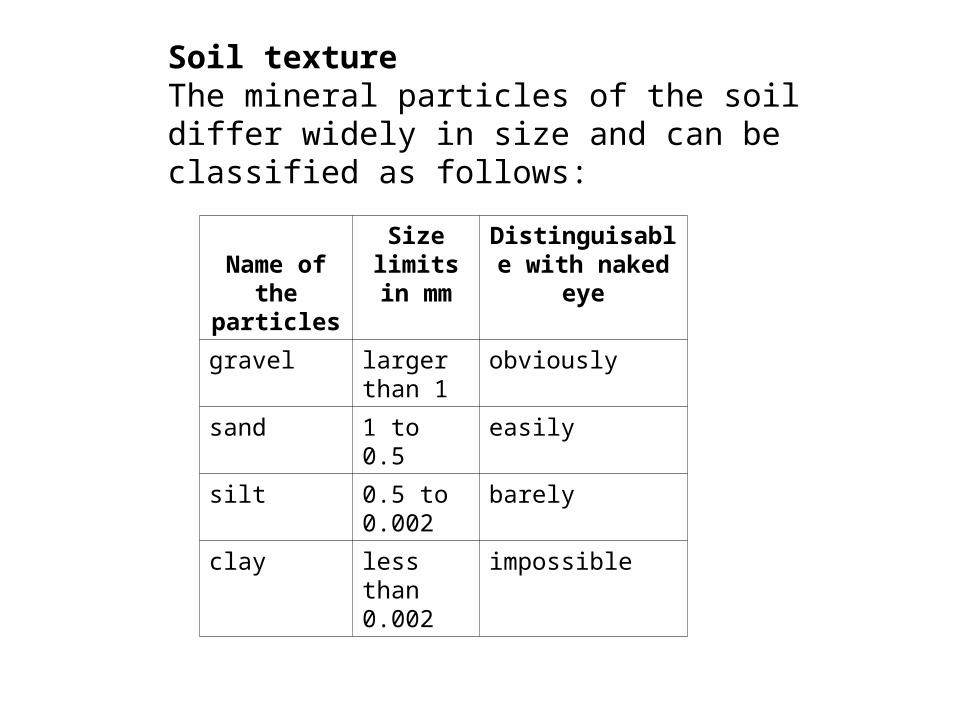
Soil textureThe mineral particles of the soil differ widely in size and can be classified as follows:
Name of the
particles
Size limits in
mm
Distinguisable with naked eye
gravel larger than 1
obviously
sand 1 to 0.5 easilysilt 0.5 to
0.002barely
clay less than 0.002
impossible
The amount of sand, silt and clay present in the soil determines the soil texture:In coarse textured soils: sand is predominant (sandy soils).In medium textured soils: silt is predominant (loamy soils).In fine textured soils: clay is predominant (clayey soils).

In the field, soil texture can be determined by rubbing the soil between the fingers. Farmers often talk of light soil and heavy soil. A coarse-textured soil is light because it is easy to work, while a fine-textured soil is heavy because it is hard to work. The texture of a soil is permanent, the farmer is unable to modify or change it.
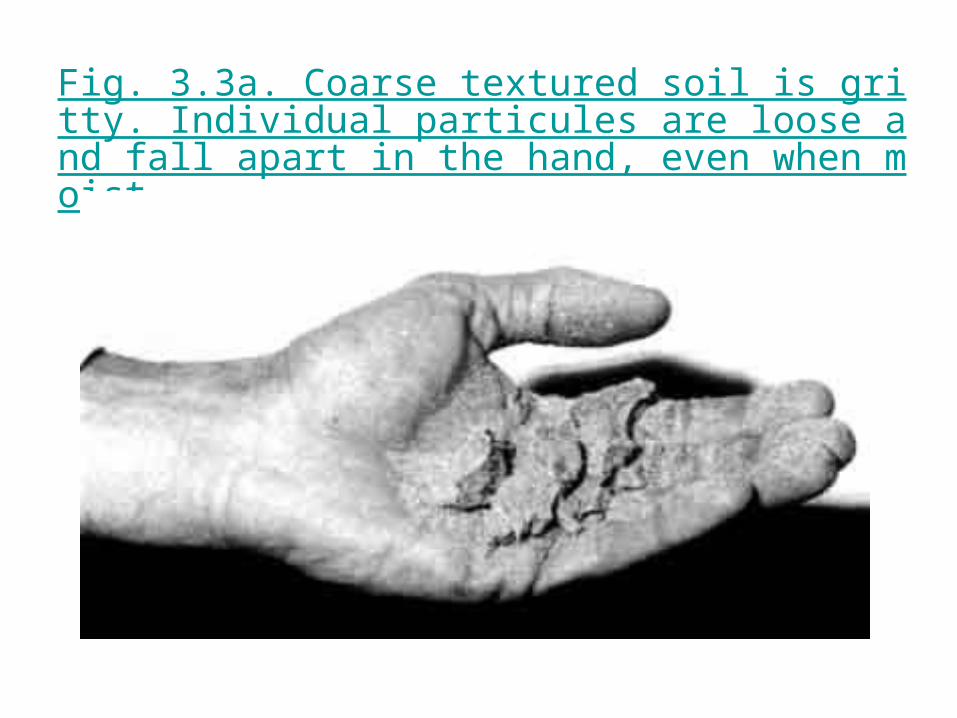
Fig. 3.3a. Coarse textured soil is gritty. Individual particules are loose and fall apart in the hand, even when moist.
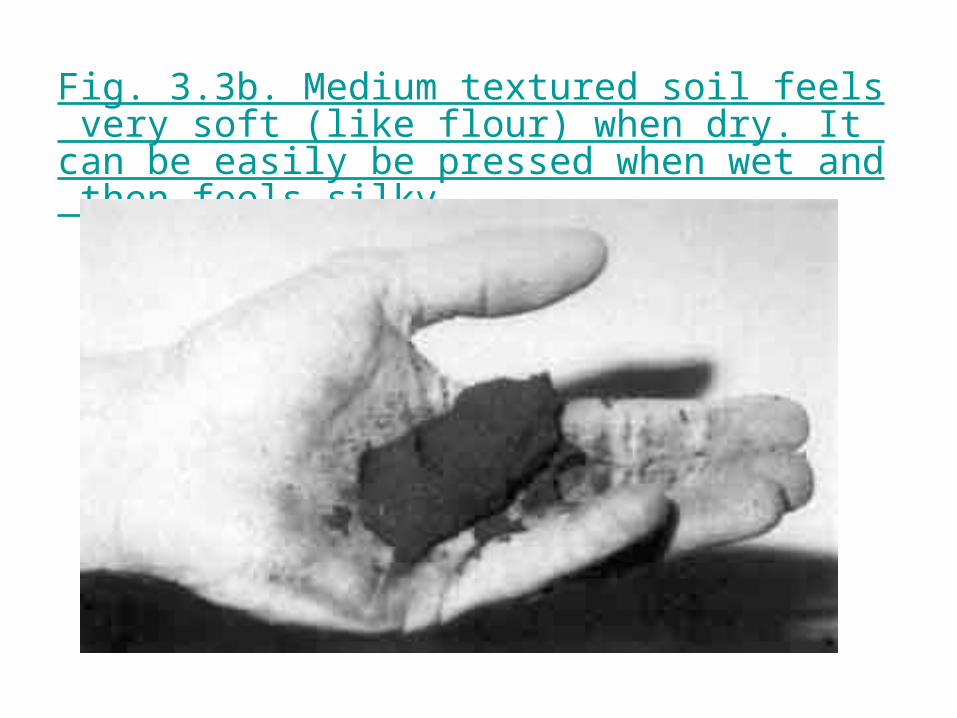
Fig. 3.3b. Medium textured soil feels very soft (like flour) when dry. It can be easily be pressed when wet and then feels silky.
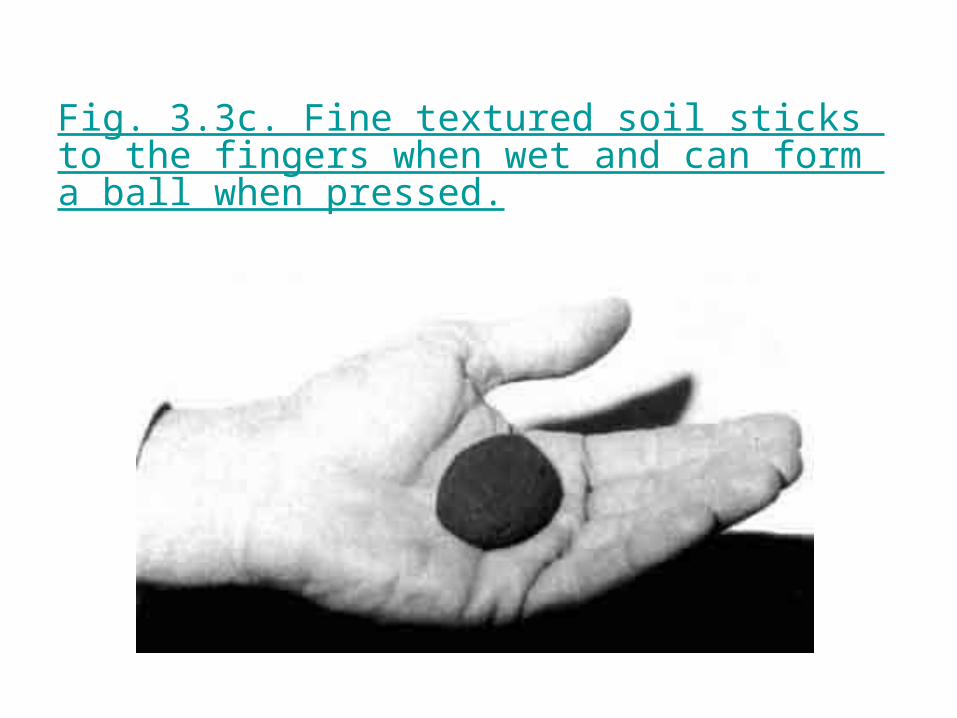
Fig. 3.3c. Fine textured soil sticks to the fingers when wet and can form a ball when pressed.
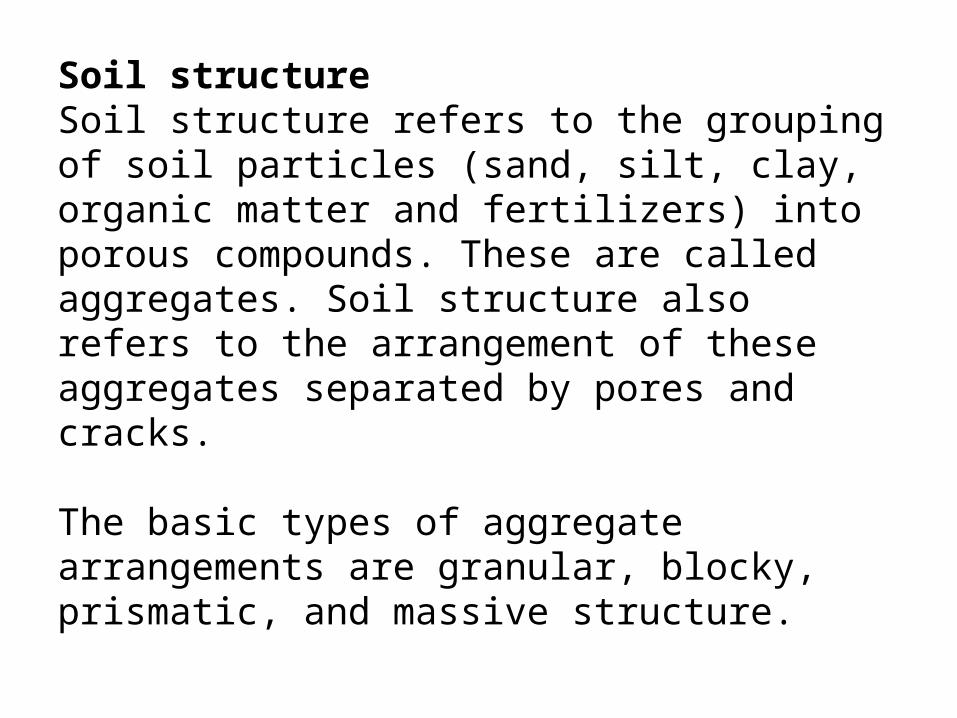
Soil structureSoil structure refers to the grouping of soil particles (sand, silt, clay, organic matter and fertilizers) into porous compounds. These are called aggregates. Soil structure also refers to the arrangement of these aggregates separated by pores and cracks.
The basic types of aggregate arrangements are granular, blocky, prismatic, and massive structure.
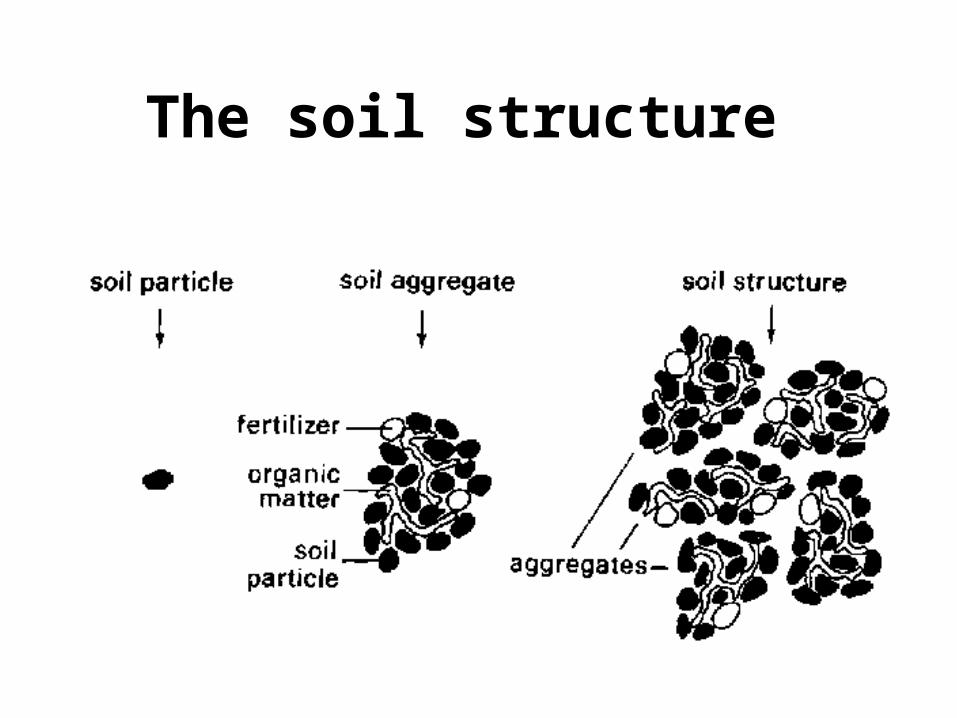
The soil structure
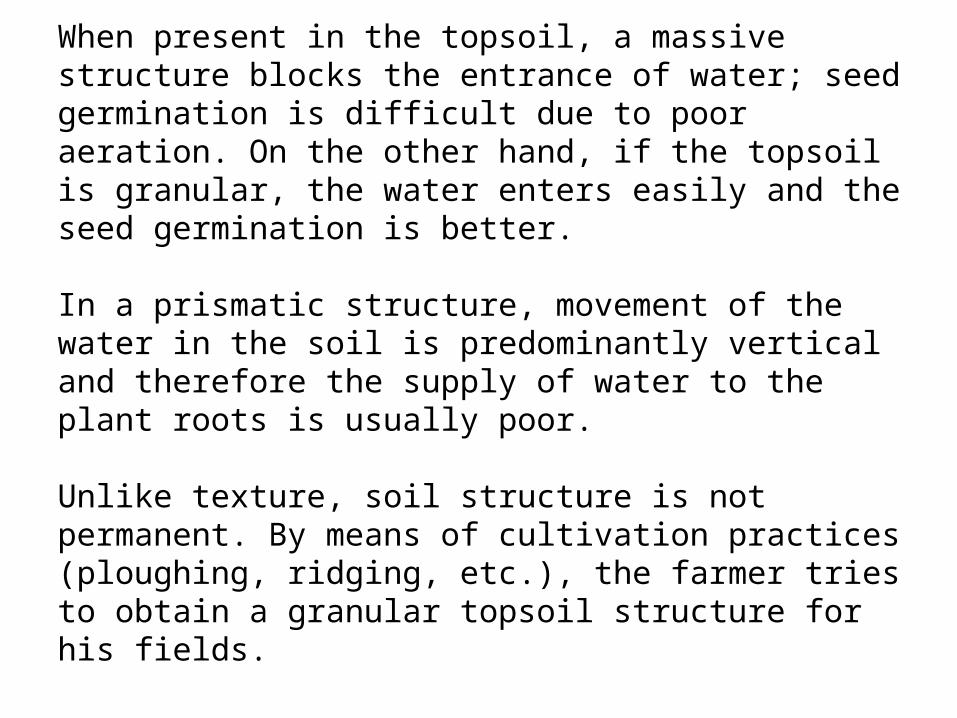
When present in the topsoil, a massive structure blocks the entrance of water; seed germination is difficult due to poor aeration. On the other hand, if the topsoil is granular, the water enters easily and the seed germination is better.
In a prismatic structure, movement of the water in the soil is predominantly vertical and therefore the supply of water to the plant roots is usually poor.
Unlike texture, soil structure is not permanent. By means of cultivation practices (ploughing, ridging, etc.), the farmer tries to obtain a granular topsoil structure for his fields.
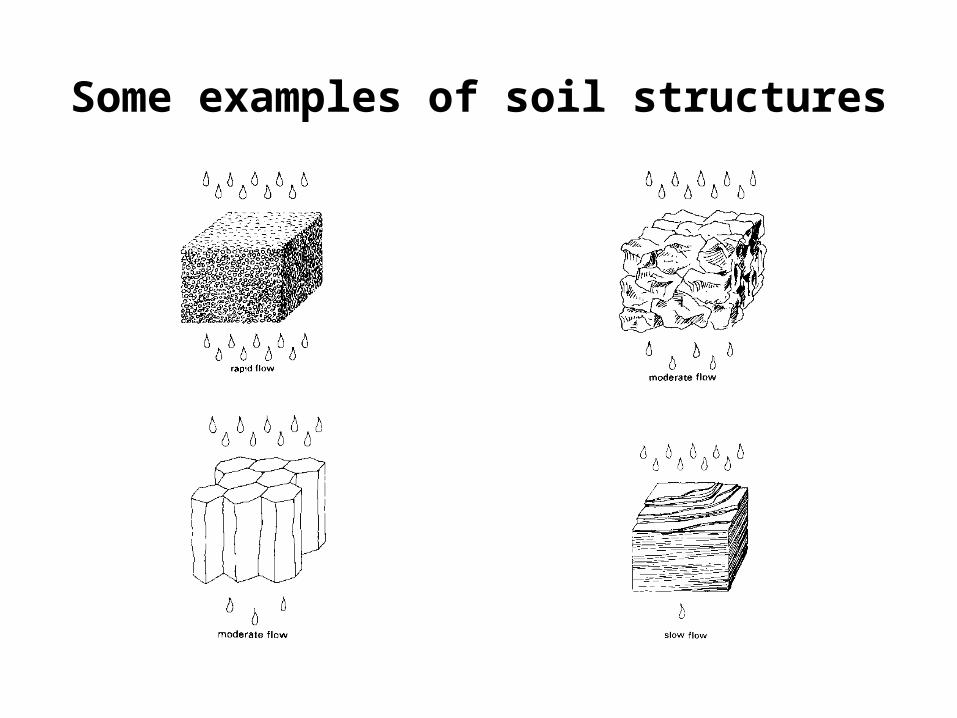
Some examples of soil structures
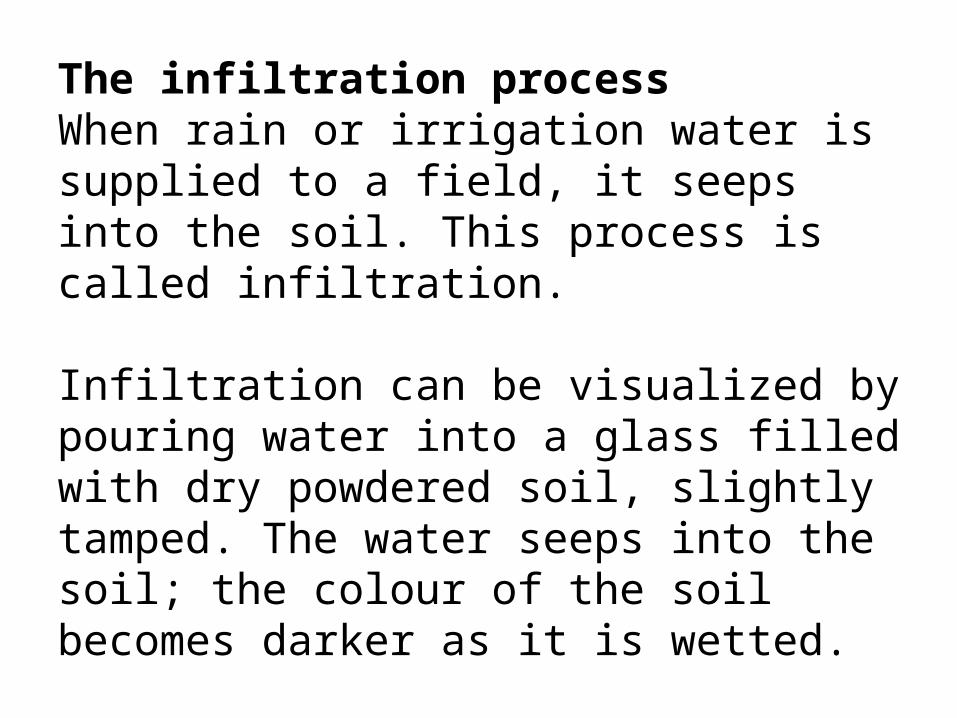
The infiltration processWhen rain or irrigation water is supplied to a field, it seeps into the soil. This process is called infiltration.
Infiltration can be visualized by pouring water into a glass filled with dry powdered soil, slightly tamped. The water seeps into the soil; the colour of the soil becomes darker as it is wetted.
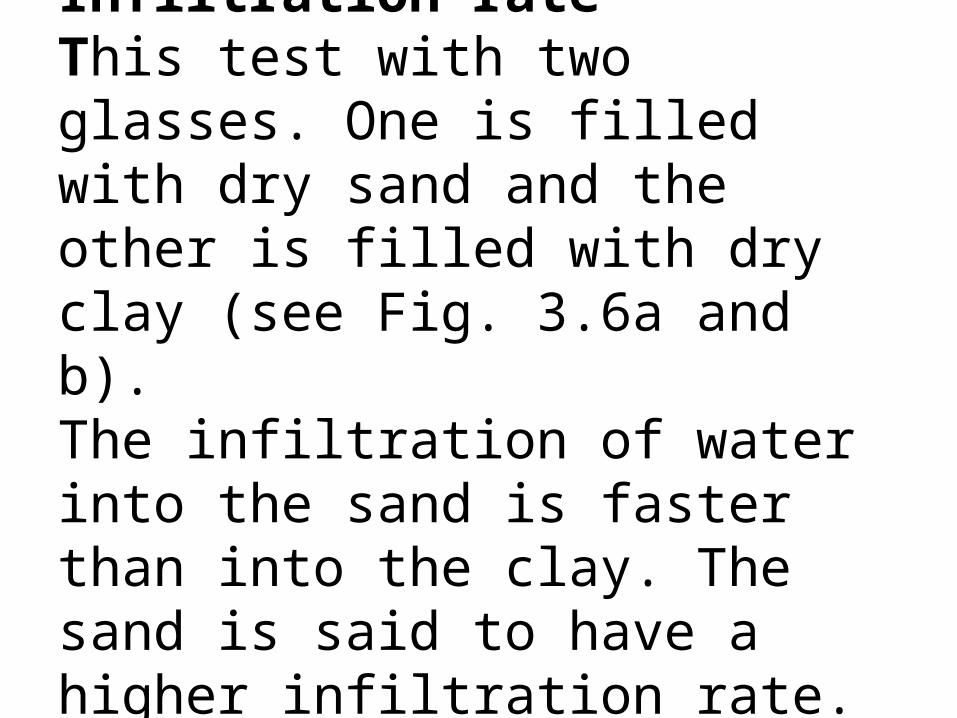
Infiltration rateThis test with two glasses. One is filled with dry sand and the other is filled with dry clay (see Fig. 3.6a and b). The infiltration of water into the sand is faster than into the clay. The sand is said to have a higher infiltration rate.
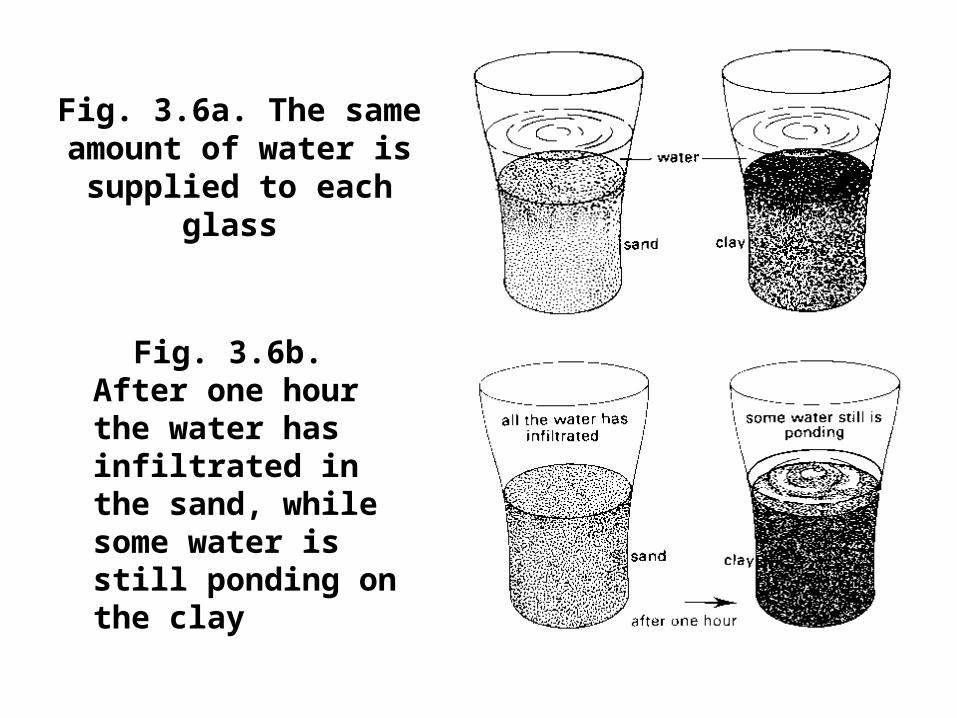
Fig. 3.6a. The same amount of water is
supplied to each glass
Fig. 3.6b. After one hour the water has infiltrated in the sand, while some water is still ponding on the clay

The infiltration rate of a soil is the velocity at which water can seep into it. It is commonly measured by the depth (in mm) of the water layer that the soil can absorb in an hour. An infiltration rate of 15 mm/hour means that a water layer of 15 mm on the surface of the soil, will take one hour to infiltrate (see fig. 3.7).
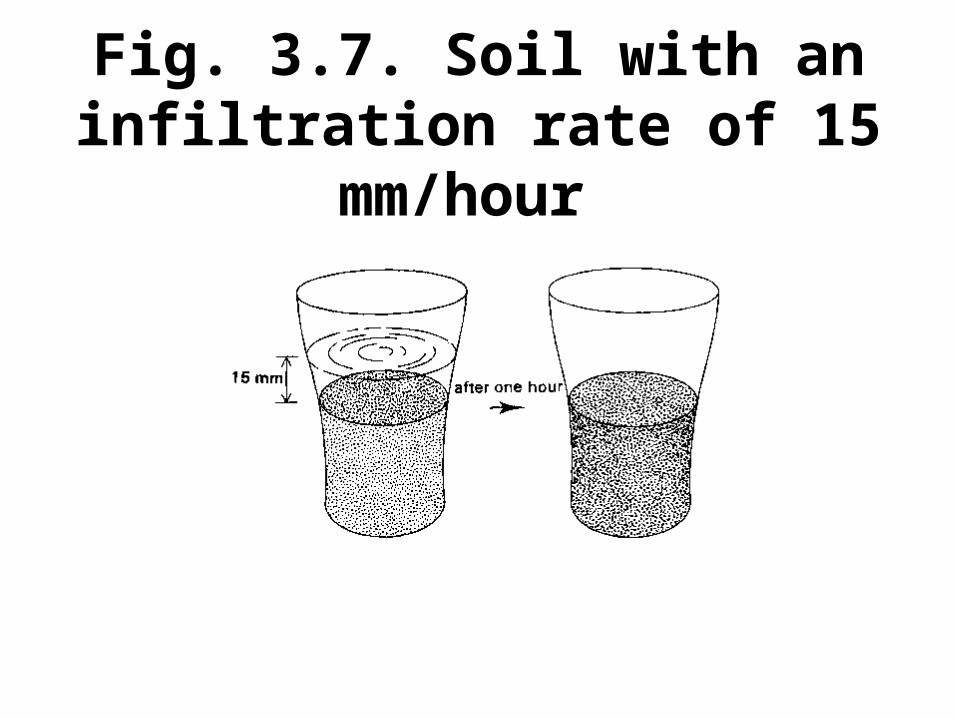
Fig. 3.7. Soil with an infiltration rate of 15 mm/hour
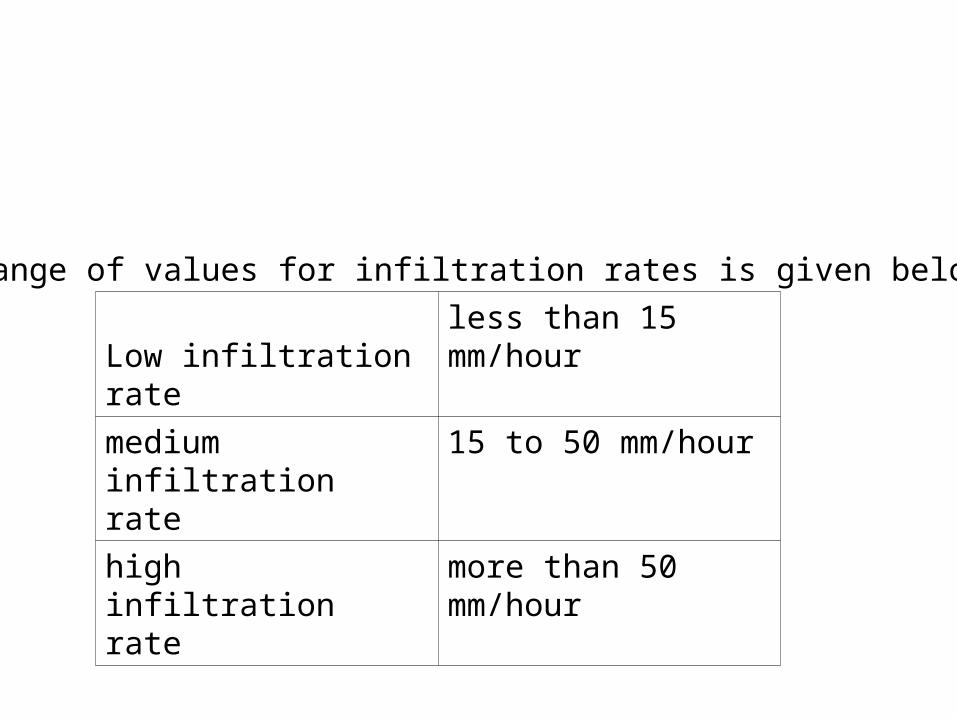
A range of values for infiltration rates is given below:
Low infiltration rateless than 15 mm/hour
medium infiltration rate 15 to 50 mm/hourhigh infiltration rate more than 50 mm/hour
Factors influencing the infiltration rateThe infiltration rate of a soil depends on factors that are constant, such as the soil texture. It also depends on factors that vary, such as the soil moisture content.
i. Soil Texture Coarse textured soils have mainly large particles in between which there are large pores. On the other hand, fine textured soils have mainly small particles in between which there are small pores (see Fig. 3.8). In coarse soils, the rain or irrigation water enters and moves more easily into larger pores; it takes less time for the water to infiltrate into the soil. In other words, infiltration rate is higher for coarse textured soils than for fine textured soils.
ii. The soil moisture content The water infiltrates faster (higher infiltration rate) when the soil is dry, than when it is wet. As a consequence, when irrigation water is applied to a field, the water at first infiltrates easily, but as the soil becomes wet, the infiltration rate decreases.
iii. The soil structure Generally speaking, water infiltrates quickly (high infiltration rate) into granular soils but very slowly (low infiltration rate) into massive and compact soils. Because the farmer can influence the soil structure (by means of cultural practices), he can also change the infiltration rate of his soil.
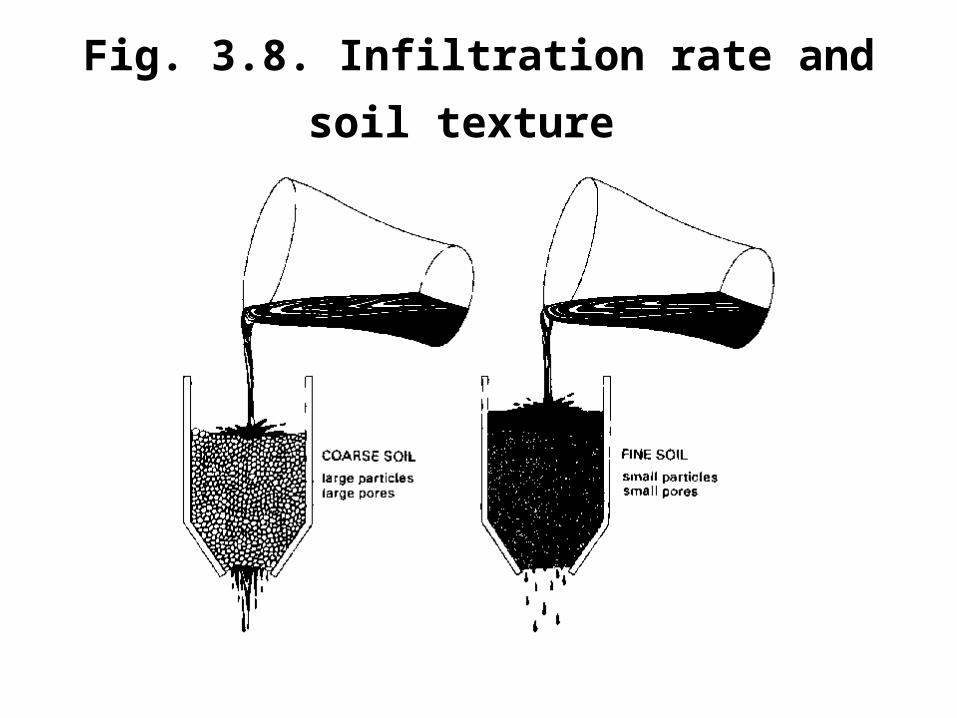
Fig. 3.8. Infiltration rate and soil texture
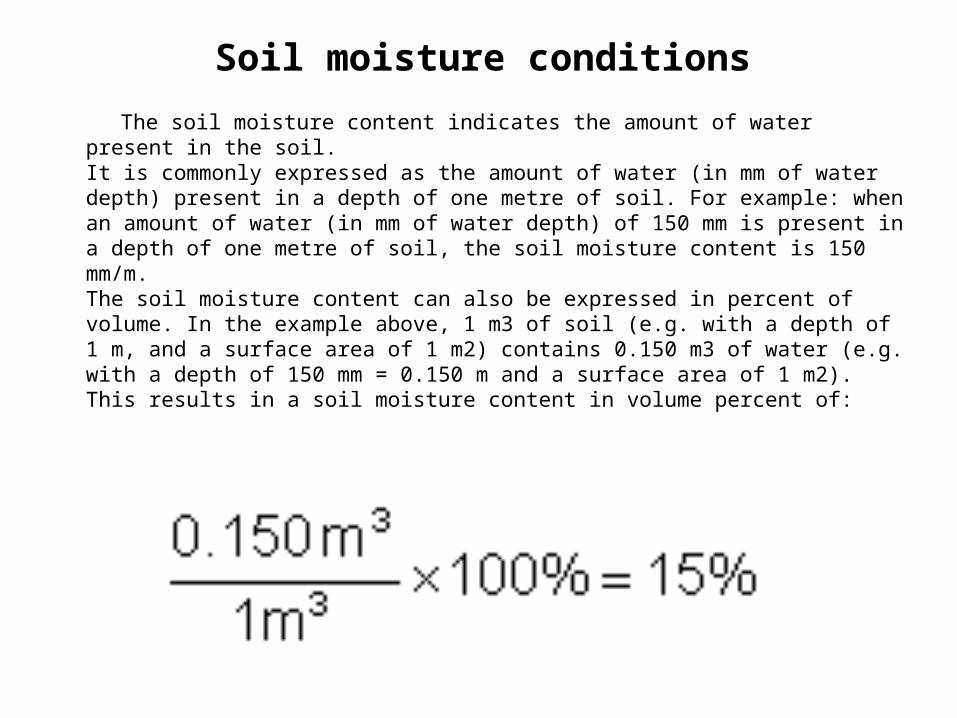
Soil moisture conditions The soil moisture content indicates the amount of water present in the soil.
It is commonly expressed as the amount of water (in mm of water depth) present in a depth of one metre of soil. For example: when an amount of water (in mm of water depth) of 150 mm is present in a depth of one metre of soil, the soil moisture content is 150 mm/m. The soil moisture content can also be expressed in percent of volume. In the example above, 1 m3 of soil (e.g. with a depth of 1 m, and a surface area of 1 m2) contains 0.150 m3 of water (e.g. with a depth of 150 mm = 0.150 m and a surface area of 1 m2). This results in a soil moisture content in volume percent of:
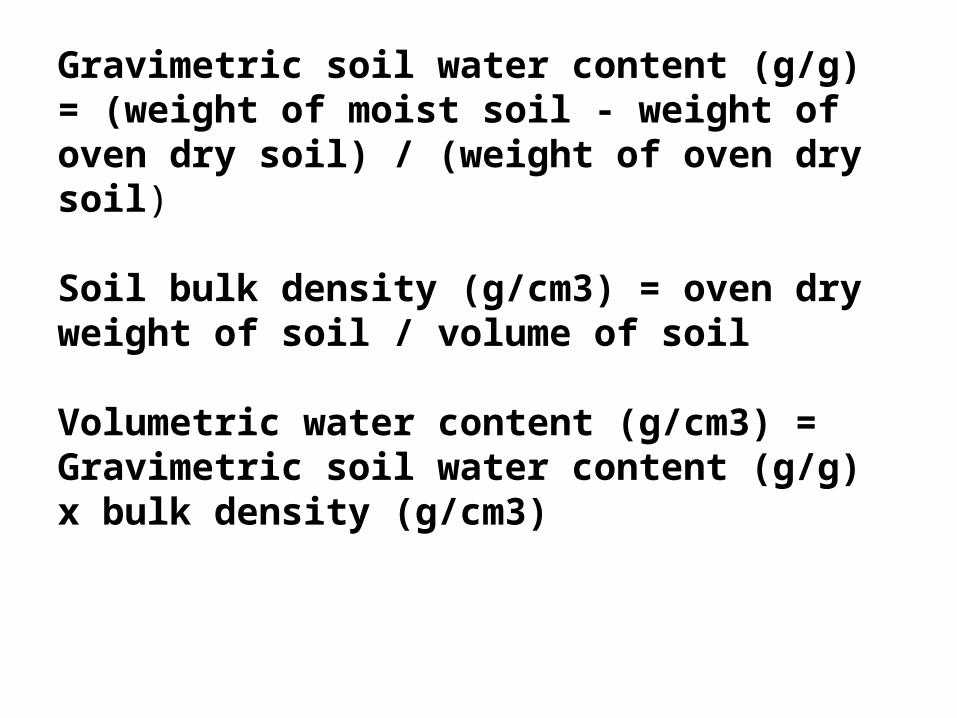
Gravimetric soil water content (g/g) = (weight of moist soil - weight of oven dry soil) / (weight of oven dry soil)
Soil bulk density (g/cm3) = oven dry weight of soil / volume of soil
Volumetric water content (g/cm3) = Gravimetric soil water content (g/g) x bulk density (g/cm3)
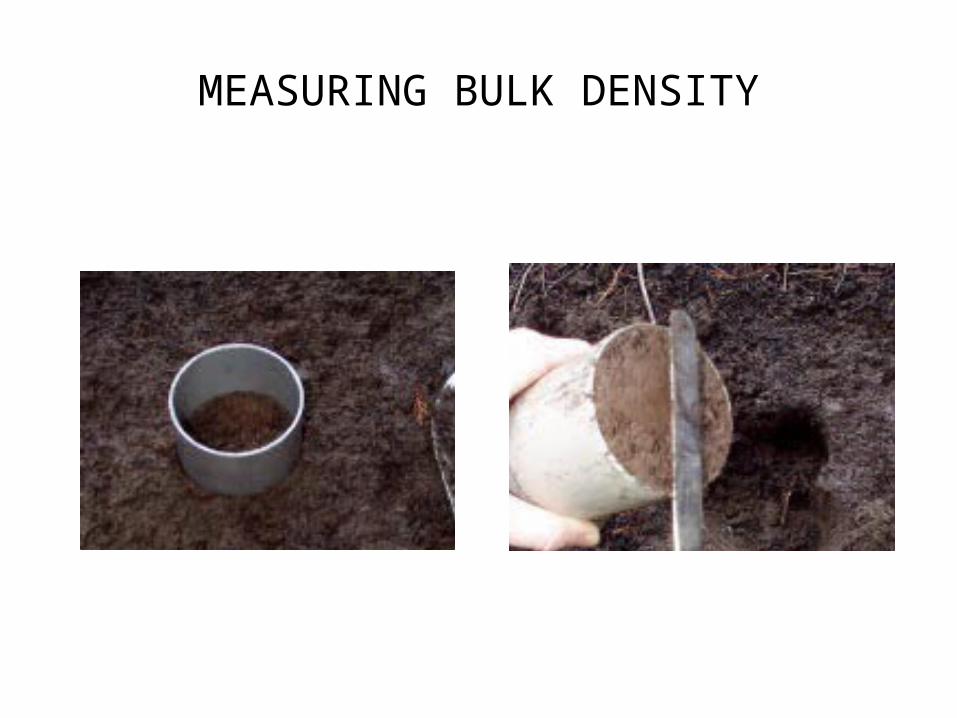
MEASURING BULK DENSITY
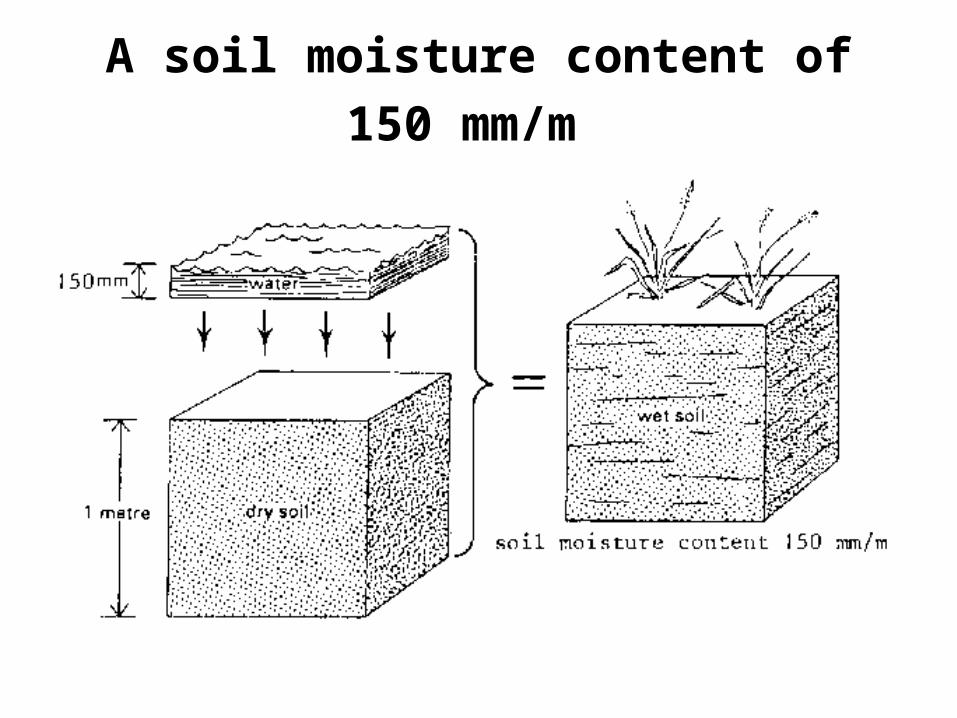
A soil moisture content of 150 mm/m
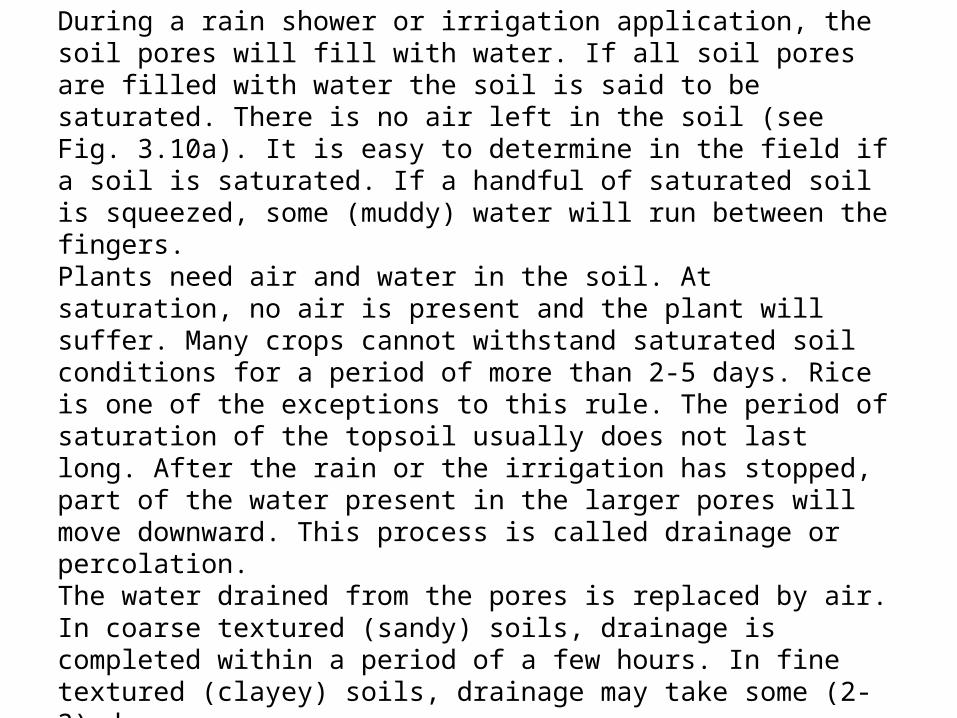
Saturation PointDuring a rain shower or irrigation application, the soil pores will fill with water. If all soil pores are filled with water the soil is said to be saturated. There is no air left in the soil (see Fig. 3.10a). It is easy to determine in the field if a soil is saturated. If a handful of saturated soil is squeezed, some (muddy) water will run between the fingers. Plants need air and water in the soil. At saturation, no air is present and the plant will suffer. Many crops cannot withstand saturated soil conditions for a period of more than 2-5 days. Rice is one of the exceptions to this rule. The period of saturation of the topsoil usually does not last long. After the rain or the irrigation has stopped, part of the water present in the larger pores will move downward. This process is called drainage or percolation. The water drained from the pores is replaced by air. In coarse textured (sandy) soils, drainage is completed within a period of a few hours. In fine textured (clayey) soils, drainage may take some (2-3) days.
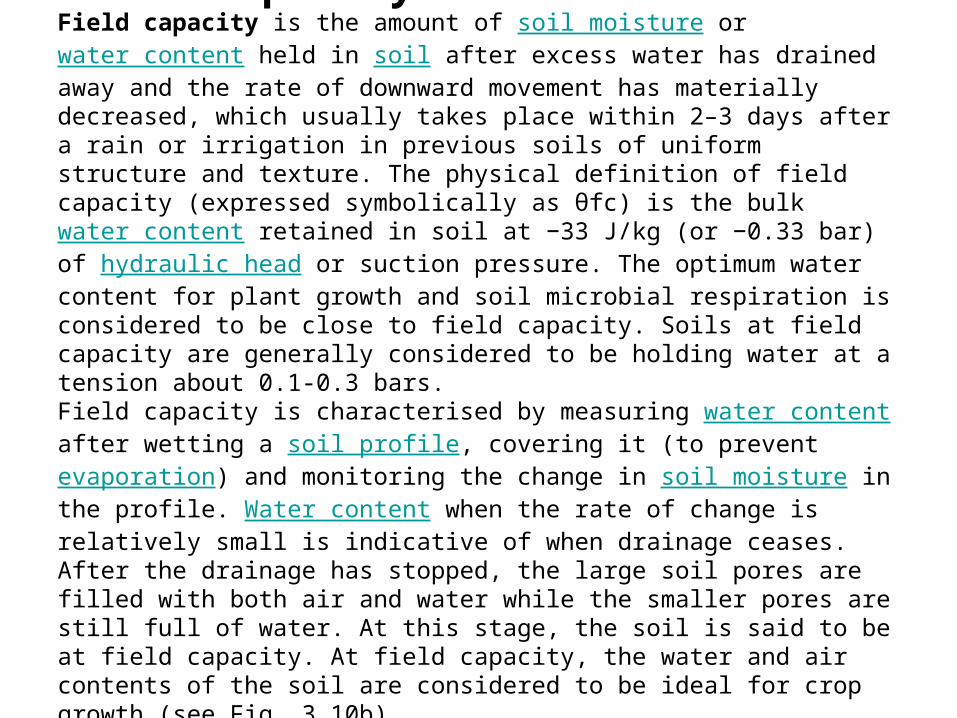
Field capacityField capacity is the amount of soil moisture or water content held in soil after excess water has drained away and the rate of downward movement has materially decreased, which usually takes place within 2–3 days after a rain or irrigation in previous soils of uniform structure and texture. The physical definition of field capacity (expressed symbolically as θfc) is the bulk water content retained in soil at −33 J/kg (or −0.33 bar) of hydraulic head or suction pressure. The optimum water content for plant growth and soil microbial respiration is considered to be close to field capacity. Soils at field capacity are generally considered to be holding water at a tension about 0.1-0.3 bars. Field capacity is characterised by measuring water content after wetting a soil profile, covering it (to prevent evaporation) and monitoring the change in soil moisture in the profile. Water content when the rate of change is relatively small is indicative of when drainage ceases. After the drainage has stopped, the large soil pores are filled with both air and water while the smaller pores are still full of water. At this stage, the soil is said to be at field capacity. At field capacity, the water and air contents of the soil are considered to be ideal for crop growth (see Fig. 3.10b).
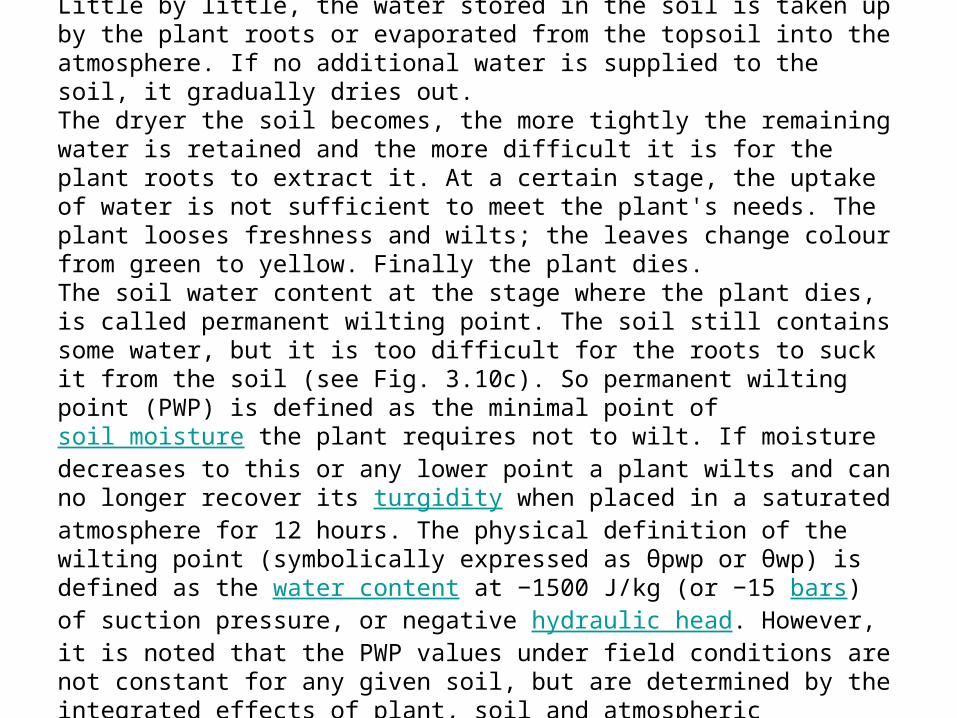
Permanent wilting pointLittle by little, the water stored in the soil is taken up by the plant roots or evaporated from the topsoil into the atmosphere. If no additional water is supplied to the soil, it gradually dries out. The dryer the soil becomes, the more tightly the remaining water is retained and the more difficult it is for the plant roots to extract it. At a certain stage, the uptake of water is not sufficient to meet the plant's needs. The plant looses freshness and wilts; the leaves change colour from green to yellow. Finally the plant dies. The soil water content at the stage where the plant dies, is called permanent wilting point. The soil still contains some water, but it is too difficult for the roots to suck it from the soil (see Fig. 3.10c). So permanent wilting point (PWP) is defined as the minimal point of soil moisture the plant requires not to wilt. If moisture decreases to this or any lower point a plant wilts and can no longer recover its turgidity when placed in a saturated atmosphere for 12 hours. The physical definition of the wilting point (symbolically expressed as θpwp or θwp) is defined as the water content at −1500 J/kg (or −15 bars) of suction pressure, or negative hydraulic head. However, it is noted that the PWP values under field conditions are not constant for any given soil, but are determined by the integrated effects of plant, soil and atmospheric conditions.
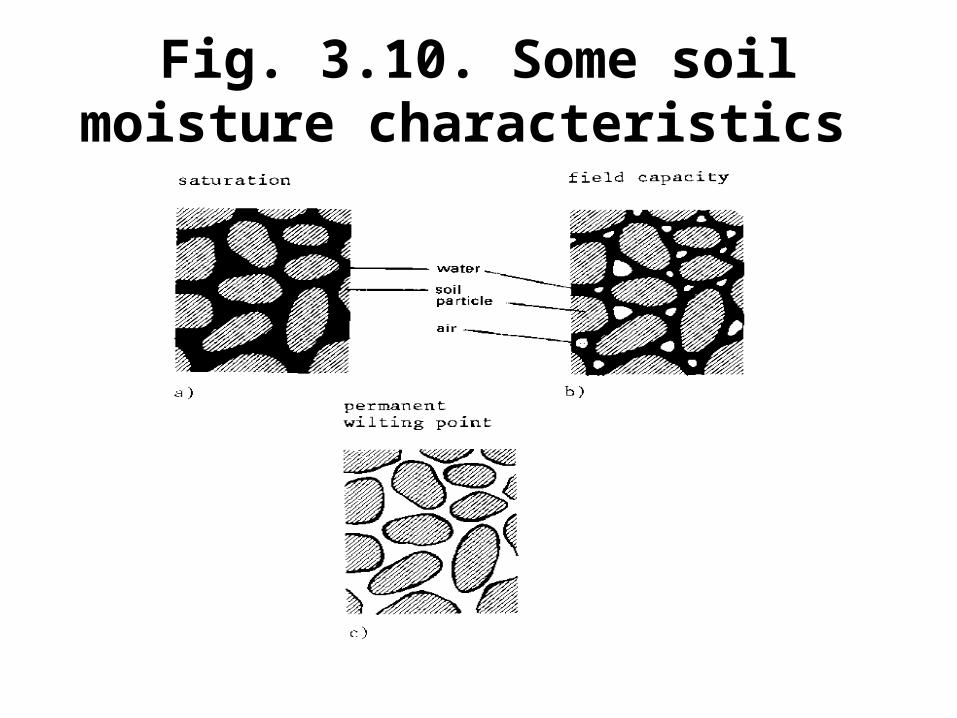
Fig. 3.10. Some soil moisture characteristics
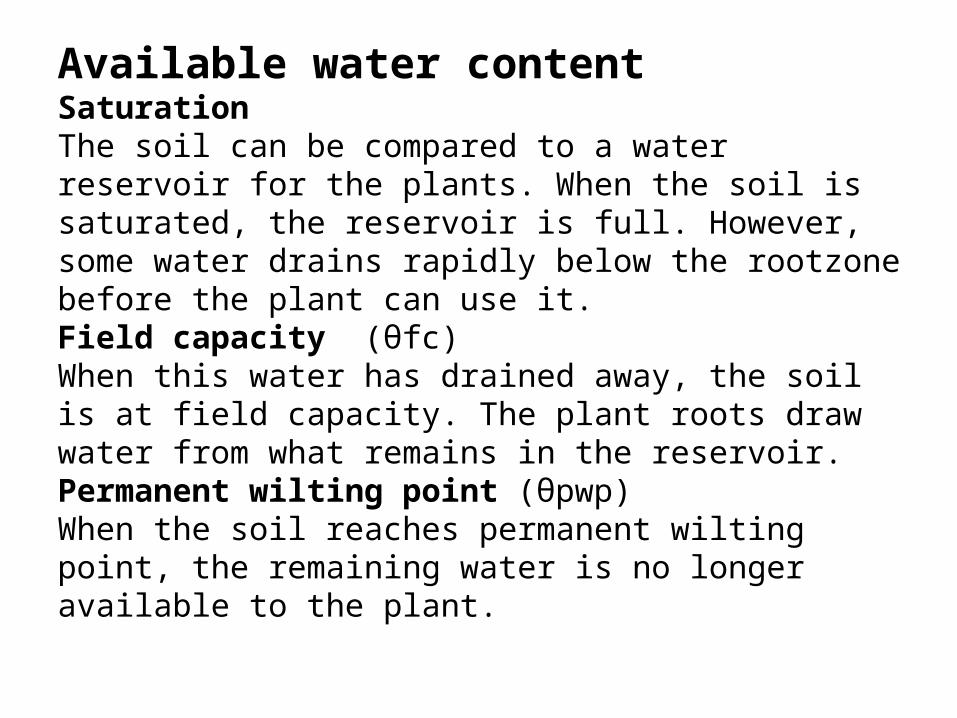
Available water contentSaturation The soil can be compared to a water reservoir for the plants. When the soil is saturated, the reservoir is full. However, some water drains rapidly below the rootzone before the plant can use it.Field capacity (θfc)When this water has drained away, the soil is at field capacity. The plant roots draw water from what remains in the reservoir. Permanent wilting point (θpwp)When the soil reaches permanent wilting point, the remaining water is no longer available to the plant.
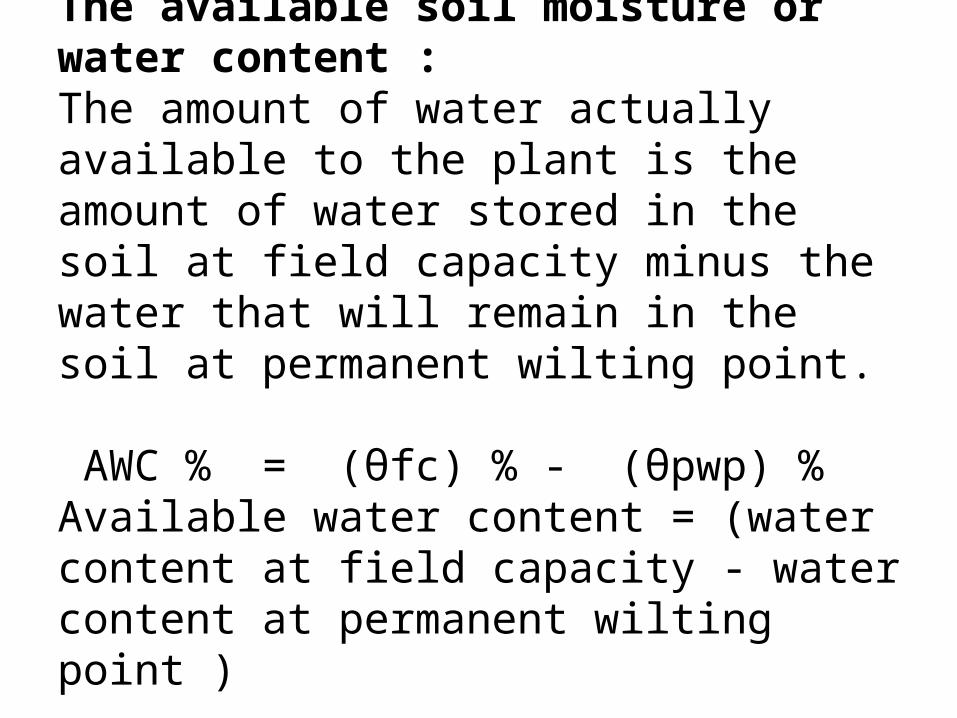
The available soil moisture or water content :The amount of water actually available to the plant is the amount of water stored in the soil at field capacity minus the water that will remain in the soil at permanent wilting point. AWC % = (θfc) % - (θpwp) %Available water content = (water content at field capacity - water content at permanent wilting point )
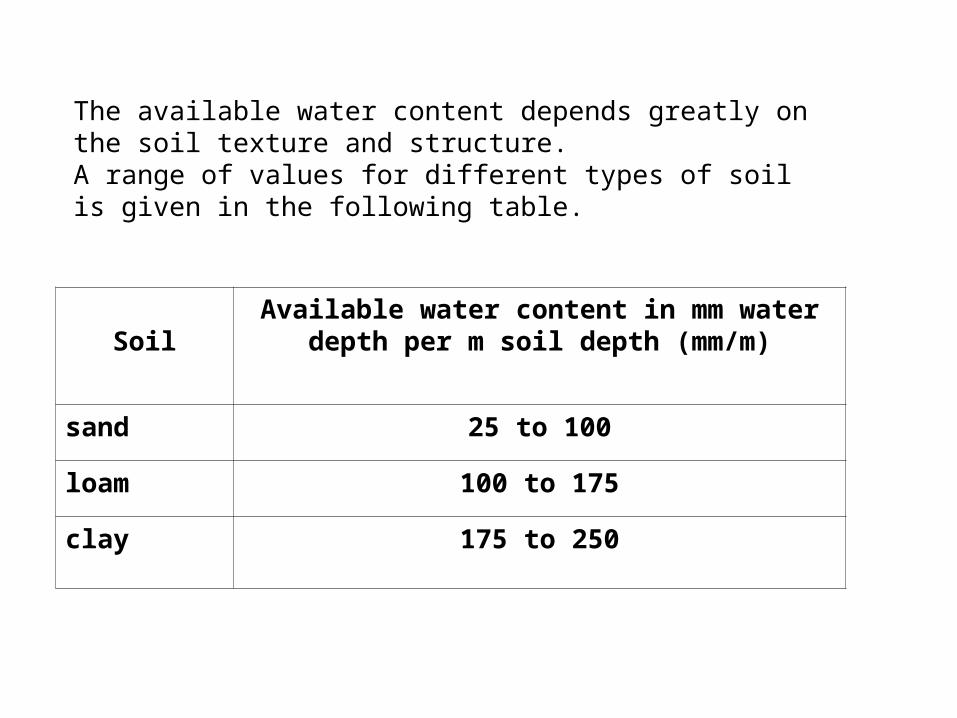
The available water content depends greatly on the soil texture and structure. A range of values for different types of soil is given in the following table.
SoilAvailable water content in mm water depth per
m soil depth (mm/m)
sand 25 to 100
loam 100 to 175
clay 175 to 250
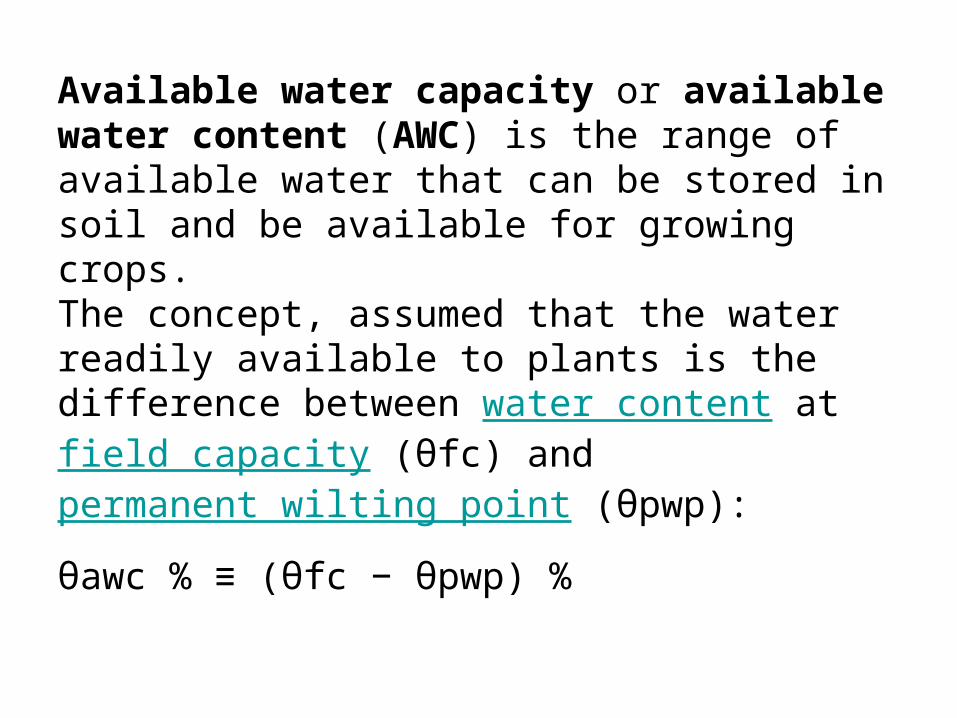
Available water capacity or available water content (AWC) is the range of available water that can be stored in soil and be available for growing crops.The concept, assumed that the water readily available to plants is the difference between water content at field capacity (θfc) and permanent wilting point (θpwp):
θawc % ≡ (θfc − θpwp) %
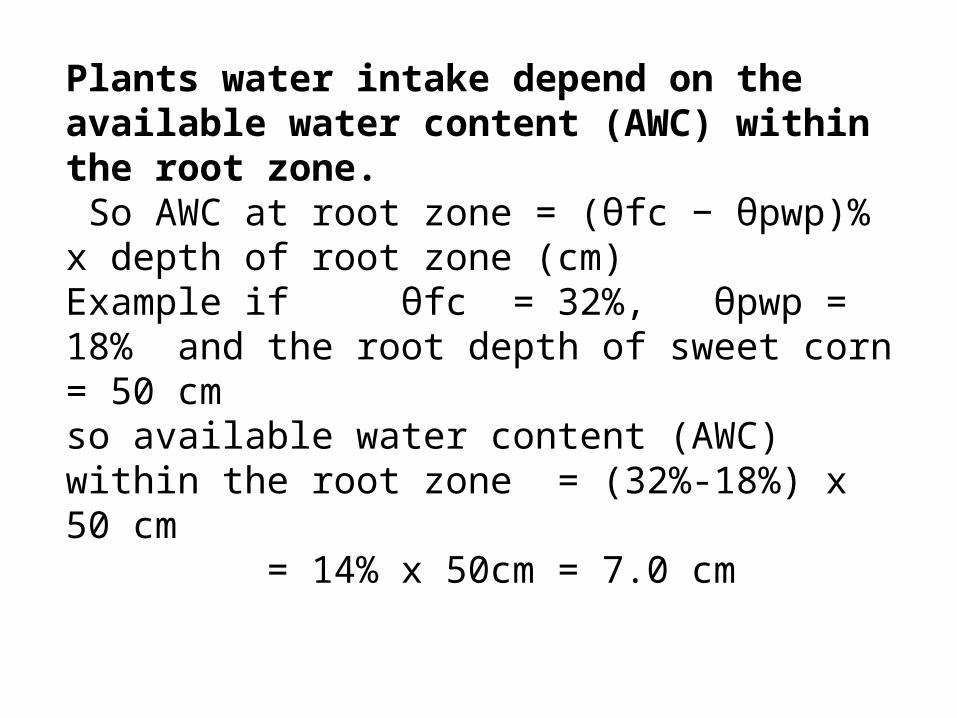
Plants water intake depend on the available water content (AWC) within the root zone. So AWC at root zone = (θfc − θpwp)% x depth of root zone (cm)Example if θfc = 32%, θpwp = 18% and the root depth of sweet corn = 50 cmso available water content (AWC) within the root zone = (32%-18%) x 50 cm = 14% x 50cm = 7.0 cm
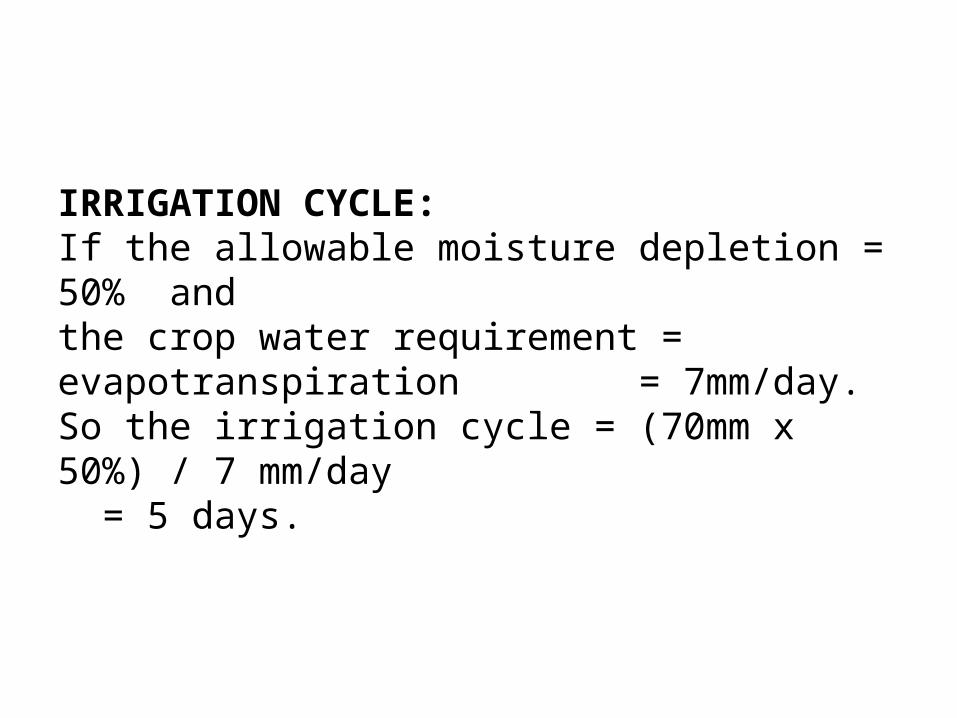
IRRIGATION CYCLE:If the allowable moisture depletion = 50% and the crop water requirement = evapotranspiration = 7mm/day.So the irrigation cycle = (70mm x 50%) / 7 mm/day = 5 days.
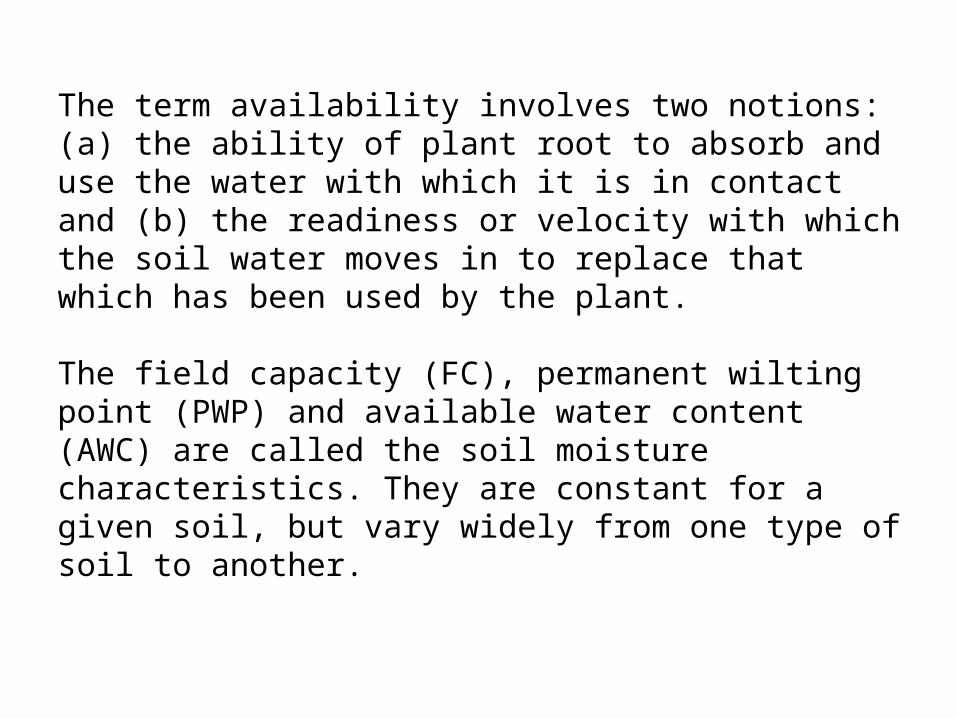
The term availability involves two notions: (a) the ability of plant root to absorb and use the water with which it is in contact and (b) the readiness or velocity with which the soil water moves in to replace that which has been used by the plant.
The field capacity (FC), permanent wilting point (PWP) and available water content (AWC) are called the soil moisture characteristics. They are constant for a given soil, but vary widely from one type of soil to another.
DETERMINATION OF SOIL MOISTURE CURVE
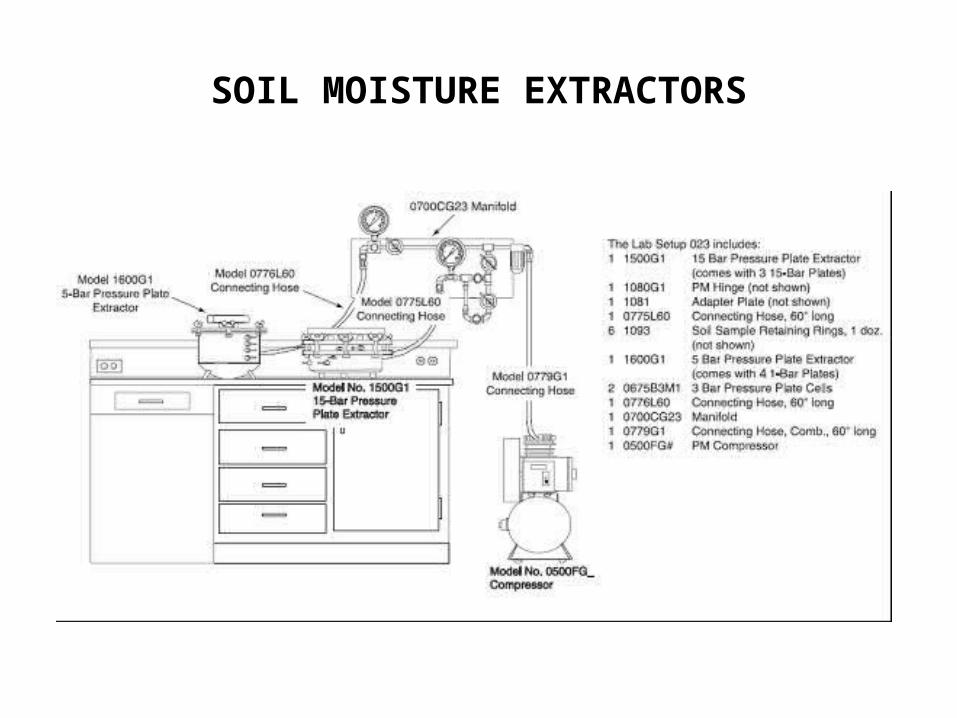
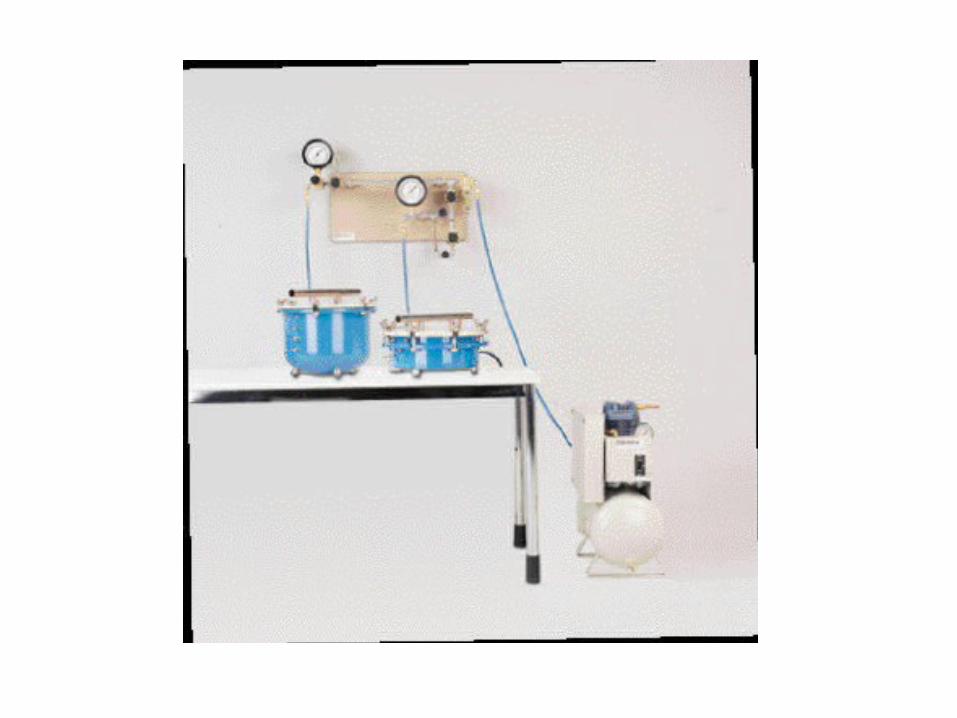
SOIL MOISTURE EXTRACTORS
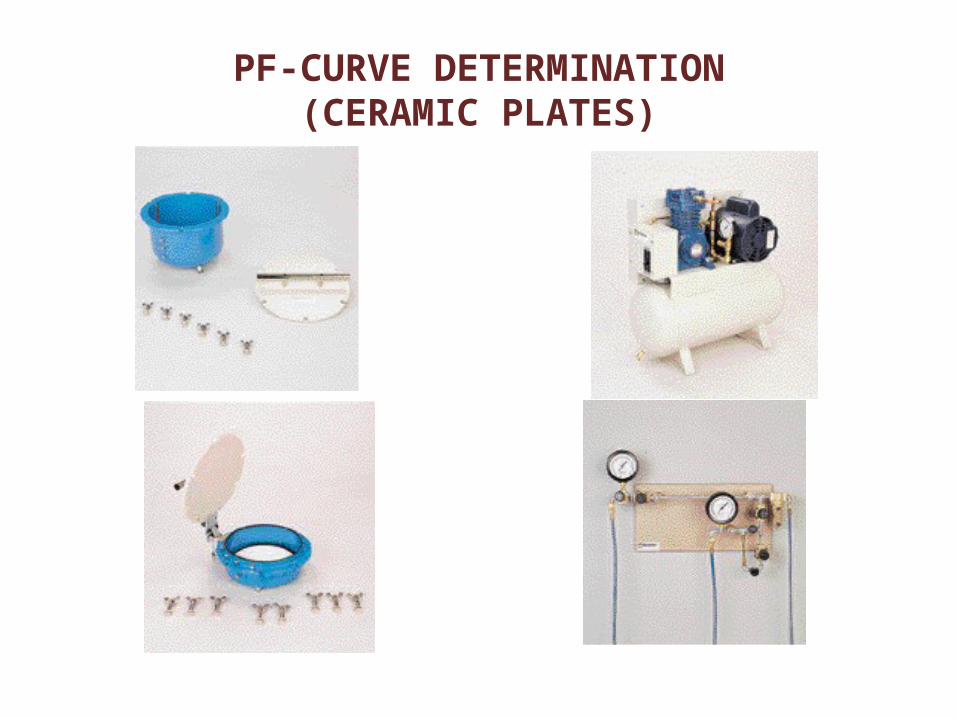
PF-CURVE DETERMINATION(CERAMIC PLATES)
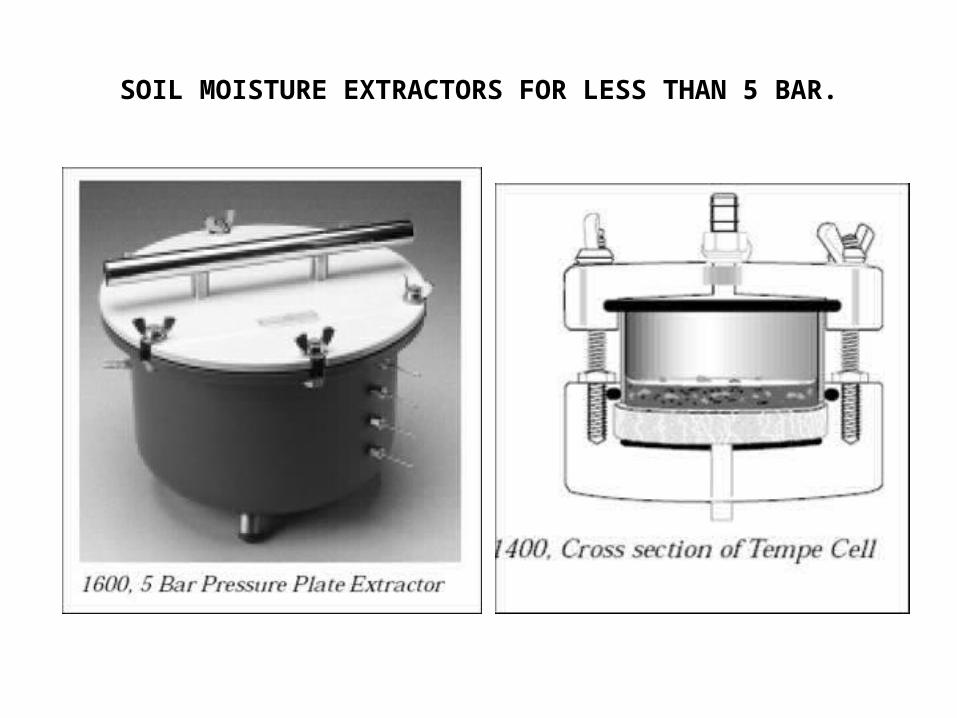
SOIL MOISTURE EXTRACTORS FOR LESS THAN 5 BAR.
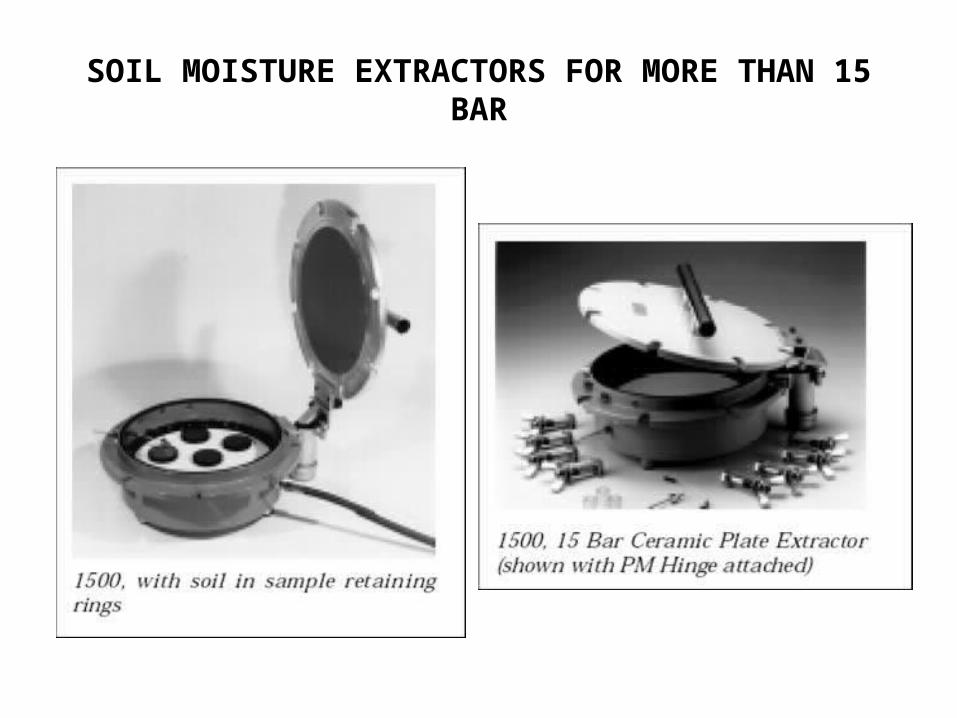
SOIL MOISTURE EXTRACTORS FOR MORE THAN 15 BAR
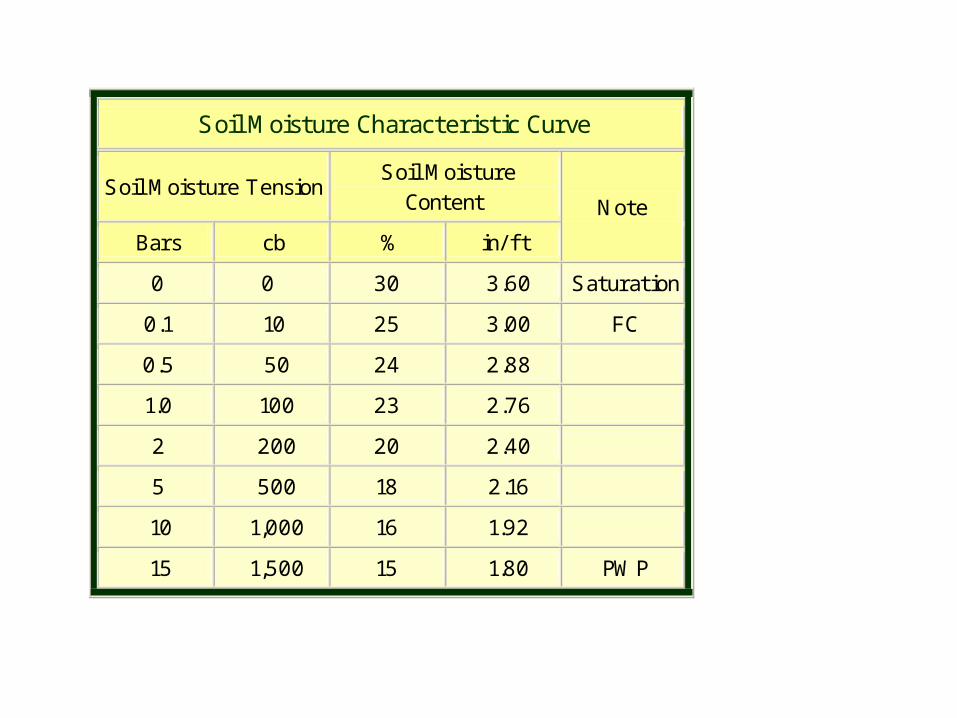
Soil Moisture Characteristic Curve
Soil Moisture Tension Soil Moisture
Content Note
Bars cb % in/ f t
0 0 30 3.60 Saturation
0.1 10 25 3.00 FC
0.5 50 24 2.88
1.0 100 23 2.76
2 200 20 2.40
5 500 18 2.16
10 1,000 16 1.92
15 1,500 15 1.80 PWP
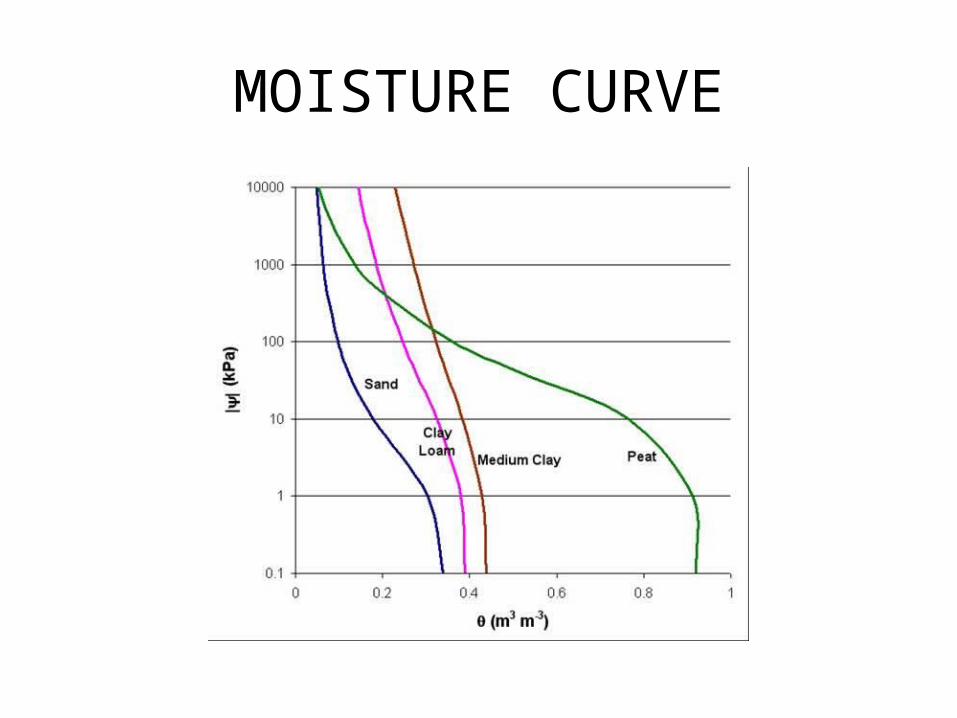
MOISTURE CURVE
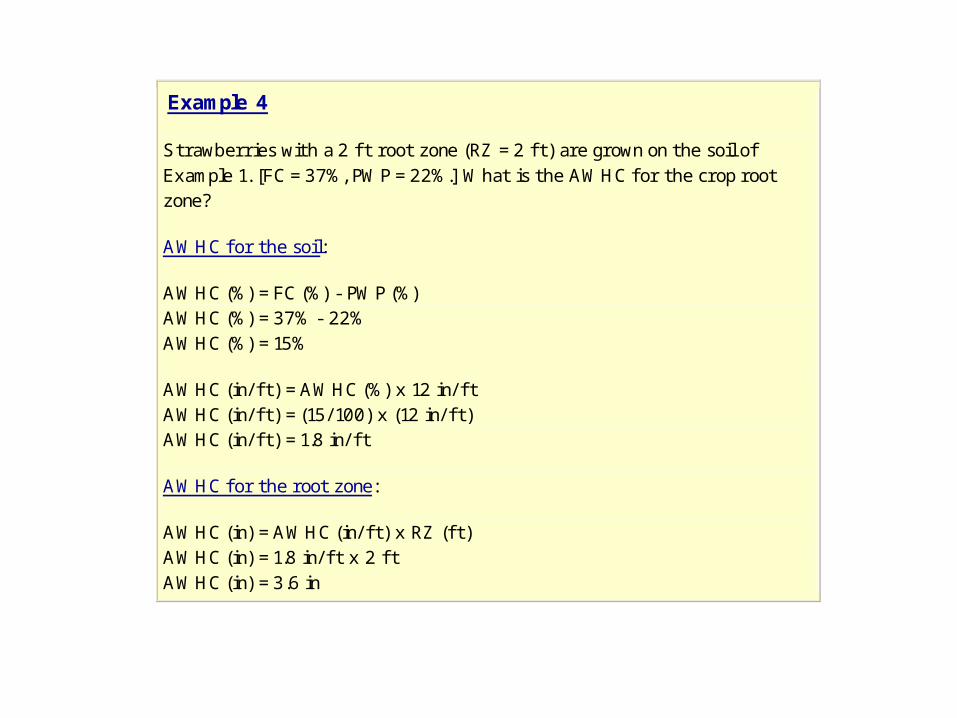
Example 4
Strawberries with a 2 f t root zone (RZ = 2 f t) are grown on the soil of Example 1. [FC = 37%, PWP = 22%.] What is the AWHC for the crop root zone?
AWHC for the soil:
AWHC (%) = FC (%) - PWP (%) AWHC (%) = 37% - 22% AWHC (%) = 15%
AWHC (in/ f t) = AWHC (%) x 12 in/ f t AWHC (in/ f t) = (15/ 100) x (12 in/ f t) AWHC (in/ f t) = 1.8 in/ f t
AWHC for the root zone:
AWHC (in) = AWHC (in/ f t) x RZ (f t) AWHC (in) = 1.8 in/ f t x 2 f t AWHC (in) = 3.6 in
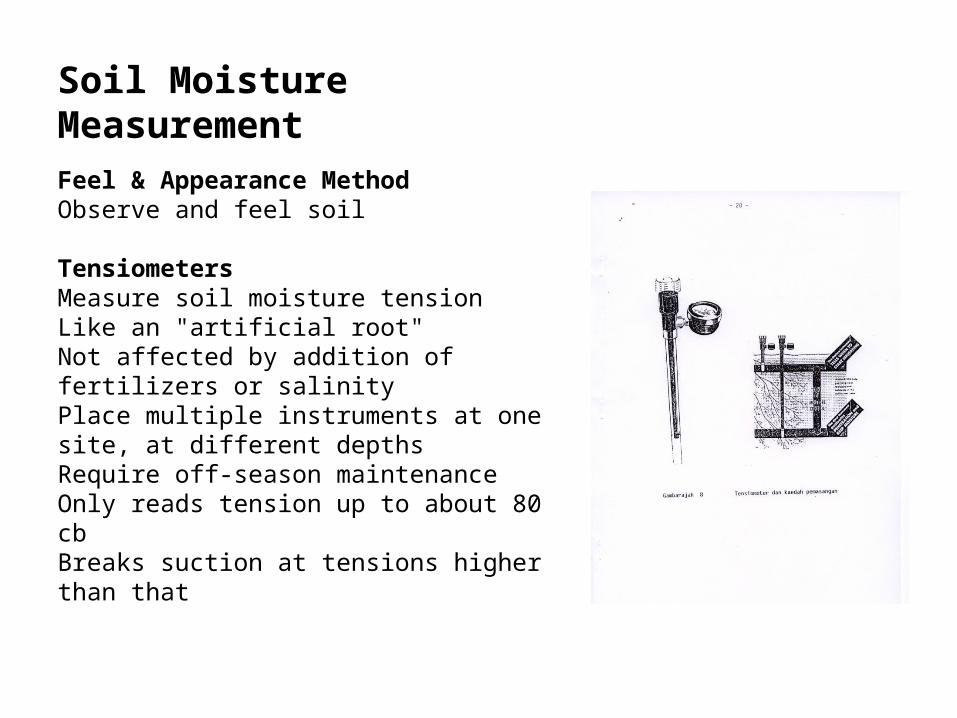
Soil Moisture MeasurementFeel & Appearance MethodObserve and feel soil
TensiometersMeasure soil moisture tension Like an "artificial root" Not affected by addition of fertilizers or salinity Place multiple instruments at one site, at different depths Require off-season maintenance Only reads tension up to about 80 cb Breaks suction at tensions higher than that
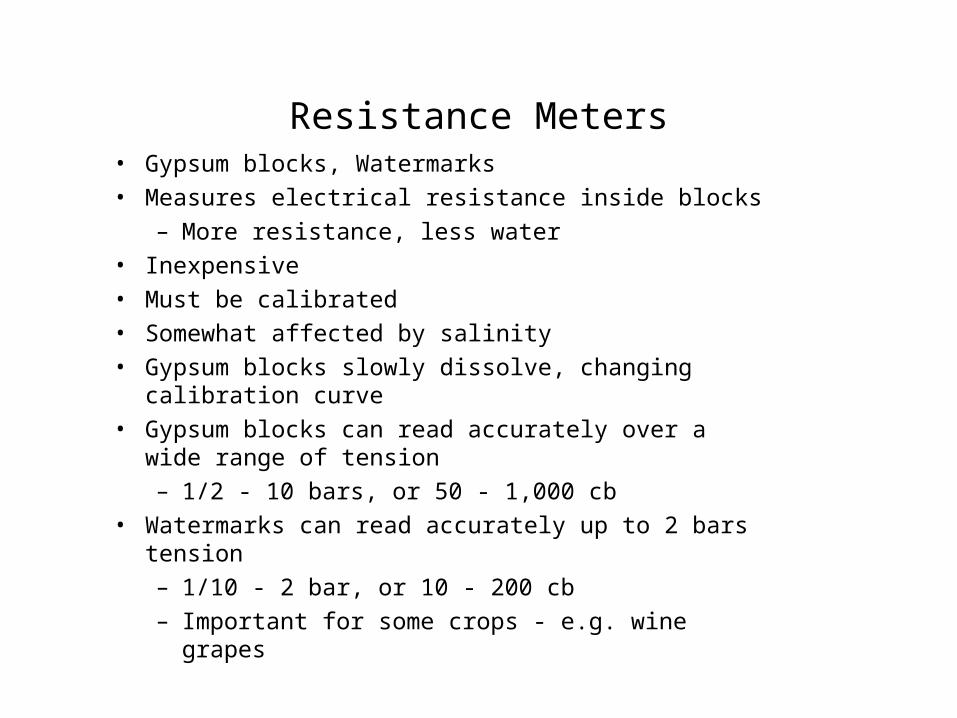
Resistance Meters• Gypsum blocks, Watermarks • Measures electrical resistance inside blocks
– More resistance, less water • Inexpensive • Must be calibrated • Somewhat affected by salinity • Gypsum blocks slowly dissolve, changing calibration
curve • Gypsum blocks can read accurately over a wide
range of tension – 1/2 - 10 bars, or 50 - 1,000 cb
• Watermarks can read accurately up to 2 bars tension – 1/10 - 2 bar, or 10 - 200 cb – Important for some crops - e.g. wine grapes
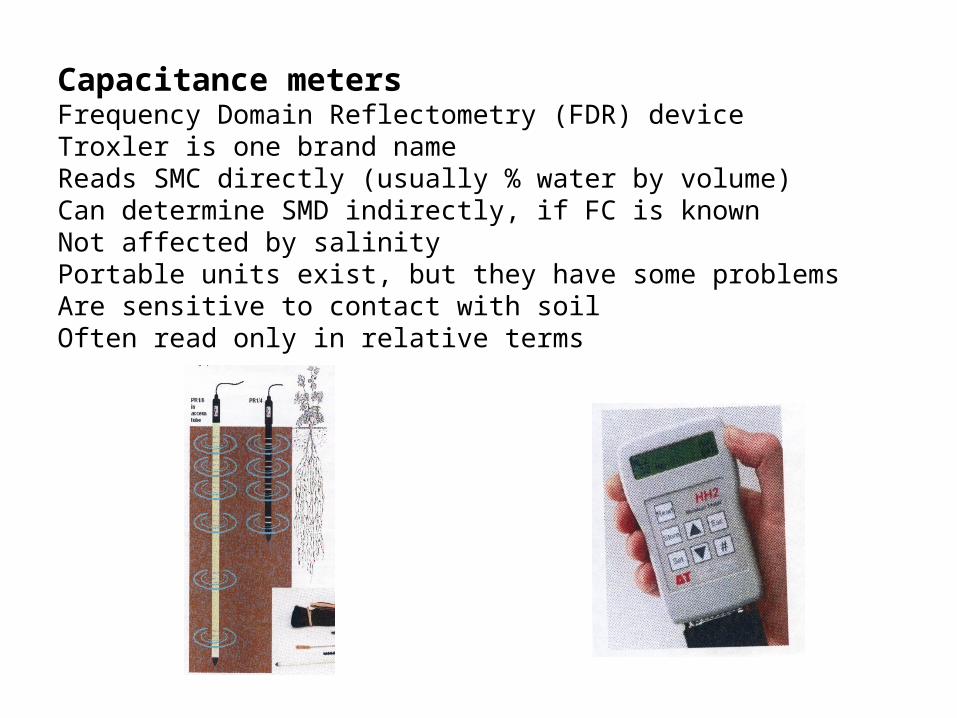
Capacitance metersFrequency Domain Reflectometry (FDR) device Troxler is one brand name Reads SMC directly (usually % water by volume) Can determine SMD indirectly, if FC is known Not affected by salinity Portable units exist, but they have some problems Are sensitive to contact with soil Often read only in relative terms
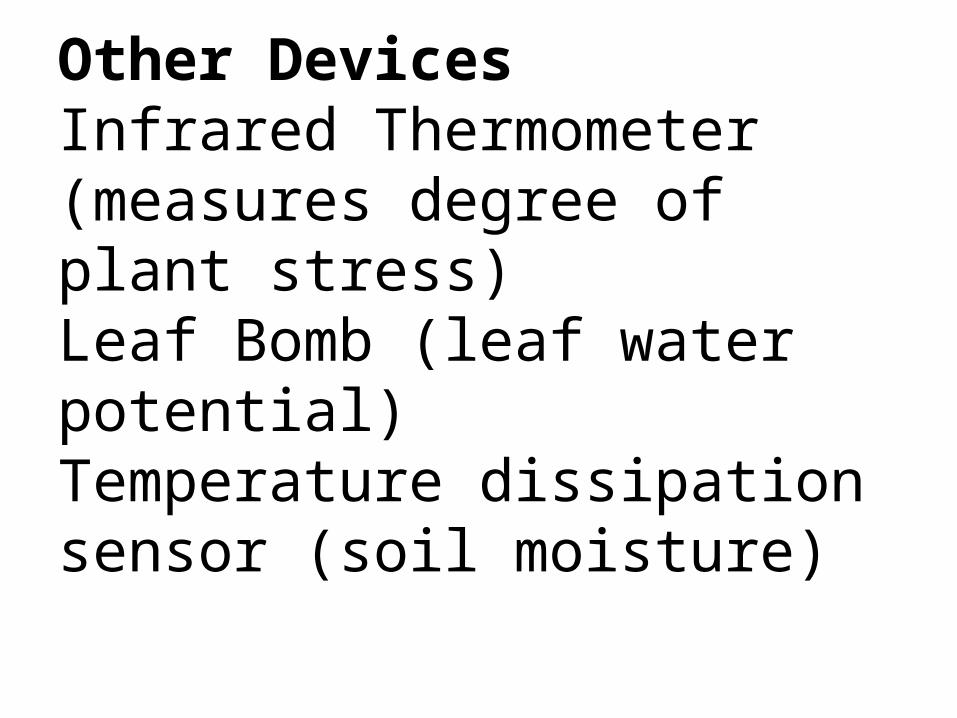
Other DevicesInfrared Thermometer (measures degree of plant stress) Leaf Bomb (leaf water potential)
Temperature dissipation sensor (soil moisture)
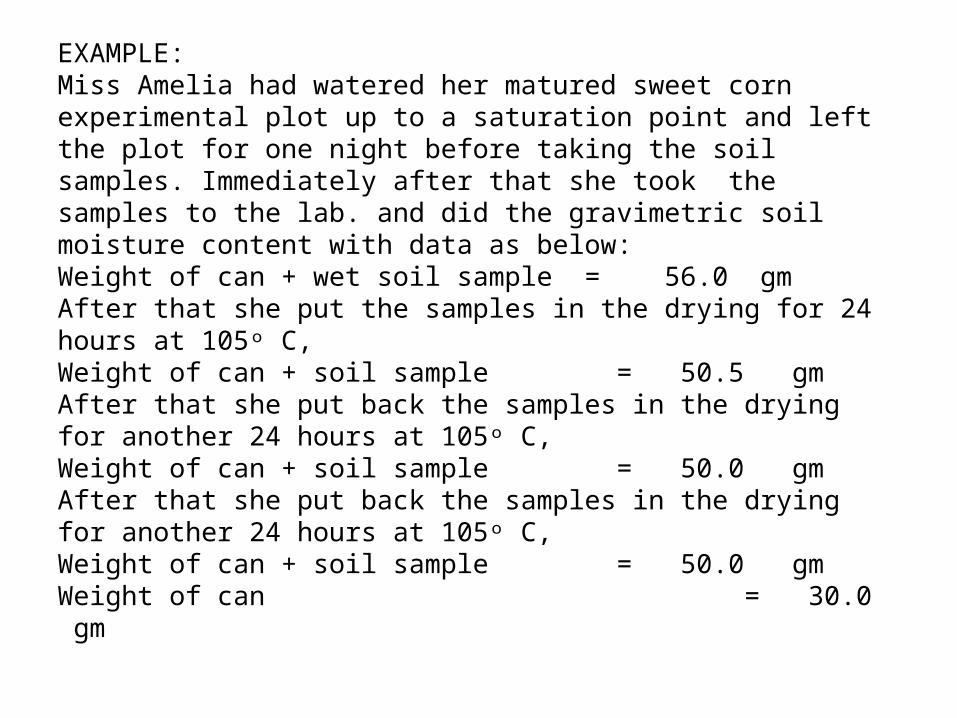
EXAMPLE:Miss Amelia had watered her matured sweet corn experimental plot up to a saturation point and left the plot for one night before taking the soil samples. Immediately after that she took the samples to the lab. and did the gravimetric soil moisture content with data as below:Weight of can + wet soil sample = 56.0 gmAfter that she put the samples in the drying for 24 hours at 105ᵒ C,Weight of can + soil sample = 50.5 gmAfter that she put back the samples in the drying for another 24 hours at 105ᵒ C,Weight of can + soil sample = 50.0 gmAfter that she put back the samples in the drying for another 24 hours at 105ᵒ C,Weight of can + soil sample = 50.0 gmWeight of can = 30.0 gm
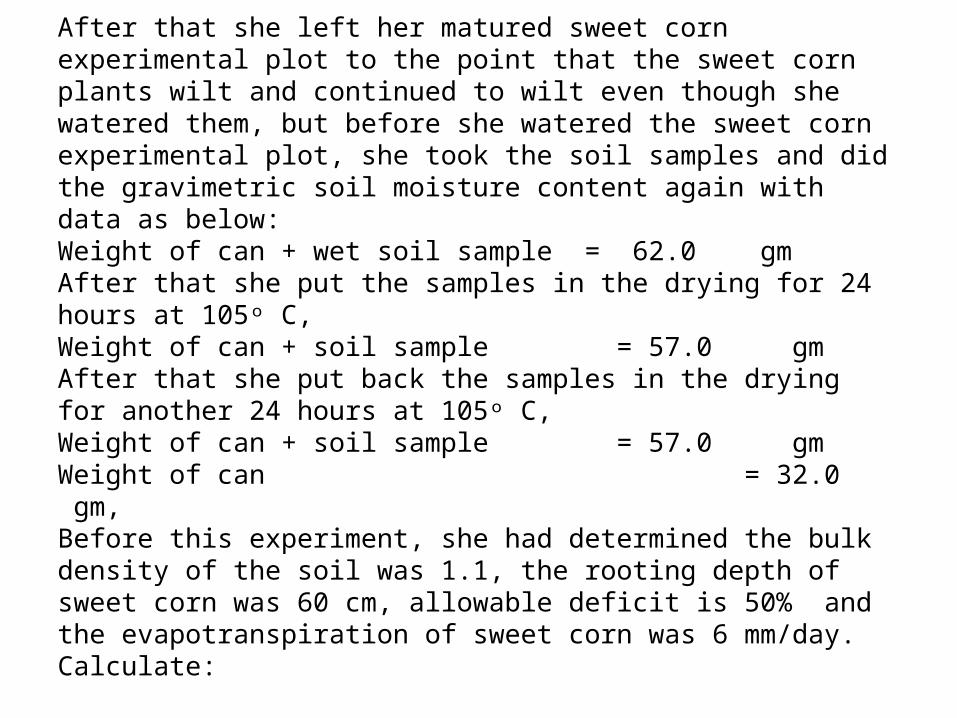
After that she left her matured sweet corn experimental plot to the point that the sweet corn plants wilt and continued to wilt even though she watered them, but before she watered the sweet corn experimental plot, she took the soil samples and did the gravimetric soil moisture content again with data as below:Weight of can + wet soil sample = 62.0 gmAfter that she put the samples in the drying for 24 hours at 105ᵒ C,Weight of can + soil sample = 57.0 gmAfter that she put back the samples in the drying for another 24 hours at 105ᵒ C,Weight of can + soil sample = 57.0 gmWeight of can = 32.0 gm, Before this experiment, she had determined the bulk density of the soil was 1.1, the rooting depth of sweet corn was 60 cm, allowable deficit is 50% and the evapotranspiration of sweet corn was 6 mm/day. Calculate:
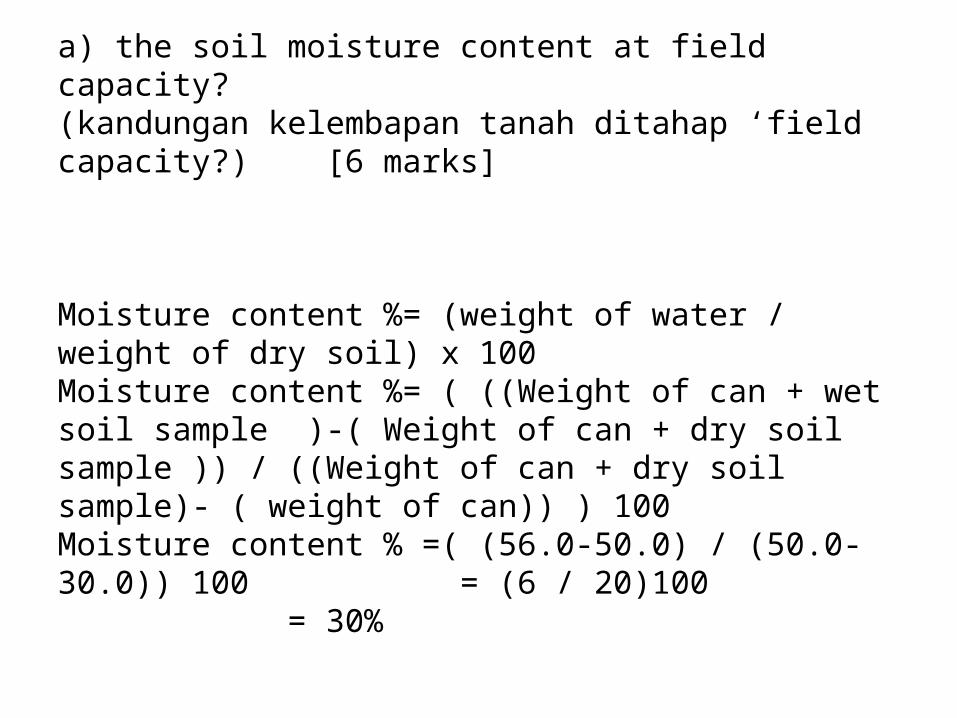
a) the soil moisture content at field capacity?(kandungan kelembapan tanah ditahap ‘field capacity?) [6 marks] Moisture content %= (weight of water / weight of dry soil) x 100Moisture content %= ( ((Weight of can + wet soil sample )-( Weight of can + dry soil sample )) / ((Weight of can + dry soil sample)- ( weight of can)) ) 100Moisture content % =( (56.0-50.0) / (50.0-30.0)) 100 = (6 / 20)100 = 30%
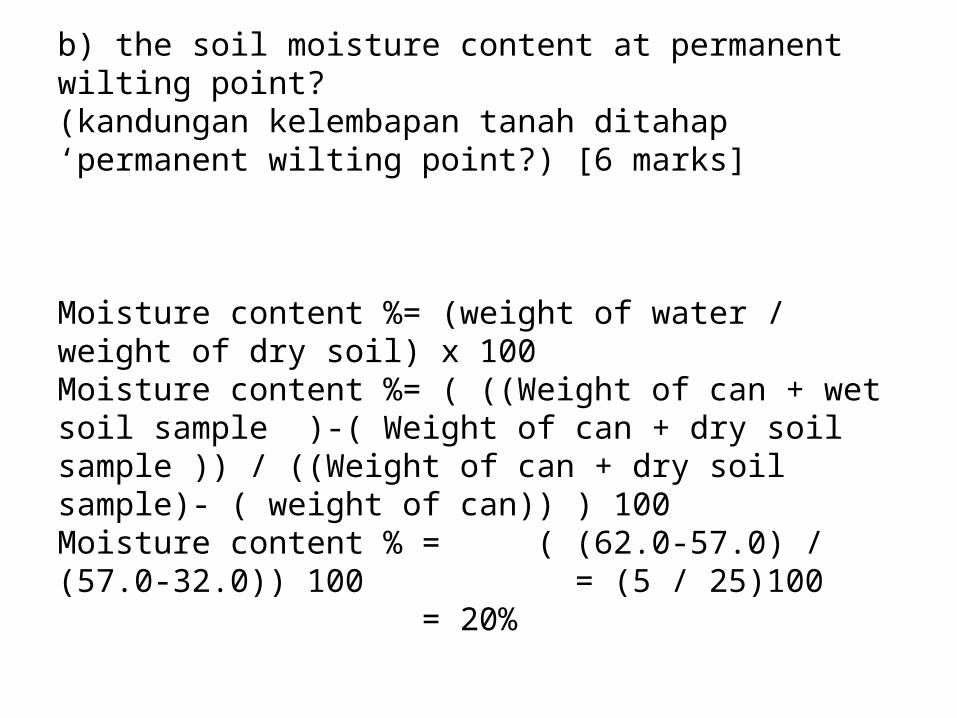
b) the soil moisture content at permanent wilting point?(kandungan kelembapan tanah ditahap ‘permanent wilting point?) [6 marks] Moisture content %= (weight of water / weight of dry soil) x 100Moisture content %= ( ((Weight of can + wet soil sample )-( Weight of can + dry soil sample )) / ((Weight of can + dry soil sample)- ( weight of can)) ) 100Moisture content % = ( (62.0-57.0) / (57.0-32.0)) 100 = (5 / 25)100 = 20%
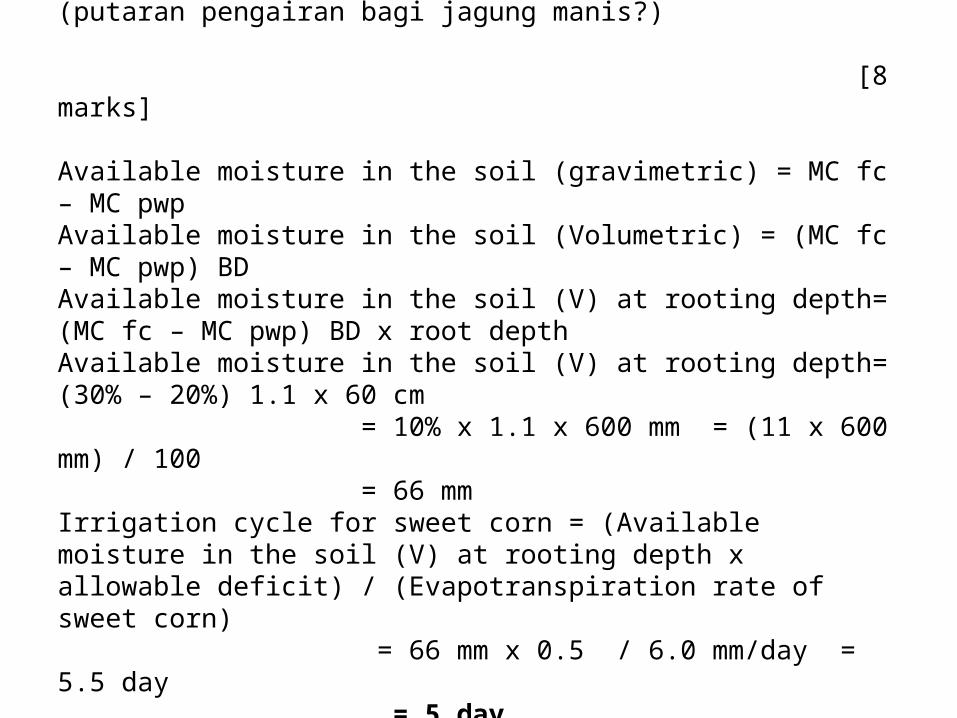
c) the irrigation cycle for the sweet corn?(putaran pengairan bagi jagung manis?) [8 marks]
Available moisture in the soil (gravimetric) = MC fc – MC pwpAvailable moisture in the soil (Volumetric) = (MC fc – MC pwp) BDAvailable moisture in the soil (V) at rooting depth= (MC fc – MC pwp) BD x root depthAvailable moisture in the soil (V) at rooting depth= (30% – 20%) 1.1 x 60 cm = 10% x 1.1 x 600 mm = (11 x 600 mm) / 100 = 66 mmIrrigation cycle for sweet corn = (Available moisture in the soil (V) at rooting depth x allowable deficit) / (Evapotranspiration rate of sweet corn) = 66 mm x 0.5 / 6.0 mm/day = 5.5 day = 5 day

Thank youThank you