mohammad javad hessamistudentsrepo.um.edu.my/7514/2/mj_hessami_phd_dissertation.pdf · kepada...
TRANSCRIPT

PROFILING OF MALAYSIAN SEAWEEDS FOR
BIOETHANOL PRODUCTION
MOHAMMAD JAVAD HESSAMI
FACULTY OF SCIENCE
UNIVERSITY OF MALAYA
KUALA LUMPUR
2017
PROFILING OF MALAYSIAN SEAWEEDS FOR
BIOETHANOL PRODUCTION
MOHAMMAD JAVAD HESSAMI
THESIS SUBMITTED IN FULFILMENT OF THE
REQUIREMENTS FOR THE OF DOCTOR OF
PHILOSOPHY
FACULTY OF SCIENCE
UNIVERSITY OF MALAYA
KUALA LUMPUR
2017
i
UNIVERSITY OF MALAYA
ORIGINAL LITERARY WORK DECLARATION
Name of Candidate: Mohammad Javad Hessami (I.C/Passport No: X95385829)
Registration/Matric No: SHC100099
Name of Degree: PhD
Title of Project Paper/Research Report/Dissertation/Thesis (“this Work”):
“PROFILING MALAYSIAN SEAWEEDS FOR BIOETHANOL PRODUCTION”
Field of Study: Algal Biotechnology
I do solemnly and sincerely declare that:
(1) I am the sole author/writer of this Work;
(2) This Work is original;
(3) Any use of any work in which copyright exists was done by way of fair dealing
and for permitted purposes and any excerpt or extract from, or reference to or
reproduction of any copyright work has been disclosed expressly and
sufficiently and the title of the Work and its authorship have been
acknowledged in this Work;
(4) I do not have any actual knowledge nor do I ought reasonably to know that the
making of this work constitutes an infringement of any copyright work;
(5) I hereby assign all and every rights in the copyright to this Work to the
University of Malaya (“UM”), who henceforth shall be owner of the copyright
in this Work and that any reproduction or use in any form or by any means
whatsoever is prohibited without the written consent of UM having been first
had and obtained;
(6) I am fully aware that if in the course of making this Work I have infringed any
copyright whether intentionally or otherwise, I may be subject to legal action
or any other action as may be determined by UM.
Candidate’s Signature Date:
Subscribed and solemnly declared before,
Witness’s Signature Date:
Name:
Designation:
ii
ABSTRACT
Marine macroalgae (seaweed) biomass has the potential to be an important feedstock for
the production of renewable biofuel. The carbohydrate-rich seaweed shows great
potential as a competitive feedstock for the production of bioethanol. Seaweeds offer a
more economically feasible and environmentally-friendly bioethanol feedstock to the
currently utilised corn and sugarcane. Seaweeds produce a variety of polysaccharides that
require differing conditions for saccharification to produce sugars that can be fermented
to alcohols. The critical step in bioethanol production is the conversion of carbohydrates
to fermentable monosaccharides, which takes place via chemical liquefaction by acid
hydrolysis or the more environmentally-friendly enzymatic saccharification, or a
combination of both. In this study, 29 Malaysian seaweeds (11 green, 10 red and 8 brown
seaweeds) were collected from various habitats and analysed for their potential for
bioethanol production. The seaweeds’ species were analysed for total carbohydrate
content, while sugar production was investigated using the common method of dilute acid
hydrolysis. The highest total carbohydrate content was in Kappaphycus alvarezii (71.22
± 0.71 % DW), followed by Eucheuma denticulatum (69.91 ± 3.35 % DW). The highest
reducing sugar content was found in K. alvarezii and Gracilaria manilaensis, which were
34.12 ± 1.09 % DW and 33.02 ± 1.11 % DW, respectively. Two seaweed species, K.
alvarezii and G. manilaensis, were selected for further analyses based on their high sugar
and carbohydrate contents. To optimise the saccharification process, factors such as
temperature, incubation time, and acid concentration were applied, and based on highest
reducing sugar yield and acceptable fermentation, inhibitors generated during hydrolysis
the combination of 2.5 % w v-1 sulphuric acid, temperature of 120 °C, and 40 min
incubation time were selected, which is regarded as milder, but effective parameters for
hydrolysis. In the current study, this hydrolysis treatment produced total reducing sugar
yields of 34% DW (K. alvarezii) and 33 % DW (G. manilaensis). Two wild-type yeasts,
iii
plus one industrial grade yeast (Saccharomyces cerevisiae, Ethanol Red) were used to
ferment sugar in this study. Only S. cerevisiae Ethanol Red, resulted in high ethanol yield
and was used for further fermentation study. The hydrolysed seaweeds via the optimised
method were converted to bioethanol, where S. cerevisiae resulted in bioethanol yields of
20.90 g L-1 (71.0 % of theoretical yield) for K. alvarezii and 18.16 g L-1 (67.9 % theoretical
yield) for G. manilaensis. Dilute acid residues of both seaweed species were hydrolysed
using enzymatic approach and assimilated to ethanol. The cumulative yield of ethanol of
both dilute acid and enzymatic saccharification was 0.14 g g-1 biomass using K. alvarezii,
while cumulative ethanol yield of 0.15 g g-1 biomass was achieved using G. manilaensis.
In the current study, selected seaweed species were subjected to hydrolysis by dilute acid
saccharification under mild condition using response surface method. Obtained results
indicate that this new strategy can be effective in the saccharification of macroalgal
biomass. This study simultaneously illuminated not only potential seaweed resources of
Malaysia as feedstock for biofuel, but also challenges pertaining to this subject.
iv
ABSTRAK
Biojisim makroalga marin (rumpai laut) mempunyai potensi sebagai bahan mentah yang
penting untuk menghasilkan biofuel. Rumpai laut yang kaya dengan kandungan
karbohidrat menunjukkan potensi besar sebagai bahan mentah kompetitif untuk sektor
pengeluaran bioetanol. Rumpai Laut sebagai bahan mentah bioethanol yang lebih baik
dari segi ekonomi dan mesra alam berbanding dengan jagung dan tebu yang sering
digunakan. Rumpai Laut menghasilkan pelbagai polisakarida yang memerlukan keadaan
yang berbeza untuk proses saccharification untuk menghasilkan gula yang boleh ditapai
kepada alkohol. Langkah penting dalam pengeluaran bioetanol adalah penukaran
karbohidrat kepada monosakarida penapaian melalui proses pencairan kimia dengan
menggunakan hidrolisis asid atau “saccharification” enzim yang lebih bermesra alam,
atau mengabungan kedua-dua kaedah tersebut. Dalam kajian ini, 29 rumpai laut Malaysia
(11 hijau, 10 merah dan 8 perang) telah dikumpul dari pelbagai habitat dan potensi
penghasilan bioethanol telah dianalisiskan. Spesies rumpai laut telah dianalisis untuk
mendapatkan jumlah kandungan karbohidrat dengan menggunakan kaedah sulfurik fenol,
dan penghasilan gula telah dikaji dengan menggunakan kaedah asid cair hidrolisis.
Jumlah kandungan karbohidrat yang paling tinggi dihasilkan daripdada Kappaphycus
alvarezii (71.22 ± 0.71 % dw) diikut oleh Eucheuma denticulatum (69.91 ± 3.35% DW).
Kandungan “reducing sugar” yang tertinggi ditemui dalam K. alvarezii dan Gracilaria
manilaensis iaitu 34.12 ± 1.09 % DW dan 33.02 ± 1.11 % DW. Dua spesies rumpai laut,
K. alvarezii and G. manilaensis, telah dipilih untuk pengajian lanjutan berdasarkan
kandungan gula dan karbohidrat yang tinggi. Untuk mengoptimumkan proses
saccharification, faktor seperti suhu, masa inkubasi dan kepekatan asid telah digunakan
dan berdasarkan penghasilan “reducing sugar” yang tertinggi serta perencat penapaian
dihasilkan semasa hidrolisis yang bergabung dengan 2.5 % w v-1 asid sulfurik, suhu 120
°C dan 40 minit masa pengeraman telah dipilih, keadaan ini mungkin dianggap ringan

v
tetapi masih berkesan untuk proses hidrolisis berlaku.Dalam kajian ini, rawatan hidrolisis
menghasilkan jumlah “reducing sugar” sebanyak 34 % DW (K. alvarezii) dan 33 % DW
(G. manilaensis). Dua jenis mikroorganisma penapaian (Saccharomyces cerevisiae,
Ethanol Red) telah digunakan untuk penapaian gula dalam kajian ini. Hanya S. cerevisiae
, Ethanol Merah menghasilkan kandungan etanol yang tinggi dan telah digunakan dalam
kajian seterusnya. Rumpai laut yang telah dihidrolisiskan melalui kaedah yang optimum
ditukar kepada bioethanol, kandungan bioetanol S. cerevisiae adalah sebanyak 20.90 g L-
1 bersamaan dengan 71.0 % hasil teori, untuk K. alvareazii dan 18.16 g L-1 bersamaan
dengan 67.9 % hasil teori untuk G. manilaensis. Sisa-sisa asid cair bagi kedua-dua spesies
rumpai laut telah dihidrolisis menggunakan enzim dan diasimilasikan kepada etanol.
Hasil pengumpulan etanol kedua-dua asid cair dan enzim saccharification adalah 0.14 g
g-1 biojisism dengan menggunakan K. alvarezii dan 0.15 g g-1 biojisim dengan
menggunakan G. manilaensis. Dalam kajian ini, spesies rumpai laut yang terpilih
dihidrolisis oleh asid cair saccharification di bawah keadaan sederhana menggunakan
kaedah gerak balas permukaan. Keputusan yang diperolehi menunjukkan bahawa strategi
baru ini boleh adalah berkesan dalam saccharification biojisim macroalgal. Kajian ini
bukan sahaja menunjukan rumpai laut Malaysia sebagai sumber yang berpotensi sebagai
bahan mentah untuk biofuel, tetapi juga sebagai cabaran dalam bidang ini.

vi
ACKNOWLEDGEMENTS
I would like to begin this acknowledgement by expressing my gratitude to God, who kept
me on the correct path throughout the course of my studies. I would also like to thank my
first advisor, Professor Dr. Phang Siew Moi, for mentoring me, it is an honour to be your
PhD student. Your guidance and attentiveness greatly encouraged my research
endeavours and helped me grow as a research scientist. I would also like to thank my
second advisor, Dato’ Prof. Dr. Aishah Salleh. I am forever appreciative of your
contributions in terms of your time and funds, both of which made my PhD more
productive and intellectually stimulating. The University of Malaya and the people of
Malaysia also deserve a special mention in their role of hosting me during my studies.
The members of the Algae Research Lab. and IOES have indeed contributed immensely
to my personal and professional development at the University of Malaya. I would like to
take this opportunity to thank the past and present Algae lab and IOES members that I
had the pleasure of working with, who are, but not limited to Yoon Yen, Sim, VJ, Tan Ji,
Victoria, Tan, Mei Cing, Emmie, Fiona, Poh Kheng, Sze looi, Sze Wan, James, Jeannethe,
Yong Hao, Wai Kuan, Kok Keong, Rydza,… and the kind officers of IOES. I would also
like to mention Reza Rabiei and Jelveh Sohrabipoor, who have been instrumental during
the first two years of my PhD. They make excellent friends and were more than happy to
share advice(s) and collaborate when needed. I am also grateful for the collaboration we
had with Martin during the course of my work. Bahram, who was also a collaborator,
deserve a special mention due to his help during my studies and his subsequent friendship.
I am also appreciative of Hui Yin, who was instrumental in handling official affairs. The
statistical portion of my work I owe to Mahmood Danayee, in ADeC, UM, who patiently
taught me statistics. Hong Sok Lai taught me HPLC-RI for some samples also deserve
my gratitude. I would also like to mention friends whose enthusiasm are infectious;
Vahab, Arman, Shahrooz, Vahid, Mohamad Reza, and beloved cousins, Adel and Hana.
vii
I would like to take this opportunity to acknowledge the funds that made my PhD
possible; IPPP, UM, and the Ministry of Science, Technology and Innovation Malaysia.
Last, but certainly not least, I would like to thank my family for all of their support and
encouragement in the course of my work. My dear uncle, Dayee Nasser, who was always
supportive, was more to me than an uncle. The love of my siblings, Nooshin, Narges,
Maedeh and Sadegh, kept me going, and my loving, supportive, encouraging, and patient
wife, Hoda, who remained faithfully supportive during the final stages of my PhD,
deserve my special thanks. Also, my parents, who raised me with the love of science,
supportive of my pursuits; my father who gave me the strength to keep going, and my
mother, who remained supportive even during her battle with cancer. Love you Mom!
Thanks all!
Mohammad Javad Hessami
University Of Malaya
May 2017
viii
TABLE OF CONTENTS
Abstract ............................................................................................................................. ii
Abstrak ............................................................................................................................. iv
Acknowledgements .......................................................................................................... vi
Table of Contents ........................................................................................................... viii
List of Figures ................................................................................................................ xiii
List of Tables.................................................................................................................. xvi
List of Symbols and Abbreviations .............................................................................. xviii
List of Appendices ......................................................................................................... xxi
CHAPTER 1: INTRODUCTION .................................................................................. 1
CHAPTER 2: LITERATURE REVIEW ...................................................................... 6
2.1 Renewable energy and biomass ............................................................................... 6
2.1.1 What are seaweeds? .................................................................................... 7
2.1.2 Algae and the environment ......................................................................... 8
2.2 Algae and biofuel ..................................................................................................... 9
2.2.1 Production of energy from biomass ......................................................... 10
2.2.1.1 Direct combustion ..................................................................... 10
2.2.1.2 Pyrolysis (bio-oil) ...................................................................... 11
2.2.1.3 Gasification ............................................................................... 11
2.2.1.4 Liquefaction .............................................................................. 12
2.2.1.5 Biomethane ................................................................................ 13
2.2.1.6 Bioethanol ................................................................................. 14
2.3 Use of seaweed biomass as feedstock for bioethanol production .......................... 18
2.3.1 Saccharification of seaweed biomass ....................................................... 19

ix
2.3.1.1 Chemical hydrolysis .................................................................. 20
2.3.1.2 Enzymatic hydrolysis ................................................................ 25
2.3.2 Fermentation of algal biomass ................................................................. 31
2.3.3 Fermentation strategies ............................................................................. 32
2.3.3.1 Separate enzymatic hydrolysis and fermentation (SHF) ........... 33
2.3.3.2 Simultaneous saccharification and fermentation (SSF) ............ 34
2.4 Seaweeds of Malaysia............................................................................................ 34
2.4.1 Gracilaria manilaensis Yamamoto & Trono ........................................... 35
2.4.2 Kappaphycus alvarezii (Doty) Doty ex P.C.Silva .................................... 36
2.5 Response surface methodology ............................................................................. 37
CHAPTER 3: MATERIALS AND METHODS ........................................................ 39
3.1 Source of seaweeds ................................................................................................ 39
3.1.1 Seaweed storage and preparation ............................................................. 39
3.2 Experiment 1. Chemical characterisation of selected seaweeds ............................ 41
3.2.1 Total carbohydrate .................................................................................... 41
3.2.2 Moisture and ash ...................................................................................... 41
3.2.3 Reducing sugar ......................................................................................... 42
3.2.4 Soluble neutral sugar by gas chromatography ......................................... 42
3.2.5 Fermentation inhibitors ............................................................................ 43
3.3 Experiment 2. Saccharification of K. alvarezii and G. manilaensis ...................... 44
3.3.1 Method 1: Dilute acid hydrolysis ............................................................. 45
3.3.1.1 Selection of suitable acid ........................................................... 45
3.3.1.2 Fresh vs dry biomass ................................................................. 45
3.3.1.3 Optimisation of dilute acid saccharification .............................. 46
3.3.1.4 Seaweed hydrolysate detoxification .......................................... 46
3.3.2 Method 2: Enzymatic saccharification ..................................................... 47
x
3.3.2.1 Optimization of the enzyme dosage .......................................... 47
3.3.2.2 Optimization of liquid: biomass ratio ........................................ 47
3.4 Experiment 3. Fermentation studies ...................................................................... 48
3.4.1 Yeast strains and medium ......................................................................... 48
3.4.2 Selection of yeast strains and acclimation ................................................ 48
3.4.3 Preparing seaweed hydrolysate for fermentation study ........................... 49
3.4.3.1 Dilute acid hydrolysis ................................................................ 49
3.4.3.2 Enzymatic hydrolysis ................................................................ 50
3.4.4 Fermentation of dilute acid-based hydrolysate......................................... 50
3.4.5 Fermentation of enzyme-based hydrolysate ............................................. 51
3.4.6 Analysing bioethanol content by GC using a novel sample preparation
approach ................................................................................................... 51
3.4.7 Reactor systems ........................................................................................ 52
3.4.7.1 100 mL serum bottle ................................................................. 52
3.4.7.2 1000 mL working volume fermenter ........................................ 53
3.5 Experiment 4. Saccharification using dilute acid at low temperature, based on
response surface methodology (RSM) .................................................................. 54
3.6 Statistical analysis .................................................................................................. 55
CHAPTER 4: RESULTS .............................................................................................. 56
4.1 Experiment 1: Characterization of selected seaweeds ........................................... 56
4.1.1 Total carbohydrate .................................................................................... 56
4.1.2 Moisture and ash ...................................................................................... 56
4.1.3 Reducing sugars ....................................................................................... 58
4.1.4 Neutral sugars ........................................................................................... 58
4.1.5 Fermentation inhibitors ............................................................................ 60
4.2 Experiment 2. Saccharification of K. alvarezii and G. manilaensis biomass ........ 62
xi
4.2.1 Dilute acid saccharification ...................................................................... 62
4.2.1.1 Selection of suitable acid ........................................................... 62
4.2.1.2 Fresh vs dry biomass ................................................................. 64
4.2.1.3 Dilute acid treatment ................................................................. 65
4.2.2 Seaweed hydrolysate detoxification ......................................................... 74
4.2.3 Enzyme-based saccharification ................................................................ 75
4.2.3.1 Optimization of the enzyme dosage .......................................... 75
4.2.3.2 Optimization of liquid: biomass ratio ........................................ 76
4.2.4 Preparation of seaweed hydrolysate for fermentation study .................... 77
4.2.4.1 Dilute acid-based hydrolysis ..................................................... 77
4.2.4.2 Enzyme-based hydrolysis .......................................................... 78
4.3 Experiment 3. Fermentation studies ...................................................................... 79
4.3.1 Selection of microorganism and acclimation to seaweed hydrolyzate ..... 79
4.3.1.1 Acclimation of selected strain ................................................... 83
4.3.2 Fermentation of dilute acid-based hydrolysate......................................... 83
4.3.3 Fermentation of enzyme-based hydrolysate ............................................. 85
4.3.4 Calculating the bioethanol production potential in K. alvarezii and G.
manilaensis ............................................................................................... 87
4.3.5 Analysing bioethanol content by GC using a novel sample preparation
approach ................................................................................................... 90
4.4 Experiment 4. Saccharification at low temperature and dilute acid ...................... 93
4.4.1 RSM modelling for reducing sugar production ........................................ 93
4.4.1.1 Validation of optimum conditions using RSM ....................... 103
CHAPTER 5: DISCUSSION ..................................................................................... 105
5.1 Characterization of selected tropical seaweeds with reference to their use as
feedstock for bioethanol production .................................................................... 105
xii
5.2 Optimization of saccharification of K. alvarezii and G. manilaensis .................. 111
5.3 Fermentation of seaweed hydrolysate to bioethanol ........................................... 117
5.4 Dilute acid hydrolysis at low temperature, a novel approach .............................. 123
CHAPTER 6: CONCLUSION ................................................................................... 125
6.1 Conclusion ........................................................................................................... 125
6.2 Appraisal of this study ......................................................................................... 128
6.3 Areas for future research ..................................................................................... 128
REFERENCES .............................................................................................................. 130
List of Publications and Papers Presented .................................................................... 149
Appendices .................................................................................................................... 150
xiii
LIST OF FIGURES
Figure 1.1: Flow-chart of research approach. 5
Figure 2.1: Various forms of the seaweeds. 8
Figure 3.1: A. Gracilaria manilaensis; B. Kappaphycus alvarezii. 44
Figure 3.2:
Bioreactors: Left: 100 mL serum bottle; Right: Lab scale
fermentation setup (A. PC; B. 1.4 L fermenter; C. Water chiller
and D. Rotary evaporator)
53
Figure 4.1: Effect of four different acids on saccharification of G. manilaensis
samples under different concentrations (0.5 – 5 % w v-1) and
incubation time of 60 min, at 121 °C. (Hydrochloric acid ♦;
Sulphuric acid ●; Perchloric acid ▲, Acetic acid ■). Mean ± SD:
n=3. Means with different letter are significantly different at each
acid concentration level (p < 0.5, Tukey, HSD).
63
Figure 4.2: Evaluation of the effect of biomass (G. manilaensis) condition
(Dry ● Fresh ■) on the yield of saccharification. Mean ± SD, n=3,
Independent t-Test df 4, p < 0.05 *, p < 0.01 **.
64
Figure 4.3: Reducing sugar content obtained under different conditions
during thermal-acidic treatment of K. alvarezii (80 °C). Means
with different letter are significantly different at each acid
concentration level (p < 0.5, Tukey, HSD), n=3.
66
Figure 4.4: Reducing sugar content obtained under different conditions
during thermal-acidic treatment of K. alvarezii (100 °C). Means
with different letters are significantly different at each acid
concentration level (p < 0.5, Tukey, HSD), n=3.
67
Figure 4.5: Reducing sugar content obtained under different conditions
during thermal-acidic treatment of K. alvarezii (120 °C). Means
with different letter are significantly different at each acid
concentration level (p < 0.5, Tukey, HSD), n=3.
68
Figure 4.6: Reducing sugar content obtained under different conditions
during thermal-acidic treatment of K. alvarezii (140 °C). Means
with different letter are significantly different at each acid
concentration level (p < 0.5, Tukey, HSD), n=3.
69
Figure 4.7: Reducing sugar content obtained under different conditions
during thermal-acidic treatment of G. manilaensis (80 °C). Means
with different letter are significantly different at each acid
concentration level (p < 0.5, Tukey, HSD), n=3.
70
Figure 4.8: Reducing sugar content obtained under different conditions
during thermal-acidic treatment of G. manilaensis (100 °C),
Means with different letter are significantly different at each acid
concentration level (p < 0.5, Tukey, HSD), n=3.
71
xiv
Figure 4.9: Reducing sugar content obtained under different conditions
during thermal-acidic treatment of G. manilaensis (120 °C).
Means with different letter are significantly different at each acid
concentration level (p < 0.5, Tukey, HSD), n=3.
72
Figure 4.10: Reducing sugar content obtained under different conditions
during thermal-acidic treatment of G. manilaensis (140 °C).
Means with different letter are significantly different at each acid
concentration level (p < 0.5, Tukey, HSD), n=3.
73
Figure 4.11: Reduction of 5-HMF during over liming process in K. alvarezii
hydrolysate. Different letters are representing significant
difference at p < 0.05 by Tukey, HSD between yeast species,
(n=3).
74
Figure 4.12: Figure 4.12: Reduction of 5-HMF during over liming process in
G. manilaensis hydrolysate. Different letters are representing
significant difference at p < 0.05 by Tukey, HSD (n=3).
75
Figure 4.13: Enzymatic hydrolysis of G. manilaensis residues by different
cellulase concentration loading. Different letters are representing
significant difference at p < 0.05 by Tukey, HSD (n=3).
76
Figure 4.14: Effect of ratio of liquid to biomass (G. manilaensis cellulosic
residues) in hydrolysis yield and final glucose concentration.
77
Figure 4.15: Fermentation of hydrolysate of G. manilaensis by B. bruxellensis-
NBRC 0677, during cyclic adaption. Different letters are
representing significant difference at p < 0.05 by Tukey, HSD
(n=3).
81
Figure 4.16: Fermentation of hydrolysate of G. manilaensis by S. cerevisiae-
NBRC 10217, during cyclic adaption. Different letters are
representing significant difference at p < 0.05 by Tukey, HSD
(n=3).
81
Figure 4.17: Fermentation of hydrolysate of G. manilaensis by S. cerevisiae-
Ethanol Red, during cyclic adaption. Different letters are
representing significant difference at p < 0.05 by Tukey, HSD
(n=3).
82
Figure 4.18: Ethanol production from hydrolysate of G. manilaensis by three
yeast strains after 3 cyclic acclimations. Sc: S. cervisies NBRC
10217; Bb: B. bruxellensis- NBRC 0677; Ethanol Red: S.
cerevisiae- Ethanol Red. Different letters are representing
significant difference at p < 0.05 by Tukey, HSD between yeast
species, (n=3).
82
Figure 4.19: Ethanol production from G. manilaensis hydrolysate, initial
reducing sugar concentration and remaining reducing sugar
concentration of acclimation process in S. cerevisiae- Ethanol
Red, n=3. (* Significant difference p < 0.05, ns: Not Significant).
83
xv
Figure 4.20: Fermentation with dilute acid hydrolysate of K. alvarezii
hydrolysate using Ethanol Red, S. cerevisiae.
84
Figure 4.21: Fermentation with dilute acid hydrolysate of G. manilaensis
hydrolysate using Ethanol Red, S. cerevisiae.
85
Figure 4.22: Fermentation with enzymatic hydrolysate of K. alvarezii.
86
Figure 4.23: Fermentation with enzymatic hydrolysate of G. manilaensis.
86
Figure 4.24: Material balance chart for the conversion of K. alvarezii biomass
to bioethanol.
88
Figure 4.25: Material balance chart for the conversion of G. manilaensis
biomass to bioethanol.
89
Figure 4.26: Effect of solvent mixture on fermented sample, A. Centrifuged
fermented sample, B. supernatant of centrifuged sample from vial
A, C. Solvent mixture is added to sample, D. Centrifuged
precipitated sample.
90
Figure 4.27: Chromatogram of three compounds (retention time, min)
including; Ethanol (2.30), Acetonitrile (2.660) and Iso-Butanol
(3.060).
91
Figure 4.28: Effect of “A” Acid concentration (% w v-1) and “B” Temperature
(°C) on reducing sugar yield in dilute acid treatment of K.
alvarezii.
100
Figure 4.29: Effect of “A” Acid concentration (% w v-1) and “B” Temperature
(°C) on reducing sugar yield in dilute acid treatment of G.
manilaensis.
100
Figure 4.30: Effect of “A” Acid concentration (% w v-1) and “C” Incubation
Time (h) on reducing sugar yield in dilute acid treatment of K.
alvarezii.
101
Figure 4.31: Effect of “A” Acid concentration (% w v-1) and “C” Incubation
Time (h) on reducing sugar yield in dilute acid treatment of G.
manilaensis
102
Figure 4.32: Effect of “C” Time (h) and “B” Temperature (°C) on reducing
sugar yield in dilute acid treatment of K. alvarezii
102
Figure 4.33: Effect of “C” Time (h) and “B” Temperature (°C) on reducing
sugar yield in dilute acid treatment of G. manilaensis.
103
Figure 5.1: Energy demand in a single distillation unit for concentration of
the dilute ethanol stream to 94.5 % (w w-1) (Galbe, 2002).
115
xvi
LIST OF TABLES
Table 2.1: Reducing sugar and bioethanol yields of some land-crops.
16
Table 2.2: Comparison between two acid hydrolysis approaches
(Taherzadeh & Karimi, 2007a).
21
Table 2.3: Comparison of chemical saccharification and ethanol yields from
different seaweed biomass.
23
Table 2.4: Comparison of enzymatic treatments in the saccharification of
selected seaweeds.
29
Table 3.1: List of seaweeds used.
40
Table 3.2: Coded level for variables used in the experimental design.
55
Table 4.1: Total carbohydrate, reducing sugar, ash and moisture contents of
selected Malaysian seaweeds.
57
Table 4.2: Monosaccharide composition of some selected seaweed species
conducted with gas chromatography.
59
Table 4.3: Composition of some fermentation inhibitors including 5-
hydroxymethylfurfural, (5-HMF); furfural and total phenolic
compounds (TPC) in hydrolysates obtained from saccharification
of selected tropical seaweeds.
61
Table 4.4: Material balance obtained during dilute acid hydrolysis treatment
for fermentation study.
78
Table 4.5: Effect of over-liming treatment to remove fermentation inhibitors
on two seaweed hydrolysates.
78
Table 4.6: Results of enzymatic hydrolysis of two seaweeds by dilute acid
treatment residues from 7 g DW residue.
79
Table 4.7: Calculated values of enzymatic hydrolysis of two seaweed dilute
acid treatment residues obtained from 100 g DW biomass.
79
Table 4.8: Evaluating the solvents mixture method by known ethanol
concentration samples.
92
Table 4.9: Experimental design matrix for the optimization of the dilute acid
pretreatment of K. alvarezii.
93
Table 4.10: Experimental design matrix for the optimization of the dilute acid
pretreatment of G. manilaensis.
94
Table 4.11: Sequential model sum of squares for reducing sugars yield in K.
alvarezii.
95

xvii
Table 4.12: Sequential model sum of squares for reducing sugars yield in G.
manilaensis.
95
Table 4.13: Lack of fit tests for reducing sugars yield in K. alvarezii.
96
Table 4.14: Lack of fit tests for reducing sugars yield in G. manilaensis.
96
Table 4.15: Model Summary Statistics for reducing sugar in K. alvarezii.
97
Table 4.16: Model Summary Statistics for reducing sugar in G. manilaensis.
97
Table 4.17: Model coefficient estimated by regression for reducing sugar
yield in K. alvarezii.
98
Table 4.18: Model coefficient estimated by regression for reducing sugar
yield in G. manilaensis.
98
Table 4.19: Predicted and experimental sugar yield % DW at optimum
condition in K. alvarezii.
104
Table 4.20: Predicted and experimental sugar yield % DW at optimum
condition in G. manilaensis.
104
Table 5.1: Comparison of reported total carbohydrate content in seaweed
species with the present study.
107
Table 5.2: Solvents and their corresponding vapour volume in injector
temperature 250 °C; pressure 20 psi.
122
xviii
LIST OF SYMBOLS AND ABBREVIATIONS
% : Percent
°C : Degree Celsius
µL : Microliter
µm : micrometre
ANOVA : Analysis of variance
AOAC : Association of Official Analytical Chemists
CBP : Consolidated Bioprocessing
CCD : Central Composite Design
Chl : Chlorophyta
Conc : Concentration
CV : Coefficient of variation
DNS : 3, 5-dinitrosalycylic acid
DW : Dry Weight
EtOH : Ethanol
FAO : Food and Agriculture Organization
Fin R. Sugar : Final Reducing Sugar
FPU : Filter Paper Unit
FW : Fresh Weight
g : Gram
GC : Gas Chromatography
GC-FID : Gas Chromatography- Flame Ionization Detector
h : Hour
5-HMF : 5- hydroxyl methyl furfural
HPLC-PDA : High Performance Liquid Chromatography- Photo Diode Array
xix
Hyd : Hydrolysate
Ini R. Sugar : Initial Reducing Sugar
IS : Internal Standard
g L-1 : Gram per Litre
kg : Kilogram
kg m−2 year−1 : Kilogram per square meter per year
L : Litre
L. ha−1. year−1 : Litre per hectare per year
m : Meter
M : Molar
mm : Millimetre
min : Minute
mg : Milligram
mg L-1 : Milligram per Litre
mg g-1 : Milligram per Gram
mL : Millilitre
mMol : Milli Mole
MTBE : Methyl tert-butyl ether
N.A. : Not Available
N/D : Not detected
nL : Nano litre
ns : Not Significant
NSSF : Non-isothermal Simultaneous Saccharification and Fermentation
pAm : Pico Ampere Meter
Phy : Phaeophyta
ppm : Part per million

xx
R2 : Coefficient of determination
Rhd : Rhodophyta
rpm : Round per minute
RS : Reducing Sugars
RSM : Response Surface Methodology
S.A. : Sulphuric Acid
SD : Standard Deviation
SHF : Separate Enzymatic Hydrolysis and Fermentation
SSCF : Simultaneous Saccharification and Co-fermentation
SSF : Simultaneous Saccharification and Fermentation
temp : Temperature
TFA : Trifluoroacetic acid
TPC : Total phenolic compounds
UV : Ultra violet
Vol : Volume
v v-1 : Volume per volume
w v-1 : Weight per Volume
w w-1 : Weight per Weight
xxi
LIST OF APPENDICES
APPENDIX A: Neutral sugar analysis by GC (hydrolysis and derivatization) according
(Melton & Smith, 2001) ................................................................................................ 150
APPENDIX B: HPLC chromatogram of 5-HMF and Furfural .................................... 153
APPENDIX C: Preparing solutions for Folin–Ciocalteu (Lee et al., 2004; Singleton,
Orthofer & Lamuela-Raventos, 1999). ......................................................................... 154
APPENDIX D: Normality test of dilute acid saccharification of K. alvarezii based on
skewness and kurtosis. Descriptive table and boxplots of reducing sugar yield distribution
....................................................................................................................................... 155
APPENDIX E: Normality test of dilute acid saccharification of G. manilaensis based on
skewness and kurtosis. Descriptive table and boxplots of reducing sugar yield distribution
....................................................................................................................................... 156
APPENDIX F: Summary of factorial analysis of variance (ANOVA) for dilute acid
treatment of K. alvarezii. ............................................................................................... 157
APPENDIX G: Mean comparison between temperature levels for reducing sugar yield in
K. alvarezii using LSD test ........................................................................................... 158
APPENDIX H: Mean comparison between incubating time levels for reducing sugar
yield in K. alvarezii using LSD test .............................................................................. 159
APPENDIX I: Mean comparison between acid concentration levels for reducing sugar
yield in K. alvarezii using LSD test .............................................................................. 160
APPENDIX J: Summary of factorial analysis of variance (ANOVA) for dilute acid
treatment of G. manilaensis .......................................................................................... 161
APPENDIX K: Mean comparison between temperature levels for reducing sugar yield in
G. manilaensis using LSD test ...................................................................................... 162
APPENDIX L: Mean comparison between incubating time levels for reducing sugar yield
in G. manilaensis using LSD test .................................................................................. 163
APPENDIX M: Mean comparison between acid concentrations levels for reducing sugar
yield in G. manilaensis using LSD test ......................................................................... 164
APPENDIX N: Gas chromatograph of some standard solvents ................................... 165
APPENDIX O: Standard curves plotted with and without sample preparation method.
Figure above is plotted with (Lower figure) and without (above figure) applying solvent
mixture method and IS. ................................................................................................. 166

1
CHAPTER 1: INTRODUCTION
The marine macroalgae, also known as seaweeds, can be categorized generally as the
green algae (Chlorophyta), brown algae (Phaeophyta) and red algae (Rhodophyta).
Seaweeds are the main resource materials for phycocolloids such as agar, carrageenan
(derived from Rhodophyta) and alginates (derived from Phaeophyta) (Abbott, 1982). The
residues from such processing also represent a renewable source of energy (Ross et al.,
2008).
Seaweeds have a wide spectrum of advantages to being used as a feedstock for biofuel
production. Seaweeds are capable of producing high yields of material when compared
to even the most productive land-based plants. Kelp forests in shallow sub-tidal regions
are amongst the most productive communities on earth, generating large amounts of
organic carbon. In Nova Scotia, laminarian beds produce 1.75 kg organic carbon m−2
year−1, but an average of 1.0 kg organic carbon m−2 year−1 is more typical of kelp beds in
general (Sze, 1993). When considering the dry weight generated, production figures
between 3.3 and 11.1 kg m−2 year−1 for non-cultured macroalgae are cited (Gao &
McKinley, 1994). This is due to this fact that seaweeds have higher photosynthetic
activity (6 – 8 %) than terrestrial biomass (1.8 – 2.2 %). This also leading to the increased
CO2 absorption by seaweeds (Aresta et al., 2005).
The issues arising with increasing the proportion of land used for biofuel crops and the
“food versus fuels” debate are not applicable to the seaweeds (Adams et al., 2009)
because the algal feedstock can be cultivated on otherwise non-productive land that is
unsuitable for agriculture or in brackish, saline, and waste-water that has little-competing
demands. Using algae to produce feedstock for biofuel production could have little impact
on the production of food and other products derived from terrestrial crops, unlike the use
of corn or sugar-cane (Searchinger et al., 2008; Hughes et al., 2012).
2
Algae have the potential to reduce the generation of greenhouse gases (GHG) and to
recycle CO2 emissions from flue gases from power plants and natural gas operations as
indicated by preliminary life cycle assessments (Darzins et al., 2010). Also, algae remain
exempt from the negativity associated with terrestrial biomass resources, which is said to
be responsible for higher food prices and which impacts water sources, biodiversity, and
rainforests (Chynoweth, 2005). Another advantage of using seaweed is the low lignin
content which improves the enzymatic hydrolysis of cellulose. Being immersed in water,
the seaweeds do not require the support from lignified tissue and are able to absorb
nutrients through the entire surface of the thallus. This saving of energy results in many
seaweeds having higher biomass productivity (13.1 kg DW m-2 over 7 months) than land
plants (0.5 – 4.4 kg DW m-2 year-1) (Lewandowski et al., 2003).
A diversity of useful products including food, feed, medicine and industrial materials
can be produced from the seaweeds. The Phaeophyta and Rhodophyta are economically
more important because they contribute 66.5 % of annual production of 4 million tones
globally, of which 2.6 million tones are brown and 33 % are red seaweeds (Sahoo, 2002).
The phycocolloids, comprise alginate which is produced from the brown seaweeds, and
agar and carrageenan that are sourced from the red seaweeds.
The most important component of the seaweeds with regards to the production of
bioethanol is the carbohydrate, which also plays an important role in the metabolism of
the seaweeds, as it supplies the energy needed for respiration and other important
processes (Bramarambica et al. 2014). Green algae accumulate cellulose as the cell wall
carbohydrate, which can be used for ethanol production after enzymatic hydrolysis using
cellulase (Dibenedetto, 2011). The resultant sugars are then fermented to bioethanol. The
red and brown seaweeds produce different forms of carbohydrate which may or may not
be easily converted to sugar through saccharification.
3
Presently, food crops like sugar-cane and corn are used as feedstocks for bioethanol
production (Karimi & Chisti, 2015). According to Adams et al. (2009), by considering
average world yield of different crops, sugar-cane as the most productive terrestrial crop
can produce 6756 (L ha−1. year−1) bioethanol, whereas this yield interestingly could reach
23,400 (L ha−1 year−1) for the seaweeds. Use of seaweeds as feedstocks will not compete
with their use as food, and there will be no conflicts with other land uses such as urban
development or other agricultural and industrial usage.
Malaysia is rich in marine algal resources (Phang et al., 2007) including species
belonging to the Chlorophyta and Rhodophyta which contain biomaterial suitable for
bioconversion into biofuel (Phang, 2006). While there have been reports of bioethanol
production from tropical seaweeds (Khambhaty et al., 2012; Kumar et al., 2013, Meinita
et al.2013; Mutripah et al., 2014), the potential of using indigenous Malaysian seaweeds
has not been explored.
Malaysia has a steadily expanding seaweed industry based mainly on the
carrageenophytes Eucheuma and Kappaphycus. There are many other tropical seaweeds
that may be commercialised if shown to be a good feedstock for bioethanol production.
The search for suitable tropical seaweeds has started, and the work carried out in this
thesis is to answer the question of whether local seaweed species abundantly found in
Malaysia can serve as competitive feedstocks for bioethanol production.
The objective of this project was to obtain the profiles of common seaweed species in
Malaysia for selection of potential species for production of bioethanol. Optimization of
saccharification was conducted, followed by fermentation.

4
This was achieved through the following sub-objectives.
i) To collect and analyse the carbohydrate and sugar content of Malaysian seaweeds.
ii) To select two seaweeds with the potential to serve as feedstock for bioethanol
production based on high carbohydrate content and type of sugar.
iii) To optimize the saccharification process for selected seaweed.
iv) To produce ethanol from selected seaweeds.
Research outputs
This research generated the following outputs.
i) List of Malaysian seaweed species and their profiles with respect to carbohydrate
and sugar contents.
ii) List of Malaysian seaweeds that meet the requirements for bioethanol production.
iii) A protocol for saccharification of the seaweed carbohydrates.
iv) The potential bioethanol yield from selected seaweeds.
Figure 1.1 shows the research approach.
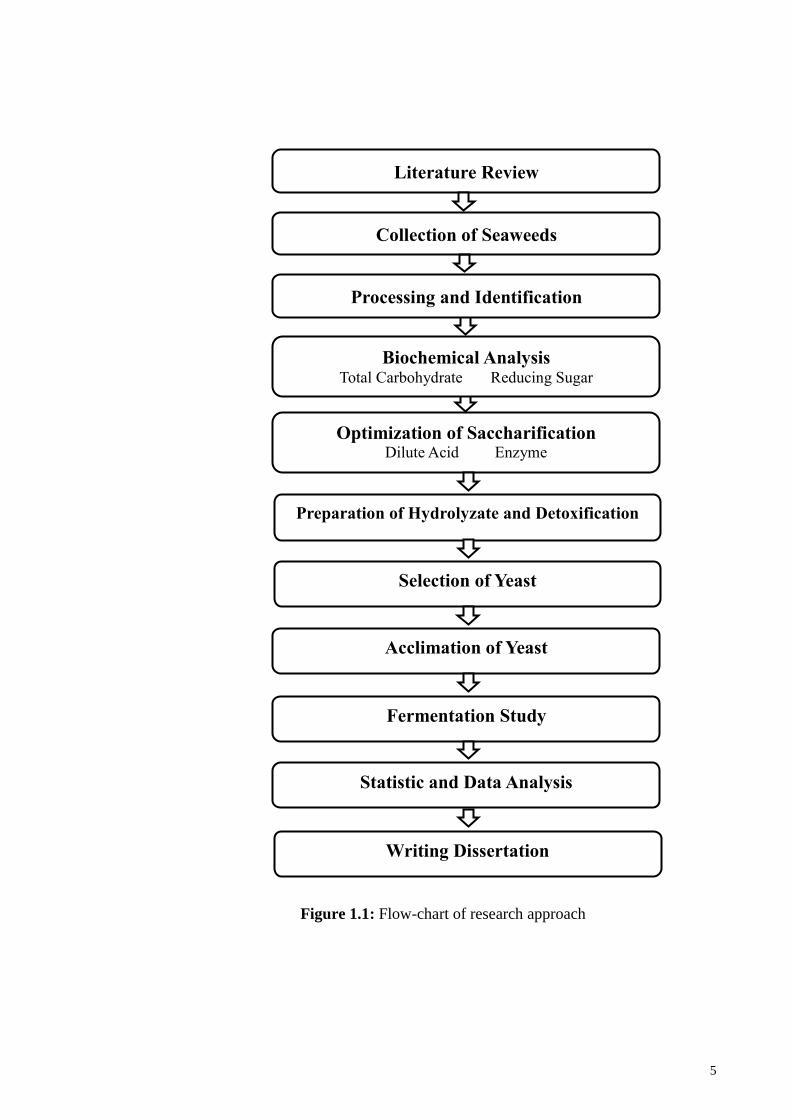
5
Figure 1.1: Flow-chart of research approach
Literature Review
Collection of Seaweeds
Processing and Identification
Biochemical Analysis
Total Carbohydrate Reducing Sugar
Optimization of Saccharification
Dilute Acid Enzyme
Selection of Yeast
Acclimation of Yeast
Preparation of Hydrolyzate and Detoxification
Fermentation Study
Statistic and Data Analysis
Writing Dissertation
6
CHAPTER 2: LITERATURE REVIEW
2.1 Renewable energy and biomass
Concerns over depletion of fossil fuel resources, fuel security, global warming and
increasing fuel price have generated great attention towards finding alternative sources of
energy to ensure the current rate of development. Renewable energy sources are essential
contributors to the energy supply portfolios that contribute to world energy supply
security. The advantages of renewables are well known, as far as they enhance diversity
in energy supply markets; secure long-term sustainable energy supplies; reduce local and
global atmospheric emissions; create new employment opportunities offering possibilities
for local manufacturing and enhance security of supply since they do not require imports
that characterize the supply of fossil fuels (Goldemberg & Coelho, 2004). Biomass,
hydro, geothermal, wind, solar and tide are the most known types of renewable energy.
Biomass, currently contributes 10 – 12 % of gross worldwide energy, due to geographical,
economic, and climatic differences, the share of biomass energy in relation to total
consumption differs widely among different countries, ranging from less than 1 % in
some industrialized countries like the United Kingdom and The Netherlands to
significantly more than 50 % in some developing countries in Africa and Asia
(Kaltschmitt et al., 2002). Biomass is a well-established source (80 % of total renewable
energy production) of renewable energy; however, hydropower may have a higher
potential than biomass (Resch et al., 2008).
It is well understood that bioenergy has been used since the humans discovered how
to use biomass for making fire. Biomass was the main source of energy until fossil fuels
were discovered during the industrial revolution (Quaschning, 2010). Evidence of ethanol
production (winemaking) gathered from residues found in the Middle East was dated back
to 6,000 years ago (Berkowitz, 1996). The technology of ethanol production has
progressed greatly, and it may readily be applied. Nevertheless, improvement in process
7
efficiency and search for cheaper and sugar-rich sources still continue (Knothe, 2010).
The idea of using algae for industrial fuel production is over 60 years old (Borowitzka,
2008). At the beginning, biofuel was produced from land-crops such as corn, sugarcane,
wheat or potato. The major issue with these first generation biofuel is competition with
their use as food, although the process may be economic and environmentally friendly.
The second generation biofuels were developed using mainly non-food feedstock such as
grass, forest residues or lignocellulosic materials. The technology for industrial
production of the second generation biofuel is still under development, especially with
regards to reduction in the cost of production (Naik et al., 2010). The third generation
biofuels are derived from marine biomass, mainly from seaweeds and micro-algae (Wei
et al., 2013).
2.1.1 What are seaweeds?
The algae can be divided by size into two groups: macro-algae commonly known as
‘seaweed’ and micro-algae, microscopic single cell organisms ranging in size from a few
micrometres to a few hundred micrometre (µm) (Sheehan et al., 1998). The term micro-
algae is often used to include the prokaryotic cyanobacteria (blue-green algae), although
these are no longer classified as algae, together with the eukaryotic microalgae such as
diatoms and green algae (Mata et al., 2010).
Seaweeds can be classified according to their characteristics into four groups.
Dissimilar to unicellular microalgae, the seaweeds are multicellular and have more plant-
like structures. They generally comprise very specific structures such as holdfast, frond
and the stipe (Figure 2.1).
8
Figure 2.1: Various forms of the seaweeds. Redrawn from:U. lactuca (Balzert, 1999); S. flavicans & L. saccharina (http://www.fao.org/docrep/006/y4765e/y4765e07.htm)
Even though seaweeds are restricted to the tidal zones and benthic photic zones, they
contribute to about 10 % of the total world marine productivity (Israel et al., 2010).
Ecologically, they provide food, shelter and nursery grounds for marine life, and are also
involved in nutrient cycling (Phang et al., 2010).
2.1.2 Algae and the environment
During algal growth and photosynthesis, they remove CO2 from the atmosphere. This
gas is released again when their biomass is consumed in the various ways. However algae
may provide a carbon-neutral or even a carbon reducing system if appropriate steps are
taken, for example if the biomass is used to replace fossil fuel which consumes more
energy in its production. In addition, algal residues after extraction of biofuel precursors,
could be put to good use as mineral-rich fertilizer (Israel et al., 2010). Seaweeds play
5 cm
5 cm 30 cm
Ulva lactuca Sargassum flavicans Laminaria saccharina
9
significant roles in the normal functioning of atmospheric environments. Globally
changing environments on earth is more likely to severely modify the current equilibrated
terrestrial and marine ecosystems (Pinto, 2013). Specifically for the marine environment,
global changes will include increased carbon dioxide which will acidify the aqueous
media. It has been estimated that for CO2, the change might be from the current 350 ppm
to approximately 750 ppm within 50 years, or so. Such a difference will cause higher
average seawater temperatures (within 1 – 3 °C) and higher UV radiation on the water
surface. These changes will affect seaweeds at different levels, namely molecular,
biochemical, and population levels. While predictions of altered environments have been
studied extensively for terrestrial ecosystems, comparatively much less effort has been
devoted to the marine habitat. Seaweeds may also contribute significantly to pollutant
reduction (heavy metals, and excessive nutrients disposed of into the marine
environments) (Israel et al., 2010).
2.2 Algae and biofuel
According to predictions, demand for sustainable biofuels will increase but the
consumption of first generation biofuels in order to meet this goal, may result in negative
environmental impacts.
Third-generation biofuels are recommended as a good solution.as they can be
cultivated on marginal or non-agronomical area, can use brackish water and seawater and
may be more productive than former biofuel generations.
The current seaweed industry is 100 times bigger than the micro-algal industry. In
2012, 54 % of the world’s seaweed produced in China which was accounted for over 12.8
million wet tonnes of the annual world production (Roesijad et al., 2010; FAO, 2014).
10
Seaweed cultivation for bioethanol and biogas is being explored in Asia, Europe and
South America, while bio-butanol from macro-algae is attracting research interest and
investment in the USA.
2.2.1 Production of energy from biomass
Seaweed can be used to produce energy in various ways which can be direct
combustion, pyrolysis, gasification, liquefaction, bioethanol and biomethane.
2.2.1.1 Direct combustion
Currently, direct combustion is the main method by which biomass is used to produce
energy (Demirbaş, 2001). Many industries devote a considerable amount of energy to the
production of steam, with the pulp and paper industry using 81 % of its total energy
consumption for this purpose (Saidur et al., 2011). The co-combustion of biomass with
coal-fired plants is an attractive way to use biomass (Demirbaş, 2001; Saidur et al., 2011).
The co-generation of heat and electricity can significantly improve the economics of
biomass combustion, but requires that there is a local demand for heat (Demirbaş, 2001).
It should be noted that in case of macroalgal biomass, the moisture content can reduce
the heat production compared to dry biomass by 20 % (Demirbaş, 2001) and the direct
combustion of biomass is feasible only for biomass with a moisture content of less than
50 % (McKinney, 2004; Varfolomeev & Wasserman, 2011). Also as seaweeds have a
high amount of ash content, this also must be a considerable problem in the direct
combustion of biomass due to fouling of the boilers restricting the use of high ash content
biomass (Demirbaş, 2001).

11
2.2.1.2 Pyrolysis (bio-oil)
The using of bio-oil goes back to the time when the Egyptians discovered the way to
produce tars by applying the pyrolysis of wood (Demirbaş, 2001). Fast and slow pyrolysis
are two type of hydrolysis but fast pyrolysis is of the most promising thermochemical
processes which produces a solid and volatile products. The products proportion is
influenced by feedstock properties and operation parameters (Briens et al., 2008). Fast
pyrolysis is capable of achieving greater liquid product and gas yields of around 70 % –
80 %, compared to 15 % – 65 % achieved through slow pyrolysis (Varfolomeev &
Wasserman, 2011). To obtain high yields of valuable liquid products or bio-oil, the
biomass particles must be rapidly heated and the residence time of volatile products must
be short (Briens et al., 2008).
Various investigations have been conducted on producing bio-oil from lignocellulosic
biomass such as sawdust, rice straw, corn cob straw and oreganum stalks, cherry and
grape seeds, switch grass, etc. (Yanik et al., 2013). Besides lignocellulosic biomass, some
articles have been published on the feasibility of bio-oil production from macroalgal
biomass (Miao & Wu, 2004; Wang et al., 2013b; Bermúdez et al., 2014). It is reported
that, overall efficiency of the pyrolysis of seaweed is lower than that derived from
lignocellulosic materials due to presence of high ash and also metal ions content in the
seaweeds (Yanik et al., 2013). Bio-oil has the potential to be transported and stored and
generate more energy in comparison with char and syngas (Jena & Das, 2011). This
makes bio-oil more interesting biofuel than char and syngas.
2.2.1.3 Gasification
During the gasification process which is carried out under high temperature (800 -
1000 °C), organic matter is converted to a combustible gas mixture which contains carbon
12
monoxide (20 - 30 %), hydrogen (30 - 40 %), methane (10 - 15 %), ethylene (1 %),
nitrogen and water vapour. This gas mixture which is known as syngas has a calorific
value of 4 - 6 M J m-3 ( Demirbaş, 2001; McKendry, 2002; Saidur et al., 2011). Syngas
can be combusted to generate heat or electricity in the combined gas turbine systems that
can produce an electric energy yield of 50 % of the heating value of the incoming gas. In
this process, dry biomass is required to be utilized (Guan et al., 2012), but for some
biomass feedstock which contain high moisture, such as seaweed, supercritical water
gasification (SCWG) can be employed. Moreover, the produced syngas can be converted
to hydrogen or methanol that can be utilized in transportation (McKendry, 2002; Saidur
et al., 2011).
Increasing temperature from 302 to 652 °C, yield of the syngas increase, in agreement
with a recent model of the kinetics of supercritical water gasification that indicates that
higher temperatures favour generation of intermediates which are more easily gasified
together with the production of gas at the expense of char (McKendry, 2002; Saidur et
al., 2011).
2.2.1.4 Liquefaction
Liquefaction is a low-temperature high-pressure process where biomass is converted
into a stable liquid hydrocarbon fuel (bio-oil) in the presence of a catalyst and hydrogen.
In the presence of a catalyst, at the high temperature and wet environment, biomass is
converted to hydrocarbons which is partially oxygenated (Demirbaş, 2001; McKendry,
2002). It is now shown that liquefaction treatment is not attractive in terms of industrial
views, due to its feed system complexity and also higher costs than other processes
(Demirbaş, 2001; McKendry, 2002). However this procedure has the advantage of the
13
conversion being carried out in an aqueous condition; therefore a prior drying process is
not necessary (Minowa et al., 1995; Brown et al., 2010).
2.2.1.5 Biomethane
Biomethane fermentation is considered as a highly complex process which is
partitioned into four stages: hydrolysis, acidogenesis, acetogenesis and methanogenesis,
where in each stage, different groups of microorganisms are involved (Angelidaki et al.,
1993). Hydrolysing and fermenting microorganisms excrete enzymes to attack the
polymers to generate simpler compounds such as hydrogen, acetate and also volatile fatty
acids such as butyrate and propionate. Most of the microorganisms in this stage are strict
anaerobes such as Bifidobacteria, Clostridia and Bacteriocides. However some
facultative anaerobes also take part in this stage, including Enterobacteriaceae and
Streptococcus. During the third stage, the obligate acetogenic bacteria convert the higher
volatile fatty acids into hydrogen and acetates (Bagi et al., 2007), and at the end,
methanogenic bacteria produce methane from acetate or hydrogen and carbon dioxide
(Schink, 1997).
In the industrial point of view, producing biomethane from wet biomass such as
seaweeds is highly attractive. A great amount of articles have been published on the
biogas production by different sources of organic materials as well as some of the recent
researches on evaluating biofuel from seaweed biomass (Golueke et al., 1957; Weiland,
2010; Hughes et al., 2012; Vanegas & Bartlett, 2013; Marquez et al., 2014; Vanegas et
al., 2015; Montingelli et al., 2016; Tabassum et al., 2016).
Seaweeds have been successfully digested to produce biogas at a low concentrations
(< 1% DW), however a process that can allow for use of higher biomass concentrations

14
are more attractive and profitable (Oswald, 1988). Another advantage of anaerobic
digestion can be the reuse of residual nutrients to enrich the seaweed farm systems (Singh
& Olsen, 2011). The yield of biomethane from seaweeds have been reported between
0.09 to 0.34 cubic meters kg-1 of VS (Zamalloa et al., 2011; González‐Fernández et al.,
2012).
2.2.1.6 Bioethanol
Ethanol fermentation is a biological process in which reducing sugars are converted
by microorganisms to ethanol and CO2 (Lin & Tanaka, 2006). Bioethanol can be extracted
from a variety of feedstocks that possess fermentable sugars generally in a mixture of
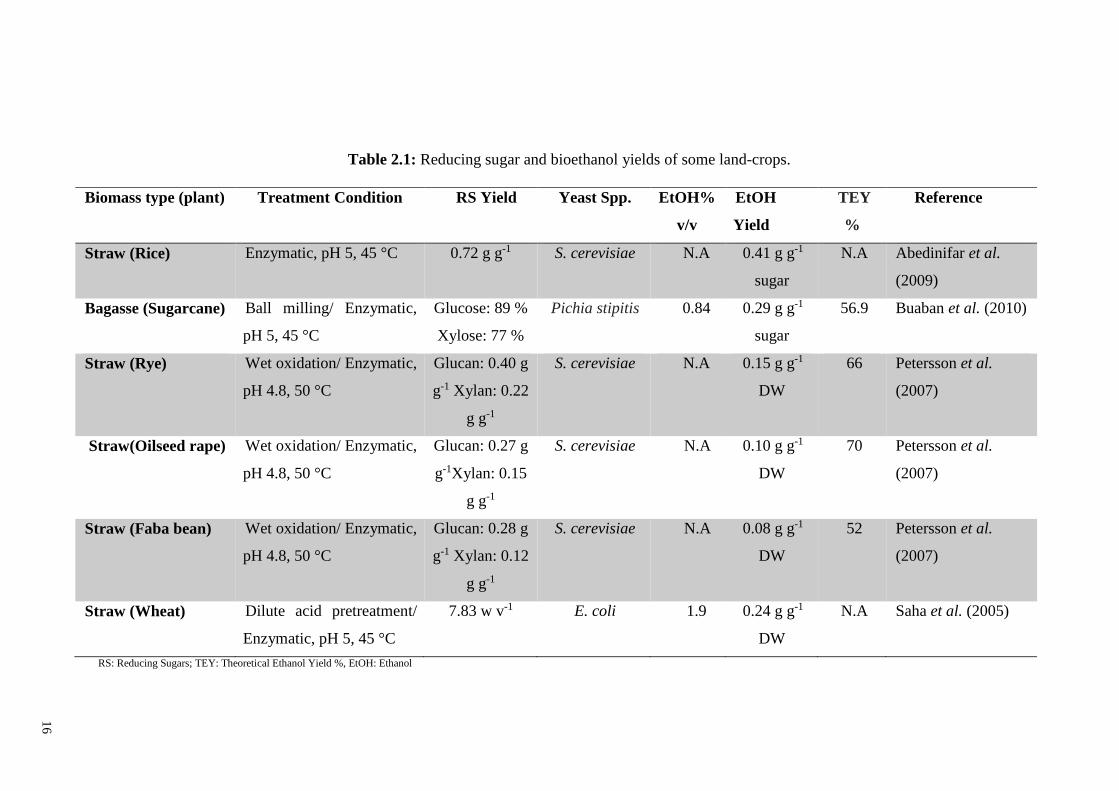
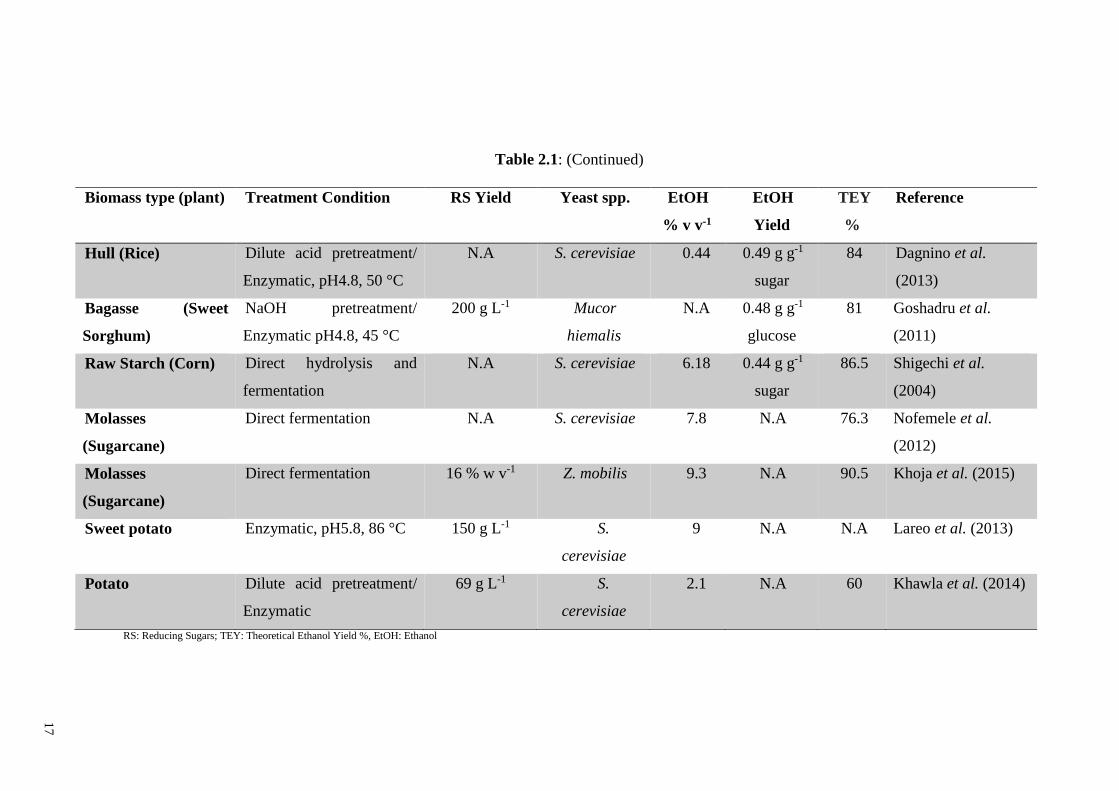
polysaccharides and free sugars. Table 2.1 gives a summary of studies on ethanol
production from various feedstocks.
The microorganisms used for ethanol production are divided into three categories
which are mold (mycelium), bacteria (Zymomonas spp.) and most commonly, yeast
(Saccharomyces spp.). These microorganisms that are isolated from the natural
environment are highly selective in their substrates, metabolism and other fermentation
characteristics. Some of these microorganisms can be very dependent on hexoses such as
glucose and galactose or pentose such as xylose or sometimes mixtures of hexose and
pentose sugars (Naik et al., 2010).
Presently all vehicles, without adjusting the engine, can be run on a mixture of 10 %
ethanol and 90 % gasoline. With more progress in engine technology, even consumption
of higher ethanol content in fuel can become feasible. Some engines can run on 100 %
ethanol whereas there are flexible-fuel cars that are capable of utilizing 85 % ethanol
(E85). Diesel can also be replaced by ethanol provided that emulsifiers are used to
15
enhance diesel and ethanol mixing (Galbe & Zacchi, 2002). Ethanol is blended with
gasoline due to its high octane number leading to increased octane number of the mixture.
This would reduce the need of MTBE, the main octane enhancing additive which is
considered as a carcinogenic compound. Use of ethanol can lead to reduction of carbon
monoxide and other hazardous hydrocarbons as it provides oxygen for the gasoline
mixture (Galbe & Zacchi, 2002). Replacement of compression-ignition and spark-
ignition engines for the use of higher content of ethanol (E85), was summarized by Baily
(1996). He concluded that in compression-ignition engines, ethanol possesses almost the
same overall transport efficiency compared to diesel (Bailey 1996). Therefore, although
ethanol possesses only about two-thirds of the energy content of gasoline, it will still be
possible to run 75 – 80 % of the distance on the same amount of ethanol (Wyman 1996).
16
Table 2.1: Reducing sugar and bioethanol yields of some land-crops.
Biomass type (plant) Treatment Condition RS Yield Yeast Spp. EtOH%
v/v
EtOH
Yield
TEY
%
Reference
Straw (Rice) Enzymatic, pH 5, 45 °C 0.72 g g-1 S. cerevisiae N.A 0.41 g g-1
sugar
N.A Abedinifar et al.
(2009)
Bagasse (Sugarcane) Ball milling/ Enzymatic,
pH 5, 45 °C
Glucose: 89 %
Xylose: 77 %
Pichia stipitis 0.84 0.29 g g-1
sugar
56.9 Buaban et al. (2010)
Straw (Rye) Wet oxidation/ Enzymatic,
pH 4.8, 50 °C
Glucan: 0.40 g
g-1 Xylan: 0.22
g g-1
S. cerevisiae N.A 0.15 g g-1
DW
66 Petersson et al.
(2007)
Straw(Oilseed rape) Wet oxidation/ Enzymatic,
pH 4.8, 50 °C
Glucan: 0.27 g
g-1Xylan: 0.15
g g-1
S. cerevisiae N.A 0.10 g g-1
DW
70 Petersson et al.
(2007)
Straw (Faba bean) Wet oxidation/ Enzymatic,
pH 4.8, 50 °C
Glucan: 0.28 g
g-1 Xylan: 0.12
g g-1
S. cerevisiae N.A 0.08 g g-1
DW
52 Petersson et al.
(2007)
Straw (Wheat) Dilute acid pretreatment/
Enzymatic, pH 5, 45 °C
7.83 w v-1 E. coli 1.9 0.24 g g-1
DW
N.A Saha et al. (2005)
RS: Reducing Sugars; TEY: Theoretical Ethanol Yield %, EtOH: Ethanol
16
17
Table 2.1: (Continued)
Biomass type (plant) Treatment Condition RS Yield Yeast spp. EtOH
% v v-1
EtOH
Yield
TEY
%
Reference
Hull (Rice) Dilute acid pretreatment/
Enzymatic, pH4.8, 50 °C
N.A S. cerevisiae 0.44 0.49 g g-1
sugar
84 Dagnino et al.
(2013)
Bagasse (Sweet
Sorghum)
NaOH pretreatment/
Enzymatic pH4.8, 45 °C
200 g L-1 Mucor
hiemalis
N.A 0.48 g g-1
glucose
81 Goshadru et al.
(2011)
Raw Starch (Corn) Direct hydrolysis and
fermentation
N.A S. cerevisiae 6.18 0.44 g g-1
sugar
86.5 Shigechi et al.
(2004)
Molasses
(Sugarcane)
Direct fermentation N.A S. cerevisiae 7.8 N.A 76.3 Nofemele et al.
(2012)
Molasses
(Sugarcane)
Direct fermentation 16 % w v-1 Z. mobilis 9.3 N.A 90.5 Khoja et al. (2015)
Sweet potato Enzymatic, pH5.8, 86 °C 150 g L-1 S.
cerevisiae
9 N.A N.A Lareo et al. (2013)
Potato Dilute acid pretreatment/
Enzymatic
69 g L-1 S.
cerevisiae
2.1 N.A 60 Khawla et al. (2014)
RS: Reducing Sugars; TEY: Theoretical Ethanol Yield %, EtOH: Ethanol
17
18
Currently, bioethanol derived from sugarcane in Brazil is the only economically
feasible biofuel that shows a significant net energy gain (Walker, 2010). By utilizing
sugarcane as bioethanol feedstock, a huge amount of bagasse are produced. This can be
combusted to generate heat for distillation of bioethanol, although this process has led to
some environmental concerns and it is suggested that it may be more beneficial to
enzymatically convert bagasse to bioethanol rather than burn it (Gressel, 2008).
Providing that the bioethanol fermentation technology can be economically feasible,
with the huge amounts of feedstock available globally, it is estimated that by converting
crop residues and wastes to bioethanol, about 380 million metric tonnes equal to 16 times
higher than the current worldwide production of bioethanol can be produced (Balat et al.,
2008).
One of the technical obstacles in industrial conversion of crop waste into bioethanol is
presence of lignin and hemicellulose and also crystallinity of cellulose which reduce the
yield of saccharification (Gressel, 2008). Seaweeds contain very low amounts of lignin
and hemicellulose, thus it is more amenable for enzymatic conversion to reducing sugars.
2.3 Use of seaweed biomass as feedstock for bioethanol production
Seaweeds are generally grouped into the green, red and brown seaweeds, which
contain a diversity of carbohydrates, which exhibit different degrees of ease in
saccharification, and also produce different sugars. All these influence the use of different
species of seaweeds for bioethanol production, and process optimisation may have to be
species-specific.
There are various methods for processing the seaweed biomass prior to fermentation.
The biomass must be harvested and processed according to protocols to ensure that the

19
quality of the carbohydrate has not been reduced. The biomass has to undergo a series of
processes including saccharification, fermentation, distillation and recovery and residue
processing.
2.3.1 Saccharification of seaweed biomass
The carbohydrate polymers in the seaweed biomass need to be digested to monomers
before the fermentation process through a process called saccharification. Various
approaches are available for biomass saccharification but the most well-known methods
are grouped into enzymatic and chemical hydrolysis (Taherzadeh & Karimi, 2007a). In
addition, there are other hydrolysis methods in which no chemicals or enzymes are
applied. For instance, lignocelluloses may be hydrolysed by gamma-ray or electron-beam
irradiation or microwave irradiation. However, these processes are far from being
commercially applied (Taherzadeh & Karimi, 2007a). Other saccharification approaches
beside enzymatic or chemical treatments include electron-beam irradiation, gamma-ray
microwave, that still require further development for commercial application
(Taherzadeh, 1999). Seaweed carbohydrate is very different from land-crop biomass
which have high carbohydrate content and ease of hydrolysis to fermentable sugars (Kim
et al., 2015).
Seaweeds contain unique carbohydrate compositions. Besides starch, cellulose, agar,
carrageenan, alginate, they may also contain mannitol and laminarin, making them
distinctively different from terrestrial biomass. Thus, it is important to apply appropriate
methods to seaweed biomass and to select appropriate microorganisms that are pivotal
for successful bioethanol fermentation (Tan & Lee, 2014). Table 2.3 illustrates a
comparison of various chemical saccharification procedures and fermentation strategies
with different microorganisms used to produce ethanol from different seaweed species.
20
2.3.1.1 Chemical hydrolysis
Hydrolysis includes breaking the carbohydrate polymer and randomly cleaves the
constituents in the material to monomers. Cellulose breaks to glucose, hemicellulose
gives some different hexoses and pentose sugars such as xylose, arabinose and glucose
(Taherzadeh & Karimi, 2007a).
Acid hydrolysis of plant lignocellulosic biomass has been known since 1819.
Examples are the modified Bergius process (40 % HCl) operated during World War II in
Germany, and the more recently modified Scholler processes (0.4 % H2SO4) in the former
Soviet Union, Japan and Brazil (Galbe, 2002).
however other acids such as hydrochloric acid also have been well applied (Wright &
Power, 1986; Hashem & Rashad, 1993). Acid hydrolysis is mostly carried out by two
methods, a) dilute-acid hydrolysis b) concentrated acid hydrolysis (Taherzadeh & Karimi,
2007a). A comparison between two methods is illustrated in Table 2.2.
a. Concentrated acid hydrolysis
This process was first discovered by Braconnot in 1819 (Sherrard & Kressman, 1945)
where they found concentrated acid can convert cellulose to glucose. This process is
conducted with a high concentration of acid (30 – 70 %) and at low temperature (30 - 40
°C) with a very high yield of glucose production (90 % of theoretical) therefore more
ethanol yield is achievable in compare with dilute-acid treatment (Taherzadeh & Karimi,
2007a). Beside high yield of this method, use of this method might be extremely
dangerous due to a corrosive attribute of concentrated acid specially once temperature
increases and expensive as specialized acid resistant material must be used in reactors
with high level of safety. Also acid recovery which is highly energy demanding process

21
is another bottleneck of this method (Taherzadeh & Karimi, 2007a) however Van
Groenestijn, Hazewinkel & Bakker (2006) presented a method to use concentrated acid
sulphuric and recover it by biological process and anion-selective membranes. In
biological part, resulted sulphate reduced to sulphide via anaerobic process and sulphide
is recovered as H2S gas and then burned into sulphur dioxide and sulphur trioxide
followed by conversion into sulphuric acid.
Table 2.2: Comparison between two acid hydrolysis approaches (Taherzadeh & Karimi,
2007a). Hydrolysis type Advantages Disadvantages
Concentrated acid process - Conducted at low temperature
- High reducing sugar production
- High acid use
- Risk of equipment corrosion
- High energy use for acid
recovery
- Longer incubating time
Dilute-acid process - Low acid use
- Short incubating time
- High incubating temperature
- Low reducing sugar
production
- Risk of equipment corrosion
i. -Generation of fermentation
inhibitors
b. Dilute-acid hydrolysis
Dilute-acid hydrolysis is the commonly applied chemical hydrolysis and can be used
either as a pre-treatment or as the actual method of hydrolysing biomass to fermentable
sugars (Qureshi & Manderson, 1995). It is reported that the first process was more likely
22
the Scholler process where the condition of 0.5 % sulphuric acid at 11-12 bar pressure for
45 min was applied to convert the lignocellulosic material into sugars (Faith, 1945).
Single stage hydrolysis in batch reactors has been widely applied for the kinetic study of
the hydrolysis of biomass to ethanol production in pilot or laboratory scales (Taherzadeh
& Karimi, 2007a). The main drawback of single stage hydrolysis is degradation of parts
of sugar that release from less resistant polymers into fermentation toxins such as 5-
hydroxymethylfurfural, furfural, formic acid, vanillic acid, phenol, acetic acid,
formaldehyde, etc. (Larsson et al., 1999). It is recommended that dilute-acid hydrolysis
is conducted in more than one stage (generally two stages) to avoid degradation of sugars.
At the first stage, less resistant polymers convert to monosaccharides under a mild
condition, while in second treatment, the residues which are more crystalline (such as
cellulose) undergoes more severe condition (Nguyen et al., 2000). A temperature range
140 - 170 °C can be applied in one stages hydrolysis while the temperature of 120 °C for
a longer time may be used for two stages treatment (Kim et al., 1993). A comparison of
saccharification and fermentation yield using different seaweed species is shown in Table
2.3.
23
Table 2.3: Comparison of chemical saccharification and ethanol yields from different seaweed biomass.
Seaweed spp.
Typ
e
Treatment condition
Agent/ Conc/ time/ temp
Init
ial
Con
c R
S g
L-1
RS
Yie
ld
(g R
S g
-1 s
eaw
eed
)
Microorganism
used
EtO
H C
on
c %
v v
-1
EtO
H Y
ield
(g E
tOH
g -1
RS
)
Fer
men
tati
on
yie
ld %
Reference
Laminaria
hyperborea
Phy S.A/ pH2/ 60min/ 65 °C 20 N.A Pichia angophorae N.A 0.43 84
Horn et al. (2000)
Undaria pinnatifida Phy S.A/ 0.7%/ 60 min/ 121 °C 28.65 N.A Pichia angophorae 0.942 N.A 27 Cho et al. (2013)
Saccharina japonica Phy S.A/0.4% & Saccharification
with Bacillus sp.
45.6 N.A Pichia angophorae,
Pichia stipites, S.
cerevisiae, Pachysolen
tannophilus
0.77 0.33 NA Jang et al. (2012)
Saccharina latissima Phy S.A/ pH=6/ 30 min /23 °C N.A N.A S. cerevisiae 0.45 N.A N.A Adams et al. (2009)
Abbreviation: Chl: Chlorophyta, Rhd: Rhodophyta, Phy: Phaeophyta, RS: Reducing Sugar, EtOH: Ethanol, S.A: Sulphuric Acid, Conc: Concentration, Temp: Temperature, N.A: Not Available
23
24
Table 2.3: Continued
Seaweed spp.
Typ
e
Treatment condition
Agent/ Conc/ time/ temp
Init
ial
Con
c R
S
g L
-1
RS
Yie
ld
(g R
S g
-1 s
eaw
eed
)
Microorganism used
EtO
H c
on
c
% v
v-1
EtO
H Y
ield
(g E
tOH
g-1
RS
)
Fer
men
tati
on
yie
ld %
Reference
Gelidium amansii Rhd S.A/ 2.5%/ 150 °C N.A 0.42 Brettanomyces custersii 2.7 N.A 38 Park et al., (2012)
Gelidium amansii Rhd S.A/ 1% / 60 min/ 121 °C 43.5 N.A Scheffersomyces stipitis 2 N.A 91 Ra et al., (2013)
Kappaphycus
alvarezii
Rhd S.A/ 2%/ 15 min/ 130 °C 4.4 N.A S. cerevisiae 0.16 N.A 66 Meinita et al.,
(2012)
Palmaria palmata Rhd S.A/ 4%/ 25 min/ 125 °C N.A 0.16 S. cerevisiae N.A 0.012 24 Mutripah et al.,
(2014)
Kappaphycus
alvarezii
Rhd S.A/1%/ 5 min/ 140 °C 38.3 0.31 Kluyveromyces marxianus 1.6 0.42 N.A Ra et al. (2016)
Gracilaria corticata
(spent biomass)
Rhd S.A/ 1%/ 15 min / 120 °C N.A 0.13 S. cerevisiae 0.3 0.10 N.A Sudhakar et al.,
(2016)
Abbreviation: Chl: Chlorophyta, Rhd: Rhodophyta, Phy: Phaeophyta, RS: Reducing Sugar, EtOH: Ethanol, S.A: Sulphuric Acid, Conc: Concentration, Temp: Temperature, N.A: Not Available
24
25
2.3.1.2 Enzymatic hydrolysis
Dilute acid hydrolysis is a common method applied to hydrolyse seaweed biomass but
this method has its drawbacks including degradation of sugar to fermentation inhibitors.
A safer method for feedstock hydrolysis is the enzymatic procedure. Enzymes are
naturally found in certain plants and microorganisms that cause a chemical reaction to
breakdown polymers. Cellulose as the most abundant polymer in the plant can be
degraded to its monomer by the enzyme cellulase. To conduct enzymatic hydrolysis, the
enzymes must obtain access to the molecules to be hydrolysed and the crystalline
structure of cellulose must be reduced to increase the access of enzyme to molecules. To
obtain this condition, some kind of physical or chemical pre-treatment process is applied
(Badger, 2002).
Cellulase enzymes are highly specific catalysts which act under mild conditions (e.g.
pH 4.5 - 5.0 and temperature 40 to 50 °C). This allows for low corrosion of equipment,
low energy consumption and also the low toxicity of the hydrolysates (Taherzadeh &
Karimi, 2007b). This process is performed by the synergistic action of at least three major
classes of enzymes: endo-glucanases, exo-glucanases, and ß-glucosidases. These
enzymes are usually called together as cellulase or cellulolytic enzymes. The
endoglucanases create free chain-ends. The sugar chain is degraded by exoglucanases by
removing cellobiose from the chain and ß-glucosidases cleave the cellobiose
disaccharides to glucose (Wyman, 1996).
Trichoderma reesei and T. viride are considered the most investigated and best
characterized microorganisms that produce cellulase. The enzymes extracted from these
species have some advantages including their resistance to inhibitors and stability under
the enzymatic hydrolysis while the disadvantage of Trichoderma extracted cellulase is
26
the low activity of ß-glucosidases. Aspergillus spp. have been found to be very efficient
ß-glucosidase producers ( Wyman, 1996; Taherzadeh & Karimi, 2007b).
Seaweeds have different polysaccharides rather than cellulose and hemicellulose that
are common in terrestrial crops. Hemicellulose is only found in some green seaweeds,
Ulva (Ventura & Castañón, 1998; Ye et al., 2010), Enteromorpha (Ray, 2006) but unique
polysaccharides such as carrageenan, alginate, agar, etc. are found in seaweeds (Sze,
1993; Barsanti & Gualtieri, 2005; Michel et al., 2006). Therefore special enzymes are
required for seaweed enzymatic hydrolysis. Some enzymatic treatments are reviewed in
Table 2.4.
Agar is a valuable phycocolloid extracted from the cell walls of the red seaweeds, and
is composed of 3,6-anhydro-L-galactoses (or L-galactose-6-sulphates) D-galactoses and
L-galactoses (routinely in the forms of 3,6-anhydro-L-galactoses or L-galactose-6-
sulphates) alternately linked by β-(1,4) and α-(1,3) linkages (Chi et al., 2012). The main
sources of agar production are from the Rhodophyceae, including Gelidium, Gracilaria,
and Porphyra spp.
The first bacterium with an agarolytic enzyme was isolated from seawater in the early
20th century (Michel et al., 2006). After that, few microorganisms were found in seawater,
coastal marine sediments or water column and reported to have same attributes (Stanier,
1942). The main marine microorganisms that produce agarolytic enzymes belong to the
Gammaproteobacteria class of the Proteobacteria phylum, including the genera
Pseudomonas, Alteromonas, Pseudoalteromonas, Vibrio, Alterococcus, Microbulbifer,
Agarivorans, Thalassomonas, and Saccharophagus (Michel et al., 2006). Their enzymes
are classified into α-agarase and β-agarase according to the cleavage pattern (Fu & Kim,
2010).

27
Carrageenan is a gel-forming and viscosifying olysaccharides which is extracted from
some species of the class Rhodophyceae, mainly Chondrus, Gigartina, Kappaphycus and
Eucheuma (Necas & Bartosikova, 2013). The main blocks of carrageenan are of D-
galactose and 3,6-anhydro-galactose which are joined by α1→3 and β1→4 linkage. The
average molecular mass of carrageenan is above 100 kDa and ester-sulphate can be
detected in different content (15 - 40 %) in its structure. This sulphated polygalactan is
classified into various types such as λ, κ, ι, ε, μ, which all containing 22 - 35% sulphate
groups. Solubility of these carrageenan types in KCl is the base of this classification.
Three factors of i) position of ester-sulphate ii) number of ester-sulphate groups and iii)
content of 3.6-anhydro galactose are determining the properties of carrageenan types. For
instance, higher levels of ester sulphate leads to lower solubility temperature and lower
gel strength (Barbeyron et al. 2000). This phycocolloid has no nutritional value and it is
applied due to its gelling and emulsifying characteristics in food and pharmaceutical
industries (Van de Velde et al. 2002). In comparison to agar-degrading bacteria, much
fewer microorganisms have been reported to hydrolyse carrageenan. All these bacteria
were isolated in the marine environment and belong to the Gamma proteobacteria,
Flavobacteria, or Sphingobacteria classes.
Alginate was first discovered by E. C. C. Stanford and patented at 12 January 1881.
He believed that alginic acid contained nitrogen and contributed much to the elucidation
of its chemical structure. Later by acid hydrolysis, alginate was digested into three
fractions. Homopolymeric molecules of G (α-L-guluronate) and M (β-D-mannuronate)
were two fractions while another fraction was a mixture (MG). Alginate was described
as being composed of different blocks of G, M and MG respectively (Draget et al., 2005).
Alginate is an unbranched polysaccharide polymer without repeating subunit structures
and can be found widely in brown seaweeds and some bacteria including Azotobacter
vinelandii and Pseudomonas aeruginosa (Hansen et al., 1984). Numerous bacteria are

28
capable of producing alginase, but unlike carrageenase, the majority of them are marine
bacteria which are active in algal decomposing residues (von Riesen, 1980).
29
Table 2.4: Comparison of enzymatic treatments in the saccharification of selected seaweeds
Seaweed spp. Typ
e
Target
polymer
Enzyme/
Enzyme conc
Condition
pH/time/temperatu
re RS
g L
-1
Yield
Reference
Ulva fasciata Chl Cellulose Cellulase / 2 %
(v v-1)
5 / 36 h / 45 °C N.A 0.2 g g-1 SW Trivedi et al. (2013)
Ulva rigida Chl Starch
Cellulose
amyloglucosidase
α-amylase,
cellulase
5/ 48 h / 37 °C N.A 0.19 g g-1 SW Korzen et al. (2015)
Ulva pertusa Chl Cellulose,
starch
Meicelase/ 5g L-1 N.A / 120 h / 50 °C 43 0.82 g g-1
glucan
Yanagisawa et al. (2011)
Alaria crassifolia Phy Cellulose,
starch
Meicelase/ 5 g L-1 N.A / 120 h / 50 °C 67 0.58 g g-1
glucan
Yanagisawa et al. (2011)
Saccharina japonica Phy Starch Termamyl 120 L
(Amylase)
N.A 20.6 0.31 g g-1 CHD Jang et al. (2012)
Nizimuddinia
zanardini
Phy Cellulose Cellulase
b-glucosidase
4.8 / 24 h / 45 °C N.A 0.07 g g-1 SW Yazdani et al. (2011)
Laminaria japonica Phy Cellulose
Cellobiase 55
CBU g-1
Cellulase 45 FPU
g-1
4.8 / 48 h / 50 °C
34 0.24 g g-1 SW Ge et al. (2011)
Abbreviation: Chl: Chlorophyta, Rhd: Rhodophyta, Phy: Phaeophyta, S.A: Sulphuric Acid, Conc: Concentration, Temp: Temperature, N.A: Not Available
29

30
Table 2.4: (continued)
seaweed
Typ
e
Target
polymer
Enzyme/
Enzyme conc
Condition
pH /time /
temperature RS
g L
-1 Yield Reference
Laminaria japonica,
Caulerpa sp.
Phy,
Chl
Alginate Rapidase/
Viscozyme
/ dextrozyme
N.A 8.3 N.A Choi et al., (2009)
Gracilaria salicornia Rhd Cellulose Cellulase/ 0.5 % w
v-1
5/ 30 h / 50 °C N.A 0.013 g g-1 wet
Biomass
Wang et al. (2011)
Gelidium elegans Rhd Cellulose,
starch
Meicelase/ 5g L-1 N.A/ 120 h / 50 °C 49 0.67 g g-1
glucan
Yanagisawa et al. (2011)
Gracilaria verrucosa Rhd Cellulose Cellulase/ 20 FPU
g-1 SW
b-glucosidase 60 U
g-1 SW
5/ N.A / 50 °C
40 0.87 g g-1
cellulose
Kumar et al. (2013)
Kappaphycus alvarezii Rhd Cellulose Cellulase 45 FPU
g
5/ 24 h / 50 °C 90 0.76 g g-1
cellulose
Hargreaves et al., (2013)
Abbreviation: Chl: Chlorophyta, Rhd: Rhodophyta, Phy: Phaeophyta, S.A: Sulphuric Acid, Conc: Concentration, Temp: Temperature, N.A: Not Available
30
31
2.3.2 Fermentation of algal biomass
Generally, ethanol can be produced from any material that contains sugar. Feedstock
utilized in the production of ethanol by fermentation are either sugars, starches or
cellulosic materials. Sugars can be converted to ethanol directly, while starches and
cellulose first have to be hydrolysed to fermentable sugars by the action of enzymes
(Bashir & Lee, 1994).
Ethanol is one of the most significant organic chemicals because of its unique
combination of properties as a solvent, a fuel, a germicide, a beverage, an antifreeze and
as an intermediate in the production of other chemicals. Thus, many processes for ethanol
production have been carried out with a negative energy balance, since the ethanol was
not intended for the fuel market (Horn, 2000).
In the process of ethanol production from seaweed, biomass is saccharified and then
transferred to fermenters. The different sugar composition of seaweeds causes difficulty
in fermentation process by using one or a few strains of microbes in fermentation. Reith
et al., (2005) proposed that the seaweed biomass must be grounded at the first stage to
small pieces and then transferred to saccharification. The saccharified solution
(hydrolyzate) can be concentrated by evaporation if low sugar content was obtained. The
hydrolyzate is then transferred to the fermentation reactors to produce ethanol. The
fermented product is distilled and dehydrated to achieve a concentration of 99.9 % v v-1
which is needed as fuel quality specifications. Also, the residues of fermentation can be
utilized to produce heat and electricity (Roesijad et al., 2010).
Seaweeds of Europe and East Asia have been much investigated for bioethanol
production. In Europe, where brown seaweeds dominate in the cold climate and in East
and South-East Asia, the red seaweeds are abundant. Among brown seaweed species,
Laminaria spp. ( Horn, 2000; Horn et al., 2000; Cui et al., 2002; Lee & Lee, 2010; Adams
32
et al., 2011; Lee & Lee, 2011; Tedesco et al., 2014) Undaria spp. (Yoon et al., 2012; Cho
et al., 2013; Kim et al., 2013), Saccharina spp. (Adams et al., 2009; Jang et al., 2012) are
the most investigated seaweeds in bioethanol production while in red seaweeds the most
interest has been towards Kappaphycus spp. (Khambhaty et al., 2012; Meinita et al.,
2012; Hargreaves et al., 2013; Mody et al., 2015; ), Gelidium spp. (Kim, 2009; Wi et al.,
2009; Jeong et al., 2011; Park et al., 2012; Meinita et al., 2013; Ra et al., 2013; Cho &
Kim, 2014; Kim et al., 2015; ), Gracilaria spp. ( Amanullah et al., 2013; Hyebeen, 2013;
Kumar et al., 2013; Liao et al., 2013; Meinita et al., 2013; Ahmad, 2014; Wu et al., 2014).
2.3.3 Fermentation strategies
Accordance with biomass specification, hydrolysis techniques and also possible
reducing sugar composition, different strategies must be adopted to increase the yield of
bioethanol. Considering saccharification approaches to produce reducing sugar, various
saccharification and fermentation procedures can be set up that can be listed as Separate
Enzymatic Hydrolysis and Fermentation (SHF), Simultaneous Saccharification and
Fermentation (SSF), Non-isothermal Simultaneous Saccharification and Fermentation
(NSSF), Simultaneous Saccharification and Co-fermentation (SSCF), and Consolidated
Bioprocessing (CBP) (Taherzadeh & Karimi, 2007b). In NSSF process, saccharification
and fermentation conducted in the same time but in different reactors which are adjusted
to optimum temperatures for saccharification and fermentation. This strategy is used to
overcome decreasing the efficiency of saccharification and fermentation process in SSF,
where temperature is not suits for both process (Wu & Lee, 1998). The SSCF is another
strategy to improve SSF, in which pentose and hexose sugars are fermented
simultaneously (Hamelinck et al., 2005).
33
Unlike all hydrolysis and fermentation strategies that mentioned above, in CBP, ethanol
together with all of the required enzymes is produced in single reactor by applying a single
microorganisms. Means, this single microorganism first hydrolyze the polysaccharides to
reducing sugars then assimilate the products to ethanol itself (Taherzadeh & Karimi,
2007b). In terms of technical and economic viewpoints, each of these strategies has its
pros and cons that must be studied properly before application. The first two procedures
which are most well-investigated are described next.
2.3.3.1 Separate enzymatic hydrolysis and fermentation (SHF)
In this process, biomass is saccharified into reducing sugars and the hydrolyzate is
transferred into a separate reactor to be converted to ethanol. Main advantage of this
approach is the possibility of conducting hydrolysis and fermentation at their own
optimum conditions since enzymatic hydrolysis gives optimum yield between 45 and
50 ̊C (Olsson et al., 2006; Saha et al., 2005; Söderström et al., 2003) whereas, the
optimum temperature for fermentation is 30 - 37 °C. The main disadvantage of SHF is
inhibition of cellulase activity by the reducing sugars produced. For example, cellobiose
concentration at 6 g L-1 may reduce the activity of cellulase by 60 %. On the other hand,
glucose is a strong inhibitor for ß-glucosidase in which 3 g L-1 of glucose concentration
would inhibit ß-glucosidase activity by 75 % (Philippidis et al., 1993; Philippidis &
Smith, 1995). Another possible problem in SHF is that of contaminations. The hydrolysis
process is rather long, e.g. one to four days, and a dilute solution of sugar always has a
risk of microbial contaminations, even at rather high temperature such as 45 - 50 °C
(Taherzadeh & Karimi, 2007b).
34
2.3.3.2 Simultaneous saccharification and fermentation (SSF)
Currently, a combination of both enzymatic hydrolysis and fermentation into one
stage, is considered as the most successful method for ethanol production from biomass.
In this process, the sugars generated by the enzymatic process are immediately utilized
by the fermenting microorganism present in the same reactor. This is an interesting
advantage for SSF compared to SHF, as no inhibition effects of enzymatic end-product
may occur by keeping a low concentration of enzymatic end-product in the culture
(Taherzadeh & Karimi, 2007b). It is much reported that SSF produces ethanol at higher
yields than SHF and requires lower amounts of enzyme (Eklund & Zacchi, 1995;
McMillan et al., 1999; Sun & Cheng, 2002). Moreover, because of the presence of ethanol
in media, risk of contamination in this way is lower than in the SHF process. Also, the
number of vessels required for SSF is reduced in comparison to SHF resulting in a lower
capital cost of the process. A key point of obtaining higher yield in SSF is to provide
better conditions for the enzymatic hydrolysis and fermentation as much as possible,
especially with respect to temperature (Taherzadeh & Karimi, 2007b). The optimum
temperature for enzymatic hydrolysis with a most common enzyme, cellulase is between
45-50 °C, while the temperature of 30 - 35 °C is considered the optimum for fermentation
process (Tengborg, 2000). Hydrolysis is usually the rate-limiting step in SSF (Philippidis
& Smith, 1995). Also, the presence of ethanol may inhibit enzymatic hydrolysis in SSF.
Wyman (1996) reported that 30 g L1 ethanol reduces the enzyme activity by 25%.
2.4 Seaweeds of Malaysia
Malaysia is located in the world’s richest biodiversity region, where Malaysian
macroalgae biodiversity was reported as 375 specific and intraspecific taxa in 56 families
of marine algae (Phang, 2006). In the region of South East Asia, mass-production of
Kappaphycus and Eucheuma started around the mid-1960s in the Philippines. After

35
successful farming of Kappaphycus in the Philippines at the early 1970s, the technology
was transferred to Malaysia and Indonesia in the late 1970s. At the present, Indonesia is
producing more seaweeds and lower seaweed is producing in the Philippines and
Malaysia (Hurtado et al., 2014). Two seaweed species, Kappaphycus alvarezii and
Eucheuma are growing in commercial scale especially in Sabah, East Malaysia. Several
species of Ulva, Gracilaria have a wide range of distribution in Peninsular Malaysia and
East Malaysia. Species of Ulva, Gracilaria and Chaetomorpha showed good growth in
mangrove forest ecosystem which reflects their ability to grow in the high turbidity
(Phang, 1994; Saifullah & Ahmed, 2007).
2.4.1 Gracilaria manilaensis Yamamoto & Trono
The world's first source of agar, from the middle of the seventeenth century, was
Gelidium from Japan, but with increasing phycocolloid demand in the 20th century,
Gracilaria was introduced in the market to meet the demands in agar production industry
(Armisen, 1995) The genus Gracilaria, comprises more than a hundred species and is
widely distributed throughout the world where the most of the species can be found in the
tropical zone and warm waters (McLachlan & Bird, 1986).
Gracilaria manilaensis productivity is reported as 8.9 to 35.7 DW g m-2 (Pondevida et
al., 1996).
36
2.4.2 Kappaphycus alvarezii (Doty) Doty ex P.C.Silva
Kappaphycus alvarezii was first described by Doty as Eucheuma alvarezii (Doty &
Norris, 1985) from Semporna, Sabah, Malaysia, and later changed to new combination
K. alvarezii (Silva et al., 1996). Kappaphycus alvarezii has a tough, fleshy thallus, up to
one meter in length (Phang et al., 2007).
Kappaphycus has been used greatly in different applications in the world industries of
food, pharmaceuticals, and nutraceuticals. Farming of this seaweed is a significant
activity especially along the coastal areas between the 10° N and 10° S of the Equator
(Hurtado et al., 2014). In Malaysia, K. alvarezii has reported from Sabah on sandy habitat
and this species is one of the seaweeds cultivated in commercial scale in East Malaysia
using the monofilament method in the islands near Semporna for eight months a year.
The average cultivation period of K. alvarezii is 45 days (Phang et al. 2007; 2014).
Kappaphycus alvarezii was introduced widely for commercial purposes in the tropical
warm waters. It is used for the extraction of kappa-carrageenan, as a homogenizer in milk
products, chocolate milk, canned evaporated milk and medicinal purposes (Phang et al.,
2010). In 2010, Malaysia produced 15,000 tonnes dried carrageenan. At present, in
Malaysia 12 varieties of Kappaphycus have been reported for cultivation. The phylogeny
of Malaysian varieties of Kappaphycus and Eucheuma was recently published (Tan et al.,
2012).
37
2.5 Response surface methodology
Response surface methodology (RSM) is a collection of statistical and mathematical
techniques useful for developing, improving and optimization processes. Originally, Box
and Wilson (1951) described the principles and fundamental aspects of this method of
analysis. Reducing the number of experimental runs that are needed to provide sufficient
information for statistically acceptable results is the main advantage of RSM (Ozdemir &
Devres, 2000). So, it is less laborious and time-consuming than another conventional
method which is required to optimize the process (Giovanni, 1983).
RSM uses quantitative data from appropriate experiments to determine and
simultaneously solve multivariate equations. It is a collection of statistical techniques for
designing experiments, building models, evaluating the effects of factors and analysing
optimum conditions of factors for desirable responses.
The most extensive applications of RSM are in the particular situations where
multiple variables potentially influence some performance measure or quality
characteristic of the process. The usage of RSM in the optimization stage process leads
to the requirement for an experimental design, which can create a lot of samples for
consumer evaluation in a short period of time, and therefore the laboratory level tests are
more efficient (Lee et al., 2006).
Among various design of RSM, central composite design (CCD) is a favourite type
of analysis in which attention is focused on characteristics of the fit response function, in
particular, where optimum response value occurs. The yield data were analysed for model
fit using the RSM software (Design Expert) (Corredor et al., 2006). On the other hand,
CCD is an optimum design for fitting quadratic models. The number of experimental
points in the CCD is sufficient to test the statistical validness of the fitted quadratic model
and in addition, to test the acceptability of lack-of-fit of the model. The CCDs had its
central point replicated several times to evaluate the error, resulting from experimental or
38
random variability. All tests were done in a randomized order to prevent the disturbing
effect of environmental conditions.
A successive response surface method is an iterative method which consists of a
scheme to assure the convergence of an optimization process. The scheme determines the
location and size of each successive region of interest in the design space, builds a
response surface in this region, conducts a design optimization and will check the
tolerances on the response and design variables for termination. This RSM method has
been widely used to evaluate and understand the interaction between different
physiological and nutritional parameters (Hounjg et al., 1989). This method has been
successfully applied to optimize compositions of the fermentation medium, conditions of
enzymatic hydrolysis, synthesis parameters for polymers and parameters for food
processes (Li et al., 2007).

39
CHAPTER 3: MATERIALS AND METHODS
3.1 Source of seaweeds
Twenty-nine seaweed species which are members of the Chlorophyta (green
seaweeds), Phaeophyta (brown seaweeds) and Rhodophyta (red seaweeds), were
collected from different habitats along the Malaysian coastline (Table 3.1). Voucher
specimens were prepared as dried herbarium specimens and deposited in the University
of Malaya Seaweeds and Seagrasses Herbarium. The Eucheuma spp. and Kappaphycus
spp. seaweeds were obtained from a farm in Semporna, Sabah. Also, Gracilaria
manilaensis was purchased from a farming pond in Kedah. All seaweed samples were
authenticated by Prof Phang Siew Moi.
3.1.1 Seaweed storage and preparation
Collected seaweeds were washed with diluted seawater and sand, dirt and ephypites
were removed from seaweed samples. Cleaned seaweeds were partially dried in oven at
55 °C for 24 h then were ground through a 2-mm screen using a grinder and the reduced
sized sample were re-dried in 80 °C to reach a constant weight and preserved in a
desiccator for further use.
40
Table 3.1: List of seaweeds used. No Seaweed name Collection site
1
Ch
loro
ph
yta
Bryopsis plumosa (Hudson) C. Agardh Port Dickson, Negeri Sembilan
2 Caulerpa racemosa (Forsskål) J. Agardh Port Dickson, Negeri Sembilan
3 Caulerpa serrulata (Forsskål) J. Agardh Port Dickson, Negeri Sembilan
4 Caulerpa sertularioides (S.G.Gmelin) M.Howe Port Dickson, Negeri Sembilan
5 Chaetomorpha sp. Kützing Port Dickson, Negeri Sembilan
6 Cladophora sp. Kützing Port Dickson, Negeri Sembilan
7 Cladophora rugulosa G. Martens Port Dickson, Negeri Sembilan
8 Halimeda sp. J. V. Lamouroux Perhentian Islands,Terengganu
9 Ulva flexuosa Wulfen Port Dickson, Negeri Sembilan
10 Ulva intestinalis Linnaeus Port Dickson, Negeri Sembilan
11 Ulva reticulata Forsskål Johor
12
Rh
od
op
hy
ta
Acanthophora spicifera (M.Vahl) Børgesen Morib, Selangor
13 Eucheuma denticulatum (N. L. Burman) Collins & Hervey Semporna, Sabah
14 Gracilaria changii (B. M. Xia & I. A. Abbott) I. A. Abbott,
J. Zhang & B. M. Xia
Morib, Selangor
15 Gracilaria edulis (S. G. Gmelin) P. C. Silva Morib, Selangor
16 Gracilaria manilaensis Yamamoto & Trono Kedah
17 Gracilaria salicornia (C.Agardh) E. Y. Dawson Morib, Selangor
18 Hypnea sp. J. V. Lamouroux Morib, Selangor
19 Kappaphycus alvarezii (Doty) Doty ex P.C.Silva Semporna, Sabah
20 Pterocladiella caerulescens (Kützing) Santelices &
Hommersand
Port Dickson, Negeri Sembilan
21 Solieria sp. J. Agardh Port Dickson, Negeri Sembilan
22
Ph
aeo
ph
yta
Dictyota sp. (Hudson) J. V. Lamouroux Perhentian Islands,Terengganu
23 Hormophysa sp. (J. F. Gmelin) P. C. Silva Port Dickson, Negeri Sembilan
24 Lobophora variegate (J. V. Lamouroux) Womersley ex E.
C. Oliveira
Perhentian Islands,Terengganu
25 Padina australis Hauck Perhentian Islands,Terengganu
26 Sargassum baccularia (Mertens) C. Agardh Port Dickson, Negeri Sembilan
27 Sargassum binderi Sonder ex J. Agardh Port Dickson, Negeri Sembilan
28 Turbinaria conoides (J. Agardh) Kützing Perhentian Islands,Terengganu
29 Turbinaria ornata (Turner) J. Agardh Perhentian Islands,Terengganu
41
3.2 Experiment 1. Chemical characterisation of selected seaweeds
3.2.1 Total carbohydrate
The total carbohydrate contents of the seaweed samples were estimated by the phenol-
sulphuric acid method (DuBois et al., 1956) with some minor changes to improve the
sensitivity of analysis as follows. Dried samples (500 mg) in centrifuge test tubes were
soaked in 25 mL HCl (2 M) for one hour and then incubated for one hour in a water bath
(80 °C). The test tubes were shaken repeatedly to ensure complete hydrolysis. Test tubes
were centrifuged for 30 min at 2500 ×g and aliquots of supernatants were diluted with
distilled water to reach the concentration of 1-10 g L-1 sugars. Then 100 µL of diluted
samples were transferred to clean glass test tubes. Then 3 mL of phenol solution (5 % w
v-1) were added to each tube and after shaking the glass test tubes, 5 mL of concentrated
sulphuric acid were next added and the test tubes mixed thoroughly. The same procedure
was applied to the standards (calibration) solutions. Test tubes were kept at room
temperature to be cooled for 15 min and then readings were taken at 485 nm using the
UV-visible spectrophotometer (UV-1800, Shimadzu, Japan). The standard curves were
prepared based on galactose (for red seaweeds), glucose (for green seaweeds) and fucose
(for brown seaweeds).
3.2.2 Moisture and ash
The moisture content was determined applying modified AOAC (2000). To conduct
this, 5 g FW sample (triplicate) was placed on weighed aluminium foil, dried by an oven
(Memmert, Germany) at 80 °C until constant weight was obtained. The dried sample
moved to desiccator to reach room temperature, then dry weighed (DW) and amount of
moisture was calculated according Eq. 3.1.

42
Moisture content =FW−DW
FW× 100 (3.1)
The ash content was measured by further combusting of the 2 g DW samples
(triplicate) in a muffle furnace at 550 °C for 5 hours (AOAC, 2000). The crucibles were
transferred immediately to desiccator to cool down to room temperature and reweighed.
The ash content was calculated as Eq 3.2:
Ash content = (Ash+Crucible) − Crucible
DW × 100 (3.2)
3.2.3 Reducing sugar
The sugar contents of the hydrolysates were analysed using the modified DNS (3, 5-
dinitrosalycylic acid) method (Miller, 1959). The main reagent was prepared according
to basic protocol but diluted with distilled water 9 : 7, and kept in dark glass bottles. The
solution of 0.1 % w v-1 Sodium meta-bisulphite was prepared and added to DNS reagent
prior to use by a ratio of 1 : 16. To conduct the analysis, 1.5 mL of final DNS reagent,
was added to 100 µL of the sample and incubated for 10 min at 90 °C. To stabilize the
developed colour, 250 µL of sodium potassium tartarat (40 %) was added to reaction
vials, while the vials were hot and then the vials were cooled to room temperature. The
samples were read at 575 nm on a UV-Vis spectrophotometer (UV-1800, Shimadzu,
Japan).
3.2.4 Soluble neutral sugar by gas chromatography
Selected seaweed species were hydrolysed with 2 M TFA (trifluoroacetic acid) for 1
h at 121 ° C. The supernatants were collected and derivatized to their alditol acetate
compounds (APPENDIX A) (Melton & Smith, 2001). GC analyses of the sugar
43
derivatives were conducted with a 7820A gas chromatograph, Agilent, USA, equipped
with a flame-ionization detector (FID), using a fused silica capillary column (30 m × 0.32
mm) wall coated with BPX70. Helium was used as the carrier gas at a column head
pressure of 40 kPa and at a flow rate of 1 mL min-1 and a split ratio of 60 : 1 with an
injection volume of 2 µL.
The initial oven temperature, 70 °C, was maintained for 5 min following injection,
then increased to 170 °C at 50 °C min-1, then to 230 °C at 2 °C min-1, and kept at 230 °C
for 20 min. The detector and inlet temperatures were held at 150 °C and 250 °C
respectively. Hydrogen and zero air flow were 40 mL min-1 and 450 mL min-1
respectively and makeup flow was maintained as 50 mL min-1. Glucose, galactose,
mannose, fucose, rhamnose, xylose and arabinose were used as standard
monosaccharides and allose as an internal standard.
3.2.5 Fermentation inhibitors
The fermentation inhibitors including furfural and 5-hydroxymethylfurfural (5-HMF)
were analysed through chromatography using the HPLC-PDA machine, Varian Prostar-
210, equipped with the C18 column. Isocratic elution of HPLC grade Methanol and
Acetic acid 1 % in HPLC grade water was used at 20 : 80 ratio and at 27 °C and under
wavelength of 254 nm. Sample of HPLC chromatogram is provided as Appendix B.
The total phenolic content (TPC) was analysed by the Folin–Ciocalteu method (Lee et
al., 2004; Singleton et al., 1999) with some modification. Among the several assays
available to quantify total polyphenols, this method is one of the most commonly used
(Zhang et al., 2006). 50 µL of diluted samples (range of 50 - 500 mg L-1) was mixed with
3.5 mL distilled water in 5 mL self-standing base centrifuge test tubes, followed by 250
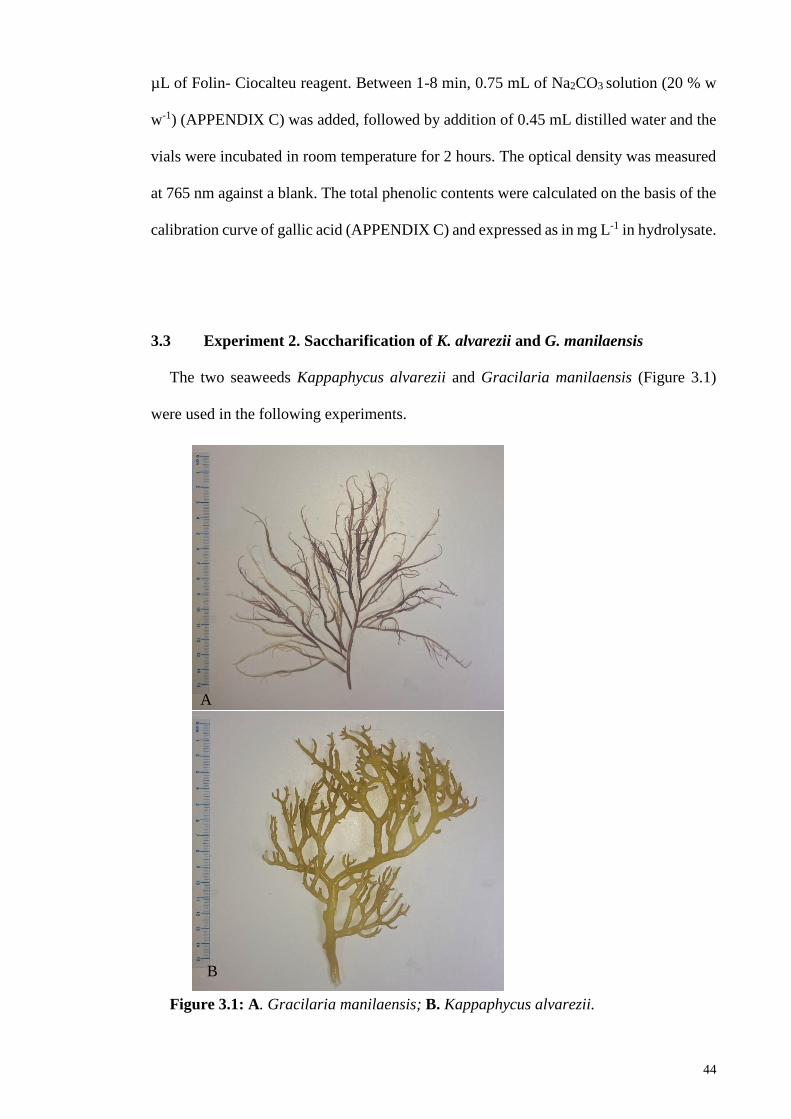
44
µL of Folin- Ciocalteu reagent. Between 1-8 min, 0.75 mL of Na2CO3 solution (20 % w
w-1) (APPENDIX C) was added, followed by addition of 0.45 mL distilled water and the
vials were incubated in room temperature for 2 hours. The optical density was measured
at 765 nm against a blank. The total phenolic contents were calculated on the basis of the
calibration curve of gallic acid (APPENDIX C) and expressed as in mg L-1 in hydrolysate.
3.3 Experiment 2. Saccharification of K. alvarezii and G. manilaensis
The two seaweeds Kappaphycus alvarezii and Gracilaria manilaensis (Figure 3.1)
were used in the following experiments.
Figure 3.1: A. Gracilaria manilaensis; B. Kappaphycus alvarezii.
A
B
45
3.3.1 Method 1: Dilute acid hydrolysis
3.3.1.1 Selection of suitable acid
To select the best acid for hydrolysis, hydrochloric, sulphuric, perchloric and acetic
acid at different concentrations were used to convert the carbohydrates of G. manilaensis
to reducing sugars. A paste of a fresh seaweed sample (1 kg) was prepared by blending
the sample, using a home blender to obtain a final paste of about 10 % total solids content.
Five gram of this paste which was equal to 0.5 g DW seaweed biomass, was added to a
15ml centrifuge test tube to which sulphuric acid was added to provide different acid
concentrations (0.5, 1, 1.5, 2, 2.5, 3.0, 3.5, 4.0, 4.5 and 5 % w v-1). This was repeated for
the other three different acids (perchloric acid, hydrochloric acid and acetic acid). The
test tubes were then heated at 121 °C for 60 min in an autoclave. The test tubes were
cooled, centrifuged for 10 min by 2500 ×g and the supernatants were analysed for
reducing sugar content by the modified DNS method (Miller, 1959) as described in
section 3.2.3.
3.3.1.2 Fresh vs dry biomass
Fresh and dry biomass of G. manilaensis were used to investigate the effect of drying
on dilute acid saccharification. Five g of paste from fresh seaweeds (as prepared in section
3.3.1.1) were added into 15 mL centrifuge test tubes followed by addition of sulphuric
acid to provide acid concentration (ranging from 0.5 to 5 % w v-1). This was followed by
thermal treatment for 60 min at 121 °C. The test tubes were centrifuged for 10 min at
2500 ×g and the supernatant was used for reducing sugar analysis using DNS method.
For dry biomass, 0.5 g of dry seaweed samples were used in place of the paste from the
fresh seaweeds, and the same procedures for saccharification were applied.
46
3.3.1.3 Optimisation of dilute acid saccharification
Optimisation of the saccharification process was performed using sulphuric acid, on
the two seaweeds Kappaphycus alvarezii and Gracilaria manilaensis. A combination of
various parameters including temperature, incubation time and acid concentrations were
used. To conduct this, 0.5g biomass was soaked in vials containing 10 mL dilute acid
(0.5, 1.0, 2.5, 5.0 and 10.0 % w v-1) giving a ratio of 1 : 20 for 2 hours at room temperature
(25 ± 1 °C). The vials were then incubated in the range of different temperatures (80,
100, 120 and 140 ˚C) and for different incubation times (10, 20, 40 and 60 min). The
reducing sugar contents in the resultant hydrolysate, was measured using the DNS
method (Miller 1959).
3.3.1.4 Seaweed hydrolysate detoxification
Acid hydrolysis can produce fermentation inhibitors like 5-HMF. Over-liming is a
process to reduce these fermentation inhibitors. The hydrolysates of the two seaweeds,
from saccharification under optimised conditions (2.5 % sulphuric acid w v-1, 40 min at
120 °C) were used in this study. Into beakers containing 300 mL hydrolysate, was added
Ca(OH)2 while stirring, until the pH of the hydrolysate reached 10, and incubated for 2
hr at 30 °C with continuous stirring using a magnetic stirrer. Sampling was conducted at
regular intervals during the 2 hr, and the samples were immediately centrifuged. The
supernatant was transferred to new centrifuge test tubes and the pH was adjusted to 5
using concentrated H2SO4 (Yadav et al., 2011). The experiment was repeated to
investigate the effect of the incubation pH at 11 and 12. The amount of fermentation
inhibitors was determined in the samples using the HPLC-PDA machine (according the
protocol described in section 3.2.5).
47
3.3.2 Method 2: Enzymatic saccharification
After dilute acid hydrolysis, cellulosic materials which are not converted to reducing
sugars are still found in the residues. To convert these residues to reducing sugar,
commercial cellulase enzyme (Cellic CTec 2) produced from Novozyme, Denmark was
used. Enzyme dosage and liquid: biomass ratio were factors applied for optimization of
enzymatic conversion of seaweed dilute acid treatment residues.
3.3.2.1 Optimization of the enzyme dosage
Residues from the acid hydrolysis were neutralized with 2 % w v-1 NaOH, washed and
freeze-dried (Modulyo, Thermo, USA) for 2 days. The dried residues (2 g) were soaked
in 20 mL of 0.1 M sodium citrate buffer (pH 4.8) and 0.2 % v v-1 Tween 80 (in blue cap
bottles 50 mL), then the bottles were autoclaved for 15 min at 121 °C. Cellulase was
added to each sample with different concentration from 2 %, 5 %, 10 % and 20 % g g-1
biomass and by adding distilled water liquid volume were adjusted to 40 mL. The samples
were incubated 72 h at 50 °C on a shaker incubator with a speed of 170 rpm (Manns et
al., 2014). Samples were taken out periodically, centrifuged and reducing sugar was
measured using the DNS method.
3.3.2.2 Optimization of liquid: biomass ratio
In order to produce glucose with high concentration, it is required to reduce the
volume of liquid (sodium citrate buffer) to biomass (residue) and optimize this ratio. To
conduct this, dried residue (2 g) was hydrolysed with optimum enzyme dosage of 10 % v
v-1, the temperature of 50 °C, pH 4.8 and in different liquid: biomass ratios ranging from
48
1:2.5, 1:5, 1:7.5 and 1:10. After hydrolysis treatment, reducing sugars was measured
using the DNS method.
3.4 Experiment 3. Fermentation studies
3.4.1 Yeast strains and medium
Three different yeast species were used in this study:
1. Saccharomyces cerevisiae (NBRC 10217)
2. Brettanomyces bruxellensis (NBRC 0677)
3. Saccharomyces cerevisiae (Ethanol Red)
Saccharomyces cerevisiae (NBRC 10217) and Brettanomyces bruxellensis (NBRC
0677) were purchased from the National Institute of Technology and Evaluation (NITE),
Japan while Saccharomyces cerevisiae (Ethanol Red) was kindly provided by Fermentis,
France.
The first two strains were revived and cultured on medium code 108 containing
glucose 1.0 % w v-1; yeast extract 0.6 % w v-1; peptone 0.5 % w v-1; agar 3.0 % w v-1; pH
6.4–6.8 and incubated at 30 °C followed by preservation at 4 °C. The Ethanol Red was in
freeze-dried condition and preserved at - 20 °C.
3.4.2 Selection of yeast strains and acclimation
The inoculum was prepared using Difco YPD broth (10 g L-1 yeast extract, 20 g L-1
peptone, 20 g L-1 glucose) for 48 h on a rotary shaker at 30 °C. In order to conduct
preliminary yeast adaptation, seaweed hydrolysate was enriched with peptone and yeast
extract and the pH was adjusted to pH 5 followed by sterilization at 105 °C for 20 min;
and then were inoculated (10 % v v-1) with three yeast strains for three cycles of
49
cultivation. To conduct this, 1 L of G. manilaensis hydrolysate was prepared, detoxified
and enriched with 0.6 % yeast extract. Reducing sugar content was adjusted to 40 g L-1.
The initial volume of the first batch was 50 mL of seaweed hydrolysate for all strains.
The second cycle of adaptation was performed by inoculation fresh media with 5 mL of
the first reaction batch medium and the same procedure was taken for the third cycle
adaptation. Each cycle lasted 5 days under anaerobic condition, at 30 °C. The best yeast
strain was selected based on the highest fermentation yield and used for further studies.
The selected yeast strain, Ethanol Red was used for further acclimation process using
the fed-batch system in 100 mL bottles and under anaerobic condition at 30 °C. Every
week 20 % of the reactor medium was withdrawn and fresh seaweed medium was added
to the reactor regularly for 3 months under constant conditions.
3.4.3 Preparing seaweed hydrolysate for fermentation study
3.4.3.1 Dilute acid hydrolysis
Two seaweed species including G. manilaensis and K. alvarezii (Figure 3.1) were
subjected to dilute acid treatment by the optimum condition. For that, biomass was
cleaned and washed with diluted seawater and then oven dried to reach a constant weight
at 80 °C, then 100 g DW of each seaweed biomass (triplicate) was soaked in 800 mL of
sulphuric acid (2.5 % w v-1). Samples were incubated at 120 °C for 40 min. The
hydrolysate was cooled down to room temperature and residues were separated by a sieve
(0.5 mm) and filtrates were detoxified by over-liming. Detoxified hydrolysates were
filtered through Whatman filter paper no. 1 and immediately the hydrolysates pH were
adjusted (pH 5) by hydrochloric acid. The hydrolysate was enriched with organic nitrogen
source (Yeast Extract 0.2 % w v-1) and was sterilized at 105 °C for 20 min.
50
3.4.3.2 Enzymatic hydrolysis
The residues obtained from the dilute acid hydrolysis treatment above (Section
3.4.3.1) were collected from both seaweed biomass, washed and pH adjusted to 5,
followed by drying using freeze drier. Then the residues were characterized for DW and
ash content.
7g of residue from each seaweed species, were transferred to 100 mL serum bottle
followed by addition of 45 mL of 0.05 M citrate buffer pH 5 and 0.1 % Tween 80 as a
surfactant. The samples were autoclaved for 15 min at 121 °C and after cooling down to
room temperature Cellulase was added to each sample to provide a required enzyme
dosage (10 % w w-1 biomass). Non-ionic surfactant Tween 80 (0.1 % v v-1) to prevent
unproductive binding of the enzyme to residues was used in all experiments (Castanon &
Wilke, 1981; Alkasrawi et al., 2003). Final volume of serum bottles were adjusted to 50
ml by addition of 0.05 M citrate buffer. Samples were incubation on a shaking incubator
(170 rpm) for 48 h at 50 °C. Hydrolysate was filtered under the aseptic condition and
transferred to clean 100 mL serum bottle for further procedures.
3.4.4 Fermentation of dilute acid-based hydrolysate
The seaweeds’ hydrolysate using dilute acid treatment were fermented under anaerobic
condition in 100 mL serum bottles and 1400 mL fermenter using adapted yeast (Ethanol
Red). The pH of media was adjusted and maintained at 4.8 with 0.1 M citrate buffer in
serum vials and using automatic adjusting in the fermenter. The volume of inoculation
was 6 % v v-1 in all experiments at 30 °C and agitation was 150 rpm.
51
3.4.5 Fermentation of enzyme-based hydrolysate
Fermentation was also conducted using the enzyme hydrolysates of the seaweeds (as
prepared in section 3.4.3.2). The medium was enriched with nitrogen source, yeast extract
0.6 % (Khambhaty et al. 2012). pH was adjusted (pH 5) using 0.05 M sodium citrate
buffer followed by inoculation with adapted yeast (Ethanol Red). The samples were
incubated for 3 days at 30 °C and 150 rpm in a shaking incubator.
3.4.6 Analysing bioethanol content by GC using a novel sample preparation
approach
Bioethanol samples were defrosted and centrifuged for 15 min at 10625 ×g. Clear
brown supernatant was collected and 100 µL of each sample (by triplicates) was added to
900 µL of solvent mixture (1% w v-1 iso-butanol in acetonitrile) and shaken vigorously
for 15 sec, followed by centrifugation at 5976 ×g at 5 °C for 3 min. This is the first time
this method is used. This is done to remove soluble compounds and to reduce the amount
of water content in injection volume in GC.
Followed that sample preparation step, the concentration of bioethanol was then
analysed by Gas Chromatograph (GC) (Agilent 5820-A, Agilent Inc., USA) equipped
with a split/ splitless inlet, a flame ionization detector (FID) and a capillary column (HP-
Innowax 30 m, 0.32 mm, 0.15 µm). The temperature programming of the GC analysis
were as follow: 230 °C as injector and 230 °C as detector temperature, the column was
held at 70 °C for 7 min and then the temperature was increased at a rate of 25 °C min-1 to
220 °C and then held for 10 min; helium at 3 mL min-1 was used as carrier gas, the flow
rates for the FID were 40 mL min-1 for the makeup gas (He), 40 mL min-1 for hydrogen,
and 450 mL min-1 for air with a split ratio of 1:100 and 1 µL injection sample size was
used (Lin et al., 2014). A standard curve of ethanol was plotted using different levels of
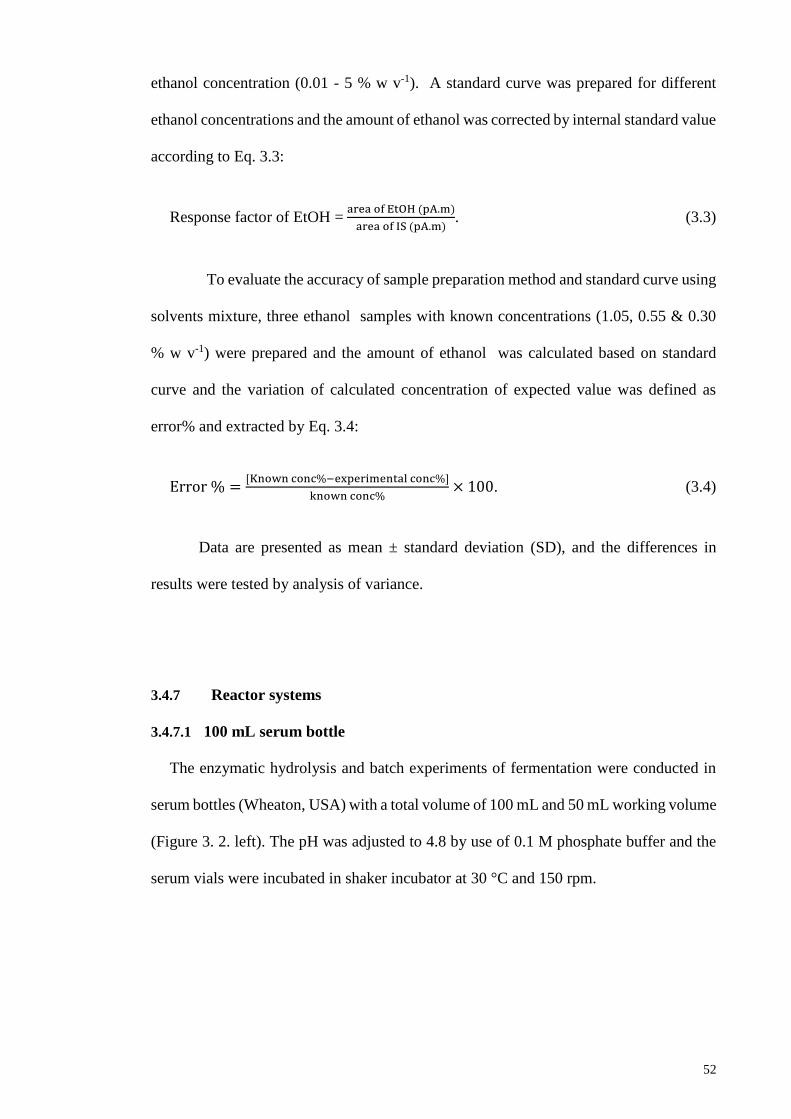
52
ethanol concentration (0.01 - 5 % w v-1). A standard curve was prepared for different
ethanol concentrations and the amount of ethanol was corrected by internal standard value
according to Eq. 3.3:
Response factor of EtOH = area of EtOH (pA.m)
area of IS (pA.m). (3.3)
To evaluate the accuracy of sample preparation method and standard curve using
solvents mixture, three ethanol samples with known concentrations (1.05, 0.55 & 0.30
% w v-1) were prepared and the amount of ethanol was calculated based on standard
curve and the variation of calculated concentration of expected value was defined as
error% and extracted by Eq. 3.4:
Error % =[Known conc%−experimental conc%]
known conc%× 100. (3.4)
Data are presented as mean ± standard deviation (SD), and the differences in
results were tested by analysis of variance.
3.4.7 Reactor systems
3.4.7.1 100 mL serum bottle
The enzymatic hydrolysis and batch experiments of fermentation were conducted in
serum bottles (Wheaton, USA) with a total volume of 100 mL and 50 mL working volume
(Figure 3. 2. left). The pH was adjusted to 4.8 by use of 0.1 M phosphate buffer and the
serum vials were incubated in shaker incubator at 30 °C and 150 rpm.
53
3.4.7.2 1000 mL working volume fermenter
The final fermentation experiment was conducted in a 1.4 L fermenter, Multifors,
Switzerland (Figure 3. 2. b). The pH in the fermenter was maintained at 5 by automatic
addition of 2 M HCl and 2 M NaOH. The temperature was 30 °C and agitation speed was
150 rpm. Sampling was conducted through a special aseptic sampling port.
Figure 3.2: Bioreactors: Left: 100 mL serum bottle; Right: Lab scale fermentation setup
(A. PC; B. 1.4 L fermenter; C. Water chiller and D. Rotary evaporator).
A B C D
54
3.5 Experiment 4. Saccharification using dilute acid at low temperature, based
on response surface methodology (RSM)
In this part, two seaweed species, were treated with dilute sulphuric acid at a lower
temperature than what have been used in other studies but with longer incubation time.
To optimize the reaction parameters to achieve maximum production of reducing sugars
with minimum cost and faster time, the experiment was designed by Design-Expert
software version 7.0.0 (Stat-Ease Inc., Minneapolis, MN, USA). Central composite
design (CCD) was applied to optimize the reaction variables including temperature
ranged 45-75 °C, acid concentration ranged 2.5-7.5 % w v -1 and incubation time 2-10 h.
Dried biomass (200 mg) of G. manilaensis and K. alvarezii were transferred in
15mL centrifuge test tubes and 5 mL of 2.5, 5 and 7.5 % w v -1 acid sulphuric added to
test tubes, then test tubes were mixed thoroughly by vortexed for 30 seconds and soaked
for one hour at room temperature. Test tubes later were incubated at oven (45, 60 and 75
°C) for various incubation time (2, 6 and 10 h). During incubation time, test tubes were
shaken by vortex for 5s each hour to ensure effective treatment. All the experiments were
done in triplicate to ensure the reproducibility of the data. The samples were immediately
stored in fridge for further analysis. Amount of reducing sugars was measured using DNS
method (Miller 1959) and the yield of saccharification is estimated from Eq. 3.5:
Yield of saccharification = amount of reducing sugar
total biomass DW× 100 (3.5)
In present study, optimum condition for maximizing the reducing sugar generation
were predicted by solving the second-order polynomial equation (Eq. 3.6) and by
analysing the response surface contour plots.
(3.6)
55
Where Y represents the predicted response, B0 is the interception coefficient Bi ,
Bii and Bij are the regression coefficients for the three variables, Xi (linear term), Xi2
(quadratic term) and XiXj (interaction term) respectively.
The error of analysis for the experimental procedure is approximately ± 5 %.
Regression analysis and analysis of variance (ANOVA) tested the significance of the
model. The coded values of the variables are shown in Table 3.2.
Table 3.2: Coded level for variables used in the experimental design.
Factors Symbol Coded levels
-1 0 +1
Acid concentration (w v-1) A 2.5 5 7.5
Incubation temperature ( °C) B 45 60 75
Incubation time (h) C 2 6 10
3.6 Statistical analysis
In all experiments, normal distribution of data was tested using the Kolmogorov-
Smirnov test. All data were analysed with the analysis of variance (ANOVA). The
statistical analyses were carried out using SPSS software, version 21 (SPSS Inc., USA).
Tukey’s HSD comparisons were applied to determined statistically significant differences
(p < 0.05) among time (min), acid concentration (% w v-1) and temperature (°C) following
ANOVA. A significance level of 95% (p < 0.05) was set for all the tests. Results of
statistical analysis are shown in tables and figures in Appendices part.
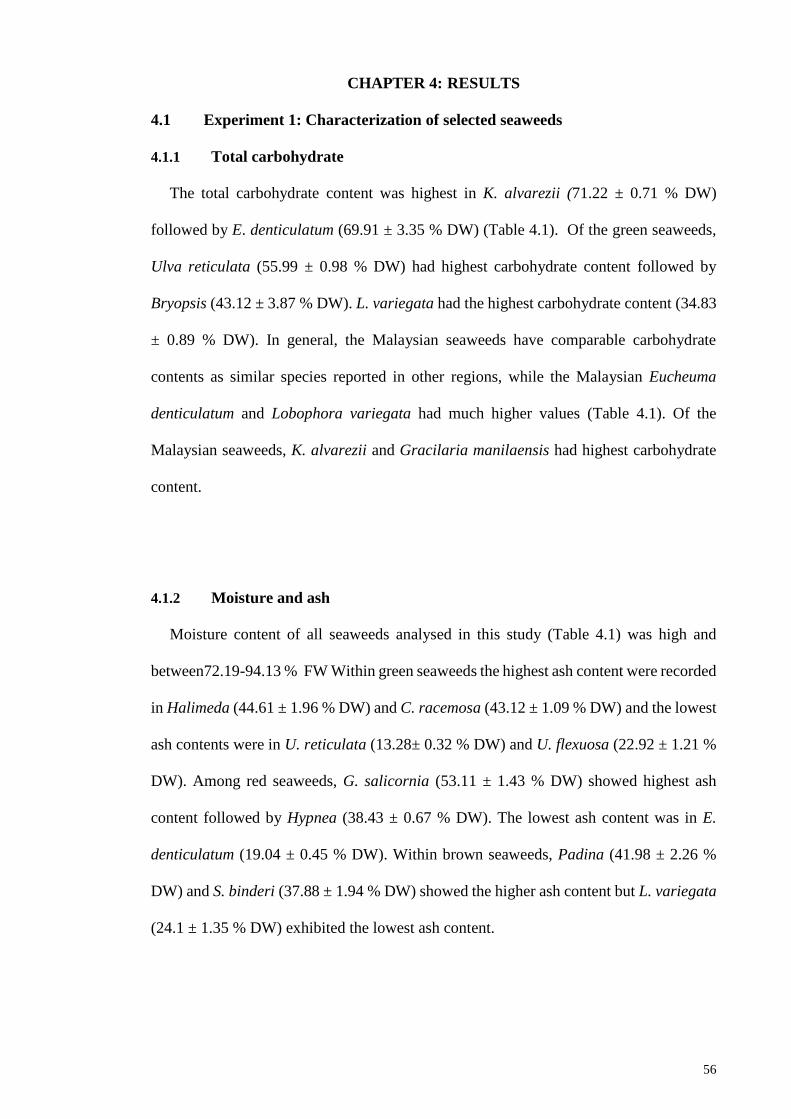
56
CHAPTER 4: RESULTS
4.1 Experiment 1: Characterization of selected seaweeds
4.1.1 Total carbohydrate
The total carbohydrate content was highest in K. alvarezii (71.22 ± 0.71 % DW)
followed by E. denticulatum (69.91 ± 3.35 % DW) (Table 4.1). Of the green seaweeds,
Ulva reticulata (55.99 ± 0.98 % DW) had highest carbohydrate content followed by
Bryopsis (43.12 ± 3.87 % DW). L. variegata had the highest carbohydrate content (34.83
± 0.89 % DW). In general, the Malaysian seaweeds have comparable carbohydrate
contents as similar species reported in other regions, while the Malaysian Eucheuma
denticulatum and Lobophora variegata had much higher values (Table 4.1). Of the
Malaysian seaweeds, K. alvarezii and Gracilaria manilaensis had highest carbohydrate
content.
4.1.2 Moisture and ash
Moisture content of all seaweeds analysed in this study (Table 4.1) was high and
between72.19-94.13 % FW Within green seaweeds the highest ash content were recorded
in Halimeda (44.61 ± 1.96 % DW) and C. racemosa (43.12 ± 1.09 % DW) and the lowest
ash contents were in U. reticulata (13.28± 0.32 % DW) and U. flexuosa (22.92 ± 1.21 %
DW). Among red seaweeds, G. salicornia (53.11 ± 1.43 % DW) showed highest ash
content followed by Hypnea (38.43 ± 0.67 % DW). The lowest ash content was in E.
denticulatum (19.04 ± 0.45 % DW). Within brown seaweeds, Padina (41.98 ± 2.26 %
DW) and S. binderi (37.88 ± 1.94 % DW) showed the higher ash content but L. variegata
(24.1 ± 1.35 % DW) exhibited the lowest ash content.
57
Table 4.1: Total carbohydrate, reducing sugar, ash and moisture contents of selected
Malaysian seaweeds. Amount (% DW)
Ash Total
carbohydrates
Reducing Sugar Moisture
C
hlo
rop
hy
ta
Bryopsis sp. 27.29 ± 0.98 defgh 43.12 ± 3.87 d 23.16±6.12 bcde 93.02 ± 1.09 abc
Caulerpa racemosa 34.49 ± 1.09 abc 38.11 ± 2.09 def 15.56 ± 4.09 efghi 94.00 ± 1.44 ab
C. lentillifera 27.31 ± 1.13 defgh 38.12 ± 2.98 def 22.65±2.77 bcdef 92.09 ± 1.91 abcd
C. serrulata 29.34 ± 0.29 cdefg 34.12 ± 1.45 efg 20.04 ± 2.01 defg 93.19 ± 0.83 abc
C. sertularioides 28.15 ± 2.09 defgh 32.99 ± 0.90 fg 17.14 ± 1.14 efghi 92.98 ± 1.04 abc
Chaetomorpha sp. 30.49 ± 0.55 bcde 34.13 ± 1.11 fg 18.12 ± 1.98 efghi 87.11 ± 0.19 fghi
Cladophora rugulosa 22.36 ± 1.41 hij 34.98 ± 2.09 efg 18.12 ± 3.18 efghi 88.12 ± 0.98 efgh
Halimeda sp. 35.68± 1.96 ab 29.77 ± 3.48 g 10.16 ± 4.19 ijk 73.09 ± 2.09 mn
Ulva flexuosa 18.33± 1.21 jk 34.98 ± 1.19 efg 18.12 ± 3.12 efghi 85.98 ± 0.99 ghi
U. intestinalis 22.49 ± 0.66 ghij 33.12 ± 1.09 fg 19.15±2.74 defgh 89.56 ± 1.09cdefg
U. reticulata 10.62 ± 0.32 l 55.99 ± 0.98 bc 27.11±1.98 abcd 82.12 ± 0.41 jk
Rh
od
op
hy
ta
Acanthophora spicifera 27.35 ± 0.99 defgh 37.12 ± 2.01 ef 20.38 ± 1.03 defg 82.28 ± 1.09 jk
Eucheuma denticulatum 15.23 ± 0.45 kl 69.91 ± 3.35 a 32.28 ± 3.98 a 94.13 ± 0.65 kl
Gracilaria changii 25.68 ± 0.97 efgh 52.94 ± 0.98 c 29.66 ± 1.06 ab 89.11 ± 0.45defg
G. edulis 29.68 ± 1.08 bcdef 39.18 ± 0.67 de 20.12 ± 1.58 defg 91.26 ±1.11 abcde
G. manilaensis 28.53 ± 0.68 bcdef 59.68 ± 1.83 b 33.02 ± 1.11 a 92.66 ± 0.98 abcd
G. salicornia 38.12 ± 1.43 a 35.53 ± 1.98 efg 16.19 ± 2.05 efghi 85.12 ± 0.76 hij
Hypnea sp. 30.43 ± 0.67 bcde 39.4 ± 1.93 de 18.19 ± 2.83 efghi 91.11 ±1.98 abcde
Kappaphycus alvarezii 18.74 ± 1.04 jk 71.22 ± 0.71 a 34.12 ± 1.09 a 93.08 ± 0.84 abc
Pterocladiella
caerulescens
17.05 ± 0.35 jk 51.65 ± 1.48 c 28.12 ±2.09 abc 76.30 ± 1.70 lm
Soleria sp. 30.98 ± 1.97 bcdef 36.17 ± 2.10 ef 19.13± 3.01cdefg 91.35 ± 1.01 abcde
Ph
aeo
ph
yta
Dictyota sp. 25.98 ± 3.06 cdef 13.11 ± 1.76 ij 11.18 ± 2.12 ijk 89.11 ± 0.76 defg
Hormophysa sp. 29.15 ± 3.18 fghi 20.14 ± 1.12 h 11.85 ± 2.11 hij 79.12 ± 0.45lm
Lobophora variegata 19.28 ± 1.35 ijk 34.83 ± 0.89 efg 3.62 ± 0.50 k 89.98 ± 0.65 bcdef
Padina australis 33.98 ± 2.26 abc 29.70 ± 0.61 g 11.21 ± 1.02 ijk 91.55 ± 0.79 abcde
Sargassum baccularia 29.30 ± 2.94 cdef 17.09 ± 0.87 hij 14.48 ± 0.49 fghi 84.59 ± 0.91 hij
S. binderi 30.88 ± 1.94 bcde 12.16 ± 2.11 j 5.17 ± 3.70 jk 84.09 ± 0.59 ij
Turbinaria conoides 29.30 ± 3.33 abcd 18.98 ± 2.97 h 16.63 ± 2.33 efghi 72.19 ± 0.93 n
T. ornata 25.6 ± 1.87 efgh 17.37 ± 2.44 hij 13.49 ± 3.29 ghi 75.02 ± 1.05 mn
Values are represented as mean ± SD, replicate by independent experiments n=3. Values followed by the same letter are not
significantly different at p < 0.5, (Tukey, HSD).
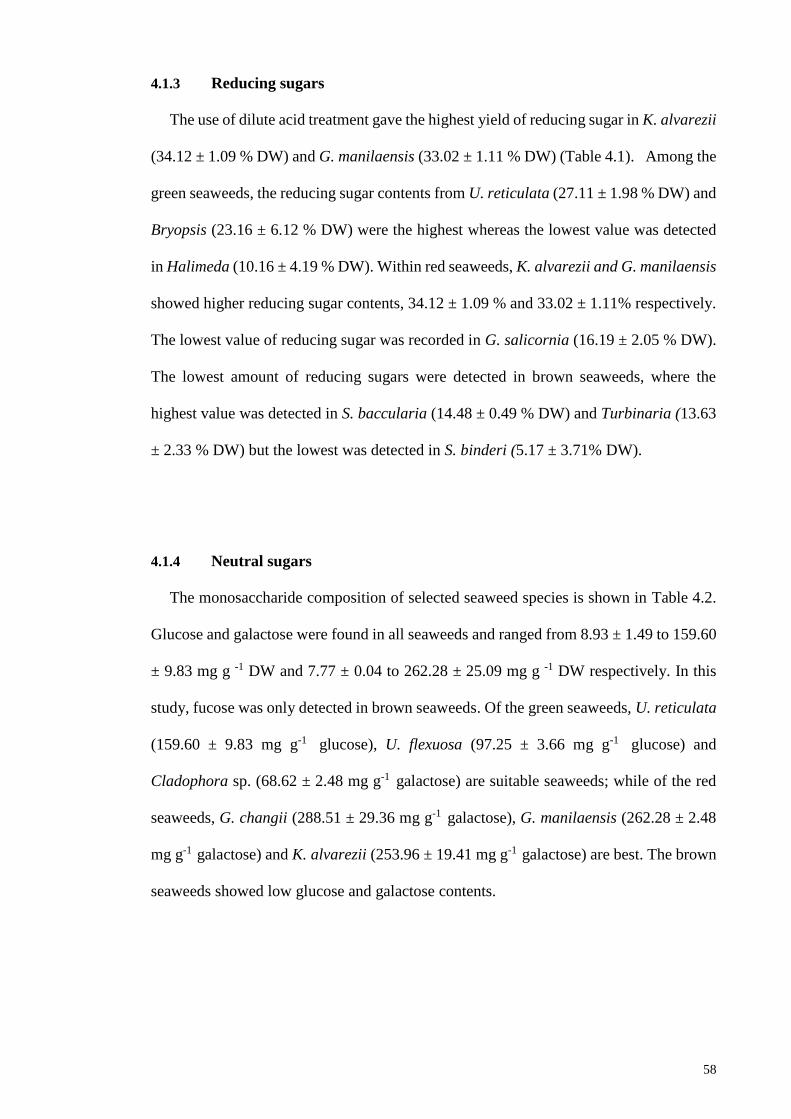
58
4.1.3 Reducing sugars
The use of dilute acid treatment gave the highest yield of reducing sugar in K. alvarezii
(34.12 ± 1.09 % DW) and G. manilaensis (33.02 ± 1.11 % DW) (Table 4.1). Among the
green seaweeds, the reducing sugar contents from U. reticulata (27.11 ± 1.98 % DW) and
Bryopsis (23.16 ± 6.12 % DW) were the highest whereas the lowest value was detected
in Halimeda (10.16 ± 4.19 % DW). Within red seaweeds, K. alvarezii and G. manilaensis
showed higher reducing sugar contents, 34.12 ± 1.09 % and 33.02 ± 1.11% respectively.
The lowest value of reducing sugar was recorded in G. salicornia (16.19 ± 2.05 % DW).
The lowest amount of reducing sugars were detected in brown seaweeds, where the
highest value was detected in S. baccularia (14.48 ± 0.49 % DW) and Turbinaria (13.63
± 2.33 % DW) but the lowest was detected in S. binderi (5.17 ± 3.71% DW).
4.1.4 Neutral sugars
The monosaccharide composition of selected seaweed species is shown in Table 4.2.
Glucose and galactose were found in all seaweeds and ranged from 8.93 ± 1.49 to 159.60
± 9.83 mg g -1 DW and 7.77 ± 0.04 to 262.28 ± 25.09 mg g -1 DW respectively. In this
study, fucose was only detected in brown seaweeds. Of the green seaweeds, U. reticulata
(159.60 ± 9.83 mg g-1 glucose), U. flexuosa (97.25 ± 3.66 mg g-1 glucose) and
Cladophora sp. (68.62 ± 2.48 mg g-1 galactose) are suitable seaweeds; while of the red
seaweeds, G. changii (288.51 ± 29.36 mg g-1 galactose), G. manilaensis (262.28 ± 2.48
mg g-1 galactose) and K. alvarezii (253.96 ± 19.41 mg g-1 galactose) are best. The brown
seaweeds showed low glucose and galactose contents.
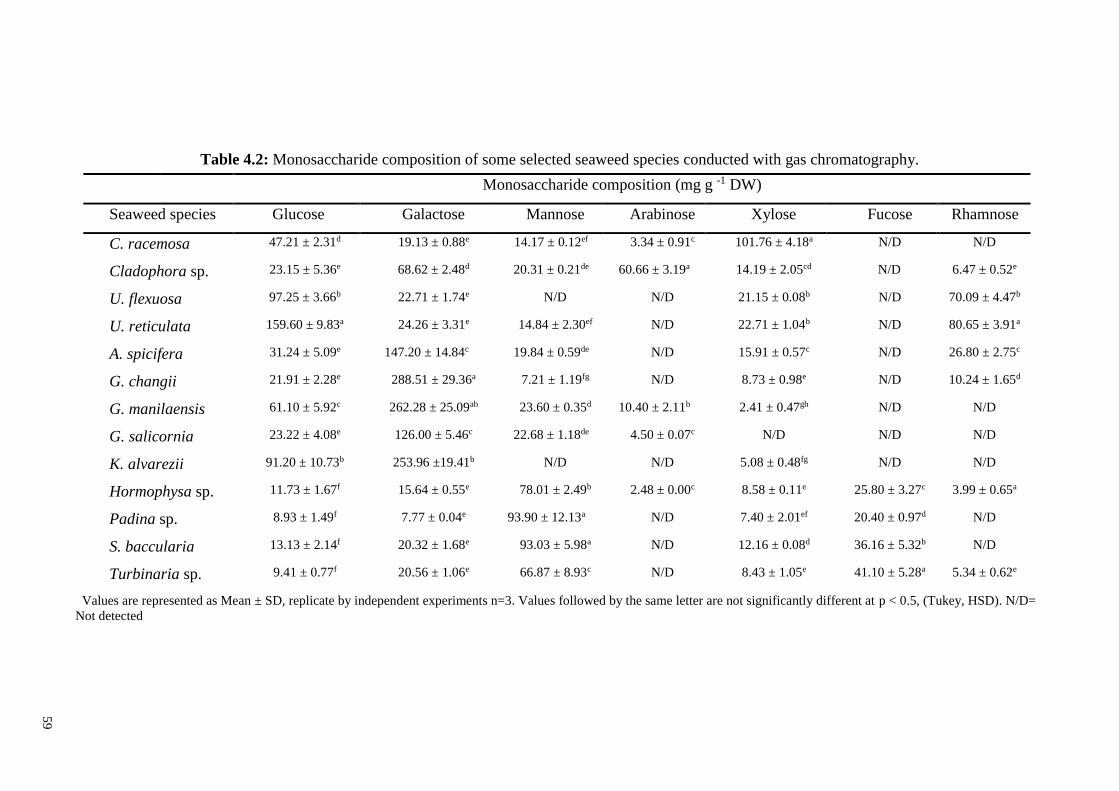
59
Table 4.2: Monosaccharide composition of some selected seaweed species conducted with gas chromatography.
Values are represented as Mean ± SD, replicate by independent experiments n=3. Values followed by the same letter are not significantly different at p < 0.5, (Tukey, HSD). N/D=
Not detected
Monosaccharide composition (mg g -1 DW)
Seaweed species Glucose Galactose Mannose Arabinose Xylose Fucose Rhamnose
C. racemosa 47.21 ± 2.31d 19.13 ± 0.88e 14.17 ± 0.12ef 3.34 ± 0.91c 101.76 ± 4.18a N/D N/D
Cladophora sp. 23.15 ± 5.36e 68.62 ± 2.48d 20.31 ± 0.21de 60.66 ± 3.19a 14.19 ± 2.05cd N/D 6.47 ± 0.52e
U. flexuosa 97.25 ± 3.66b 22.71 ± 1.74e N/D N/D 21.15 ± 0.08b N/D 70.09 ± 4.47b
U. reticulata 159.60 ± 9.83a 24.26 ± 3.31e 14.84 ± 2.30ef N/D 22.71 ± 1.04b N/D 80.65 ± 3.91a
A. spicifera 31.24 ± 5.09e 147.20 ± 14.84c 19.84 ± 0.59de N/D 15.91 ± 0.57c N/D 26.80 ± 2.75c
G. changii 21.91 ± 2.28e 288.51 ± 29.36a 7.21 ± 1.19fg N/D 8.73 ± 0.98e N/D 10.24 ± 1.65d
G. manilaensis 61.10 ± 5.92c 262.28 ± 25.09ab 23.60 ± 0.35d 10.40 ± 2.11b 2.41 ± 0.47gh N/D N/D
G. salicornia 23.22 ± 4.08e 126.00 ± 5.46c 22.68 ± 1.18de 4.50 ± 0.07c N/D N/D N/D
K. alvarezii 91.20 ± 10.73b 253.96 ±19.41b N/D N/D 5.08 ± 0.48fg N/D N/D
Hormophysa sp. 11.73 ± 1.67f 15.64 ± 0.55e 78.01 ± 2.49b 2.48 ± 0.00c 8.58 ± 0.11e 25.80 ± 3.27c 3.99 ± 0.65a
Padina sp. 8.93 ± 1.49f 7.77 ± 0.04e 93.90 ± 12.13a N/D 7.40 ± 2.01ef 20.40 ± 0.97d N/D
S. baccularia 13.13 ± 2.14f 20.32 ± 1.68e 93.03 ± 5.98a N/D 12.16 ± 0.08d 36.16 ± 5.32b N/D
Turbinaria sp. 9.41 ± 0.77f 20.56 ± 1.06e 66.87 ± 8.93c N/D 8.43 ± 1.05e 41.10 ± 5.28a 5.34 ± 0.62e
59
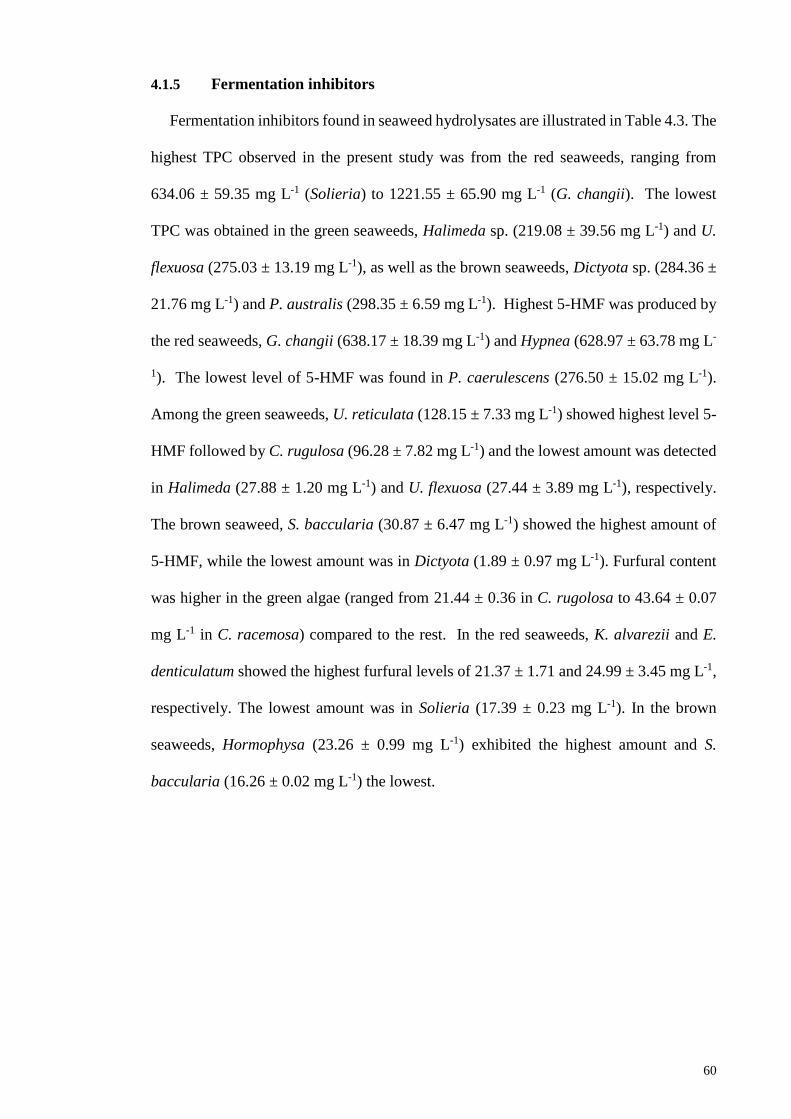
60
4.1.5 Fermentation inhibitors
Fermentation inhibitors found in seaweed hydrolysates are illustrated in Table 4.3. The
highest TPC observed in the present study was from the red seaweeds, ranging from
634.06 ± 59.35 mg L-1 (Solieria) to 1221.55 ± 65.90 mg L-1 (G. changii). The lowest
TPC was obtained in the green seaweeds, Halimeda sp. (219.08 ± 39.56 mg L-1) and U.
flexuosa (275.03 ± 13.19 mg L-1), as well as the brown seaweeds, Dictyota sp. (284.36 ±
21.76 mg L-1) and P. australis (298.35 ± 6.59 mg L-1). Highest 5-HMF was produced by
the red seaweeds, G. changii (638.17 ± 18.39 mg L-1) and Hypnea (628.97 ± 63.78 mg L-
1). The lowest level of 5-HMF was found in P. caerulescens (276.50 ± 15.02 mg L-1).
Among the green seaweeds, U. reticulata (128.15 ± 7.33 mg L-1) showed highest level 5-
HMF followed by C. rugulosa (96.28 ± 7.82 mg L-1) and the lowest amount was detected
in Halimeda (27.88 ± 1.20 mg L-1) and U. flexuosa (27.44 ± 3.89 mg L-1), respectively.
The brown seaweed, S. baccularia (30.87 ± 6.47 mg L-1) showed the highest amount of
5-HMF, while the lowest amount was in Dictyota (1.89 ± 0.97 mg L-1). Furfural content
was higher in the green algae (ranged from 21.44 ± 0.36 in C. rugolosa to 43.64 ± 0.07
mg L-1 in C. racemosa) compared to the rest. In the red seaweeds, K. alvarezii and E.
denticulatum showed the highest furfural levels of 21.37 ± 1.71 and 24.99 ± 3.45 mg L-1,
respectively. The lowest amount was in Solieria (17.39 ± 0.23 mg L-1). In the brown
seaweeds, Hormophysa (23.26 ± 0.99 mg L-1) exhibited the highest amount and S.
baccularia (16.26 ± 0.02 mg L-1) the lowest.

61
Table 4.3: Composition of some fermentation inhibitors including 5-
hydroxymethylfurfural, (5-HMF); furfural and total phenolic compounds (TPC) in
hydrolysates obtained from saccharification of selected tropical seaweeds. Amount (mg L-1 in hydrolysate)
5-HMF Furfural TPC
Ch
loro
ph
yta
Bryopsis sp. 81.08 ± 25.43 fg 30.14 ± 2.48 b 764.61 ± 98.91 bcdefgh
Caulerpa racemosa 64.97 ± 28.22 fg 43.64 ± 0.07 a 447.54 ± 72.52 ijklm
C. lentillifera 53.04 ± 3.63 fg 46.30 ± 2.16 a 508.17 ± 158.26 hijklm
C. serrulata 48.39 ± 9.57 fg 46.83 ± 1.42 a 671.36 ±217.60 efghijk
C. sertularioides 67.15 ± 10.02 fg 34.11 ± 1.37 b 680.68 ± 19.78 efghij
Chaetomorpha sp. 66.26 ± 14.08 fg 24.37 ± 0.05 cd 904.49 ± 72.53 bcdef
Cladophora rugulosa 96.28 ± 7.82 fg 21.44±0.36 cdefgh 937.13 ± 39.56 abcde
Halimeda sp. 27.88 ± 1.20 fg 21.37 ± 1.35 cdefg 219.08 ± 39.56 m
Ulva flexuosa 27.44 ± 3.89 fg 20.56 ±0.65 defghi 275.03 ± 13.19 m
U. intestinalis 46.69 ± 18.91 fg 33.31 ± 2.50 b 330.99 ± 29.10 lm
U. reticulata 128.15 ± 7.33 f 22.92 ± 3.67 cde 927.80 ± 118.69 abcd
Rh
od
op
hy
ta
Acanthophora spicifera 482.06 ± 115.56 bc 21.63±0.99 cdefgh 955.78 ± 52.75 abcde
Eucheuma denticulatum 561.85 ± 88.89 ab 24.99 ± 3.45 c 1044.37 ± 164.85 ab
Gracilaria changii 638.17 ± 18.39 a 18.82 ± 0.45 ghij 1221.55 ± 65.90 a
G. edulis 505.21 ± 18.52 bc 19.33 ± 1.13 fghij 1053.70 ± 32.97 ab
G. manilaensis 411.67 ± 90.51 cd 20.04 ± 0.32 efghij 913.82 ± 72.53 bcdef
G. salicornia 435.82 ± 59.24 cd 19.40 ± 0.14 fghij 904.49 ± 138.47 bcdef
Hypnea sp. 628.97 ± 63.78 a 19.61 ± 0.19 efghij 988.42± 19.78 abc
Kappaphycus alvarezii 586.23 ± 61.74 ab 21.37±1.71 cdefgh 685.35 ± 131.88 defghij
Pterocladiella
caerulescens
276.50 ± 15.02 e 22.00 ± 2.90 cdefg 1024.25 ± 134.25 ab
Soleria sp. 329.35 ± 29.36 de 17.39 ± 0.23 hij 634.06 ± 59.35 fghijk
Ph
aop
hy
ta
Dictyota sp. 1.89 ± 0.97 g 16.35 ± 0.02 j 284.36 ± 21.76 lm
Hormophysa sp. 7.35 ± 1.30 g 23.26 ± 0.99 cdef 340.31 ± 39.56 klm
Lobophora variegata 2.78 ± 1.27 g 21.93 ± 0.56 cdefg 424.31 ± 88.25 ijklm
Padina australis 3.72 ± 2.92 g 16.39 ± 0.07 ij 298.35 ± 6.59 lm
Sargassum baccularia 30.87 ± 6.47 fg 16.26 ± 0.02 j 708.66 ± 19.78 cdefghi
S. binderi 4.75 ± 1.07 g 21.84±0.29 cdefgh 821.70 ± 76.40 bcdefg
Turbinaria conoides 4.89 ± 0.16 g 21.74±0.11 cdefgh 400.93 ± 59.35 jklm
T. ornata 7.99 ± 3.11 g 21.53 ± 1.67 cdefg 573.44 ± 79.13 ghijkl
Thermal-acidic treatment using1%w v-1 sulphuric acid; incubation time 1 h, at 121 °C; ratio of solid: liquid= 1:20. Values are
represented as Mean ± SD, replicate by independent experiments n=3. Values followed by the same letter are not significantly different at p < 0.5, (Tukey, HSD).
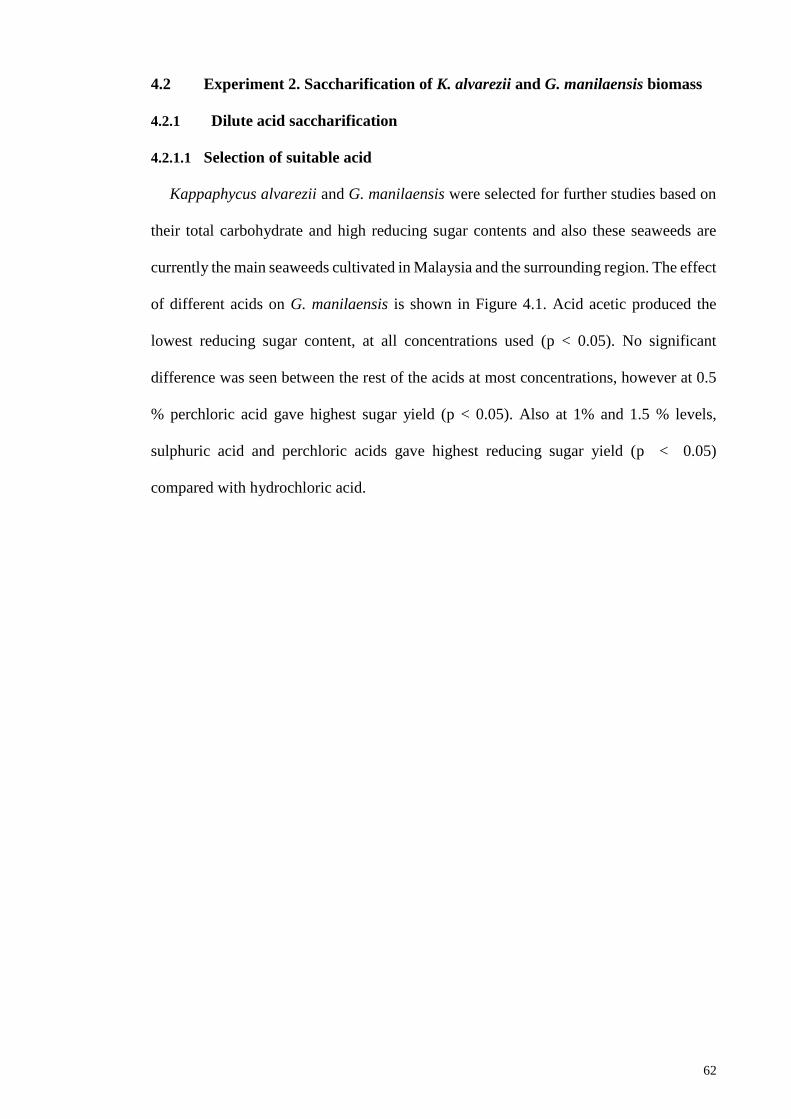
62
4.2 Experiment 2. Saccharification of K. alvarezii and G. manilaensis biomass
4.2.1 Dilute acid saccharification
4.2.1.1 Selection of suitable acid
Kappaphycus alvarezii and G. manilaensis were selected for further studies based on
their total carbohydrate and high reducing sugar contents and also these seaweeds are
currently the main seaweeds cultivated in Malaysia and the surrounding region. The effect
of different acids on G. manilaensis is shown in Figure 4.1. Acid acetic produced the
lowest reducing sugar content, at all concentrations used (p < 0.05). No significant
difference was seen between the rest of the acids at most concentrations, however at 0.5
% perchloric acid gave highest sugar yield (p < 0.05). Also at 1% and 1.5 % levels,
sulphuric acid and perchloric acids gave highest reducing sugar yield (p < 0.05)
compared with hydrochloric acid.
63
Figure 4.1: Effect of four different acids on saccharification of G. manilaensis samples
under different concentrations (0.5 – 5 % w v-1) and incubation time of 60 min, at 121 °C.
(Hydrochloric acid ♦; Sulphuric acid ●; Perchloric acid ▲, Acetic acid ■). Mean ± SD:
n=3. Means with different letter are significantly different at each acid concentration level
(p < 0.5, Tukey, HSD).
a
a
ab
a
a
ab
a a
a a
c
cc b
bb b
b
b bb
a
a a a a
a
a
a
b
b b
a
a
a
a
a
a
0
100
200
300
400
0.5% 1.0% 1.5% 2.0% 2.5% 3.0% 3.5% 4.0% 4.5% 5.0%
Red
uci
ng
Su
ga
r (m
g g
-1D
W)
Acid concentration (% w v-1)
Perchloric Acid
Acetic acid
Sulfuric Acid
Hydrochloric Acid
64
4.2.1.2 Fresh vs dry biomass
Figure 4.2 shows the effect of biomass physical condition on hydrolysis yield at
different acid concentrations. At 1 %, 2.5 % and 3% sulphuric acid concentrations, dry
biomass yielded higher than fresh biomass ( p < 0.5) and the bigger difference was seen
at acid concentrations of 1.5 % and 2 % sulphuric acid (p < 0.01). No significant
difference was seen in other acid concentrations between dry and fresh biomass (p >
0.05).
Figure 4.2: Evaluation of the effect of biomass (G. manilaensis) condition (Dry ● Fresh
■) on the yield of saccharification. Mean ± SD, n=3, Independent t-Test df 4, p < 0.05 *,
p < 0.01 ** .
* ****
**
0
100
200
300
400
500
0.0% 0.5% 1.0% 1.5% 2.0% 2.5% 3.0% 3.5% 4.0% 4.5% 5.0%
Red
uci
ng s
ugar
s (m
g g
-1D
W)
Acid Concentration (w v-1)
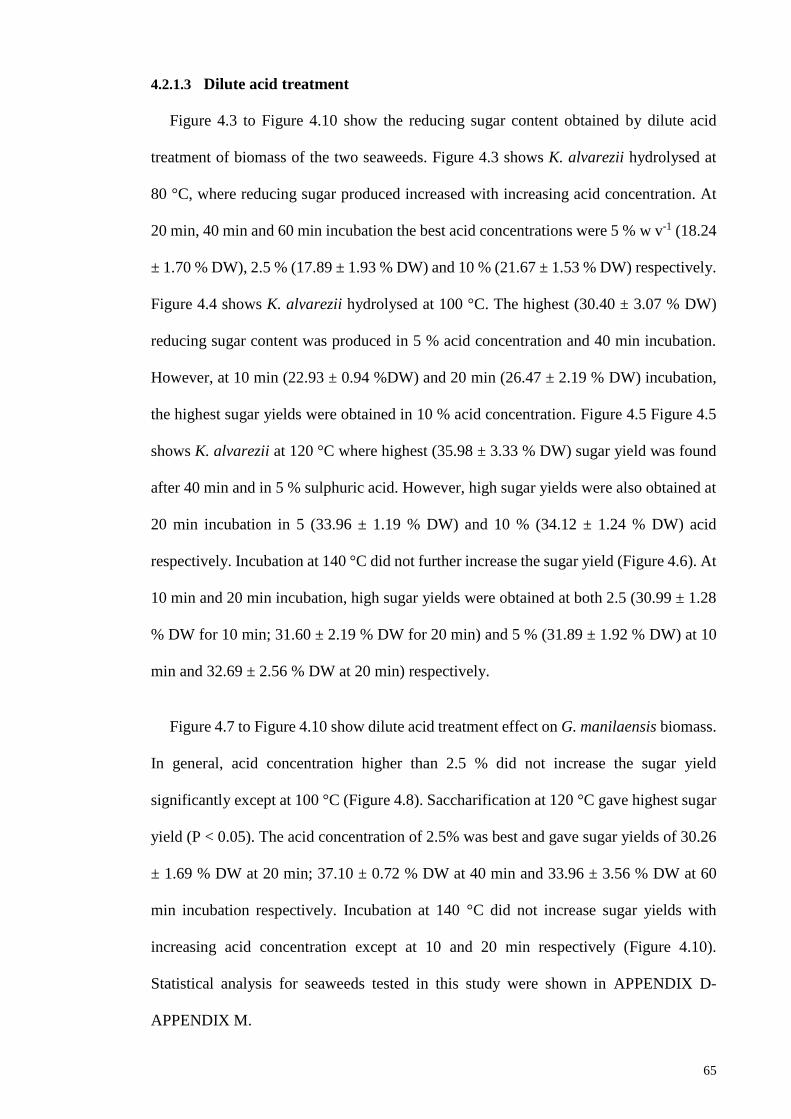
65
4.2.1.3 Dilute acid treatment
Figure 4.3 to Figure 4.10 show the reducing sugar content obtained by dilute acid
treatment of biomass of the two seaweeds. Figure 4.3 shows K. alvarezii hydrolysed at
80 °C, where reducing sugar produced increased with increasing acid concentration. At
20 min, 40 min and 60 min incubation the best acid concentrations were 5 % w v-1 (18.24
± 1.70 % DW), 2.5 % (17.89 ± 1.93 % DW) and 10 % (21.67 ± 1.53 % DW) respectively.
Figure 4.4 shows K. alvarezii hydrolysed at 100 °C. The highest (30.40 ± 3.07 % DW)
reducing sugar content was produced in 5 % acid concentration and 40 min incubation.
However, at 10 min (22.93 ± 0.94 %DW) and 20 min (26.47 ± 2.19 % DW) incubation,
the highest sugar yields were obtained in 10 % acid concentration. Figure 4.5 Figure 4.5
shows K. alvarezii at 120 °C where highest (35.98 ± 3.33 % DW) sugar yield was found
after 40 min and in 5 % sulphuric acid. However, high sugar yields were also obtained at
20 min incubation in 5 (33.96 ± 1.19 % DW) and 10 % (34.12 ± 1.24 % DW) acid
respectively. Incubation at 140 °C did not further increase the sugar yield (Figure 4.6). At
10 min and 20 min incubation, high sugar yields were obtained at both 2.5 (30.99 ± 1.28
% DW for 10 min; 31.60 ± 2.19 % DW for 20 min) and 5 % (31.89 ± 1.92 % DW) at 10
min and 32.69 ± 2.56 % DW at 20 min) respectively.
Figure 4.7 to Figure 4.10 show dilute acid treatment effect on G. manilaensis biomass.
In general, acid concentration higher than 2.5 % did not increase the sugar yield
significantly except at 100 °C (Figure 4.8). Saccharification at 120 °C gave highest sugar
yield (P < 0.05). The acid concentration of 2.5% was best and gave sugar yields of 30.26
± 1.69 % DW at 20 min; 37.10 ± 0.72 % DW at 40 min and 33.96 ± 3.56 % DW at 60
min incubation respectively. Incubation at 140 °C did not increase sugar yields with
increasing acid concentration except at 10 and 20 min respectively (Figure 4.10).
Statistical analysis for seaweeds tested in this study were shown in APPENDIX D-
APPENDIX M.
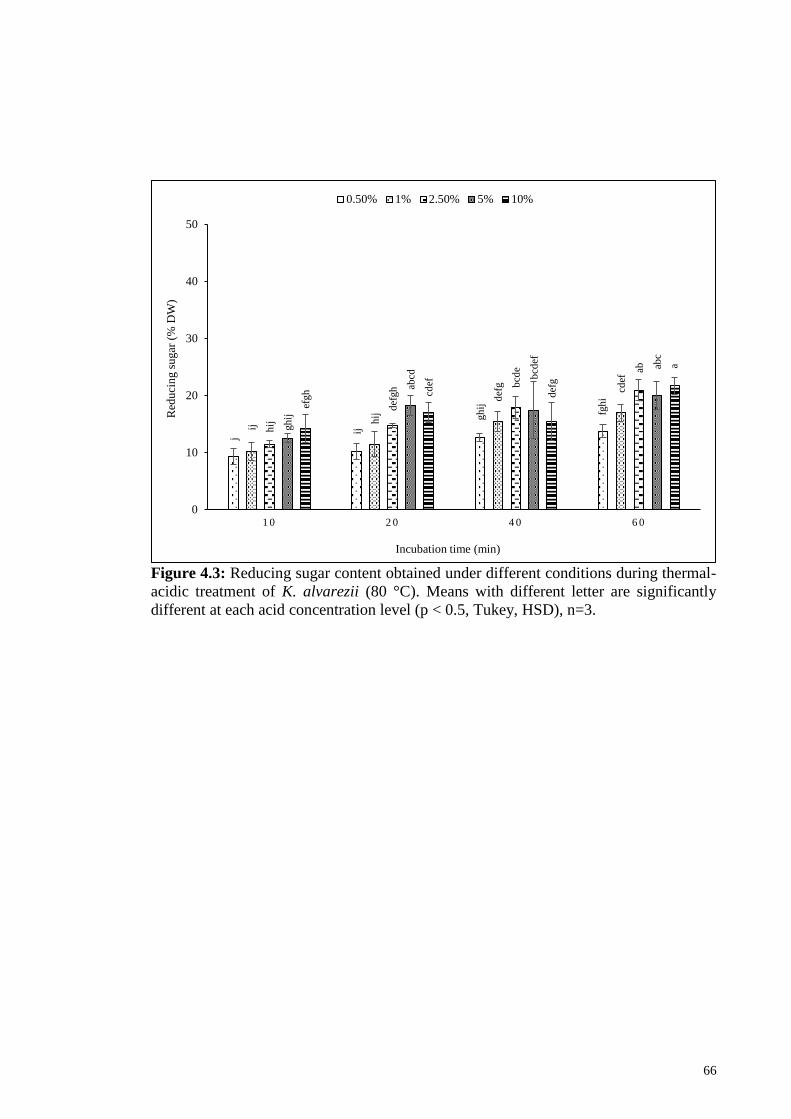
66
Figure 4.3: Reducing sugar content obtained under different conditions during thermal-
acidic treatment of K. alvarezii (80 °C). Means with different letter are significantly
different at each acid concentration level (p < 0.5, Tukey, HSD), n=3.
j
ij
gh
ij
fgh
i
ij
hij
def
g
cdef
hij
def
gh b
cde ab
gh
ij
abcd b
cdef
abc
efgh cd
ef
def
g
a
0
10
20
30
40
50
1 0 2 0 4 0 6 0
Red
uci
ng s
ugar
(%
DW
)
Incubation time (min)
0.50% 1% 2.50% 5% 10%
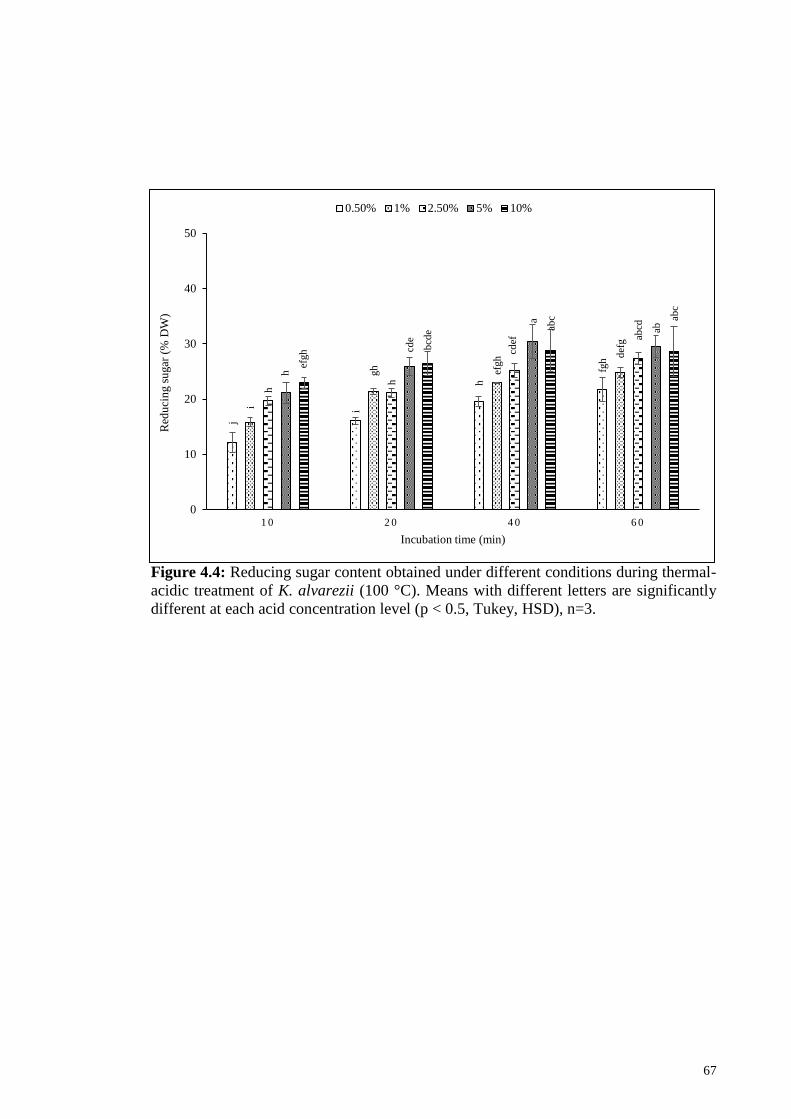
67
Figure 4.4: Reducing sugar content obtained under different conditions during thermal-
acidic treatment of K. alvarezii (100 °C). Means with different letters are significantly
different at each acid concentration level (p < 0.5, Tukey, HSD), n=3.
j
i
h
fgh
i
gh efgh d
efg
h
h
cdef ab
cd
h
cde
a
ab
efgh b
cde ab
c abc
0
10
20
30
40
50
1 0 2 0 4 0 6 0
Red
uci
ng s
ugar
(%
DW
)
Incubation time (min)
0.50% 1% 2.50% 5% 10%
68
Figure 4.5: Reducing sugar content obtained under different conditions during thermal-
acidic treatment of K. alvarezii (120 °C). Means with different letter are significantly
different at each acid concentration level (p < 0.5, Tukey, HSD), n=3.
i
gh ef
g def
g
hi
cdef
g
cdef bcd
e
hi
cdef
g
a abc
def
g abc
ab
cdef
g
def
g abc
bcd
fg
0
10
20
30
40
50
1 0 2 0 4 0 6 0
Red
uci
ng s
ugar
(%
DW
)
Incubation time (min)
0.50% 1% 2.50% 5% 10%

69
Figure 4.6: Reducing sugar content obtained under different conditions during thermal-
acidic treatment of K. alvarezii (140 °C). Means with different letter are significantly
different at each acid concentration level (p < 0.5, Tukey, HSD), n=3.
f
def
abcd ab
ef def
abc d
ef
abcd
abc a
abcd
e
abc ab
abc
def
def b
cde
ef f
0
10
20
30
40
50
1 0 2 0 4 0 6 0
Red
uci
ng s
ugar
(%
DW
)
Incubation time (min)
0.50% 1% 2.50% 5% 10%
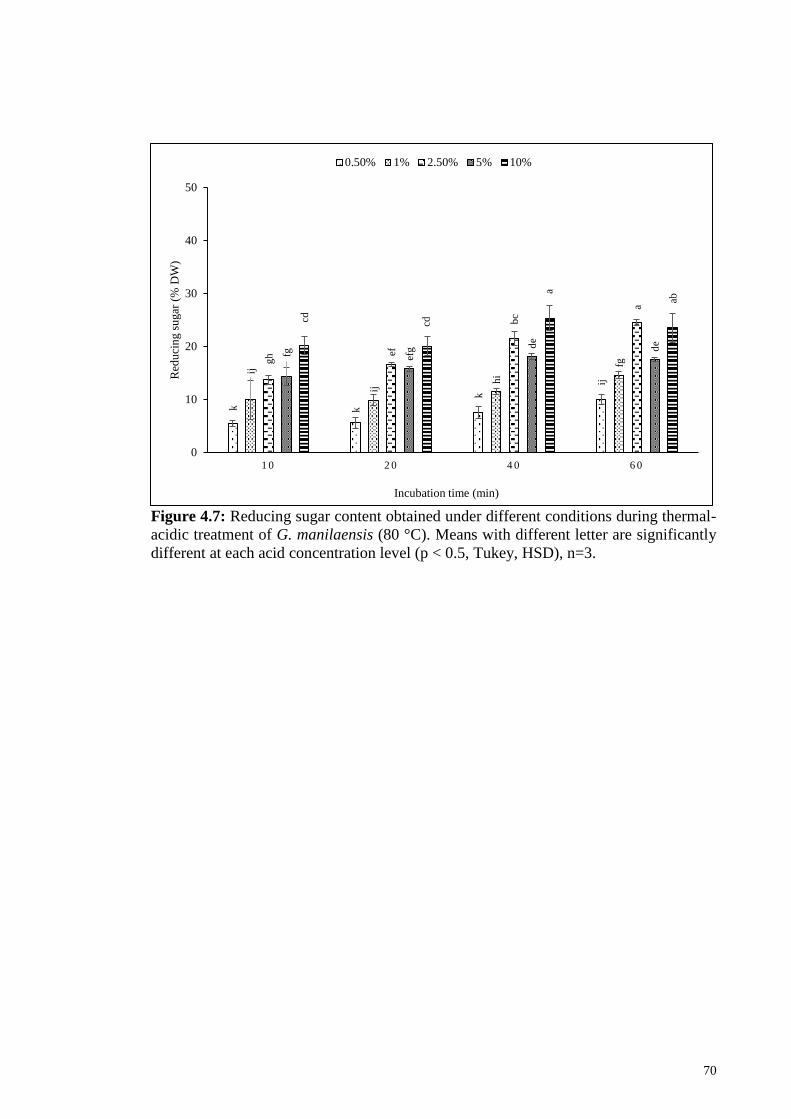
70
Figure 4.7: Reducing sugar content obtained under different conditions during thermal-
acidic treatment of G. manilaensis (80 °C). Means with different letter are significantly
different at each acid concentration level (p < 0.5, Tukey, HSD), n=3.
k k
k
ij
ij
ij
hi
fggh ef
bc
a
fg efg d
e
de
cd cd
a
ab
0
10
20
30
40
50
1 0 2 0 4 0 6 0
Red
uci
ng s
ugar
(%
DW
)
Incubation time (min)
0.50% 1% 2.50% 5% 10%

71
Figure 4.8: Reducing sugar content obtained under different conditions during thermal-
acidic treatment of G. manilaensis (100 °C), Means with different letter are significantly
different at each acid concentration level (p < 0.5, Tukey, HSD), n=3.
k
jk
hi
gh
ij
gh
def
g cde
fgh efg
cdef
c
efgh cd
b
a
gh g
h
b a
0
10
20
30
40
50
1 0 2 0 4 0 6 0
Red
uci
ng s
ugar
(%
DW
)
Incubation time (min)
0.50% 1% 2.50% 5% 10%
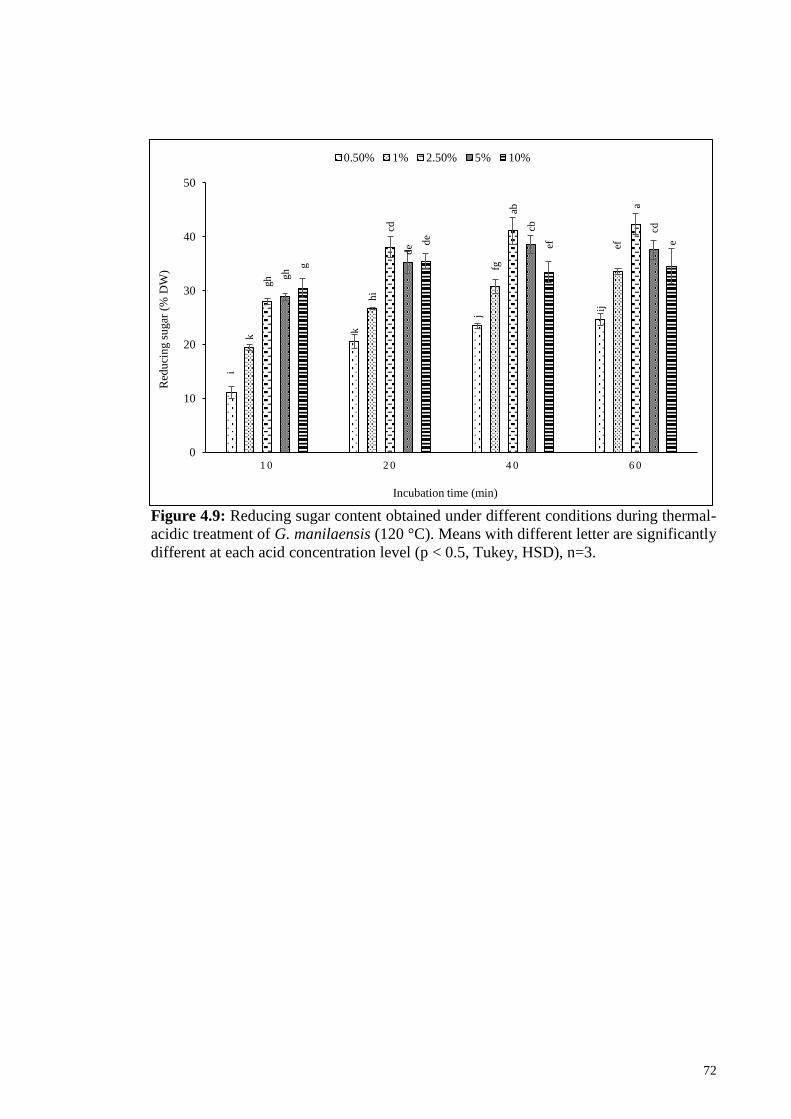
72
Figure 4.9: Reducing sugar content obtained under different conditions during thermal-
acidic treatment of G. manilaensis (120 °C). Means with different letter are significantly
different at each acid concentration level (p < 0.5, Tukey, HSD), n=3.
i
k
j
ij
k
hi
fg
ef
gh
cd
ab
a
gh
de
cb cd
g
de
ef e
0
10
20
30
40
50
1 0 2 0 4 0 6 0
Red
uci
ng s
ugar
(%
DW
)
Incubation time (min)
0.50% 1% 2.50% 5% 10%
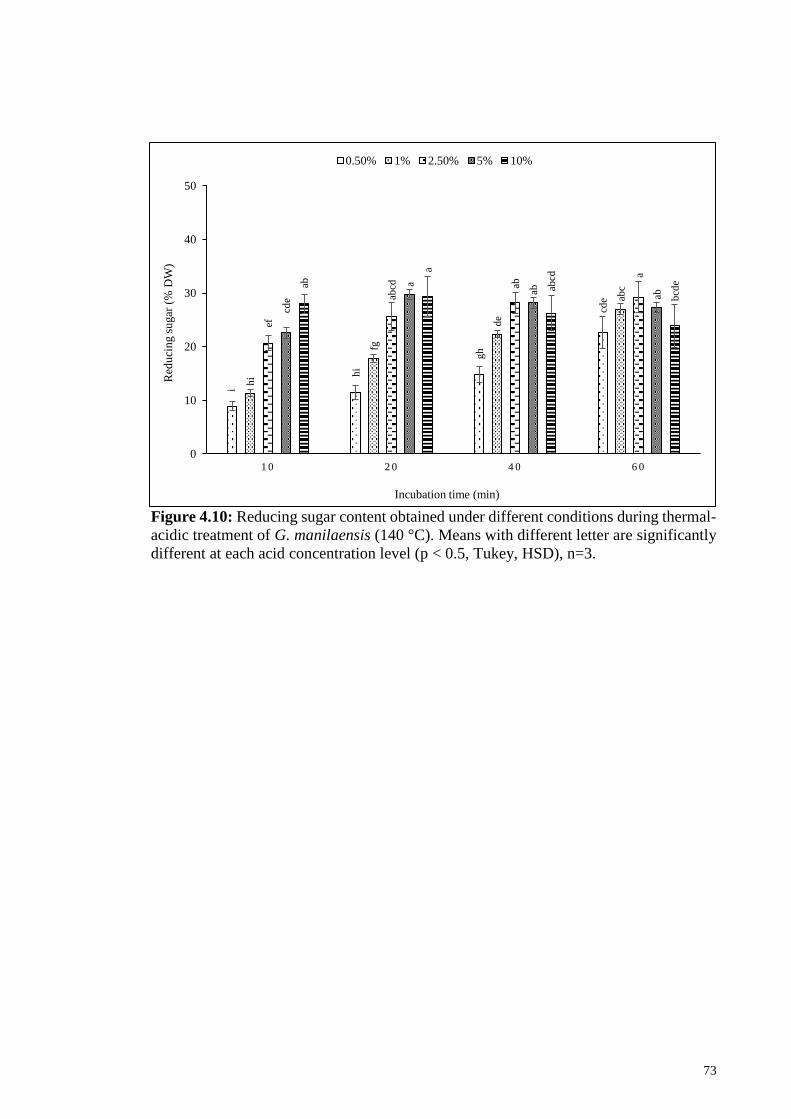
73
Figure 4.10: Reducing sugar content obtained under different conditions during thermal-
acidic treatment of G. manilaensis (140 °C). Means with different letter are significantly
different at each acid concentration level (p < 0.5, Tukey, HSD), n=3.
i
hi
gh
cde
hi
fg
de
abc
ef
abcd ab
a
cde
a
ab ab
ab
a
abcd
bcd
e
0
10
20
30
40
50
1 0 2 0 4 0 6 0
Red
uci
ng s
ugar
(%
DW
)
Incubation time (min)
0.50% 1% 2.50% 5% 10%
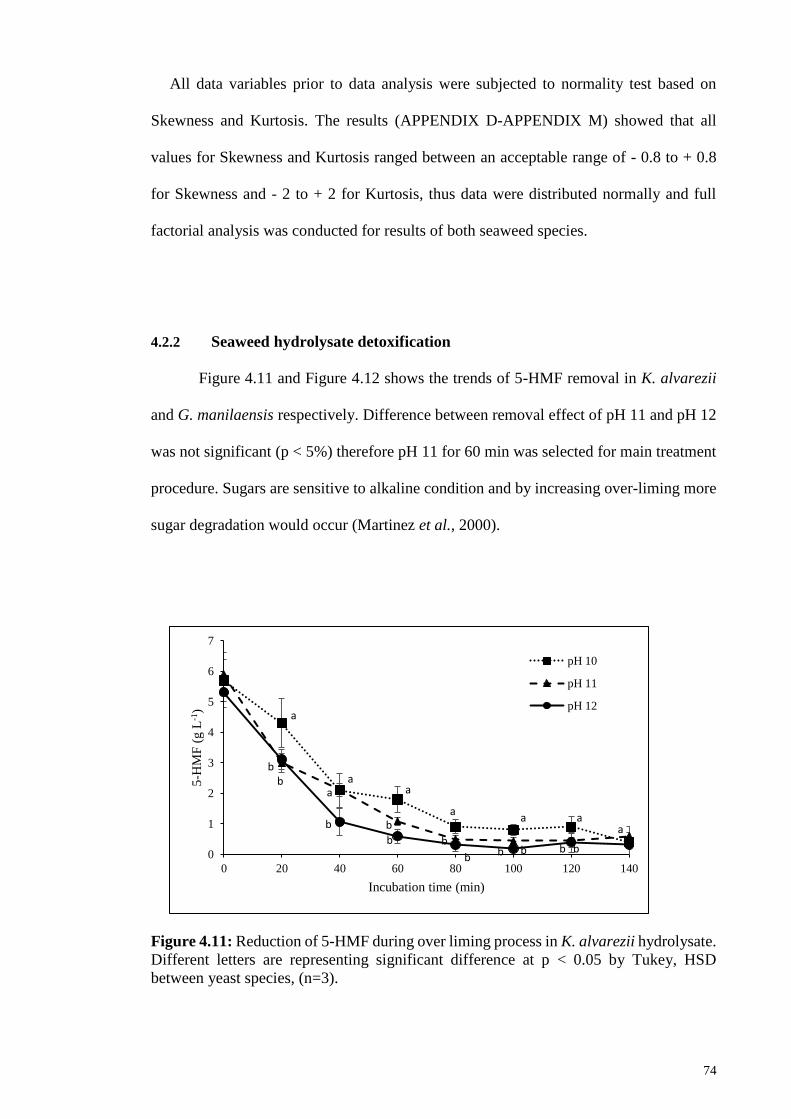
74
All data variables prior to data analysis were subjected to normality test based on
Skewness and Kurtosis. The results (APPENDIX D-APPENDIX M) showed that all
values for Skewness and Kurtosis ranged between an acceptable range of - 0.8 to + 0.8
for Skewness and - 2 to + 2 for Kurtosis, thus data were distributed normally and full
factorial analysis was conducted for results of both seaweed species.
4.2.2 Seaweed hydrolysate detoxification
Figure 4.11 and Figure 4.12 shows the trends of 5-HMF removal in K. alvarezii
and G. manilaensis respectively. Difference between removal effect of pH 11 and pH 12
was not significant (p < 5%) therefore pH 11 for 60 min was selected for main treatment
procedure. Sugars are sensitive to alkaline condition and by increasing over-liming more
sugar degradation would occur (Martinez et al., 2000).
Figure 4.11: Reduction of 5-HMF during over liming process in K. alvarezii hydrolysate.
Different letters are representing significant difference at p < 0.05 by Tukey, HSD
between yeast species, (n=3).
0
1
2
3
4
5
6
7
0 20 40 60 80 100 120 140
5-H
MF
(g L
-1)
Incubation time (min)
pH 10
pH 11
pH 12a
b a
b
b
a a
b
b
a
b
b
a
bb
a
bb
a
75
Figure 4.12: Reduction of 5-HMF during over liming process in G. manilaensis
hydrolysate. Different letters are representing significant difference at p < 0.05 by Tukey,
HSD (n = 3).
4.2.3 Enzyme-based saccharification
4.2.3.1 Optimization of the enzyme dosage
Figure 4.13 illustrates the hydrolysis of G. manilaensis dilute acid treatment residues
by different ratio of cellulase enzyme (CTech 2). In general, amount of 2 % w w-1 and 5
% w w-1 showed same hydrolytic effectiveness and similarly 10 and 20 % w w-1 did not
show significant differences (p > 0.05). Highest yield (87.5 % conversion) was achieved
after 48 h in the sample with 20 % w w-1 enzyme where the yield of the sample with 10
% w w-1 enzyme was 85.5 % and no significant difference was observed (p > 0.05).
Highest yield in 2 % enzyme was 82.5 % and 87.5 % for 5 % enzyme loading after 72 h
incubation.
0
1
2
3
4
5
6
7
0 20 40 60 80 100 120 140
5-H
MF
(g L
-1)
Incubation time (min)
pH 10
pH 11
pH 12
a
a
b
ab
a
a
a
b
b
a
ab
b
a
ab
b
a
ab
b
a
b
76
Figure 4.13: Enzymatic hydrolysis of G. manilaensis residues by different cellulase
concentration loading. Different letters are representing significant difference at p <
0.05 by Tukey, HSD (n = 3).
4.2.3.2 Optimization of liquid: biomass ratio
Figure 4.14 illustrates the effect of the ratio of liquid to seaweed biomass on enzymatic
hydrolysis yield and glucose concentration in the hydrolysate. In ration of 2.5 : 1 no
reducing sugar was produced also 5.31 % w w-1 glucose was produced after 3 days
incubation in sample with liquid: biomass ratio 5 :1. Highest hydrolysis yield was
achieved in liquid: biomass ratio 10 : 1 where 85.12 % of biomass was converted to
glucose, whereas highest glucose concentration 20.89 % w v-1 was achieved in sample
with liquid: biomass ratio 7.5 : 1.
0
10
20
30
40
50
60
70
80
90
100
0 10 20 30 40 50 60 70 80
Hyd
roly
sis
Yie
ld (
%)
Time (h)
2%
5%
10%
20%
a
a
b
b
a
a
b
b
a
b
c
c
a
a
b
b
a
b
a
b
aa
bb
aaaa

77
Figure 4.14: Effect of ratio of liquid to biomass (G. manilaensis cellulosic residues) in
hydrolysis yield and final glucose concentration.
4.2.4 Preparation of seaweed hydrolysate for fermentation study
4.2.4.1 Dilute acid-based hydrolysis
The process of dilute acid treatment for two seaweed species was conducted by
optimized condition, includes, using 2.5 % w v-1, biomass: acid ratio 1:8, incubation time
and temperature of 40 min and 120 °C respectively. Hydrolysates were filtered and
detoxified by over-liming treatment using Ca (OH) 2. Material balance during the process
of hydrolysis and detoxification is illustrated in Table 4.4.
Table 4.5 presents the effect of over-liming on sugar and main fermentation inhibitor
in two seaweed hydrolysates. 5-HMF content in G. manilaensis and K. alvarezii
hydrolyzate were reduced 62.15 % and 76.98 %, respectively. Over-liming also reduced
the amount of sugar in both G. manilaensis and K. alvarezii hydrolyzate by 11.43 % and
10.88 %, respectively. The volume of hydrolyzate in both specimens is also decreased
because of absorption of liquid to dry Ca (OH)2.
0
5
10
15
20
25
0
10
20
30
40
50
60
70
80
90
100
2.5 5 7.5 10
Glu
cose
Co
nc
(% w
v-1
)
Hyd
roly
sis
yil
ed (
% w
w-1
)
Liquid / Biomass (v w-1) Ratio
Hydrolysis Yield %
Glocose Conc. %
78
Table 4.4: Material balance obtained during dilute acid hydrolysis treatment for
fermentation study. Seaweed spp. K. alvarezii G. manilaensis
Before Hydrolysis Initial Biomass (g) 100 ± 0.00 100 ± 0.00
Sulphuric acid added (mL) 800 ± 0.00 800 ± 0.00
Hydrolysis Process Recovered Hyd (mL) 580.33 ± 3.51 680.67 ± 9.02
Hyd Sugar Conc (g L-1) 58.81 ± 1.33 56.29 ± 2.75
Produced Sugar (g) 34.13 ± 0.60 38.30 ± 1.43
After
Detoxification
Process
Detoxified Hyd Vol (mL) 489.67 ± 8.50 615.00 ± 6.24
Detoxified Hyd Sugar Conc (g L-1) 61.28 ± 2.98 55.77 ± 3.28
Vol Hyd Loss (mL) 72.00 ± 3.46 72.00 ± 3.46
Vol Hyd Loss (%) 12.41 ± 0.60 10.58 ± 0.40
Sugar Recovered (g) 29.99 ± 0.94 34.28 ± 1.71
Sugar Loss (g) 4.14 ± 0.54 4.02 ± 0.32
Sugar Loss (%) 12.14 ± 1.68 10.51 ± 1.19
Hyd: Hydrolysate, Vol: Volume
Table 4.5: Effect of over-liming treatment to remove fermentation inhibitors on two
seaweed hydrolysates. Before treatment
g L-1
After treatment
g L-1
Decrease
%
K. alvarezii Reducing sugar 58.18 ± 1.33 61.28 ± 2.98 12.14 ± 1.68
5- HMF 5.68 ± 0.41 1.42 ± 0.42 79.23 ± 4.35
Furfural 0.46 ± 0.07 0.31± 0.05 42.63 ± 6.39
Phenolic compounds 3.88 ± 0.67 1.96 ± 0.73 54.59 ± 23.79
G. manilaensis Reducing sugar 56.29 ± 2.75 55.77 ± 3.28 10.51 ± 1.19
5- HMF 5.24 ± 0.79 1.30 ± 0.17 77.16 ± 5.04
Furfural 0.76 ± 0.14 0.52 ± 0.17 36.99 ± 22.57
Phenolic compounds 3.17 ± 1.02 1.05 ± 0.09 68.26 ± 8.08
The hydrolysates were adjusted to pH 11 by adding Ca(OH)2 and were shaken for 30 min at 30 °C, Mean
± SD, n = 3.
4.2.4.2 Enzyme-based hydrolysis
Table 4.6 illustrates the enzymatic hydrolysis of residues of the two seaweeds, after
dilute acid treatment. Seven g of each residue were used in this experiment and results
were used to calculate the potential amount of sugar that can be generated (Table 4.7).
79
Table 4.6: Results of enzymatic hydrolysis of two seaweeds by dilute acid treatment
residues from 7 g DW residue. K. alvarezii
G. manilaensis
Initial Residue used (g) 7.00 ± 0
7.00 ± 0
Ash % 8.75 ± 0.54 ns
7.03 ± 0.19 ns
Ash Free DW (g) 6.38 ± 0.43 ns
6.90 ± 0.73 ns
Total Buffer (mL) 50 ± 0
50 ± 0
Recovered Hyd (mL) 44.17 ± 2.25 ns
45.77 ± 1.66 ns
Hyd Sugar Conc (g L-1) 120.33 ± 10.97 ns
105.67 ± 4.16 ns
Produced Sugar (g) 5.30 ± 0.24 ns
4.83 ± 0.08 ns
Saccharification Yield % 82.97 ± 4.23 ns
74.15 ± 1.73 ns
ns: Not Significant at t-Test analysis p > 0.05
Table 4.7: Calculated values of enzymatic hydrolysis of two seaweed dilute acid
treatment residues obtained from 100 g DW biomass. K. alvarezii G. manilaensis
Residues (g) 13.07 ± 2.18 ns 13.81 ± 0.54 ns
Ash % 8.75 ± 0.54 ns 7.03 ± 0.19 ns
Total Ash Free DW (g) * 11.93 ± 2.03 12.86 ± 0.60
Hyd Sugar Conc (g L-1) * 120.33 ± 10.97 ns 105.67 ± 4.16 ns
Produced Sugar (g) * 9.94 ± 1.38 ns 9.54 ± 0.32 ns
Sugar Yield (g g biomass-1)* 0.82 ± 0.01 ns 0.74 ± 0.01 ns
ns: Not Significant with t-Test analysis at p > 0.05
*The values are calculated based on saccharification yield of 7.00 g DW residue in Table 4.6
4.3 Experiment 3. Fermentation studies
4.3.1 Selection of microorganism and acclimation to seaweed hydrolyzate
Figure 4.15, Figure 4.16 and Figure 4.17 show the trend of sugar consumption and
ethanol production during 3 cycles of acclimation by three yeast species. Figure 4.15
shows ethanol production was increased from 2.13 ± 0.25 g L -1 to 3.90 ± 0.56 g L -1 in B.
bruxellensis while ethanol was increased from 3.55± 0.48 g L -1 to 5.3 ± 0.90 g L -1 in S.
cerevisiae NBRC 10217 (Figure 4.16), where no significant difference on ethanol
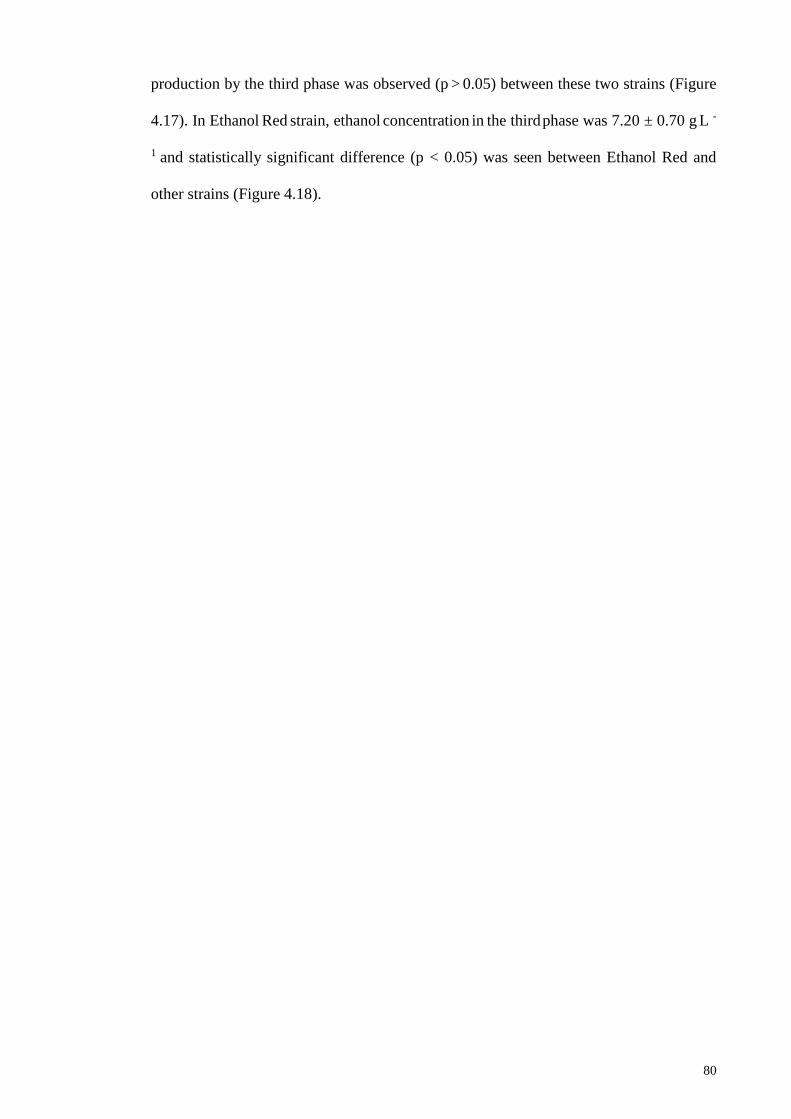
80
production by the third phase was observed (p > 0.05) between these two strains (Figure
4.17). In Ethanol Red strain, ethanol concentration in the third phase was 7.20 ± 0.70 g L -
1 and statistically significant difference (p < 0.05) was seen between Ethanol Red and
other strains (Figure 4.18).
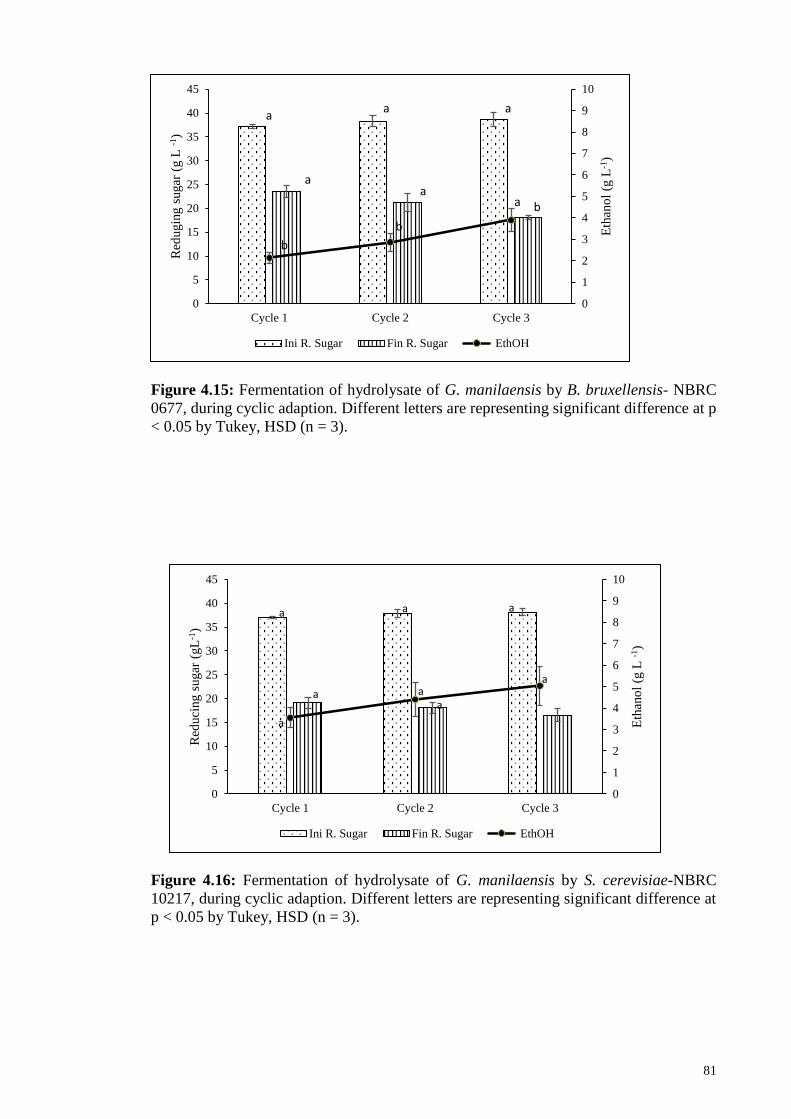
81
Figure 4.15: Fermentation of hydrolysate of G. manilaensis by B. bruxellensis- NBRC
0677, during cyclic adaption. Different letters are representing significant difference at p
< 0.05 by Tukey, HSD (n = 3).
Figure 4.16: Fermentation of hydrolysate of G. manilaensis by S. cerevisiae-NBRC
10217, during cyclic adaption. Different letters are representing significant difference at
p < 0.05 by Tukey, HSD (n = 3).
0
1
2
3
4
5
6
7
8
9
10
0
5
10
15
20
25
30
35
40
45
Cycle 1 Cycle 2 Cycle 3
Eth
ano
l (g
L-1
)
Red
ugin
g s
ugar
(g L
-1)
Ini R. Sugar Fin R. Sugar EthOH
aa a
aa
ba
b
b
0
1
2
3
4
5
6
7
8
9
10
0
5
10
15
20
25
30
35
40
45
Cycle 1 Cycle 2 Cycle 3
Eth
ano
l (g
L -1
)
Red
uci
ng s
ugar
(gL
-1)
Ini R. Sugar Fin R. Sugar EthOH
a
aa
aa
a a a
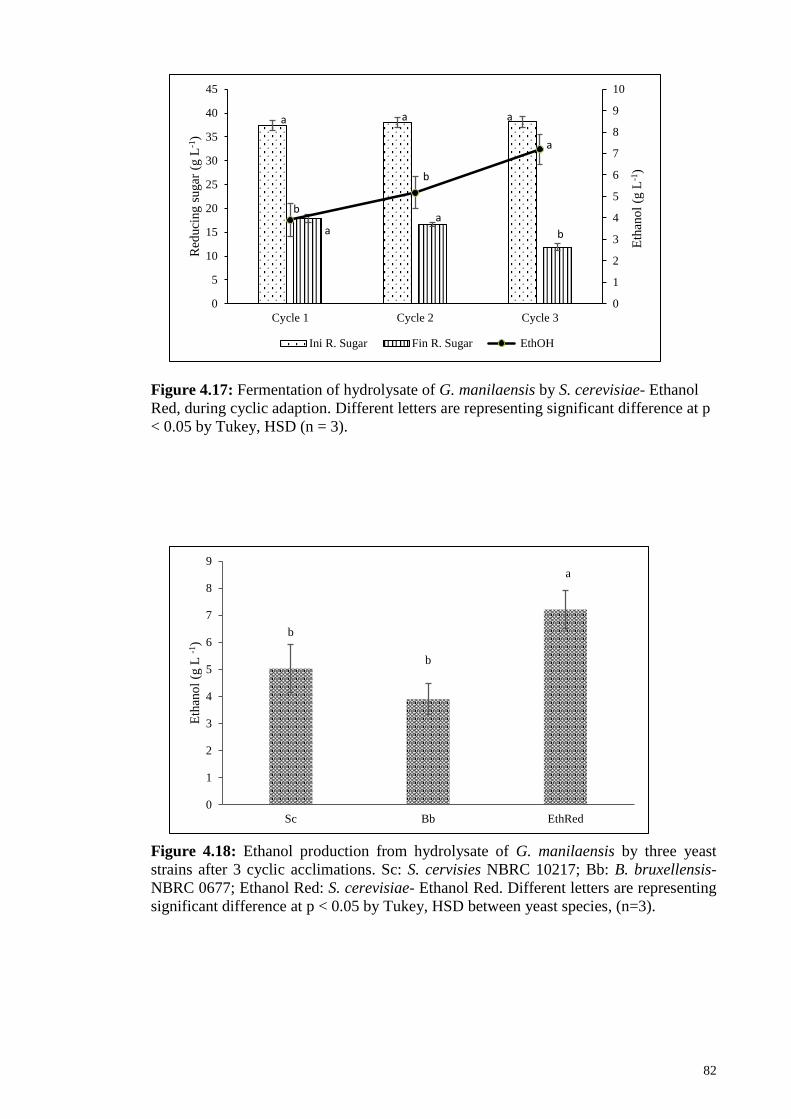
82
Figure 4.17: Fermentation of hydrolysate of G. manilaensis by S. cerevisiae- Ethanol
Red, during cyclic adaption. Different letters are representing significant difference at p
< 0.05 by Tukey, HSD (n = 3).
Figure 4.18: Ethanol production from hydrolysate of G. manilaensis by three yeast
strains after 3 cyclic acclimations. Sc: S. cervisies NBRC 10217; Bb: B. bruxellensis-
NBRC 0677; Ethanol Red: S. cerevisiae- Ethanol Red. Different letters are representing
significant difference at p < 0.05 by Tukey, HSD between yeast species, (n=3).
0
1
2
3
4
5
6
7
8
9
10
0
5
10
15
20
25
30
35
40
45
Cycle 1 Cycle 2 Cycle 3
Eth
ano
l (g
L-1
)
Red
uci
ng s
ugar
(g L
-1)
Ini R. Sugar Fin R. Sugar EthOH
a a a
a
b
b
b
aa
b
b
a
0
1
2
3
4
5
6
7
8
9
Sc Bb EthRed
Eth
ano
l (g
L -1
)
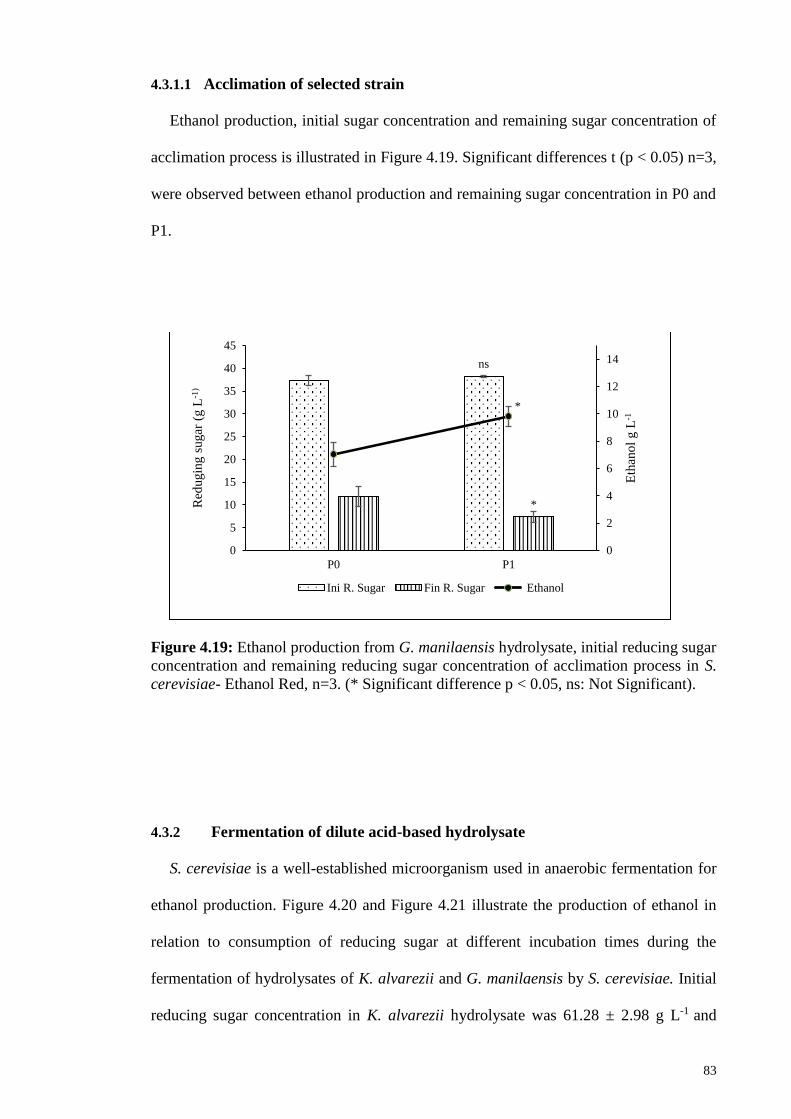
83
4.3.1.1 Acclimation of selected strain
Ethanol production, initial sugar concentration and remaining sugar concentration of
acclimation process is illustrated in Figure 4.19. Significant differences t (p < 0.05) n=3,
were observed between ethanol production and remaining sugar concentration in P0 and
P1.
Figure 4.19: Ethanol production from G. manilaensis hydrolysate, initial reducing sugar
concentration and remaining reducing sugar concentration of acclimation process in S.
cerevisiae- Ethanol Red, n=3. (* Significant difference p < 0.05, ns: Not Significant).
4.3.2 Fermentation of dilute acid-based hydrolysate
S. cerevisiae is a well-established microorganism used in anaerobic fermentation for
ethanol production. Figure 4.20 and Figure 4.21 illustrate the production of ethanol in
relation to consumption of reducing sugar at different incubation times during the
fermentation of hydrolysates of K. alvarezii and G. manilaensis by S. cerevisiae. Initial
reducing sugar concentration in K. alvarezii hydrolysate was 61.28 ± 2.98 g L-1 and
ns
*
*
0
2
4
6
8
10
12
14
0
5
10
15
20
25
30
35
40
45
P0 P1
Eth
ano
l g L
-1
Red
ugin
g s
ugar
(g L
-1)
Ini R. Sugar Fin R. Sugar Ethanol
84
maximum ethanol production (20.90 ± 1.81 g L-1) was achieved at 36 h corresponding to
71.06 % of theoretical yield conversion of reducing sugar on the basis of glucose yield
(0.48 g g-1), while maximum ethanol production in G. manilaensis was 20.62 ± 1.68 g L-
1 at the same time which was corresponding to 72.50 % of theoretical yield. In the present
study, all sugar were not fully consumed in both hydrolysates after 72 h, were 3.47 ± 1.11
g L-1 and 6.24 ± 1.15g L-1 were seen in K. alvarezii and G. manilaensis, respectively.
Figure 4.20: Fermentation with dilute acid hydrolysate of K. alvarezii hydrolysate using
Ethanol Red, S. cerevisiae.
0
5
10
15
20
25
30
0
10
20
30
40
50
60
70
80
0 12 24 36 48 60 72 84 96
Eth
ano
l (
g L
-1)
Red
uci
ng s
ugar
(g
L-1
)
Incubation time (h)Sugar Ethanol

85
Figure 4.21: Fermentation with dilute acid hydrolysate of G. manilaensis hydrolysate
using Ethanol Red, S. cerevisiae.
4.3.3 Fermentation of enzyme-based hydrolysate
Figure 4.22 illustrates the fermentation of hydrolysate of K. alvarezii. Maximum
ethanol (56.26 g L-1) was achieved after 48 h in K. alvarezii corresponding to 91 % of
theoretical yield while highest ethanol production was after 36 h (51.10 g L-1) in G.
manilaensis hydrolysate (Figure 4.23) and 95 % of the theoretical yield of fermentation
was achieved.
0
5
10
15
20
25
30
0
10
20
30
40
50
60
70
80
0 12 24 36 48 60 72 84 96
Eth
ano
l (
g L
-1)
Red
uci
ng s
ugar
(g
L-1
)
Incubation time (h)Sugar Ethanol
86
Figure 4.22: Fermentation with enzymatic hydrolysate of K. alvarezii.
Figure 4.23: Fermentation with enzymatic hydrolysate of G. manilaensis.
0
10
20
30
40
50
60
70
0
20
40
60
80
100
120
140
0 12 24 36 48 60 72
Eth
ano
l (
g L
-1)
Red
uci
ng s
ugar
(g
L-1
)
Incubation time (h)Sugar Ethanol
0
10
20
30
40
50
60
0
20
40
60
80
100
120
140
0 12 24 36 48 60 72
Eth
ano
l (
g L
-1)
Red
uci
ng s
ugar
(g
L-1
)
Incubation time (h)Sugar Ethanol
87
4.3.4 Calculating the bioethanol production potential in K. alvarezii and G.
manilaensis
The potential of bioethanol production from K. alvarezii and G. manilaensis in this
study was calculated based on 100 g DW of each seaweed biomass and data are plotted
in Figure 4.24 and Figure 4.25 respectively. Applying optimum condition for dilute acid
treatment, soluble polysaccharide were converted to reduced sugars and residues were
characterized for ash and DW content. In K. alvarezii, 34.13 ± 0.60 g of reducing sugars
was produced and after over liming treatment 29.99 ± 0.94 g of reducing sugars remained
in detoxified K. alvarezii hydrolysate. These values were 38.30 ± 1.43 g and 34.28 ± 1.71
g for G. manilaensis biomass. Obtained residues for K. alvarezii and G. manilaensis were
13.07 ± 2.18 g and 13.81 ± 0.54 g respectively, and the amount of ash in both seaweed
residues were not high. Enzymatic conversion generated 9.94 ± 1.38 g glucose in K.
alvarezii corresponding to 82.97 ± 4.23 % enzymatic conversion while 9.54 ± 0.32 g
glucose was produced in G. manilaensis with a value of 74.15 ± 1.73 % for enzymatic
conversion.
Taking into account the reducing sugar yields and losses in each step, it can be
estimated that the process herein studied resulted in a ratio 14.88 g corresponding1 to
18.83 mL ethanol in K. alvarezii (Figure 4. 24) and 15.79 g corresponding to 19.98 mL
of ethanol in G. manilaensis (Figure 4.25) per 100 g DW seaweed, respectively.
1 The density of ethanol is equal to 0.789 g/cm3
88
Figure 4.24: Material balance chart for the conversion of K. alvarezii biomass to
bioethanol
100 g DW
K. alvarezii
800 mL 2.5 % w v-1 Sulphuric acid
Dilute acid treatment
580 mL Hydrolysate
58.18 g L-1 Reducing sugars
34.13 g Sugar recovered 100 g
biomass
Residues 13.07 g
Ash content 1.14 g
Ash free DW 11.93 g
Over-liming
489.67 mL Hydrolysate
61.28 g L-1 Reducing sugars
29.99 g Sugar recovered
Fermentation
20.90 g L-1 Bioethanol Conc.
• 10.23 g content
Enzymatic hydrolysis
82.67 mL Hydrolysate
120.33 g L-1 Glucose Conc.
9.94 g Glucose produced
Fermentation
56.26 g L-1 Bioethanol Conc.
• 4.65 g content
14.88 g or 18.83 mL Bioethanol / 100 g biomass DW

89
Figure 4.25: Material balance chart for the conversion of G. manilaensis biomass to
bioethanol
100 g DW
G. manilaensis
800 mL 2.5 % w v-1 Sulphuric acid
Dilute acid treatment
680 mL Hydrolysate
56.29 g L-1 Reducing sugars
38.30 g Sugar recovered /100
g biomass
• Residues 13.81 g
• Ash content 0.97 g
• Ash free DW 12.86 g
Over-liming
• 615.67 mL Hydrolysate
• 55.77 g L-1 Reducing sugars
• 34.28 g Sugar recovered
Fermentation
18.16 g L-1 Bioethanol Conc.
11.18 g content
Enzymatic hydrolysis
90.34 mL Hydrolysate
105.67 g L-1 Glucose Conc.
9.53 g Glucose produced
Fermentation
51.10 g L-1Bioethanol Conc.
4.61 g content
15.79 g or 19.98 mL Bioethanol / 100g biomass DW
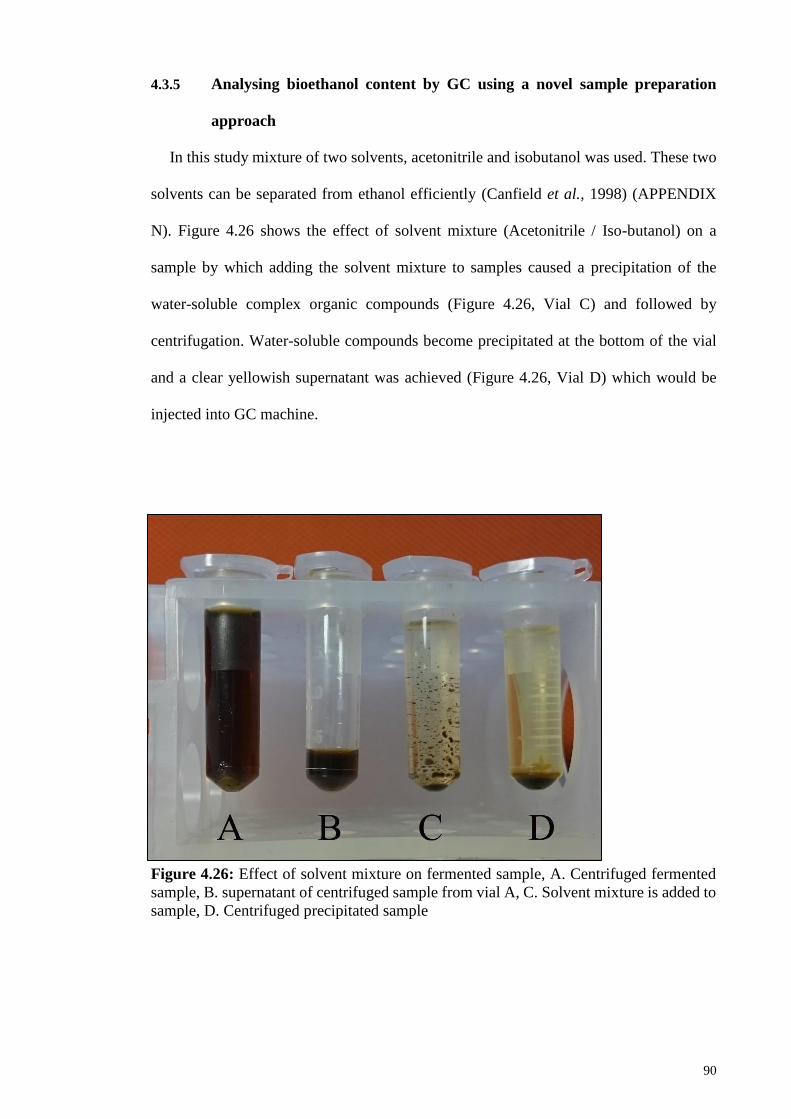
90
4.3.5 Analysing bioethanol content by GC using a novel sample preparation
approach
In this study mixture of two solvents, acetonitrile and isobutanol was used. These two
solvents can be separated from ethanol efficiently (Canfield et al., 1998) (APPENDIX
N). Figure 4.26 shows the effect of solvent mixture (Acetonitrile / Iso-butanol) on a
sample by which adding the solvent mixture to samples caused a precipitation of the
water-soluble complex organic compounds (Figure 4.26, Vial C) and followed by
centrifugation. Water-soluble compounds become precipitated at the bottom of the vial
and a clear yellowish supernatant was achieved (Figure 4.26, Vial D) which would be
injected into GC machine.
Figure 4.26: Effect of solvent mixture on fermented sample, A. Centrifuged fermented
sample, B. supernatant of centrifuged sample from vial A, C. Solvent mixture is added to
sample, D. Centrifuged precipitated sample
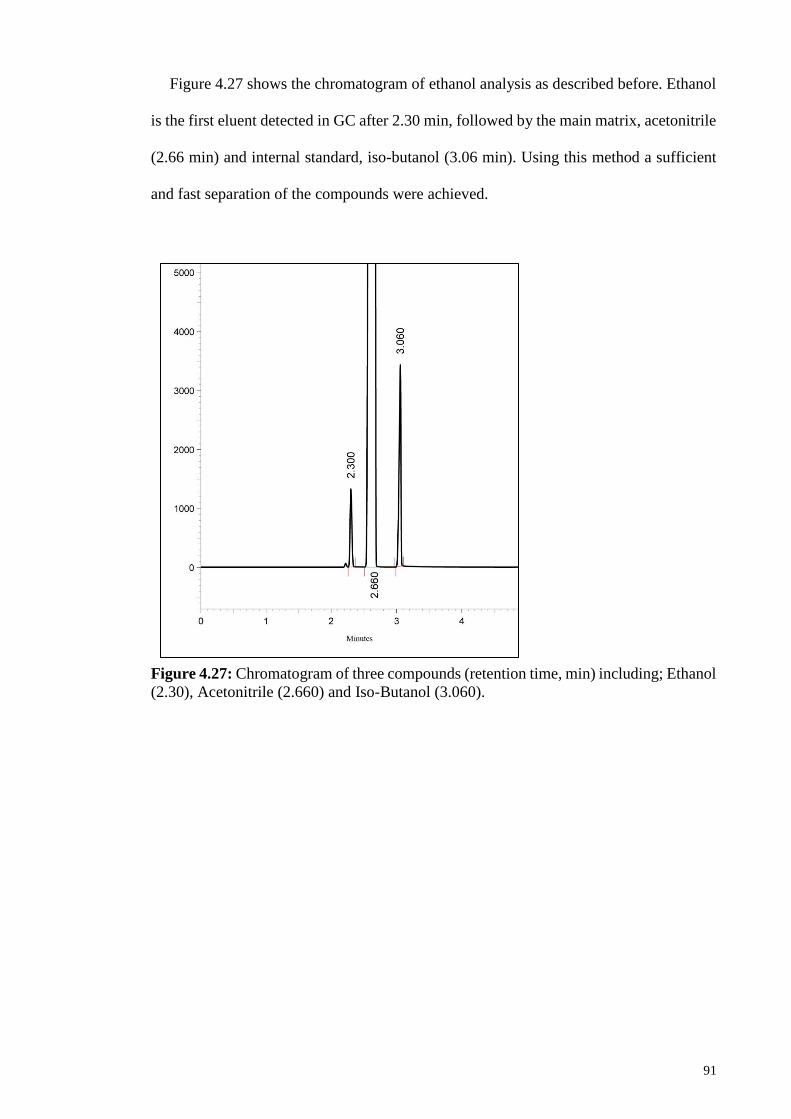
91
Figure 4.27 shows the chromatogram of ethanol analysis as described before. Ethanol
is the first eluent detected in GC after 2.30 min, followed by the main matrix, acetonitrile
(2.66 min) and internal standard, iso-butanol (3.06 min). Using this method a sufficient
and fast separation of the compounds were achieved.
Figure 4.27: Chromatogram of three compounds (retention time, min) including; Ethanol
(2.30), Acetonitrile (2.660) and Iso-Butanol (3.060).
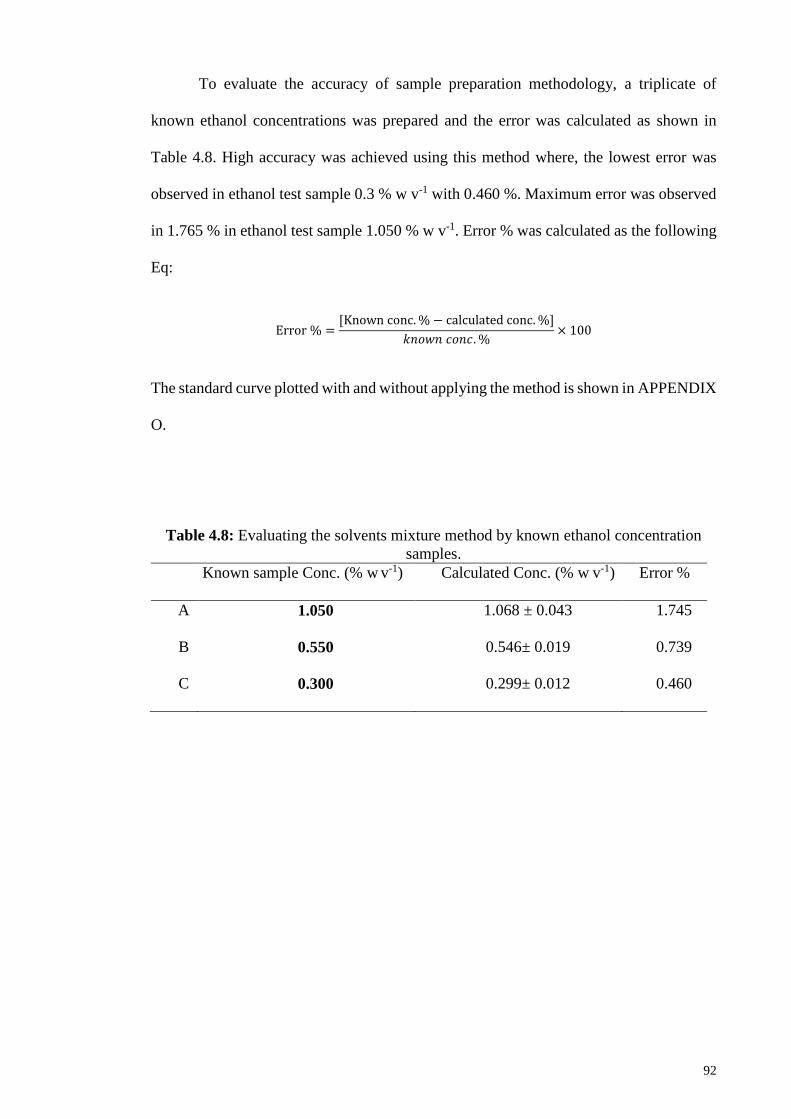
92
To evaluate the accuracy of sample preparation methodology, a triplicate of
known ethanol concentrations was prepared and the error was calculated as shown in
Table 4.8. High accuracy was achieved using this method where, the lowest error was
observed in ethanol test sample 0.3 % w v-1 with 0.460 %. Maximum error was observed
in 1.765 % in ethanol test sample 1.050 % w v-1. Error % was calculated as the following
Eq:
Error % =[Known conc. % − calculated conc. %]
𝑘𝑛𝑜𝑤𝑛 𝑐𝑜𝑛𝑐. %× 100
The standard curve plotted with and without applying the method is shown in APPENDIX
O.
Table 4.8: Evaluating the solvents mixture method by known ethanol concentration
samples.
Known sample Conc. (% w v-1) Calculated Conc. (% w v-1) Error %
A 1.050 1.068 ± 0.043 1.745
B 0.550 0.546± 0.019 0.739
C 0.300 0.299± 0.012 0.460
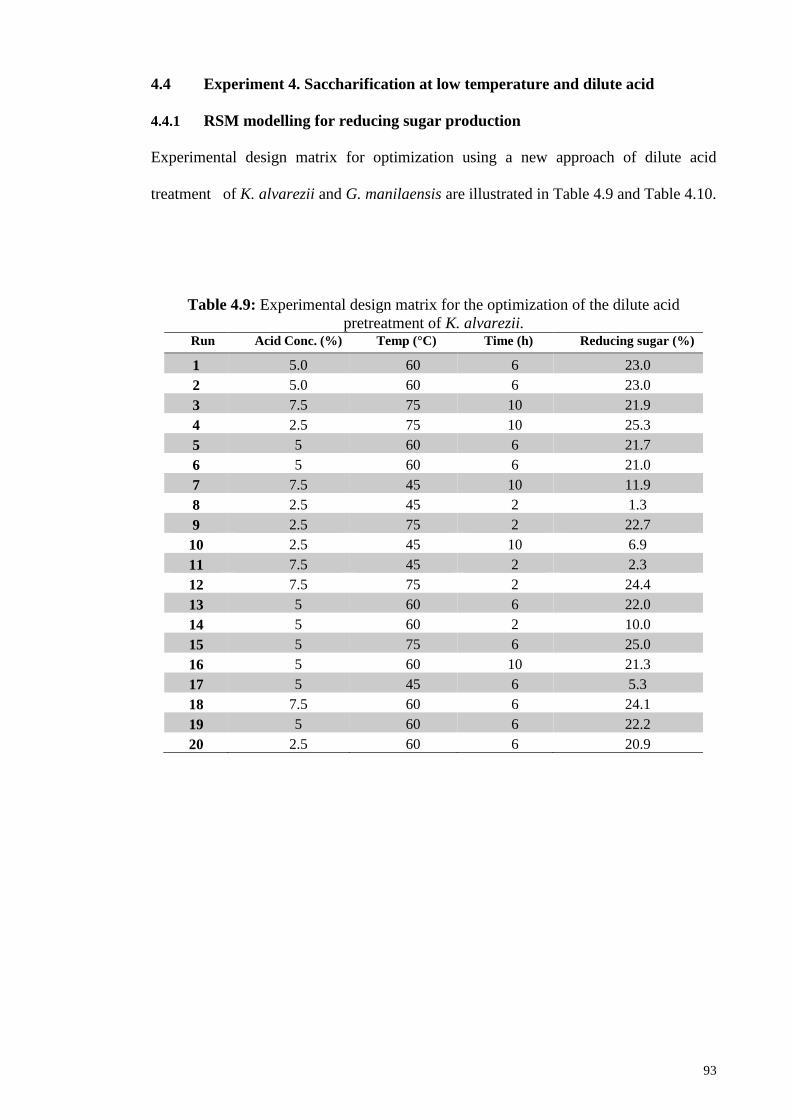
93
4.4 Experiment 4. Saccharification at low temperature and dilute acid
4.4.1 RSM modelling for reducing sugar production
Experimental design matrix for optimization using a new approach of dilute acid
treatment of K. alvarezii and G. manilaensis are illustrated in Table 4.9 and Table 4.10.
Table 4.9: Experimental design matrix for the optimization of the dilute acid
pretreatment of K. alvarezii. Run Acid Conc. (%) Temp (°C) Time (h) Reducing sugar (%)
1 5.0 60 6 23.0
2 5.0 60 6 23.0
3 7.5 75 10 21.9
4 2.5 75 10 25.3
5 5 60 6 21.7
6 5 60 6 21.0
7 7.5 45 10 11.9
8 2.5 45 2 1.3
9 2.5 75 2 22.7
10 2.5 45 10 6.9
11 7.5 45 2 2.3
12 7.5 75 2 24.4
13 5 60 6 22.0
14 5 60 2 10.0
15 5 75 6 25.0
16 5 60 10 21.3
17 5 45 6 5.3
18 7.5 60 6 24.1
19 5 60 6 22.2
20 2.5 60 6 20.9
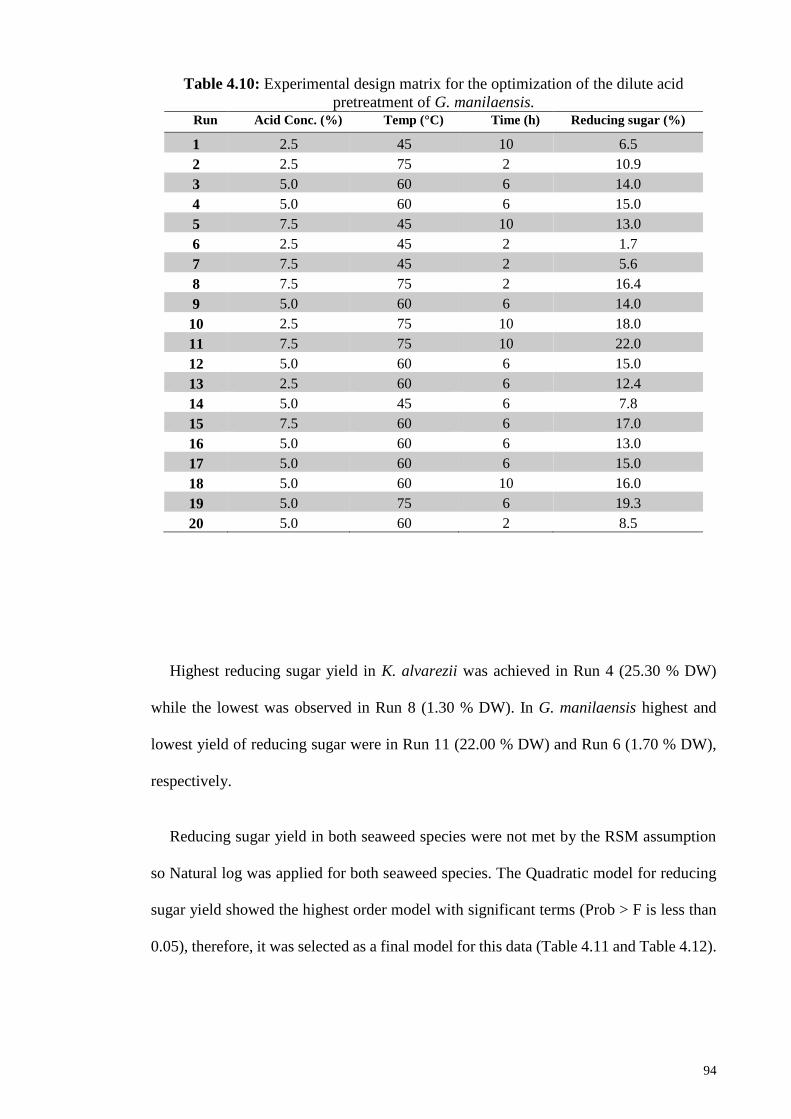
94
Table 4.10: Experimental design matrix for the optimization of the dilute acid
pretreatment of G. manilaensis. Run Acid Conc. (%) Temp (°C) Time (h) Reducing sugar (%)
1 2.5 45 10 6.5
2 2.5 75 2 10.9
3 5.0 60 6 14.0
4 5.0 60 6 15.0
5 7.5 45 10 13.0
6 2.5 45 2 1.7
7 7.5 45 2 5.6
8 7.5 75 2 16.4
9 5.0 60 6 14.0
10 2.5 75 10 18.0
11 7.5 75 10 22.0
12 5.0 60 6 15.0
13 2.5 60 6 12.4
14 5.0 45 6 7.8
15 7.5 60 6 17.0
16 5.0 60 6 13.0
17 5.0 60 6 15.0
18 5.0 60 10 16.0
19 5.0 75 6 19.3
20 5.0 60 2 8.5
Highest reducing sugar yield in K. alvarezii was achieved in Run 4 (25.30 % DW)
while the lowest was observed in Run 8 (1.30 % DW). In G. manilaensis highest and
lowest yield of reducing sugar were in Run 11 (22.00 % DW) and Run 6 (1.70 % DW),
respectively.
Reducing sugar yield in both seaweed species were not met by the RSM assumption
so Natural log was applied for both seaweed species. The Quadratic model for reducing
sugar yield showed the highest order model with significant terms (Prob > F is less than
0.05), therefore, it was selected as a final model for this data (Table 4.11 and Table 4.12).

95
Table 4.11: Sequential model sum of squares for reducing sugars yield in K. alvarezii Source Sum of sq df Mean sq F Value p-value
Prob>F
Block vs Mean 0.3992 1 0.3992
Linear vs Block 9.3351 3 3.1117 11.4448 0.0004
2FI vs Linear 1.5598 3 0.5199 2.4773 0.1112
Quadratic vs 2FI 2.4705 3 0.8235 154.3815 < 0.0001 Suggested
Cubic vs Quadratic 0.0343 4 0.0086 3.1212 0.1218 Aliased
Residual 0.0137 5 0.0027
Total 155.3182 20 7.7659
Table 4.12: Sequential model sum of squares for reducing sugars yield in G.
manilaensis Source Sum of sq df Mean sq F Value p-Value
Prob>F
Block vs Mean 0.1764 1 0.1764
Linear vs Block 5.0546 3 1.6849 20.8817 < 0.0001
2FI vs Linear 0.5266 3 0.1755 3.0813 0.0683
Quadratic vs 2FI 0.5872 3 0.1957 18.2631 0.0004 Suggested
Cubic vs Quadratic 0.0767 4 0.0192 4.8555 0.0567 Aliased
Residual 0.0197 5 0.0039
Total 126.8670 20 6.3433
The test for lack of fit breaks up the sum of squares of error into a sum of squares for
lack of fit and an experimental error sum of squares (Lazic, 2006). Thus, to finalize the
model lack of fit test should be considered. In this study, based on Table 4.13 and Table
4.14, showed that quadratic model is a better model to meet our results.
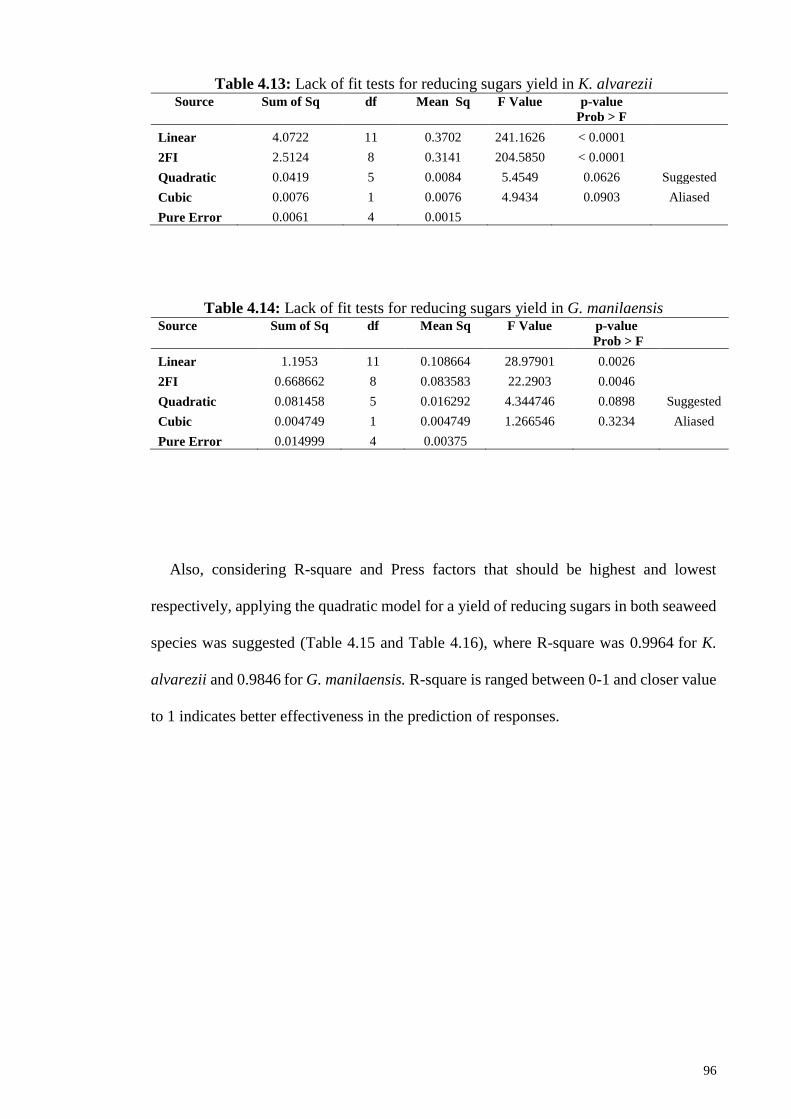
96
Table 4.13: Lack of fit tests for reducing sugars yield in K. alvarezii Source Sum of Sq df Mean Sq F Value p-value
Prob > F
Linear 4.0722 11 0.3702 241.1626 < 0.0001
2FI 2.5124 8 0.3141 204.5850 < 0.0001
Quadratic 0.0419 5 0.0084 5.4549 0.0626 Suggested
Cubic 0.0076 1 0.0076 4.9434 0.0903 Aliased
Pure Error 0.0061 4 0.0015
Table 4.14: Lack of fit tests for reducing sugars yield in G. manilaensis Source Sum of Sq df Mean Sq F Value p-value
Prob > F
Linear 1.1953 11 0.108664 28.97901 0.0026
2FI 0.668662 8 0.083583 22.2903 0.0046
Quadratic 0.081458 5 0.016292 4.344746 0.0898 Suggested
Cubic 0.004749 1 0.004749 1.266546 0.3234 Aliased
Pure Error 0.014999 4 0.00375
Also, considering R-square and Press factors that should be highest and lowest
respectively, applying the quadratic model for a yield of reducing sugars in both seaweed
species was suggested (Table 4.15 and Table 4.16), where R-square was 0.9964 for K.
alvarezii and 0.9846 for G. manilaensis. R-square is ranged between 0-1 and closer value
to 1 indicates better effectiveness in the prediction of responses.
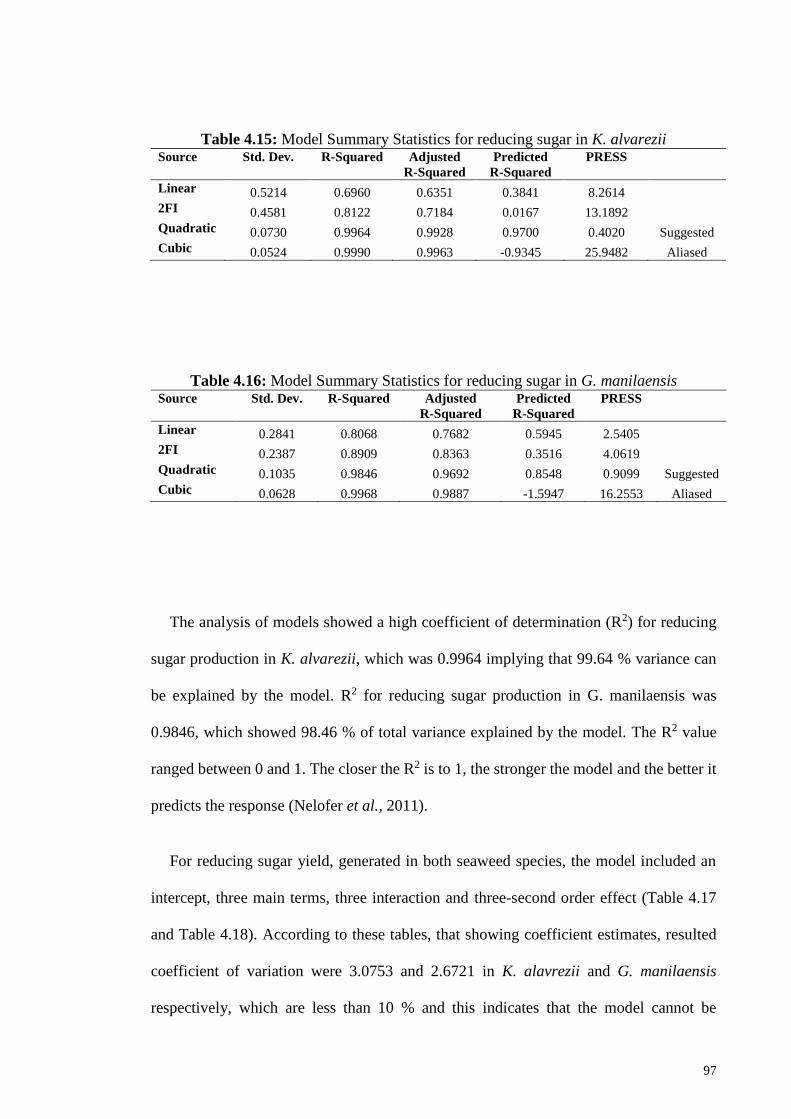
97
Table 4.15: Model Summary Statistics for reducing sugar in K. alvarezii Source Std. Dev. R-Squared Adjusted
R-Squared
Predicted
R-Squared
PRESS
Linear 0.5214 0.6960 0.6351 0.3841 8.2614
2FI 0.4581 0.8122 0.7184 0.0167 13.1892
Quadratic 0.0730 0.9964 0.9928 0.9700 0.4020 Suggested
Cubic 0.0524 0.9990 0.9963 -0.9345 25.9482 Aliased
Table 4.16: Model Summary Statistics for reducing sugar in G. manilaensis Source Std. Dev. R-Squared Adjusted
R-Squared
Predicted
R-Squared
PRESS
Linear 0.2841 0.8068 0.7682 0.5945 2.5405
2FI 0.2387 0.8909 0.8363 0.3516 4.0619
Quadratic 0.1035 0.9846 0.9692 0.8548 0.9099 Suggested
Cubic 0.0628 0.9968 0.9887 -1.5947 16.2553 Aliased
The analysis of models showed a high coefficient of determination (R2) for reducing
sugar production in K. alvarezii, which was 0.9964 implying that 99.64 % variance can
be explained by the model. R2 for reducing sugar production in G. manilaensis was
0.9846, which showed 98.46 % of total variance explained by the model. The R2 value
ranged between 0 and 1. The closer the R2 is to 1, the stronger the model and the better it
predicts the response (Nelofer et al., 2011).
For reducing sugar yield, generated in both seaweed species, the model included an
intercept, three main terms, three interaction and three-second order effect (Table 4.17
and Table 4.18). According to these tables, that showing coefficient estimates, resulted
coefficient of variation were 3.0753 and 2.6721 in K. alavrezii and G. manilaensis
respectively, which are less than 10 % and this indicates that the model cannot be
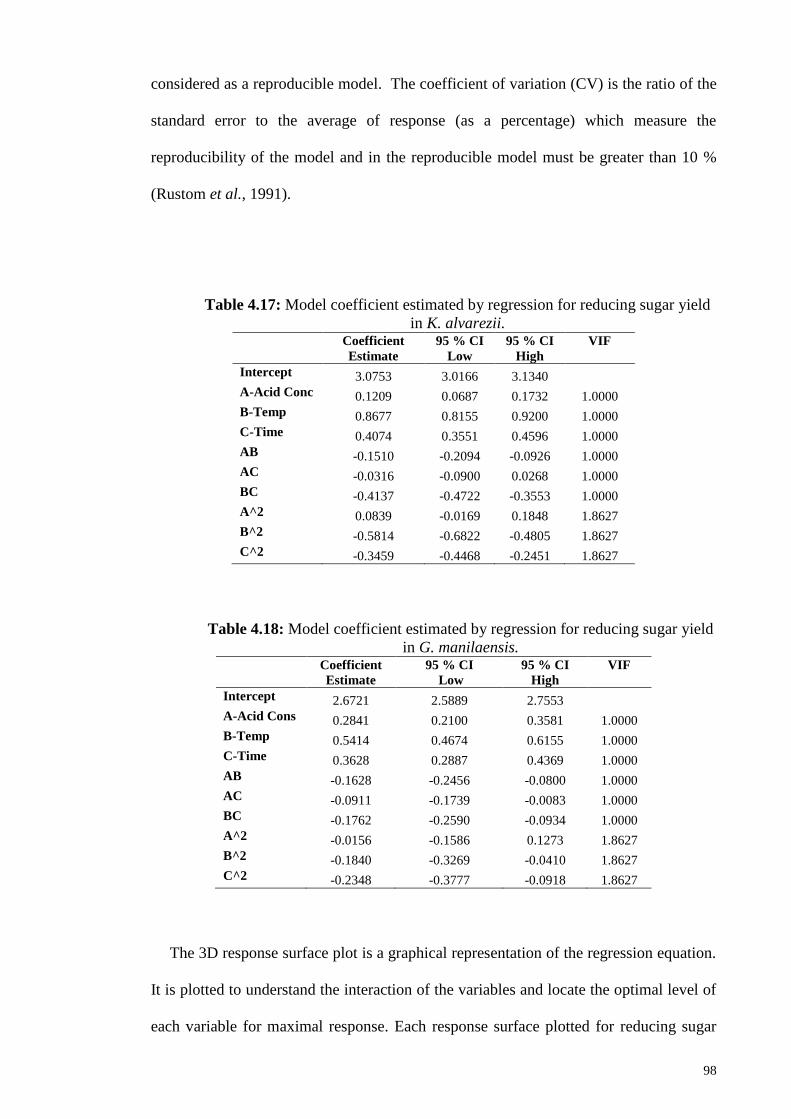
98
considered as a reproducible model. The coefficient of variation (CV) is the ratio of the
standard error to the average of response (as a percentage) which measure the
reproducibility of the model and in the reproducible model must be greater than 10 %
(Rustom et al., 1991).
Table 4.17: Model coefficient estimated by regression for reducing sugar yield
in K. alvarezii. Coefficient
Estimate
95 % CI
Low
95 % CI
High
VIF
Intercept 3.0753 3.0166 3.1340 A-Acid Conc 0.1209 0.0687 0.1732 1.0000
B-Temp 0.8677 0.8155 0.9200 1.0000
C-Time 0.4074 0.3551 0.4596 1.0000
AB -0.1510 -0.2094 -0.0926 1.0000
AC -0.0316 -0.0900 0.0268 1.0000
BC -0.4137 -0.4722 -0.3553 1.0000
A^2 0.0839 -0.0169 0.1848 1.8627
B^2 -0.5814 -0.6822 -0.4805 1.8627
C^2 -0.3459 -0.4468 -0.2451 1.8627
Table 4.18: Model coefficient estimated by regression for reducing sugar yield
in G. manilaensis. Coefficient
Estimate
95 % CI
Low
95 % CI
High
VIF
Intercept 2.6721 2.5889 2.7553
A-Acid Cons 0.2841 0.2100 0.3581 1.0000
B-Temp 0.5414 0.4674 0.6155 1.0000
C-Time 0.3628 0.2887 0.4369 1.0000
AB -0.1628 -0.2456 -0.0800 1.0000
AC -0.0911 -0.1739 -0.0083 1.0000
BC -0.1762 -0.2590 -0.0934 1.0000
A^2 -0.0156 -0.1586 0.1273 1.8627
B^2 -0.1840 -0.3269 -0.0410 1.8627
C^2 -0.2348 -0.3777 -0.0918 1.8627
The 3D response surface plot is a graphical representation of the regression equation.
It is plotted to understand the interaction of the variables and locate the optimal level of
each variable for maximal response. Each response surface plotted for reducing sugar
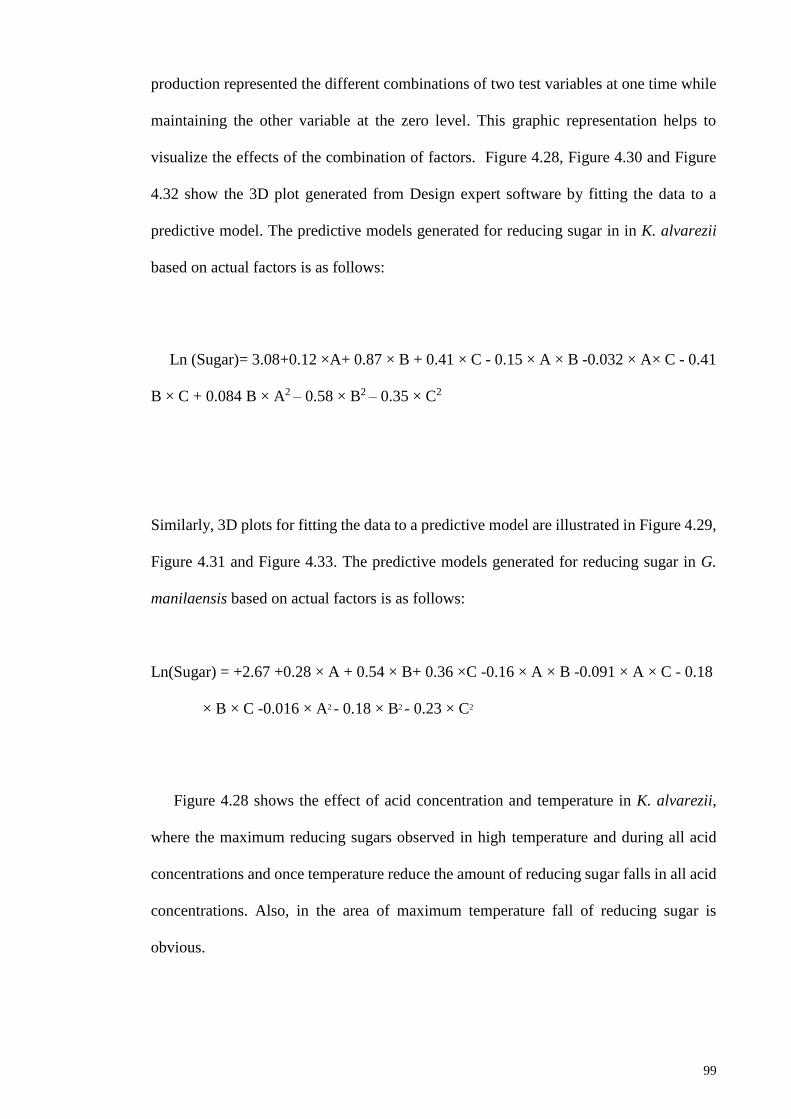
99
production represented the different combinations of two test variables at one time while
maintaining the other variable at the zero level. This graphic representation helps to
visualize the effects of the combination of factors. Figure 4.28, Figure 4.30 and Figure
4.32 show the 3D plot generated from Design expert software by fitting the data to a
predictive model. The predictive models generated for reducing sugar in in K. alvarezii
based on actual factors is as follows:
Ln (Sugar)= 3.08+0.12 ×A+ 0.87 × B + 0.41 × C - 0.15 × A × B -0.032 × A× C - 0.41
B × C + 0.084 B × A2 – 0.58 × B2 – 0.35 × C2
Similarly, 3D plots for fitting the data to a predictive model are illustrated in Figure 4.29,
Figure 4.31 and Figure 4.33. The predictive models generated for reducing sugar in G.
manilaensis based on actual factors is as follows:
Ln(Sugar) = +2.67 +0.28 × A + 0.54 × B+ 0.36 ×C -0.16 × A × B -0.091 × A × C - 0.18
× B × C -0.016 × A2 - 0.18 × B2 - 0.23 × C2
Figure 4.28 shows the effect of acid concentration and temperature in K. alvarezii,
where the maximum reducing sugars observed in high temperature and during all acid
concentrations and once temperature reduce the amount of reducing sugar falls in all acid
concentrations. Also, in the area of maximum temperature fall of reducing sugar is
obvious.
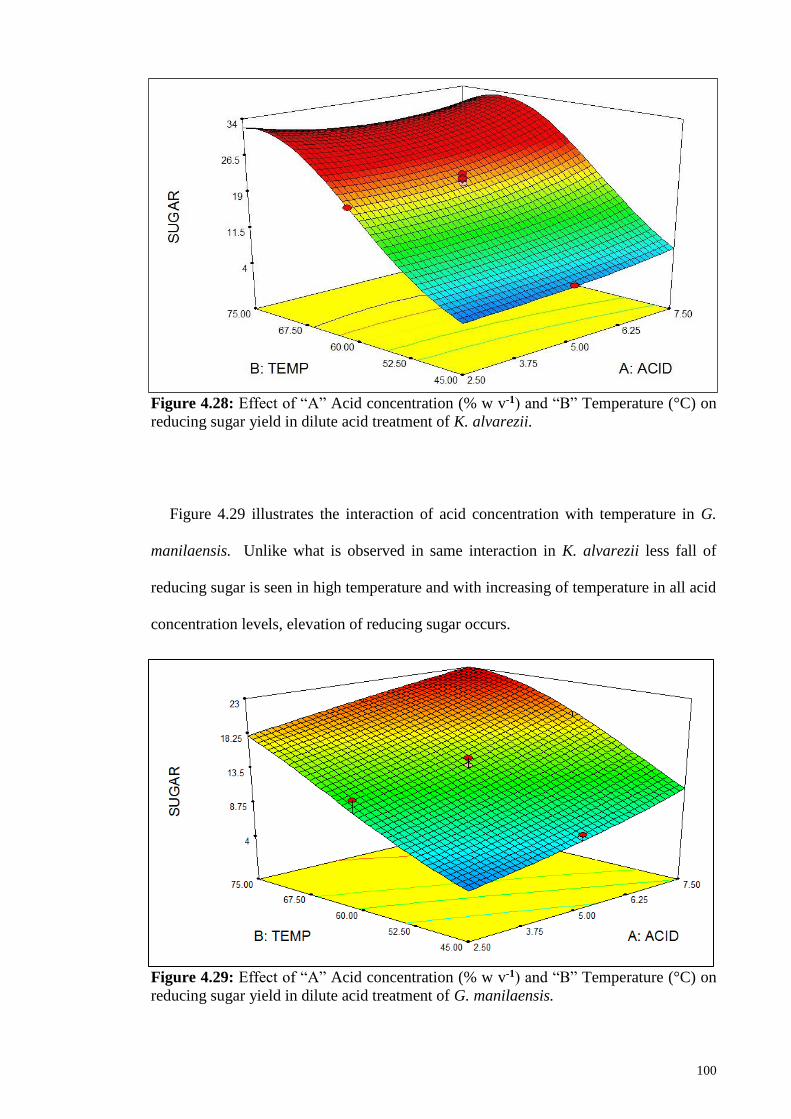
100
Figure 4.28: Effect of “A” Acid concentration (% w v-1) and “B” Temperature (°C) on
reducing sugar yield in dilute acid treatment of K. alvarezii.
Figure 4.29 illustrates the interaction of acid concentration with temperature in G.
manilaensis. Unlike what is observed in same interaction in K. alvarezii less fall of
reducing sugar is seen in high temperature and with increasing of temperature in all acid
concentration levels, elevation of reducing sugar occurs.
Figure 4.29: Effect of “A” Acid concentration (% w v-1) and “B” Temperature (°C) on
reducing sugar yield in dilute acid treatment of G. manilaensis.
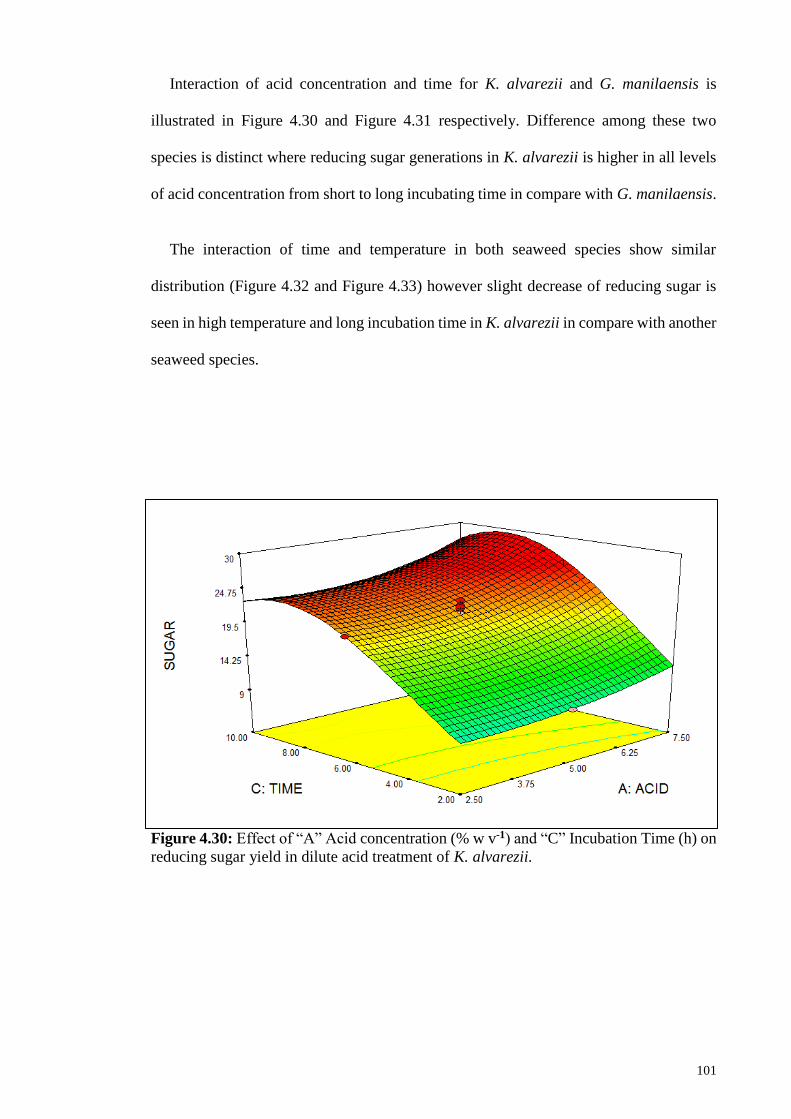
101
Interaction of acid concentration and time for K. alvarezii and G. manilaensis is
illustrated in Figure 4.30 and Figure 4.31 respectively. Difference among these two
species is distinct where reducing sugar generations in K. alvarezii is higher in all levels
of acid concentration from short to long incubating time in compare with G. manilaensis.
The interaction of time and temperature in both seaweed species show similar
distribution (Figure 4.32 and Figure 4.33) however slight decrease of reducing sugar is
seen in high temperature and long incubation time in K. alvarezii in compare with another
seaweed species.
Figure 4.30: Effect of “A” Acid concentration (% w v-1) and “C” Incubation Time (h) on
reducing sugar yield in dilute acid treatment of K. alvarezii.
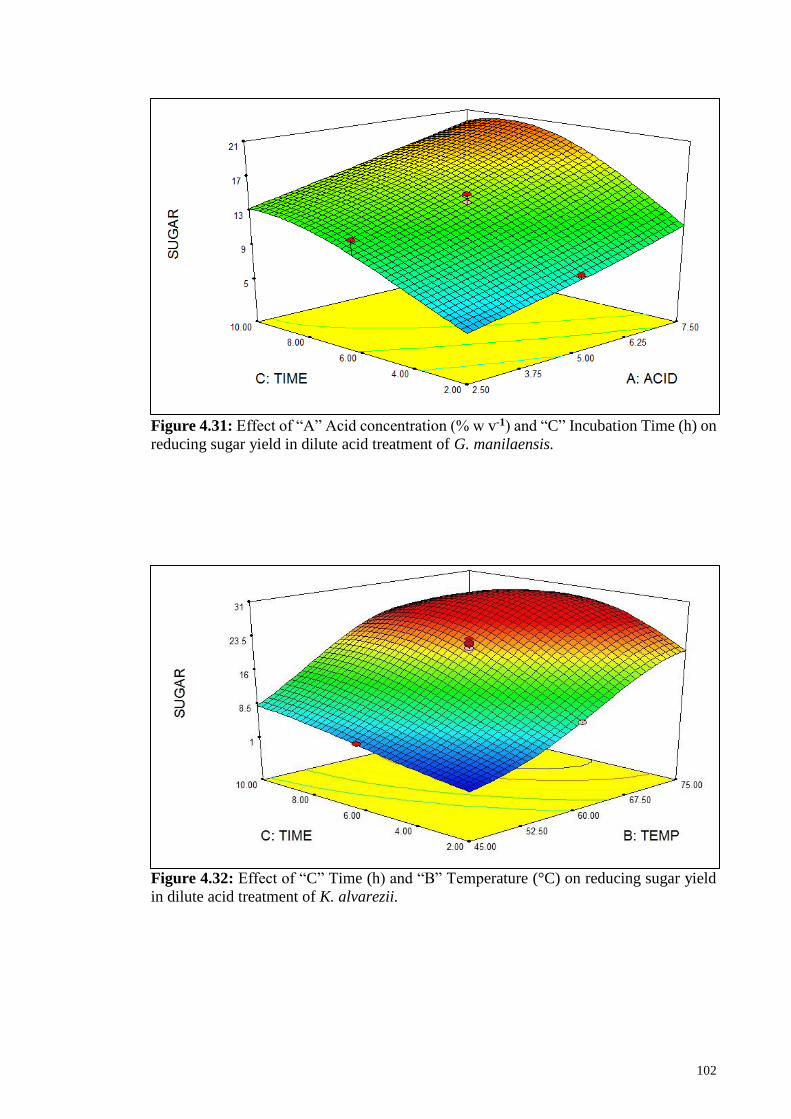
102
Figure 4.31: Effect of “A” Acid concentration (% w v-1) and “C” Incubation Time (h) on
reducing sugar yield in dilute acid treatment of G. manilaensis.
Figure 4.32: Effect of “C” Time (h) and “B” Temperature (°C) on reducing sugar yield
in dilute acid treatment of K. alvarezii.

103
Figure 4.33: Effect of “C” Time (h) and “B” Temperature (°C) on reducing sugar yield
in dilute acid treatment of G. manilaensis.
4.4.1.1 Validation of optimum conditions using RSM
Table 4.19 and Table 4.20 present the optimum conditions of reducing sugar in K.
alvarezii and G. manilaensis respectively. To find such optimum condition for both
seaweed species, the acid concentration was adjusted to a minimum while the rest of
factors including temperature and time were in the range of actual experiment values
(time: between 2 – 12 h, temperature: 40 - 80 °C). Highest desirability (1) was achieved
in K. alavarezii optimization model (Table 4.19) while the acceptable value of this factor
(0.989) seen in G. manilaensis (Table 4. 20).
Also, it can be observed that lower temperature (63.65 °C) in former seaweed
species can be applied to achieve highest desirability in compare with G. manilaensis
(79.98 °C) .
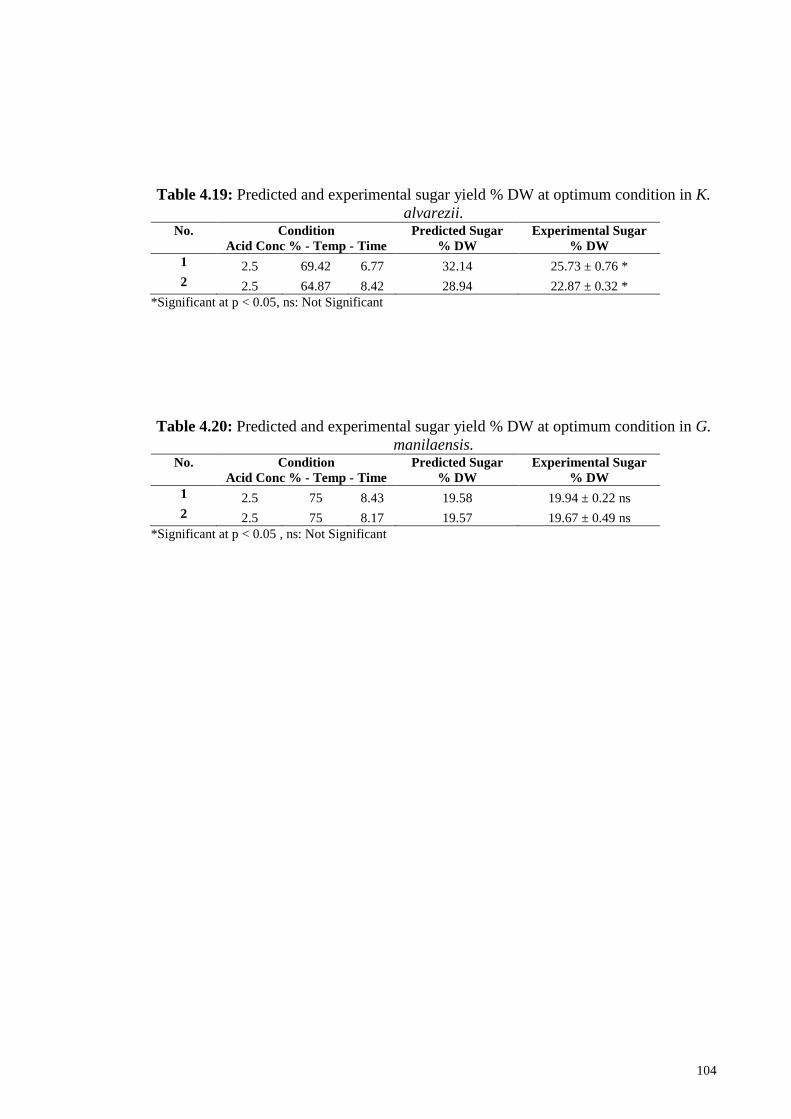
104
Table 4.19: Predicted and experimental sugar yield % DW at optimum condition in K.
alvarezii. No. Condition
Acid Conc % - Temp - Time
Predicted Sugar
% DW
Experimental Sugar
% DW
1 2.5 69.42 6.77 32.14 25.73 ± 0.76 *
2 2.5 64.87 8.42 28.94 22.87 ± 0.32 *
*Significant at p < 0.05, ns: Not Significant
Table 4.20: Predicted and experimental sugar yield % DW at optimum condition in G.
manilaensis. No. Condition
Acid Conc % - Temp - Time
Predicted Sugar
% DW
Experimental Sugar
% DW
1 2.5 75 8.43 19.58 19.94 ± 0.22 ns
2 2.5 75 8.17 19.57 19.67 ± 0.49 ns
*Significant at p < 0.05 , ns: Not Significant

105
CHAPTER 5: DISCUSSION
5.1 Characterization of selected tropical seaweeds with reference to their use as
feedstock for bioethanol production
In the context of bioethanol production, carbohydrate content is the most important
biochemical property in seaweeds. The method of measuring carbohydrate content is a
challenging issue, as some methods are detecting soluble carbohydrate only but there are
other methods refer to total carbohydrate content. Also in some studies, carbohydrate
content is determined by calculation and using subtraction of ash, moisture, lipids, and
proteins from the total dry weight. (McDermid & Stuercke, 2003).
The aim of this study was to select two seaweed species with the highest total
carbohydrate contents that also possessed the potential to be easily converted to
fermentable sugars, within the framework of this criteria, more focus was placed on the
collection of red and green seaweeds, due to the fact converting reducing sugars of brown
seaweed to bioethanol is not promising (Takeda et al. 2011, Wang et al. 2013a).
Kappaphycus alvarezii and E. denticulatum showed the highest carbohydrate content
in this study. Kappaphycus and Eucheuma are two closely related genera with high
economic importance (Tan et al., 2012), and their cultivation in Southeast Asia is
common. Compared to our findings, a lower value of 56.8 % total carbohydrate in K.
alvarezii was reported by (Fayaz et al., 2005), while a higher amount (78.3 ±11.5 % DW)
was reported in Papua, Indonesia (Meinita et al., 2012). K. alvarezii contains 74 % k-
carrageenan and 3 % µ-carrageenan (Estevez, Ciancia & Cerezo, 2004). MacArtain and
Stuercke (2008) reported the value of soluble carbohydrate content of Hawaiian E.
denticulatum as 28.0 ± 0.7 % DW, where crude fibre is not included. U. reticulata was
collected from India (Shanmugam & Palpandi, 2010) and Indonesia (Mutripah et al.,
2014), and had carbohydrate contents of 50.24 % DW and 46.81 % DW, respectively.
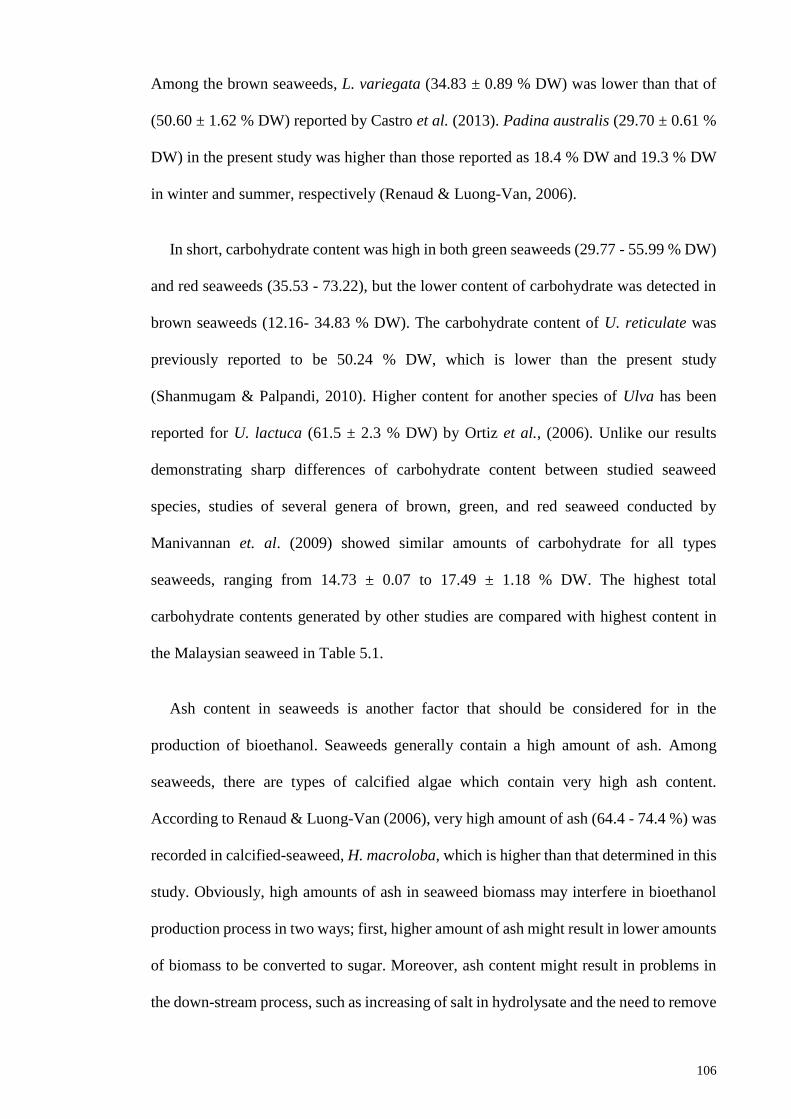
106
Among the brown seaweeds, L. variegata (34.83 ± 0.89 % DW) was lower than that of
(50.60 ± 1.62 % DW) reported by Castro et al. (2013). Padina australis (29.70 ± 0.61 %
DW) in the present study was higher than those reported as 18.4 % DW and 19.3 % DW
in winter and summer, respectively (Renaud & Luong-Van, 2006).
In short, carbohydrate content was high in both green seaweeds (29.77 - 55.99 % DW)
and red seaweeds (35.53 - 73.22), but the lower content of carbohydrate was detected in
brown seaweeds (12.16- 34.83 % DW). The carbohydrate content of U. reticulate was
previously reported to be 50.24 % DW, which is lower than the present study
(Shanmugam & Palpandi, 2010). Higher content for another species of Ulva has been
reported for U. lactuca (61.5 ± 2.3 % DW) by Ortiz et al., (2006). Unlike our results
demonstrating sharp differences of carbohydrate content between studied seaweed
species, studies of several genera of brown, green, and red seaweed conducted by
Manivannan et. al. (2009) showed similar amounts of carbohydrate for all types
seaweeds, ranging from 14.73 ± 0.07 to 17.49 ± 1.18 % DW. The highest total
carbohydrate contents generated by other studies are compared with highest content in
the Malaysian seaweed in Table 5.1.
Ash content in seaweeds is another factor that should be considered for in the
production of bioethanol. Seaweeds generally contain a high amount of ash. Among
seaweeds, there are types of calcified algae which contain very high ash content.
According to Renaud & Luong-Van (2006), very high amount of ash (64.4 - 74.4 %) was
recorded in calcified-seaweed, H. macroloba, which is higher than that determined in this
study. Obviously, high amounts of ash in seaweed biomass may interfere in bioethanol
production process in two ways; first, higher amount of ash might result in lower amounts
of biomass to be converted to sugar. Moreover, ash content might result in problems in
the down-stream process, such as increasing of salt in hydrolysate and the need to remove

107
it. In this study, all seaweeds showed high amounts of ash, and this character was not
useful for selection of suitable seaweeds to produce bioethanol.
Table 5.1: Comparison of reported total carbohydrate content in seaweed species with
the present study. Type of
seaweed
Name TCHD
% DW
Method used Location Reference
Rhodophyte Kappaphycus alvarezii 78.3 Ph-sulphuric Papua, Indonesia Meinita et al. (2012)
Kappaphycus alvarezii 71.22 Ph-sulphuric Sabah, Malaysia Present study
Euchema denticulatum 69.91 Ph-sulphuric Sabah, Malaysia Present study
Gracilaria manilaensis 59.68 Ph-sulphuric Kedah, Malaysia Present study
Chlorophyte Ulva reticulata 50.24 Ph-sulphuric Vellar Estuary,
India
Shanmugam &
Palpandi, (2010) Bryposis plumosa 56.9 Ph-sulphuric Argentina Ciancia et al. (2012)
Ulva reticulata 55.99 Ph-sulphuric Johor, Malaysia Present study
Bryopsis plumosa 43.12 Ph-sulphuric Port Dickson,
Malaysia
Present study
Phaeophyte Lobophora variegata 19.34 Ph-sulphuric India Thennarasan (2015)
Padina fernandeziana 44.07 Calc. Chile Goecke et al. (2012)
Lobophora variegata 34.83 Ph-sulphuric Perhentian Island Present study
Padina australis 29.7 Ph-sulphuric Perhentian Island Present study
Ph.sulpuric: Phenol-sulphuric based on DuBois et al., (1956), Calc.: calculation based on McDermid &
Stuercke (2003).
Song et al. (2010) reported that the monosaccharide composition of Bryopsis spp. are
mainly galactose, arabinose and glucose, but the ratio might vary in different samples
(galactose 2.38 - 43 %, arabinose 4.36- 31 %, and glucose 4.62- 90.30 % of total sugars).
In a previous study on tropical Australian seaweeds, Halimeda macroloba was reported
as a seaweed with very low soluble carbohydrate (4.7 % DW in summer and 2.7 % DW
in winter), which may be the result of its remarkable ash content (74.4 % DW in summer
and 64.4 % DW in winter) (Renaud & Luong-Van, 2006).
Thermo-chemical hydrolysis conducted as a dilute acid treatment at high temperature
is an inexpensive process compared with the enzymatic process from an economic
perspective, but the disadvantage of this treatment is the possible occurrence of
108
fermentation inhibitors. On the other hand, the enzymatic hydrolysis is more effective,
and fermentation inhibitor does not occur in the process (Taherzadeh et al. 2007; Larsson
et al. 1999; Klinke et al. 2004). Currently, enzymatic hydrolysis is considered an
expensive process in the bioethanol industry. Hence, in this study, we used diluted
sulphuric acid and high temperature to aid carbohydrate hydrolysis. According to our
results (Figure 4.1) for both seaweeds, K. alvarezii and G. manilaensis, hydrolysis yields
in both 80 °C and 100 °C were low compared to 120 °C and 140 °C, where significant
differences of p > 0.05 was observed.
On one hand, using sulphuric acid at high concentrations and temperature require
better equipment and more energy and chemicals. However, harsh treatments might result
in increased fermentation inhibitors. Therefore, in this study, we selected the optimal
condition of 2.5 % w v -1 sulphuric acid, temperature of 120 °C, and 40 min incubation
time, which might be considered a milder but more effective condition. Khambhaty et al.
(2013) applied the same treatment with minor modifications, where they used sulphuric
acid (2.5 % w v -1) and treated K. alvarezii biomass for 1 hour in 100 °C. Meinita et al.
(2012) used sulphuric acid (2 % w v -1) and 15 min treatment in 130 °C for the same
seaweed species.
The mild condition is utilised to prevent the over-decomposition of carbohydrate
(Yang et al., 2009). Khambhaty et al. (2012), using dilute acid (0.9 N H2SO4) hydrolysis,
obtained up to 30.6 % DW reducing sugar from K. alvarezii, while the value was
increased to 62.35 % DW with a combined acid-enzyme (Celluclast) method (Abd-Rahim
et al., 2014).
Agar contains D-and L-galactose, whereas carrageenan consists entirely of the D-
galactose (Percival 1979). Glucose is also another dominant reducing sugar in red
seaweeds. Wi et al. (2009) reported galactose and glucose as main reducing sugars in
109
Gelidium amansii, with values of 23.4 and 22.3 % DW, respectively. Other
monosaccharides such as rhamnose, arabinose, xylose, and mannose were detected at
very low amounts. The content of galactose may reach 87.3 % of total carbohydrate in
red seaweeds, such as Gracilaria cornea (Melo et al., 2002).
Hemicellulose encompasses xylans, xyloglucans, glucomannans, mannans, and beta-
glucans (Scheller & Ulvskov, 2010). Main sources of xylose that can be converted to
furfural is absent in seaweeds (Kraan, 2012). Another pentose sugar, arabinose, are also
scarce in seaweeds (Percival, 1979), resulting in low furfural levels. Generally, dilute acid
saccharification of seaweeds in the current study resulted in lower amounts of furfural
and TPC compared to 5-HMF. Galactose is the main component of galactan, which is the
major polysaccharide, namely agar and carrageenan, of red seaweeds, and consists of
galactose or modified galactose units (Percival, 1979).
Monosaccharide profiling confirmed that fucose was only detected in brown seaweeds.
Fucose is a deoxyhexose (6-deoxy-galactose) that is present in a wide variety of
organisms (Becker & Lowe, 2003). Fucoidans are polysaccharides consisting of L-fucose
and sulphate ester groups, found in brown seaweeds and some marine invertebrates (Li et
al., 2008). The presence of high glucose and galactose content after saccharification
confirms the viability of the seaweed to be used as feedstock for fermentation.
Acid hydrolysis can result in the degradation of carbohydrates to fermentation
inhibitors, including furfural, 5-HMF, acetic acid, levulinic acid, formic acid, uronic acid,
and formaldehyde and phenolic compounds, such as 4-hydroxybenzoic acid, vanillic acid,
vanillin, phenol, and cinnamaldehyde (Taherzadeh, 1999; Larsson et al., 2000). The TPC
such as 5-HMF and furfural were determined early on in the seaweed hydrolysates in the
present study. TPCs are derived from the degradation of lignin, while furfural is derived
from the degradation of pentose monosaccharides such as xylose and arabinose. Other
110
hexose sugars tend to decompose to 5-HMF and levulinic acid (Palmqvist & Hahn-
Hägerdal, 2000). Phenolic compounds are naturally present in some brown seaweeds;
29.01 ± 0.50 mg g-1 of phenolic compounds was reported in Turbinaria conoides
(Chandini et al., 2008), but less phenolic compounds are expected to be present in the
hydrolysates of Kappaphycus and Gracilaria, since they contain very little lignin (Wi et
al. 2009; Ge et al. 2011).
Polyphenolic compounds are derived from the degradation of lignin, while furfural is
derived from pentose monosaccharides degradation products, mainly xylose and
arabinose. Other hexoses sugars tend to form 5-HMF and levulinic acids (Palmqvist et
al., 2000). However, phenolic compounds are naturally present in some brown seaweeds,
(29.01 ± 0.50 mg g-1 of phenolic compound was reported in Turbinaria conoides)
(Chandini et al., 2008), while low phenolic compounds were expected to be present in
the hydrolysate, since seaweed carbohydrate contain low amounts of lignin (Wi et. al
2009; Ge et al., 2011). Furthermore, pentose sugars (xylose and arabinose) are detected
in low amount in seaweeds (Percival, 1979; Ly et al. 2005), therefore, low furfural such
as pentose sugar degradation product is expected. 5-HMF and levulinic acid are detected
in higher amounts in seaweed hydrolysate. Meinita et al. (2012) reported a value of 4.67
± 0.96 g L-1 5-HMF in K. alvarezii. They used activated charcoal to remove this
compound, and reduced it to 1.14 ± 0.02 g L-1. In another study on the same red seaweed,
a total of 4.23 ± 1.50 g L-1 of 5-HMF was detected in seaweed hydrolysate. Over-liming
and activated charcoal were applied to remove the fermentation inhibitor (Jeong et al.,
2013). The presence of 5-HMF is also reported in G. amansii in hydrolysate at 4.8 g L-1,
but no detoxification treatment was applied prior to the fermentation study (Cho & Kim,
2014).

111
In summary, the data gathered in this study proved that two red seaweed species, K.
alvarezii and G. manilaensis, are suitable for further studies and can be utilized as
feedstock for generating reducing sugars to produce bioethanol.
5.2 Optimization of saccharification of K. alvarezii and G. manilaensis
In this study, we used dilute acid treatment to screen seaweeds. Dilute acid conversion
is the most feasible technology for generating reduced sugars. This technology represent
the best commercialisation option (Kaylen et al., 2000).
Based on high total carbohydrate contents, high reduced sugar contents and the ease
of mass cultivation, K. alvarezii and G. manilaensis were selected for evaluating their
potential as a feedstock for bioethanol production. The advantage of using K. alvarezii is
that carrageenan, as the main component of this seaweed, contains the basic unit of D-
typed galactose, which is easily fermented by yeast and bacteria (Meinita et al., 2012),
but agar hydrolysate from Gracilaria consist of galactose and 3,6-anhydro-L-galactose,
where the latter cannot be metabolised by common microorganisms, thus precluding it
from producing ethanol (Yun et al., 2014).
To select the best acid for dilute acid treatment, G. manilaensis was used as seaweed
sample (Figure 4.1). Sulphuric acid showed better performance in this study, along with
perchloric acid. Currently, most studies have been conducted using sulphuric acid, not
only due to its high acidity, but also its reasonable associated costs (Harris et al., 1945;
Wright & Power 1986; Hashem & Rashad 1993). However, Abd Rahim et al. (2014)
found no significant difference between the use of H2SO4 and HCl, and obtained sugar
yields of 42.8 and 44.8 % DW, respectively, under conditions of 110 °C and incubation
time of 90 min.
112
The physical condition of the biomass was also studied, where higher yield achieved
from the dry biomass that showed that the drying makes the seaweed easier to break
(Moore et al. 2008) thus facilitating easier saccharification.
Dilute-acid hydrolysis is less expensive compared to the use of enzymes for
saccharification. The former allows the direct transfer of the treated sample to a secondary
enzymatic hydrolysis process to further increase the sugar yield (Ge et al. 2011).
However, a disadvantage of acid treatment is the production of fermentation inhibitors
(Taherzadeh & Karimi, 2007).
Kinetic studies on the dilute acid treatment of various biomass indicated that the
hydrolysis kinetic factors are strongly dependent on the biomass and acid concentrations,
incubation time, and temperature (Malester et al., 1988; Lenihan et al., 2010).
Kappaphycus alvarezii and G. manilaensis were hydrolysed at various acid
concentrations, temperature, and incubation times. In this study, we selected 2.5 % w v-1
sulphuric acid, a temperature of 120 °C, and 40 min incubation time, which is regarded
as milder, but still effective, as the most suitable conditions for hydrolysis. In the present
study, the hydrolysis treatment reduced sugar yields to 34 % DW (K. alvarezii) and 33 %
DW (G. manilaensis). Meinita et al. (2012) used a range of acid hydrolysis conditions on
K. alvarezii, and reported that the best conditions were 0.2 M sulphuric acid and 15 min
incubation time at 130 °C. The sugar yield was 30.5 g L-1 with 25.6 g L-1 galactose and
the ethanol yield reached 1.7 g L-1 hydrolysate.
Increasing hydrolysis time decreased production due to the sugar degrading into
fermentation inhibitors such as 5-HMF and levulinic acid. Khambhaty et al. (2012) used
sulphuric acid (2.5 % w v-1) at 100 °C and an incubation time of 60 min, obtaining up to
30.6 % DW sugar yield from K. alvarezii. In another study, the best condition for
113
hydrolysing G. salicornai was a temperature of 120 °C , 2 % w v-1 sulphuric acid, and 30
min incubation time (Wang et al., 2011).
Park et al. (2012) used continuous acid hydrolysis in a reactor to obtain higher sugar
yields and lower levels of fermentation inhibitors from Gelidium amansii. Park et al.
(2012) used 4 % sulphuric acid at 190 °C, and obtained 38.09 % glucose from G. amansii.
In another strategy, lower temperatures and longer incubation times compared to our
pre-set optimal conditions were used in other studies. In one study, Laminaria hyperborea
was treated for 60 min at 65 °C (Horn et al., 2000), while Khambhaty et al. (2013) set a
temperature of 100 °C and 60 min incubation time to treat K. alvarezii.
However, dilute-acid hydrolysis is an inexpensive process compared to the enzymatic
process. The generation of fermentation inhibitors is regarded as one of its main
drawbacks (Taherzadeh et al., 2007). Generally, increasing the hydrolysis time decreased
production, due to sugar degradation into fermentation inhibitors such as 5-HMF and
levulinic acid (Ra et al., 2013).
In order to detoxify dilute acid hydrolysate, several approaches has been applied
prior to fermentation process, such as over-liming, neutralisation, activated charcoal,
extraction with ethyl acetate, membrane-mediated detoxification, evaporation, and
certain biological procedures (Chandeli et al., 2011). Among these approaches, over-
liming is an effective way of reducing the toxicity of hydrolysates generated from dilute
acid treatment of biomass (Mohagheghi et al., 2006) using over-liming and activated
charcoal to remove fermentation inhibitors (Jeong et al., 2013). 5-HMF (4.8 g L-1 ) was
reported in G. amansii hydrolysate (Cho & Kim, 2014). Generally, the use of over-liming
eliminates fermentation inhibitors to a safe(r) level. Activated charcoal (26 %) was used
by Hargreaves et al (2013) in K. alvarezii to detoxify 20 g L-1 5-HMF, reaching <1 g L-1.

114
Dissimilar to dilute acid hydrolysis, mild conditions are applied in enzymatic
treatment, resulting in the absence of fermentation inhibitors and high yields of
hydrolysis. Nonetheless, the bottleneck of the enzymatic approach in biomass treatment
is high, which hinders its commercial application in the biofuel industry (Taherzadeh &
Karimi, 2007b). There has been great interest in lower enzyme consumption or recycling
enzyme in order to render it feasible for industrial applications (Jordan & Theegala, 2014;
Tu et al., 2009; Weiss et al., 2013).
In the current study, results indicated that 10 % w v-1 of cellullytic enzyme is effective
for the saccharification of biomass. Other studies reported lower dosage of the enzyme,
where Baghel et al. (2015) used 2 % dosage to convert seaweed biomass, while in another
study, 5 % cellulolytic enzyme (CTec 2) was used (Manns et al., 2015).
Distillation is one of the most energy-intensive steps in ethanol production (Hoyer et
al., 2009), and several studies have concluded that the ethanol concentration being
generated should reach ~ 4 – 5 % to render the process economically feasible (Fan et al.,
2003; Lu et al., 2010). The trend of energy demand for distillation of fermented syrup at
dilute ethanol concentration is shown in Figure 5.1. Some attempts have been made to
increase the concentration of ethanol obtained from lignocellulose. Lu et al. (2010)
obtained up to 49.5 g L-1 ethanol by applying high solid concentration to the fermentation
of steam-exploded corn stover. (Yamashita et al., 2010) succeeded in producing an
approximate concentration of 73 g L-1 ethanol by using organosolv pre-treated Japanese
cedar. Therefore, we attempted to determine the optimum condition in order to realise the
highest enzymatic conversion efficiency and most concentrated glucose. So, the effect of
the ratio of liquid: solid on enzymatic hydrolysis yield was evaluated, and the ratio of 7.5
: 1 was confirmed to be the best condition, where 78.11 % of biomass was converted to
glucose, and a 20.82 % glucose concentration was achieved. Hargreaves et al. (2013)
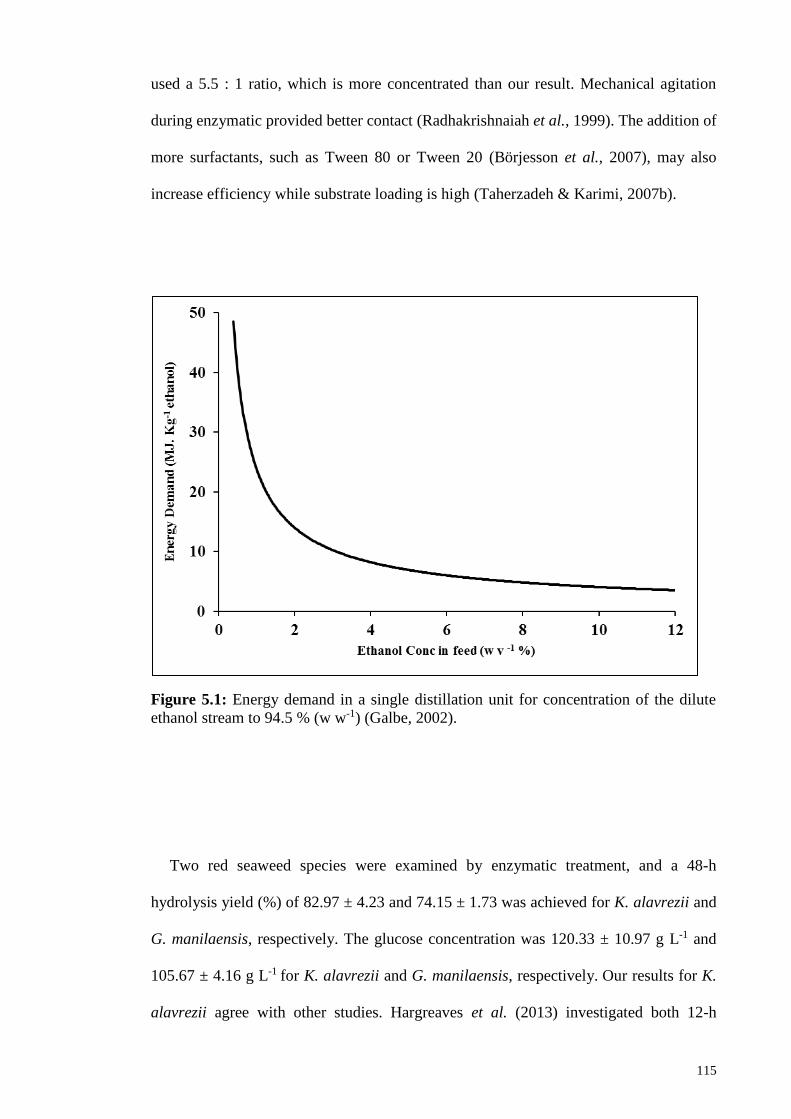
115
used a 5.5 : 1 ratio, which is more concentrated than our result. Mechanical agitation
during enzymatic provided better contact (Radhakrishnaiah et al., 1999). The addition of
more surfactants, such as Tween 80 or Tween 20 (Börjesson et al., 2007), may also
increase efficiency while substrate loading is high (Taherzadeh & Karimi, 2007b).
Figure 5.1: Energy demand in a single distillation unit for concentration of the dilute
ethanol stream to 94.5 % (w w-1) (Galbe, 2002).
Two red seaweed species were examined by enzymatic treatment, and a 48-h
hydrolysis yield (%) of 82.97 ± 4.23 and 74.15 ± 1.73 was achieved for K. alavrezii and
G. manilaensis, respectively. The glucose concentration was 120.33 ± 10.97 g L-1 and
105.67 ± 4.16 g L-1 for K. alavrezii and G. manilaensis, respectively. Our results for K.
alavrezii agree with other studies. Hargreaves et al. (2013) investigated both 12-h
116
enzymatic efficiency and glucose concentrations, which are critical factors in enzymatic
hydrolysis. They achieved the highest glucose concentration under 18 % cellulosic
residue loading (92.3 g L-1 glucose), with 77.3 % enzymatic efficiency, which is lower
than our values. Moreover, they reported 84.1 % as their highest enzymatic yield. To
ensure complete hydrolysis of biomass, a 48 - 72 h treatment is recommended by enzyme
provider. In the current study, overall, after 48 h of incubation, further enzymatic
hydrolysis did not significantly increase the concentration of glucose.
As far as we are aware, there have been no reports pertaining to the enzymatic
hydrolysis of G. manilaensis. Instead, other species of Gracilaria have attracted more
attention. G. dura was investigated for enzyme treatment at the optimum condition of 2
% enzyme and a hydrolysis period of 36-h at a temperature of 45 °C (Baghel et al., 2015).
They reported 910 mg glucose g-1 cellulosic. The dry weight of this species was 12.24 ±
0.09 %, while the cellulosic matter had a fresh weight of 3.70 ± 0.13 %. In another study,
G. salicornia was hydrolysed by cellulose, and 15.1 mM glucose was achieved after 4 h
incubation (Wang et al., 2011). Kawaroe et al. (2013), with similar seaweed species,
reported 0.80 g glucose g-1 biomass.
Gracilaria verrucosa was studied in another research, and 0.87 g sugars g-1 cellulose
was generated under enzymatic treatment. Another study on G. verrucosa was conducted
by adding 16 U mL-1 of single and mixed enzymes using Spirizyme Fuel, Viscozyme L,
and Celluclast 1.5 L (Ra et al., 2015). In a slurry with 60 g DW total carbohydrate L-1,
21.7 g L-1 glucose was generated after 24 h of treatment with mixed enzymes (Viscozyme
L and Celluclast 1.5 L).
Low saccharification yield was reported in acid treatment residues, as notable
amount of residues that are not cellulosic matter exist in the form of ash or residual
117
phycocolloids. It might be more effective to use an enzyme cocktail rather than a single
enzymatic treatment.
All in all, the data obtained from this study seemed to suggest that both seaweed
species carbohydrate can be converted to reduce sugar by applying dilute sulphuric acid
at 120 °C for 40 min, which results in the highest amount of reduced sugar. Enzymatic
hydrolysis is another effective approach to convert seaweed cellulosic residues by
applying 10 % w w-1 commercial cellulase for 48 h incubation time at 50 °C. The data
obtained from this study seems to imply that higher hydrolysis efficiency and
concentrated reduced sugar (glucose) can be generated by enzymatic approach, while
faster hydrolysis can be done with dilute acid treatment. It is also believed that the higher
enzymatic cost of enzymatic hydrolysis is a limiting factor, and efforts are ongoing to
reduce cost via recycling.
5.3 Fermentation of seaweed hydrolysate to bioethanol
In fermenting seaweed hydrolysates, fermentative microorganism (yeast or bacteria)
consume reduced sugar to produce bioethanol in an anaerobic condition. Saccharomyces
cerevisiae is the most common microorganism used in anaerobic fermentation, and it has
proven itself to be highly vigorous and well fitted for conversion of cellulosic
hydrolysates into bioethanol. Zymomonas mobilis can ferment glucose to ethanol with
higher yields due to the reduced production of biomass, but is less robust (Galbe, 2002).
It is assumed that the selection of proper fermentative microorganism and the acclimation
to seaweed hydrolyzate are key factors in the successful seaweed usage in biofuel
production, which resulted in many studies pertaining to this area (Kawai & Murata,
2016).
118
In the present study, two starins of S. cerevisiae and B. bruxellensis were evaluated,
and from these, one strain of S. cerevisiae, Ethanol Red, Fermentis, France, showed
significantly higher ethanol production efficiency (Figure 4.18). It was reported that B.
bruxellensis performed well on co-fermentability using reagent grade of mixed sugar,
comprising of galactose and glucose as substrates to produce ethanol (Park et al., 2012).
They used B. bruxellensis to co-ferment G. amansii hydrolysate containing galactose and
glucose, and a 91 % fermentation efficiency was reported.
Compared with B. bruxellensis, many studies have been conducted using Ethanol Red,
which is the industrial strain of S. cerevisiae (Yan et al., 2011, Gill et al., 2012; Bischoff
et al. 2016; Pedersen, 2016;). Furthermore, this strain is reported to perform well in mixed
sugar media (Klaassen et al., 2015), and few studies have been conducted using this strain
to ferment seaweed hydrolysate (Adams et al., 2009; Adams et al., 2011).
In the present study, seaweed hydrolysates were fermented by Ethanol Red. The initial
reduced sugar content in acid hydrolysate of K. alvarezii and G. manilaensis were 61.28
± 2.98 g L-1 and 55.76 ± 3.28 g L-1, respectively. The highest ethanol concentration in K.
alvarezii was achieved after 72 h (Figure 4.20), while in G. manilaensis, the maximum
ethanol concentration was generated after 48 h (Figure 4.21). Adams et al. (2009)
reported that when using Ethanol Red, the highest ethanol concentration from fresh and
defrosted seaweeds (S. latissima) was achieved at 55 and 48 h, respectively. The ethanol
yield was 20.90 ± 1.81 g L-1, corresponding to 76.75 % of theoretical yield, while these
values for G. manilaensis were 20.62 ±1.68 g L-1 and 72.50 %, respectively.
The low ethanol production rate and fermentation efficiency in both seaweeds are due
to the presence of galactose in dilute acid hydrolysate as the main reducing sugar content
as yield and productivity from galactose are notably lower than yields from glucose (Hong
et al., 2011; Lee et al., 2011), since D-galactose undergoes conversion via the Leloir
119
pathway (Frey, 1996). Basically, in this pathway, a five-step enzymatic pathway converts
D-galactose to glucose-6-phosphate, resulting in higher energy consumption (Timson,
2007). For starters, galactose is transported into the cell by galactose permease (Gal2)
(Tschopp et al., 1986). The conversion of D-galactose to glucose-1-phosphate is achieved
by the four reactions, catalysed by Gal10, Gal1, and Gal7, which constitutes the Leloir
pathway (Holden et al., 2003). All these processes lead to higher energy consumption in
galactose metabolism, thus lower fermentation yield compared with glucose.
Some studies have been carried out to improve the efficiency of ethanol from galactose
using the transformed S. cerevisiae (Ostergaard et al., 2000; Bro et al., 2005; Hong et al.,
2011; Lee et al., 2011). Bro et al. (2005) reported a fermentation yield of 0.29 g g-1 in a
genetically transformed strain of S. cerevisiae, demonstrating better yield compared to
the control (0.18 g g-1 galactose), while in another study, Meinita et al. (2012) reported
higher fermentation yields from pure galactose, at 0.32 g g-1.
According to our results, the fermentation of enzymatic hydrolysate from both
seaweeds dilute acid residues is less difficult, and higher fermentation yield was realised,
where 91 % and 95 % theoretical fermentation efficiency was produced in K. alvarezii
and G. manilaensis. Unlike ethanol concentration from dilute acid hydrolysates, the
ethanol concentration generated by both seaweed residue via the enzymatic approach falls
within an acceptable range of > 5% v v-1 (Fan et al., 2003; Lu et al., 2010).
Based on the results of the current study, 33.4 g and 33.2 g ethanol can be extracted
from 1 kg DW of K. alvarzeii and G. manilaensis through enzymatic treatment of dilute
acid residues, respectively, which is comparable to the yield of ethanol in G. verrucosa,
at 38 g ethanol per kg DW (Kumar et al., 2013). These findings are indicative of the fact
that more opportunities can be expected in enzymatic hydrolysis of seaweeds rather than
dilute acid treatment. However, it is not cost effective.
120
Overall, the cumulative ethanol production by both dilute acid and enzymatic
treatment shows that 105.9 g ethanol, which is equivalent to 134 mL of ethanol, can be
extracted from 1 kg DW of K. alvarezii, while 112.5 g ethanol, or 142.4 mL, can be
obtained from G. manilaensis. This yield is higher compared to a similar study conducted
on G. Salicornia, which was 79.1 g per kg DW (Wang et al., 2011).
In the same study, Gracilaria sp. was converted to reduced sugar using sequential
acid and enzymatic hydrolysis (Wu et al., 2014) processes. They reported 0.48 g g-1
ethanol per reduced sugar corresponding to a 94 % fermentation efficiency, where 236 g
of ethanol was extracted from 1 kg DW, and 38 g of ethanol was extracted per kg DW
G. from verrucosa (Kumar et al., 2013).
Previous studies have introduced K. alvarezii as a promising feedstock for the
production of bioethanol (Khambhaty et al., 2012; Hargreaves et al., 2013; Mansa et al.,
2013), and our study indicates that G. manilaensis can also be cultivated to serve as a
bioethanol feedstock.
In summary and based on the gathered results, it can be concluded that although the
efficiency of fermentation from seaweed reducing sugars was lower than land-based
crops, the advantages of seaweed cultivation over land-based crop render these seaweeds
as viable feedstock for the production of bioethanol in Malaysia.
Regardless of the developments in GC techniques, injecting aqueous samples for gas
chromatography analyses is a topic of great interest, due to the fact that it is hazardous to
not only gas chromatograph machine and capillary column, but it is also capable of
interrupting the results of the analyses. There is a need to minimise the negative effects
of sample preparation, which is assumed to be the most time-consuming and labour-
intensive task involved in the analytical scheme (Santos & Galceran, 2002). Due to the

121
need for an effective, robust, and reliable sample preparation, many procedures have been
developed with the aim of achieving fast, simple, and, if possible, solvent-free or solvent-
minimised operations.
The main issue with water in GC-samples is its large expansion volume. It starts
in the injector, where the samples are vaporised so that the analytes can be swept into the
column by the carrier gas; a problem known as back-flash (Kuhn, 2002). Some common
solvents and their corresponding vapour expansion volumes are tabulated in Table 5.2.
Another concern regarding the presence of water in the samples are the degradation of
the stationary phase, since water is capable of interacting with the stationary phase of the
polymer (de Zeeuw & Luong, 2002).
The presence of water-soluble compounds in fermented samples, such as plant
pigments, proteins, lipids (Miyazawa et al., 1991; Palmqvist & Hahn-Hägerdal, 2000;
Wu et al., 2007; Hou et al., 2015) and fermentation additives (yeast extract, meat peptone,
vitamins, enzymes, etc.) are matters of concern in the context of GC analysis. Generally,
these compounds are non-volatile and are retained in GC-units, mostly the injection
chamber, column, and even detectors.

122
Table 5.2: Solvents and their corresponding vapour volume in injector temperature 250
°C; pressure 20 psi. Solvent sample 1uL Approximate Vapour
Volume (µL)
Isooctane 110
n-Hexane 140
Toluene 170
Ethyl acetate 185
Acetone 245
Methylene chloride 285
Carbon disulphide 300
Acetonitrile 350
Methanol 450
Water 1010
The values are calculated using flow calculator application can be downloaded from Agilent Technologies’
web site (http://www.chem.agilent.com).
Overall, the addition of this solvent mixture result in the reduction of water by almost
10 % (added solvent to the ratio of 9:1). Considering 1 µL sample injection and a split
ratio of 100 : 1 in split/split less injector, a maximum of 1 nL of water could enter the
injection chamber and capillary column, respectively, which is 10 times lower compared
to direct sample injection.
Also, applying this simple approach, fewer unwanted compounds would pass through
the GC machine, including the path of injection part, column, and detector. Thus, it would
lead to the increased life-span of capillary column and maintenance of the system’s
cleaner over injections.
Moreover, the accuracy of the method did not fall within an acceptable R2 in a standard
plot (APPENDIX O).
123
5.4 Dilute acid hydrolysis at low temperature, a novel approach
Currently, two main approaches of acid based hydrolysis were introduced, which are
dilute and concentrated acid methods (Taherzadeh & Karimi, 2007a). Each of these
approaches encompasses various advantages and disadvantages that have been reviewed
previously (Table 2.2). In this study, two red seaweed species, including K. alvarezii and
G. manilaensis were examined using response surface methodology (RSM) for a new
approach of acid based hydrolysis, which is the application of dilute acid at lower than
80 °C incubating temperature range at longer incubation times.
In this experiment, the lack of fit was not statistically significant in both seaweed
species (Tables 4.10 and 4.11), as the P values exceeded 0.05, indicating that the RSM
can be applied for predicting the optimum. However, the validation of optimum condition
resulted in different values for K. alvarezii and G. manilaensis, where a significant
difference (p < 0.05) was observed in the predicted and experimental reduced sugar yields
in K. alvarezii (Table 4.9), while in G. manilaensis, the method was validated as the
difference between the predicted and experimental yield as not being significantly
different (P > 0.05). Failure in validating the optimisation method for K. alvarezii might
be due to the occurrence of sugar decomposition in this species.
Up till this point, dilute acid treatment under mild temperature (below 80 °C) of any
biomass has not been reported in literature. Hereby, the acceptable yield of reducing
sugars in both seaweed species by this approach indicates that the application of low
temperature and low acid concentration at longer incubation time can be assumed to be
an effective method for saccharification of the macrolagal biomass, although this claim
needs to be evaluated by other seaweed species.
124
The possible advantages of this approach are:
1. The usage of high temperatures would reduce the cost of facility and heat
generation in the reactors (Taherzadeh & Karimi, 2007a).
2. The generation of fermentation inhibitor is expected to decrease due to the smaller
amount of carbohydrate decomposition in mild temperatures (Larsson et al., 1999).
Therefore, we expect to be able to optimise this approach, not only in the context of the
efficiency of saccharification, but also decreasing fermentation inhibitors in hydrolysate,
resulting in immediate fermentation post-pH adjustment. The loss of reduced sugars
during the detoxification process have been reported.
3. Providing optimum temperatures (65-80 °C) will provide a feasible approach of
biomass treatment once this method is coupled with other sustainable heat production
systems, such as solar thermal heating, which is suitable for tropical climates (Mekhilef
et al., 2012).

125
CHAPTER 6: CONCLUSION
6.1 Conclusion
Based on the medium variant projection, the global population of 7.2 billion in mid-
2013 is expected to reach 8.1 billion in 2025, and 9.6 billion in 2050 (DeSA, 2013). The
need to develop alternatives to fossil fuels is therefore inevitable. This study evaluated
seaweed resources of Malaysia in the event they could be utilised as feedstock to produce
bioethanol.
Among all of the seaweeds that were examined, the red seaweeds showed the
highest carbohydrate content, particularly two red seaweed species, K. alvarezii, which is
well-studied in terms of bioethanol production, and G. manilaensis. Both were hydrolysed
by applying dilute acid treatment and enzymatic approach, followed by fermentation
using an acclimated yeast. Calculated ethanol yield per kg DW with K. alvarezii and G.
manilaensis were 105.9 g and 112.5 g, respectively.
Therefore, these seaweed species can be utilised as feedstock for bioethanol
production in Malaysia, however, this process is not without its problems. The main
difficulty with ethanol production using seaweeds is the nature of carbohydrate, which is
mostly made up of galactose, and also the presence of sulphated bonds. Galactose yield
was determined to be low, and its metabolism is even slower compared to glucose. Proper
yeast or bacteria that was acclimated with galactose was suggested for use in the process
of removing the sulphate bond, however, the overall process needs to be improved (Cho
& Kim, 2014; Kim et al., 2014; Kimet al., 2013). More investigation is also needed to
develop a more effective thermo-chemical treatment using different acid types and
concentrations to optimise the hydrolysis process. Effective and cheap enzymes must be
applied to increase the efficiency of hydrolysis and optimise fermentation in order
increase bioethanol yield from seaweeds.
126
One can challenge the cultivation of red seaweed for bioenergy production, as
phycocolloids have a higher value of 10.5- 18 USD kg-1 (Bixler & Porse, 2011) compared
to biofuel, which is much cheaper. However, taking into account the market size for
global phycocolloids production and demand, which was 86,000 tonnes in 2009 (Bixler
& Porse, 2011), it illustrates the huge distinction between these two industries, revealing
the fact that in the context of economics, seaweed cultivation can be logical for the
generation of biofuels.
Although most prior reports showed that substituting biofuels for gasoline will
reduce greenhouse gasses because biofuels sequester carbon via growth of the feedstock,
using a worldwide agricultural model to estimate emissions from land use change,
Searchinger et al. (2008) reported that final result of using land crop-based bioethanol
instead of producing a 20% savings, nearly doubles greenhouse emissions over 30 years
and increases greenhouse gasses for the next 167 years (Searchinger et al., 2008). They
also pointed out that biofuels from switchgrass, if grown on U.S. corn lands, increase
emissions by 50%. This raises concerns about large corn-based biofuel, and highlights
the value of utilising other sources to produce biofuels. Therefore, producing bioethanol
from marine algae has recently attracted more attention.
Moreover, in this study, a novel approach to sample preparation for analysing ethanol
in the fermented sample was introduced, which enhances the accuracy of measurement
and increase the life-span of capillary column and gas chromatograph parts.
We also introduced a new cost effective procedure for seaweed biomass hydrolysis
using dilute acid treatment. This method can examine other polysaccharides that can be
digested in a mild condition, such as starch in marine and land-based crops.

127
All in all, despite the fact that ethanol yield range obtained in this investigation is
lower than land-based crops, taking into account the unique advantages of cultivating
seaweeds over land-based crop, it can be concluded that red seaweeds are a suitable
alternative feedstock for the production of ethanol in Malaysia. It should also be pointed
out that the cultivation of seaweed for biofuel production is not economically feasible,
and we strongly suggest that the industry produce bioethanol as petroleum additive to
replace methyl tert-butyl ether (MTBE), which is a highly carcinogenic compound,
currently added to petroleum in developing countries such as Malaysia. Many
investigations have confirmed its carcinogenic attribute (Mehlman, 1998; Mehlman,
1996). MTBE is an oxygenate compound that is added to petroleum to raise its octane
number. Its production and consumption have been banned in the USA from 2004
(Metcalf et al., 2016), and has now been replaced by ethanol.
This could present an additional incentive for the replacing MTBE with bioethanol
from renewable resources such as seaweeds. Seaweed cultivation can also remove
nutrients from wastewaters (Rabiei et al., 2015; Rabiei et al., 2016), as well as reduce the
content of carbon dioxide from the atmosphere (Hughes et al. 2012; Kader et al., 2013;
Liu 2013). Seaweed cultivation for biofuel can be a sustainable and environment friendly
process, rendering the cultivation of K. alvarezii and G. manilaensis in Malaysia an
important activity for the production of bioethanol on an economically feasible basis.
128
6.2 Appraisal of this study
This study illustrated a real image of potential seaweed resources of tropical region in
order to be used as bioethanol feedstock, and simultaneously, issues with using seaweed
biomass as well. We found that two red seaweeds, K. alvarezii and G. manilaensis, are
well-established in Malaysia in the context of mass production (Phang et al. 1996; Phang
2010). They have the highest potential for use as feedstock to produce bioethanol.
The fermentation yield in this work was in line with other crops, so in the event that
the production of bioethanol becomes vital in the near future, seaweeds might serve to be
an alternative that warrants further investigations, and the results of this study would be
good start.
Moreover, a new approach of biomass hydrolysis was tested in this study, where dilute
acid treatment in mild condition showed promising results. Provided that optimisation
can be conducted in order to increase the yield of reduced sugars, our proposed approach
can be efficiently applied for the production of biofuels.
6.3 Areas for future research
Due to unique nature of seaweed carbohydrate, up till this point, the complete
utilisation of reduced sugar obtained by seaweeds is unfeasible, therefore, more
investigations is warranted in order to increase the efficiency of fermentation in order to
increase the yield of bioethanol. Part of the problem is the fact that industrial yeast is
generally isolated or engendered, acclimated, and used to assimilate land-crop based
sugars to bioethanol, which are obviously inefficient for marine-based sugars. Thus,
isolating or engineering fermentative microorganisms (yeasts or bacteria) that are capable

129
of tolerating higher salinity or the presence of sulphate in media, and more importantly in
different reduced sugars rather than glucose or xylose in seaweed biomass.
Moreover, as seaweeds are aquatic plants, they tend to absorb and retain a great
amount of water, thus obtaining concentrated slurry of seaweed biomass is not a simple
affair, and consequently, reduced sugar and ethanol content can hardly touch industrial
requirements. Therefore, creative methods in order to solve this issue to increase the
reduced sugar contents in the seaweed hydrolysate is needed.
One of the bottlenecks of bioethanol production from seaweeds towards industrial
scale is that researches have not focused heavily upon the production of bioethanol from
macrolagal biomass, although some researchers and institutes are claiming to pursue this
technology. More organised research with powerful governmental support is needed to
develop applicable approaches for bioethanol production from seaweeds.
130
REFERENCES
Abbott, I. A. (1982). Seaweeds and their uses: V. J. Chapman and D.J. Chapman. 3rd
edn., Chapman and Hall, London and New York, 1980, Aquatic Botany, 12(0),
389-390.
Abdullah, M. I., & Fredriksen, S. (2004). Production, respiration and exudation of
dissolved organic matter by the kelp Laminaria hyperborea along the west coast
of Norway. Journal of the Marine Biological Association of the United Kingdom,
84(05), 887-894.
Adams, J. M., Gallagher, J. A., & Donnison, I. S. (2009). Fermentation study on
Saccharina latissima for bioethanol production considering variable pre-
treatments. Journal of Applied Phycology, 21(5), 569-574.
Adams, J. M. M., Toop, T. A., Donnison, I. S., & Gallagher, J. A. (2011). Seasonal
variation in Laminaria digitata and its impact on biochemical conversion routes to
biofuels. Bioresource Technology, 102(21), 9976-9984.
Ahmad, A. (2014). Bioethanol production from cellulose in red algae Gracilaria verrucosa
BY separated hydrolysis and fermentation system using Trichoderma viride and
Zymomonas mobilis. International Journal of Pharma and Bio Sciences, 5 (2) :
(B) 445 - 452.
Alkasrawi, M., Eriksson, T., Börjesson, J., Wingren, A., Galbe, M., Tjerneld, F., &
Zacchi, G. (2003). The effect of Tween-20 on simultaneous saccharification and
fermentation of softwood to ethanol. Enzyme and Microbial Technology, 33(1),
71-78.
Amanullah, T. R., Krishnan, D., Senthil Balaji, D., Ganesan, K., Anand, B. G.,
Barthelomai, I. S., . . . Chinnasamy, S. K. (2013). Effective production of ethanol-
from-cellulose (EFC) from cheap sources sawdust and seaweed Gracilaria edulis.
Advances in Applied Science Research, 4(5), 213-222.
Ananthaswamy, A., & Le Page, M. (2012). How clean is green? New Scientist, 213(2849),
34-38.
Angelidaki I., Ellegard L., & Ahring B. K. (1999) A comprehensive model of anaerobic
bioconversion of complex substrates to biogas. Biotechnology Bioengineering
63:363–372.
Association of Official Analytical Chemists (2000) Official methods of analysis of
AOAC International, (17th ed.), Gaithersburg, MD, USA: AOAC.
Armisen, R. (1995). World-wide use and importance of Gracilaria. Journal of Applied
Phycology, 7(3), 231-243.
Badger, P. C. (2002). Ethanol from cellulose: A general review. Trends in New Crops
and New Uses, 14, 17-21.
131
Baghel, R. S., Trivedi, N., Gupta, V., Neori, A., Reddy, C., Lali, A., & Jha, B. (2015).
Biorefining of marine macroalgal biomass for production of biofuel and
commodity chemicals. Green Chemistry, 17(4), 2436-2443.
Bagi Z., Acs N., Balint B., Hovrath L., Dobo K., Perei K. R., Rakhely G., & Kovacs K.
L. (2007) Biotechnological intensification of biogas production. Applied
Microbiology Biotechnology, 76:473–482.
Balat, M., Balat, H., & Öz, C. (2008). Progress in bioethanol processing. Progress in
Energy and Combustion Science, 34(5), 551-573.
Balzert, H. (1999). Lehrbuch der Objektmodellierung (Vol. 2): Spektrum Akademischer
Verlag Heidelberg.
Barbeyron, T., Michel, G., Potin, P., Henrissat, B., & Kloareg, B. (2000). ι-Carrageenases
constitute a novel family of glycoside hydrolases, unrelated to that of κ-
carrageenases. Journal of Biological Chemistry, 275(45), 35499-35505.
Barsanti, L., & Gualtieri, P. (2005). Algae: anatomy, biochemistry, and biotechnology:
CRC press.
Bashir, S., & Lee, S. (1994). Fuel ethanol production from agricultural lignocellulosic
feedstocks- a review. Fuel Science and Technology International, 12(11-12),
1427-1473.
Becker, D. J., & Lowe, J. B. (2003). Fucose: biosynthesis and biological function in
mammals. Glycobiology, 13(7), 41R-53R.
Bender, E. (1980). Marine biomass research advances. Sea Technology.;(United States),
21(8), 19-24.
Berkowitz, M. (1996). World’s earliest wine. Archaeology, 49(5), 26-26.
Bermúdez, J. M., Francavilla, M., Calvo, E. G., Arenillas, A., Franchi, M., Menéndez, J.
A., & Luque, R. (2014). Microwave-induced low temperature pyrolysis of
macroalgae for unprecedented hydrogen-enriched syngas production. RSC
Advances, 4(72), 38144-38151.
Binod, P., Sindhu, R., Singhania, R. R., Vikram, S., Devi, L., Nagalakshmi, S., . . .
Pandey, A. (2010). Bioethanol production from rice straw: an overview.
Bioresource Technology, 101(13), 4767-4774.
Bischoff, K. M., Zhang, Y., & Rich, J. O. (2016). Fate of virginiamycin through the fuel
ethanol production process., World Journal of Microbiology and Biotechnology
32(5), 1-7.
Bixler, H. J., & Porse, H. (2011). A decade of change in the seaweed hydrocolloids
industry. Journal of Applied Phycology, 23(3), 321-335.
Börjesson, J., Peterson, R., & Tjerneld, F. (2007). Enhanced enzymatic conversion of
softwood lignocellulose by poly (ethylene glycol) addition. Enzyme and
Microbial Technology, 40(4), 754-762.

132
Borowitzka, M. A. (1998). Tubular photobioreactors for large-scale algal culture (pp.
249-257): Oxford and IBH Publishing Co., New Delhi.
Bramarambica K., Murthy J. V. V. S. N., & Harasreeramulu S. (2014) A study on the
geographical variation of nutritive aspects of Caulerpa- a marine alga of
Visakhapatnam coast , India. Journal of Algal Biomass Utilization. 2014, 5 (4):
44-49.
Briens, C., Piskorz, J., & Berruti, F. (2008). Biomass Valorization for Fuel and Chemicals
Production-A Review. International Journal of Chemical Reactor Engineering,
6(1).
Bro, C., Knudsen, S., Regenberg, B., Olsson, L., & Nielsen, J. (2005). Improvement of
galactose uptake in Saccharomyces cerevisiae through overexpression of
phosphoglucomutase: example of transcript analysis as a tool in inverse metabolic
engineering. Applied and Environmental Microbiology, 71(11), 6465-6472.
Brown, T. M., Duan, P., & Savage, P. E. (2010). Hydrothermal liquefaction and
gasification of Nannochloropsis sp. Energy and Fuels, 24(6), 3639-3646.
Burtin, P. (2003). Nutritional value of seaweeds. Electronic Journal of Environmental,
Agricultural and Food Chemistry, 24, 498-503.
Canfield, D. V., Smith, M. D., Adams, H. J., & Houston, E. R. (1998). Selection of an
Internal Standard for Postmortem Ethanol Analysis. Federal aviation
administration oklahama city OK civil aeromedical institute.
Castanon, M., & Wilke, C. R. (1981). Effects of the surfactant Tween 80 on enzymatic
hydrolysis of newspaper. Biotechnology and Bioengineering, 23(6), 1365-1372.
Chandel, A. K., da Silva, S. S., & Singh, O. V. (2011). Detoxification of lignocellulosic
hydrolysates for improved bioethanol production. In Biofuel production-Recent
developments and prospects. InTech.
Chandini, S. K., Ganesan, P., & Bhaskar, N. (2008). In vitro antioxidant activities of three
selected brown seaweeds of India. Food Chemistry, 107(2), 707-713.
Chi, W.-J., Chang, Y.-K., & Hong, S.-K. (2012). Agar degradation by microorganisms
and agar-degrading enzymes. Applied Microbiology Biotechnology, 94(4), 917-
930.
Cho, H. Y., & Kim, S. K. (2014). Bioprocess and Metabolic Engineering: Ethanol
Production from the Seaweed Gelidium amansii, Using Specific Sugar
Acclimated Yeasts. Journal of Microbiology and Biotechnology, 24(2), 264-269.
Cho, Y., Kim, H., & Kim, S.-K. (2013). Bioethanol production from brown seaweed,
Undaria pinnatifida, using NaCl acclimated yeast. Bioprocess and Biosystems
Engineering, 36(6), 713-719.
Choi, D., Sim, H. S., Piao, Y. L., Ying, W., & Cho, H. (2009). Sugar production from
raw seaweed using the enzyme method. Journal of Industrial and Engineering
Chemistry, 15(1), 12-15.
133
Chynoweth, D. P. (2005). Renewable biomethane from land and ocean energy crops and
organic wastes. Horticultural Science, 40 (2), 283-286.
Ciancia, M., Alberghina, J., Arata, P. X., Benavides, H., Leliaert, F., Verbruggen, H., &
Estevez, J. M. (2012). Characterization of cell wall polysaccharides of the
coencocytic green seaweed Bryopsis plumosa (Bryposidacea, Chlorophyta) from
the Argentine coast. Journal of Phycology, 48 (2), 326-335.
Collado-Vides, L. (2001). Clonal architecture in marine macroalgae: ecological and
evolutionary perspectives. Evolutionary Ecology, 15 (4-6), 531-545.
Cui, C.-B., Oh, S.-W., Lee, D.-S., & Ham, S. S. (2002). Effects of the biological activities
of ethanol extract from Korean traditional Kochujang added with sea tangle
(Laminaria longissima). Korean Journal of Food Preservation, 9, 1-7.
Darzins, A., Pienkos, P., & Edye, L. (2010). Current status and potential for algal biofuels
production. A report to IEA Bioenergy Task, 39.
De Wreede, R. E., & Green, L. G. (1990). Patterns of gametophyte dominance ofIridaea
splendens (Rhodophyta) in Vancouver Harbour, Vancouver, British Columbia,
Canada. Journal of Applied Phycology, 2(1), 27-34.
de Zeeuw, J., & Luong, J. (2002). Developments in stationary phase technology for gas
chromatography. TrAC Trends in Analytical Chemistry, 21(9), 594-607.
Demirbaş, A. (2001). Biomass resource facilities and biomass conversion processing for
fuels and chemicals. Energy Conversion and Management, 42(11), 1357-1378.
DeSA, U. (2013). World population prospects: the 2012 revision. Population Division of
the Department of Economic and Social Affairs of the United Nations Secretariat,
New York.
Dibenedetto, A. (2011). The potential of aquatic biomass for CO2‐enhanced fixation and
energy production. Greenhouse Gases: Science and Technology, 1(1), 58-71.
Doty, M. S., & Norris, J. N. (1985). Eucheuma species (Solieriaceae, Rhodophyta) that
are major sources of carrageenan. Taxonomy of Economic Seaweeds. California
Sea Grant College Program, La Jolla, California, 47-61.
Draget, K. I., Smidsrød, O., & Skjåk‐Bræk, G. (2005). Alginates from algae. Biopolymers
Online.
DuBois, M., Gilles, K. A., Hamilton, J. K., Rebers, P. A., & Smith, F. (1956).
Colorimetric Method for Determination of Sugars and Related Substances.
Analytical Chemistry, 28(3), 350-356.
Dyck, L. J., & De Wreede, R. E. (1995). Patterns of seasonal demographic change in the
alternate isomorphic stages of Mazzaella splendens (Gigartinales, Rhodophyta).
Phycolology, 34(5), 390-395.
Eklund, R., & Zacchi, G. (1995). Simultaneous saccharification and fermentation of
steam-pretreated willow. Enzyme and Microbial Technology, 17(3), 255-259.

134
Estevez, J. M., Ciancia, M., & Cerezo, A. S. (2004). The system of galactans of the red
seaweed, Kappaphycus alvarezii, with emphasis on its minor constituents.
Carbohydrate Research, 339(15), 2575-2592.
Faith, W. L. (1945). Development of the Scholler process in the United States. Industrial
and Engineering Chemistry Research, 37(1), 9-11.
Fan, Z., South, C., Lyford, K., Munsie, J., van Walsum, P., & Lynd, L. R. (2003).
Conversion of paper sludge to ethanol in a semicontinuous solids-fed reactor.
Bioprocess and Biosystems Engineering, 26(2), 93-101.
Fayaz, M., Namitha, K. K., Murthy, K. N. C., Swamy, M. M., Sarada, R., Khanam, S., .
. . Ravishankar, G. A. (2005). Chemical composition, iron bioavailability, and
antioxidant activity of Kappaphycus alvarezzi (Doty). Journal of Agricultural and
Food Chemistry, 53(3), 792-797.
Food and Agriculture Organization of the United Nations. Fisheries Dept. (2014). The
state of world fisheries and aquaculture, 2014. Food and Agriculture Org.
Frey, P. A. (1996). The Leloir pathway: a mechanistic imperative for three enzymes to
change the stereochemical configuration of a single carbon in galactose. FASEB
Journal, 10(4), 461-470.
Fu, X. T., & Kim, S. M. (2010). Agarase: review of major sources, categories, purification
method, enzyme characteristics and applications. Marine Drugs, 8(1), 200-218.
Galbe, M., & Zacchi, G. (2002). A review of the production of ethanol from softwood.
Applied Microbiology and Biotechnology, 59(6), 618-628.
Gao, K., & McKinley, K. R. (1994). Use of macroalgae for marine biomass production
and CO2 remediation: a review. Journal of Applied Phycology, 6(1), 45-60.
Ge, L., Wang, P., & Mou, H. (2011). Study on saccharification techniques of seaweed
wastes for the transformation of ethanol. Renewable Energy, 36(1), 84-89.
Gill, G. E., Savage, B. J., & Bhargava, S. (2012). Using enhanced amylase to generate
ethanol from reduced concentrations of carbohydrates: Google Patents.
Giovanni, M. 1983. Response surface methodology and product optimization. Food
Technology. 37 (11):41-45.
Goecke, F., Escobar, M., & Collantes, G. (2012). Chemical composition of Padina
fernandeziana (Phaeophyceae, Dictyotales) from Juan Fernandez Archipelago,
Chile. Revista Latinoamericana de Biotecnología Ambiental y Algal, 3(2), 95-
104.
Goldemberg, J., & Coelho, S. T. (2004). Renewable energy—traditional biomass vs.
modern biomass. Energy Policy, 32 (6), 711-714.
Golueke, C. G., Oswald, W. J., & Gotaas, H. B. (1957). Anaerobic digestion of algae.
Applied Microbiology, 5 (1), 47-47.

135
González‐Fernández, C., Sialve, B., Bernet, N., & Steyer, J. P. (2012). Impact of
microalgae characteristics on their conversion to biofuel. Part II: Focus on
biomethane production. Biofuels, Bioproducts and Biorefining, 6 (2), 205-218.
Gressel, J. (2008). Transgenics are imperative for biofuel crops. Plant science, 174 (3),
246-263.
Guan, Q., Wei, C., & Savage, P. E. (2012). Kinetic model for supercritical water
gasification of algae. Physical Chemistry Chemical Physics, 14(9), 3140-3147.
Hamelinck C. N, Hooijdonk G. V. and Faiij A. P. ( 2005). Ethanol from lignocellulosic
biomass: Techno-economic performance in short-, middle- and long-term,
Biomass and Bioenergy. 28 (4). 394-410.
Hansen, J. B., Doubet, R. S., & Ram, J. (1984). Alginase enzyme production by Bacillus
circulans. Applied and Environmental Microbiology, 47(4), 704-709.
Hargreaves, P. I., Barcelos, C. A., da Costa, A. C. A., & Pereira, N. (2013). Production
of ethanol 3G from Kappaphycus alvarezii: Evaluation of different process
strategies. Bioresource Technology, 134, 257-263.
Hashem, A. M., & Rashad, M. M. (1993). Production of ethanol by yeasts grown on
hydrolysate of Egyptian sweet potato. Egyptian Journal of Food Science, 21(2),
171-180.
Holden, H. M., Rayment, I., & Thoden, J. B. (2003). Structure and function of enzymes
of the Leloir pathway for galactose metabolism. Journal of Biological Chemistry,
278(45), 43885-43888.
Hong, K.-K., Vongsangnak, W., Vemuri, G. N., & Nielsen, J. (2011). Unravelling
evolutionary strategies of yeast for improving galactose utilization through
integrated systems level analysis. Proceedings of the National Academy of
Sciences, 108(29), 12179-12184.
Horn, S. J. (2000). Bioenergy from brown seaweeds (Doctoral dissertation). Norwegian
University of Science and Technology, Department of Biotechnology. Retrived
from: https://brage.bibsys.no/xmlui//handle/11250/245590.
Horn, S. J., Aasen, I. M., & Østgaard, K. (2000). Ethanol production from seaweed
extract. Journal of Industrial Microbiology and Biotechnology, 25(5), 249-254.
Hou, X., Hansen, J. H., & Bjerre, A.-B. (2015). Integrated bioethanol and protein
production from brown seaweed Laminaria digitata. Bioresource Technology,
197, 310-317.
Hoyer, K., Galbe, M., & Zacchi, G. (2009). Production of fuel ethanol from softwood by
simultaneous saccharification and fermentation at high dry matter content.
Journal of Chemical Technology and Biotechnology, 84(4), 570-577.
Hughes, A. D., Black, K. D., Campbell, I., Davidson, K., Kelly, M. S., & Stanley, M. S.
(2012). Does seaweed offer a solution for bioenergy with biological carbon
capture and storage? Greenhouse Gases: Science and Technology, 2(6), 402-407.
136
Hughes, A. D., Kelly, M. S., Black, K. D., & Stanley, M. S. (2012). Biogas from
Macroalgae: is it time to revisit the idea? Biotechnology for Biofuels, 5(1), 1.
Hurtado, A. Q., Gerung, G. S., Yasir, S., & Critchley, A. T. (2014). Cultivation of tropical
red seaweeds in the BIMP-EAGA region. Journal of Applied Phycology, 26(2),
707-718.
Hyebeen, K. I. M. (2013). Optimal production conditions for bioethanol fermentation
using Gracilaria verrucosa with thermal acid hydrolysis. Korean Society for
Biotechnology and Bioengineering, 186-186.
Israel, A., Einav, R., & Seckbach, J. (2010). Seaweeds and their role in Globally
Changing Environments (Vol. 15): Springer Science & Business Media.
Jang, J.-S., Cho, Y., Jeong, G.-T., & Kim, S.-K. (2012). Optimization of saccharification
and ethanol production by simultaneous saccharification and fermentation (SSF)
from seaweed, Saccharina japonica. Bioprocess and Biosystems Engineering,
35(1-2), 11-18.
Jena, U., & Das, K. C. (2011). Comparative evaluation of thermochemical liquefaction
and pyrolysis for bio-oil production from microalgae. Energy and Fuels, 25(11),
5472-5482.
Jeong, G.-T., Kim, S.-K., & Park, D.-H. (2013). Detoxification of hydrolysate by
reactive-extraction for generating biofuels. Biotechnology and Bioprocess
Engineering, 18(1), 88-93.
Jordan, J., & Theegala, C. (2014). Probing the limitations for recycling cellulase enzymes
immobilized on iron oxide (Fe3O4) nanoparticles. Biomass Conversion and
Biorefinery, 4(1), 25-33.
Juanich, G. (1988). Manual of running water fish culture 1 Eucheuma spp. Projected
reports Cebu, Philippines, FAO.
Kaltschmitt, M., Thrän, D., & Smith, K. R. (2002). Renewable energy from biomass.
Encyclopedia of Physical Science and Technology, ed. by RA Meyers, 203-228.
Kawai, S., & Murata, K. (2016). Biofuel production based on carbohydrates from both
brown and red macroalgae: recent developments in key biotechnologies.
International Journal of Molecular Sciences, 17(2), 145.
Kaylen, M., Van Dyne, D. L., Choi, Y.-S., & Blasé, M. (2000). Economic feasibility of
producing ethanol from lignocellulosic feedstocks. Bioresource Technology,
72(1), 19-32.
Khambhaty, Y., Mody, K., Gandhi, M. R., Thampy, S., Maiti, P., Brahmbhatt, H., . . .
Ghosh, P. K. (2012). Kappaphycus alvarezii as a source of bioethanol.
Bioresource Technolology, 103(1), 180-185.
Kim, B. J., Lee, Y. Y., & Torget, R. (1993). An optimal temperature policy of percolation
process as applied to dilute-acid hydrolysis of biphasic hemicellulose. App
Biochemistry and Biotechnology, 39(1), 119-129.
137
Kim, H. M., Wi, S. G., Jung, S., Song, Y., & Bae, H.-J. (2015). Efficient approach for
bioethanol production from red seaweed Gelidium amansii. Bioresource
Technology, 175, 128-134.
Klaassen, P., Gielesen, B. E. M., Van Suylekom, G. P., & Heijne, W. H. M. (2015). Cell
suitable for fermentation of a mixed sugar composition: Google Patents.
Knothe, G. (2010). Biodiesel and renewable diesel: a comparison. Progress in Energy
and Combustion Science, 36(3), 364-373.
Korzen, L., Pulidindi, I. N., Israel, A., Abelson, A., & Gedanken, A. (2015). Single step
production of bioethanol from the seaweed Ulva rigida using sonication. RSC
Advances, 5(21), 16223-16229.
Kraan, S. (2012). Algal polysaccharides, novel applications and outlook: INTECH Open
Access Publisher.
Kuhn, E. R. (2002). Water Injections in GC-How Wet Can You Get? LC GC North
America, 20(5), 474-478.
Kumar, S., Gupta, R., Kumar, G., Sahoo, D., & Kuhad, R. C. (2013). Bioethanol
production from Gracilaria verrucosa, a red alga, in a biorefinery approach.
Bioresource Technology, 135, 150-156.
Larsson, S., Palmqvist, E., Hahn-Hägerdal, B., Tengborg, C., Stenberg, K., Zacchi, G., &
Nilvebrant, N.-O. (1999). The generation of fermentation inhibitors during dilute
acid hydrolysis of softwood. Enzyme and Microbial Technology, 24(3), 151-159.
Larsson, S., Quintana-Sáinz, A., Reimann, A., Nilvebrant, N. O., & Jönsson, L. J. (2000).
Influence of lignocellulose-derived aromatic compounds on oxygen-limited
growth and ethanolic fermentation by Saccharomyces cerevisiae. In Twenty-First
Symposium on Biotechnology for Fuels and Chemicals (pp. 617-632). Humana
Press. Lazic, Z. R. (2006). Design of experiments in chemical engineering: A
practical guide: John Wiley & Sons.
Lee, D. H. (2011). Algal biodiesel economy and competition among bio-fuels.
Bioresource Technology, 102(1), 43-49.
Lee, J. J., Hutner, S. H., & Bovee, E. C. (1985). Illustrated guide to the protozoa: Society
of Protozoologists.
Lee, K. S., Hong, M. E., Jung, S. C., Ha, S. J., Yu, B. J., Koo, H. M., . . . Park, J. C.
(2011). Improved galactose fermentation of Saccharomyces cerevisiae through
inverse metabolic engineering. Biotechnology and Bioengineering, 108(3), 621-
631.
Lee, R. E. (2008). Phycology: Cambridge University Press.
Lee, S.-M., & Lee, J.-H. (2011). The isolation and characterization of simultaneous
saccharification and fermentation microorganisms for Laminaria japonica
utilization. Bioresource Technology, 102(10), 5962-5967.
138
Lee, S. M., & Lee, J. H. (2010). Influence of acid and salt content on the ethanol
production from Laminaria japonica. Applied Chemistry for Engineering, 21(2),
154-161.
Lee, W. C., Yusof, S., Hamid, N. S. A., & Baharin, B. S. (2006) Optimizing conditions
for hot water extraction of banana juice using response surface methodology
(RSM). Journal of Food Engineering. 75 (4):473-479.
Lenihan, P., Orozco, A., O’neill, E., Ahmad, M., Rooney, D., & Walker, G. (2010). Dilute
acid hydrolysis of lignocellulosic biomass. Chemical Engineering Journal,
156(2), 395-403.
Lewandowski, I., Scurlock, J. M., Lindvall, E., & Christou, M. (2003). The development
and current status of perennial rhizomatous grasses as energy crops in the US and
Europe. Biomass and Bioenergy, 25(4), 335-361.
Li, B., Lu, F., Wei, X., & Zhao, R. (2008). Fucoidan: structure and bioactivity. Molecules,
13(8), 1671-1695.
Liao, Y.-J., Wang, M.-Y., & Shih, I.-L. (2013) Study on using Gracilaria biomass for
Bioethanol production. In: International conference on challenges in aquatic
science, vol. 320, no. 320. Department of Environmental Engineering, University
of Daoye.
Lin, X., Fan, J., Wen, Q., Li, R., Jin, X., Wu, J., . . . Bai, J. (2014). Optimization and
validation of a GC–FID method for the determination of acetone-butanol-ethanol
fermentation products. Journal of Chromatographic Science, 52(3), 264-270
Lin, Y., & Tanaka, S. (2006). Ethanol fermentation from biomass resources: current state
and prospects. Applied Microbiology and Biotechnology, 69(6), 627-642.
Lu, Y., Wang, Y., Xu, G., Chu, J., Zhuang, Y., & Zhang, S. (2010). Influence of high
solid concentration on enzymatic hydrolysis and fermentation of steam-exploded
corn stover biomass. Applied Biochemistry and Biotechnology, 160(2), 360-369.
Lundquist, T. J., Woertz, I. C., Quinn, N. W. T., & Benemann, J. R. (2010). A realistic
technology and engineering assessment of algae biofuel production. Energy
Biosciences Institute, 1-1.
MacArtain, P., Gill, C. I. R., Brooks, M., Campbell, R., & Rowland, I. R. (2008).
Nutritional Value of edible seaweeds. Nutrition Reviews, 65(12), 535-543.
Malester, A., Green, M., Kimchie, S., & Shelef, G. (1988). The effect of the neutralizing
capacity of cellulosic materials on the kinetics of cellulose dilute acid hydrolysis.
Biological Wastes, 26(2), 115-124.
Manns, D., Andersen, S. K., Saake, B., & Meyer, A. S. (2015). Brown seaweed
processing: enzymatic saccharification of Laminaria digitata requires no pre-
treatment. Journal of Applied Phycology, 28, 1287-1294.

139
Manns, D., Deutschle, A., Saake, B., & Meyer, A. S. (2014). Methodology for
quantitative determination of the carbohydrate composition of brown seaweeds
(Laminariaceae). Rsc Advances, 4(49), 25736-25746.
Mansa, R. F., Chen, W. F., Yeo, S. J., Farm, Y. Y., Bakar, H. A., & Sipaut, C. S. (2013).
Fermentation study on macroalgae Eucheuma cottonii for bioethanol production
via varying acid hydrolysis. In Advances in Biofuels (pp. 219-240). Springer US.
Marquez, G. P. B., Santiañez, W. J. E., Trono, G. C., Montaño, M. N. E., Araki, H.,
Takeuchi, H., & Hasegawa, T. (2014). Seaweed biomass of the Philippines:
Sustainable feedstock for biogas production. Renewable and Sustainable Energy
Reviews, 38, 1056-1068.
Mata, T. M., Martins, A. A., & Caetano, N. S. (2010). Microalgae for biodiesel production
and other applications: a review. Renewable and Sustainable Energy Reviews,
14(1), 217-232.
McDermid, K. J., & Stuercke, B. (2003). Nutritional composition of edible Hawaiian
seaweeds. Journal of Applied Phycology, 15(6), 513-524.
McKendry, P. (2002). Energy production from biomass (part 2): conversion technologies.
Bioresource Technology, 83(1), 47-54.
McKinney, R. E. (2004). Environmental pollution control microbiology: a fifty-year
perspective: CRC Press.
McLachlan, J., & Bird, C. J. (1986). Gracilaria (Gigartinales, Rhodophyta) and
productivity. Aquatic Botany, 26, 27-49.
Mcmillan, J. D., Newman, M. M., Templeton, D. W., & Mohagheghi, A. (1999).
Simultaneous saccharification and cofermentation of dilute-acid pretreated yellow
poplar hardwood to ethanol using xylose-fermenting Zymomonas mobilis. In
Twentieth Symposium on Biotechnology for Fuels and Chemicals (pp. 649-665).
Humana Press. Mehlman. (1996). Dangerous and cancer-causing properties of
products and chemicals in the oil-refining and petrochemical industry—Part
XXII: health hazards from exposure to gasoline containing methyl tertiary butyl
ether: study of New Jersey residents. Toxicology and industrial health, 12(5), 613-
627.
Mehlman. (1998). Pollution by gasoline containing hazardous methyl tertiary butyl ether
(MTBE). Archives of Environmental and Occupational Health, 53(4), 245-246.
Meinita, M. D. N., Kang, J.-Y., Jeong, G.-T., Koo, H. M., Park, S. M., & Hong, Y.-K.
(2012). Bioethanol production from the acid hydrolysate of the carrageenophyte
Kappaphycus alvarezii (cottonii). Journal of Applied Phycology, 24(4), 857-862.
Meinita, M. D. N., Marhaeni, B., Winanto, T., Jeong, G.-T., Khan, M. N. A., & Hong,
Y.-K. (2013). Comparison of agarophytes (Gelidium, Gracilaria, and
Gracilariopsis) as potential resources for bioethanol production. Journal of
Applied Phycology, 25(6), 1957-1961.

140
Mekhilef, S., Safari, A., Mustaffa, W., Saidur, R., Omar, R., & Younis, M. (2012). Solar
energy in Malaysia: current state and prospects. Renewable and Sustainable
Energy Reviews, 16(1), 386-396.
Melo, M. R. S., Feitosa, J. P. A., Freitas, A. L. P., & De Paula, R. C. M. (2002). Isolation
and characterization of soluble sulfated polysaccharide from the red seaweed
Gracilaria cornea. Carbohydrate Polymers, 49(4), 491-498.
Melton, L. D., & Smith, B. G. (2001). Determination of neutral sugars by gas
chromatography of their alditol acetates. Current Protocols in Food Analytical
Chemistry.
Metcalf, M. J., Stevens, G. J., & Robbins, G. A. (2016). Application of first order kinetics
to characterize MTBE natural attenuation in groundwater. Journal of
Contaminant Hydrology, 187, 47-54.
Miao, X., & Wu, Q. (2004). High yield bio-oil production from fast pyrolysis by
metabolic controlling of Chlorella protothecoides. Journal of Biotechnology,
110(1), 85-93.
Michel, G., Nyval-Collen, P., Barbeyron, T., Czjzek, M., & Helbert, W. (2006).
Bioconversion of red seaweed galactans: a focus on bacterial agarases and
carrageenases. Applied Microbiology and Biotechnology, 71(1), 23-33.
Millati, R., Niklasson, C., & Taherzadeh, M. J. (2002). Effect of pH, time and temperature
of overliming on detoxification of dilute-acid hydrolyzates for fermentation by
Saccharomyces cerevisiae. Process Biochemistry, 38(4), 515-522.
Miller, G. L. (1959). Use of Dinitrosalicylic Acid Reagent for Determination of Reducing
Sugar. Analytical Chemistry, 31(3), 426-428.
Minowa, T., Yokoyama, S.-y., Kishimoto, M., & Okakura, T. (1995). Oil production from
algal cells of Dunaliella tertiolecta by direct thermochemical liquefaction. Fuel,
74(12), 1735-1738.
Miyazawa, M., Kaneko, T., Kaneko, T., Yarita, K., Mori, S., Iitani, K., & Yamamoto, M.
(1991). Process for recovering L-amino acids from fermentation liquors
containing them: Google Patents.
Mohagheghi, A., Ruth, M., & Schell, D. J. (2006). Conditioning hemicellulose
hydrolysates for fermentation: effects of overliming pH on sugar and ethanol
yields. Process Biochemistry, 41(8), 1806-1811.
Montingelli, M. E., Benyounis, K. Y., Quilty, B., Stokes, J., & Olabi, A. G. (2016).
Optimisation of biogas production from the macroalgae Laminaria sp. at
different periods of harvesting in Ireland. Applied Energy, 177, 671-682.
Mutripah, S., Meinita, M. D. N., Kang, J.-Y., Jeong, G.-T., Susanto, A. B., Prabowo, R.
E., & Hong, Y.-K. (2014). Bioethanol production from the hydrolysate of
Palmaria palmata using sulfuric acid and fermentation with brewer’s yeast.
Journal of Applied Phycology, 26(1), 687-693.

141
Naik, S. N., Goud, V. V., Rout, P. K., & Dalai, A. K. (2010). Production of first and
second generation biofuels: a comprehensive review. Renewable and Sustainable
Energy Reviews, 14(2), 578-597.
Necas, J., & Bartosikova, L. (2013). Carrageenan: a review. Veterinarni Medicina, 58(4),
187-205.
Nelofer, R., Ramanan, R. N., Rahman, R. N. Z. R. A., Basri, M., & Ariff, A. B. (2011).
Sequential optimization of production of a thermostable and organic solvent
tolerant lipase by recombinant Escherichia coli. Annals of Microbiology, 61(3),
535-544.
Nguyen, Q. A., Tucker, M. P., Keller, F. A., & Eddy, F. P. (2000). Two-stage dilute-acid
pretreatment of softwoods. In Twenty-first Symposium on biotechnology for fuels
and chemicals (pp. 561-576). Humana Press.
Olsson, L., Soerensen, H. R., Dam, B. P., Christensen, H., Krogh, K. M., & Meyer, A. S.
(2006). Separate and simultaneous enzymatic hydrolysis and fermentation of
wheat hemicellulose with recombinant xylose utilizing Saccharomyces
cerevisiae. Applied Biochemistry and Biotechnology, 129(1-3), 117-129.
Ostergaard, S., Olsson, L., Johnston, M., & Nielsen, J. (2000). Increasing galactose
consumption by Saccharomyces cerevisiae through metabolic engineering of the
GAL gene regulatory network. Nature Biotechnology, 18(12), 1283-1286.
Oswald, W. J. (1988). Large-scale algal culture systems (engineering aspects). Micro-
algal biotechnology. Cambridge University Press, Cambridge, 357-394.
Özdemir, M., & Devres, O. (2000) Analysis of color development during roasting of
hazelnuts using response surface methodology. Journal of Food Engineering. 45
(1):17-24.
Palmqvist, E., & Hahn-Hägerdal, B. (2000). Fermentation of lignocellulosic hydrolysates.
II: inhibitors and mechanisms of inhibition. Bioresource Technology, 74(1), 25-
33.
Park, J.-H., Hong, J.-Y., Jang, H. C., Oh, S. G., Kim, S.-H., Yoon, J.-J., & Kim, Y. J.
(2012). Use of Gelidium amansii as a promising resource for bioethanol: a
practical approach for continuous dilute-acid hydrolysis and fermentation.
Bioresource Technology, 108, 83-88.
Pedersen, S. (2016). Process for simultaneous saccharification and fermentation of whey
permeate: US Patent 20,160,108,440.
Percival, E. (1979). The polysaccharides of green, red and brown seaweeds: Their basic
structure, biosynthesis and function. British Phycological Journal, 14(2), 103-
117.
Phang, S. M. (1994). Some species of Gracilaria from peninsular Malaysia and
Singapore. Taxonomy of economics seaweeds with reference to some Pacific
species. Volume V, 125-134.
142
Phang, S. M. (2006). Seaweed resources in Malaysia: current status and future prospects.
Aquatic Ecosystem Health and Management, 9(2), 185-202.
Phang, S. M. (2010). Potential products from tropical algae and seaweeds, especially with
reference to Malaysia. Malaysian Journal of Science, 29(2), 160-166.
Phang, S. M., Shaharuddin, S., Noraishah, H., & Sasekumar, A. (1996). Studies on
Gracilaria changii (Gracilariales, Rhodophyta) from Malaysian mangroves.
Hydrobiologia, 326(1), 347-352.
Phang, S. M., Wong, C., Lim, P., Ooi, J., Gan, S., Melor Ismail, Y. H., & EM, M. (2007).
Seaweed Diversity in Malaysia. Status of Biological Diversity in Malaysia and
Threat Assessment of Plant Species in Malaysia (eds. Chua LSL, Kirton LG and
Saw LG) Forest Research Institute Malaysia, 185-210.
Phang, S. M., & Wee, Y. C. (1991). Benthic marine algae. The state of nature
conservation in Malaysia, 51-61.
Phang, S. M., Lim, P. E., & Yeong, H. Y. (2010). Malaysian seaweed resources in the
South China Sea and their potential economic and ecological applications. Journal
of Science and Technology in the Tropics, 6, 87-109.
Phang, S. M., Yeong, H. Y., Lim, P. E., Adibi, R. M. N., & Gan, K. T. (2010).
Commercial varieties of Kappaphycus and Eucheuma in Malaysia. Malaysian
Journal of Science, 29(3), 214-224.
Philippidis, G. P., & Smith, T. K. (1995). Limiting factors in the simultaneous
saccharification and fermentation process for conversion of cellulosic biomass to
fuel ethanol. Applied Biochemistry and Biotechnology, 51(1), 117-124.
Philippidis, G. P., Smith, T. K., & Wyman, C. E. (1993). Study of the enzymatic
hydrolysis of cellulose for production of fuel ethanol by the simultaneous
saccharification and fermentation process. Biotechnology and Bioengineering,
41(9), 846-853.
Pinto, F. d. C. V. (2013). Invasive marine macroalgae-community invasibility, invasion
process, and their ecological role in the ecosystem functioning. https://repositorio-
aberto.up.pt/bitstream/10216/73448/2/92481.pdf?
Pondevida, H. B., & Hurtado-Ponce, A. Q. (1996). Assessment of some agarophytes from
the coastal areas of Iloilo, Philippines. I. Seasonal variations in the biomass of
Gracilaria changii, Gracilaria manilaensis and Gracilariopsis bailinae
(Gracilariales, Rhodophyta). Botanica Marina, 39(1-6), 117-122.
Quaschning, V. (2010). Carbon‐Free Energy‐Vision or Utopia? Renewable Energy and
Climate Change, 70-86.
Qureshi, N., & Manderson, G. J. (1995). Bioconversion of renewable resources into
ethanol: an economic evaluation of selected hydrolysis, fermentation, and
membrane technologies. Energy Sources, 17(2), 241-265.

143
Ra, C. H., Choi, J. G., Kang, C.-H., Sunwoo, I. Y., Jeong, G.-T., & Kim, S.-K. (2015).
Thermal Acid Hydrolysis Pretreatment, Enzymatic Saccharification and Ethanol
Fermentation from Red Seaweed, Gracilaria verrucosa. Microbiology and
Biotechnology Letters, 41(1), 9-15.
Ra, C. H., Jeong, G.-T., Shin, M. K., & Kim, S.-K. (2013). Biotransformation of 5-
hydroxymethylfurfural (HMF) by Scheffersomyces stipitis during ethanol
fermentation of hydrolysate of the seaweed Gelidium amansii. Bioresource
Technology, 140, 421-425.
Ra, C. H., Nguyen, T. H., Jeong, G-T., & Kim S. K. (2016). Evaluation of hyper thermal
acid hydrolysis of Kappaphycus alvarezii for enhanced bioethanol production.
Bioresource Technology. 209, 66–72.
Radhakrishnaiah, P., Meng, X., Huang, G., Buschle-Diller, G., & Walsh, W. (1999).
Mechanical agitation of cotton fabrics during enzyme treatment and its effect on
tactile properties. Textile Research Journal, 69(10), 708-713.
Ray, B. (2006). Polysaccharides from Enteromorpha compressa: Isolation, purification
and structural features. Carbohydrate Polymers, 66(3), 408-416.
Reith, J. H., Deurwaarder, E. P., Hemmes, K., Curvers, A. P. W. M., Kamermans, P.,
Brandenburg, W., & Zeeman, G. (2005). Bio-offshore: grootschalige teelt van
zeewieren in combinatie met offshore windparken in de Noordzee. Petten [etc.],
Energieonderzoek Centrum Nederland [etc.].
Renaud, S. M., & Luong-Van, J. T. (2006). Seasonal Variation in the Chemical
Composition of Tropical Australian Marine Macroalgae. Journal of Applied
Phycology, 18(3-5), 381-387.
Resch, G., Held, A., Faber, T., Panzer, C., Toro, F., & Haas, R. (2008). Potentials and
prospects for renewable energies at global scale. Energy Policy, 36(11), 4048-
4056.
Roesijad, G., Jones, S. B., Snowden-Swan, L. J., & Zhu, Y. (2010). Macroalgae as a
biomass feedstock: a preliminary analysis, PNNL 19944. Pacific Northwest
National Laboratory, USA CrossRef.
Ross, A., Jones, J., Kubacki, M., & Bridgeman, T. (2008). Classification of macroalgae
as fuel and its thermochemical behaviour. Bioresource Technology, 99(14), 6494-
6504.
Rustom, I. Y. S., Lopez-leiva, M. H., & Nair, B. M. (1991). Optimization of Extraction
of Peanut Proteins with Water by Response-Surface Methodology. Journal of
Food Sciences, 56(6), 1660-1663.
Saha, B. C., Iten, L. B., Cotta, M. A., & Wu, Y. V. (2005). Dilute acid pretreatment,
enzymatic saccharification and fermentation of wheat straw to ethanol. Process
Biochemistry , 40(12), 3693-3700.
Sahoo, D. (2002). Towards a blue revolution in the sea. Advances in Marine and
Aritarctic Science. APH Publishing corporation, New Delhi, India, 1-19.
144
Saidur, R., Abdelaziz, E. A., Demirbas, A., Hossain, M. S., & Mekhilef, S. (2011). A
review on biomass as a fuel for boilers. Renewable and Sustainable Energy
Reviews, 15(5), 2262-2289.
Saifullah, S. M., & Ahmed, W. (2007). Epiphytic algal biomass on pneumatophores of
mangroves of Karachi, Indus Delta. Pakistan Journal of Botany, 39, 2097-2102.
Santos, F. J., & Galceran, M. T. (2002). The application of gas chromatography to
environmental analysis. TrAC T Analytical Chemistry, 21(9), 672-685.
Scheller, H. V., & Ulvskov, P. (2010). Hemicelluloses. Plant Biology, 61(1), 263-263.
Schink, B. (1997) Energetics of syntrophic cooperation in methanogenic degradation.
Microbiology and Molecular Biology Reviews 61:262–280
Searchinger, T., Heimlich, R., Houghton, R. A., Dong, F., Elobeid, A., Fabiosa, J., . . .
Yu, T.-H. (2008). Use of US croplands for biofuels increases greenhouse gases
through emissions from land-use change. Science, 319(5867), 1238-1240.
Shanmugam, A., & Palpandi, C. (2010). Biochemical Composition and Fatty Acid Profile
of the Green Alga Ulva reticulata. Asian Journal of Biochemistry, 5(3), 188-193.
Sheehan, J., Dunahay, T., Benemann, J., & Roessler, P. (1998). A look back at the US
Department of Energy's Aquatic Species Program: Biodiesel from algae (Vol.
328): National Renewable Energy Laboratory Golden.
Sherrard, E. C., & Kressman, F. W. (1945). Review of processes in the United States prior
to World War II. Industrial and Engineering Chemistry, 37(1), 5-8.
Silva, P. C., Basson, P. W., & Moe, R. L. (1996). Catalogue of the benthic marine algae
of the Indian Ocean (Vol. 79): University of California Press.
Singh, A., & Olsen, S. I. (2011). A critical review of biochemical conversion,
sustainability and life cycle assessment of algal biofuels. Applied Energy, 88(10),
3548-3555.
Singleton, V. L., Orthofer, R., & Lamuela-Raventos, R. M. (1999). Analysis of total
phenols and other oxidation substrates and antioxidants by means of Folin-
Ciocalteu reagent. Methods in Enzymology, 299, 152-178.
Söderström, J., Pilcher, L., Galbe, M., & Zacchi, G. (2003). Combined use of H2SO4 and
SO2 impregnation for steam pretreatment of spruce in ethanol production. Applied
Biochemistry and Biotechnology, 105(1-3), 127-140.
Stanier, R. Y. (1942). Agar-decomposing strains of the Actinomyces coelicolor species-
group. Journal of Bacteriology, 44(5), 555-555.
Sudhakar, M., Merlyn, R., Arunkumar, K., & Perumal, K. (2016). Characterization,
pretreatment and saccharification of spent seaweed biomass for bioethanol
production using baker's yeast. Biomass and Bioenerg, 90, 148-154.
145
Sun, Y., & Cheng, J. (2002). Hydrolysis of lignocellulosic materials for ethanol
production: a review. Bioresource Technology, 83(1), 1-11.
Sze, P. (1993). A Biology of the Algae. Wm. C. Brown Publishers.
Tabassum, M. R., Wall, D. M., & Murphy, J. D. (2016). Biogas production generated
through continuous digestion of natural and cultivated seaweeds with dairy slurry.
Bioresource Technology, 219, 228-238.
Taherzadeh, M. J. (1999). Ethanol from lignocellulose: physiological effects of inhibitors
and fermentation strategies: Chalmers University of Technology.
Taherzadeh, M. J., & Karimi, K. (2007a). Acid-based hydrolysis processes for ethanol
from lignocellulosic materials: a review. BioResources, 2(3), 472-499.
Taherzadeh, M. J., & Karimi, K. (2007b). Enzymatic-based hydrolysis processes for
ethanol from lignocellulosic materials: A review. BioResources, 2(4), 707-738.
Takeda, H., Yoneyama, F., Kawai, S., Hashimoto, W., & Murata, K. (2011). Bioethanol
production from marine biomass alginate by metabolically engineered
bacteria. Energy and Environmental Science, 4(7), 2575-2581.
Tan, I. S., & Lee, K. T. (2014). Enzymatic hydrolysis and fermentation of seaweed solid
wastes for bioethanol production: An optimization study. Energy, 78, 53-62.
Tan, J., Lim, P.-E., & Phang, S.-M. (2012). Phylogenetic relationship of Kappaphycus
Doty and Eucheuma J. Agardh (Solieriaceae, Rhodophyta) in Malaysia. Journal
of Applied Phycology, 25(1), 13-29.
Tedesco, S., Mac Lochlainn, D., & Olabi, A. G. (2014). Particle size reduction
optimization of Laminaria spp. biomass for enhanced methane production.
Energy, 76, 857-862.
Tengborg, C. (2000). Bioethanol production: Pretreatment and enzymatic hydrolysis of
softwood. Department of Chemical Engineering 1, Lund University.
Thennarasan, S. (2015). Biochecmial composition of marine brown alga Lobophora
variegata from Mandapam in the South East Coast of Tamil Nadu. International
Journal of Phytopharmacy, 5(3), 25-29.
Timson, D. J. (2007). Galactose metabolism in Saccharomyces cerevisiae. Dynamic
Biochemistry, Process Biotechnology and Molecular Biology, 1(1), 63-73.
Trivedi, N., Gupta, V., Reddy, C. R. K., & Jha, B. (2013). Enzymatic hydrolysis and
production of bioethanol from common macrophytic green alga Ulva fasciata
Delile. Bioresource Technology, 150, 106-112.
Tschopp, J. F., Emr, S., Field, C., & Schekman, R. (1986). GAL2 codes for a membrane-
bound subunit of the galactose permease in Saccharomyces cerevisiae. Journal of
Bacteriology, 166 (1), 313-318.
146
Tu, M., Zhang, X., Paice, M., MacFarlane, P., & Saddler, J. N. (2009). The potential of
enzyme recycling during the hydrolysis of a mixed softwood feedstock.
Bioresource Technology, 100 (24), 6407-6415.
Twidell, J., & Weir, T. (2006). Renewable Energy Resources. by Taylor and Francis.
Newyork, USA.
Van de Velde F, Lourenco ND, Pinheiro HM, Bakkerd M (2002) Carrageenan: a food-
grade and biocompatible support for immobilisation techniques. Advanced
Synthesis and Catalysis, 344, 815–835.
Van Groenestijn, J., Hazewinkel, O., & Bakker, R. (2006). Pretreatment of lignocellulose
with biological acid recycling (Biosulfurol process). Sugar Industry, 131, 639-
641.
Vanegas, C., & Bartlett, J. (2013). Green energy from marine algae: biogas production
and composition from the anaerobic digestion of Irish seaweed species.
Environmental Technology, 34(15), 2277-2283.
Vanegas, C., Hernon, A., & Bartlett, J. (2015). Enzymatic and organic acid pretreatment
of seaweed: effect on reducing sugars production and on biogas inhibition.
International Journal of Ambient Energy, 36(1), 2-7.
Varfolomeev, S. D., & Wasserman, L. A. (2011). Microalgae as source of biofuel, food,
fodder, and medicines. Applied Biochemistry and Microbiology, 47(9), 789-807.
Ventura, M. R., & Castañón, J. I. R. (1998). The nutritive value of seaweed (Ulva lactuca)
for goats. Small Ruminant Research, 29(3), 325-327.
von Riesen, V. L. (1980). Digestion of algin by Pseudomonas maltophilia and
Pseudomonas putida. Applied and Environmental Microbiology, 39(1), 92-96.
Wainright, P. O., Hinkle, G., Sogin, M. L., & Stickel, S. K. (1993). Monophyletic origins
of the metazoa: an evolutionary link with fungi. Science, 260(5106), 340-342.
Walker, D. A. (2010). Biofuels–for better or worse? Annals of Applied Biology, 156(3),
319-327.
Wang, X., Liu, X., & Wang, G. (2011). Two‐stage Hydrolysis of Invasive Algal
Feedstock for Ethanol FermentationF. Journal of Integrative Plant Biology, 53(3),
246-252.
Wang, J., Kim, Y. M., Rhee, H. S., Lee, M. W., & Park, J. M. (2013a). Bioethanol
production from mannitol by a newly isolated bacterium, Enterobacter sp. JMP3.
Bioresource technology, 135, 199-206.
Wang, S., Wang, Q., Jiang, X., Han, X., & Ji, H. (2013b). Compositional analysis of bio-
oil derived from pyrolysis of seaweed. Energy Conversion and Management, 68,
273-280.
Wei, N., Quarterman, J., & Jin, Y.-S. (2013). Marine macroalgae: an untapped resource
for producing fuels and chemicals. Trends in biotechnology, 31(2), 70-77.
147
Weiland, P. (2010). Biogas production: current state and perspectives. Applied
Microbiology Biotechnology, 85(4), 849-860.
Weiss, N., Börjesson, J., Pedersen, L. S., & Meyer, A. S. (2013). Enzymatic
lignocellulose hydrolysis: Improved cellulase productivity by insoluble solids
recycling. Biotechnology for Biofuels, 6(1), 1.
Wi, S. G., Kim, H. J., Mahadevan, S. A., Yang, D.-J., & Bae, H.-J. (2009). The potential
value of the seaweed Ceylon moss (Gelidium amansii) as an alternative bioenergy
resource. Bioresource Technology, 100(24), 6658-6660.
Wright, J. D., & Power, A. J. (1986). Comparative technical evaluation of acid hydrolysis
processes for conversion of cellulose to alcohol (No. SERI/TP-232-2957; CONF-
860405-5). Solar Energy Research Inst., Golden, CO (USA).
Wu, A. and Lee, Y. Y. (1998). Nonisothermal simultaneous saccharification and
fermenatation for direct conversion of lignocellulosic biomass to ethanol. Applied
Biochemistry and Biotechnology. 70-72, 479-492.
Wu, F.-C., Wu, J.-Y., Liao, Y.-J., Wang, M.-Y., & Shih, L. (2014). Sequential acid and
enzymatic hydrolysis in situ and bioethanol production from Gracilaria biomass.
Bioresource Technology, 156, 123-131.
Wu, X., Zhao, R., Bean, S. R., Seib, P. A., McLaren, J. S., Madl, R. L., . . . Wang, D.
(2007). Factors Impacting Ethanol Production from Grain Sorghum in the Dry-
Grind Process 1. Cereal Chemistry, 84(2), 130-136.
Wyman, C. (1996). Handbook on bioethanol: production and utilization: CRC press.
Yadav, K. S., Naseeruddin, S., Prashanthi, G. S., Sateesh, L., & Rao, L. V. (2011).
Bioethanol fermentation of concentrated rice straw hydrolysate using co-culture
of Saccharomyces cerevisiae and Pichia stipitis. Bioresource Technology,
102(11), 6473-6478.
Yamashita, Y., Sasaki, C., & Nakamura, Y. (2010). Effective enzyme saccharification
and ethanol production from Japanese cedar using various pretreatment methods.
Journal of bioscience and bioengineering, 110(1), 79-86.
Yan, S., Wu, X., Bean, S. R., Pedersen, J. F., Tesso, T., Chen, Y., & Wang, D. (2011).
Evaluation of waxy grain sorghum for ethanol production. Cereal Chemistry,
88(6):589-595
Yanagisawa, M., Nakamura, K., Ariga, O., & Nakasaki, K. (2011). Production of high
concentrations of bioethanol from seaweeds that contain easily hydrolyzable
polysaccharides. Process Biochemistry, 46(11), 2111-2116.
Yanik, J., Stahl, R., Troeger, N., & Sinag, A. (2013). Pyrolysis of algal biomass. Journal
of Analytical and Applied Pyrolysis, 103, 134-141.
Yazdani, P., Karimi, K., & Taherzadeh, M. J. (2011). Improvement of enzymatic
hydrolysis of a marine macro-algae by dilute acid hydrolysis pretreatment. In

148
World Renewable Energy Congress-Sweden; 8-13 May; 2011; Linköping;
Sweden (No. 057, pp. 186-191). Linköping University Electronic Press.
Ye, N., Li, D., Chen, L., Zhang, X., & Xu, D. (2010). Comparative studies of the pyrolytic
and kinetic characteristics of maize straw and the seaweed Ulva pertusa. PLoS
One, 5(9), e12641-e12641.
Yun, E. J., Lee, S., Kim, H. T., Pelton, J. G., Kim, S., Ko, H. J., . . . Kim, K. H. (2014).
The novel catabolic pathway of 3, 6‐anhydro‐L‐galactose, the main component of
red macroalgae, in a marine bacterium. Environmental Microbiology. 17(5),
1677-1688.
Zamalloa, C., Vulsteke, E., Albrecht, J., & Verstraete, W. (2011). The techno-economic
potential of renewable energy through the anaerobic digestion of microalgae.
Bioresource Technology, 102(2), 1149-1158.
Zhang, Q., Zhang, J., Shen, J., Silva, A., Dennis, D. A., & Barrow, C. J. (2006). A simple
96-well microplate method for estimation of total polyphenol content in seaweeds.
In Eighteenth International Seaweed Symposium (pp. 219-224). Springer
Netherlands.
Zhu, S., Wu, Y., Yu, Z., Wang, C., Yu, F., Jin, S., . . . Zhang, Y. (2006). Comparison of
three microwave/chemical pretreatment processes for enzymatic hydrolysis of
rice straw. Biosystems Engineering, 93(3), 279-283.
149
LIST OF PUBLICATIONS AND PAPERS PRESENTED
Publication
Hessami M. J., Aishah Salleh, & Phang S. M. (2016) Bioethanol as a by-product of agar
and carrageenan production industry from the tropical red seaweeds, Gracilaria
manilaensis and Kappaphycus alvarezii, Iranian Journal of Fisheries Sciences
(Accepted).
Hessami M. J., Aishah Salleh, Rabiei R., & Phang S.M (2016) Evaluation of tropical
seaweeds as feedstock for bioethanol production, International Journal of
Environmental Science and Technology (Submitted).
Hessami M. J., Phang S. M., Aishah Salleha, & Cheng S. F. (2017) Evaluation of a
simple gas chromatography sample preparation for bioethanol analysis using the
red seaweed, Gelidium elegans - Short comunication; (In preparation).
Hessamia M. J., Aslanzadeh S., Rabieie R., Aishah Saliha, & Phang S. M. (2017) A
comparative study on biogas production from residues of agar industry, (In
preparation).
Conference and seminar presentation
Hessami M. J., Wong M. M., Teoh T. C., Aishah Binti Salleh, Zainudin Bin Arifin &
Phang S. M. (2012) Evaluating perchloric acid for the saccharification of selected
seaweeds, Poster presentation in South China Sea 2012 (SCS2012): Sharing
Knowledge, Resources and Technologies for Sustainable South China Sea.
Second Conference for Regional Cooperation in the South China Sea conference,
22-26 October 2012 at University of Malaya, Malayisa.
Hessami, M. J., Aishah, Salleh, & Phang, S. M. (2015). Evaluation of tropical seaweeds
as feedstock for bioethanol production. In: 20th biological scinces graduate
congress: Biological Science Research For Enhancing ASEAN Sustainability,
Bangkok, Thailand 9-11 Dec, (23): Chulalongkorn University, Thailand.

150
APPENDICES
APPENDIX A: Neutral sugar analysis by GC (hydrolysis and derivatization) according
(Melton & Smith, 2001).
Materials:
Dried macroalgal sample; 2 M trifluoroacetic acid (TFA); Nitrogen gas; 20 mg/ml
allose; Seven sugar standard; 15 M ammonia (analytical grade); 0.5 M sodium
borohydride in DMSO (freshly prepared); 18 M acetic acid (glacial, analytical grade); 1-
methylimidazole; Acetic anhydride; Dichloromethane (high quality)
Hydrolyze seaweed biomass with TFA
1. Place 10 mg of dried seaweed powder into a clean borosilicate glass test tube.
2. Add 0.5 mL of 2 M TFA with glass tip pipette, to each sample.
3. Flush test tubes well with nitrogen gas (to remove all traces of air) and cap tightly
using a screw cap with Teflon-lined insert. Vortex to mix, taking care not to spread the
solid material above the level of the liquid.
4. Incubate for 60 min at 121 °C. Allow to cool.
5. Add 25 μl of 20 mg mL-1 allose (internal standard). Vortex to mix.
6. Filter hydrolysate using glass syringe fitted with a swinney stainless steel 13-mm
filter unit and a 0.22 μm PTFE filter into a clean borosilicate glass test tube.
7. Evaporate filtrate to dryness in a gentle stream of air or nitrogen gas.
151
Reduce monosaccharides to corresponding alditols
1. Take dried hydrolysates and add 100 μl Milli-Q-purified water to each test tube.
2. Set up two clean test tubes as controls. Add 100 μl Milli-Q water (water control) to
one
tube and 100 μl of the sugars standard to the other tube.
3. Add 20 μl of 15 M ammonia to each tube under a fume hood.
4. Add 1 mL of 0.5 M sodium borohydride in DMSO to each tube, cap the test tubes
and vortex.
5. Incubate for 90 min at 40 °C.
6. Add 100 μl of 18 M acetic acid to each tube in a fume hood, vortex to mix.
Acetylate the alditols
1. Add 200 μl of 1-methylimidazole.
2. Add 2 mL acetic anhydride to each tube and vortex to mix.
3. Incubate for 10 min at room temperature.
4. Add 5 mL Milli-Q-purified water to each tube to destroy the excess acetic anhydride.
5. Incubate for 10 min at room temperature or until cool.
152
6. Add 1 mL dichloromethane (DCM) to extract the alditol acetates. Vortex to mix and
allow the phases to separate and transfer the lower DCM phase to a clean borosilicate
glass tube using a Pasteur pipet.
7. Add another 1 mL DCM to the original solution (aqueous phase) and repeat the
extraction process.
8. Add 4 mL Milli-Q-purified water to the combined DCM extracts and vortex to mix.
Remove upper aqueous phase and discard. Add 4 mL water and repeat the wash procedure
an additional three times.
9. Gently evaporate the DCM completely in a stream of instrument-grade air or
nitrogen
gas, and add 2 mL of DCM. Proceed to gas chromatography of the fully acetylated
alditols.
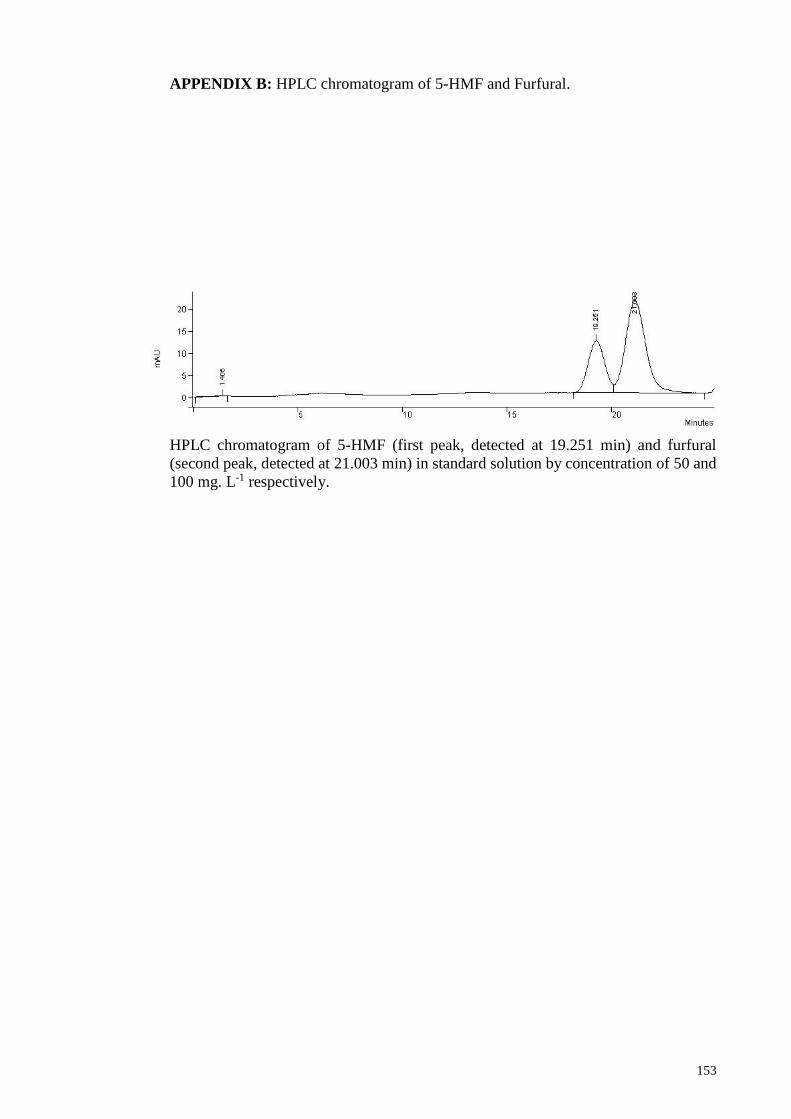
153
APPENDIX B: HPLC chromatogram of 5-HMF and Furfural.
HPLC chromatogram of 5-HMF (first peak, detected at 19.251 min) and furfural
(second peak, detected at 21.003 min) in standard solution by concentration of 50 and
100 mg. L-1 respectively.
154
APPENDIX C: Preparing solutions for Folin–Ciocalteu (Lee et al., 2004; Singleton,
Orthofer & Lamuela-Raventos, 1999).
Preparation of the Gallic acid standard
Gallic acid (G7384 SIGMA, USA) was used as standard of the phenolic compounds.
To prepare main stock solution (5 g L-1), 0.5 g of gallic acid was dissolved in 10 mL
ethanol (99%) and then taped to 100 mL in a volumetric balloon with distilled water.
Then 1, 2, 5 and 10 mL of this stock were diluted to 100 mL to achieve standards with
concentration of 50, 100, 250 and 500 mg L-1 gallic acid, respectively. This solution is
stable up to two weeks in 4 °C.
ii. Preparation of sodium carbonate solution
20 g of anhydrous sodium carbonate was dissolved in 80 mL of distilled water in a 250
mL flask and heated up to boiling then cooled down at room temperature. Few crystals
of anhydrous sodium carbonate (< 0.1 g) were added to solution and kept at room
temperature for 24 hours. The solution was filtered with filter paper (Whatman No. 1)
and distilled water was added to reach 100 mL.

155
APPENDIX D: Normality test of dilute acid saccharification of K. alvarezii based on
skewness and kurtosis. Descriptive table and boxplots of reducing sugar yield
distribution.
Descriptive normality test Statistic SE
sugar Mean
24.38375 0.47905 Skewness -0.34007 0.157138 Kurtosis
-0.8375 0.313012
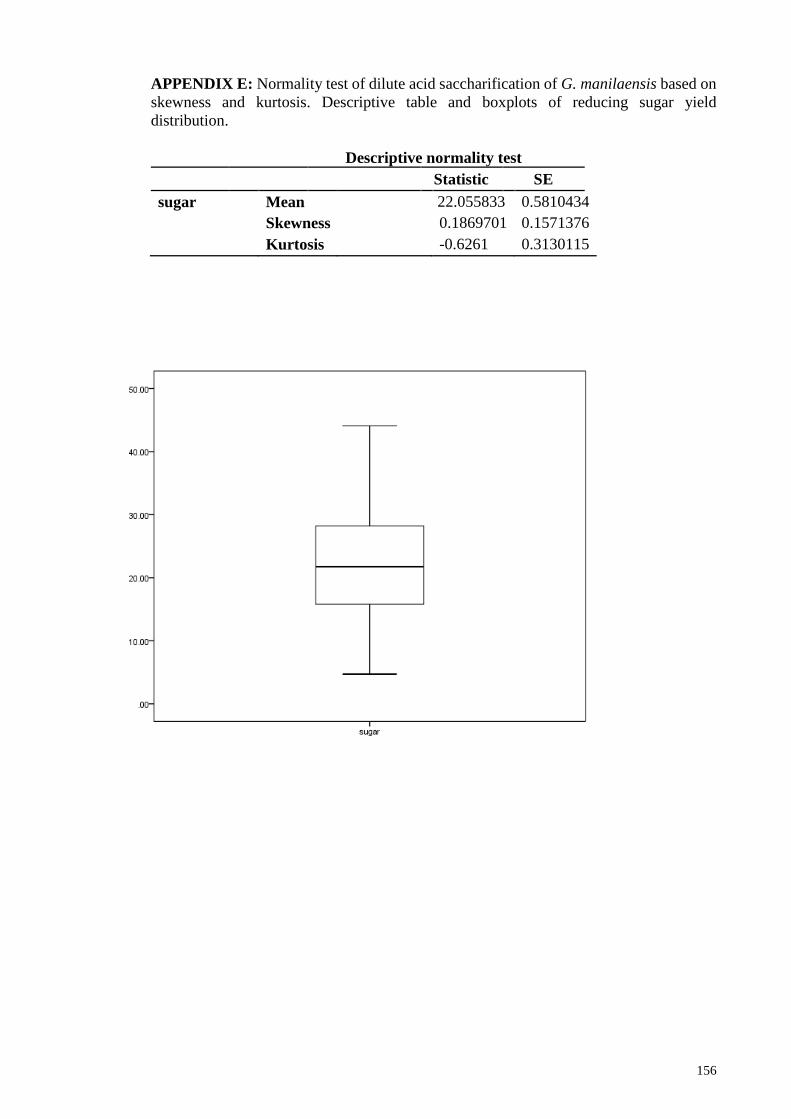
156
APPENDIX E: Normality test of dilute acid saccharification of G. manilaensis based on
skewness and kurtosis. Descriptive table and boxplots of reducing sugar yield
distribution.
Descriptive normality test
Statistic SE
sugar Mean
22.055833 0.5810434 Skewness
0.1869701 0.1571376
Kurtosis -0.6261 0.3130115
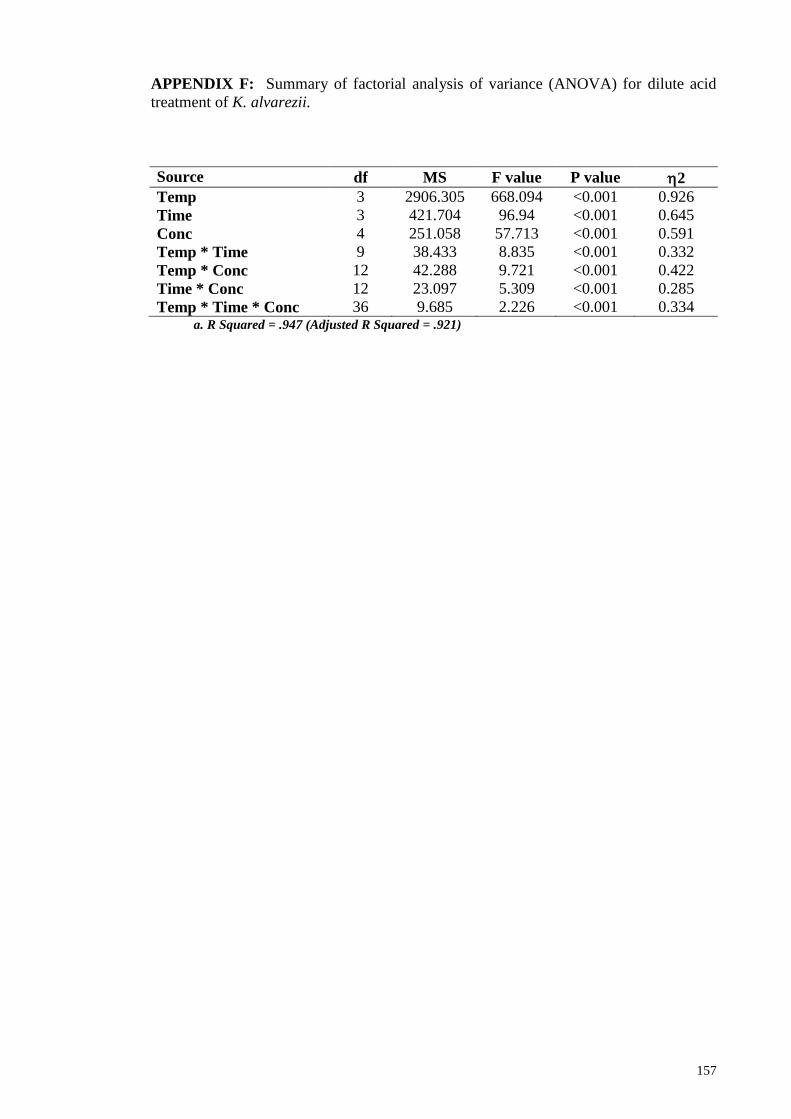
157
APPENDIX F: Summary of factorial analysis of variance (ANOVA) for dilute acid
treatment of K. alvarezii.
Source df MS F value P value 2
Temp 3 2906.305 668.094 <0.001 0.926
Time 3 421.704 96.94 <0.001 0.645
Conc 4 251.058 57.713 <0.001 0.591
Temp * Time 9 38.433 8.835 <0.001 0.332
Temp * Conc 12 42.288 9.721 <0.001 0.422
Time * Conc 12 23.097 5.309 <0.001 0.285
Temp * Time * Conc 36 9.685 2.226 <0.001 0.334 a. R Squared = .947 (Adjusted R Squared = .921)
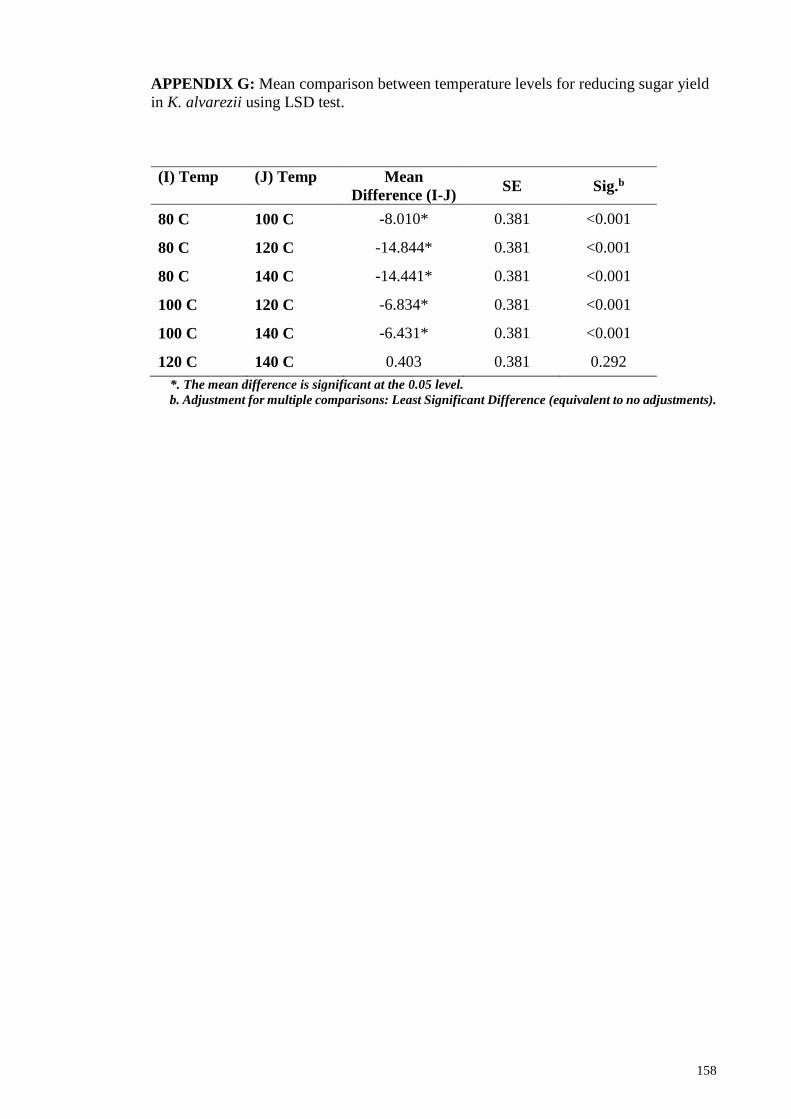
158
APPENDIX G: Mean comparison between temperature levels for reducing sugar yield
in K. alvarezii using LSD test.
(I) Temp (J) Temp Mean
Difference (I-J) SE Sig.b
80 C 100 C -8.010* 0.381 <0.001
80 C 120 C -14.844* 0.381 <0.001
80 C 140 C -14.441* 0.381 <0.001
100 C 120 C -6.834* 0.381 <0.001
100 C 140 C -6.431* 0.381 <0.001
120 C 140 C 0.403 0.381 0.292
*. The mean difference is significant at the 0.05 level.
b. Adjustment for multiple comparisons: Least Significant Difference (equivalent to no adjustments).
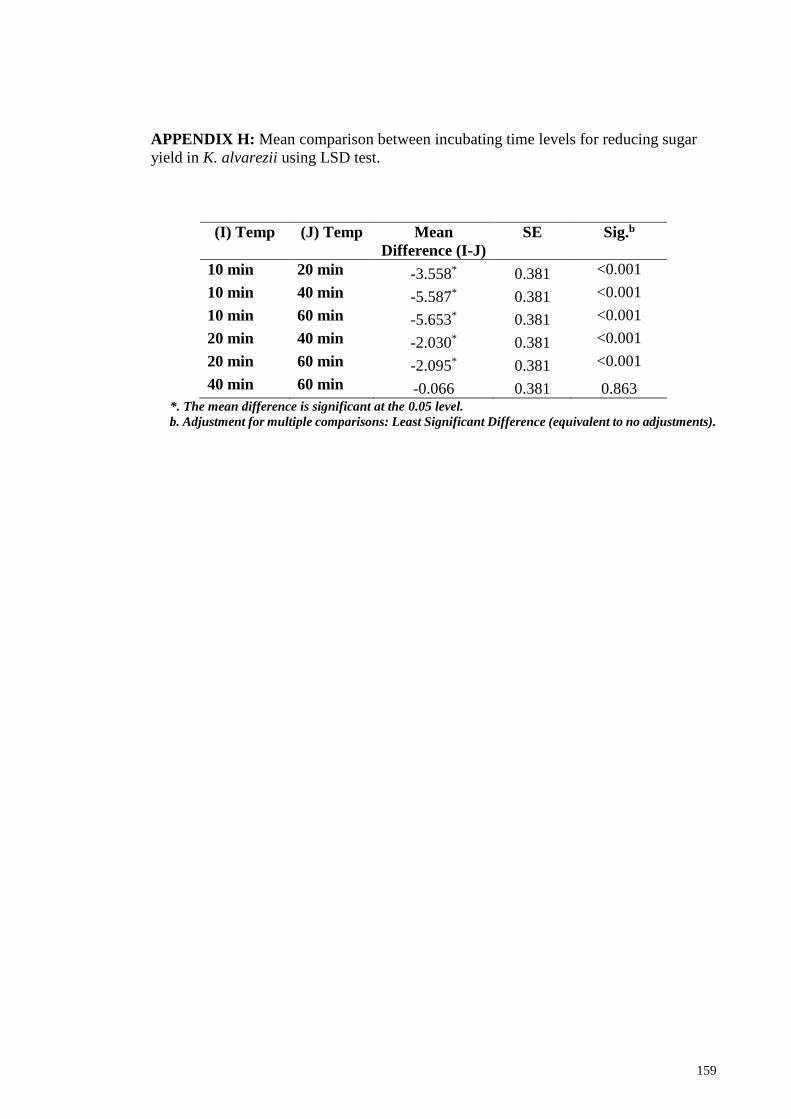
159
APPENDIX H: Mean comparison between incubating time levels for reducing sugar
yield in K. alvarezii using LSD test.
(I) Temp (J) Temp Mean
Difference (I-J)
SE Sig.b
10 min 20 min -3.558* 0.381 <0.001
10 min 40 min -5.587* 0.381 <0.001
10 min 60 min -5.653* 0.381 <0.001
20 min 40 min -2.030* 0.381 <0.001
20 min 60 min -2.095* 0.381 <0.001
40 min 60 min -0.066 0.381 0.863 *. The mean difference is significant at the 0.05 level.
b. Adjustment for multiple comparisons: Least Significant Difference (equivalent to no adjustments).
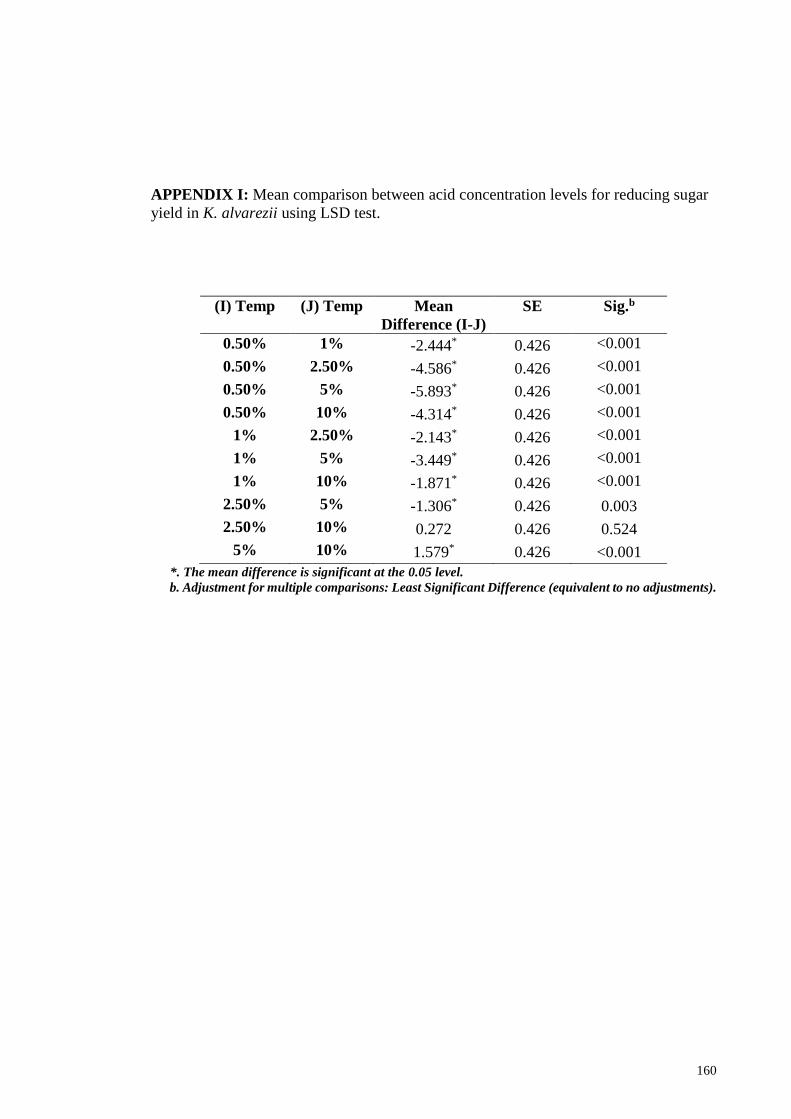
160
APPENDIX I: Mean comparison between acid concentration levels for reducing sugar
yield in K. alvarezii using LSD test.
(I) Temp (J) Temp Mean
Difference (I-J)
SE Sig.b
0.50% 1% -2.444* 0.426 <0.001
0.50% 2.50% -4.586* 0.426 <0.001
0.50% 5% -5.893* 0.426 <0.001
0.50% 10% -4.314* 0.426 <0.001
1% 2.50% -2.143* 0.426 <0.001
1% 5% -3.449* 0.426 <0.001
1% 10% -1.871* 0.426 <0.001
2.50% 5% -1.306* 0.426 0.003
2.50% 10% 0.272 0.426 0.524
5% 10% 1.579* 0.426 <0.001
*. The mean difference is significant at the 0.05 level.
b. Adjustment for multiple comparisons: Least Significant Difference (equivalent to no adjustments).
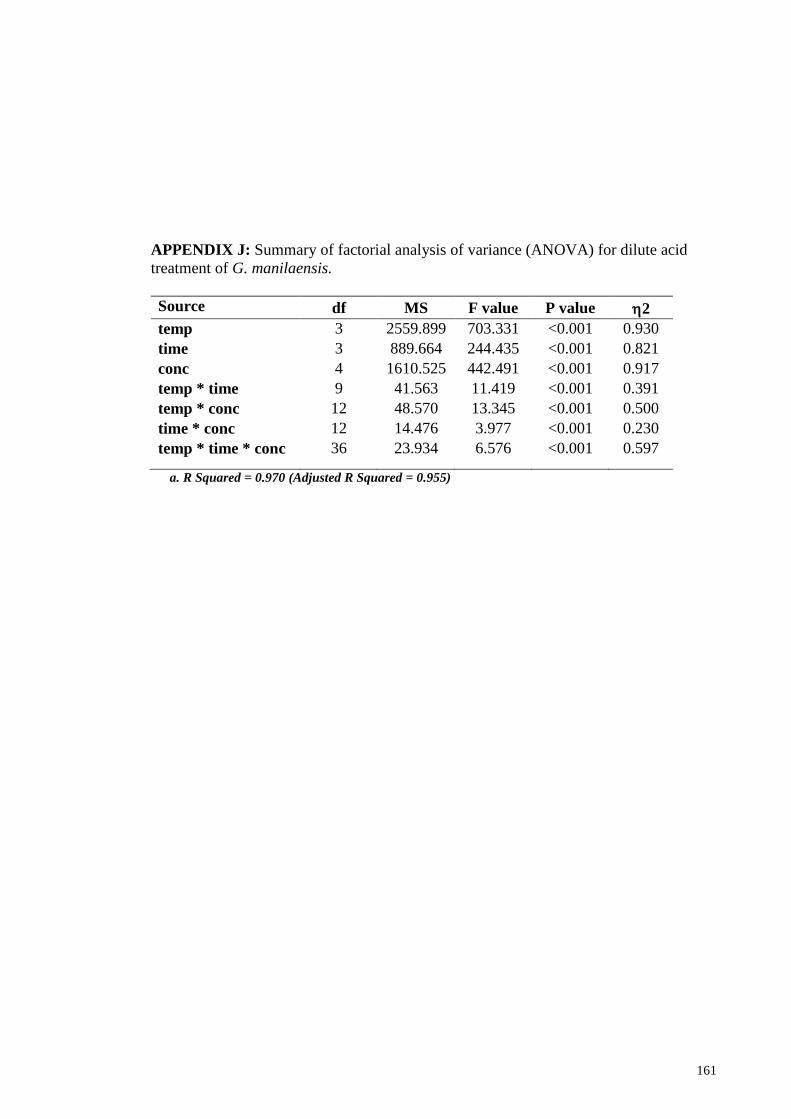
161
APPENDIX J: Summary of factorial analysis of variance (ANOVA) for dilute acid
treatment of G. manilaensis.
Source df MS F value P value 2
temp 3 2559.899 703.331 <0.001 0.930
time 3 889.664 244.435 <0.001 0.821
conc 4 1610.525 442.491 <0.001 0.917
temp * time 9 41.563 11.419 <0.001 0.391
temp * conc 12 48.570 13.345 <0.001 0.500
time * conc 12 14.476 3.977 <0.001 0.230
temp * time * conc 36 23.934 6.576 <0.001 0.597
a. R Squared = 0.970 (Adjusted R Squared = 0.955)

162
APPENDIX K: Mean comparison between temperature levels for reducing sugar yield
in G. manilaensis using LSD test.
(I) Temp (J) Temp Mean
Difference (I-J)
SE Sig.b
80 C 100 C -4.217* 0.348 <0.001
80 C 120 C -15.436* 0.348 <0.001
80 C 140 C -7.506* 0.348 <0.001
100 C 120 C -11.219* 0.348 <0.001
100 C 140 C -3.289* 0.348 <0.001
120 C 140 C 7.930* 0.348 <0.001
*. The mean difference is significant at the 0.05 level.
b. Adjustment for multiple comparisons: Least Significant Difference (equivalent to no adjustments).
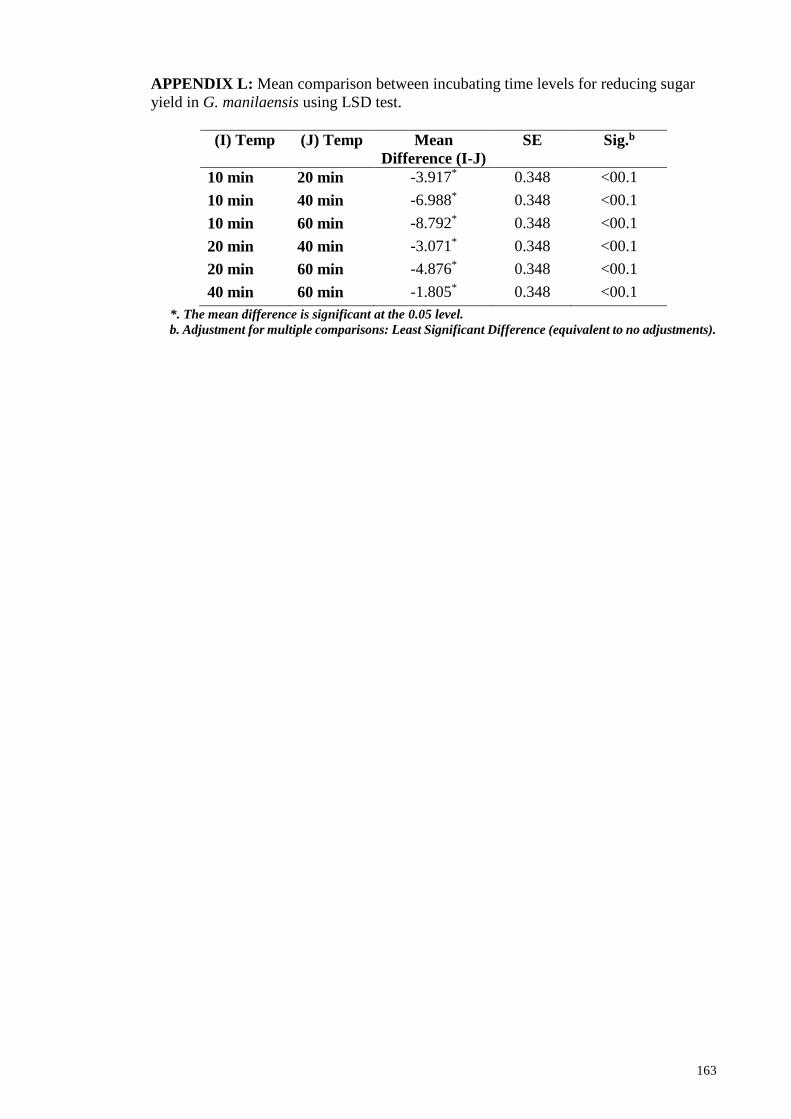
163
APPENDIX L: Mean comparison between incubating time levels for reducing sugar
yield in G. manilaensis using LSD test.
(I) Temp (J) Temp Mean
Difference (I-J)
SE Sig.b
10 min 20 min -3.917* 0.348 <00.1
10 min 40 min -6.988* 0.348 <00.1
10 min 60 min -8.792* 0.348 <00.1
20 min 40 min -3.071* 0.348 <00.1
20 min 60 min -4.876* 0.348 <00.1
40 min 60 min -1.805* 0.348 <00.1
*. The mean difference is significant at the 0.05 level.
b. Adjustment for multiple comparisons: Least Significant Difference (equivalent to no adjustments).
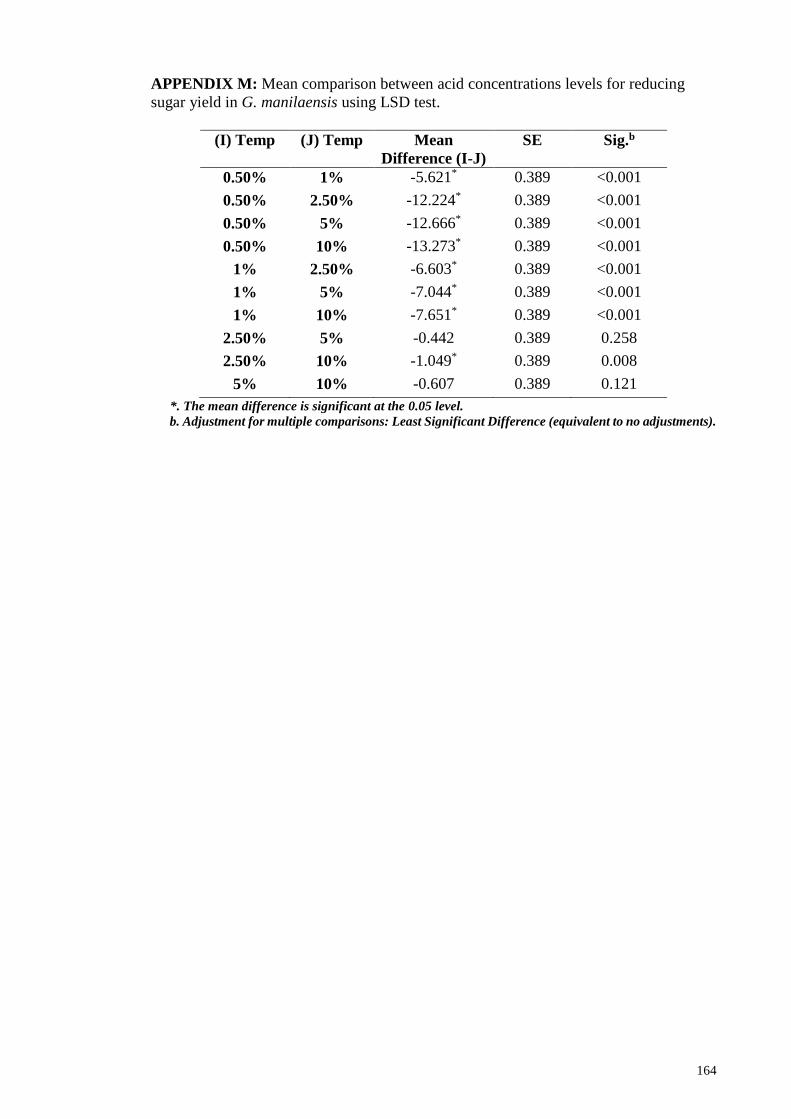
164
APPENDIX M: Mean comparison between acid concentrations levels for reducing
sugar yield in G. manilaensis using LSD test.
(I) Temp (J) Temp Mean
Difference (I-J)
SE Sig.b
0.50% 1% -5.621* 0.389 <0.001
0.50% 2.50% -12.224* 0.389 <0.001
0.50% 5% -12.666* 0.389 <0.001
0.50% 10% -13.273* 0.389 <0.001
1% 2.50% -6.603* 0.389 <0.001
1% 5% -7.044* 0.389 <0.001
1% 10% -7.651* 0.389 <0.001
2.50% 5% -0.442 0.389 0.258
2.50% 10% -1.049* 0.389 0.008
5% 10% -0.607 0.389 0.121
*. The mean difference is significant at the 0.05 level.
b. Adjustment for multiple comparisons: Least Significant Difference (equivalent to no adjustments).
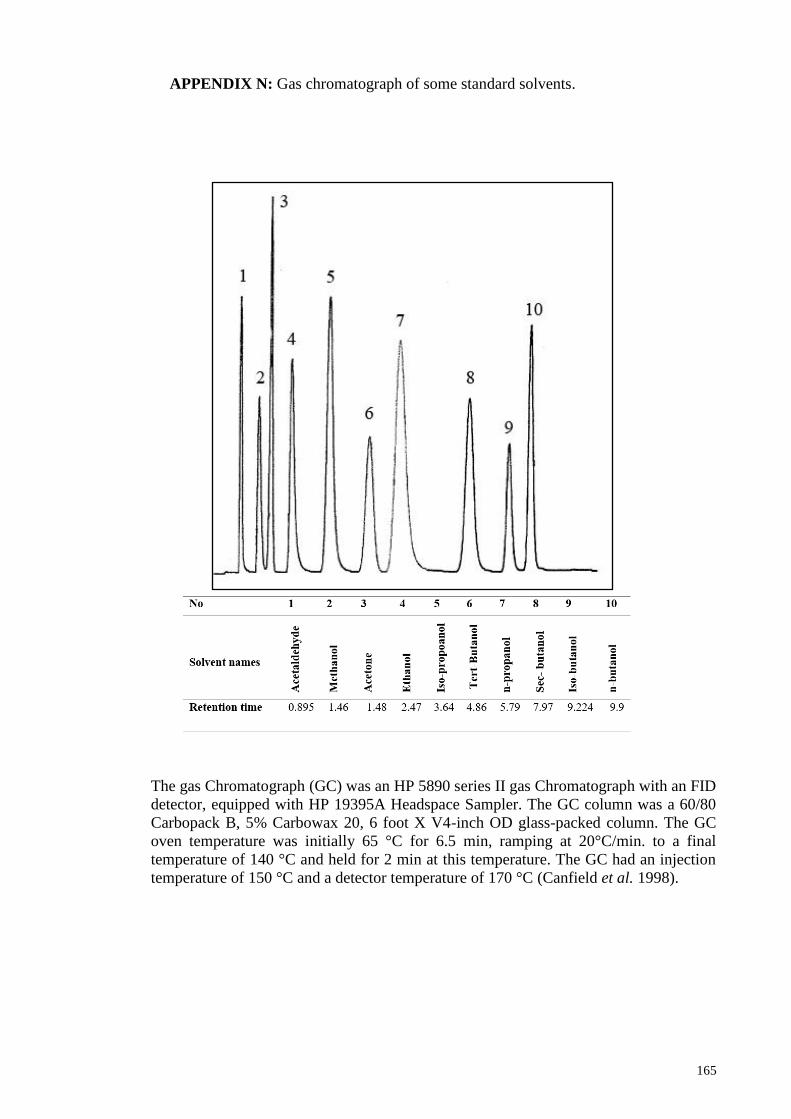
165
APPENDIX N: Gas chromatograph of some standard solvents.
The gas Chromatograph (GC) was an HP 5890 series II gas Chromatograph with an FID
detector, equipped with HP 19395A Headspace Sampler. The GC column was a 60/80
Carbopack B, 5% Carbowax 20, 6 foot X V4-inch OD glass-packed column. The GC
oven temperature was initially 65 °C for 6.5 min, ramping at 20°C/min. to a final
temperature of 140 °C and held for 2 min at this temperature. The GC had an injection
temperature of 150 °C and a detector temperature of 170 °C (Canfield et al. 1998).
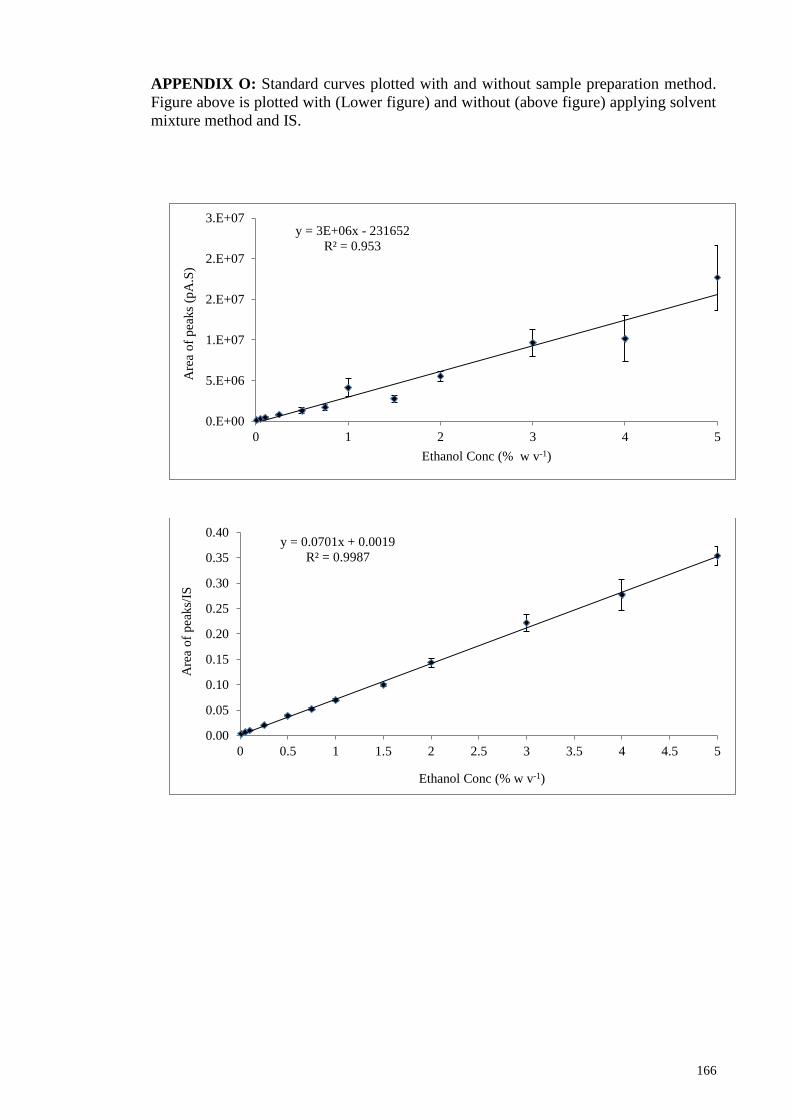
166
APPENDIX O: Standard curves plotted with and without sample preparation method.
Figure above is plotted with (Lower figure) and without (above figure) applying solvent
mixture method and IS.
y = 3E+06x - 231652
R² = 0.953
0.E+00
5.E+06
1.E+07
2.E+07
2.E+07
3.E+07
0 1 2 3 4 5
Are
a o
f p
eaks
(pA
.S)
Ethanol Conc (% w v-1)
y = 0.0701x + 0.0019
R² = 0.9987
0.00
0.05
0.10
0.15
0.20
0.25
0.30
0.35
0.40
0 0.5 1 1.5 2 2.5 3 3.5 4 4.5 5
Are
a o
f p
eaks/
IS
Ethanol Conc (% w v-1)