image processing and analysis techniques for estimating ...ejtafs.mardi.gov.my/jtafs/35-1/chokanan...
TRANSCRIPT
183
C.C. Teoh and A.R. Mohd SyaifudinJ. Trop. Agric. and Fd. Sc. 35(1)(2007): 183– 190
Image processing and analysis techniques for estimating weight of Chokanan mangoes(Teknik pemprosesan imej dan analisis imej untuk menganggarkan berat mangga Chokanan)
C.C. Teoh* and A.R. Mohd Syaifudin*
Key words: Chokanan, image capture, image filter, image threshold, mango size, mango weight
AbstractSize is one of the major parameters that the consumer identifies to be related to the quality of mango. According to Federal Agricultural Marketing Authority (FAMA) Malaysia, size of mango is determined by weight. This paper presents a study on measuring the weight of Chokanan mangoes using image processing and analysis techniques. The computing PCI software was used to process and analyse mango image obtained from image acquisition system. Number of pixels of mango region in the captured image was counted by the software after image processing and analysing processes. A relationship between mango pixels and mango weights was analysed using statistical method of regression. The statistical analyses results showed that the mango pixels counted has high relationship with the mango weights with correlation coefficient value of 0.9769. The linear model developed from the linear regression analysis was evaluated by a set of 50 mango samples in terms of mango weight estimation accuracy. The evaluation results showed that, the mean absolute percentage error of estimating a mango weight using the linear model was 3.76%. As a result, the image processing and analysis techniques are practical, feasible and effective in estimating weight of Chokanan mangoes.
*Mechanization and Automation Research Centre, MARDI Headquarters, Serdang, P.O. Box 12301, 50774 Kuala Lumpur, MalaysiaAuthors’ full names: Teoh Chin Chuang and Mohd Syaifudin Abdul RahmanE-mail: [email protected]©Malaysian Agricultural Research and Development Institute 2007
IntroductionMango is one of the major fruits produced in Malaysia with the export value of 126,000 t in the year 2002. Post-harvest handling is an important stage in fruit production process to ensure the fruit quality. The post-harvest handling process involves cleaning, grading and packaging. Grading is essential for determining fruit quality and also for pricing. Many local producers are still very much dependent on human labour to grade the fruits following grade recommended by
Federal Agricultural Marketing Authority (FAMA) Malaysia. The fruits are graded based on size, maturity index and external defects of fruit. Computer vision systems can be used for automated fruits inspection and grading. These systems have been widely used in the food and agricultural industry for inspection and evaluation as they provide suitable rapid, economic, consistent and objective assessment (Sun 2000). According to Kanali et al. (1998) the automated
184
Techniques for estimating weight of mangoes
inspection of produce using machine vision not only results in labour savings, but also improves inspection objectivity. Over the past decade, advances in hardware and software for digital image processing and analysis have motivated several studies on the development of the system to evaluate quality of diverse and processed foods (Gerrard et al. 1996; Locht et al. 1997). Image processing and analysis is the core of computer vision to achieve the required classification and measurement (Krutz et al. 2000). Nagata et al. (1997) investigated the use of image processing and analysis to sort fresh strawberries based on size and shape. The results showed that the system was able to sort 600 strawberries into three grades of shape and five grades of size with an accuracy of 94–98%. Toa et al. (1995) performed a study to classify ‘Golden Delicious’ apples into yellow and green groups using the HIS (hue, intensity, saturation) colour system method. The results showed that an accuracy of over 90% was achieved for the 120 samples tested. A study by Kondo (1995) on the quality through correlation of the appearance with sweetness of Iyokan oranges using image analysis demonstrated that the method effectively predicted the sweetness of the oranges with 87% correlation efficiency between measured and calculated sugar content. Leemans et al. (1998) investigated the surface defect detection of ‘Golden Delicious’ apples using image analysis. The results showed that the image analysis effectively detected various defects such as bruises, russet, scads, fungi or wounds. Sizes of tomato, potato, raisin and apple have been estimated in different ways using image processing and analysis techniques in the studies by Sarkar and Wolfe (1985), Toa et al. (1990), Okamura et al. (1991) and Varghese et al. (1991), respectively. Size is one of the major parameters that consumer identifies together with the quality of fruits (Aleixos et al. 2002). According
to FAMA, size of tropical fruits (i.e. mango, pineapple, watermelon, papaya and starfruit) is determined by weight. Manual weighing of fruits for grading size is time consuming, labour intensive, and costly. Image processing and analysis techniques in the computer vision system can be used as an alternative automated grading of fruit size based on weight. The objective of this paper was to determine how correctly the image processing and analysis measured the weight of the Chokanan mangoes, as well as estimating the error, in order to evaluate the ability of the linear model developed in the linear regression analysis for estimating weight of the mangoes.
Materials and methodsSamplingA total of 100 random samples of physiologically mature and green condition of Chokanan mangoes were harvested from an orchard at Rembau, Negeri Sembilan. Fruits were weighed using the digital balance. The samples were separated into reference and evaluate sets of 50 samples each. The 50 mango samples from reference set were used to develop a linear regression model for weight estimation. While the other 50 mangoes from evaluate set were used to verify the model.
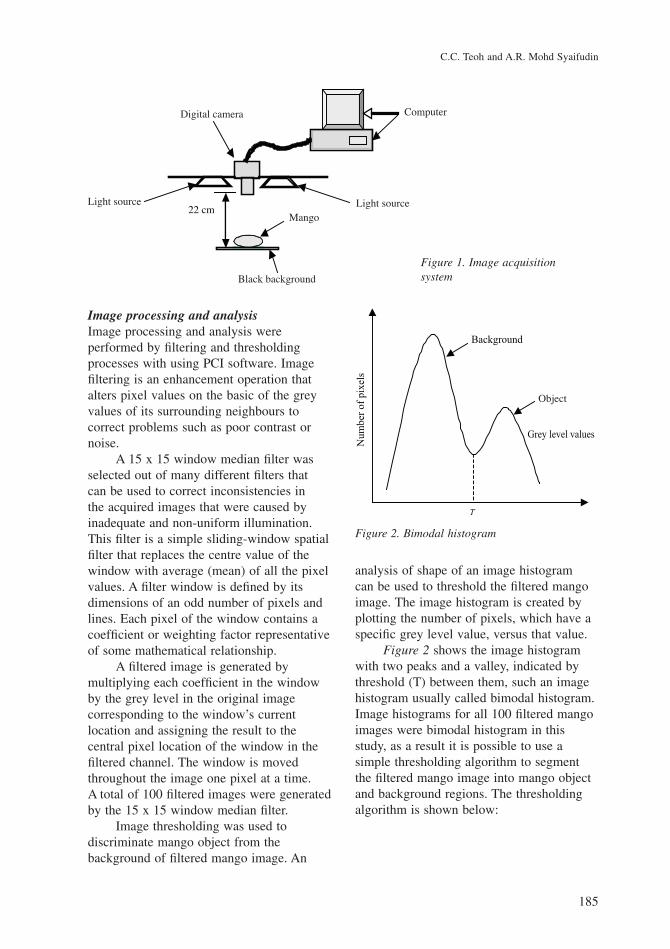
Image capturingThe 100 mango samples were immersed in water and cleaned using a soft sponge. Following that the fruits were exposed to an image acquisition system (Figure 1) consisted of a colour camera, a computer equipped with an image acquisition board, and a lighting system for capturing mango images. The images were captured in a room with a proper control environment such as lighting and height (22 cm) from camera to mango. The resolution of each captured image was 0.3 mm/pixel.
185
C.C. Teoh and A.R. Mohd Syaifudin
Image processing and analysisImage processing and analysis were performed by filtering and thresholding processes with using PCI software. Image filtering is an enhancement operation that alters pixel values on the basic of the grey values of its surrounding neighbours to correct problems such as poor contrast or noise. A 15 x 15 window median filter was selected out of many different filters that can be used to correct inconsistencies in the acquired images that were caused by inadequate and non-uniform illumination. This filter is a simple sliding-window spatial filter that replaces the centre value of the window with average (mean) of all the pixel values. A filter window is defined by its dimensions of an odd number of pixels and lines. Each pixel of the window contains a coefficient or weighting factor representative of some mathematical relationship. A filtered image is generated by multiplying each coefficient in the window by the grey level in the original image corresponding to the window’s current location and assigning the result to the central pixel location of the window in the filtered channel. The window is moved throughout the image one pixel at a time. A total of 100 filtered images were generated by the 15 x 15 window median filter. Image thresholding was used to discriminate mango object from the background of filtered mango image. An
analysis of shape of an image histogram can be used to threshold the filtered mango image. The image histogram is created by plotting the number of pixels, which have a specific grey level value, versus that value. Figure 2 shows the image histogram with two peaks and a valley, indicated by threshold (T) between them, such an image histogram usually called bimodal histogram. Image histograms for all 100 filtered mango images were bimodal histogram in this study, as a result it is possible to use a simple thresholding algorithm to segment the filtered mango image into mango object and background regions. The thresholding algorithm is shown below:
22 cm
Light source Light source
Black background
Mango
ComputerDigital camera
Figure 1. Image acquisition system
Background
Grey level values
Num
ber
of p
ixel
s
T
Object
Figure 2. Bimodal histogram
186
Techniques for estimating weight of mangoes
0, if f(x,y) ≤T
g(x,y) = { 1, otherwise
where g(x, y) is the image after thresholding, f(x, y) is the original filtered mango image and T is the threshold. All pixels of filtered mango image with grey level values greater than T were classified as object pixels (1), while pixels with grey level values equal or smaller than T were labelled as background pixels (0). The number of pixels of mango region in thresholded image was counted for regression analysis with the mango weight.
Statistical analysisA linear regression analysis was used to analyse the relationship between mango 2-dimension (2D) area of thresholded image and mango weight. The 2D area is determined by the number of mango region pixels in the thresholded image. In the regression analysis, a linear model was developed to predict the weight (dependent variable) of mango from the counted mango pixels (independent variable). To evaluate the linear model, a 95% confidence and prediction intervals graph was used to prove the linear model adequately fits the data. The confidence region was obtained using the formula: (Estimate) ± t * S(D)1/2, while the prediction region was calculated by the formula: (Estimate) ± t * S(1+D)1/2, where S is the standard deviation (estimated by mean square error), t-value from Student’s t-distribution depending on the level of confidence and degree of freedom, and D depending on each value of the regression line. The difference between the two formulae is that the calculation of prediction region has 1 added to the quantity under the square root sign.
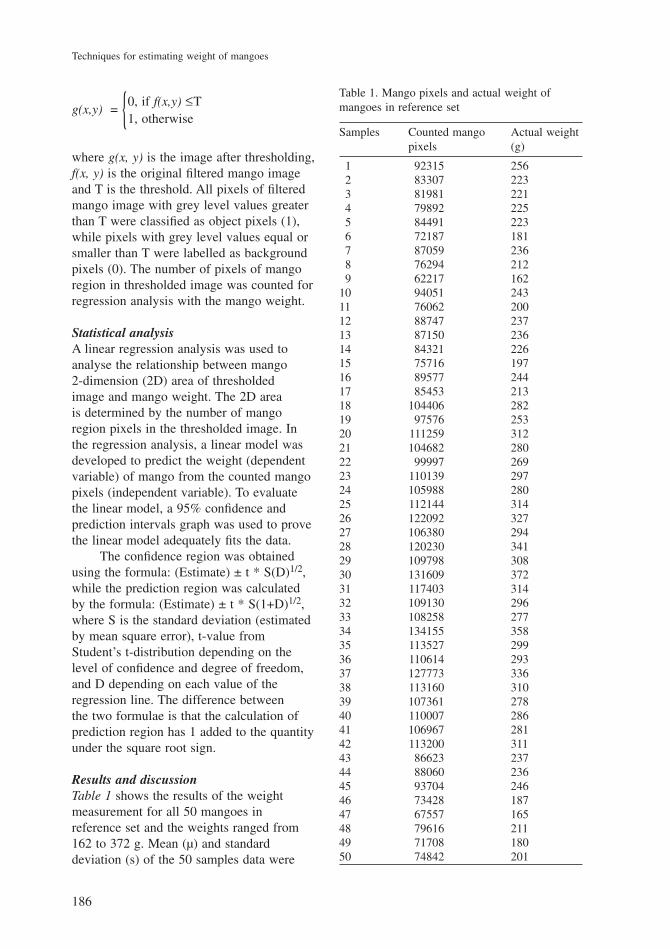
Results and discussionTable 1 shows the results of the weight measurement for all 50 mangoes in reference set and the weights ranged from 162 to 372 g. Mean (μ) and standard deviation (s) of the 50 samples data were
Table 1. Mango pixels and actual weight of mangoes in reference set
Samples Counted mango Actual weight pixels (g)
1 92315 256 2 83307 223 3 81981 221 4 79892 225 5 84491 223 6 72187 181 7 87059 236 8 76294 212 9 62217 16210 94051 24311 76062 20012 88747 23713 87150 23614 84321 22615 75716 19716 89577 24417 85453 21318 104406 28219 97576 25320 111259 31221 104682 28022 99997 26923 110139 29724 105988 28025 112144 31426 122092 32727 106380 29428 120230 34129 109798 30830 131609 37231 117403 31432 109130 29633 108258 27734 134155 35835 113527 29936 110614 29337 127773 33638 113160 31039 107361 27840 110007 28641 106967 28142 113200 31143 86623 23744 88060 23645 93704 24646 73428 18747 67557 16548 79616 21149 71708 18050 74842 201
187
C.C. Teoh and A.R. Mohd Syaifudin
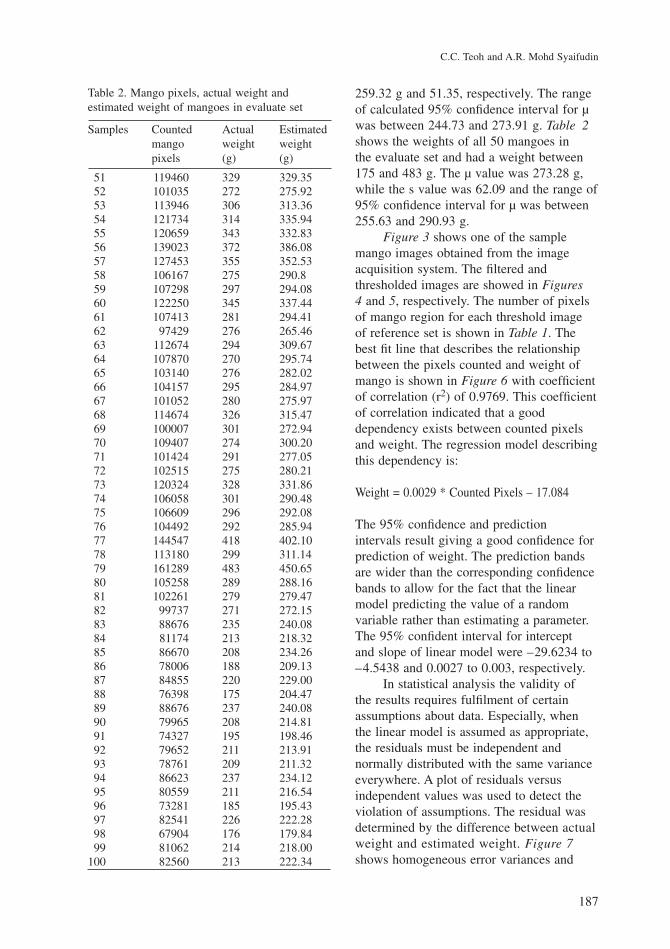
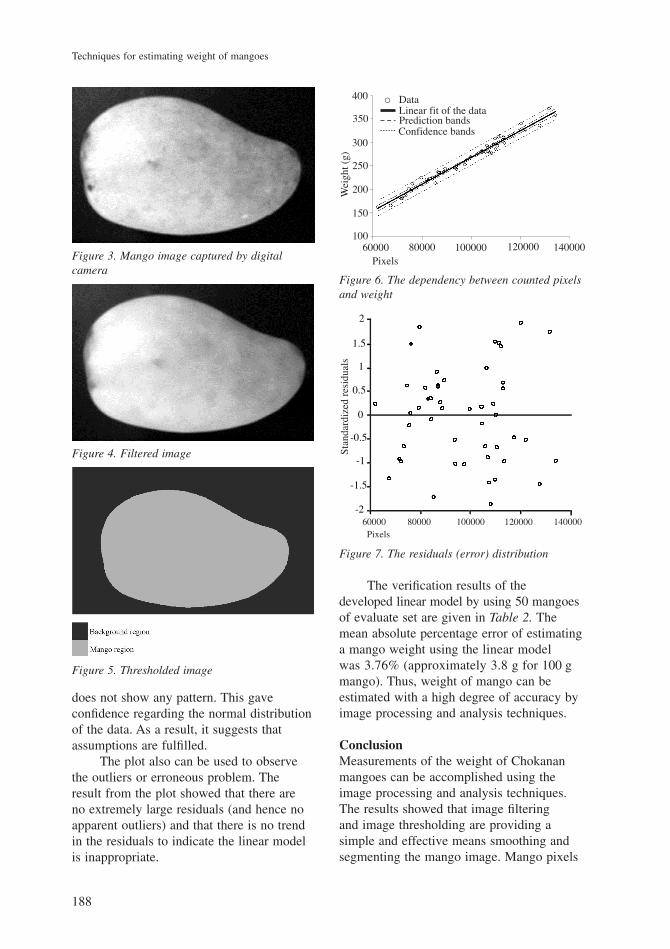
259.32 g and 51.35, respectively. The range of calculated 95% confidence interval for μ was between 244.73 and 273.91 g. Table 2 shows the weights of all 50 mangoes in the evaluate set and had a weight between 175 and 483 g. The μ value was 273.28 g, while the s value was 62.09 and the range of 95% confidence interval for μ was between 255.63 and 290.93 g. Figure 3 shows one of the sample mango images obtained from the image acquisition system. The filtered and thresholded images are showed in Figures 4 and 5, respectively. The number of pixels of mango region for each threshold image of reference set is shown in Table 1. The best fit line that describes the relationship between the pixels counted and weight of mango is shown in Figure 6 with coefficient of correlation (r2) of 0.9769. This coefficient of correlation indicated that a good dependency exists between counted pixels and weight. The regression model describing this dependency is:
Weight = 0.0029 * Counted Pixels – 17.084
The 95% confidence and prediction intervals result giving a good confidence for prediction of weight. The prediction bands are wider than the corresponding confidence bands to allow for the fact that the linear model predicting the value of a random variable rather than estimating a parameter. The 95% confident interval for intercept and slope of linear model were –29.6234 to –4.5438 and 0.0027 to 0.003, respectively. In statistical analysis the validity of the results requires fulfilment of certain assumptions about data. Especially, when the linear model is assumed as appropriate, the residuals must be independent and normally distributed with the same variance everywhere. A plot of residuals versus independent values was used to detect the violation of assumptions. The residual was determined by the difference between actual weight and estimated weight. Figure 7 shows homogeneous error variances and
Table 2. Mango pixels, actual weight and estimated weight of mangoes in evaluate set
Samples Counted Actual Estimated mango weight weight pixels (g) (g)
51 119460 329 329.35 52 101035 272 275.92 53 113946 306 313.36 54 121734 314 335.94 55 120659 343 332.83 56 139023 372 386.08 57 127453 355 352.53 58 106167 275 290.8 59 107298 297 294.08 60 122250 345 337.44 61 107413 281 294.41 62 97429 276 265.46 63 112674 294 309.67 64 107870 270 295.74 65 103140 276 282.02 66 104157 295 284.97 67 101052 280 275.97 68 114674 326 315.47 69 100007 301 272.94 70 109407 274 300.20 71 101424 291 277.05 72 102515 275 280.21 73 120324 328 331.86 74 106058 301 290.48 75 106609 296 292.08 76 104492 292 285.94 77 144547 418 402.10 78 113180 299 311.14 79 161289 483 450.65 80 105258 289 288.16 81 102261 279 279.47 82 99737 271 272.15 83 88676 235 240.08 84 81174 213 218.32 85 86670 208 234.26 86 78006 188 209.13 87 84855 220 229.00 88 76398 175 204.47 89 88676 237 240.08 90 79965 208 214.81 91 74327 195 198.46 92 79652 211 213.91 93 78761 209 211.32 94 86623 237 234.12 95 80559 211 216.54 96 73281 185 195.43 97 82541 226 222.28 98 67904 176 179.84 99 81062 214 218.00100 82560 213 222.34
188
Techniques for estimating weight of mangoes
400
350
300
250
200
150
10060000 80000 100000 120000 140000
� DataLinear fit of the dataPrediction bandsConfidence bands
Pixels
Wei
ght (
g)
Figure 6. The dependency between counted pixels and weight
Figure 7. The residuals (error) distribution
2
1
0
0.5
-0.5
-1.5
-2
-1
1.5
60000 80000 100000 120000 140000Pixels
ο
Stan
dard
ized
resid
uals
Figure 3. Mango image captured by digital camera
Figure 4. Filtered image
Figure 5. Thresholded image
does not show any pattern. This gave confidence regarding the normal distribution of the data. As a result, it suggests that assumptions are fulfilled. The plot also can be used to observe the outliers or erroneous problem. The result from the plot showed that there are no extremely large residuals (and hence no apparent outliers) and that there is no trend in the residuals to indicate the linear model is inappropriate.
The verification results of the developed linear model by using 50 mangoes of evaluate set are given in Table 2. The mean absolute percentage error of estimating a mango weight using the linear model was 3.76% (approximately 3.8 g for 100 g mango). Thus, weight of mango can be estimated with a high degree of accuracy by image processing and analysis techniques.
ConclusionMeasurements of the weight of Chokanan mangoes can be accomplished using the image processing and analysis techniques. The results showed that image filtering and image thresholding are providing a simple and effective means smoothing and segmenting the mango image. Mango pixels
189
C.C. Teoh and A.R. Mohd Syaifudin
counted from thresholded image have high relationship with weight of mango. The correlation coefficient (r2) value is 0.9769. The mean absolute percentage error of estimating a mango weight using the linear model was 3.76%. The present work has achieved the first phase of using image processing and analysis technique to determine weight of Chokanan mangoes. It is recommended that further research to develop a machine vision system that utilizes the above developed linear model for grading size of mangoes automatically be given emphasis.
ReferencesAleixos, N., Blasco, J., Navarrón, F. and Moltó,
E. (2002). Multispectral inspection of citrus in real-time using machine vision and digital signal. Computers and electronics in agriculture 33: 131–7
Gerrard, D.E., Goa, X. and Tan, J. (1996). Beef marbling and colour score determination by image processing. Journal of Food Science 61: 145–8
Kanali, C., Murase, H. and Honami, N. (1998). Three-dimensional shape recognition using a charge-simulation method to process features. Journal of Agricultural Engineering Research 70: 195–208
Kondo, N. (1995). Quality evaluation of orange fruit using neural network. Food Processing Automation IV Proceedinds of the FPAC conference. Michigan: ASAE
Krutz, G.W., Gibson, H.G., Cassens, D.L. and Zhang, M. (2000). Colour vision in forest and wood engineering. Landwards 55: 2–9
Leemans, V., Magein, H. and Destain, M.F. (1998). Defects segmentation on ‘Golden Delicious’ apples by using colour machine vision. Computers and Electronics in Agriculture 20: 117–30
Locht, P., Thomsen, K. and Mikkelsen, P. (1997). Full color image analysis as a tool for quality control and process development in the food industry. (ASAE. Paper No. 973006). Michigan: ASAE
Nagata, M., Cao, Q., Bato, P.M., Shrestha, B.P. and Kinoshita, O. (1997). Basic study on strawberry sorting system in Japan. (ASAE Annual International Meeting Technical Papers. Paper No. 973095). Michigan: ASAE
Okamura, N.K., Delwiche, M.J. and Thompson, J.F. (1991). Raisin grading by machine vision. (ASAE Paper No. 91–7011). Michigan: ASAE
Sarkar, N. and Wolfe, R.R. (1985). Feature extraction techniques for sorting tomatoes by computer vision. Transactions of the ASAE 28: 970–4
Sun, D.W. (2000). Inspection pizza topping percentage and distribution by a computer vision method. Journal of Food Engineering 44: 245–9
Toa, Y., Heinemann, P.H., Varghese, Z., Morrow, C.T. and Sommer, H.J. (1995). Machine vision for colour inspection of patotoes and apples. Transactions of the ASAE 38(3): 1555–61
Toa, Y., Morrow, C.T., Heinemann, P.H. and Sommer, J.H. (1990). Automated machine vision inspection of potatoes. (ASAE Paper No. 90–3531). Michigan: ASAE
Varghese, Z., Morrow, C.T., Heinemann, P.H., Sommer, J.H., Tao, Y. and Crasswell, R.M. (1991). Automated inspection of ‘Golden Delicious’ apples using colour computer vision. (ASAE Paper No. 91–7002). Michigan: ASAE
190
Techniques for estimating weight of mangoes
AbstrakSaiz adalah salah satu parameter penting yang dikenal pasti oleh pengguna untuk menentukan kualiti mangga. Menurut Lembaga Pemasaran Pertanian Persekutuan (FAMA) Malaysia, saiz mangga ditentukan oleh berat. Kajian telah dijalankan tentang pengukuran saiz mangga Chokanan dengan menggunakan kaedah pemprosesan imej dan analisis imej. Pengisian komputer PCI digunakan untuk memproses dan menganalisis imej mangga yang diterima dari sistem perolehan imej. Selepas pemprosesan dan analisis imej, jumlah piksel bahagian mangga di dalam imej mangga dikira oleh perisian. Hubungan antara piksel mangga dengan berat mangga dianalisis dengan menggunakan kaedah statistik regresi. Hasil analisis statistik menunjukkan bahawa piksel mangga yang dikira oleh perisian mempunyai hubungan yang amat rapat dengan berat mangga dengan nilai pekali korelasi 0.9769. Model linear yang dihasilkan daripada analisis regresi linear dinilai oleh satu set sampel yang mempunyai 50 biji mangga berdasarkan ketepatan penganggaran berat mangga. Keputusan penilaian menunjukkan bahawa, peratus ralat purata mutlak dalam menganggarkan berat sebiji mangga dengan menggunakan model linear itu ialah 3.76%. Oleh itu, teknik pemprosesan dan analisis imej didapati praktikal, boleh dipercayai dan berkesan dalam penganggaran berat mangga Chokanan.
Accepted for publication on 29 March 2006