the use of worldview-2 satellite data in urban tree ...journalarticle.ukm.my/9974/1/03 razieh...
TRANSCRIPT
Sains Malaysiana 45(7)(2016): 1025–1034
The Use of WorldView-2 Satellite Data in Urban Tree Species Mapping by Object-Based Image Analysis Technique
(Penggunaan Data Satelit WorldView-2 bagi Pemetaan Spesies Pokok Bandar menggunakan Teknik Analisis Imej berasaskan Objek)
RAZIEH SHOJANOORI, HELMI Z.M. SHAFRI*, SHATTRI MANSOR & MOHD HASMADI ISMAIL
ABSTRACT
The growth of residential and commercial areas threatens vegetation and ecosystems. Thus, an urgent urban management issue involves determining the state and the quantity of urban tree species to protect the environment, as well as controlling their growth and decline. This study focused on the detection of urban tree species by considering three types of tree species, namely, Mesua ferrea L., Samanea saman, and Casuarina sumatrana. New rule sets were developed to detect these three species. In this regard, two pixel-based classification methods were applied and compared; namely, the method of maximum likelihood classification and support vector machines. These methods were then compared with object-based image analysis (OBIA) classification. OBIA was used to develop rule sets by extracting spatial, spectral, textural and color attributes, among others. Finally, the new rule sets were implemented into WorldView-2 imagery. The results indicated that the OBIA based on the rule sets displayed a significant potential to detect different tree species with high accuracy.
Keywords: Object-based classification; pixel-based classification; urban tree species; WorldView-2
ABSTRAK
Pembangunan kawasan penempatan dan komersial mengancam tumbuhan dan ekosistem. Maka isu pengurusan bandar termasuk mengenal pasti keadaan dan kuantiti spesies pokok bandar untuk melindungi alam sekitar dan juga mengawal pertumbuhan serta kemerosotan mereka perlu dijalankan dengan segera. Kajian ini memfokuskan kepada pengesanan spesies pokok bandar dengan mengambil kira tiga spesies yang dikenali sebagai Mesua ferrea L., Samanea saman dan Casuarina sumatrana. Set peraturan baharu dibangunkan untuk mengesan tiga spesies ini. Dengan ini, dua teknik pengelasan berasaskan piksel diaplikasi dan dibandingkan menggunakan teknik kebolehjadian maksimum dan mesin penyokong vektor. Teknik ini kemudian dibandingkan dengan pengelasan analisis imej berasakan objek (OBIA). Teknik OBIA kemudian digunakan untuk membangunkan set peraturan dengan mengekstrak ciri reruang, spektrum, tekstur dan warna serta lain-lain yang berkaitan. Akhirnya set peraturan baharu diguna pakai kepada imej WorldView-2. Hasilnya menunjukkan teknik OBIA berasaskan set peraturan yang baharu tersebut menunjukkan potensi yang signifikan untuk mengesan spesies pokok dengan ketepatan yang tinggi.
Kata kunci: Pengelasan berasaskan objek; pengelasan berasaskan piksel; spesies pokok bandar; WorldView-2
INTRODUCTION
Urban vegetation management has become an important issue because of rapid urban development. Rapid urbanization has prompted people to control urban green spaces for ecological purposes (Kong & Nakagoshi 2005; Li et al. 2010). The effects and benefits of urban trees include cleaning the air, reducing sound pollution (Nowak & Dwyer 2007), preventing soil erosion, absorbing water, wind breaking, providing shade to homes and cooling the environment (Conine et al. 2004; Gobster & Westphal 2004; Huang et al. 2007; Kong et al. 2007; Ma & Ju 2011; Yuan & Bauer 2007). Accurate and reliable information of different tree species is crucial to urban vegetation studies. This information assists urban planners and researchers in urban planning and disaster management (Gong et al. 2013; Hao et al. 2011; Iovan et al. 2008). In tropical areas,
common issues involve controlling the wind, cooling the environment, and increasing energy savings. Messua ferrea L., Samanea saman and Casuarina sumatrana are among the commonly planted tree species in urban tropical areas such as Malaysia (Chonglu et al. 2010; Forest Research Institute Malaysia 2014). These trees can increase energy efficiency and limit the damage to properties by windbreak. Specifically, the M. ferrea species can lower thermal radiation by approximately 92.55% through reflection and absorption (Shahidan et al. 2010). Akamphon (2014) compared six common tree species in Thailand including Samanea saman, Mango, Jackfruit, Mahogany, White Cheesewood and Indian Cork tree. The result of the comparison demonstrates that S. saman has the highest energy saving property during the past 40 years (Akamphon 2014). The C. sumatrana species is among the most typhoon- and tsunami-resistant trees
1026
(Chonglu et al. 2010); thus, it is the best method of wind breaking to protect properties in urban areas. Therefore, the aforementioned tree species are important to the urban environment in tropical areas.Urban spaces are complex areas and accessibility to all trees by field survey is not possible due to private properties and is time-consuming. At present, remote sensing can overcome these limitations. It can be used to obtain highly accurate information by monitoring and managing urban areas and vegetation (Ardila et al. 2012). Given the spectral similarity between different tree species, hyperspectral data can discriminate urban tree species appropriately because of characteristics such as narrow-band, multi-channel and inclusion of continuous spectrum information. Several studies have investigated urban tree detection using hyperspectral data (Adeline et al. 2013; Cho et al. 2012; Forzieri et al. 2013; Hao et al. 2011; Wania & Weber 2007; Zhang & Qiu 2012). However, these data have several drawbacks, including limited coverage, high volume and high cost (Shafri et al. 2012). Studies conducted with high-resolution satellite imageries, such as IKONOS and QuickBird, also extract tree species effectively (Hájek 2006; Ke & Quackenbush 2007; Mora et al. 2010; Puissant et al. 2014; Sugumaran et al. 2003; Voss & Sugumaran 2008). Nonetheless, tree detection and information extraction from urban areas were difficult when traditional pixel-based image classification methods were used. This classification leads to low classification accuracy due to high spectral variability within land cover classes that were affected by sun angle, gaps in tree canopies and shadows (Johnson & Xie 2013; Yu et al. 2006). In order to overcome the aforementioned limitations, object-based image analysis (OBIA) approaches can be used to improve classification accuracy (Li et al. 2010; Lobo 1997; Puissant et al. 2014; Shouse et al. 2013). Several studies have been conducted to detect tree species; however, the lack of rule sets for conducting this detection process in urban areas remains a major setback. Thus, the present study attempts to develop new rule sets to extract three tree species, namely, M. ferrea, S. saman, and C. sumatrana. Moreover, WorldView-2 (WV2) imagery was used because of the potential of new bands with high spatial resolution to detect vegetation (Immitzer et al. 2012; Latif et al. 2012; Marshall et al. 2012; Nouri et al. 2014; Pu & Landry 2012; Rapinel et al. 2014).
MATERIALS AND METHODS
STUDY AREA
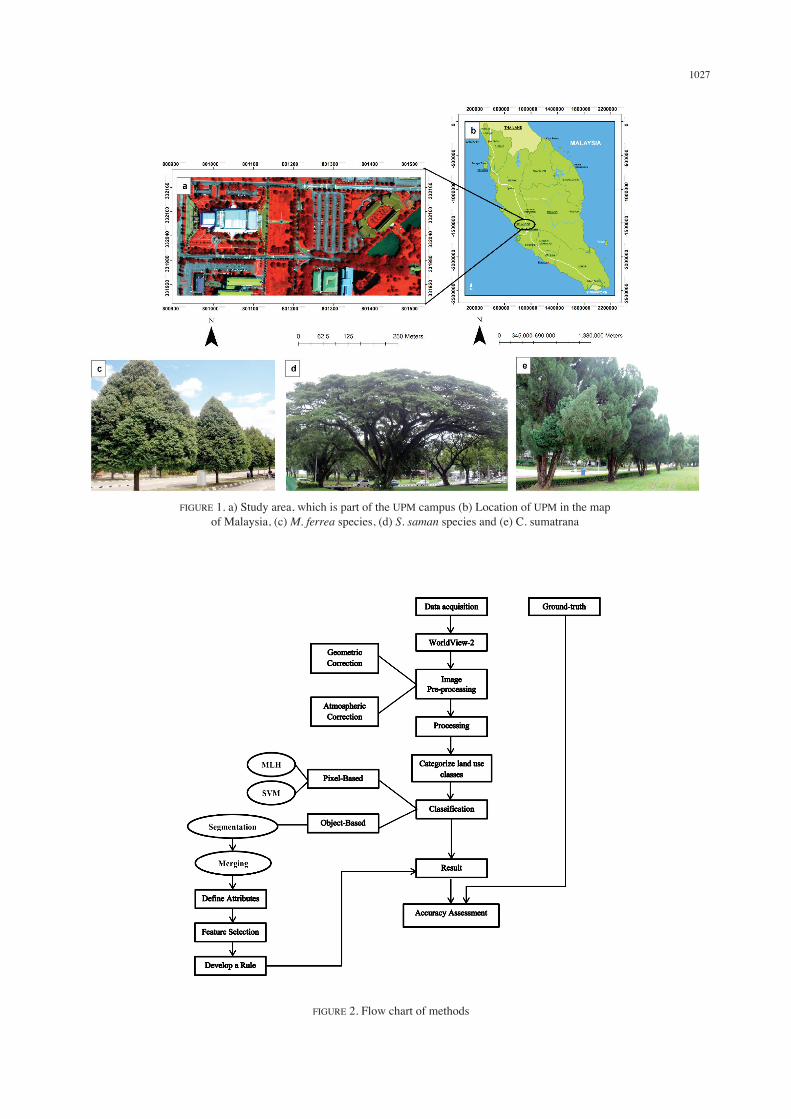
The study area is part of the Universiti Putra Malaysia (UPM) campus, which is located in Serdang, Selangor, Malaysia (Lat. 03° N, Long. 101° E) (Figure 1). The area contains different species of trees. This study considered three species (M. ferrea, S. saman and C. sumatrana) that significantly benefit the urban environment and temperature, thus resulting in high energy savings (Akamphon 2014; Shahidan et al. 2010).
WV2 IMAGERY
WV2 satellite imagery was acquired in March 2009. Unlike other commercial satellites, the WV2 satellite displays high spatial resolution (0.5 m for the panchromatic band and 2 m for multispectral bands) with eight spectral bands and four new bands. Standard bands are blue (0.45-0.51 μm), green (0.51-0.58 μm), and red (0.63-0.69 μm). The near-infrared 1 band is in the range of 0.77-0.90 μm. The four new bands are coastal (0.40-0.45 μm), yellow (0.59-0.63 μm), red edge (0.71-0.75 μm) and near- infrared 2 (NIR2) (0.86-1.04 μm). The potentially high spatial and spectral resolution of WV-2 imagery facilitates the classification and discrimination of different types of urban tree species.
WORK FLOW
The work flow chart of this study is shown in Figure 2. The materials and methods are explained in the following sections.
PREPROCESSING
The WV-2 image was subjected to atmospheric and geometric corrections before processing and classifications. For this purpose ENVI 4.7 remote sensing software was used. The WV-2 dataset was geometrically corrected using Universal Transverse Mercator projection at zone 47N and with a WGS 84 datum. Then in order to conduct an atmospheric correction, the QUick Atmospheric Correction (QUAC) extension was employed to convert radiance to reflectance. QUAC is a very fast, practical atmospheric correction code for multispectral imagery.
PROCESSING
Spectral-based classification The literature on the different classifications in urban areas suggests that maximum likelihood classification (ML) and support vector machines (SVMs) are the most common classification methods used to detect tree species (Forzieri et al. 2013; Iovan et al. 2014, 2008; Tigges et al. 2013). ML is a parametric classifier that can classify unknown pixels based on the probability threshold. Thus, each pixel is allocated to the class with the maximum probability. SVM is a non-parametric classifier that separates classes based on the decision surface, which is called an optimal hyperplane. The SVM classifier is suitable when the training samples were limited. Hence, the ML and SVM classification methods, which use radial basis function (RBF) as a kernel, were applied in this research. Cross-validation using the grid-search method was used to determine the optimal parameters of the RBF kernel (C and γ) through SVM classification. The cross-validation defines the optimal parameters as C = 1000 and γ = 0.0625. The aforementioned optimal parameters were employed in this study for SVM classification. In both classifications, land cover was classified into nine classes in both classifications as follows: S. saman, M. ferrea, C. sumatrana, grass, other trees, water, man-made, road and shadow.
1027
FIGURE 1. a) Study area, which is part of the UPM campus (b) Location of UPM in the map of Malaysia, (c) M. ferrea species, (d) S. saman species and (e) C. sumatrana
FIGURE 2. Flow chart of methods
1028
Object-based classification The OBIA method employs spectral and spatial information simultaneously (Zhou 2013). This method can increase the amount of information regarding the object in the classification, such as color, texture and compactness. This method can also reduce the number of units to be classified (Youjing & Hengtong 2007). The foundation of object-based classification is segmentation and merging.
Image segmentation and merging In this study, the feature extraction module in Envi Ex software was used for image segmentation, merging and developing rule sets. The OBIA method is based on image segmentation techniques that divide the image into spatially continuous and homogeneous regions (Flanders 2003) and limit local spectral variation (Lobo 1997; Li et al. 2010). This technique can combine the information on color, shape and space with contextual analysis to detect vegetation. The algorithm in image segmentation is based on homogeneity descriptions and object borders were extracted on such basis (Li et al. 2010). Small segments can merge into larger segments. The segment scale in this research is 20 for the M. ferrea, S. saman and C. sumatrana species. The merging level is 85 for M. ferrea and S. saman, whereas that for C. sumatrana is 65.
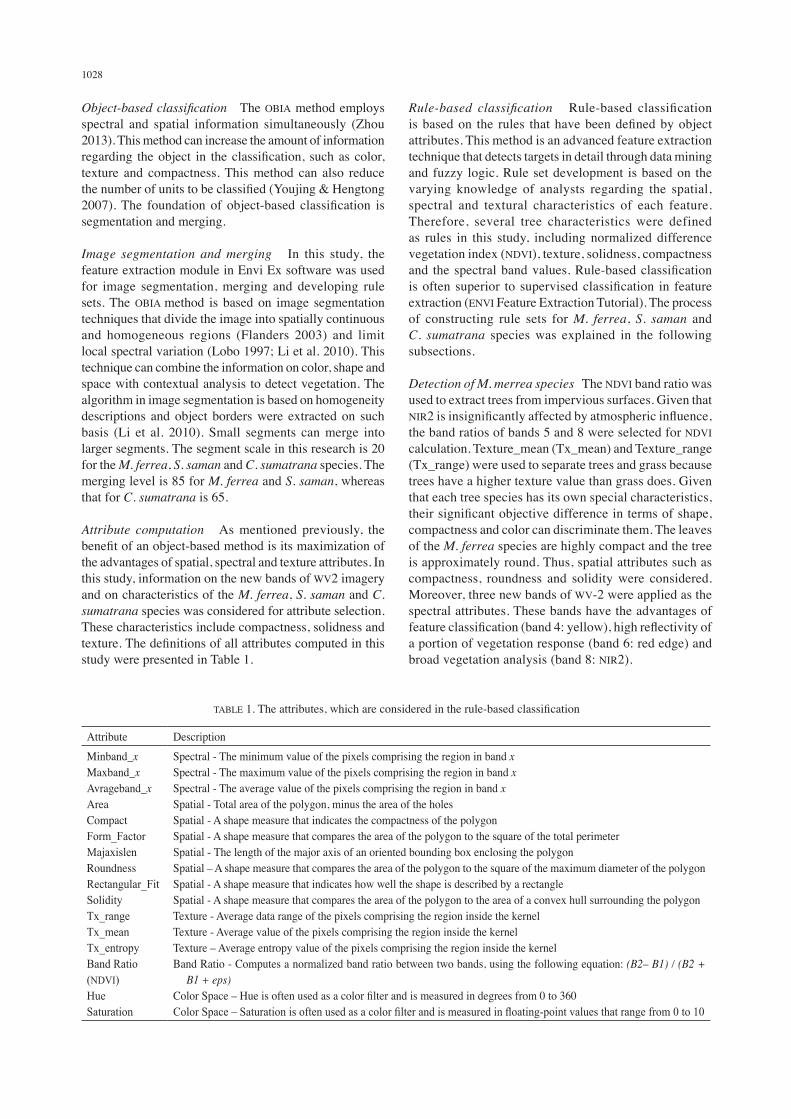
Attribute computation As mentioned previously, the benefit of an object-based method is its maximization of the advantages of spatial, spectral and texture attributes. In this study, information on the new bands of WV2 imagery and on characteristics of the M. ferrea, S. saman and C. sumatrana species was considered for attribute selection. These characteristics include compactness, solidness and texture. The definitions of all attributes computed in this study were presented in Table 1.
Rule-based classification Rule-based classification is based on the rules that have been defined by object attributes. This method is an advanced feature extraction technique that detects targets in detail through data mining and fuzzy logic. Rule set development is based on the varying knowledge of analysts regarding the spatial, spectral and textural characteristics of each feature. Therefore, several tree characteristics were defined as rules in this study, including normalized difference vegetation index (NDVI), texture, solidness, compactness and the spectral band values. Rule-based classification is often superior to supervised classification in feature extraction (ENVI Feature Extraction Tutorial). The process of constructing rule sets for M. ferrea, S. saman and C. sumatrana species was explained in the following subsections.
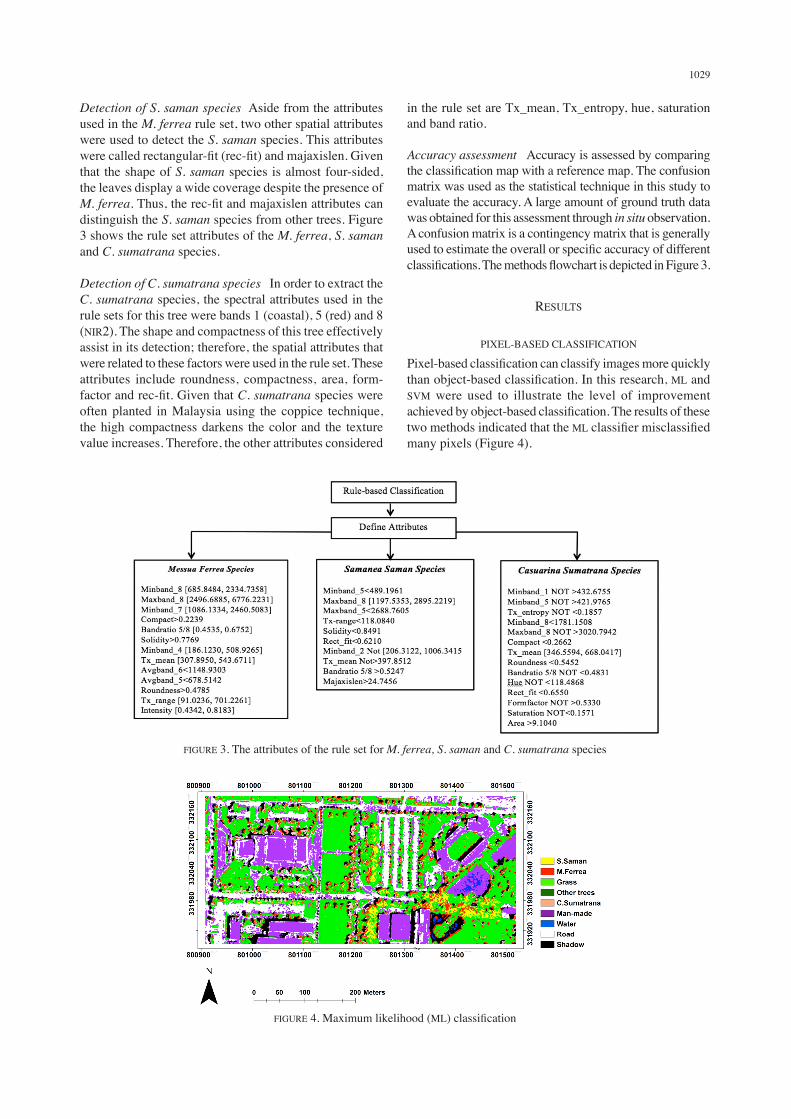
Detection of M. merrea species The NDVI band ratio was used to extract trees from impervious surfaces. Given that NIR2 is insignificantly affected by atmospheric influence, the band ratios of bands 5 and 8 were selected for NDVI calculation. Texture_mean (Tx_mean) and Texture_range (Tx_range) were used to separate trees and grass because trees have a higher texture value than grass does. Given that each tree species has its own special characteristics, their significant objective difference in terms of shape, compactness and color can discriminate them. The leaves of the M. ferrea species are highly compact and the tree is approximately round. Thus, spatial attributes such as compactness, roundness and solidity were considered. Moreover, three new bands of WV-2 were applied as the spectral attributes. These bands have the advantages of feature classification (band 4: yellow), high reflectivity of a portion of vegetation response (band 6: red edge) and broad vegetation analysis (band 8: NIR2).
TABLE 1. The attributes, which are considered in the rule-based classification
Attribute DescriptionMinband_xMaxband_xAvrageband_xAreaCompact Form_FactorMajaxislenRoundnessRectangular_FitSolidityTx_rangeTx_meanTx_entropyBand Ratio (NDVI)HueSaturation
Spectral - The minimum value of the pixels comprising the region in band xSpectral - The maximum value of the pixels comprising the region in band xSpectral - The average value of the pixels comprising the region in band xSpatial - Total area of the polygon, minus the area of the holesSpatial - A shape measure that indicates the compactness of the polygonSpatial - A shape measure that compares the area of the polygon to the square of the total perimeterSpatial - The length of the major axis of an oriented bounding box enclosing the polygonSpatial – A shape measure that compares the area of the polygon to the square of the maximum diameter of the polygonSpatial - A shape measure that indicates how well the shape is described by a rectangleSpatial - A shape measure that compares the area of the polygon to the area of a convex hull surrounding the polygonTexture - Average data range of the pixels comprising the region inside the kernelTexture - Average value of the pixels comprising the region inside the kernelTexture – Average entropy value of the pixels comprising the region inside the kernelBand Ratio - Computes a normalized band ratio between two bands, using the following equation: (B2– B1) / (B2 +
B1 + eps)Color Space – Hue is often used as a color filter and is measured in degrees from 0 to 360Color Space – Saturation is often used as a color filter and is measured in floating-point values that range from 0 to 10
1029
Detection of S. saman species Aside from the attributes used in the M. ferrea rule set, two other spatial attributes were used to detect the S. saman species. This attributes were called rectangular-fit (rec-fit) and majaxislen. Given that the shape of S. saman species is almost four-sided, the leaves display a wide coverage despite the presence of M. ferrea. Thus, the rec-fit and majaxislen attributes can distinguish the S. saman species from other trees. Figure 3 shows the rule set attributes of the M. ferrea, S. saman and C. sumatrana species.
Detection of C. sumatrana species In order to extract the C. sumatrana species, the spectral attributes used in the rule sets for this tree were bands 1 (coastal), 5 (red) and 8 (NIR2). The shape and compactness of this tree effectively assist in its detection; therefore, the spatial attributes that were related to these factors were used in the rule set. These attributes include roundness, compactness, area, form-factor and rec-fit. Given that C. sumatrana species were often planted in Malaysia using the coppice technique, the high compactness darkens the color and the texture value increases. Therefore, the other attributes considered
in the rule set are Tx_mean, Tx_entropy, hue, saturation and band ratio.
Accuracy assessment Accuracy is assessed by comparing the classification map with a reference map. The confusion matrix was used as the statistical technique in this study to evaluate the accuracy. A large amount of ground truth data was obtained for this assessment through in situ observation. A confusion matrix is a contingency matrix that is generally used to estimate the overall or specific accuracy of different classifications. The methods flowchart is depicted in Figure 3.
RESULTS
PIXEL-BASED CLASSIFICATION
Pixel-based classification can classify images more quickly than object-based classification. In this research, ML and SVM were used to illustrate the level of improvement achieved by object-based classification. The results of these two methods indicated that the ML classifier misclassified many pixels (Figure 4).
FIGURE 3. The attributes of the rule set for M. ferrea, S. saman and C. sumatrana species
FIGURE 4. Maximum likelihood (ML) classification
1030
TABLE 2. Maximum likelihood (ML) classification accuracy
Vegetation Prod. Acc. (%) User Acc. (%)M. ferreaS. samanC. sumatranaGrassOther treesMan-madeRoadShadowWaterOverall accuracyKappa coefficient
56.7748.7841.1374.6478.5493.1491.5287.6239.29
62.07% 0.54
48.5397.9428.4399.3617.0275.4393.1468.16100.00
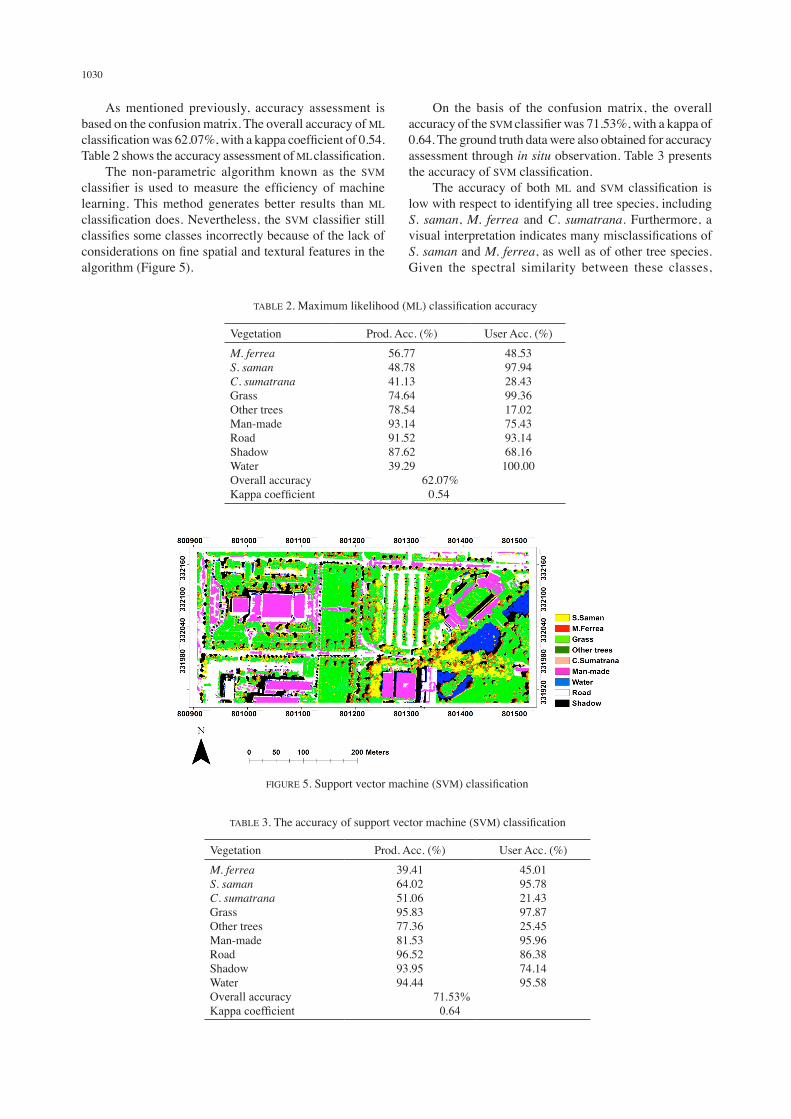
FIGURE 5. Support vector machine (SVM) classification
TABLE 3. The accuracy of support vector machine (SVM) classification
Vegetation Prod. Acc. (%) User Acc. (%)M. ferreaS. samanC. sumatranaGrassOther treesMan-madeRoadShadowWaterOverall accuracyKappa coefficient
39.4164.0251.0695.8377.3681.5396.5293.9594.44
71.53% 0.64
45.0195.7821.4397.8725.4595.9686.3874.1495.58
As mentioned previously, accuracy assessment is based on the confusion matrix. The overall accuracy of ML classification was 62.07%, with a kappa coefficient of 0.54. Table 2 shows the accuracy assessment of ML classification. The non-parametric algorithm known as the SVM classifier is used to measure the efficiency of machine learning. This method generates better results than ML classification does. Nevertheless, the SVM classifier still classifies some classes incorrectly because of the lack of considerations on fine spatial and textural features in the algorithm (Figure 5).
On the basis of the confusion matrix, the overall accuracy of the SVM classifier was 71.53%, with a kappa of 0.64. The ground truth data were also obtained for accuracy assessment through in situ observation. Table 3 presents the accuracy of SVM classification. The accuracy of both ML and SVM classification is low with respect to identifying all tree species, including S. saman, M. ferrea and C. sumatrana. Furthermore, a visual interpretation indicates many misclassifications of S. saman and M. ferrea, as well as of other tree species. Given the spectral similarity between these classes,
1031
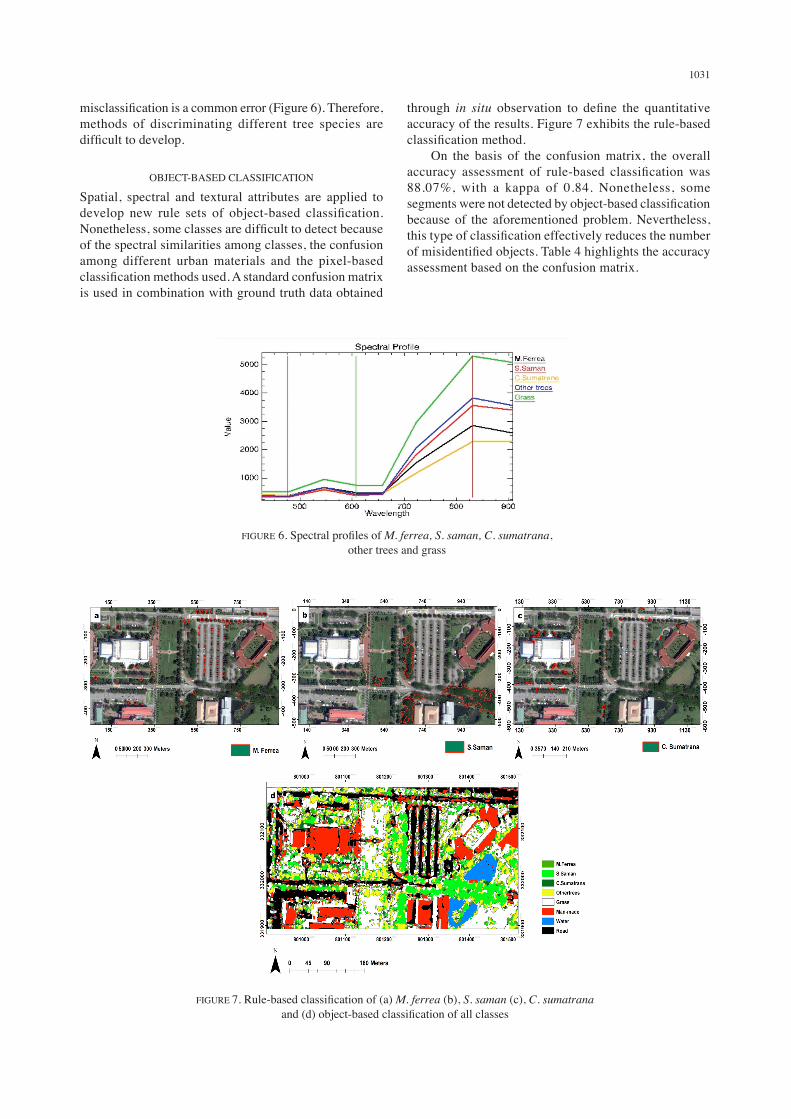
misclassification is a common error (Figure 6). Therefore, methods of discriminating different tree species are difficult to develop.
OBJECT-BASED CLASSIFICATION
Spatial, spectral and textural attributes are applied to develop new rule sets of object-based classification. Nonetheless, some classes are difficult to detect because of the spectral similarities among classes, the confusion among different urban materials and the pixel-based classification methods used. A standard confusion matrix is used in combination with ground truth data obtained
through in situ observation to define the quantitative accuracy of the results. Figure 7 exhibits the rule-based classification method. On the basis of the confusion matrix, the overall accuracy assessment of rule-based classification was 88.07%, with a kappa of 0.84. Nonetheless, some segments were not detected by object-based classification because of the aforementioned problem. Nevertheless, this type of classification effectively reduces the number of misidentified objects. Table 4 highlights the accuracy assessment based on the confusion matrix.
FIGURE 7. Rule-based classification of (a) M. ferrea (b), S. saman (c), C. sumatrana and (d) object-based classification of all classes
FIGURE 6. Spectral profiles of M. ferrea, S. saman, C. sumatrana, other trees and grass
1032
DISCUSSION
In this study, ML and SVM pixel-based classification were conducted with low-accuracy results. The pixel-based SVM performed better than the ML classifier because of the limitation of the latter in terms of extracting the spectral characteristics of each pixel. Given the weak spectral capability of these methods to separate impervious and pervious surfaces, detailed urban mapping was difficult to produce. The overall accuracy of pixel-based analysis increased from 62.07 to 71.53% (up to 9.46%) with SVM classification. Thus, SVM may be superior to the ML classifier when the spectral similarity of urban targets is high. Moreover, several factors result in the misclassification of classified images, including spectral similarities, the incapability of such classifiers to handle the richness of textural, spatial and spectral information and the high-level spatial heterogeneity in urban areas. The primary objective of this research was to study and to illustrate the capability of object-based classification to classify images from high-resolution WV-2 imagery. The secondary goal was to develop new rule sets for discriminating tree species, which was a major gap in previous urban studies. To this end, information on various spectral, spatial, band ratio and textural attributes was used. The high spatial resolution of WV-2 imagery provides high-level spatial heterogeneity from natural surfaces. The spectral diversity of the land cover classes was also highlighted in terms of the increased spectral resolution in this type of imagery. New bands in WV-2 imagery facilitated the discrimination of different tree species. Segmentation and merging in object-based classification are important steps in generating image objects and computing attributes. The selection of low segmentation and high merging scales assisted in the detection of the boundaries and shapes of different tree species. Similar adjacent segments were also combined to overcome over-segmentation. Therefore, spatial, textural and color attributes helped improve the classification of tree species. The utilization of object-based classification in WV-2 improved the classification of the WV-2 images
by up to 16.54%. Moreover, the overall accuracy of this classification was significantly higher than that of pixel-based classification. The accuracy of M. ferrea, S. saman and C. sumatrana species detection was also considerably high. As a final point, similar to the earlier research (Puissant et al. 2014), OBIA can generate good classification related to urban tree mapping. Therefore, in this study OBIA performed very well for urban tree mapping and new rule sets were developed for discriminating urban tree species which has not been done in previous studies.
CONCLUSION
In this research, we presented new rule sets based on object-based classification to highlight the efficiency of the proposed method in detecting different tree species. The proposed object-based rule sets can extract three types of tree species, namely, M. ferrea, S. saman and C. sumatrana. These trees save much energy (M. ferrea and S. saman) and act as effective windbreakers (C. sumatrana) in urban areas, especially in tropical regions. This paper presents two pixel-based methods, namely, ML and SVM and compared them to the object-based approach. The object-based method displayed a higher accuracy than ML and SVM did at approximately 88.07%. The developed rule sets use the spatial, spectral and textural information of different tree species. Nonetheless, the accuracy of object-based classification is highly dependent on segmentation; thus, a new scale must be adjusted for the segmentation step. Future studies can improve the rule sets to develop a generic rule based on the object-based classification of WV2 images and to discriminate more urban tree species. This approach can be applied to different urban area images.
ACKNOWLEDGEMENTS
The authors would like to thank the Ministry of Education (MOE) Malaysia and Universiti Putra Malaysia (UPM) for providing research grant through Fundamental Research Grant Scheme (FRGS) and Research University Grant Scheme (RUGS). The comments from anonymous reviewers in improving this manuscript were also highly appreciated.
TABLE 4. The accuracy of object-based classification
Vegetation Prod. Acc. (%) User Acc. (%)M. ferreaS. samanC. sumatranaGrassOther treesMan-madeRoadShadowWaterOverall accuracyKappa coefficient
71.9286.9773.0592.3083.7398.9497.1784.2598.81
88.07% 0.84
83.4496.8075.0095.6752.4495.9197.6071.31100.00
1033
REFERENCES
Adeline, K.R.M., Briottet, X., Paparoditis, N. & Gastellu-Etchegorry, J.P. 2013. Material reflectance retrieval in urban tree shadows with physics-based empirical atmospheric correction. IEEE Urban Remote Sensing Event (JURSE), São Paulo, Brazil, April 21-23.
Akamphon, S. & Akamphon, K. 2014. Cost and benefit tradeoffs in using a shade tree for residential building energy saving. Thai Society of Higher Education Institutes on the Environment (TSHE) 7: 19-24.
Ardila, J., Bijker, W., Tolpekin, V. & Stein, A., 2012. Gaussian localized active contours for multitemporal analysis of urban tree crowns. IEEE International Geoscience and Remote Sensing Symposium. pp. 6971-6974.
Cho, M.A., Mathieu, R., Asner, G.P., Naidoo, L., Aardt, J.V., Ramoelo, A., Debba, P., Wessels, K., Main, R., Smit, I.P.J. & Erasmus, B. 2012. Mapping tree species composition in South African savannas using an integrated airborne spectral and LiDAR system. Remote Sens. Environ. 125: 214-226.
Chonglu, Z., Yong, Z., Yu, C., Zhen, C., Qingbin, J., Pinyopusarerk, K. & Franche, C. 2010. Potential Casuarina species and suitable techniques for the GGW. In Le projetmajeurafricain de la Grande MurailleVerte: Concepts etmiseenœuvre. IRD Éditions, edited by Dia, A. & Duponnois, R. http://books.openedition.org/irdeditions/2123.
Conine, A., Xiang, W.N., Young, J. & Whitley, D. 2004. Planning for multi-purpose greenways in Concord, North Carolina. Landscape Urban Plan. 68: 271-287.
Flanders, D., Hall-Beyer, M. & Perverzoff, J. 2003. Preliminary evaluation of eCognition object based software for cut block delineation and feature extraction. Canadian Journal of Remote Sensing 29(4): 441-452.
Forest Research Institute Malaysia. 2014. http://www.frim.gov.my/attractions/colours-of-frim/.
Forzieri, G., Tanteri, L., Moser, G. & Catani, F. 2013. Mapping natural and urban environments using airborne multi-sensor ADS40–MIVIS–LiDAR synergies. Int. J. Appl. Earth ObsGeoinf. 23: 313-323.
Gong, C., Yu, S., Joesting, H. & Chen, J., 2013. Determining socioeconomic drivers of urban forest fragmentation with historical remote sensing images. Landscape and Urban Planning 117: 57-65.
Gobster, P.H. & Westphal, L.M. 2004. The human dimensions of urban greenways: planning for recreation and related experiences. Landscape Urban Plan. 68: 147-165.
Hájek, F. 2006. Object-oriented classification of Ikonos satellite data for the identification of tree species composition. Journal of Forest Science 52(4): 181-187.
Hao, Z., Heng-Jia, S. & Bo-Chun, Y. 2011. Application of hyper spectral remote sensing for urban forestry monitoring in natural disaster zones. IEEE International Conference on Computer and Management (CAMAN). pp. 1-4.
Huang, C., Shao, Y., Chen, J., Liu, J., Chen, J. & Li, J. 2007. A strategy for analyzing urban forest using landsat ETM+ Imagery. IEEE International Geoscience and Remote Sensing Symposium. pp. 1990-1993.
Immitzer, M., Atzberger, C. & Koukal, T. 2012. Tree species classification with random forest using very high spatial resolution 8-band WorldView-2 satellite data. Remote Sens. 4: 2661-2693.
Iovan, C., Cournede, P.H., Guyard, T., Bayol, B., Boldo, D. & Cord, M. 2014. Model-based analysis–synthesis for realistic
tree reconstruction and growth simulation. IEEE Trans Geosci. Remote Sens. 52: 1438-1450.
Iovan, C., Boldo, D. & Cord, M. 2008. Detection, characterization, and modeling vegetation in urban areas from high-resolution aerial imagery. IEEE Journal of Selected Topics in Applied Earth Observations and Remote Sensing 1(3): 206-213.
Johnson, B. & Xie, Z. 2013. Classifying a high resolution image of an urban area using super-object information. ISPRS Journal of Photogrammetry and Remote Sensing 83: 40-49.
Ke, Y. & Quackenbush, L.J. 2007. Forest species classification and tree crown delineation using QuickBird imagery. In Proceedings of the AS- PRS Annual Conference, May 7-11; Tampa (FL). American Society for Photogrammetry and Remote Sensing, edited by Bethesda, M.
Kong, F., Yin, H. & Nakagoshi, N. 2007. Using GIS and landscape metrics in the hedonic price modeling of the amenity value of urban green space: A case study in Jinan City, China. Landscape and Urban Planning 79: 240-252.
Kong, F. & Nakagoshi, N. 2005. Changes of urban green spaces and their driving forces: a case study of Jinan City, China. Journal of International Development and Cooperation 11(2): 97-109.
Latif, Z.A., Zamri, I. & Omar, H. 2012. Determination of trees species using WorldView-2 data. IEEE 8th Int. Conf. on Signal Process Appl. and Technol. (ICSPAT). pp. 383-387.
Li, C., Yin, J. & Zhao, J. 2010. Extraction of urban vegetation from high resolution remote sensing image. International Conference on Computer Design and Applications (ICCDA) 4: 403-406.
Lobo, A. 1997. Image segmentation and discriminant analysis for the identification of land cover units in ecology. IEEE Trans Geosci. Remote Sens. 35: 1136-1145.
Ma, J., Ju, W., 2011. Mapping Leaf Area Index for the Urban Area of Nanjing City, China Using IKONOS Remote Sensing Data. IEEE, 978-1-61284-848-8/11/$26.00.
Mora, B., Wulder, M.A. & White, J.C. 2010. Segment-constrained regression tree estimation of forest stand height from very high spatial resolution panchromatic imagery over a boreal environment. Remote Sensing of Environment 114(11): 2474-2484.
Marshall, V., Lewis, M. & Ostendorf, B. 2012. Do additional bands (coastal, NIR-2, red-edge and yellow) in WorldView-2 multispectral imagery improve discrimination of an Invasive Tussock, Buffel Grass (Cenchrus Ciliaris). International Archives of the Photogrammetry, Remote Sensing and Spatial Information Sciences Vol XXXIX-B8.
Nouri, H., Beecham, S., Anderson, S. & Nagler, P. 2014. High spatial resolution WorldView-2 imagery for mapping NDVI and its relationship to temporal urban landscape evapotranspiration factors. Journal of Remote Sensing 6: 580-602.
Nowak, D.J. & Dwyer, J.F. 2007. Understanding the benefits and costs of urban forest ecosystems. In Urban and Community Forestry in the Northeast. 2nd ed, edited by Kuser, J.E. Netherland: Springer. pp. 25-46.
Pu, R. & Landry, S. 2012. A comparative analysis of high spatial resolution IKONOS and WorldView-2 imagery for mapping urban tree species. Remote Sensing of Environment 124: 516-533.
Puissant, A., Rougier, S. & Stumpf, A. 2014. Object-oriented mapping of urban trees using Random Forest classifiers. International Journal of Applied Earth Observation and Geoinformation 26: 235-245.
1034
Rapinal, S., Clement, B., Magnanon, S., Sellin, V. & Hubert-Moy, L. 2014. Identification and mapping of natural vegetation on a coastal site using a Worldview-2 satellite image. Journal of Environmental Management 144: 236-246.
Shafri, H.Z.M., Taherzadeh, E., Mansor, S. & Ashurov, R. 2012. Hyperspectral remote sensing of urban areas: an overview of techniques and applications. Research Journal of Applied Sciences, Engineering and Technology 4: 1557-1565.
Shahidan, M.F., Shariff, M.K.M., Jones, P., Salleh, E. & Abdullah, A.M. 2010. A comparison of Mesua ferrea L. and Hura crepitans L. for shade creation and radiation modification in improving thermal comfort. Landscape and Urban Planning 97: 168-181.
Shouse, M., Liang, L. & Fei, S. 2013. Identification of understory invasive exotic plants with remote sensing in urban forests. International Journal of Applied Earth Observation and Geoinformation 21: 525-534.
Sugumaran, R., Pavuluri, M.K. & Zerr, D. 2003. The use of high resolution imagery for identification of urban climax forest species using traditional and rule-based classification approach. IEEE Transactions on Geoscience and Remote Sensing 41(9): 1933-1939.
Tigges, J., Lakes, T. & Hostert, P. 2013. Urban vegetation classification: benefits of multitemporal RapidEye satellite data. Remote Sensing of Environment 136: 66-75.
Voss, M. & Sugumaran, R. 2008. Seasonal effect on tree species classification in an urban environment using hyperspectral data, LiDAR, and an object-oriented approach. Sensors 8: 3020-3036.
Wania, A. & Weber, C. 2007. Hyperspectral imagery and urban green observation. Urban Remote Sens Event (JURSE), Paris. pp. 1-8.
Youjing, Z. & Hengtong, R. 2007. Identification scales for urban vegetation classification using high spatial resolution satellite data. In IEEE International Geoscience and Remote Sensing Symposium, (IGARSS), Barcelona, Spain. pp. 1472-1475.
Yu, Q., Gong, P., Clinton, N., Biging, G., Kelly, M. & Schirokauer, D. 2006. Object-based detailed vegetation classification with airborne high spatial resolution remote sensing imagery. Photogrammetric Engineering and Remote Sensing 72: 799-811.
Yuan, F. & Bauer, M.E. 2007. Comparison of impervious surface area and normalized difference vegetation index as indicators of surface urban heat island effects in Landsat imagery. Remote Sensing of Environment 106: 375-386.
Zhang, C. & Qiu, F. 2012. Mapping individual tree species in an urban forest using airborne LiDAR data and hyperspectral imagery. Photogramm Eng Remote Sens. 78: 1079-1087.
Zhou, W. 2013. An object-based approach for urban land cover classification: Integrating LiDAR height and intensity data. IEEE Geoscience and Remote Sensing Letters 10(4): 928-931.
Razieh Shojanoori, Helmi Z.M. Shafri* & Shattri MansorDepartment of Civil Engineering and Geospatial Information Science Research Centre (GISRC)Faculty of EngineeringUniversiti Putra Malaysia 43400 Serdang, Selangor Darul EhsanMalaysia
Mohd Hasmadi IsmailForest Survey and Engineering LaboratoryFaculty of ForestryUniversiti Putra Malaysia43400 Serdang, Selangor Darul EhsanMalaysia
*Corresponding author; email: [email protected]
Received: 25 March 2015Accepted: 3 December 2015