the analysis of indoor air quality inside...
TRANSCRIPT
THE ANALYSIS OF INDOOR AIR QUALITY INSIDE THE KELANA JAYA
LIGHT RAIL TRANSIT TRAIN IN KUALA LUMPUR
HIDAYATULLAH BIN MASJUD
Tesis ini dikemukakan sebagai
memenuhi syarat penganugerahan
Ijazah Sarjana Sains Kejuruteraan Pengangkutan Rel
Pusat Pengajian Siswazah
Universiti Tun Hussein Onn Malaysia
JANUARI 2015
iv
ACKNOWLEDGMENT
In the name of Allah most gracious the most merciful. First and foremost, I would
like to convey my deepest appreciation to my supervisor Associate Prof. Dr. Mutalib
bin Leman for his openness to help me and gives guidance and comments in
completing my research work. Special appreciation goes to my Co-supervisor Mr.
Leman Zakaria and his assistances (Mr. Mohd Firdaus Mohamad and Mr. Mohamad
Hafizan Baharum) from Rolling Stock Department at Kelana Jaya Light Rail Transit
(LRT) depot for the time spent and information given to assist me during data
collection phase. Special gratitude goes to Mr Ahmad Nizam Mohamed Amin as
Chief Operating Officer (COO) for LRT Kelana Jaya line because the green light that
has been given to me to do my research at his company. Gratitude also dedicated to
Mr. Azizi as a technician at environmental laboratory who allow me to use the
devices and shared some idea regarding this research. My deepest appreciation,
thanks, love goes to my parents and my family for their supports and motivations.
Last but not least, I would like to thank to my fellow friends for morally supporting
me.
v
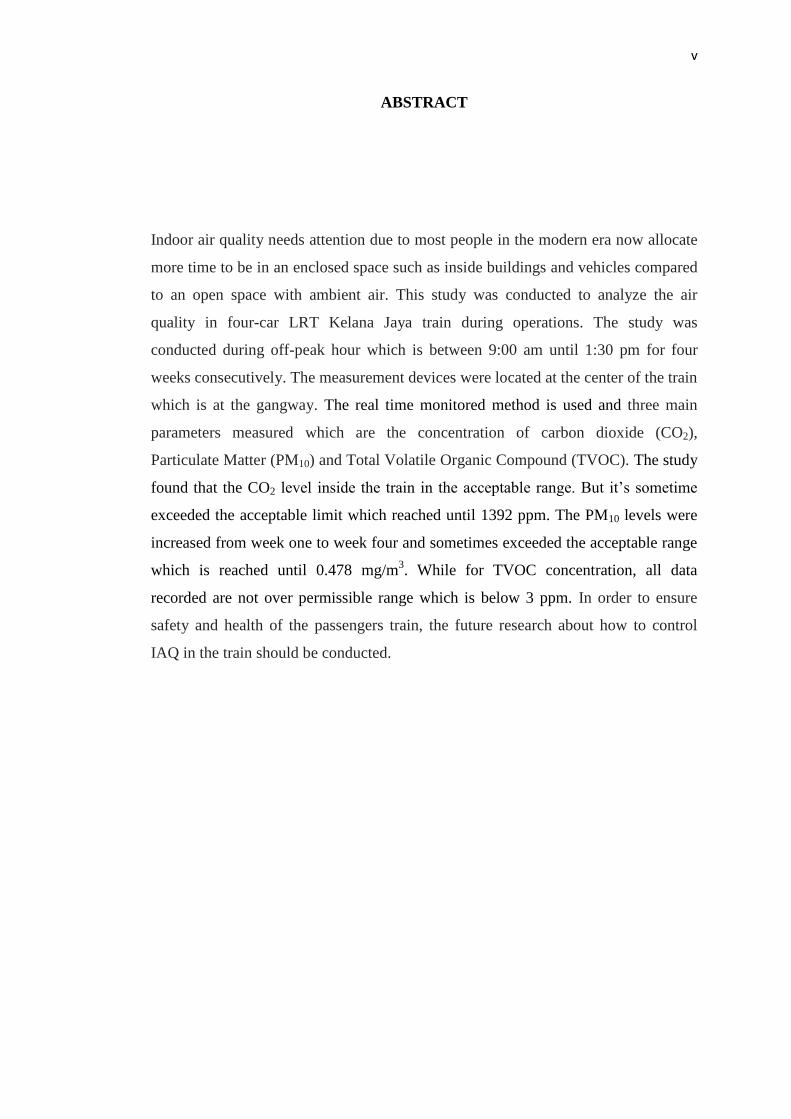
ABSTRACT
Indoor air quality needs attention due to most people in the modern era now allocate
more time to be in an enclosed space such as inside buildings and vehicles compared
to an open space with ambient air. This study was conducted to analyze the air
quality in four-car LRT Kelana Jaya train during operations. The study was
conducted during off-peak hour which is between 9:00 am until 1:30 pm for four
weeks consecutively. The measurement devices were located at the center of the train
which is at the gangway. The real time monitored method is used and three main
parameters measured which are the concentration of carbon dioxide (CO2),
Particulate Matter (PM10) and Total Volatile Organic Compound (TVOC). The study
found that the CO2 level inside the train in the acceptable range. But it’s sometime
exceeded the acceptable limit which reached until 1392 ppm. The PM10 levels were
increased from week one to week four and sometimes exceeded the acceptable range
which is reached until 0.478 mg/m3. While for TVOC concentration, all data
recorded are not over permissible range which is below 3 ppm. In order to ensure
safety and health of the passengers train, the future research about how to control
IAQ in the train should be conducted.
vi
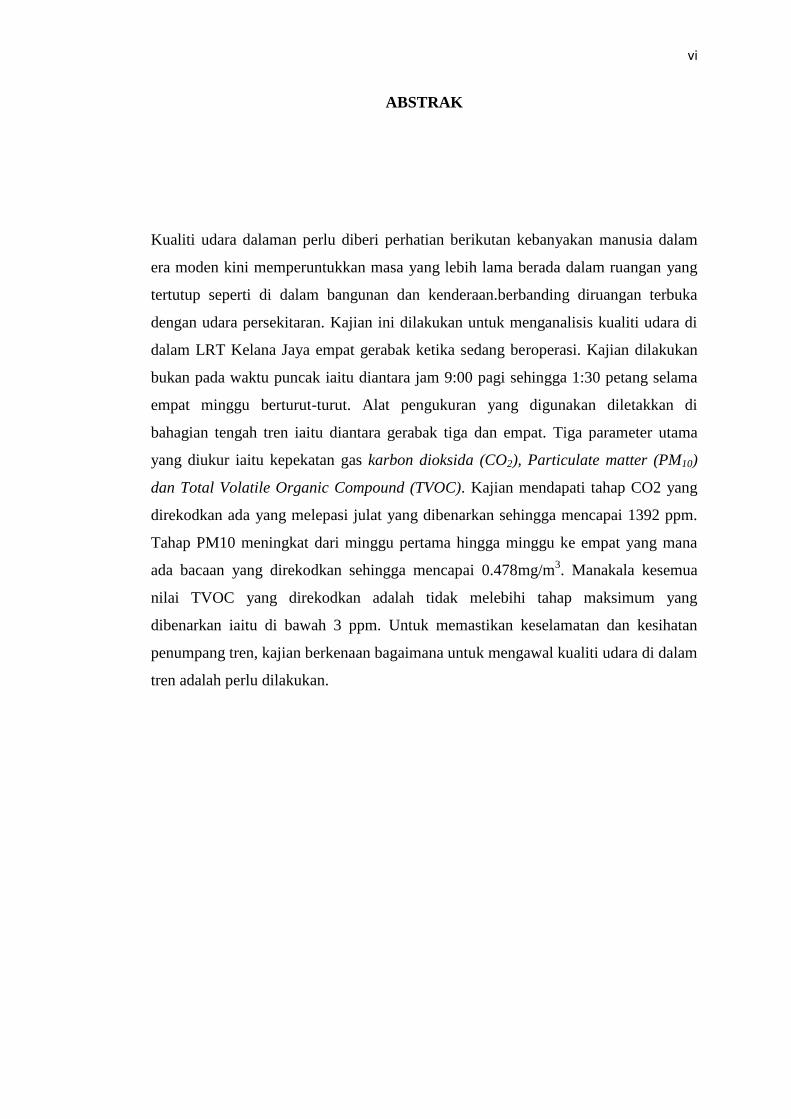
ABSTRAK
Kualiti udara dalaman perlu diberi perhatian berikutan kebanyakan manusia dalam
era moden kini memperuntukkan masa yang lebih lama berada dalam ruangan yang
tertutup seperti di dalam bangunan dan kenderaan.berbanding diruangan terbuka
dengan udara persekitaran. Kajian ini dilakukan untuk menganalisis kualiti udara di
dalam LRT Kelana Jaya empat gerabak ketika sedang beroperasi. Kajian dilakukan
bukan pada waktu puncak iaitu diantara jam 9:00 pagi sehingga 1:30 petang selama
empat minggu berturut-turut. Alat pengukuran yang digunakan diletakkan di
bahagian tengah tren iaitu diantara gerabak tiga dan empat. Tiga parameter utama
yang diukur iaitu kepekatan gas karbon dioksida (CO2), Particulate matter (PM10)
dan Total Volatile Organic Compound (TVOC). Kajian mendapati tahap CO2 yang
direkodkan ada yang melepasi julat yang dibenarkan sehingga mencapai 1392 ppm.
Tahap PM10 meningkat dari minggu pertama hingga minggu ke empat yang mana
ada bacaan yang direkodkan sehingga mencapai 0.478mg/m3. Manakala kesemua
nilai TVOC yang direkodkan adalah tidak melebihi tahap maksimum yang
dibenarkan iaitu di bawah 3 ppm. Untuk memastikan keselamatan dan kesihatan
penumpang tren, kajian berkenaan bagaimana untuk mengawal kualiti udara di dalam
tren adalah perlu dilakukan.
vii
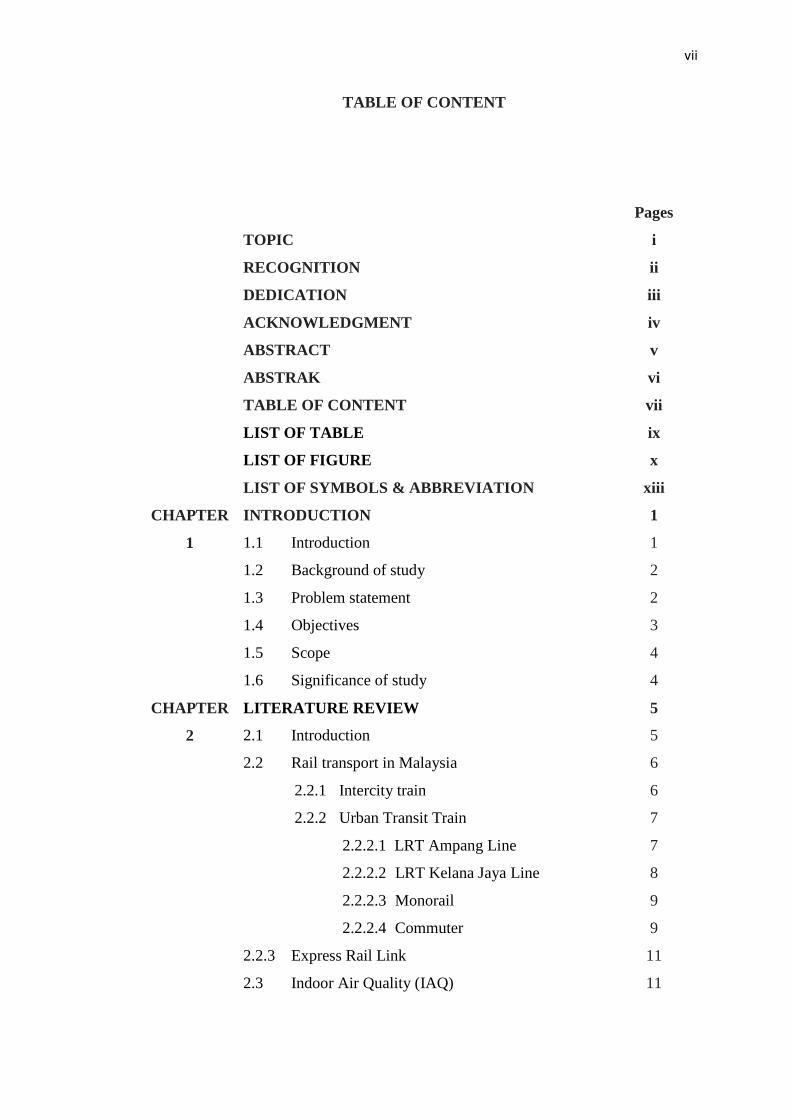
TABLE OF CONTENT
Pages
TOPIC i
RECOGNITION ii
DEDICATION iii
ACKNOWLEDGMENT iv
ABSTRACT v
ABSTRAK vi
TABLE OF CONTENT vii
LIST OF TABLE ix
LIST OF FIGURE x
LIST OF SYMBOLS & ABBREVIATION xiii
CHAPTER
1
INTRODUCTION
1.1 Introduction
1.2 Background of study
1.3 Problem statement
1.4 Objectives
1.5 Scope
1.6 Significance of study
1
1
2
2
3
4
4
CHAPTER
2
LITERATURE REVIEW
2.1 Introduction
2.2 Rail transport in Malaysia
2.2.1 Intercity train
2.2.2 Urban Transit Train
2.2.2.1 LRT Ampang Line
2.2.2.2 LRT Kelana Jaya Line
2.2.2.3 Monorail
2.2.2.4 Commuter
2.2.3 Express Rail Link
2.3 Indoor Air Quality (IAQ)
5
5
6
6
7
7
8
9
9
11
11
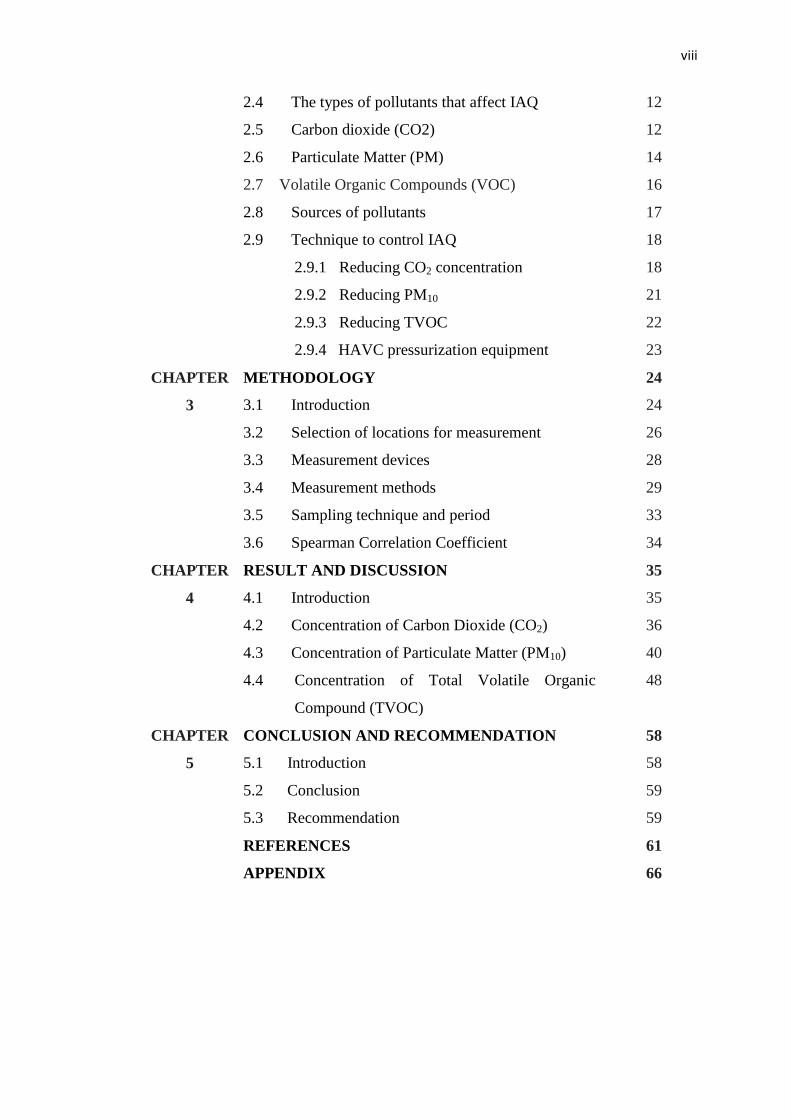
viii
2.4 The types of pollutants that affect IAQ
2.5 Carbon dioxide (CO2)
2.6 Particulate Matter (PM)
2.7 Volatile Organic Compounds (VOC)
2.8 Sources of pollutants
2.9 Technique to control IAQ
2.9.1 Reducing CO2 concentration
2.9.2 Reducing PM10
2.9.3 Reducing TVOC
2.9.4 HAVC pressurization equipment
12
12
14
16
17
18
18
21
22
23
CHAPTER
3
METHODOLOGY
3.1 Introduction
3.2 Selection of locations for measurement
3.3 Measurement devices
3.4 Measurement methods
3.5 Sampling technique and period
3.6 Spearman Correlation Coefficient
24
24
26
28
29
33
34
CHAPTER
4
RESULT AND DISCUSSION
4.1 Introduction
4.2 Concentration of Carbon Dioxide (CO2)
4.3 Concentration of Particulate Matter (PM10)
4.4 Concentration of Total Volatile Organic
Compound (TVOC)
35
35
36
40
48
CHAPTER
5
CONCLUSION AND RECOMMENDATION
5.1 Introduction
5.2 Conclusion
5.3 Recommendation
58
58
59
59
REFERENCES 61
APPENDIX 66
ix
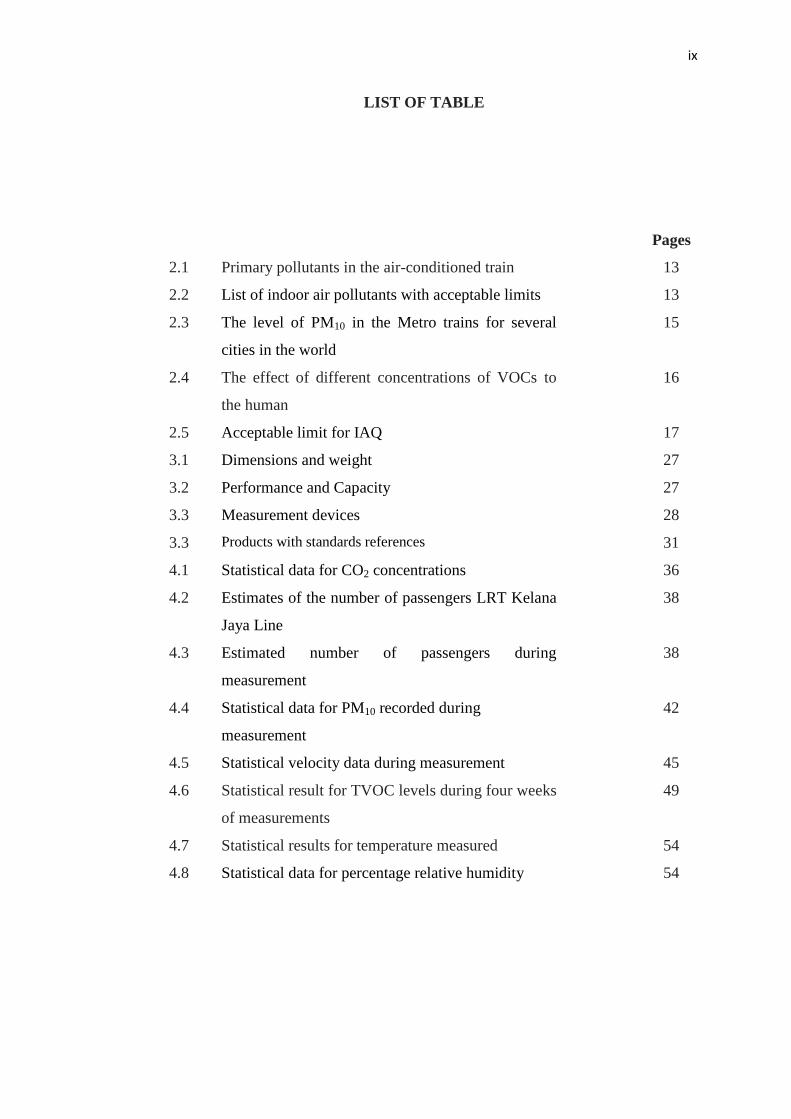
LIST OF TABLE
Pages
2.1 Primary pollutants in the air-conditioned train 13
2.2 List of indoor air pollutants with acceptable limits 13
2.3 The level of PM10 in the Metro trains for several
cities in the world
15
2.4 The effect of different concentrations of VOCs to
the human
16
2.5 Acceptable limit for IAQ 17
3.1 Dimensions and weight 27
3.2 Performance and Capacity 27
3.3 Measurement devices 28
3.3 Products with standards references 31
4.1 Statistical data for CO2 concentrations 36
4.2 Estimates of the number of passengers LRT Kelana
Jaya Line
38
4.3 Estimated number of passengers during
measurement
38
4.4 Statistical data for PM10 recorded during
measurement
42
4.5 Statistical velocity data during measurement 45
4.6 Statistical result for TVOC levels during four weeks
of measurements
49
4.7 Statistical results for temperature measured 54
4.8 Statistical data for percentage relative humidity 54
x
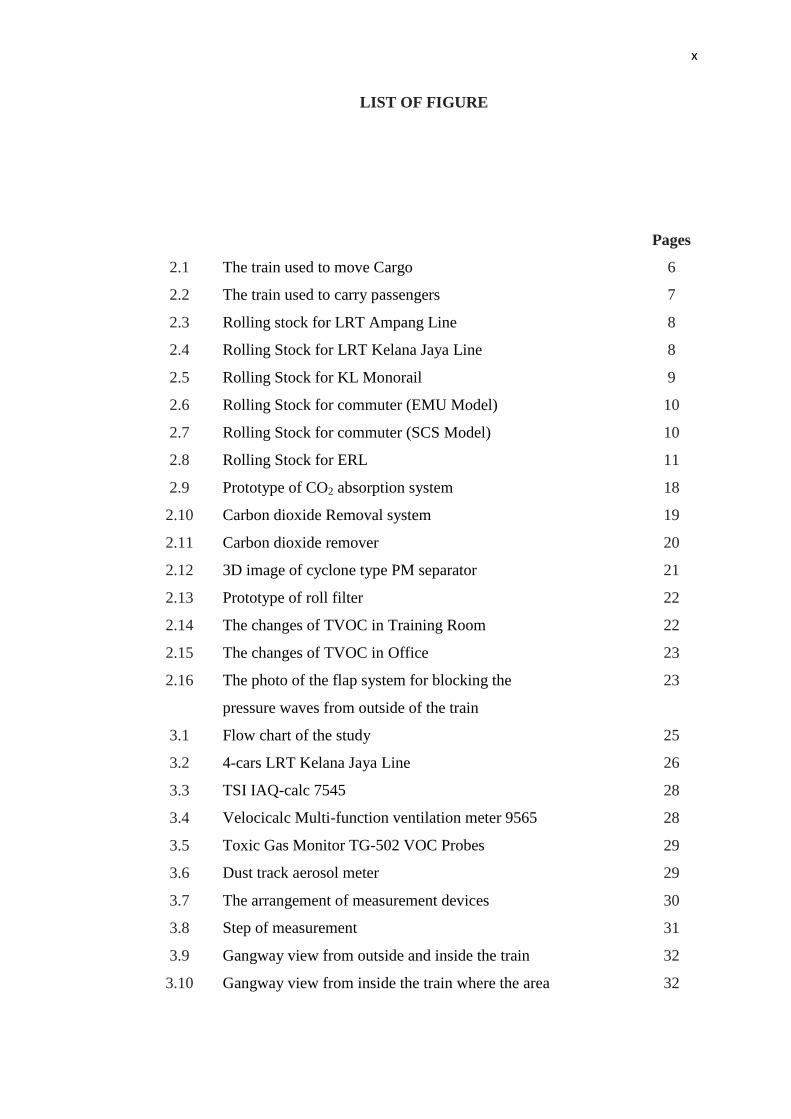
LIST OF FIGURE
Pages
2.1 The train used to move Cargo 6
2.2 The train used to carry passengers 7
2.3 Rolling stock for LRT Ampang Line 8
2.4 Rolling Stock for LRT Kelana Jaya Line 8
2.5 Rolling Stock for KL Monorail 9
2.6 Rolling Stock for commuter (EMU Model) 10
2.7 Rolling Stock for commuter (SCS Model) 10
2.8 Rolling Stock for ERL 11
2.9 Prototype of CO2 absorption system 18
2.10 Carbon dioxide Removal system 19
2.11 Carbon dioxide remover 20
2.12 3D image of cyclone type PM separator 21
2.13 Prototype of roll filter 22
2.14 The changes of TVOC in Training Room 22
2.15 The changes of TVOC in Office 23
2.16 The photo of the flap system for blocking the
pressure waves from outside of the train
23
3.1 Flow chart of the study 25
3.2 4-cars LRT Kelana Jaya Line 26
3.3 TSI IAQ-calc 7545 28
3.4 Velocicalc Multi-function ventilation meter 9565 28
3.5 Toxic Gas Monitor TG-502 VOC Probes 29
3.6 Dust track aerosol meter 29
3.7 The arrangement of measurement devices 30
3.8 Step of measurement 31
3.9 Gangway view from outside and inside the train 32
3.10 Gangway view from inside the train where the area 32
xi
to locate the measurement devices.
3.11 The measurement area was blocked by using
warning tape
33
4.1 The trend of CO2 concentration when the train
going through the upstream and downstream line
37
4.2 Passengers’ condition during measurement. 36
4.3 The trend of PM10 concentration when the train
going through the upstream and downstream line
42
4.4(i) Filter used in AVC system in 4-Car train 42
4.4(ii) Filter used in AVC system in 4-Car train (Fresh air
filter)
43
4.5 The trend that shows the relation between Air
velocity and level of PM10 in week 1
43
4.6 The trend that shows the relation between Air
velocity and level of PM10 in week 2
44
4.6 The trend that shows the relation between Air
velocity and level of PM10 in week 3
44
4.8 The trend that shows the relation between Air
velocity and level of PM10 in week 4
45
4.9 Platform Screen Door System (PSDS) 46
4.10 Correlation Coefficient between air velocity with
PM10 concentrations
47
4.11 PM10 recorded 47
4.12 Air velocity recorded 48
4.13 The concentration of TVOC when the train going
through the upstream and downstream line
50
4.14 Combination TVOC and temperature trend week 1 51
4.15 Combination TVOC and temperature trend week 2 52
4.16 Combination TVOC and temperature trend week 3 52
4.17 Combination TVOC and temperature trend week 4 53
4.18 Percentages of temperature recorded 53
4.19 Combination TVOC and relative humidity trend
week 1
55
xii
4.20 Combination TVOC and relative humidity trend
week 2
55
4.21 Combination TVOC and relative humidity trend
week 3
56
4.22 Combination TVOC and relative humidity trend
week 4
56
4.23 Correlation between temperature and TVOC 57
4.24 Correlation between relative humidity and TVOC 57
xiii
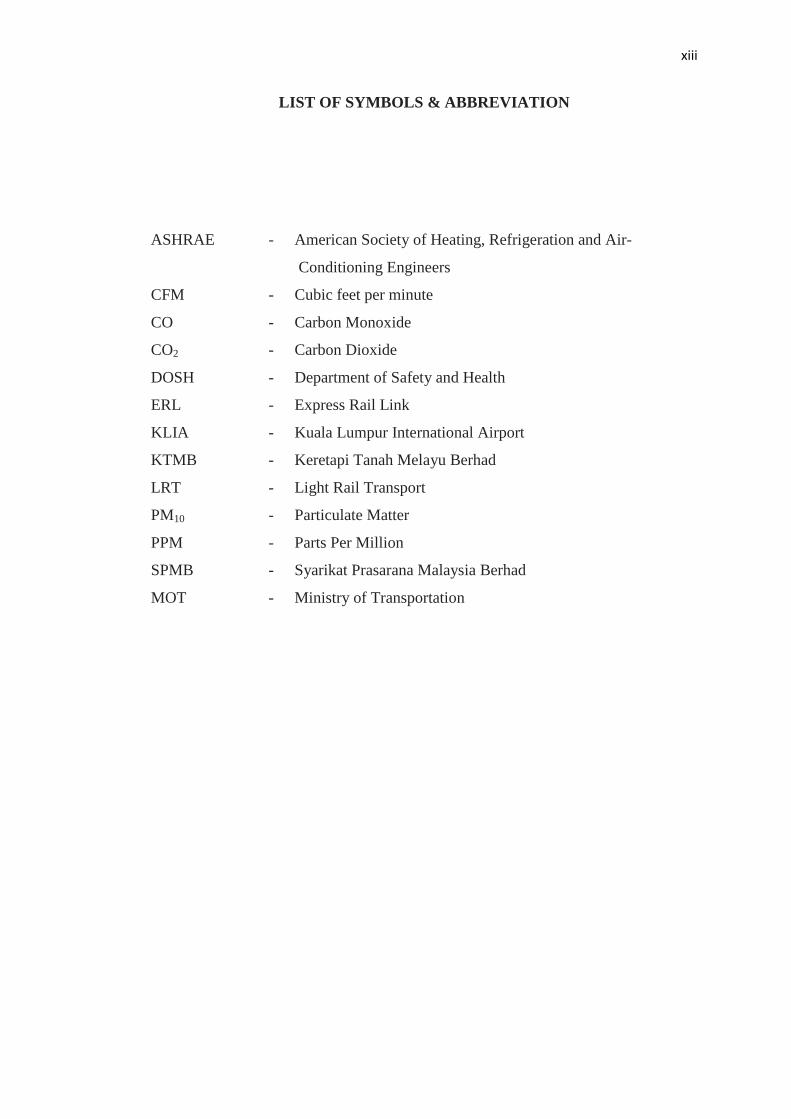
LIST OF SYMBOLS & ABBREVIATION
ASHRAE - American Society of Heating, Refrigeration and Air-
Conditioning Engineers
CFM - Cubic feet per minute
CO - Carbon Monoxide
CO2 - Carbon Dioxide
DOSH - Department of Safety and Health
ERL - Express Rail Link
KLIA - Kuala Lumpur International Airport
KTMB - Keretapi Tanah Melayu Berhad
LRT - Light Rail Transport
PM10 - Particulate Matter
PPM - Parts Per Million
SPMB - Syarikat Prasarana Malaysia Berhad
MOT - Ministry of Transportation
1
CHAPTER 1
INTRODUCTION
1.1 Introduction
The innovation of the different areas was rapidly done nowadays. The main purpose
of innovation is to make comfort and convenience of human life. In the era of
modernization and development of technology, health and safety factors must always
put in high consideration for survival of human. The environmental sustainability or
green technological knowledge is a priority in many fields nowadays and it is closely
related to the issue of environmental pollution such as water pollution, noise
pollution and air pollution. For sustainable development, all the factor that could
cause pollution need to be studied.
Among of the various types of pollution, more attention should be given to
the issue of air pollution because humans live are always depend on the air at all
time. The air quality is divided into two category which are indoor air quality (IAQ)
and outdoor air quality. Poor of air quality will give implications to the human
health. Every day, people need 10-20m3
and 1-2 litres of air and water respectively
(WHO, 2010).
2
1.2 Background of study
In the modern era, mode of life style and transportation were different from the
previous. Among the top ranking of mode of transportation in certain city now a days
is by using railway like Mass Rapid Transit (MRT), Light Rail Transit (LRT),
subway and etc. But to have all this facility, safety issues such as environmental
impact must always put into consideration. There are lots of IAQ study in buildings
have been conducted before. However, when the transport system is booming, IAQ
studies especially in public transport vehicles, was began since the 1990s. Whereas,
studies of air quality in the train only began in the 20th
century by some cities such as
Hong Kong, Seoul, Los Angeles and Beijing. This study was conducted to analyse
air quality inside the LRT Kelana Jaya which is one of the urban rail transports in
Kuala Lumpur.
1.3 Problem statement
The population of people in industrialized countries spend more than 90% of their
time in enclosed areas where air quality is lower than the open area (Snyder, 1990;
Jenkins 1992; Posudin et al., 2010). At all times, people will do activities in an
enclosed space such as in homes, offices, universities, schools, hospitals, business
centres and other (Posudin, et al., 2010). Among other areas that can be expressed as
a closed area is in a vehicle such as in cars, buses, trains, ships, airplanes and other
(Posudin,et al.,2010)
Hunt and Space (1994), mentioned that, the low IAQ level in the plane will
cause pain, fatigue, dizziness, nausea, headache, eye pain and irritation of the nose
and respiratory problems among passengers. Low levels of IAQ can cause eyes and
lungs irritation (LU Hao, 2007). Severe IAQ can also cause dryness of the skin and
mucous membranes and may increase the likelihood of transmission of viral diseases
(Pennsylvania University, 2014).
The high concentration of CO2 will degrade the IAQ level. There are many
study that show the level of IAQ was affected by the concentration of CO2. In the
3
plane, the low IAQ level is caused by low humidity levels and high concentration of
CO2 (Huanxin Chen, 2003).
In a study conducted by Tsairidi et al. (2013) found that the concentration of
CO2 is higher in the trains compare at the platform. A study by (Huanxin Chen,
2003) says that the air quality in the trains is getting worse due to congestion,
wagons are too closed, contaminants present from the passengers, goods and dust
from machine tools. The IAQ level is lower in the tunnel compare at the open area
(Kwon, Park et al. 2012). According to Anderson (2007), up to 60 million people
working in the building suffering from irritation of the eyes, nose, throat, headache
and fatigue.
There are several factors that usually influence IAQ which are the concentration of
Carbon Dioxide (CO2), concentration of Carbon Monoxide (CO), Particulate Matter
(PM), formaldehyde and volatile organic compounds (VOCs). The high
concentration of these elements will be present risks to human health such as pain,
dizziness, dryness of the throat and tongue, fatigue, chest tightness, dry skin and
other (Huanxin Chen, 2003). Based on survey made on the 20 passengers at Kelana
Jaya LRT, some of them often felt headache, drowsiness and dizziness when
boarding the train. Among themselves believed the symptoms are due to
environment in the train. There are many researchers in Malaysia and abroad who
study IAQ in buildings, but very little research done on IAQ in the vehicle,
especially in the train. Until now, there has been no research on IAQ in the train in
Malaysia. There is also no standard procedure to determine and method how to
measure IAQ in the train compare with inside the building. To look further at this
issue, this study needs to be conducted as a baseline data of IAQ in the train.
1.4 Objectives
i. To determine the trend of IAQ level when the train running through along the
line
ii. To evaluate and compare the IAQ data with code of practice on Indoor Air
Quality 2010
4
iii. To identify the correlation between chemical parameters (PM10, CO2 and
TVOC) with the physical parameters (Temperature, relative humidity, air
movement and number of passengers).
1.5 Scope
i. The IAQ data collection is formed in 4-car train for Kelana Jaya light rail
transit (LRT)
ii. The measurement was conducted during off-peak hours (9:30am to 1:00pm)
iii. The IAQ parameters were concentration of CO2 , VOCs and PM10
iv. There are only four device are used (TSI IAQ-calc 7545, Velocicalc
Multifunction ventilation meter 9565, Toxic Gas Monitor TG-502 VOC
Probes and Dust Track aerosol meter)
1.6 Significance of study
More than hundred thousands of people reported using LRT Kelana Jaya line every
day. In 2011, the statistics released by the Malaysian Ministry of Transportation
(MOT) shows that over 180 thousands passengers are using the service every day
(MOT, 2011). Imagine if the IAQ level in the train and platform are over the safety
limit, it will present the health risk to hundred thousands of passengers who use it
every day. Based on preliminary result, some of the passenger had symptoms such as
headache, drowsiness, dizziness, irritation of nose and eyes. Therefore, this study is
important in order to ensure the safety and health of the passengers especially for
those who are using the service daily.
5
CHAPTER 2
LITERATURE REVIEW
2.1 Introduction
Indoor air quality (IAQ) needs to be maintained so that is always in acceptable range.
This chapter described in detail about the contaminants that cause indoor air
pollution and also described the factors that influence the existence and development
of each pollutant. Other than that, this chapter also describes the standards set to
ensure the IAQ in order to cater the human health as well. The results from previous
studies which are related to IAQ were also mentioned in this chapter as a reference.
6
2.2 Rail transport in Malaysia
Kuala Lumpur is the capital of Malaysia. It has three types of rail transport system
which are:
i. Intercity train
ii. Urban transit train
iii. Express train
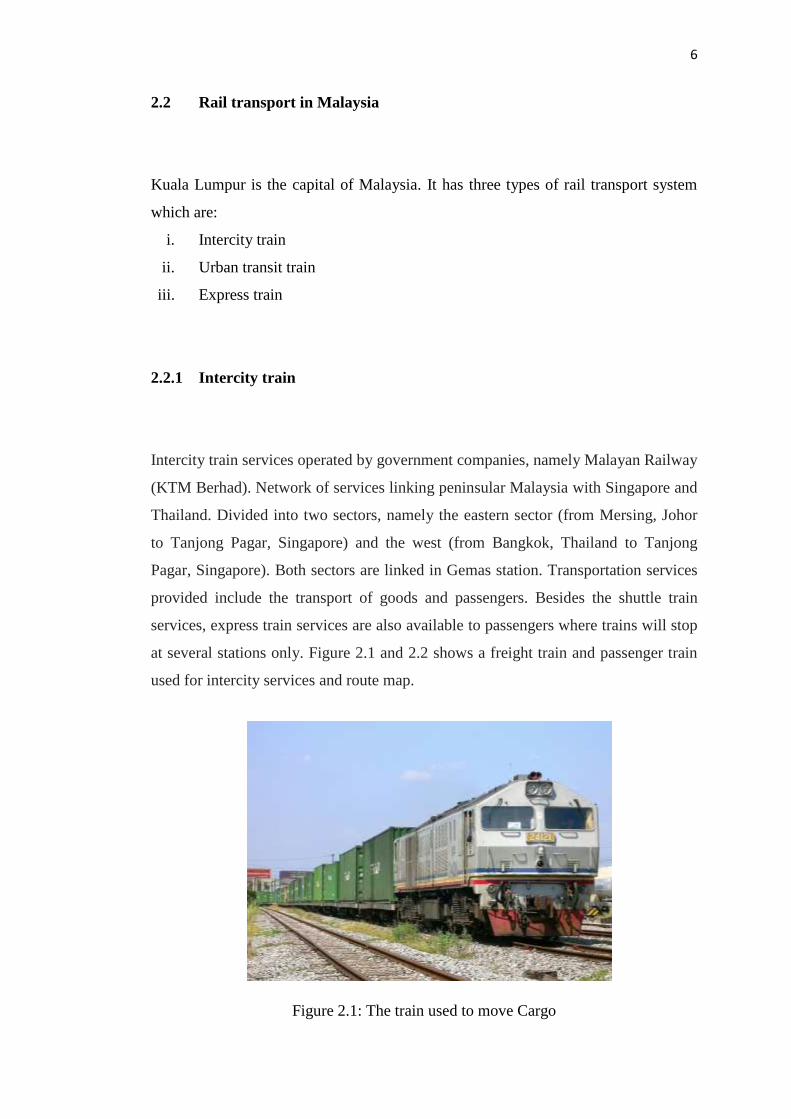
2.2.1 Intercity train
Intercity train services operated by government companies, namely Malayan Railway
(KTM Berhad). Network of services linking peninsular Malaysia with Singapore and
Thailand. Divided into two sectors, namely the eastern sector (from Mersing, Johor
to Tanjong Pagar, Singapore) and the west (from Bangkok, Thailand to Tanjong
Pagar, Singapore). Both sectors are linked in Gemas station. Transportation services
provided include the transport of goods and passengers. Besides the shuttle train
services, express train services are also available to passengers where trains will stop
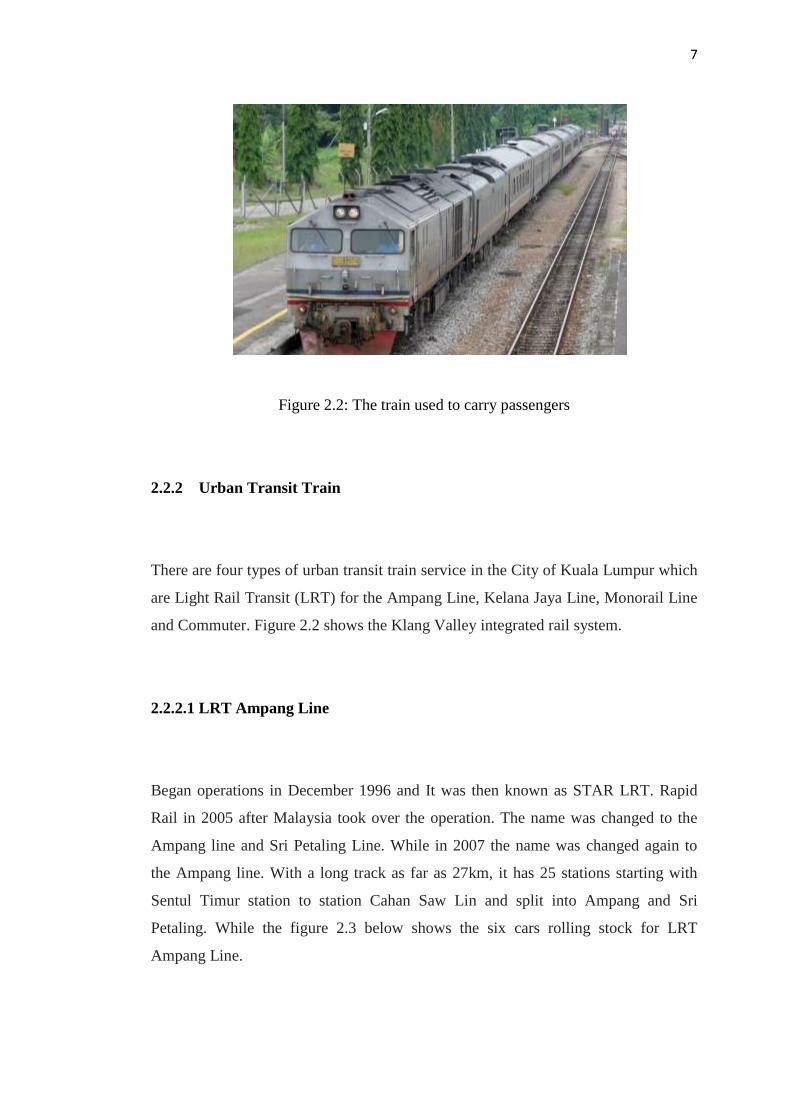
at several stations only. Figure 2.1 and 2.2 shows a freight train and passenger train
used for intercity services and route map.
Figure 2.1: The train used to move Cargo
7
Figure 2.2: The train used to carry passengers
2.2.2 Urban Transit Train
There are four types of urban transit train service in the City of Kuala Lumpur which
are Light Rail Transit (LRT) for the Ampang Line, Kelana Jaya Line, Monorail Line
and Commuter. Figure 2.2 shows the Klang Valley integrated rail system.
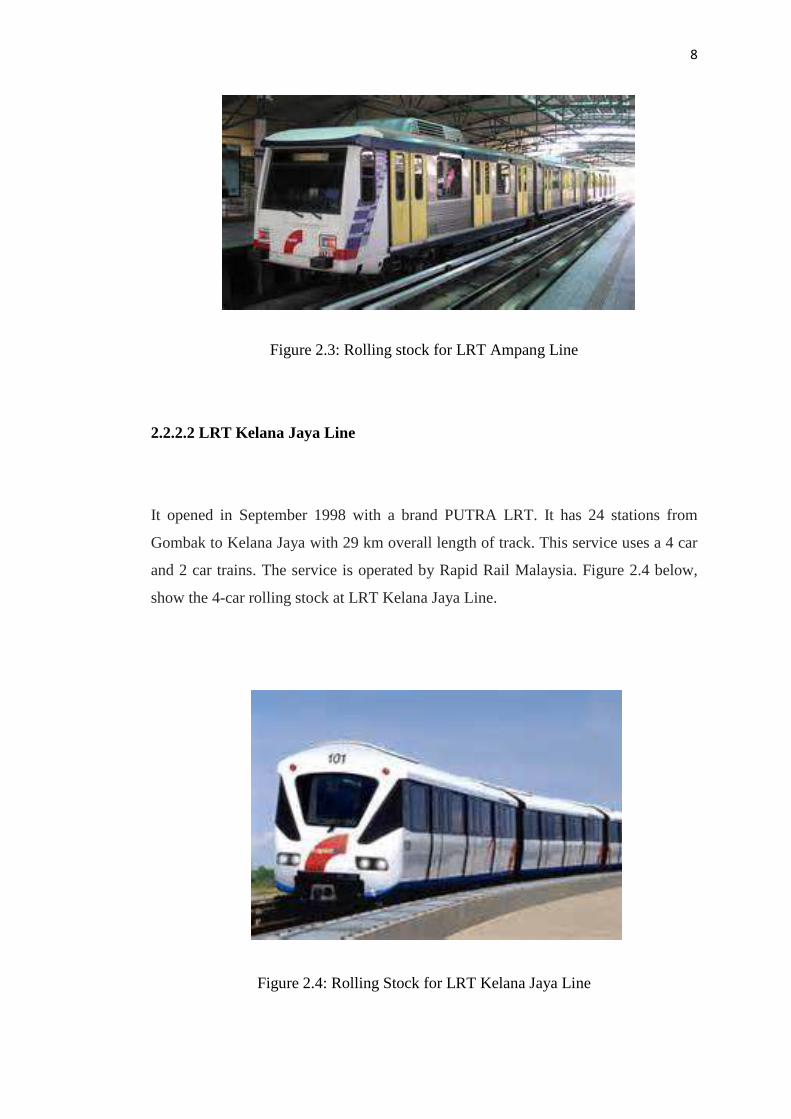
2.2.2.1 LRT Ampang Line
Began operations in December 1996 and It was then known as STAR LRT. Rapid
Rail in 2005 after Malaysia took over the operation. The name was changed to the
Ampang line and Sri Petaling Line. While in 2007 the name was changed again to
the Ampang line. With a long track as far as 27km, it has 25 stations starting with
Sentul Timur station to station Cahan Saw Lin and split into Ampang and Sri
Petaling. While the figure 2.3 below shows the six cars rolling stock for LRT
Ampang Line.
8
Figure 2.3: Rolling stock for LRT Ampang Line
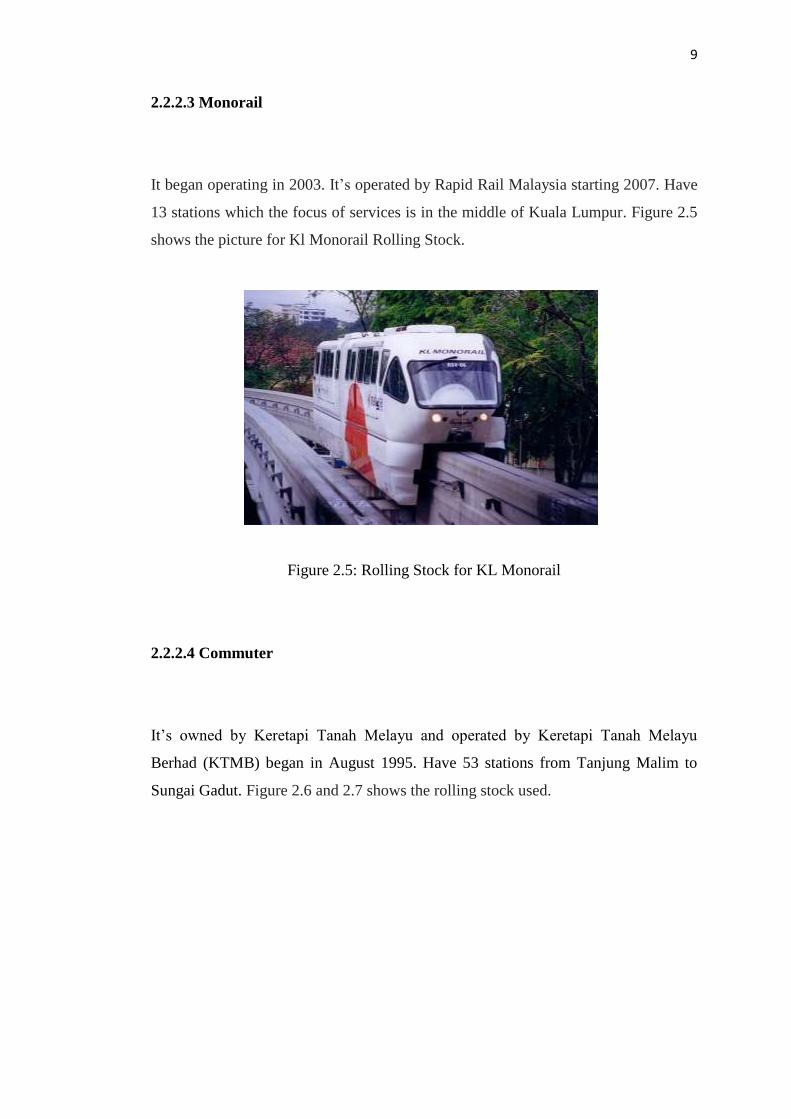
2.2.2.2 LRT Kelana Jaya Line
It opened in September 1998 with a brand PUTRA LRT. It has 24 stations from
Gombak to Kelana Jaya with 29 km overall length of track. This service uses a 4 car
and 2 car trains. The service is operated by Rapid Rail Malaysia. Figure 2.4 below,
show the 4-car rolling stock at LRT Kelana Jaya Line.
Figure 2.4: Rolling Stock for LRT Kelana Jaya Line
9
2.2.2.3 Monorail
It began operating in 2003. It’s operated by Rapid Rail Malaysia starting 2007. Have
13 stations which the focus of services is in the middle of Kuala Lumpur. Figure 2.5
shows the picture for Kl Monorail Rolling Stock.
Figure 2.5: Rolling Stock for KL Monorail
2.2.2.4 Commuter
It’s owned by Keretapi Tanah Melayu and operated by Keretapi Tanah Melayu
Berhad (KTMB) began in August 1995. Have 53 stations from Tanjung Malim to
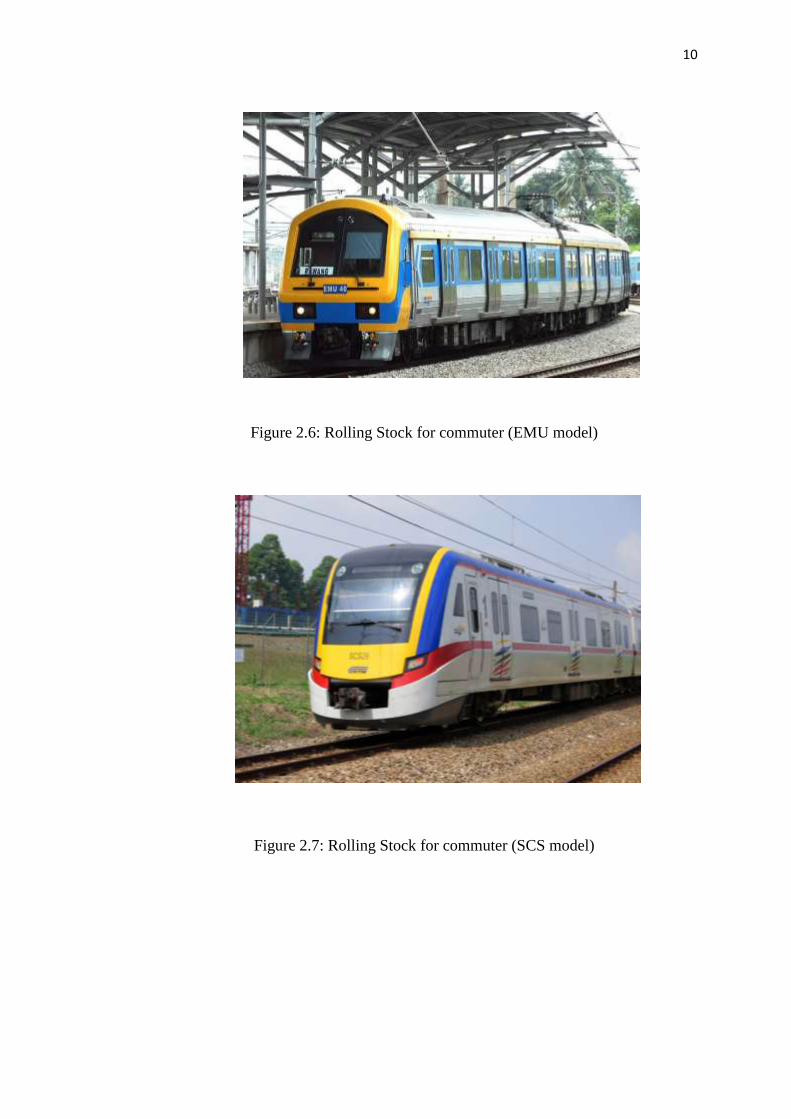
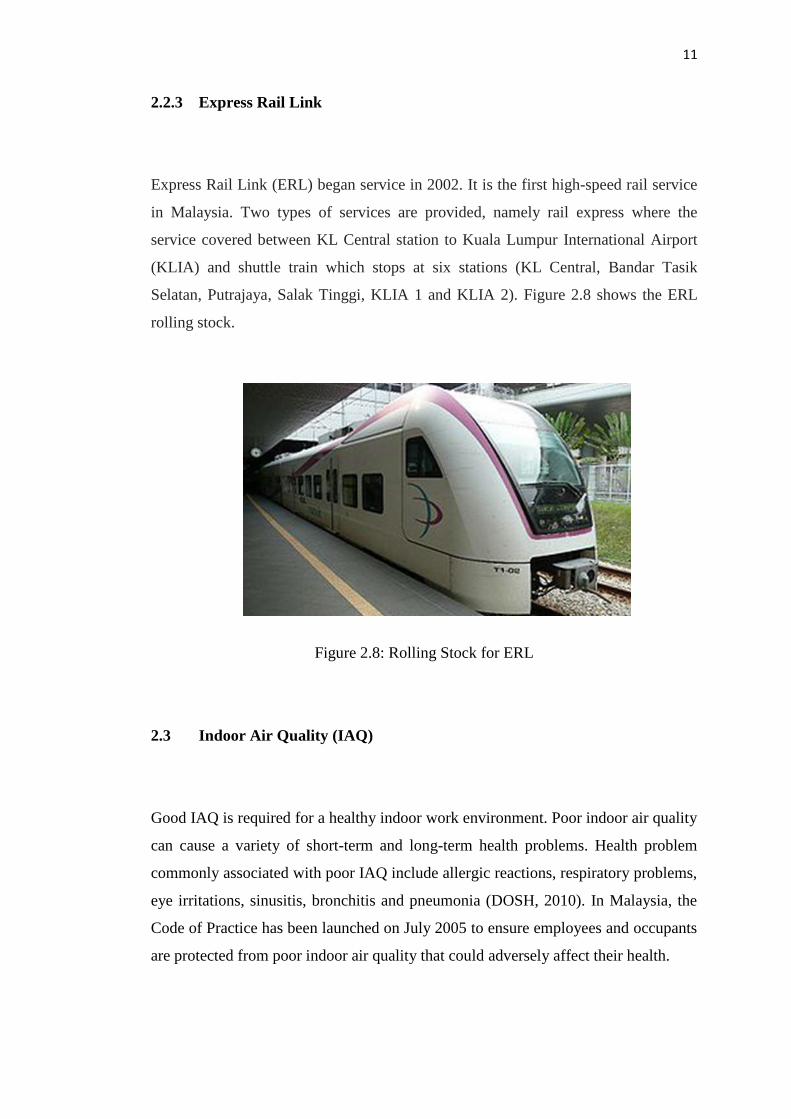
Sungai Gadut. Figure 2.6 and 2.7 shows the rolling stock used.
10
Figure 2.6: Rolling Stock for commuter (EMU model)
Figure 2.7: Rolling Stock for commuter (SCS model)
11
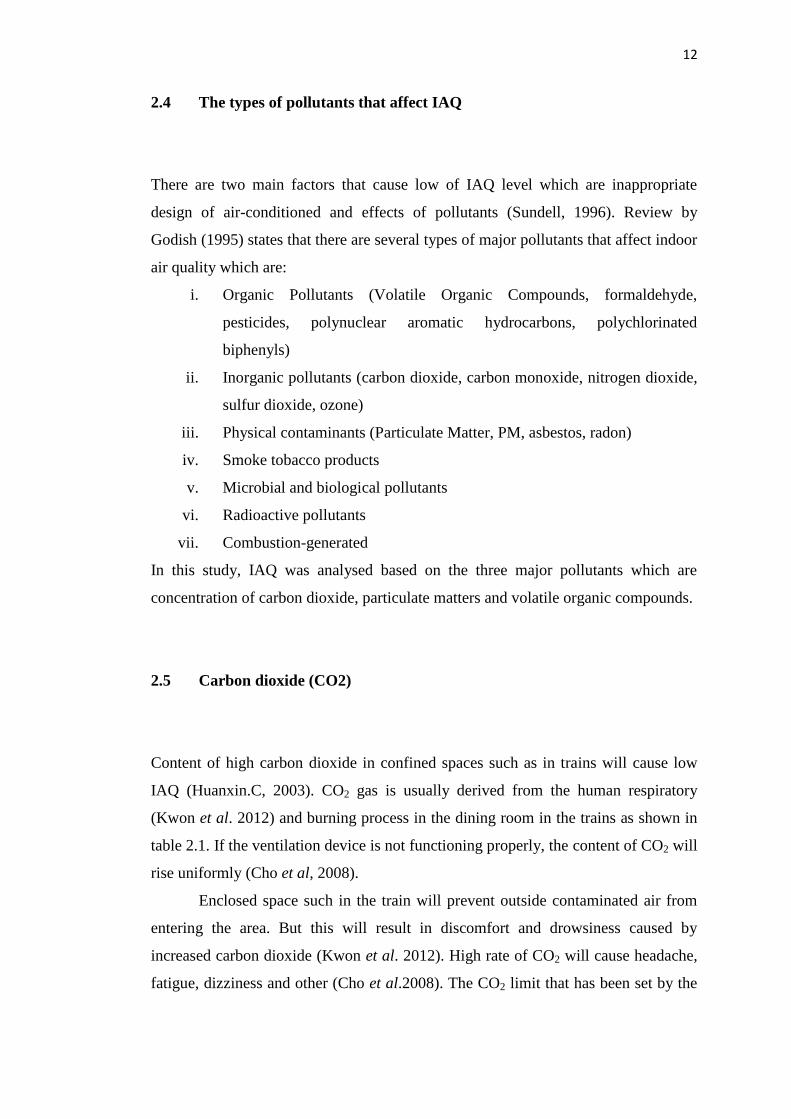
2.2.3 Express Rail Link
Express Rail Link (ERL) began service in 2002. It is the first high-speed rail service
in Malaysia. Two types of services are provided, namely rail express where the
service covered between KL Central station to Kuala Lumpur International Airport
(KLIA) and shuttle train which stops at six stations (KL Central, Bandar Tasik
Selatan, Putrajaya, Salak Tinggi, KLIA 1 and KLIA 2). Figure 2.8 shows the ERL
rolling stock.
Figure 2.8: Rolling Stock for ERL
2.3 Indoor Air Quality (IAQ)
Good IAQ is required for a healthy indoor work environment. Poor indoor air quality
can cause a variety of short-term and long-term health problems. Health problem
commonly associated with poor IAQ include allergic reactions, respiratory problems,
eye irritations, sinusitis, bronchitis and pneumonia (DOSH, 2010). In Malaysia, the
Code of Practice has been launched on July 2005 to ensure employees and occupants
are protected from poor indoor air quality that could adversely affect their health.
12
2.4 The types of pollutants that affect IAQ
There are two main factors that cause low of IAQ level which are inappropriate
design of air-conditioned and effects of pollutants (Sundell, 1996). Review by
Godish (1995) states that there are several types of major pollutants that affect indoor
air quality which are:
i. Organic Pollutants (Volatile Organic Compounds, formaldehyde,
pesticides, polynuclear aromatic hydrocarbons, polychlorinated
biphenyls)
ii. Inorganic pollutants (carbon dioxide, carbon monoxide, nitrogen dioxide,
sulfur dioxide, ozone)
iii. Physical contaminants (Particulate Matter, PM, asbestos, radon)
iv. Smoke tobacco products
v. Microbial and biological pollutants
vi. Radioactive pollutants
vii. Combustion-generated
In this study, IAQ was analysed based on the three major pollutants which are
concentration of carbon dioxide, particulate matters and volatile organic compounds.
2.5 Carbon dioxide (CO2)
Content of high carbon dioxide in confined spaces such as in trains will cause low
IAQ (Huanxin.C, 2003). CO2 gas is usually derived from the human respiratory
(Kwon et al. 2012) and burning process in the dining room in the trains as shown in
table 2.1. If the ventilation device is not functioning properly, the content of CO2 will
rise uniformly (Cho et al, 2008).
Enclosed space such in the train will prevent outside contaminated air from
entering the area. But this will result in discomfort and drowsiness caused by
increased carbon dioxide (Kwon et al. 2012). High rate of CO2 will cause headache,
fatigue, dizziness and other (Cho et al.2008). The CO2 limit that has been set by the
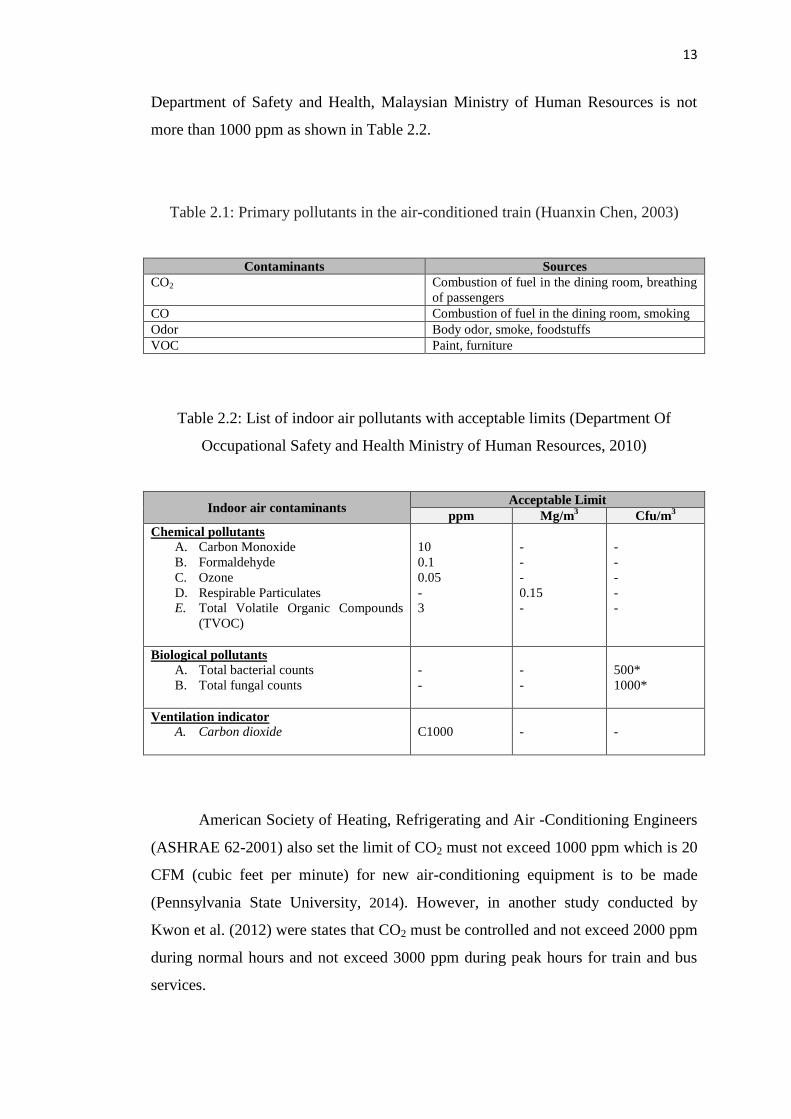
13
Department of Safety and Health, Malaysian Ministry of Human Resources is not
more than 1000 ppm as shown in Table 2.2.
Table 2.1: Primary pollutants in the air-conditioned train (Huanxin Chen, 2003)
Contaminants Sources
CO2 Combustion of fuel in the dining room, breathing
of passengers
CO Combustion of fuel in the dining room, smoking
Odor Body odor, smoke, foodstuffs
VOC Paint, furniture
Table 2.2: List of indoor air pollutants with acceptable limits (Department Of
Occupational Safety and Health Ministry of Human Resources, 2010)
Indoor air contaminants Acceptable Limit
ppm Mg/m3
Cfu/m3
Chemical pollutants
A. Carbon Monoxide
B. Formaldehyde
C. Ozone
D. Respirable Particulates
E. Total Volatile Organic Compounds
(TVOC)
10
0.1
0.05
-
3
-
-
-
0.15
-
-
-
-
-
-
Biological pollutants
A. Total bacterial counts
B. Total fungal counts
-
-
-
-
500*
1000*
Ventilation indicator
A. Carbon dioxide
C1000
-
-
American Society of Heating, Refrigerating and Air -Conditioning Engineers
(ASHRAE 62-2001) also set the limit of CO2 must not exceed 1000 ppm which is 20
CFM (cubic feet per minute) for new air-conditioning equipment is to be made
(Pennsylvania State University, 2014). However, in another study conducted by
Kwon et al. (2012) were states that CO2 must be controlled and not exceed 2000 ppm
during normal hours and not exceed 3000 ppm during peak hours for train and bus
services.
14
CO2 concentration varies along the train route. Based on a study made in the
Metro trains, CO2 level in the train during through underground contains
approximately 20-150% more than when the train through on the ground (Yu-Hsiang
Cheng et al., 2012). The study of high-speed railway in Korea found the content of
CO2 in the train exceeds the safe limits 1000 ppm (Cho et al.2007). By increasing the
duration of the trip, the CO2 content will increases up to 5000 ppm depending to the
number of passengers on the train (Kwon et al. 2012).
2.6 Particulate Matter (PM)
Particulate Matter (PM) is a complex mixture of particles that are usually divided in
fractions according to particle size. PM is the major element contributes to air
pollution that negatively affect to humans (Carvalho, 2013). Particles which have a
total particle aerodynamic diameter below 10 mm (PM10) can travel through the
conductive airways and affect breathing.
Epidemiological studies have shown that the PM may bring negative effects
on human health such as respiratory and cardiovascular disease (Burnett et al., 2002).
Cheng et al., (2008) also found that the increase of 10 μg/m3 PM in polluted air is
associated with an increased risk of 4 %, 6 % and 8 % of cardiovascular disease ,
lung cancer and death . There are studies that find content PM in the subway less
than 8 times genotic than on ordinary roads and can result in 4 times of oxidative
stress in lung cells (Karlsson & Nilsson, 2005)
The level of PM is authorized by DOSH is 0.15mg/m3 which is shown in
table 2.2. The standard is same set by the Ministry of Transport of Korea where 150
μg/m3 on a regular basis and should not exceed 200 μg/m
3 during peak hours (Park,
et al. 2012).
The presence of PM into the train is influenced by the external environment
(Jung et al., 2010). Spread through the movement of trains and passengers also
encourage the presence of PM (Chan et al. 2002). This is because the clothing of
passengers is also one of the causal agents of PM into the train and the floating of
PM in the train is influenced by the flow of air and the movement of people (Cho et
al., 2008). The major source of PM is come from friction between the wheel and rail,
15
spark resulting from electric contact (electric contact) and brake wear (Chillrud et al.,
2004). PM may also result from integration of mechanical problems on the subway
system. There are a lot of metal with particles in the subway system as Fe , Mn , Cr ,
Ni and Cu (Pope et al . 2004; Salma et al., 2007).
In the study of IAQ in Metro passenger train in Athens, found that the content
of PM in the trains and subway platform is 2 to 5 times higher than the normal levels
in the surrounding environment that is monitored by the Ministry of Environment
(Tsairidi et al. 2013). While, Metro trains in Taiwan, shows the contents of PM on
the train when going through the underground is approximately 20-50 % higher than
during through on the ground (Yu-Hsiang.C et al., 2012) . The study also received
though the train use the same route, but the content of PM is different for the
different way and it shows that PM level are influenced by environmental conditions.
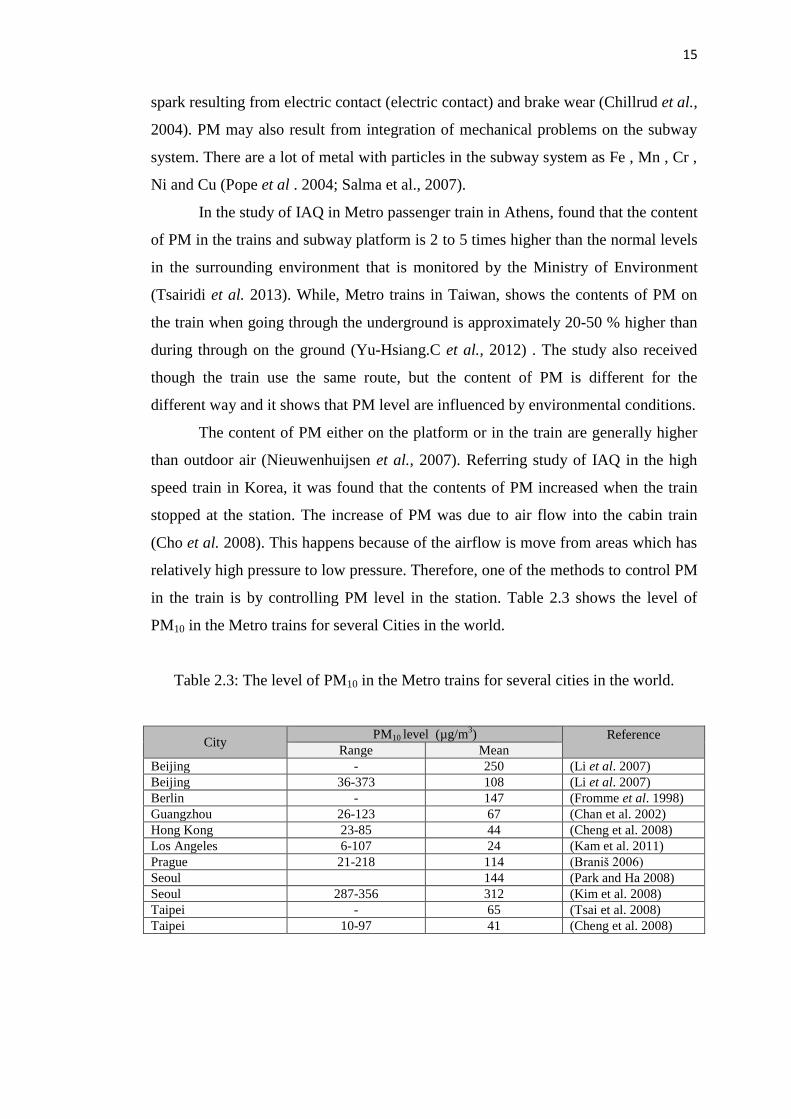
The content of PM either on the platform or in the train are generally higher
than outdoor air (Nieuwenhuijsen et al., 2007). Referring study of IAQ in the high
speed train in Korea, it was found that the contents of PM increased when the train
stopped at the station. The increase of PM was due to air flow into the cabin train
(Cho et al. 2008). This happens because of the airflow is move from areas which has
relatively high pressure to low pressure. Therefore, one of the methods to control PM
in the train is by controlling PM level in the station. Table 2.3 shows the level of
PM10 in the Metro trains for several Cities in the world.
Table 2.3: The level of PM10 in the Metro trains for several cities in the world.
City PM10 level (µg/m
3) Reference
Range Mean
Beijing - 250 (Li et al. 2007)
Beijing 36-373 108 (Li et al. 2007)
Berlin - 147 (Fromme et al. 1998)
Guangzhou 26-123 67 (Chan et al. 2002)
Hong Kong 23-85 44 (Cheng et al. 2008)
Los Angeles 6-107 24 (Kam et al. 2011)
Prague 21-218 114 (Braniš 2006)
Seoul 144 (Park and Ha 2008)
Seoul 287-356 312 (Kim et al. 2008)
Taipei - 65 (Tsai et al. 2008)
Taipei 10-97 41 (Cheng et al. 2008)
16
2.7 Volatile Organic Compounds (VOC)
Volatile organic compounds mean that emissions gas is produced from a solid or
liquid containing chemical that are harmful to human health (Posudin et al., 2010).
The study by Posudin et al., (2010) also lists some common organic compounds such
as aromatic of hydrocarbon, aliphatic and alicyclic hydrocarbon, ketones, alcohols,
glycol ethers, esters, phenolics, chlorinated hydrocarbon, terpenes, aldehydes,
acetates and other compounds. The presence of VOCs was emanating from carpet,
wood panelling, occupants, paint, paper, clothing, floor covering, furniture and
others. VOC concentrations are dependent on conditions such as the internal
structure of the house, room climate regime, ventilation system, air velocity,
temperature, humidity and season (Volland et al., 2005). Temperature and humidity
affect the rate of gas emissions, but the ability or the strength is highly dependent on
the type of product or building material and the type of VOC (Posudin et al., 2010).
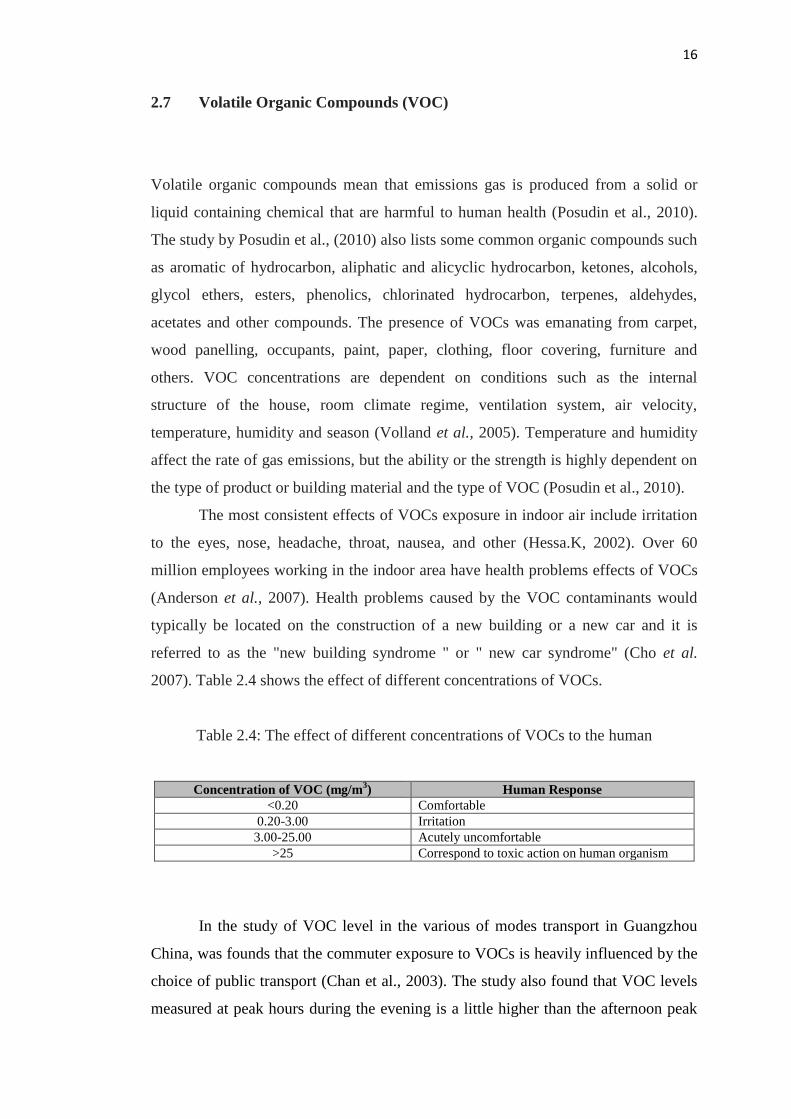
The most consistent effects of VOCs exposure in indoor air include irritation
to the eyes, nose, headache, throat, nausea, and other (Hessa.K, 2002). Over 60
million employees working in the indoor area have health problems effects of VOCs
(Anderson et al., 2007). Health problems caused by the VOC contaminants would
typically be located on the construction of a new building or a new car and it is
referred to as the "new building syndrome " or " new car syndrome" (Cho et al.
2007). Table 2.4 shows the effect of different concentrations of VOCs.
Table 2.4: The effect of different concentrations of VOCs to the human
Concentration of VOC (mg/m3) Human Response
<0.20 Comfortable
0.20-3.00 Irritation
3.00-25.00 Acutely uncomfortable
>25 Correspond to toxic action on human organism
In the study of VOC level in the various of modes transport in Guangzhou
China, was founds that the commuter exposure to VOCs is heavily influenced by the
choice of public transport (Chan et al., 2003). The study also found that VOC levels
measured at peak hours during the evening is a little higher than the afternoon peak
17
hours. This is due to the difference in the number of passengers for the two time
periods. There was also study that shows the average VOC concentration of indoor
air in winter is higher than during the summer (Sakai et al., 1999). In another study
showed higher concentrations of VOCs in newly built houses associated with
building materials and solvents used (Yamashita et al., 2001). Many substances
which produced VOCs are because of temperature effect. While for the tiles and
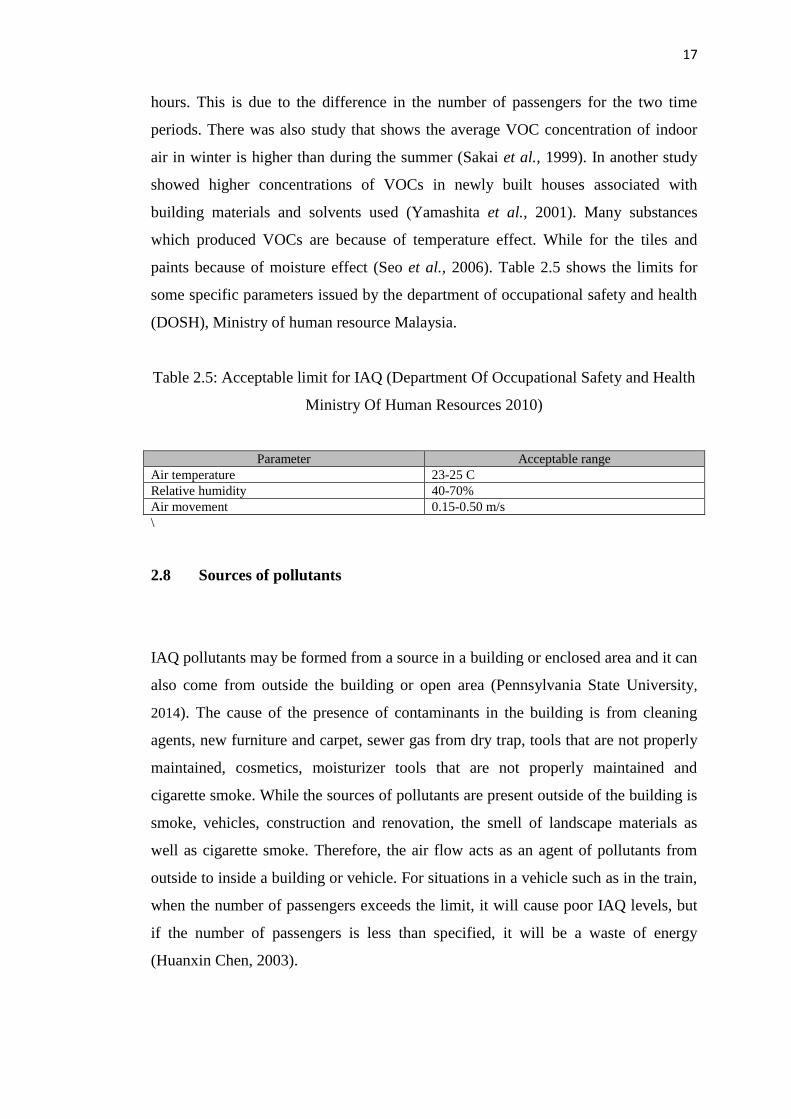
paints because of moisture effect (Seo et al., 2006). Table 2.5 shows the limits for
some specific parameters issued by the department of occupational safety and health
(DOSH), Ministry of human resource Malaysia.
Table 2.5: Acceptable limit for IAQ (Department Of Occupational Safety and Health
Ministry Of Human Resources 2010)
Parameter Acceptable range
Air temperature 23-25 C
Relative humidity 40-70%
Air movement 0.15-0.50 m/s
\
2.8 Sources of pollutants
IAQ pollutants may be formed from a source in a building or enclosed area and it can
also come from outside the building or open area (Pennsylvania State University,
2014). The cause of the presence of contaminants in the building is from cleaning
agents, new furniture and carpet, sewer gas from dry trap, tools that are not properly
maintained, cosmetics, moisturizer tools that are not properly maintained and
cigarette smoke. While the sources of pollutants are present outside of the building is
smoke, vehicles, construction and renovation, the smell of landscape materials as
well as cigarette smoke. Therefore, the air flow acts as an agent of pollutants from
outside to inside a building or vehicle. For situations in a vehicle such as in the train,
when the number of passengers exceeds the limit, it will cause poor IAQ levels, but
if the number of passengers is less than specified, it will be a waste of energy
(Huanxin Chen, 2003).
18
2.9 Technique to control IAQ
In order to maintain IAQ, it has a several method that conducted by previous
researcher. Here, it has some technique that might be applied to control IAQ in the
passenger cabin.
2.9.1 Reducing CO2 concentration
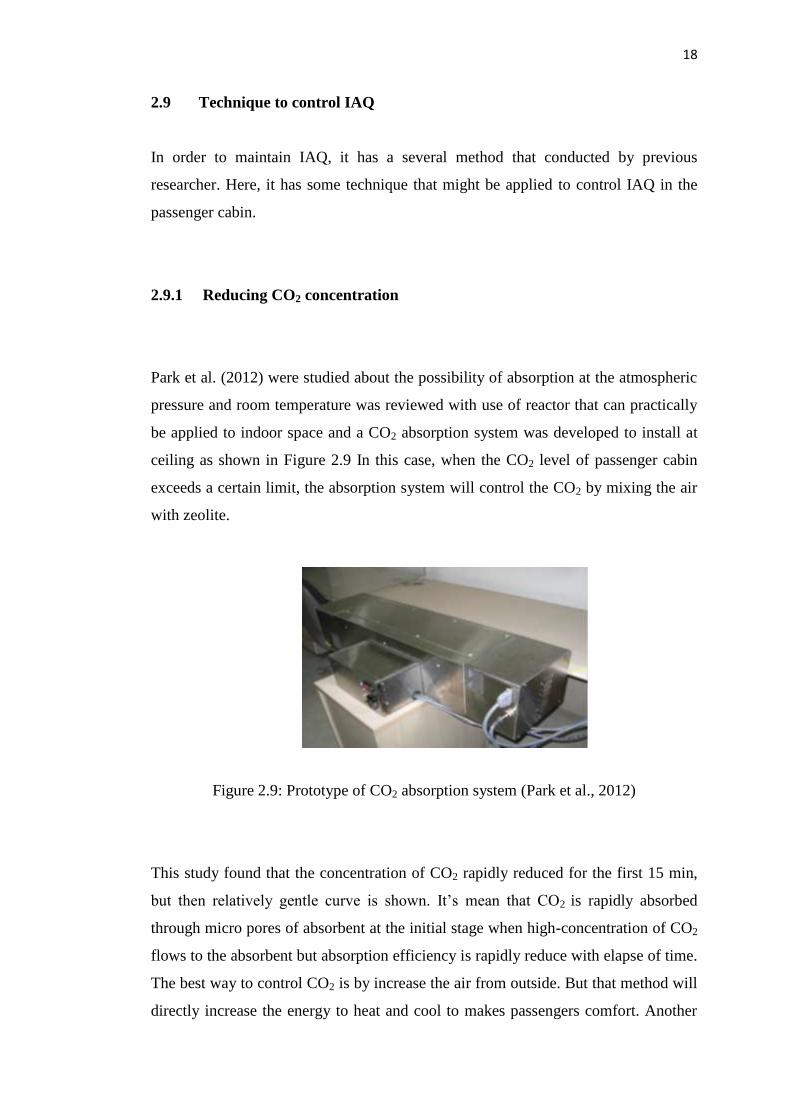
Park et al. (2012) were studied about the possibility of absorption at the atmospheric
pressure and room temperature was reviewed with use of reactor that can practically
be applied to indoor space and a CO2 absorption system was developed to install at
ceiling as shown in Figure 2.9 In this case, when the CO2 level of passenger cabin
exceeds a certain limit, the absorption system will control the CO2 by mixing the air
with zeolite.
Figure 2.9: Prototype of CO2 absorption system (Park et al., 2012)
This study found that the concentration of CO2 rapidly reduced for the first 15 min,
but then relatively gentle curve is shown. It’s mean that CO2 is rapidly absorbed
through micro pores of absorbent at the initial stage when high-concentration of CO2
flows to the absorbent but absorption efficiency is rapidly reduce with elapse of time.
The best way to control CO2 is by increase the air from outside. But that method will
directly increase the energy to heat and cool to makes passengers comfort. Another
19
method that possible to apply in other to decrease the CO2 level inside the train is by
using a specific liquid or solid material that can absorb CO2. It has a several
absorbent material that can absorb CO2 such as Zeolite, Amine, NaOH and Na2CO3.
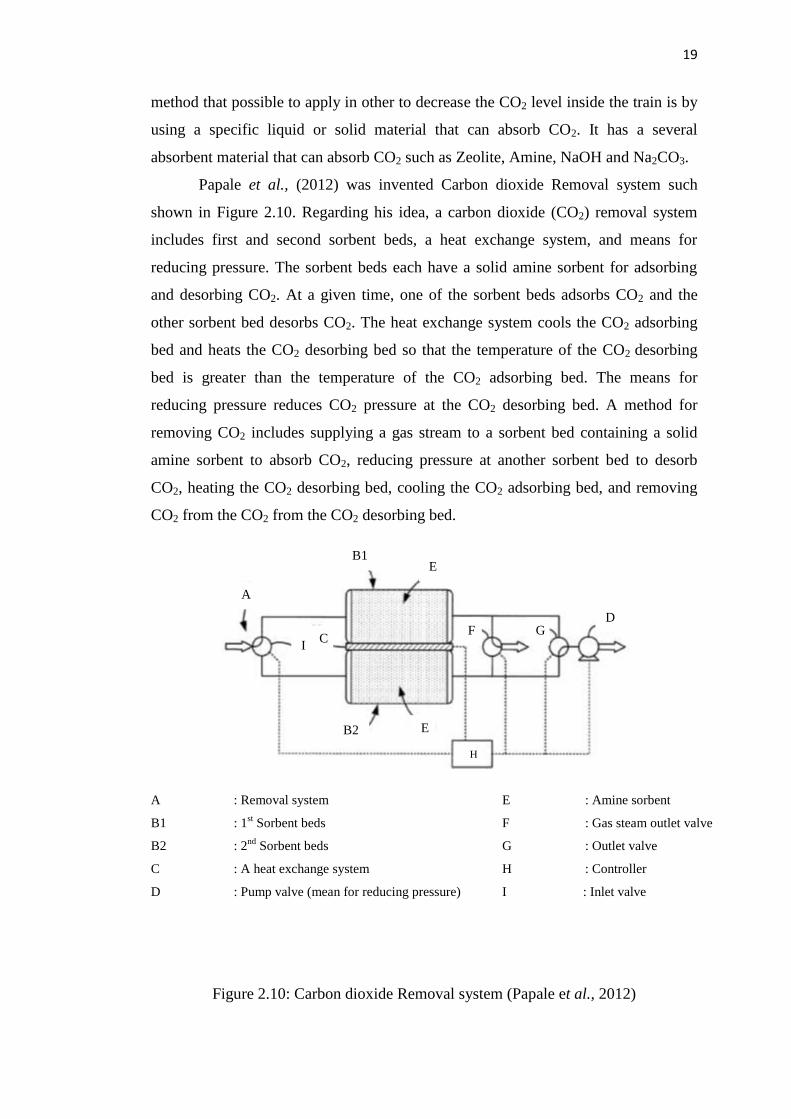
Papale et al., (2012) was invented Carbon dioxide Removal system such
shown in Figure 2.10. Regarding his idea, a carbon dioxide (CO2) removal system
includes first and second sorbent beds, a heat exchange system, and means for
reducing pressure. The sorbent beds each have a solid amine sorbent for adsorbing
and desorbing CO2. At a given time, one of the sorbent beds adsorbs CO2 and the
other sorbent bed desorbs CO2. The heat exchange system cools the CO2 adsorbing
bed and heats the CO2 desorbing bed so that the temperature of the CO2 desorbing
bed is greater than the temperature of the CO2 adsorbing bed. The means for
reducing pressure reduces CO2 pressure at the CO2 desorbing bed. A method for
removing CO2 includes supplying a gas stream to a sorbent bed containing a solid
amine sorbent to absorb CO2, reducing pressure at another sorbent bed to desorb
CO2, heating the CO2 desorbing bed, cooling the CO2 adsorbing bed, and removing
CO2 from the CO2 from the CO2 desorbing bed.
Figure 2.10: Carbon dioxide Removal system (Papale et al., 2012)
A : Removal system
B1 : 1st Sorbent beds
B2 : 2nd
Sorbent beds
C : A heat exchange system
D : Pump valve (mean for reducing pressure)
E : Amine sorbent
F : Gas steam outlet valve
G : Outlet valve
H : Controller
I : Inlet valve
A
B1
B2
C
D
E
F G
E
H
I
20
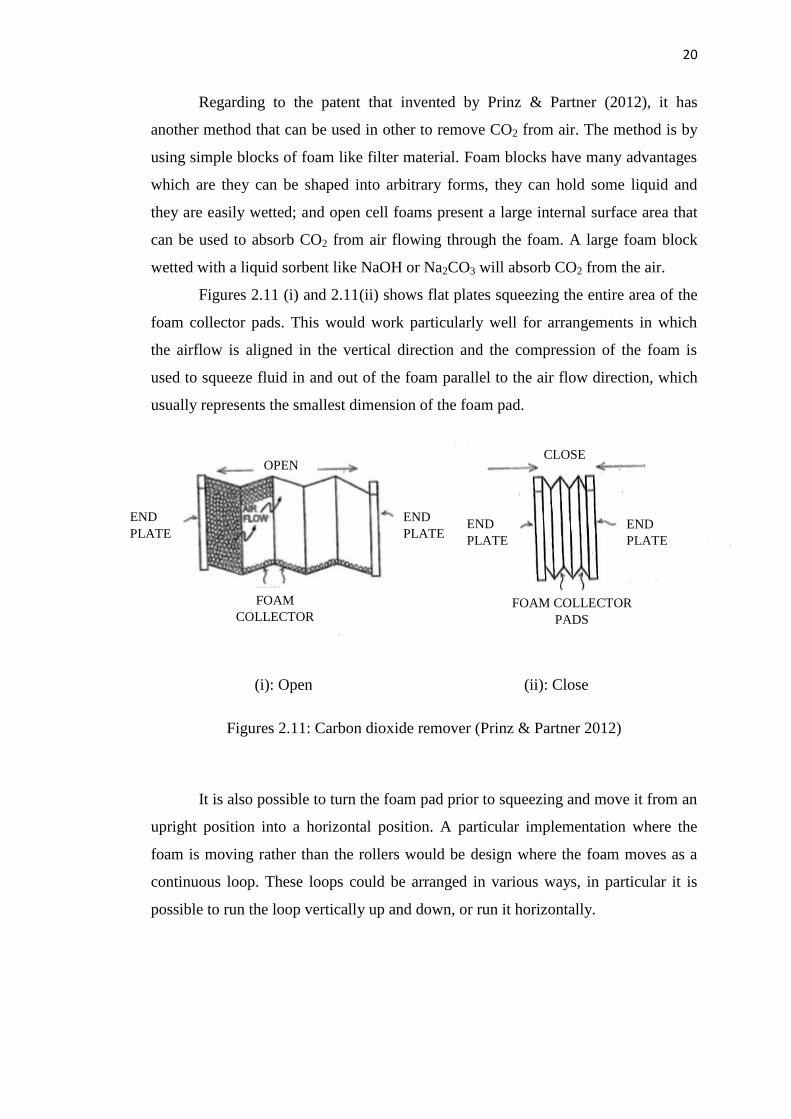
Regarding to the patent that invented by Prinz & Partner (2012), it has
another method that can be used in other to remove CO2 from air. The method is by
using simple blocks of foam like filter material. Foam blocks have many advantages
which are they can be shaped into arbitrary forms, they can hold some liquid and
they are easily wetted; and open cell foams present a large internal surface area that
can be used to absorb CO2 from air flowing through the foam. A large foam block
wetted with a liquid sorbent like NaOH or Na2CO3 will absorb CO2 from the air.
Figures 2.11 (i) and 2.11(ii) shows flat plates squeezing the entire area of the
foam collector pads. This would work particularly well for arrangements in which
the airflow is aligned in the vertical direction and the compression of the foam is
used to squeeze fluid in and out of the foam parallel to the air flow direction, which
usually represents the smallest dimension of the foam pad.
(i): Open (ii): Close
Figures 2.11: Carbon dioxide remover (Prinz & Partner 2012)
It is also possible to turn the foam pad prior to squeezing and move it from an
upright position into a horizontal position. A particular implementation where the
foam is moving rather than the rollers would be design where the foam moves as a
continuous loop. These loops could be arranged in various ways, in particular it is
possible to run the loop vertically up and down, or run it horizontally.
END
PLATE
END
PLATE END
PLATE
END
PLATE
FOAM
COLLECTOR FOAM COLLECTOR
PADS
OPEN
CLOSE
21
2.9.2 Reducing PM10
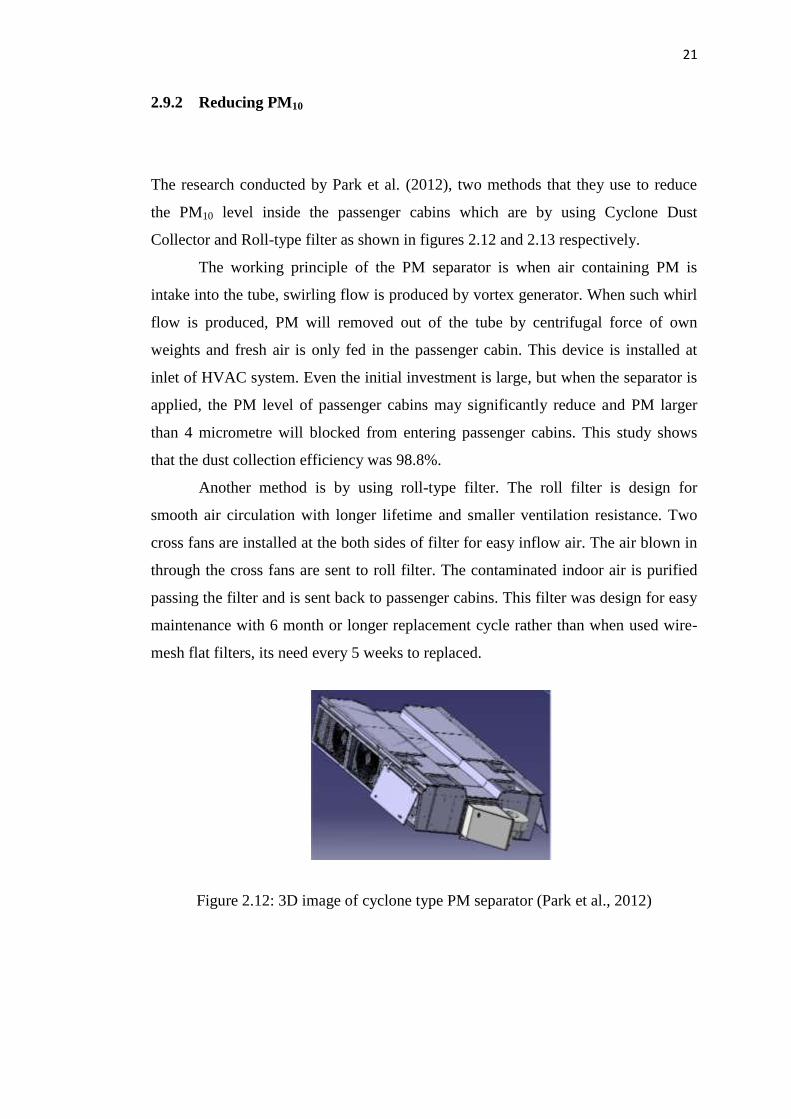
The research conducted by Park et al. (2012), two methods that they use to reduce
the PM10 level inside the passenger cabins which are by using Cyclone Dust
Collector and Roll-type filter as shown in figures 2.12 and 2.13 respectively.
The working principle of the PM separator is when air containing PM is
intake into the tube, swirling flow is produced by vortex generator. When such whirl
flow is produced, PM will removed out of the tube by centrifugal force of own
weights and fresh air is only fed in the passenger cabin. This device is installed at
inlet of HVAC system. Even the initial investment is large, but when the separator is
applied, the PM level of passenger cabins may significantly reduce and PM larger
than 4 micrometre will blocked from entering passenger cabins. This study shows
that the dust collection efficiency was 98.8%.
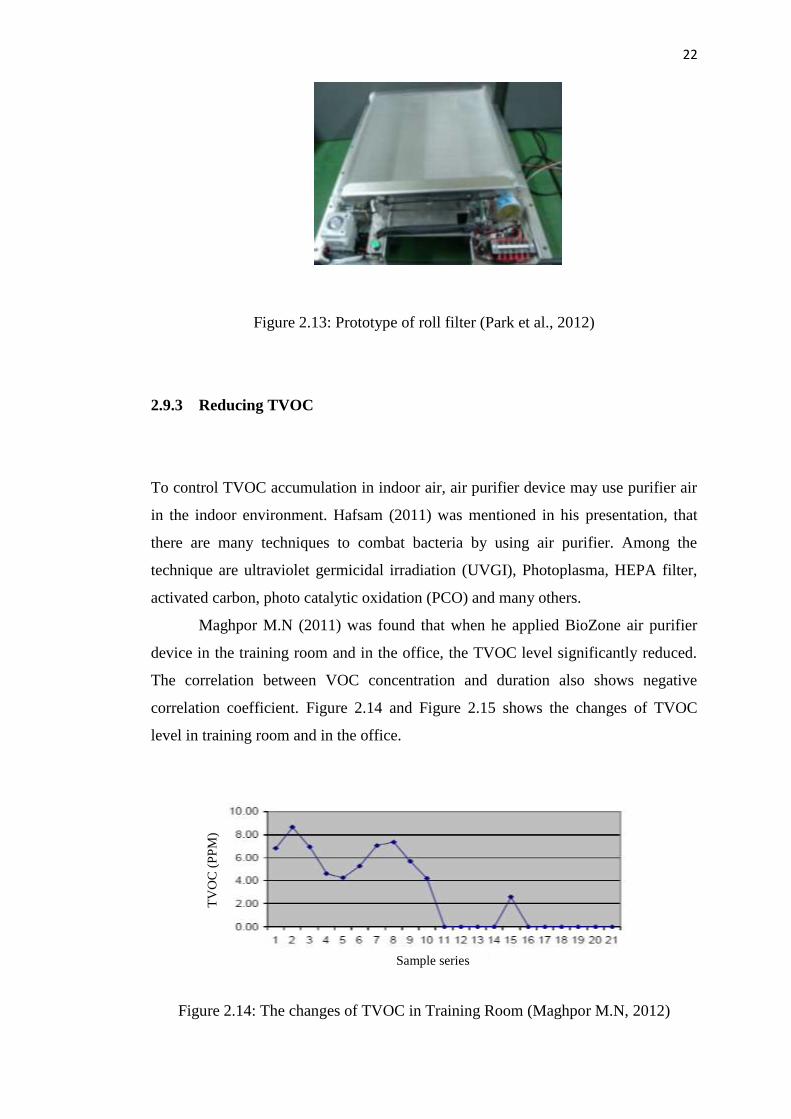
Another method is by using roll-type filter. The roll filter is design for
smooth air circulation with longer lifetime and smaller ventilation resistance. Two
cross fans are installed at the both sides of filter for easy inflow air. The air blown in
through the cross fans are sent to roll filter. The contaminated indoor air is purified
passing the filter and is sent back to passenger cabins. This filter was design for easy
maintenance with 6 month or longer replacement cycle rather than when used wire-
mesh flat filters, its need every 5 weeks to replaced.
Figure 2.12: 3D image of cyclone type PM separator (Park et al., 2012)
22
Figure 2.13: Prototype of roll filter (Park et al., 2012)
2.9.3 Reducing TVOC
To control TVOC accumulation in indoor air, air purifier device may use purifier air
in the indoor environment. Hafsam (2011) was mentioned in his presentation, that
there are many techniques to combat bacteria by using air purifier. Among the
technique are ultraviolet germicidal irradiation (UVGI), Photoplasma, HEPA filter,
activated carbon, photo catalytic oxidation (PCO) and many others.
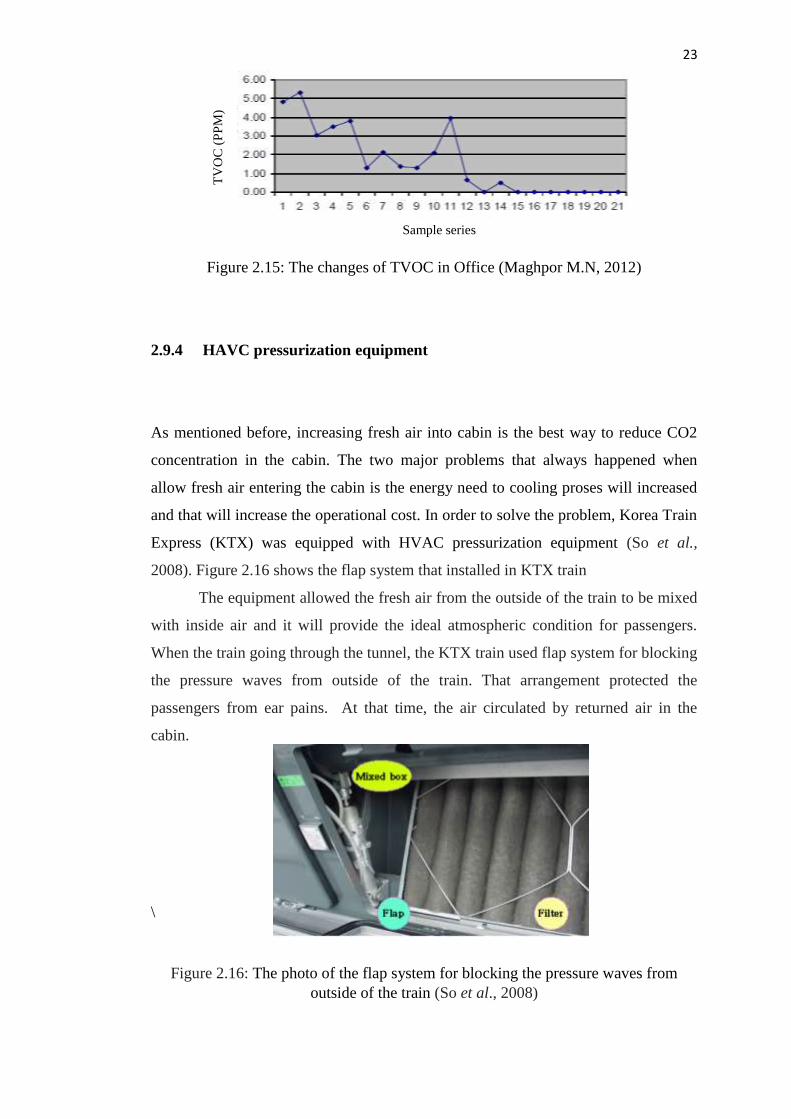
Maghpor M.N (2011) was found that when he applied BioZone air purifier
device in the training room and in the office, the TVOC level significantly reduced.
The correlation between VOC concentration and duration also shows negative
correlation coefficient. Figure 2.14 and Figure 2.15 shows the changes of TVOC
level in training room and in the office.
Figure 2.14: The changes of TVOC in Training Room (Maghpor M.N, 2012)
TV
OC
(P
PM
)
Sample series
23
Figure 2.15: The changes of TVOC in Office (Maghpor M.N, 2012)
2.9.4 HAVC pressurization equipment
As mentioned before, increasing fresh air into cabin is the best way to reduce CO2
concentration in the cabin. The two major problems that always happened when
allow fresh air entering the cabin is the energy need to cooling proses will increased
and that will increase the operational cost. In order to solve the problem, Korea Train
Express (KTX) was equipped with HVAC pressurization equipment (So et al.,
2008). Figure 2.16 shows the flap system that installed in KTX train
The equipment allowed the fresh air from the outside of the train to be mixed
with inside air and it will provide the ideal atmospheric condition for passengers.
When the train going through the tunnel, the KTX train used flap system for blocking
the pressure waves from outside of the train. That arrangement protected the
passengers from ear pains. At that time, the air circulated by returned air in the
cabin.
\
Figure 2.16: The photo of the flap system for blocking the pressure waves from
outside of the train (So et al., 2008)
TV
OC
(P
PM
) Sample series
24
CHAPTER 3
METHODOLOGY
3.1 Introduction
This chapter describes the research work to be carried out, including the types of
measuring tools used and the method of measurement. Eight parameters are involved
in this research which is physical parameters (temperature, humidity and air
movement) and chemical contaminant parameters (CO2, CO, TVOC and PM10). In
this chapter, the flow chart, equipment, and the procedure of data collection will be
discussed. The details of equipment used will be explained and the analysis
technique used in this study will be discussed. Figure 3.1 presents the flow chart of
the research.
61
REFERENCES
Anderson, S. E., Wells, J.R; Fedorowicz, A. , Butterworth, L.F.,Meade, B.J.,
Munson, (2007). Evaluation of the contact and respiratory sensation
potential of volatile organic compounds generated by the simulated indoor
air chemistry. Toxicological Science (97(2)): 355-363.
A. S. H. R. A. E. (2001). Standard 62-2001. Ventilation for acceptable indoor air
quality. Atlanta GA: American Society of Heating. Refrigeration and Air
Conditioning Engineers.
Braniš, M. (2006). The contribution of ambient sources to particulate pollution in
spaces and trains of the Prague underground transport system. Atmospheric
Environment, 40(2), 348-356.
Burnett, Pope III, C. A., R. T. (2002). Lung cancer, cardiopulmonary mortality, and
long-term exposure to fine particulate air pollution. Jama 287(9): 1132-1141.
Carvalho, A. (2013). Particulate Matter exposure assessment in underground
subway networks. 1-10.
Chan, L., W. Lau, (2003). Preliminary measurements of aromatic VOCs in public
transportation modes in Guangzhou, China. Environment International 29(4):
429-435.
Chan, L., W. Lau (2002). Exposure level of carbon monoxide and respirable
suspended particulate in public transportation modes while commuting in
urban area of Guangzhou, China. Atmospheric Environment 36(38): 5831-
5840.
Cheng, Y.-H., Y.-L. Lin (2008). Levels of PM10 and PM2.5 in Taipei Rapid Transit
System. Atmospheric Environment 42(31): 7242-7249.
Chillrud, S. N. E., .D. (2004). Elevated airbone exposure of teenagers to manganese,
chromium and iron from steeel dust and New York City's subway system.
Environmental Science & Technology(38): 732-737.
Cho, Y., S.-B. Kwon (2007). Analysis of indoor air quality in high-speed train
passenger cabin in Korea. IAQVEC 2007 proceedings–6th international
62
conference on indoor air quality, ventilation and energy conservation in
buildings: sustainable built environment 2007.
Chao, Kwon, S.-B., Y. (2008). Study on the indoor air quality of Seoul metropolitan
subway during the rush hour. Indoor and Built Environment 17(4): 361-369.
Department of Safety and Health, Ministry Of Human Resources, M. (2010).
Industry Code Of Practice On Indoor Air Quality. Investigation Process.
Malaysia: 39.
Fromme, H., A. Oddoy (1998). Polycyclic aromatic hydrocarbons (PAH) and diesel
engine emission (elemental carbon) inside a car and a subway train. Science
of the Total Environment 217(1): 165-173.
Godish, T. (1995). Sick buildings: Definition, Diagnosis and Mitigation. Boca Raton
Lewis Publisher.
Hessa-Kosa (2002). Indoor Air Quality: Sampling Methodologies. Roca-Raton-
London-New York-Washington, Lewis Publisher.
Huanxin Chen, P. Y., Xianghong Zhao (2001). Present conditions and research
countermeasures for the indoor air quality of the railway air-conditioned
passenger car. Chinese Railway 40: pp. 31-32.
Huanxin Chen, S. H. a. P. Y. (2003). Study on indoor environment in air-conditioned
trains. Interntional Journal on Architectural Science 4: p.60-72.
Hunt, E. H. and D. R. Space (1994). The airplane cabin environment. TSP 3(2):
1,000.
Jung, H.J.,Kim, B., Ryu, J.,Maskey.,S., Kim.,J.C.,Sohn,J.,Ro.,C.U. (2010). Source
identification of particulate matter collected at underground subway stations
in seoul ,Kore using quantitative single particle analysis. Atmospheric
Environment(44): 2287-2293.
Kam, W., K. Cheung (2011). Particulate matter (PM) concentrations in
underground and ground-level rail systems of the Los Angeles Metro.
Atmospheric Environment 45(8): 1506-1516.
Karlsson, H. L., L. Nilsson (2005). Subway particles are more genotoxic than street
particles and induce oxidative stress in cultured human lung cells. Chemical
research in toxicology 18(1): 19-23.
Kim, K. Y., Y. S. Kim (2008). Spatial distribution of particulate matter (PM10 and
PM2.5) in Seoul Metropolitan Subway stations. Journal of Hazardous
Materials 154(1): 440-443.
63
Kwon, S.-B., D.-S. Park (2012). Mechanical Ventilation Strategy for Subway Cabins
Using Numerical Simulations. Civil Engineering and Architecture 6(8): 1070-
1075.
Li, T.-T., Y.-H. Bai, (2007). In-train air quality assessment of the railway transit
system in Beijing: a note. Transportation Research Part D: Transport and
Environment 12(1): 64-67.
LU Hao, Z. L. (2007). Pollution survey of carbonyl compounds in train air.
Environment Science Engineering 1(1): 125-128.
Maghpor M.N (2011). Study the relationship between concentrations of airborne
TVOC with duration of application of the photo plasma air purifier. Reached
at December 28, 2014. From http://www.niosh.com.my
MOT, K. P. M. (2011). Statistik Pengangkutan. Kementerian Pengangkutan
Malaysia.
Nieuwenhuijsen, M., J. Gomez-Perales, (2007). Levels of particulate air pollution, its
elemental composition, determinants and health effects in metro systems.
Atmospheric Environment 41(37): 7995-8006.
Papale, William G.Simsbury (2012). Method and system for carbon dioxide removal.
Patent EP 2468384A1.
Park, D.-U. and K.-C. Ha (2008). Characteristics of PM10, PM2.5, CO2 and CO
monitored in interiors and platforms of subway train in Seoul, Korea.
Environment International 34(5): 629-634.
Park, D., S. Kwon (2012). Analysis of Indoor Air Quality and Development of New
Air Cleaner for Railroad Passenger Cabin.
Pennsylvania State University, E. H. S. (2014). Indoor Air Quality Standard
Procedures. Reached at December 17, 2014. From
http://www.ehs.psu.edu/workplace-safety/indoor-air-
quality/requirementsguidelines
Pope, C. A., R. T. Burnett (2004). Cardiovascular mortality and long-term exposure
to particulate air pollution epidemiological evidence of general
pathophysiological pathways of disease. Circulation 109(1): 71-77.
Posudin, Y., Ю. Посудін (2010). Volatile Organic Compounds in Indoor Air:
Scientific, Medical and Instrumental Aspects:[preprint]. 1-87.
Prinz & Partner (2012). Removal of carbon dioxide from air. Patent EP 2 409 753 A1
64
Sakai, K., Mitani., K., Tsuciya, H. (1999). Indoor air concerntration of Volatile
chlorinated organic compounds in residence in Nagoya city. Nagoya-shi
Eisei Kenkyushoho: 43-48.
Salma, I., T. Weidinger (2007). Time-resolved mass concentration, composition and
sources of aerosol particles in a metropolitan underground railway station.
Atmospheric Environment 41(37): 8391-8405.
Seo., B.-R., Kim., S.-D., Park,. S.-K. (2006). The characteristic of volatile organic
compounds (VOCs) emission from the type of indoor building materials with
regard to the temperature and humidity. Hangug Hwangeong Bogeon
Haghoeji(32(4)): 292-304.
So, J. S., & Yoo, S. Y(2008). A Research for the Indoor Air Quality Changes by
Operating HVAC pressurization equipment in the Tunnel Sections. In 8th
World Congress on Railway Research, Soul KOREA (p. 262).
Sundell, J. (1996). What we know and don't know about sick building syndrome.
ASHRAE Journal 38: pp.51-57.
Tsai, D.-H., Y.-H. Wu (2008). Comparisons of commuter's exposure to particulate
matters while using different transportation modes. Science of the Total
Environment 405(1): 71-77.
Tsairidi, E., V. D. Assimakopoulos (2013). Monitoring of Air Quality in Passenger
Cabins of the Athens Metro. EGU General Assembly Conference Abstracts.
Volland, G., Krause, G.,Hansen, D.,Zoeltzer, D. (2005). Organic pollutants in indoor
air-basic and problems. Otto Graf Journal(16): 95-109.
WHO (2010). WHO Guideline for indoor air quality: selected pollutants. Europe.
Yamashita, A., Yamura., Y., Koyama., K., Komiyama, S. (2001). Concentration of
volatile organic compounds in indoor air of private house in Nagano
Prefecture. Nagano-ken Eisi Kogai Kenkyusho Kenkyu Hokoku(24): 13-18.
Yu-Hsiang Cheng, Z.-S. L., Jhih-Wei Yan (2012). Comparisons of PM10, PM2.5,
Particle Number, and CO2 Levels inside Metro Trains Traveling in
Underground Tunnels and on Elevated Tracks. Aerosol ad Air Quality
Research: 879-891.