eem421 quality techniques (kaedah kualiti)
TRANSCRIPT
SULIT
SULIT
Second Semester Examination
2018/2019 Academic Session
June 2019
EEM421 – Quality Techniques
(Kaedah Kualiti)
Duration : 3 hours
(Masa : 3 jam)
Please check that this examination paper consists of THIRTEEN (13) pages and THREE (3) appendices page of printed material before you begin the examination. [Sila pastikan bahawa kertas peperiksaan ini mengandungi TIGA BELAS (13) muka surat dan TIGA (3) lampiran yang bercetak sebelum anda memulakan peperiksaan ini.] Instructions : This paper consists of FIVE (5) questions. Answer FIVE (5) questions. [Arahan : Kertas ini mengandungi LIMA (5) soalan. Jawab LIMA (5) soalan.] In the event of any discrepancies, the English version shall be used. [Sekiranya terdapat sebarang percanggahan pada soalan peperiksaan, versi Bahasa Inggeris hendaklah digunapakai.]
...2/-
brought to you by COREView metadata, citation and similar papers at core.ac.uk
provided by Repository@USM
SULIT EEM421
-2-
SULIT
1. The Seven Basic Quality Tools is a designation given to a fixed set of graphical
techniques identified as being most helpful in troubleshooting issues related to
quality. They are called basic because they are suitable for people with little
formal training in statistics and because they can be used to solve the vast
majority of quality-related issues.
Tujuh teknik asas kualiti ialah sebuah penunjukan yang diberikan kepada satu
set teknik graf yang dikenal pasti paling berguna untuk menyelesaikan masalah
berkaitan kualiti. Teknik-teknik tersebut disebut asas kerana sesuai dengan
mereka yang mempunyai latihan statistik formal yang sedikit dan boleh
digunakan untuk menyelesaikan majoriti isu-isu kualiti.
(a) List three basic quality tools that can be used to identify the main
problem of a general quality-related issue, and describe each of them.
Senaraikan tiga teknik asas kualiti yang boleh digunakan untuk
mengenal pasti masalah utama sebuah isu berkaitan kualiti yang umum,
dan terangkan setiap teknik tersebut.
(30 marks/markah)
(b) The G Electronic Company has just produced a new motion sensor for
GSM-based home security system. Before the product is released to the
market, it has to undergo some quality control and testing. An
experiment has been designed to estimate the “HIGH” state duration of
the sensor when a human walks towards it. Several trials have been
done and all the durations have been recorded in Table 1.
Syarikat G Electronic baru sahaja menghasilkan pengesan gerakan
baharu untuk sistem keselamatan rumah berasaskan GSM. Sebelum
produk tersebut dikeluarkan ke pasaran, ia perlu melalui beberapa
kawalan kualiti dan ujian. Sebuah eksperimen telah direka untuk
menganggarkan tempoh keadaan “TINGGI” pengesan tersebut apabila
seorang manusia berjalan ke arahnya. Beberapa percubaan telah
dilakukan dan kesemua tempoh tersebut telah direkod di dalam Jadual
1.
...3/-

SULIT EEM421
-3-
SULIT
4.51 8.5 4.19 2.29
5.96 3.49 2.25 3.45
4.89 5.25 5.36 6.3
7.28 5.25 4.29 5.25
3.96 6.79 4.66 6.5
8.22 2.56 5.25 3.33
5.55 4.90 6.10 2.49
5.25 5.40 6.5 5.25
4.10 6.11 5.25 4.56
5.70 5.25 5.00 5.25
Table 1: Duration of “HIGH” state in seconds.
Jadual 1: Tempoh keadaan “TINGGI” dalam saat.
Use a suitable basic quality tool that can help the company to see the
performance of the new sensor, and describe how the company can use
the data to complete its datasheet.
Gunakan satu teknik asas kualiti yang sesuai yang dapat membantu
syarikat tersebut melihat prestasi pengesan baharu tersebut, dan
terangkan bagaimana syarikat itu boleh menggunakan data tersebut
untuk melengkapkan lembaran data pengesan tersebut.
(35 marks/markah)
(c) What is the capability index for Six-Sigma process? Support your
answer by drawing appropriate figure and explain why it is useful.
Apakah indeks kebolehan untuk proses Six-Sigma? Sokong jawapan
anda dengan melukis rajah yang bersesuaian dan terangkan kenapa ia
berguna.
(10 marks/markah) (d) Tolerances for a capacitor are 70 pF +/- .01 pF. The current process
produces capacitors with a mean capacitance of 70.001 pF and a
population standard deviation of 0.004 pF. The process population is
normally distributed.
Toleransi sebuah kapasitor adalah 70 pF +/- .01 pF. Proses semasa
menghasilkan kapasitor dengan purata 70.001 pF dengan sisihan
piawai 0.004 pF. Proses tersebut mempunyai taburan normal.
...4/-

SULIT EEM421
-4-
SULIT
(i) Is the process capable?
Adakah proses tersebut berkebolehan? (5 marks/markah)
(ii) What proportion will meet specifications? Sketch the distribution
to visualize your answer.
Berapakan bahagian yang memenuhi spesifikasi?Lakarkan
taburan tersebut untuk menggambarkan jawapan anda.
(20 marks/markah) 2. (a) Assume that you are part of a team project working on a software, and
you have written a C++ code as shown in Figure 2.1.
Andaikan anda adalah sebahagian daripada kumpulan projek yang
sedang membuat perisian, dan anda telah menulis kod C++ seperti yang
ditunjukkan di dalam Rajah 2.1.
#include <iostream>
using namespace std;
int d;
int main ()
{
for( int a = 1, b = 10, c = 1 ; a < 10; a = a + 1, b = b - 1, c = c * 2 )
{
cout << "value of b: " << b << endl;
cout << "value of c: " << c << endl;
if (b<=5)
{
d=b^2;
}
else
{
d=0;
}
cout << "value of d: " << d << endl;
}
return 0;
}
Figure 2.1: The code
Rajah 2.1: Kod
...5/-

SULIT EEM421
-5-
SULIT
Describe how you can explain the code via one of the basic quality tools
to your other team members who know nothing about the programming,
and show the corresponding output of the code.
Perincikan bagaimana anda boleh menerangkan kod tersebut melalui
salah satu teknik asas kualiti kepada ahli-ahli kumpulan yang lain yang
tidak tahu berkenaan pengaturcaraan, dan tunjukkan keluaran yang
berkaitan dengan kod tersebut.
(40 marks/markah)
(b) A company manager wishes to find out whether there is a relationship
between the age of his employees and number of sick days they take
each year. The data for the sample are shown in Table 2.1.
Seorang pengurus sebuah syarikat hendak mengetahui hubungan
antara umur pekerja-pekerjanya dan bilangan hari cuti sakit yang
diambil setiap tahun. Data untuk sampel tersebut ditunjukkan di dalam
Jadual 2.1.
Employee Age (years) Number of Sick Days
1 25 16
2 30 11
3 29 15
4 40 7
5 27 15
6 35 9
7 39 8
8 26 13
9 42 7
10 50 5
11 49 6
12 43 8
13 31 14
14 34 12
15 25 16
Table 2.1: Sick Leave Data from 15 employees
Jadual 2.1: Data hari cuti sakit daripada 15 pekerja
...6/-
SULIT EEM421
-6-
SULIT
Use an appropriate basic quality tool to graphically show the relationship
between the age of the employes and the number of sick days, and
calculate the correlation between the two.
Gunakan satu teknik asas kualiti yang sesuai untuk menggambarkan
hubungan melalui graf antara umur dan bilangan hari sakit, dan kirakan
korelasi antara keduanya.
(30 marks/markah)
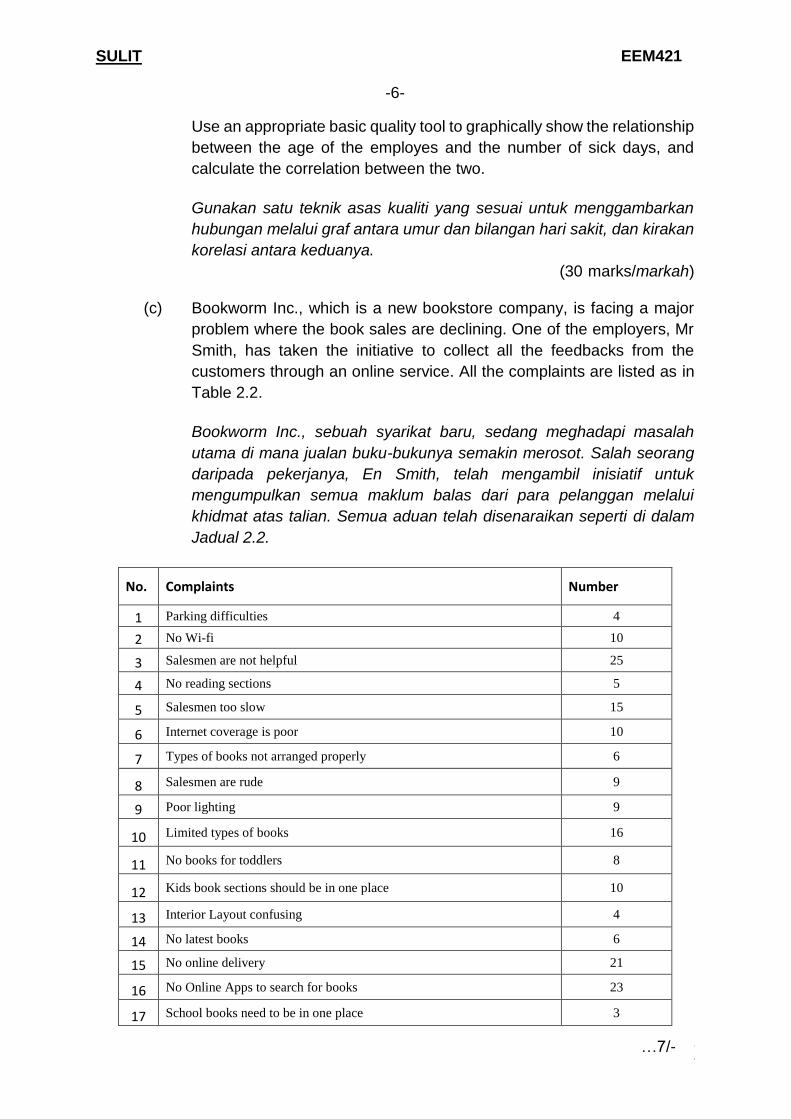
(c) Bookworm Inc., which is a new bookstore company, is facing a major
problem where the book sales are declining. One of the employers, Mr
Smith, has taken the initiative to collect all the feedbacks from the
customers through an online service. All the complaints are listed as in
Table 2.2.
Bookworm Inc., sebuah syarikat baru, sedang meghadapi masalah
utama di mana jualan buku-bukunya semakin merosot. Salah seorang
daripada pekerjanya, En Smith, telah mengambil inisiatif untuk
mengumpulkan semua maklum balas dari para pelanggan melalui
khidmat atas talian. Semua aduan telah disenaraikan seperti di dalam
Jadual 2.2.
No. Complaints Number
1 Parking difficulties 4
2 No Wi-fi 10
3 Salesmen are not helpful 25
4 No reading sections 5
5 Salesmen too slow 15
6 Internet coverage is poor 10
7 Types of books not arranged properly 6
8 Salesmen are rude 9
9 Poor lighting 9
10 Limited types of books 16
11 No books for toddlers 8
12 Kids book sections should be in one place 10
13 Interior Layout confusing 4
14 No latest books 6
15 No online delivery 21
16 No Online Apps to search for books 23
17 School books need to be in one place 3
…7/-
SULIT EEM421
-7-
SULIT
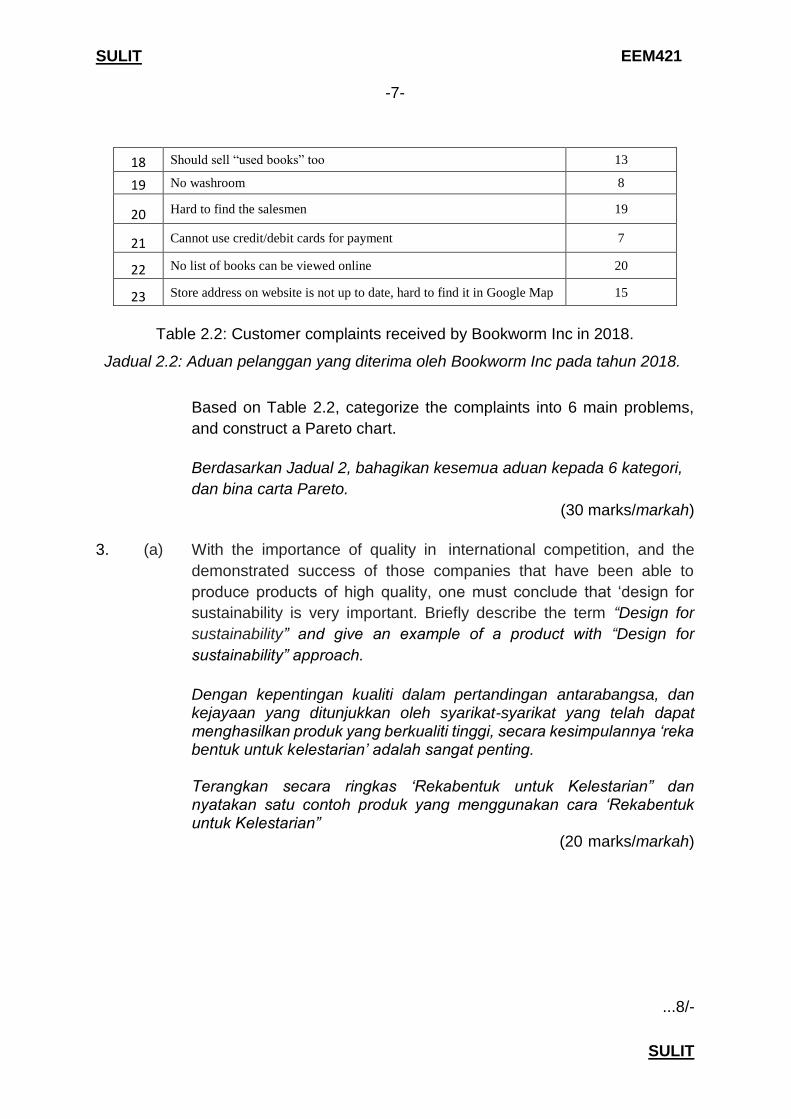
18 Should sell “used books” too 13
19 No washroom 8
20 Hard to find the salesmen 19
21 Cannot use credit/debit cards for payment 7
22 No list of books can be viewed online 20
23 Store address on website is not up to date, hard to find it in Google Map 15
Table 2.2: Customer complaints received by Bookworm Inc in 2018.
Jadual 2.2: Aduan pelanggan yang diterima oleh Bookworm Inc pada tahun 2018.
Based on Table 2.2, categorize the complaints into 6 main problems,
and construct a Pareto chart.
Berdasarkan Jadual 2, bahagikan kesemua aduan kepada 6 kategori,
dan bina carta Pareto.
(30 marks/markah)
3. (a) With the importance of quality in international competition, and the
demonstrated success of those companies that have been able to
produce products of high quality, one must conclude that ‘design for
sustainability is very important. Briefly describe the term “Design for
sustainability” and give an example of a product with “Design for
sustainability” approach.
Dengan kepentingan kualiti dalam pertandingan antarabangsa, dan kejayaan yang ditunjukkan oleh syarikat-syarikat yang telah dapat menghasilkan produk yang berkualiti tinggi, secara kesimpulannya ‘reka bentuk untuk kelestarian’ adalah sangat penting. Terangkan secara ringkas ‘Rekabentuk untuk Kelestarian” dan nyatakan satu contoh produk yang menggunakan cara ‘Rekabentuk untuk Kelestarian”
(20 marks/markah)
...8/-

SULIT EEM421
-8-
SULIT
(b) Product development is an interdisciplinary activity requiring contribution
from the three functions in design and development aspects. Identify the
two functions in product design and development. Then, suggest an
example of a product and describe its process planning.
Pembangunan produk adalah aktiviti interdisiplin yang memerlukan
sumbangan daripada tiga fungsi dalam aspek reka bentuk dan
pembangunan. Kenal pasti dua fungsi dalam reka bentuk dan
pembangunan produk. Kemudian, cadangkan satu contoh produk dan
huraikan proses perancangan bagi produk tersebut.
(40 marks/markah)
(c) Design for manufacturing and assembly is an approach to product
design that systematically includes considerations of manufacturability
and assemblability in the design. Design for Manufacturing (DFM) and
design for assembly (DFA), DFM/A also includes principles and
guidelines that indicate how to design a given product for maximum
manufacturability. Identify the three differences and three similarities
between DFA and DFM in manufacturing.
Reka bentuk dalam pembuatan dan pemasangan adalah satu
pendekatan untuk merekabentuk produk yang sistematik termasuk
pertimbangan keupayaan pembuatan dan kebolehan penggabungan
dalam reka bentuk. Design untuk Pembuatan (DFM) dan reka bentuk
untuk pemasangan (DFA), DFM / A juga merangkumi prinsip dan garis
panduan yang menunjukkan bagaimana untuk merekabentuk produk
yang diberikan untuk keupayaan pembuatan yang maksimum. Kenal
pasti tiga perbezaan dan tiga persamaan antara DFA dan DFM dalam
pembuatan.
(30 marks/markah)
Figure 3.1: Foldable bicycle
Rajah 3.1: Basikal lipat.
…9/-
SULIT EEM421
-9-
SULIT
(d) Figure 3.1 shows a ‘foldable bicycle’. Suggest how it might be
manufactured based on principle in design manufacturing and
assembly.
Rajah 3.1 menunjukkan basikal lipat. Cadangkan bagaimana ia
diperbuat berdasarkan prinsip dalam rekabentuk pembuatan dan
pemasangan.
(10 marks/markah)
4. (a) What is Normal Distribution (Gauss Distribution)?
Apakah Taburan Normal (Taburan Gauss) (8 marks/markah)
(b) Identify four characteristics of Normal Distribution
Kenalpastikan empat ciri-ciri Pengedaran Normal
(8 marks/markah)
(c) Describe the importance of central limit theorem?
Terangkan kepentingan teorem had pusat (4 marks/markah)
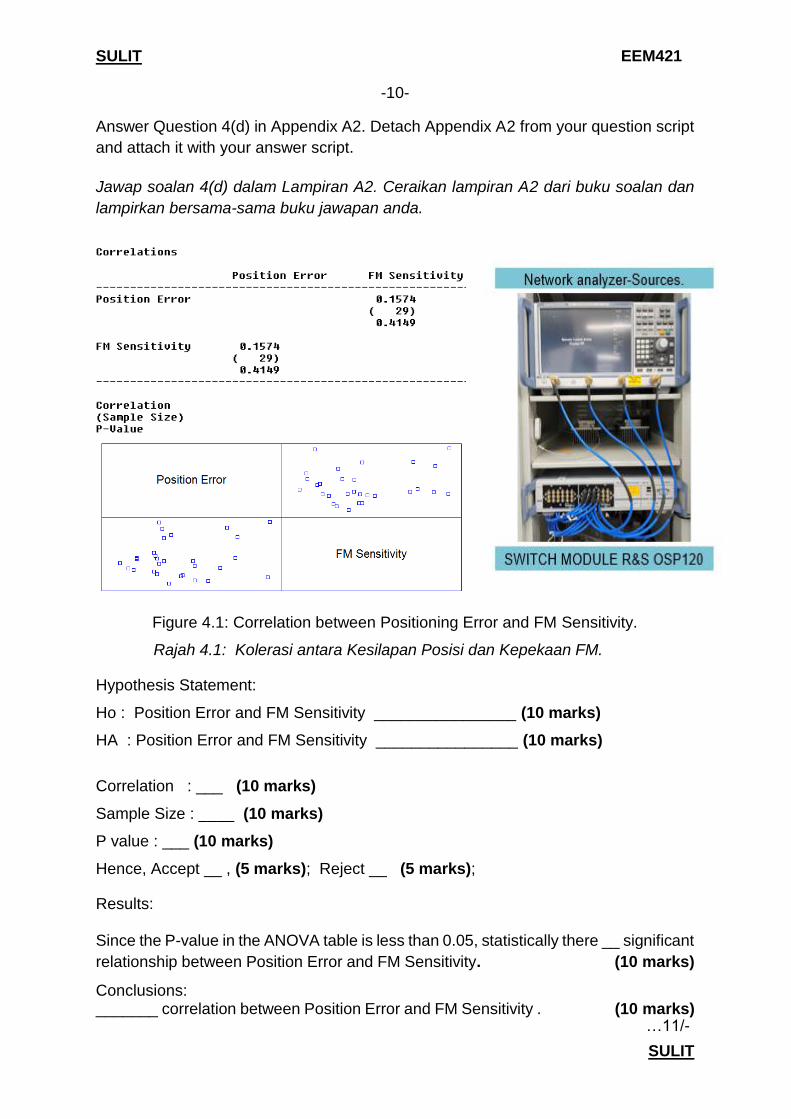
(d) An Electrical Engineer would like to understand Probing Test failure due
to Co-planarity issue when he opens the unit for Failure Analysis. He
would like to comprehend the Correlation between Positioning Error and
FM Sensitivity. After data collection as in Figure 4.1, he continued to
perform Pearson Correlation and gotten results.
Please complete the analysis and draw the conclusion.
Seorang Jurutera Elektrik ingin memahami kegagalan Ujian Probing
kerana isu Co-planarity, ketika ia membuka unit untuk Analisis
Kegagalan. Kemudian, beliau ingin memahami kedua-dua Korelasi
antara Kesilapan Posisi dan Kepekaan FM. Selepas pengumpulan data,
beliau terus melakukan Korelasi Pearson dan mendapat keputusan
seperti Rajah 4.1
Selesaikan analisis dan membuat kesimpulan .
(80 marks/markah)
...10/-
SULIT EEM421
-10-
SULIT
Answer Question 4(d) in Appendix A2. Detach Appendix A2 from your question script
and attach it with your answer script.
Jawap soalan 4(d) dalam Lampiran A2. Ceraikan lampiran A2 dari buku soalan dan
lampirkan bersama-sama buku jawapan anda.
Figure 4.1: Correlation between Positioning Error and FM Sensitivity.
Rajah 4.1: Kolerasi antara Kesilapan Posisi dan Kepekaan FM.
Hypothesis Statement:
Ho : Position Error and FM Sensitivity ________________ (10 marks)
HA : Position Error and FM Sensitivity ________________ (10 marks)
Correlation : ___ (10 marks)
Sample Size : ____ (10 marks)
P value : ___ (10 marks)
Hence, Accept __ , (5 marks); Reject __ (5 marks);
Results: Since the P-value in the ANOVA table is less than 0.05, statistically there __ significant
relationship between Position Error and FM Sensitivity. (10 marks)
Conclusions: _______ correlation between Position Error and FM Sensitivity . (10 marks)
…11/-

SULIT EEM421
-11-
SULIT
5. A PCB Design and Validation Engineer would like to evaluate LED from
OSRAM (O) and Lumileds (X) on the designed Printed Circuit Board for latest
iPhone 6G Series as in Figure 5.1. The engineer had sampled 36 pieces of
LEDs each and ran experiment with both suppliers’ LEDs on the PCB Layout.
Results from the experiment using Minitab Software and fill in the blanks
Seorang Jurutera Rekabentuk dan Pengesahan PCB ingin menilai LED dari
OSRAM (O) dan Lumileds (X) pada Papan Litar Bercetak yang direka untuk
Siri iPhone 6G yang terkini seperti dalam Rajah 5.1. Jurutera mempunyai
sampel sebanyak 36 buah LED dan menjalankan eksperimen dengan kedua-
dua pembekal LED pada permukaan PCB.
Hasil daripada eksperimen dengan menggunakan Perisian Minitab dan isikan
tempat kosong
(100 marks/markah)
Figure 5.1: Printed Circuit Board designed for latest iPhone 6G Series
Rajah 5.1: Papan Litar Bercetak yang direka untuk iPhone 6G Series terbaru.
…12/-
SULIT EEM421
-12-
SULIT
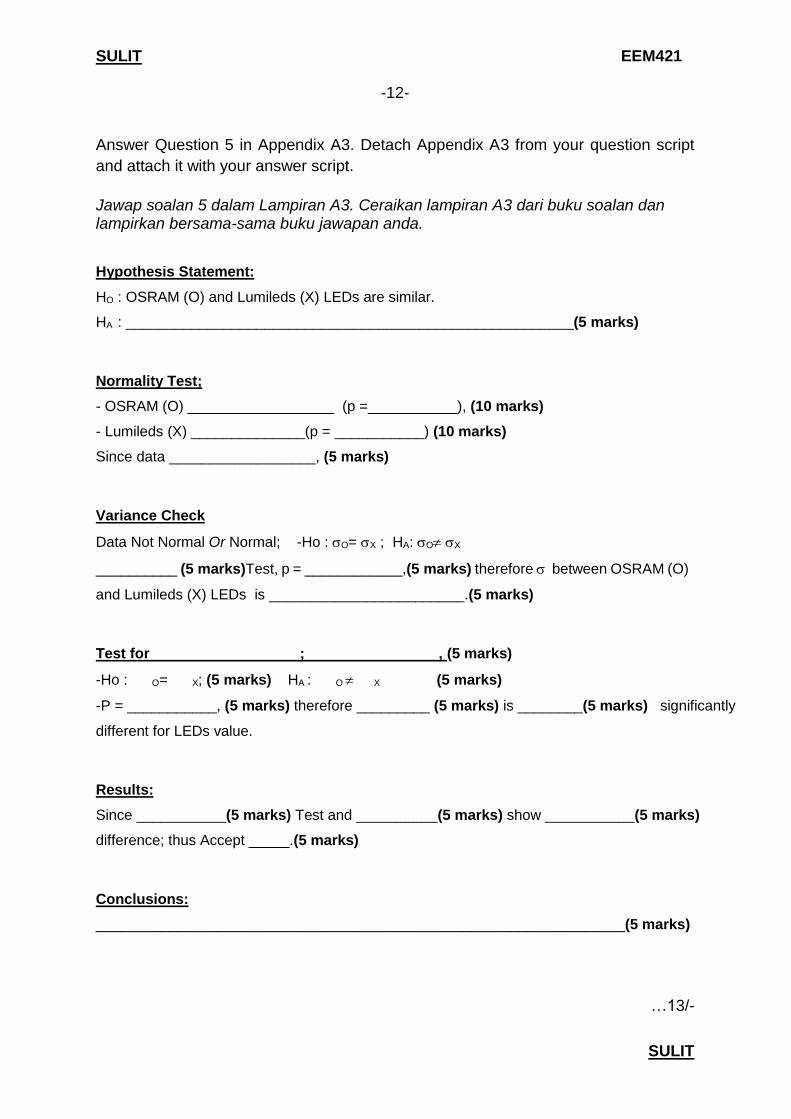
Answer Question 5 in Appendix A3. Detach Appendix A3 from your question script
and attach it with your answer script.
Jawap soalan 5 dalam Lampiran A3. Ceraikan lampiran A3 dari buku soalan dan lampirkan bersama-sama buku jawapan anda.
Hypothesis Statement:
HO : OSRAM (O) and Lumileds (X) LEDs are similar.
HA : _______________________________________________________(5 marks)
Normality Test;
- OSRAM (O) __________________ (p =___________), (10 marks)
- Lumileds (X) ______________(p = ___________) (10 marks)
Since data __________________, (5 marks)
Variance Check
Data Not Normal Or Normal; -Ho : O= X ; HA: O X
__________ (5 marks)Test, p = ____________,(5 marks) therefore between OSRAM (O)
and Lumileds (X) LEDs is ________________________.(5 marks)
Test for ; , (5 marks)
-Ho : O= X; (5 marks) HA : O X (5 marks)
-P = ___________, (5 marks) therefore _________ (5 marks) is ________(5 marks) significantly
different for LEDs value.
Results:
Since ___________(5 marks) Test and __________(5 marks) show ___________(5 marks)
difference; thus Accept _____.(5 marks)
Conclusions:
_________________________________________________________________(5 marks)
…13/-

SULIT EEM421
-13-
SULIT
Hypothesis Statement:
HO : OSRAM (O) and Lumileds (X) LEDs are
similar.
HA :
____________________________________________________________(5 marks)
-oooOooo-
Tests for Normality for OSRAM
AD 0.492 P-Value 0.205
RJ 0.982 P-Value >0.100
KS 0.132 P-Value 0.114
Computed Chi-Square goodness-of-fit statistic = 10.2222
P-Value = 0.675669
Z score for skewness = 0.92107
P-Value = 0.357012
Z score for kurtosis = -0.636429
P-Value = 0.524494
Tests for Normality for Lumileds
AD 0.412 P-Value 0.324
RJ 0. 983 P-Value >0.100
KS 0.110 -Value >0.150
Computed Chi-Square goodness-of-fit statistic = 21.7778
P-Value = 0.0589021
Z score for skewness = 1.07095
P-Value = 0.284192
Z score for kurtosis = 0.0801172
P-Value = 0.936139
Test for Equal Variances: OSRAM, Lumileds Method
Null hypothesis All variances are equal
Alternative hypothesis At least one variance is different
Significance level α = 0.05
95% Bonferroni Confidence Intervals for Standard
Deviations
Sample N StDev CI
OSRAM 36 1.50851 (1.20949, 2.00639)
Lumileds 36 1.48872 (1.15782, 2.04128)
Individual confidence level = 97.5%
Method Statistic P-Value
Multiple comparisons 0.01 0.934
Levene 0.03 0.870
Two-Sample T-Test and CI: OSRAM, Lumileds
Two-sample T for OSRAM vs Lumileds
N Mean StDev SE Mean
OSRAM 36 18.43 1.51 0.25
Lumileds 36 18.41 1.49 0.25
Difference = μ (OSRAM) - μ (Lumileds)
Estimate for difference: 0.017
95% CI for difference: (-0.688, 0.721)
T-Test of difference = 0 (vs ≠): T-Value = 0.05 P-Value =
0.963 DF = 70
Both use Pooled StDev = 1.4986 (assume equal variance)
Two-Sample T-Test and CI: OSRAM, Lumileds
Two-sample T for OSRAM vs Lumileds
N Mean StDev SE Mean
OSRAM 36 18.43 1.51 0.25
Lumileds 36 18.41 1.49 0.25
Difference = μ (OSRAM) - μ (Lumileds)
Estimate for difference: 0.017
95% CI for difference: (-0.688, 0.721)
T-Test of difference = 0 (vs ≠): T-Value = 0.05
P-Value = 0.963 DF = 69Mann
Mann-Whitney Test and CI: OSRAM, Lumileds N Median
OSRAM 36 18.210
Lumileds 36 18.310
Point estimate for η1 - η2 is -0.000
95.1 Percent CI for η1 - η2 is (-0.650,0.700)
W = 1314.5
Test of η1 = η2 vs η1 ≠ η2 is significant at 1.0000
The test is significant at 1.0000 (adjusted for ties)
Test for Equal Variances: OSRAM, Lumileds Method
Null hypothesis All variances are equal
Alternative hypothesis At least one variance is different
Significance level α = 0.05
F method is used. This method is accurate for normal data
only.
95% Bonferroni Confidence Intervals for Standard
Deviations
Sample N StDev CI
OSRAM 36 1.50851 (1.18872, 2.04887)
Lumileds 36 1.48872 (1.17312, 2.02198)
Individual confidence level = 97.5%
Method Statistic P-Value
F 1.03 0.938
SULIT EEM421
-14-
SULIT
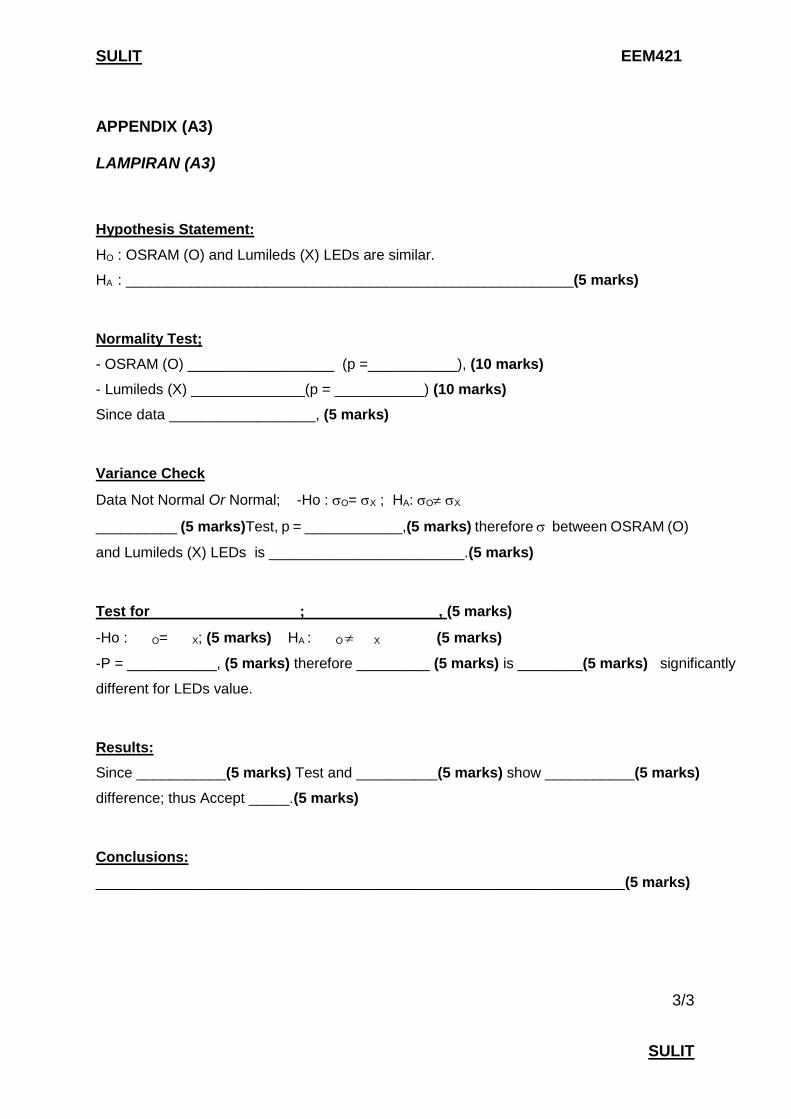
APPENDIX (A3)
LAMPIRAN (A3)
Hypothesis Statement:
HO : OSRAM (O) and Lumileds (X) LEDs are similar.
HA : _______________________________________________________(5 marks)
Normality Test;
- OSRAM (O) __________________ (p =___________), (10 marks)
- Lumileds (X) ______________(p = ___________) (10 marks)
Since data __________________, (5 marks)
Variance Check
Data Not Normal Or Normal; -Ho : O= X ; HA: O X
__________ (5 marks)Test, p = ____________,(5 marks) therefore between OSRAM (O)
and Lumileds (X) LEDs is ________________________.(5 marks)
Test for ; , (5 marks)
-Ho : O= X; (5 marks) HA : O X (5 marks)
-P = ___________, (5 marks) therefore _________ (5 marks) is ________(5 marks) significantly
different for LEDs value.
Results:
Since ___________(5 marks) Test and __________(5 marks) show ___________(5 marks)
difference; thus Accept _____.(5 marks)
Conclusions:
_________________________________________________________________(5 marks)
3/3
SULIT EEM421
-15-
SULIT
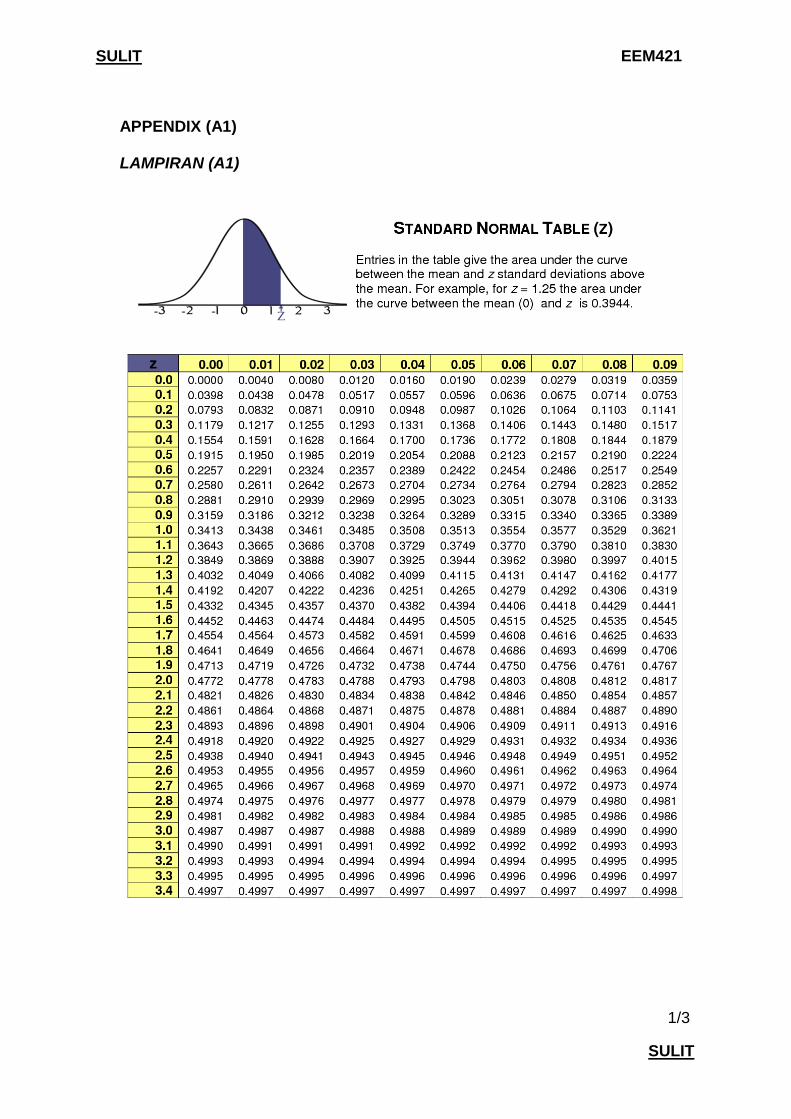
APPENDIX (A1) LAMPIRAN (A1)
1/3
SULIT EEM421
-16-
SULIT
APPENDIX (A2)
LAMPIRAN (A2)
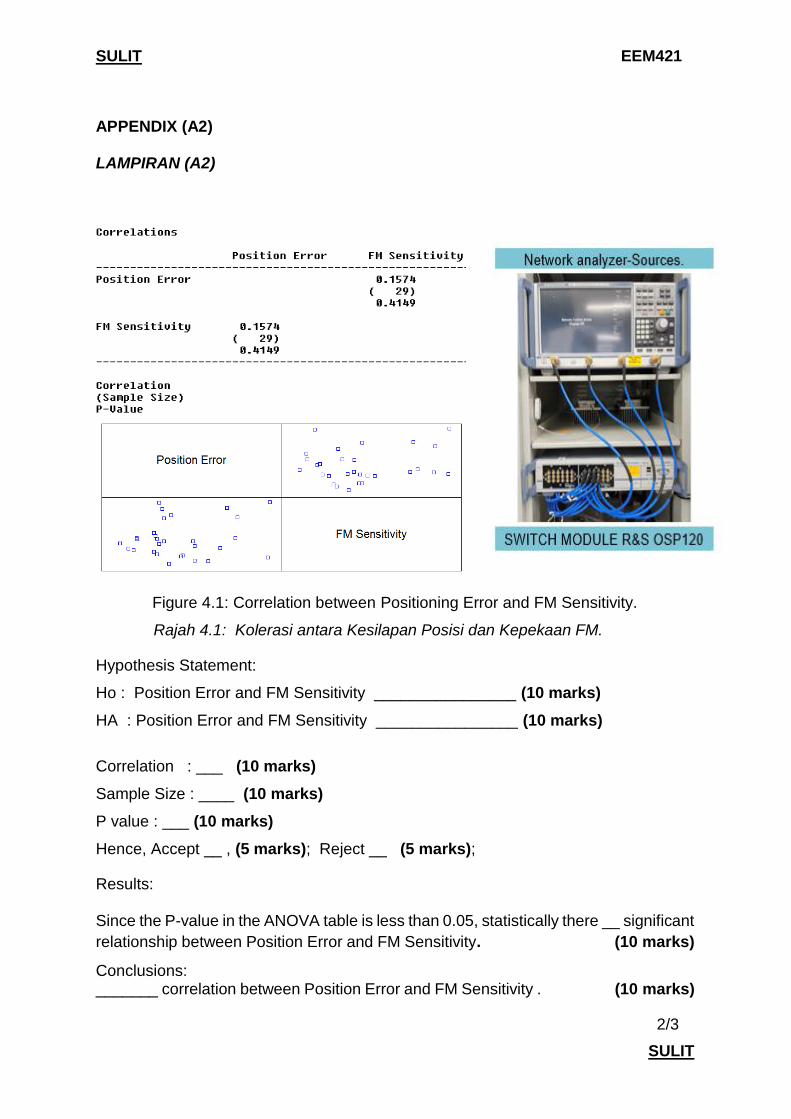
Figure 4.1: Correlation between Positioning Error and FM Sensitivity.
Rajah 4.1: Kolerasi antara Kesilapan Posisi dan Kepekaan FM.
Hypothesis Statement:
Ho : Position Error and FM Sensitivity ________________ (10 marks)
HA : Position Error and FM Sensitivity ________________ (10 marks)
Correlation : ___ (10 marks)
Sample Size : ____ (10 marks)
P value : ___ (10 marks)
Hence, Accept __ , (5 marks); Reject __ (5 marks);
Results: Since the P-value in the ANOVA table is less than 0.05, statistically there __ significant
relationship between Position Error and FM Sensitivity. (10 marks)
Conclusions: _______ correlation between Position Error and FM Sensitivity . (10 marks)
2/3