pengenalan asas gc
TRANSCRIPT

PENGENALAN ASAS GAS
CHROMATOGRAPHY
OLEH:ISMAIL IBRAHIM PPN, PJK

Kenapa sampel yang bercampur boleh diasingkan?
Dasar sungai
Arah aliran
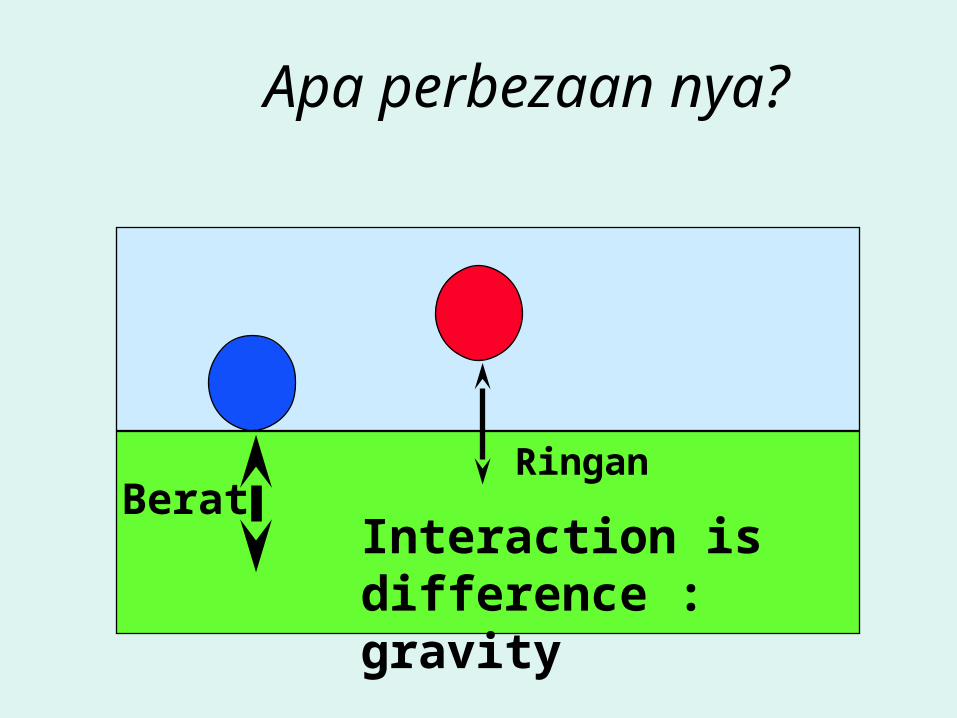
Apa perbezaan nya?
Interaction is difference : gravity
BeratRingan

Bagaimana pengasingan boleh Bagaimana pengasingan boleh dilakukan?dilakukan?
• Pengasingan dapat dilakukan oleh turus/ column.
packing material, 3-5um
Turus/column

BAGAIMANA PEMISAHAN TERJADI DALAM KROMATOGRAFI
• Pemisahan berlaku hasil dari interaksi sebatian sasaran (“target compound” dengan fasa pegun (“stationary phase”) yang berbeza di antara satu dengan lain.

Proses kromatografi melibatkan dua fasa
• Fasa Pegun (“Stationary Phase”)
Fasa Bergerak (“Mobile Phase”)
Kenapa sampel yang bercampur dapat
dipisahkan ?
• Kerana sifat tiap sampel (compound) adalah berbeza.

PEMISAHAN
• Pemisahan terhasil dari persaingan daya molekul-molekul fasa gerak dan fasa pegun menarik atau menolak molekul sampel
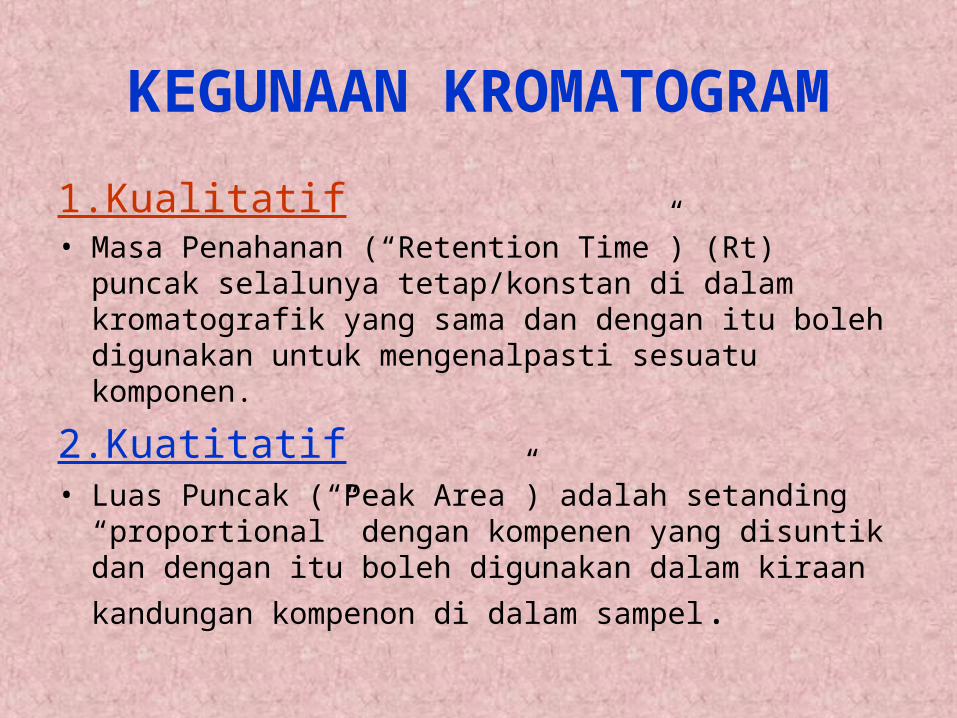
KEGUNAAN KROMATOGRAM
1.Kualitatif • Masa Penahanan (“Retention Time”) (Rt) puncak
selalunya tetap/konstan di dalam kromatografik yang sama dan dengan itu boleh digunakan untuk mengenalpasti sesuatu komponen.
2.Kuatitatif • Luas Puncak (“Peak Area”) adalah setanding
“proportional” dengan kompenen yang disuntik dan dengan itu boleh digunakan dalam kiraan kandungan
kompenon di dalam sampel.
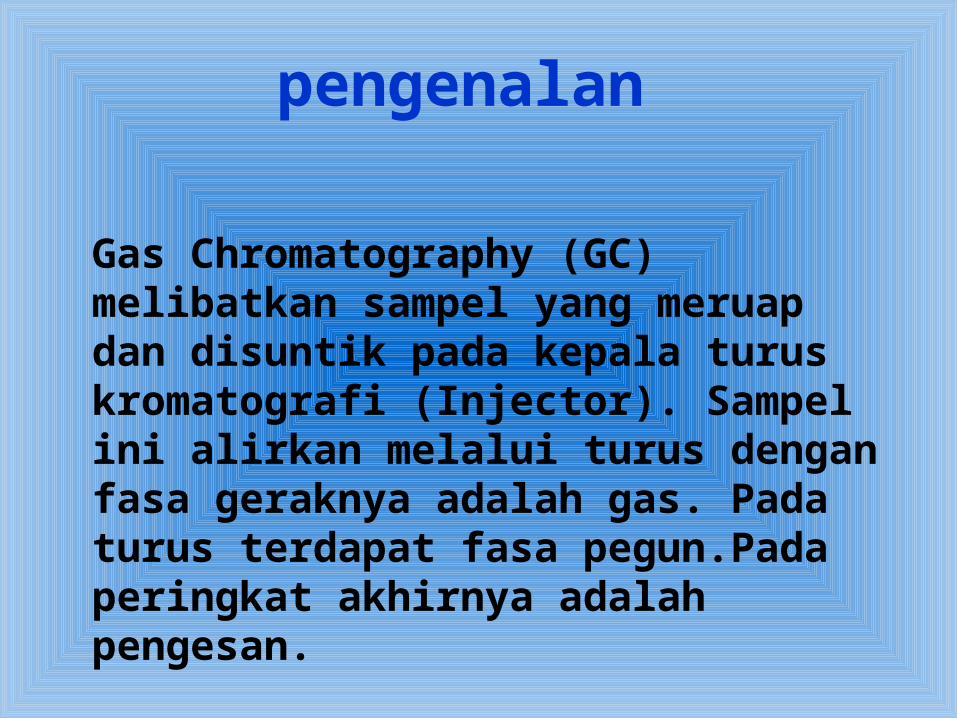
pengenalan
Gas Chromatography (GC) melibatkan sampel yang meruap dan disuntik pada kepala turus kromatografi (Injector). Sampel ini alirkan melalui turus dengan fasa geraknya adalah gas. Pada turus terdapat fasa pegun.Pada peringkat akhirnya adalah pengesan.
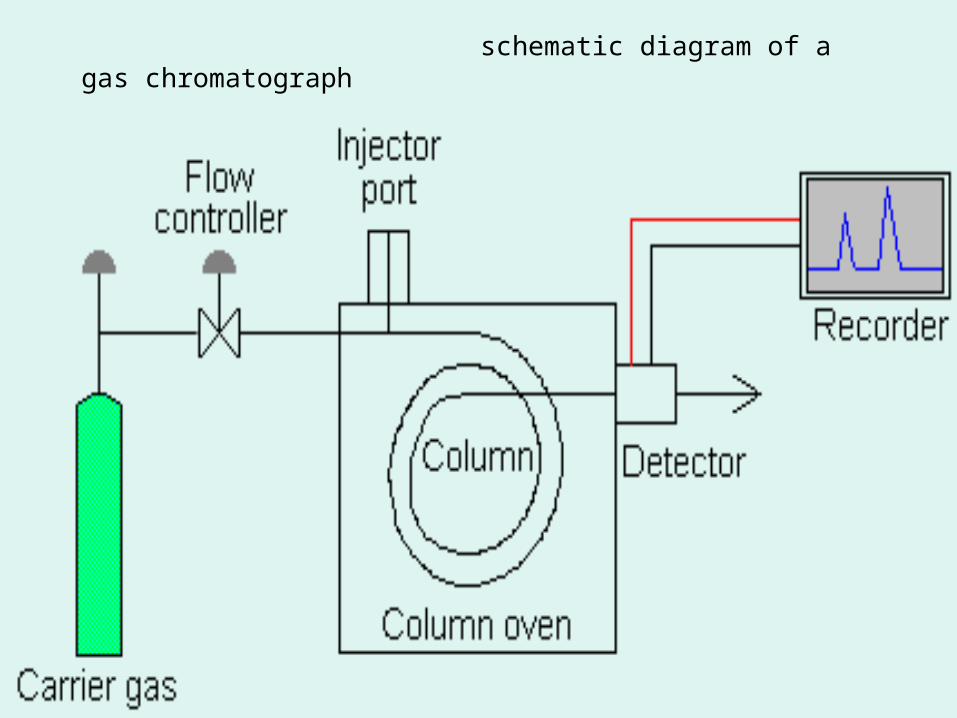
schematic diagram of a gas chromatograph
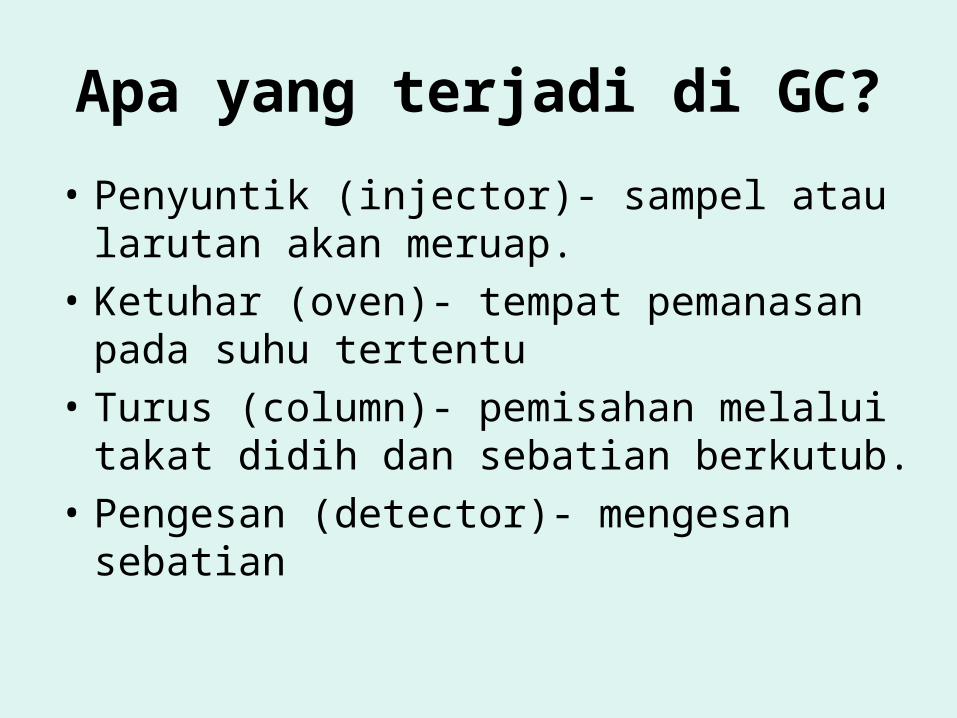
Apa yang terjadi di GC?
• Penyuntik (injector)- sampel atau larutan akan meruap.
• Ketuhar (oven)- tempat pemanasan pada suhu tertentu
• Turus (column)- pemisahan melalui takat didih dan sebatian berkutub.
• Pengesan (detector)- mengesan sebatian
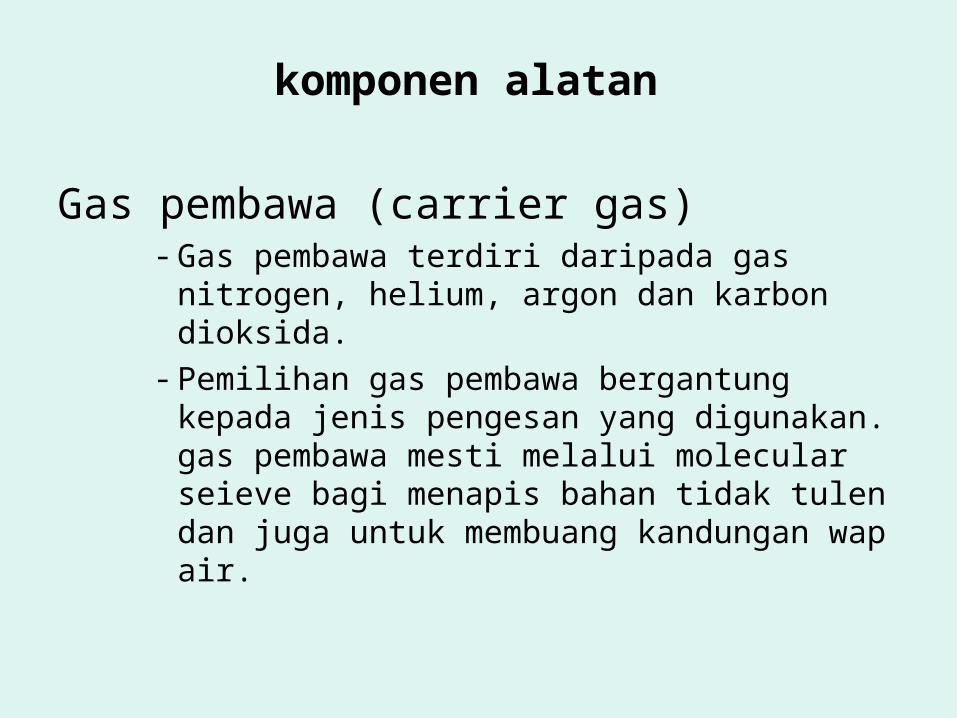
komponen alatan
Gas pembawa (carrier gas)- Gas pembawa terdiri daripada gas nitrogen,
helium, argon dan karbon dioksida. - Pemilihan gas pembawa bergantung kepada jenis
pengesan yang digunakan. gas pembawa mesti melalui molecular seieve bagi menapis bahan tidak tulen dan juga untuk membuang kandungan wap air.
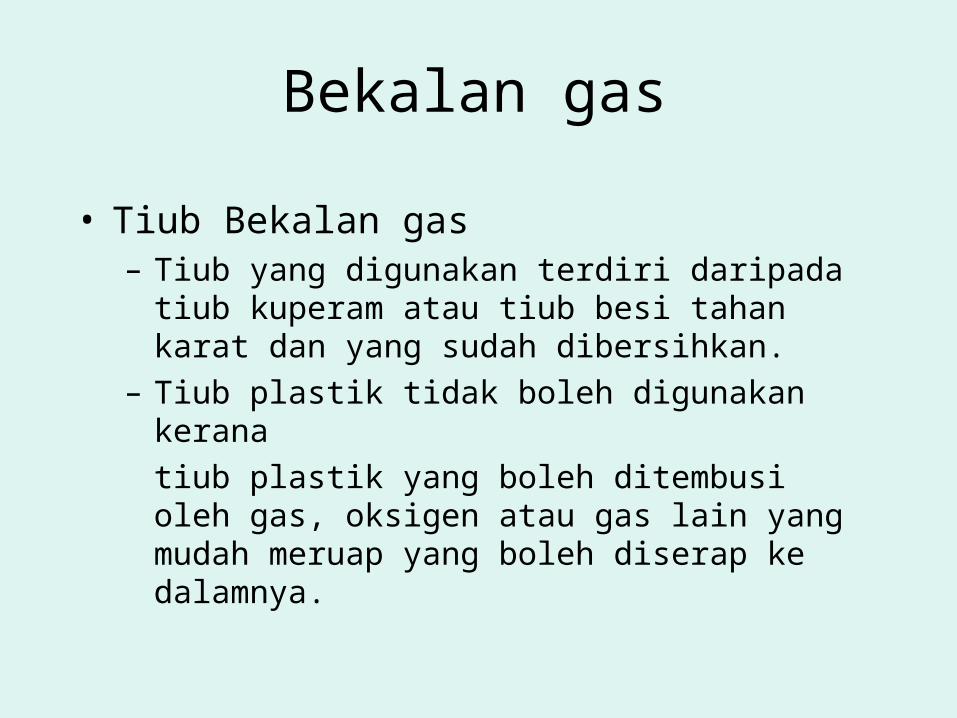
Bekalan gas
• Tiub Bekalan gas – Tiub yang digunakan terdiri daripada tiub kuperam
atau tiub besi tahan karat dan yang sudah dibersihkan.
– Tiub plastik tidak boleh digunakan kerana
tiub plastik yang boleh ditembusi oleh gas, oksigen atau gas lain yang mudah meruap yang boleh diserap ke dalamnya.
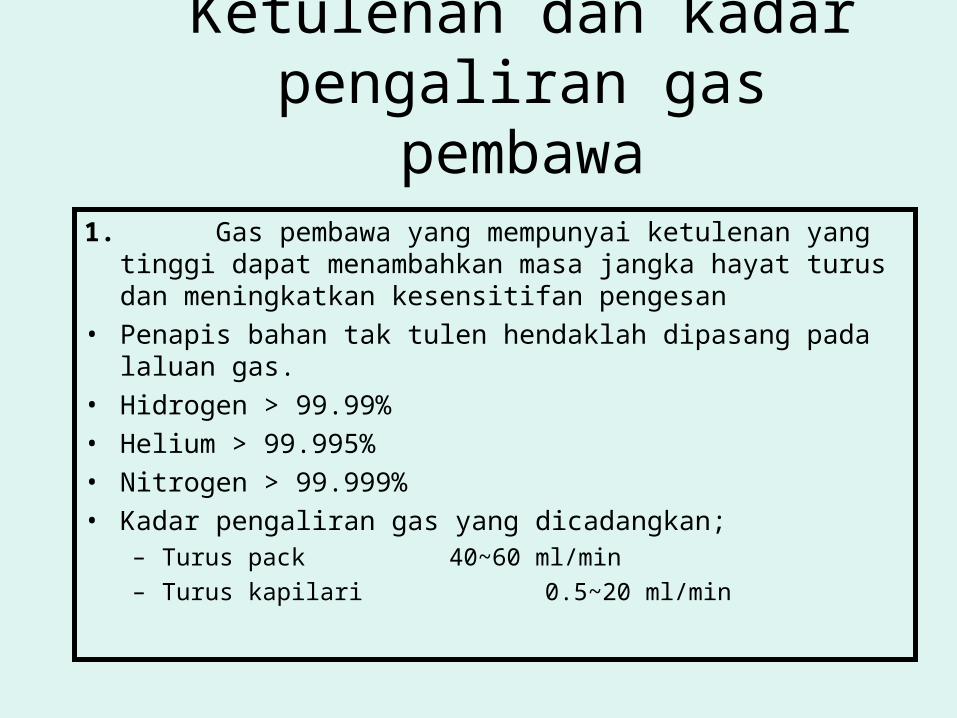
Ketulenan dan kadar pengaliran gas pembawa
1. Gas pembawa yang mempunyai ketulenan yang tinggi dapat menambahkan masa jangka hayat turus dan meningkatkan kesensitifan pengesan
• Penapis bahan tak tulen hendaklah dipasang pada laluan gas.• Hidrogen > 99.99%• Helium > 99.995%• Nitrogen > 99.999%• Kadar pengaliran gas yang dicadangkan;
– Turus pack 40~60 ml/min
– Turus kapilari 0.5~20 ml/min
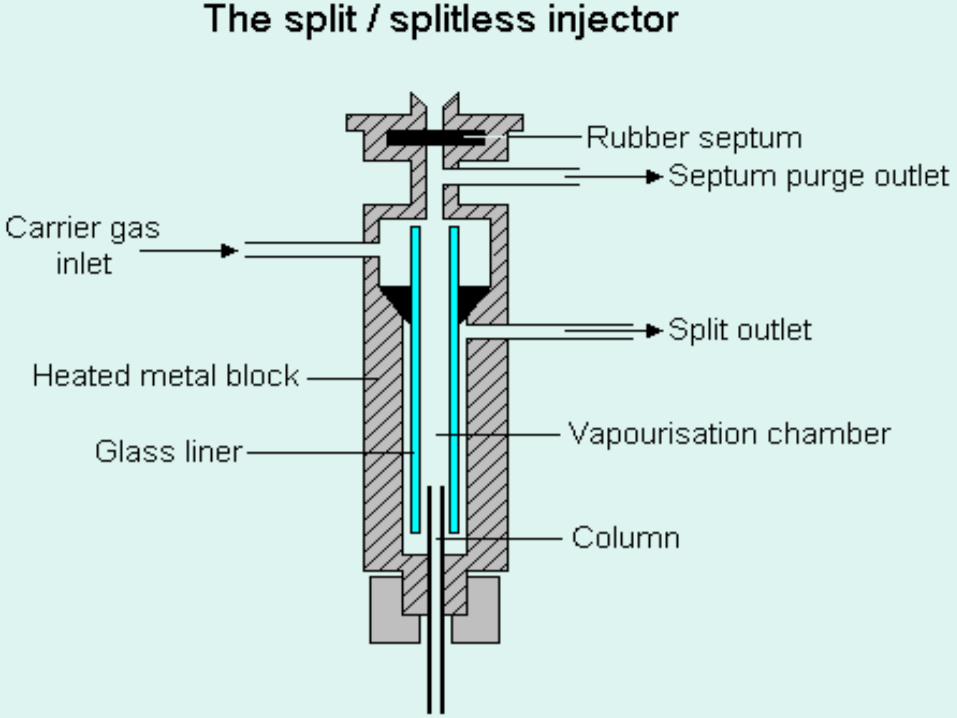
Bahagian suntikan
(Sample injection port)
• Bagi mendapatkan kecekapan turus yang optima, sampel hendaklah tidak terlalu banyak.
• Suntikan yang perlahan bagi sampel yang banyak menyebabkan jalur melebar dan resolusi berkurangan

Suntikan boleh digunakan dalam dua cara:
• split
• splitless.
CARA SUNTIKAN
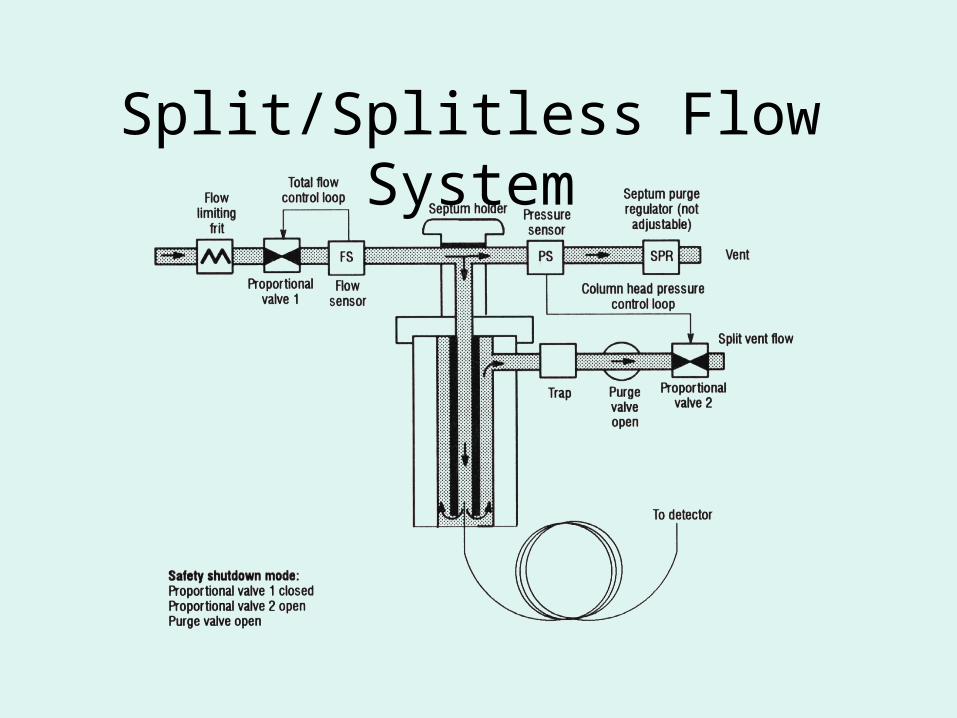
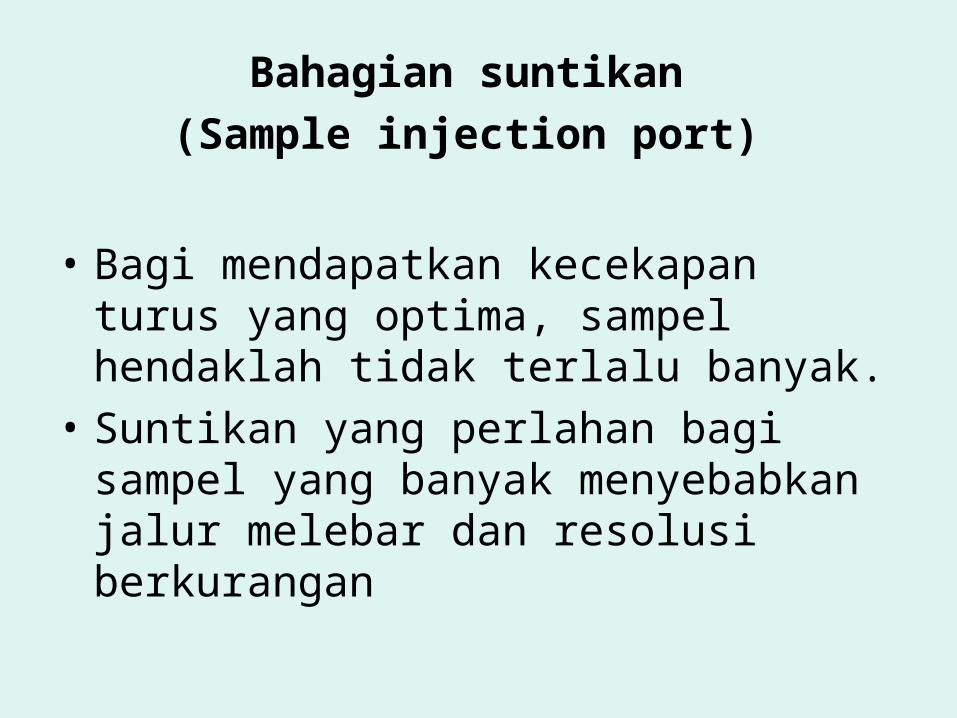
Split/Splitless Flow System
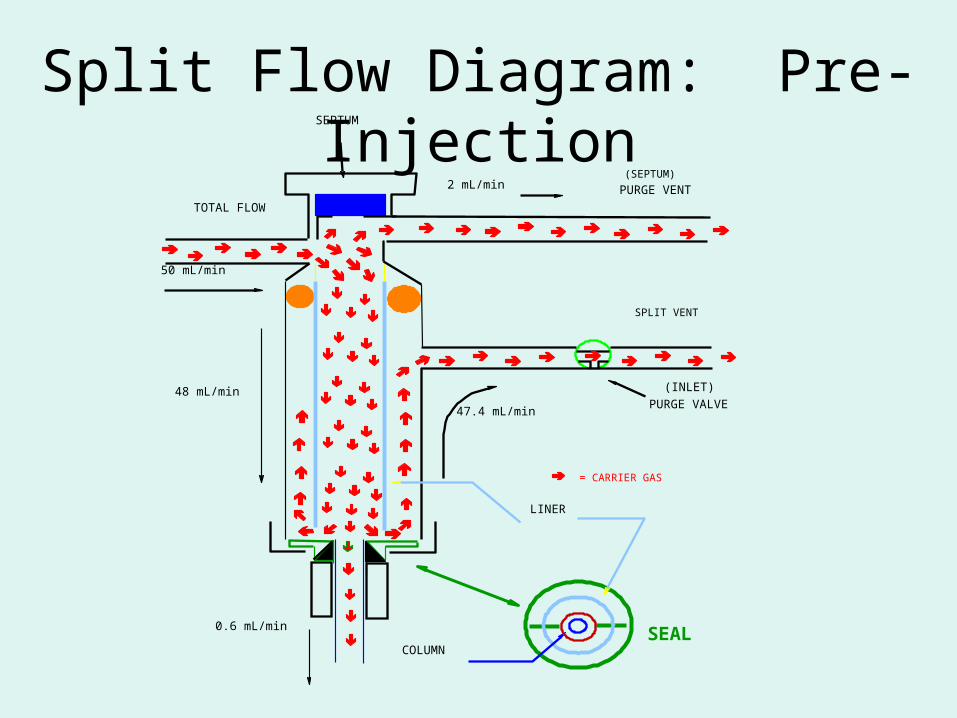
Split Flow Diagram: Pre-Injection
SEAL
(INLET)
(SEPTUM)
SPLIT VENT
TOTAL FLOW
COLUMN
SEPTUM
= CARRIER GAS
LINER
50 mL/min
2 mL/min
0.6 mL/min
48 mL/min
47.4 mL/min
PURGE VENT
PURGE VALVE
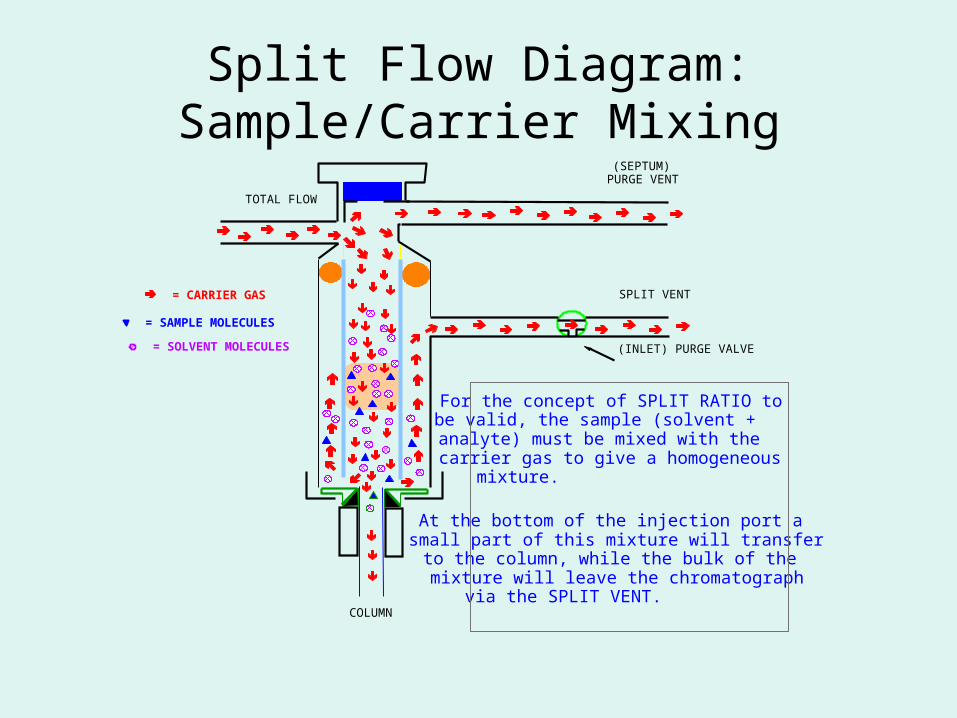
Split Flow Diagram: Sample/Carrier Mixing
(INLET) PURGE VALVE
(SEPTUM) PURGE VENT
SPLIT VENT
TOTAL FLOW
COLUMN
For the concept of SPLIT RATIO to be valid, the sample (solvent + analyte) must be mixed with the carrier gas to give a homogeneous mixture.
At the bottom of the injection port a small part of this mixture will transfer to the column, while the bulk of the mixture will leave the chromatograph via the SPLIT VENT.
= CARRIER GAS
= SAMPLE MOLECULES
= SOLVENT MOLECULES
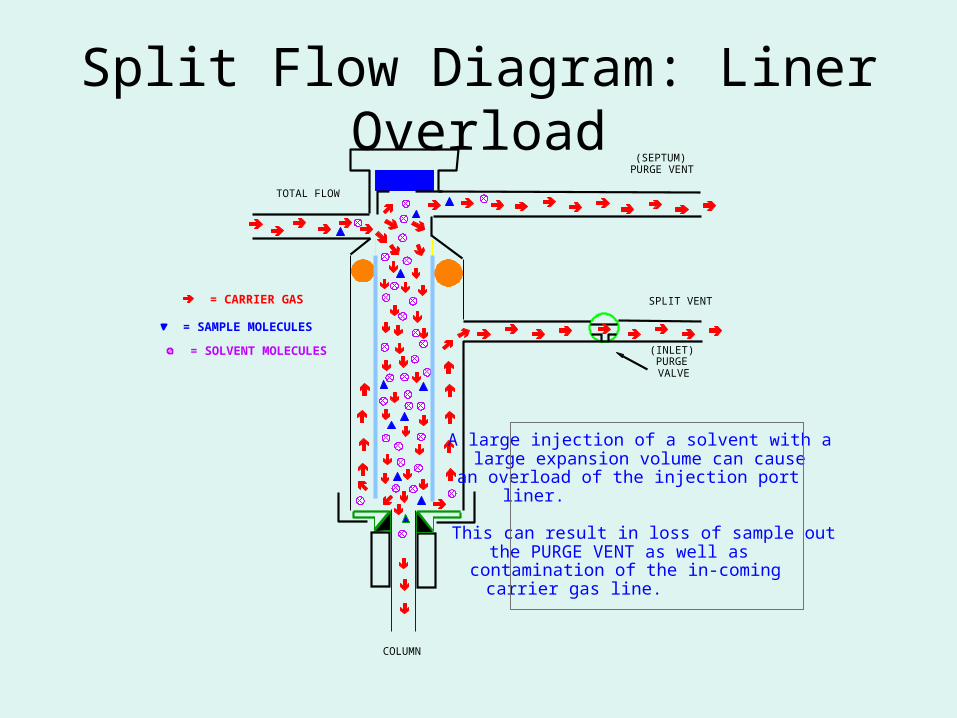
Split Flow Diagram: Liner Overload
(INLET) PURGE VALVE
(SEPTUM) PURGE VENT
SPLIT VENT
TOTAL FLOW
COLUMN
A large injection of a solvent with a large expansion volume can cause an overload of the injection port liner.
This can result in loss of sample out the PURGE VENT as well as contamination of the in-coming carrier gas line.
= CARRIER GAS
= SAMPLE MOLECULES
= SOLVENT MOLECULES

choosing the right liner for the job
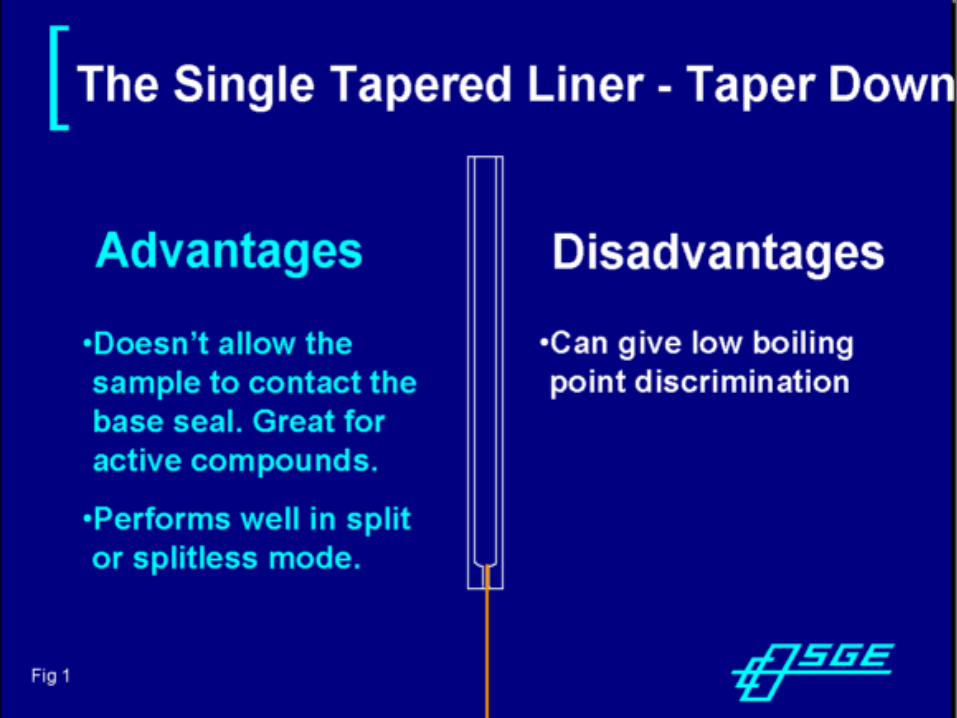
LINERS

• Liner yang tirus pada bahagian bawah dapat mengurangkan cecair yang disuntik daripada terkena bahagian bawah penyuntik.
• Jika Glass wool yang diletakan longgar, kemudian pemanasan dilakukan,ia nya dapat menghalang daripada “Glass Wool” tersebut bergerak kebawah liner yang mana boleh menyebabkan tekanan tinggi didalam “Injector Port”
Liner tirus bahagian bawahLiner tirus bahagian bawah
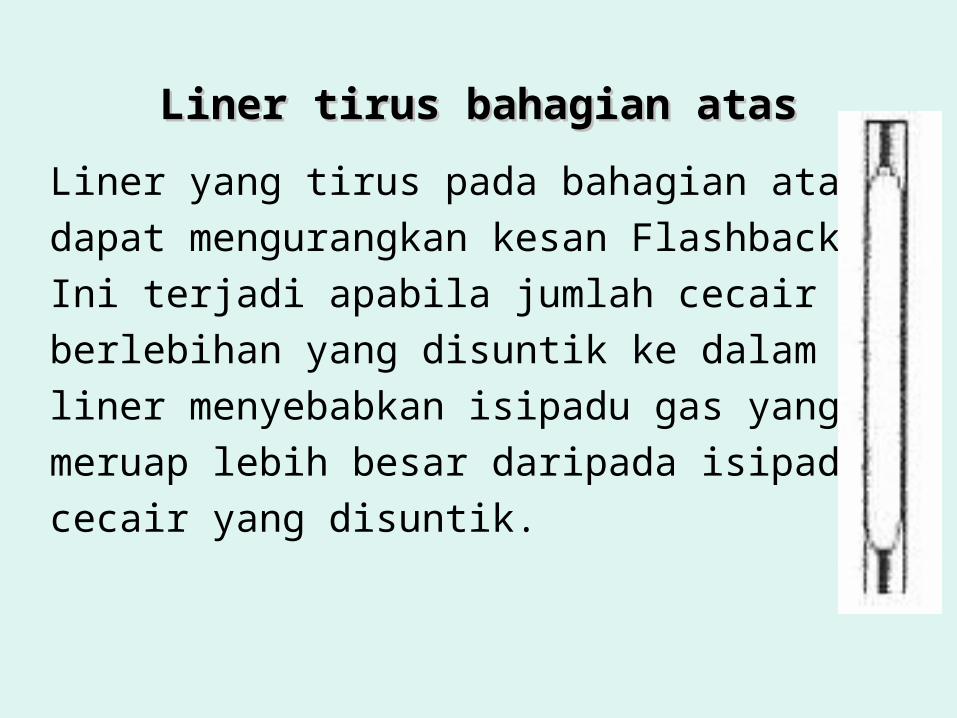
Liner yang tirus pada bahagian atas
dapat mengurangkan kesan Flashback.
Ini terjadi apabila jumlah cecair
berlebihan yang disuntik ke dalam
liner menyebabkan isipadu gas yang
meruap lebih besar daripada isipadu
cecair yang disuntik.
Liner tirus bahagian atasLiner tirus bahagian atas

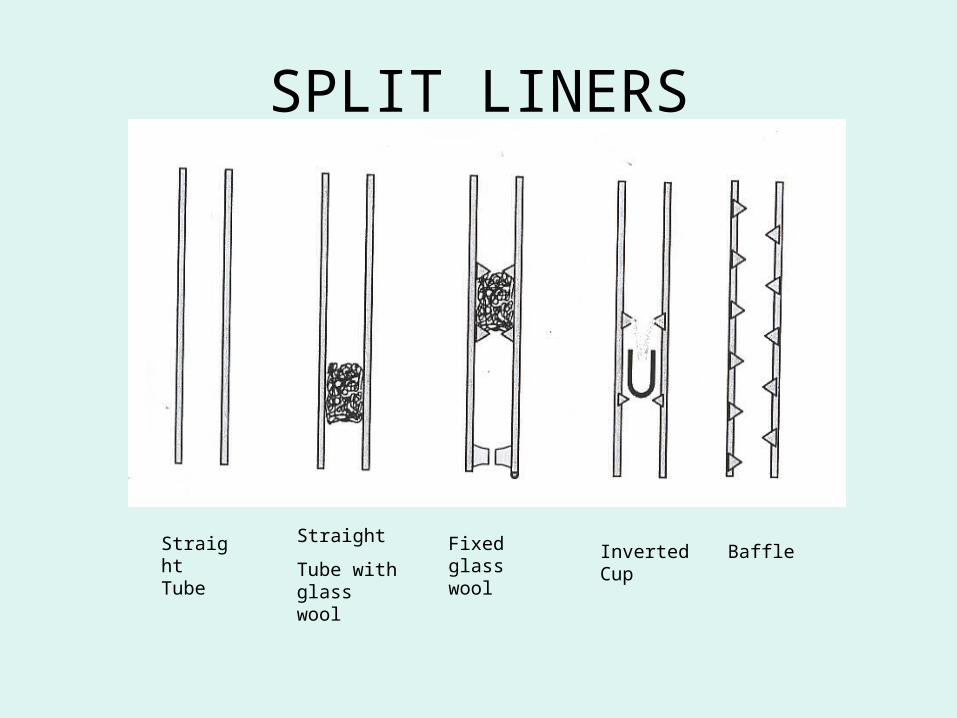
SPLIT LINERS
Straight Tube
Straight
Tube with glass wool
Fixed glass wool
Inverted Cup
Baffle

Bertindak sebagai penapis dan mengurangkan peluang bagi sebarang bahan yang tak meruap daripada sampai ke turus (Column).
• Ia dapat menangkap cecair yang disuntik daripada picagari dan meningkatkan pemeruapan
• Mengelakkan cecair terkena pada bahagian bawah penyuntik.
KEGUNAAN GLASS WOOLKEGUNAAN GLASS WOOL
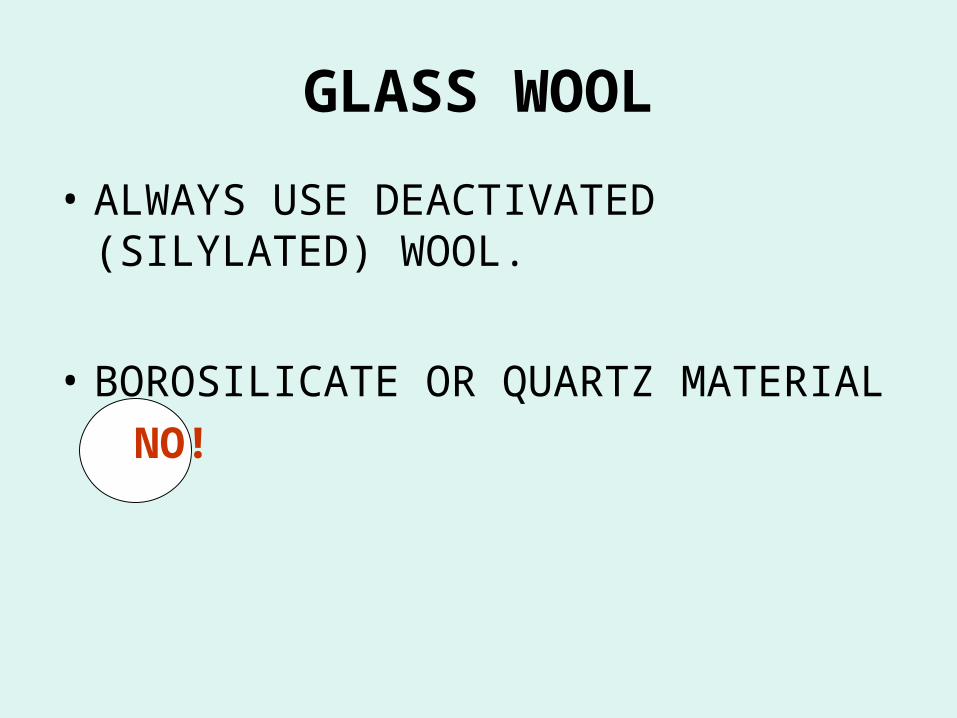
GLASS WOOL
• ALWAYS USE DEACTIVATED (SILYLATED) WOOL.
• BOROSILICATE OR QUARTZ MATERIAL
NO!

GLASS WOOL
Liner Packaging Recommendations
• Amount size and placement must be consistent for consistent result
• Liner deactivation glass wool plug in place is ideal
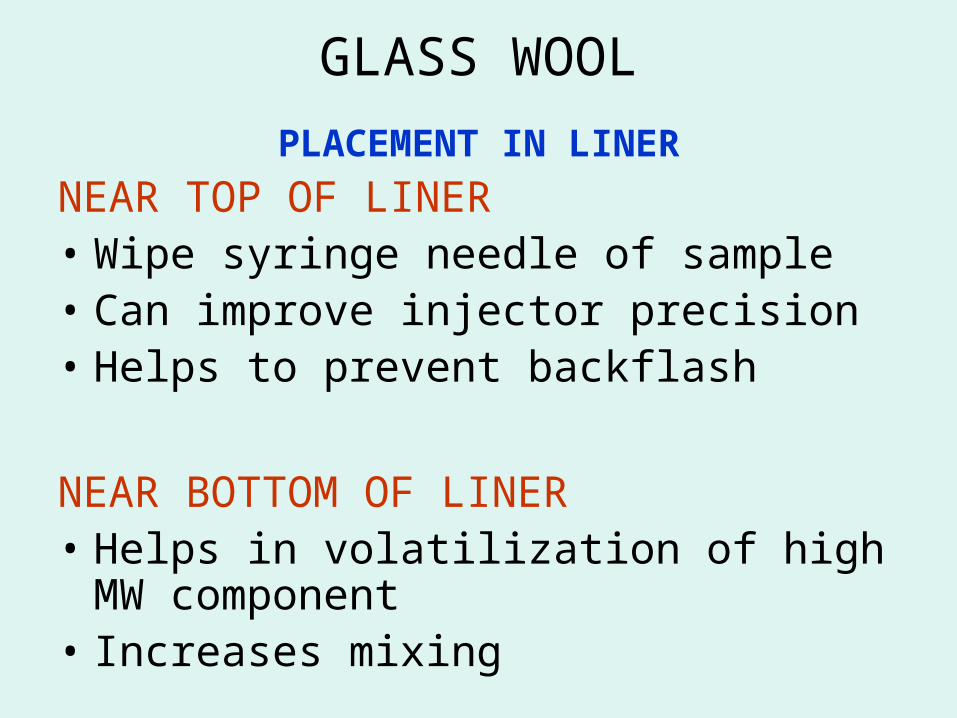
GLASS WOOL
PLACEMENT IN LINER
NEAR TOP OF LINER• Wipe syringe needle of sample• Can improve injector precision• Helps to prevent backflash
NEAR BOTTOM OF LINER• Helps in volatilization of high MW
component• Increases mixing
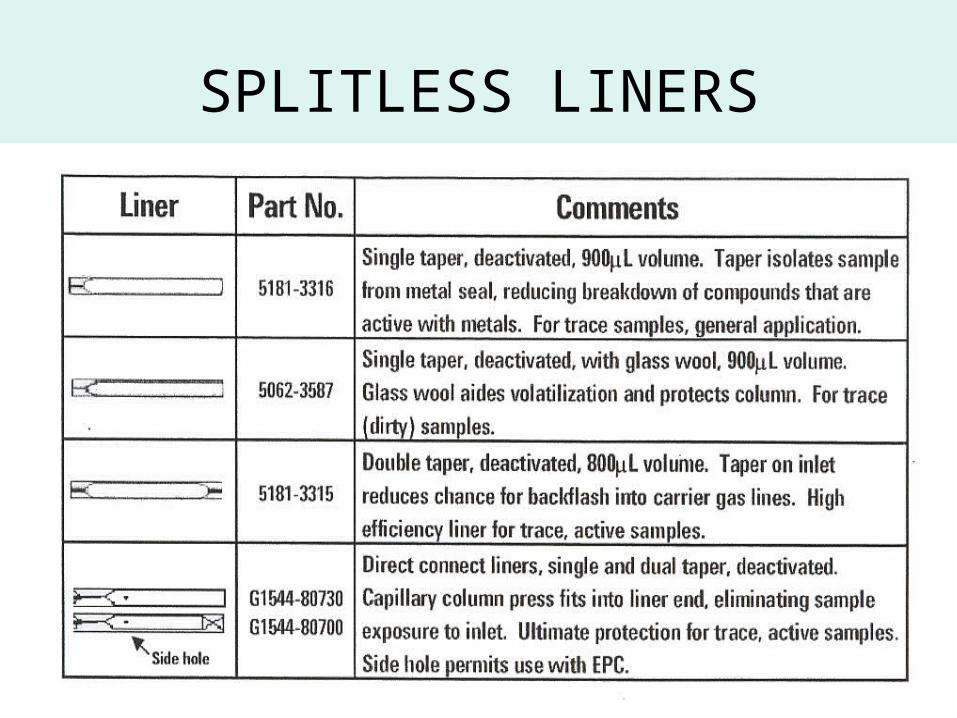
SPLITLESS LINERS

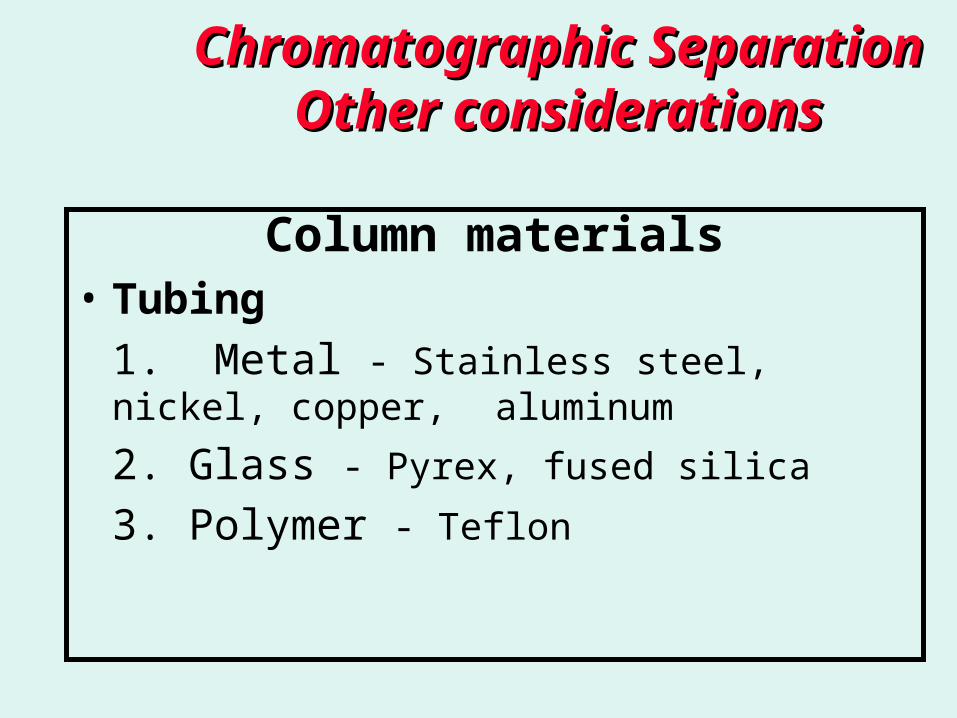
Chromatographic SeparationChromatographic SeparationOther considerationsOther considerations
Column materials• Tubing
1. Metal - Stainless steel, nickel, copper, aluminum
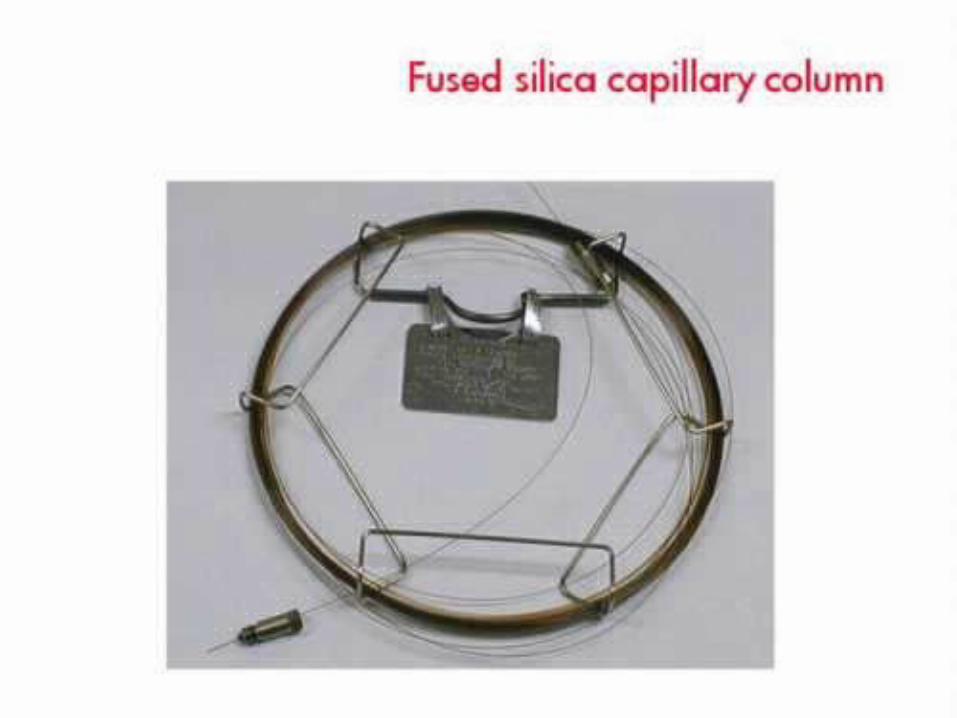
2. Glass - Pyrex, fused silica
3. Polymer - Teflon
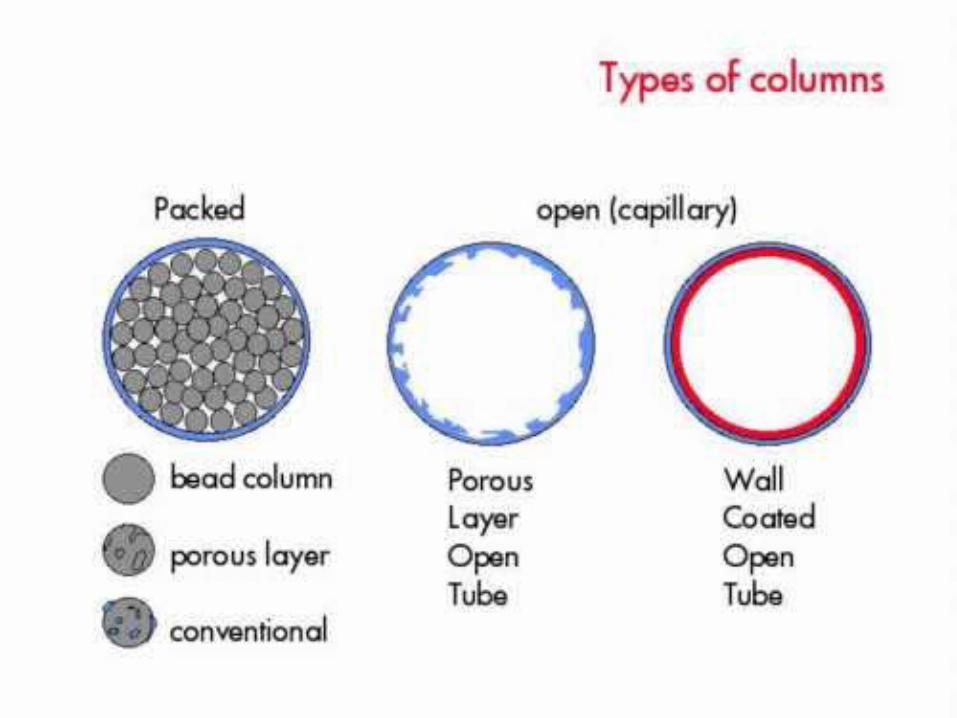
Turus (Columns)
Pada umumnya turus (column) terdiri daripada dua jenis, ia itu:
• Pack Column
• Capillary Column.


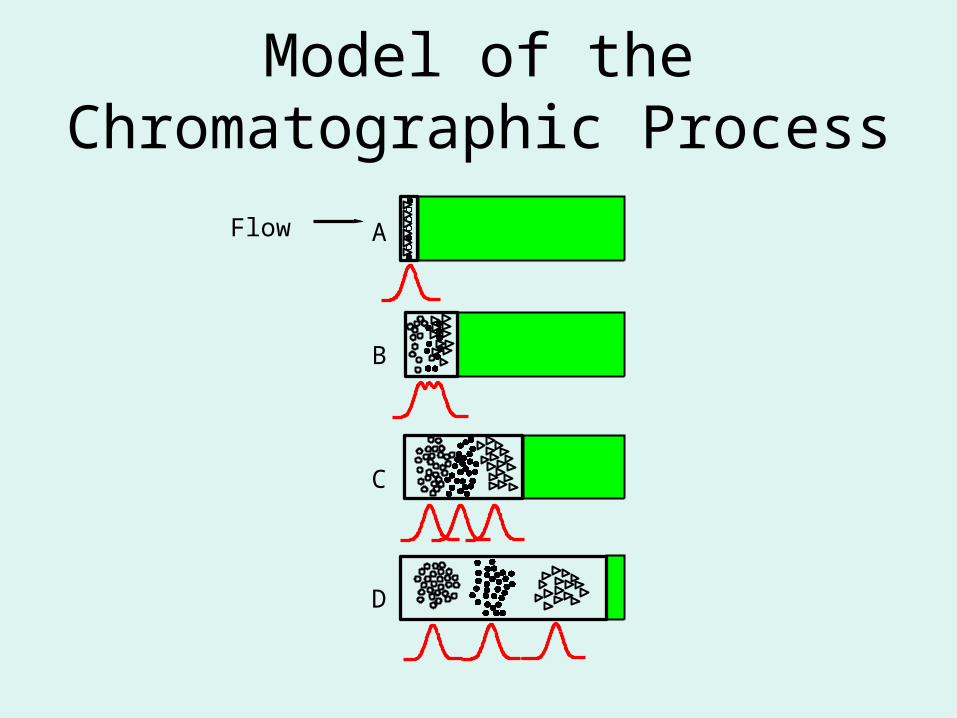
A
B
C
D
Flow
Model of the Chromatographic Process
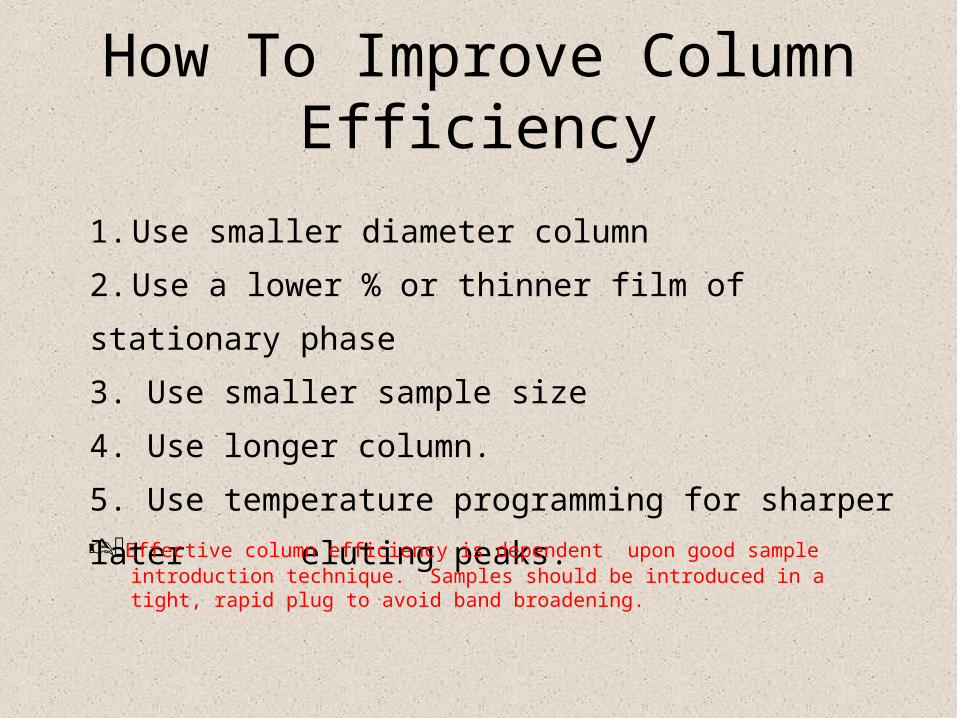
1. Use smaller diameter column
2. Use a lower % or thinner film of stationary phase
3. Use smaller sample size
4. Use longer column.
5. Use temperature programming for sharper later
eluting peaks.
Effective column efficiency is dependent upon good sample introduction technique. Samples should be introduced in a tight, rapid plug to avoid band broadening.
How To Improve Column Efficiency
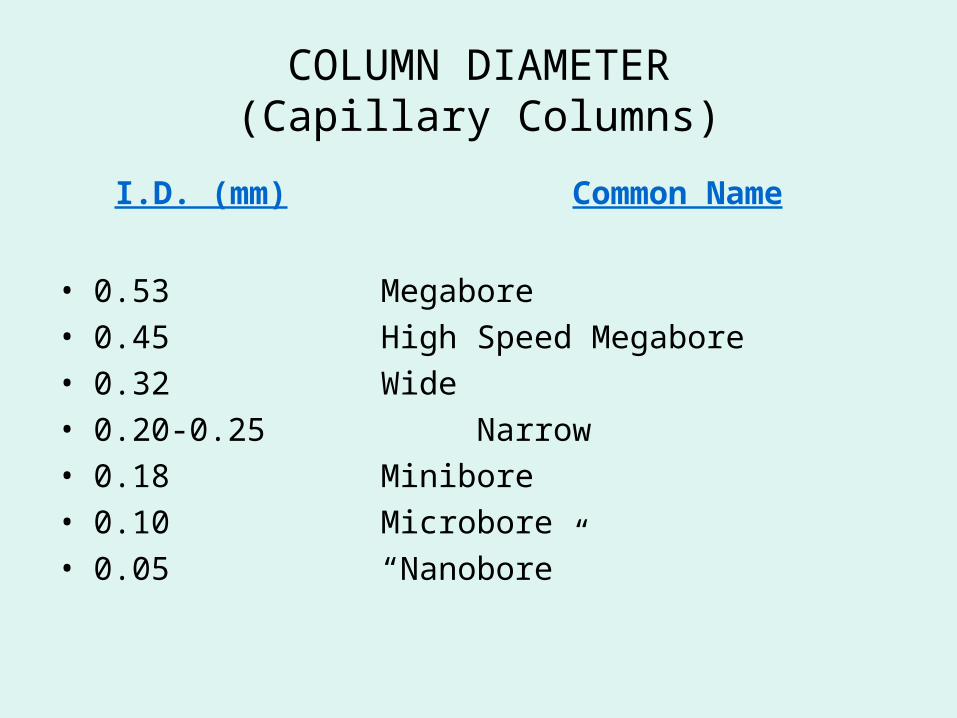
COLUMN DIAMETER(Capillary Columns)
I.D. (mm) Common Name
• 0.53 Megabore• 0.45 High Speed Megabore• 0.32 Wide• 0.20-0.25 Narrow• 0.18 Minibore• 0.10 Microbore• 0.05 “Nanobore”
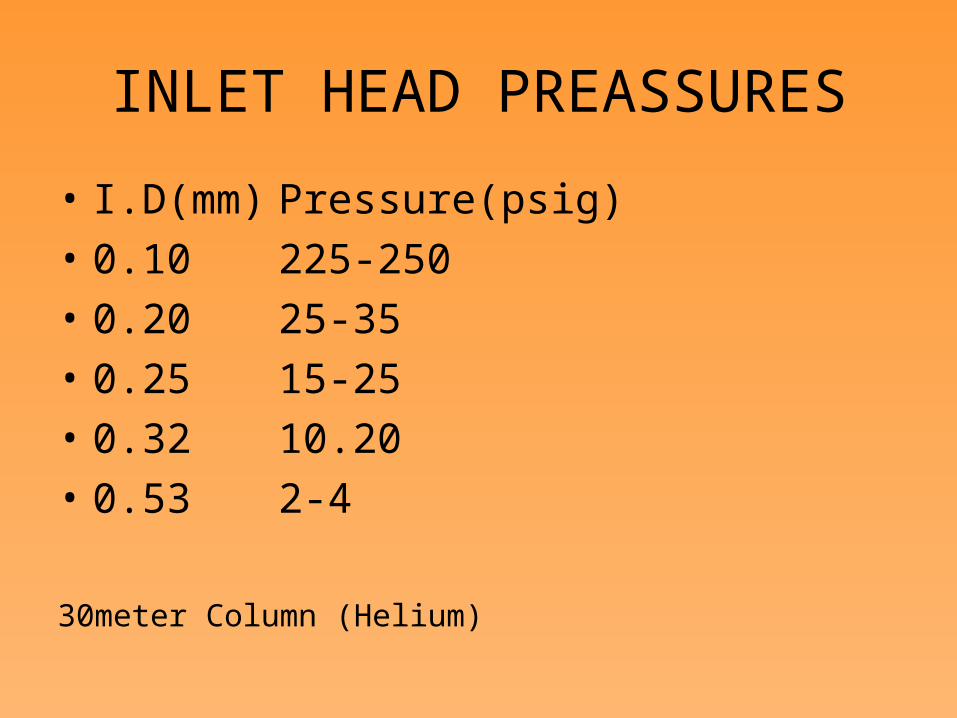
INLET HEAD PREASSURES
• I.D(mm) Pressure(psig)
• 0.10 225-250
• 0.20 25-35
• 0.25 15-25
• 0.32 10.20
• 0.53 2-4
30meter Column (Helium)
1
23
4
5
6
7
89
1 2
3
4
6
9
87
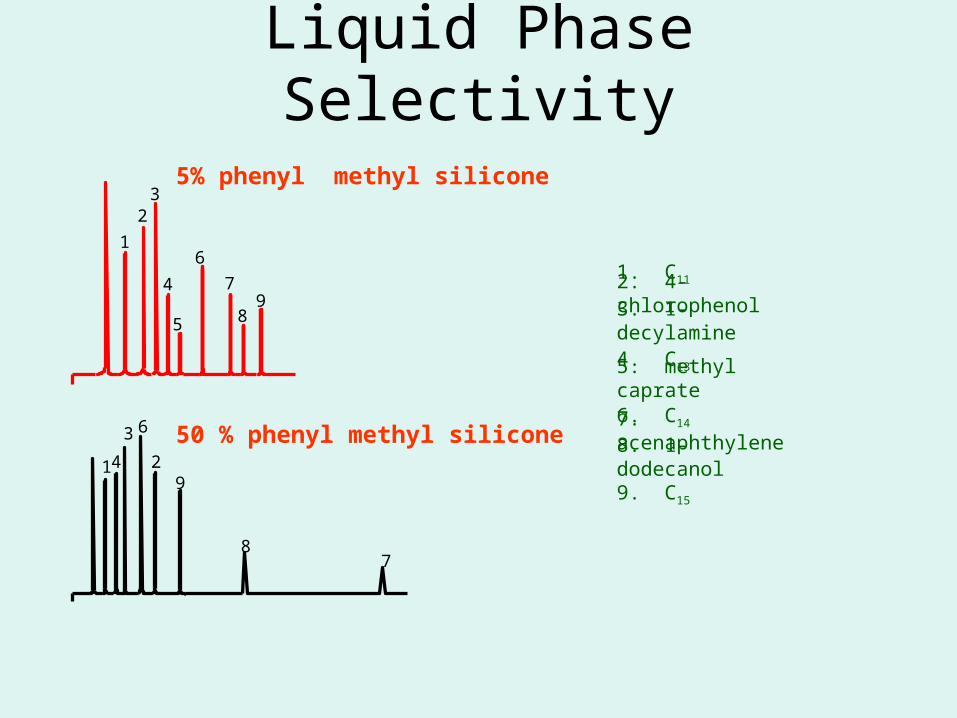
1. C11
2. 4-chlorophenol3. 1-decylamine4. C13
5. methyl caprate6. C14
7. acenaphthylene8. 1-dodecanol9. C15
Liquid Phase Selectivity
5% phenyl methyl silicone
50 % phenyl methyl silicone


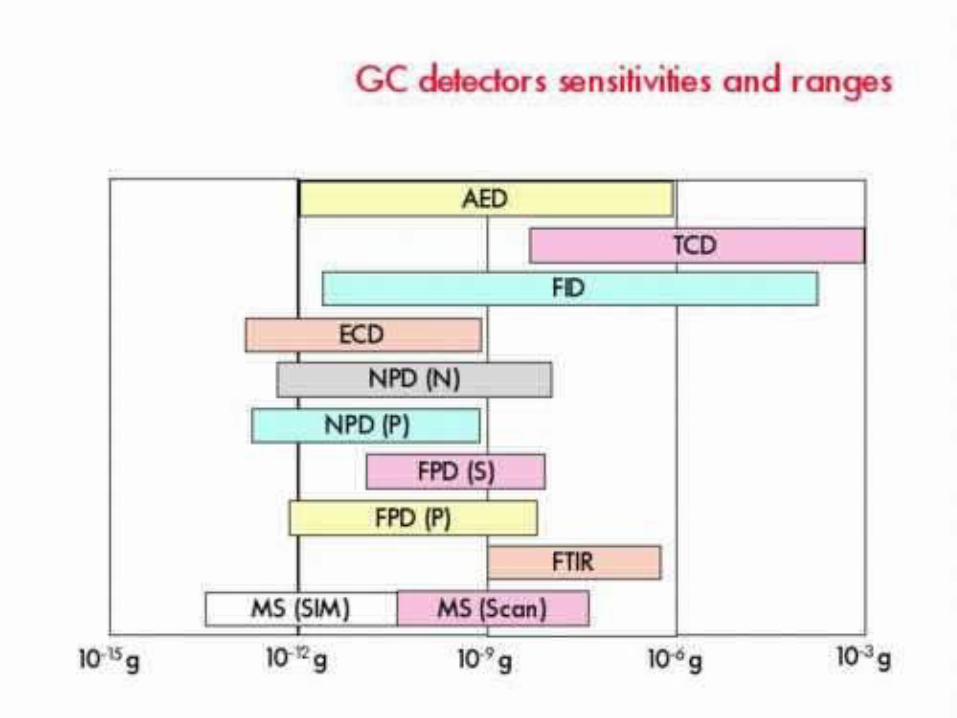
Detectors
• Different detectors will give different types of selectivity.
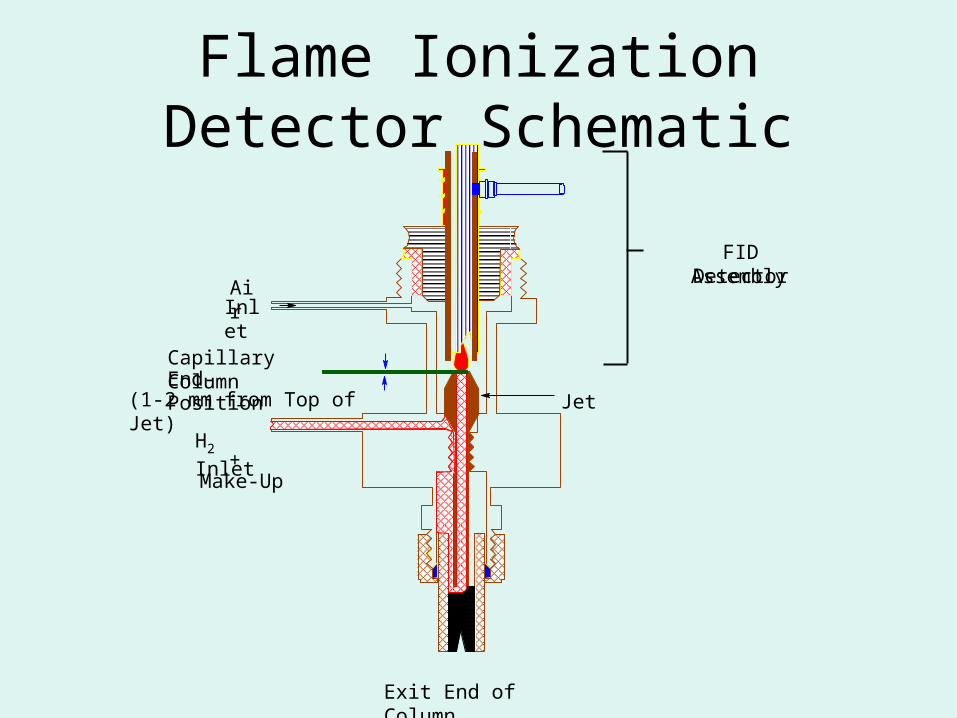
Exit End of Column
Jet
Air
H2 Inlet+
Make-Up
FID DetectorAssembly
Inlet
Capillary ColumnEnd-Position
(1-2 mm from Top of Jet)
Flame Ionization Detector Schematic
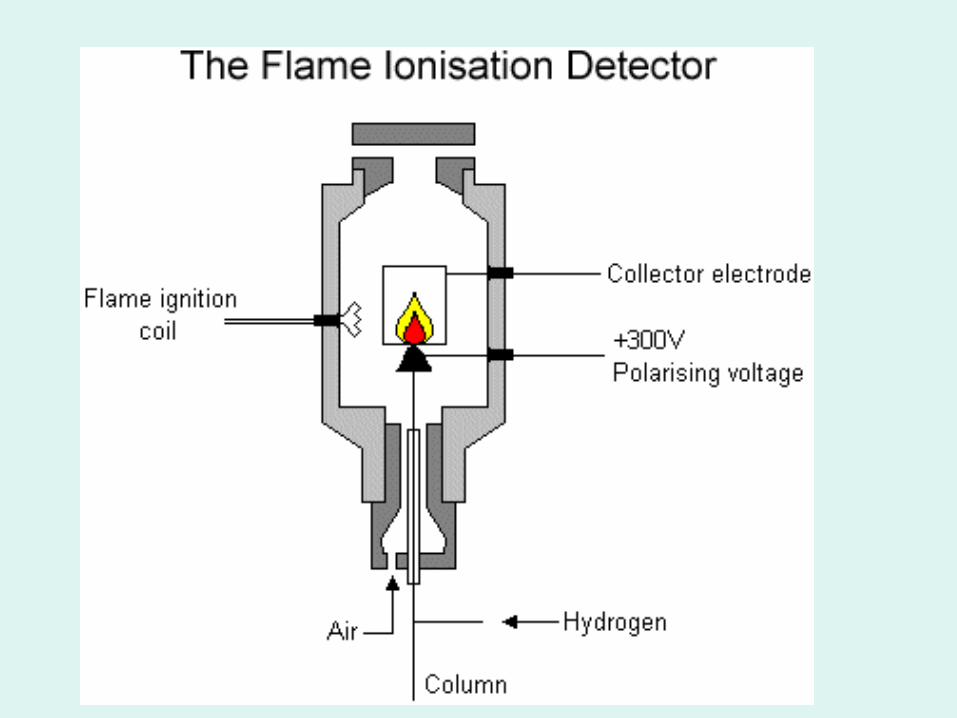

FIDFID• Nyalaan FID terujud daripada pembakaran
Hidrogen dan udara. Apabila sampel dilalukan, pembakaran akan terjadi menyebabkan berlakunya pengionan dan melepaskan elektron.
• Pemungut yang mempunyai voltan berkutub, menarik elekton yang terbebas mewujudkan arus letrik yang seimbang dengan jumlah hidrokarban didalam sampel. Isyarat dari pengesan ini akan dibesarkan dan diproses.

The FID is a destructive, mass sensing detector.Cations generated in the flame are counted and produce the detector signal. Analytes that have the greatest number of low oxidation state carbons produce the largest signal.
H2
H2
H2
H2
H2
H2
CH4
CH4
CH4
CH 4
CH 4
CH 4
CHO+
CHO+
CHO+
CHO+ CHO+
CO2
CO2
CO2
H 02
H 02
H 02
H 02
H2
H2
H2
H2
H2
H2
Column
Jet
Flame Ionization Detector

Rare gasesNitrogen oxidesSilicon halides
H2OPerhalogenated cpds
NH H COCO HCOH
2
2
3 CS COSO N HCOOH
2
2
2
Compounds with Little or No FID Response

Recommended Flow Rates
Gas Type Flow Range Suggested Flow
Recommended Detector Temperature
If < 150º C, flame will not light Detector temp should be 20º C > higher than oven temp.
Carrier Gas(hydrogen, helium, nitrogen)
Packed Columns 10 - 60 ml/min Capillary Columns 1 - 5 ml/min Detector GasesHydrogen 24 to 60 ml/min 40 ml/min.Air 200 to 600 ml/min 450 ml/minColumn plus capillary makeup
10 to 60 ml/min 50 ml/min
Operating the FID

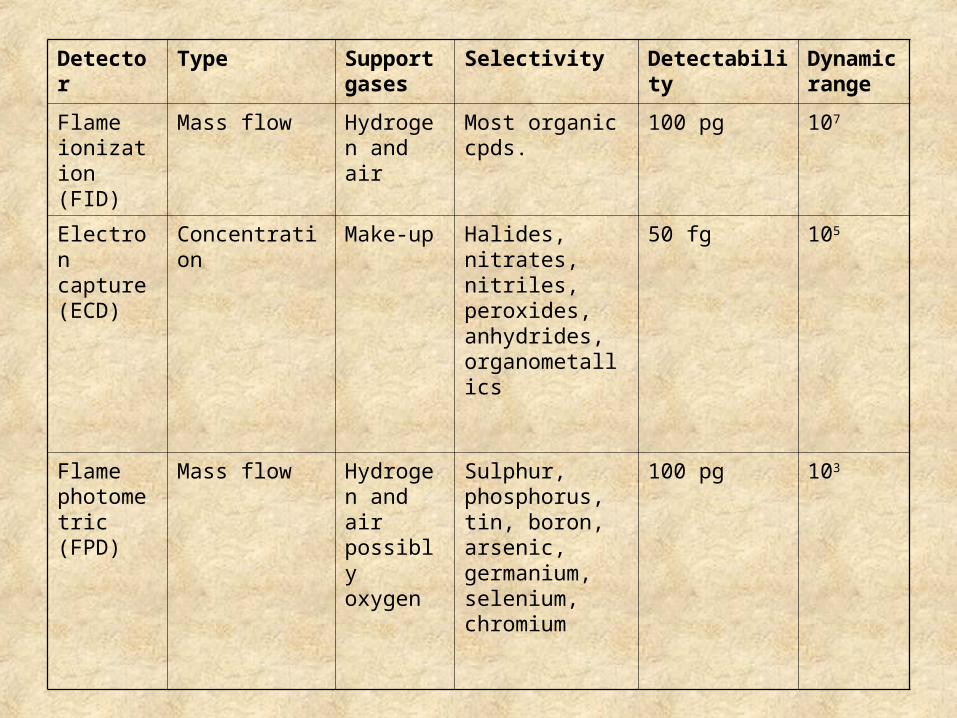
Detector Type Support gases
Selectivity Detectability Dynamic range
Flame ionization (FID)
Mass flow Hydrogen and air
Most organic cpds.
100 pg 107
Electron capture (ECD)
Concentration Make-up Halides, nitrates, nitriles, peroxides, anhydrides, organometallics
50 fg 105
Flame photometric (FPD)
Mass flow Hydrogen and air possibly oxygen
Sulphur, phosphorus, tin, boron, arsenic, germanium, selenium, chromium
100 pg 103
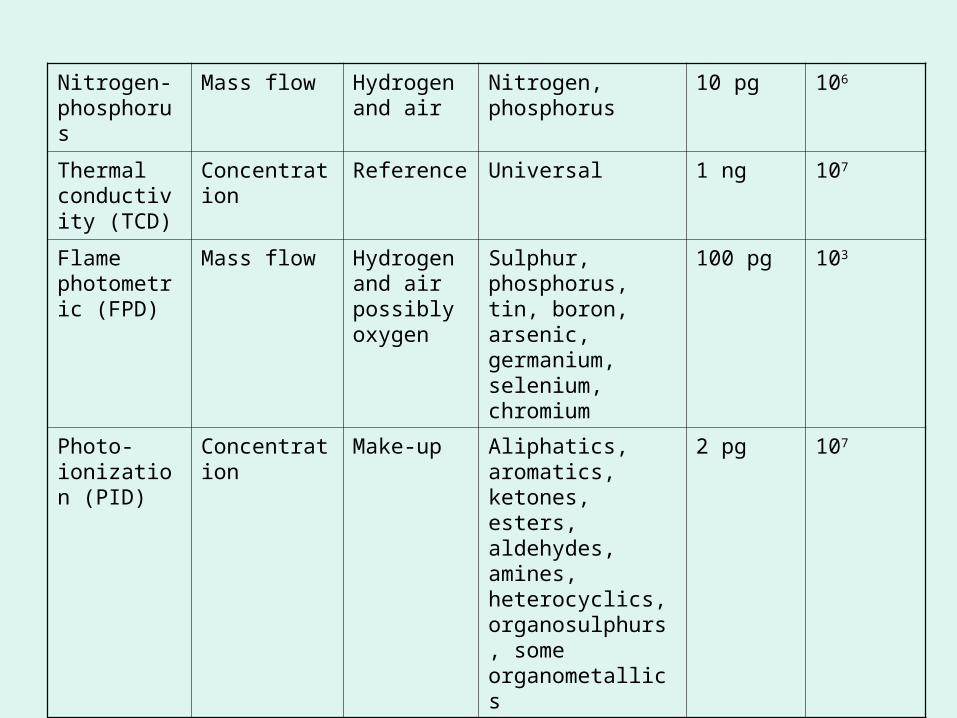
Nitrogen-phosphorus
Mass flow Hydrogen and air
Nitrogen, phosphorus
10 pg 106
Thermal conductivity (TCD)
Concentration Reference Universal 1 ng 107
Flame photometric (FPD)
Mass flow Hydrogen and air possibly oxygen
Sulphur, phosphorus, tin, boron, arsenic, germanium, selenium, chromium
100 pg 103
Photo-ionization (PID)
Concentration Make-up Aliphatics, aromatics, ketones, esters, aldehydes, amines, heterocyclics, organosulphurs, some organometallics
2 pg 107
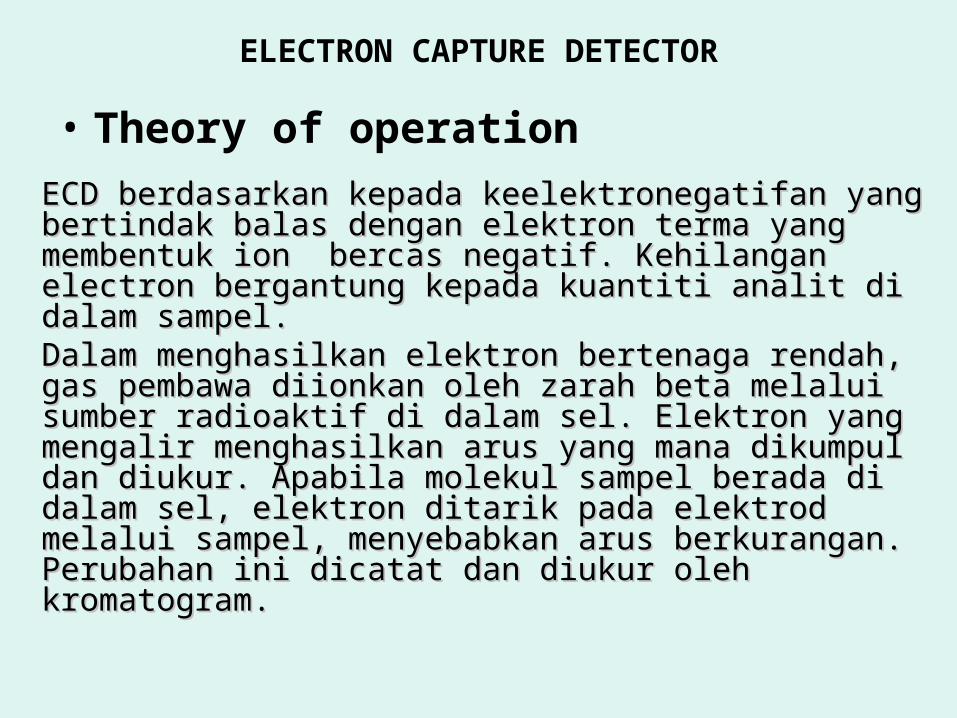
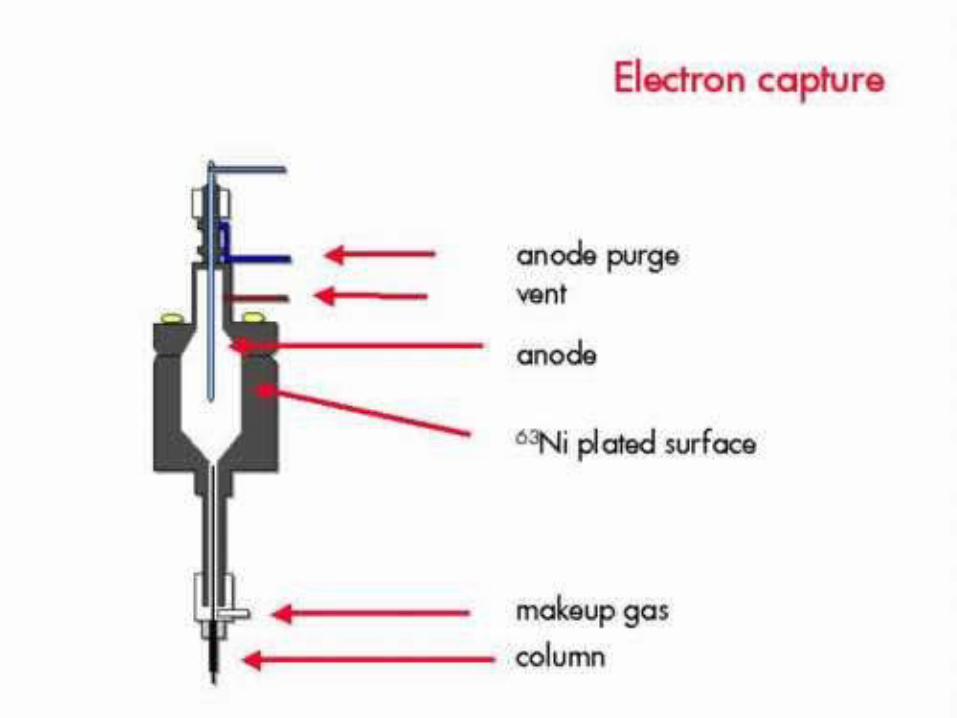
ELECTRON CAPTURE DETECTOR
• Theory of operation
ECD berdasarkan kepada keelektronegatifan yang bertindak ECD berdasarkan kepada keelektronegatifan yang bertindak balas dengan elektron terma yang membentuk ion bercas balas dengan elektron terma yang membentuk ion bercas negatif. Kehilangan electron bergantung kepada kuantiti analit negatif. Kehilangan electron bergantung kepada kuantiti analit di dalam sampel. di dalam sampel. Dalam menghasilkan elektron bertenaga rendah, gas Dalam menghasilkan elektron bertenaga rendah, gas pembawa diionkan oleh zarah beta melalui sumber radioaktif pembawa diionkan oleh zarah beta melalui sumber radioaktif di dalam sel. Elektron yang mengalir menghasilkan arus yang di dalam sel. Elektron yang mengalir menghasilkan arus yang mana dikumpul dan diukur. Apabila molekul sampel berada di mana dikumpul dan diukur. Apabila molekul sampel berada di dalam sel, elektron ditarik pada elektrod melalui sampel, dalam sel, elektron ditarik pada elektrod melalui sampel, menyebabkan arus berkurangan. Perubahan ini dicatat dan menyebabkan arus berkurangan. Perubahan ini dicatat dan diukur oleh kromatogram.diukur oleh kromatogram.

NITROGEN PHOSPHORUS DETECTOR
• Theory of operation The NPD (also called a thermionic detector) uses a jet
and collector similar in appearance to a Flame Ionization Detector. In an NPD, however, ions of alkali metal are introduced into a flame where hydrogen and air flows are less than those for an FID, minimizing the normal hydrocarbon ionizations, and increasing the ionization of nitrogen or phosphorous compounds. This causes the NPD to be both sensitive and selective for organic compounds containing nitrogen and/or phosphorous. This thermionic source efficiently ionizes nitrogen and phosphorous containing organic molecules. Ions are collected and the resulting current measured for the chromatogram.

NITROGEN PHOSPHORUS DETECTOR
• NPD juga dikenali sebagai pengesan thermoionic menggunakan jet dan Collector adalah lebih kurang sama dengan FID. Walau bagaimanapun, didalam NPD ion logam alkali diajukan(introduced) kepada nyalaan api hidrogen dan udara yang kurang berbanding FID, pengionan hidrokarbon yang kurang dan meningkatkan kadar pengionan sebatian nitrogen atau fosforus.
• Ini menyebabkan NPD lebih sensitif dan berupaya untuk memilih sebatian organik yang mengandungi sebatian nitrogen dan/atau fosforus.
• Ion yang dikumpul dan arus yang terhasil diukur untuk kromatogram.


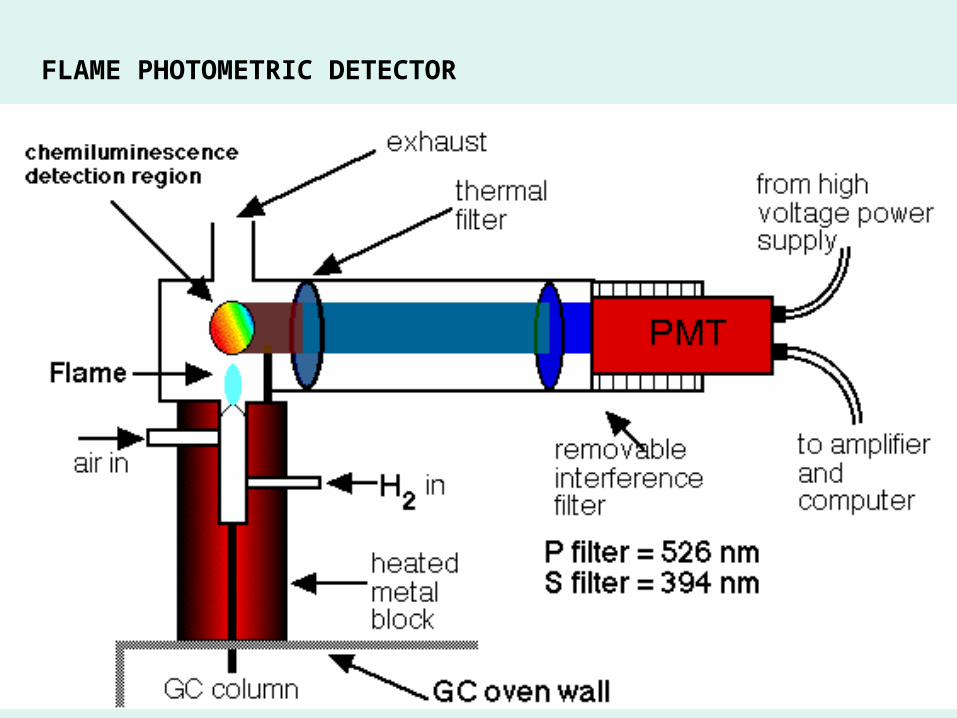
Flame Photometric Detector (FPD)
Theory of operation
In the Flame Photometric Detector (FPD), the sample burns in a hydrogen richflame, where some species are reduced and excited. The gas flow movesthe excited species to a cooler emission zone above the flame where theydecay and emit light. A narrow bandpass filter selects light unique to onespecies, while a shield prevents intense carbon emission from reaching thephotomultiplier tube (PMT).
The light strikes a photosensitive surface in the PMT where a light photonknocks loose an electron. The electron is amplified inside the PMT for anoverall gain of up to a million.
The current from the PMT is amplified and digitized by the FPD electronicsboard. The signal is available either as a digital signal on the communicationsoutput or as a voltage signal on the analog output.

FLAME PHOTOMETRIC DETECTOR
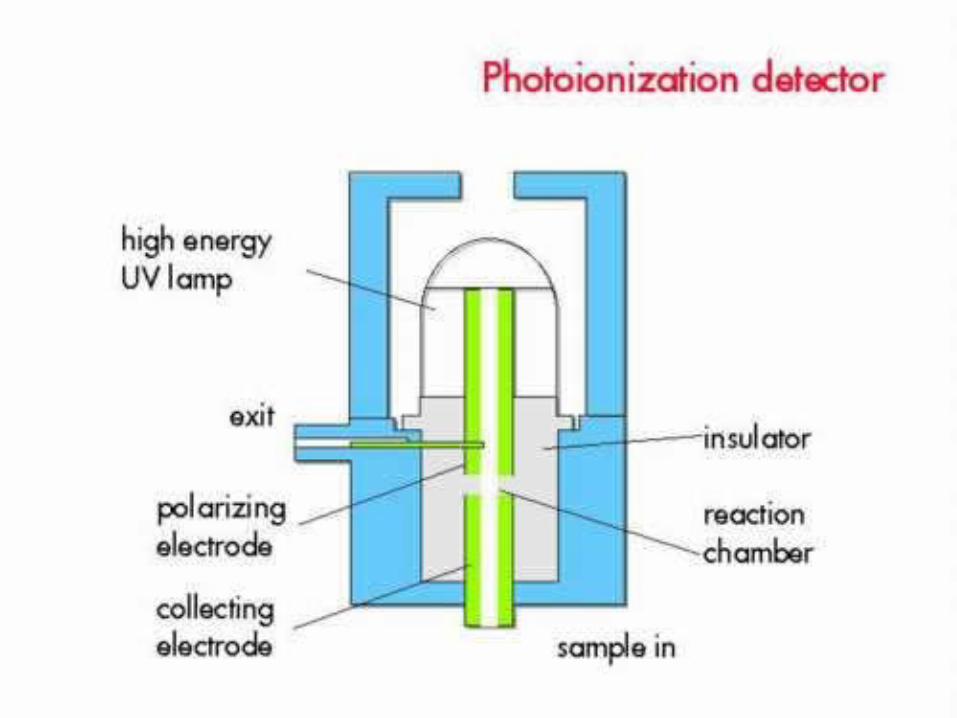
How a photoionization detector works
•A photoionization detector uses an ultraviolet (UV) light source to ionize components of the incoming sample. When a compound enters the detector, it passes by the UV lamp and is bombarded by high energy photons. Components that have a low enough ionization potential are ionized, producing free electrons that are directed to a polarizing electrode within the detector. The photoionization detector senses the electron stream as a current that is proportional to the amount of ionizable gases in the sample. The signal from the photoionization detector is then amplified and output to a display or external device.


THERMAL CONDUCTIVITY DETECTOR
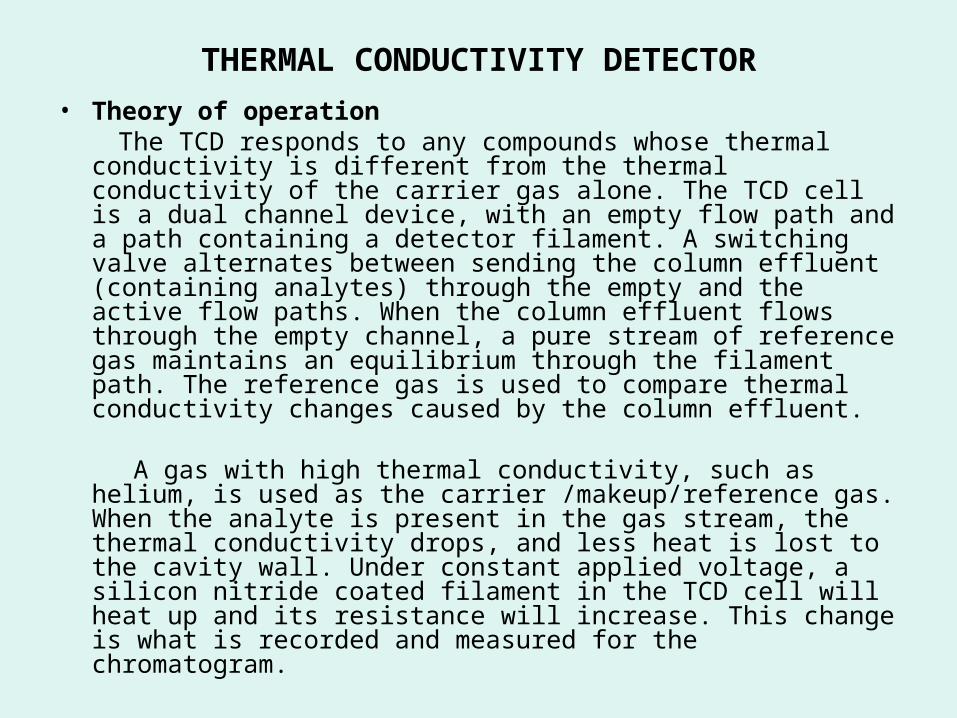
• Theory of operation The TCD responds to any compounds whose thermal conductivity is
different from the thermal conductivity of the carrier gas alone. The TCD cell is a dual channel device, with an empty flow path and a path containing a detector filament. A switching valve alternates between sending the column effluent (containing analytes) through the empty and the active flow paths. When the column effluent flows through the empty channel, a pure stream of reference gas maintains an equilibrium through the filament path. The reference gas is used to compare thermal conductivity changes caused by the column effluent.
A gas with high thermal conductivity, such as helium, is used as the carrier /makeup/reference gas. When the analyte is present in the gas stream, the thermal conductivity drops, and less heat is lost to the cavity wall. Under constant applied voltage, a silicon nitride coated filament in the TCD cell will heat up and its resistance will increase. This change is what is recorded and measured for the chromatogram.


DATA ANALYSIS
QUALITATIVE AND QUANTITATIVE
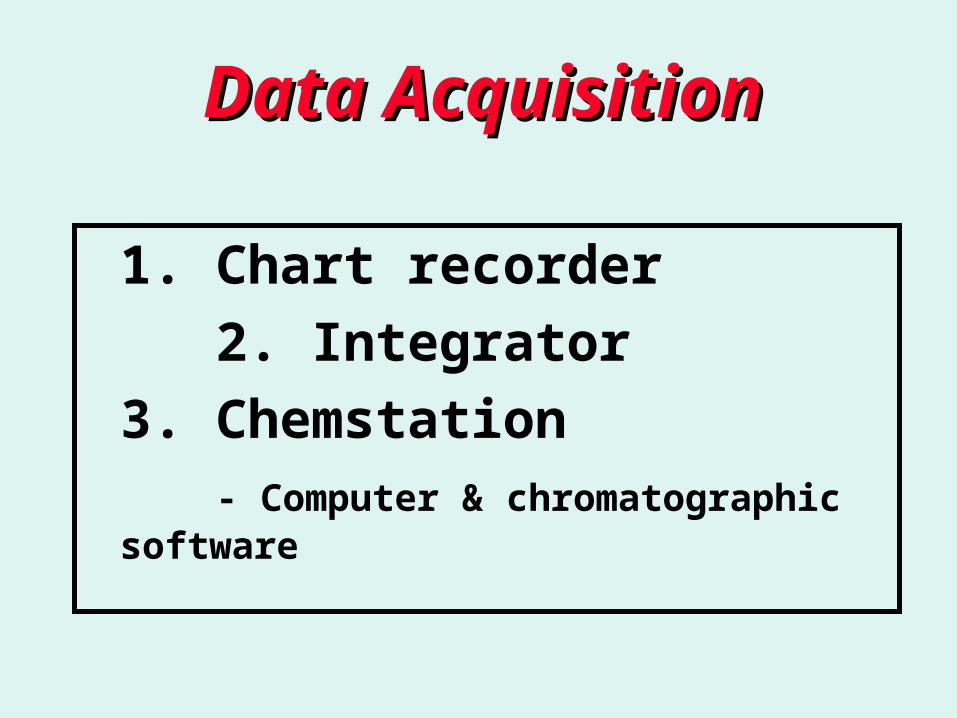
Data AcquisitionData Acquisition
1. Chart recorder
2. Integrator
3. Chemstation - Computer & chromatographic
software

Qualitative Qualitative AnalysisAnalysis
1. Direct Comparison of Retention Time
The simplest procedure in the identification of
unknown. A known standard is first analysed under the specific GC conditions, followed by the unknown also under the similar conditions.
The difference in the retention times should not be more than +/-0.1 min for proper identification

Qualitative Qualitative AnalysisAnalysis
1. Identification by Log Plotting of Homologous SeriesA. Semi-log plotting, one columnLog R t vs C n or B p or (CH2)n
B. Log-log plotting, two columnsLog R t(non polar) vs Log R t (polar)
Retention timeRetention time
Number of Carbon AtomsNumber of Carbon Atoms
n-paraffinsn-paraffinsn-paraffinsn-paraffins
EstersEstersEstersEsters
100100
1010
.. 1.01.0
0.10.1
Retention Time Retention Time (non-polar)(non-polar)
Retention Time Retention Time
(polar)(polar)
AlkeneAlkeness100100
1010
1.01.0
0.10.10.10.1 1.01.0 1010 100100
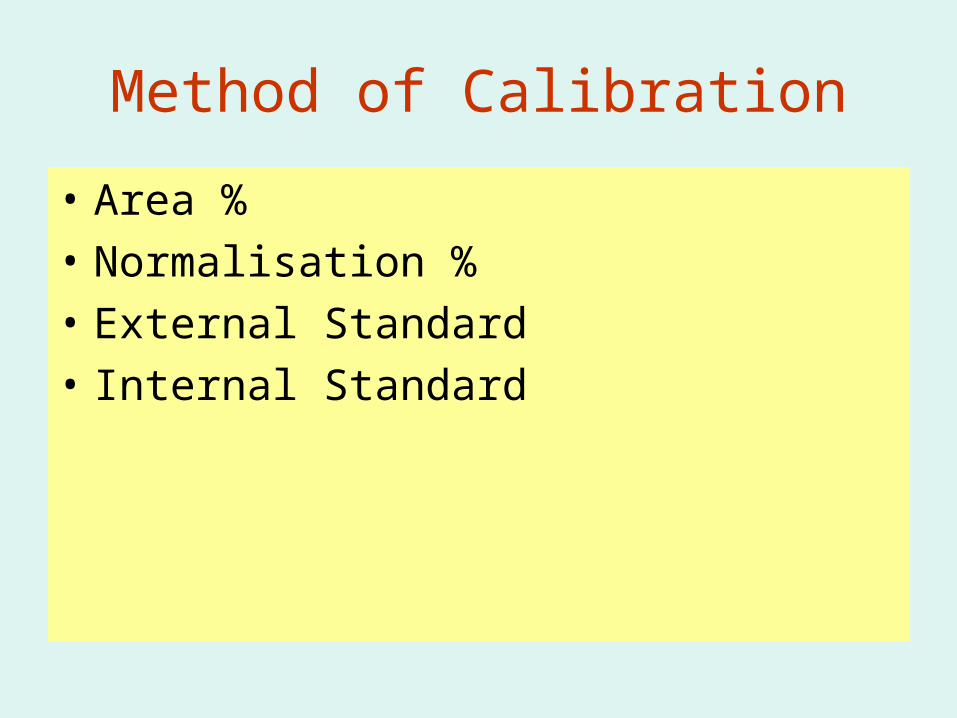
Method of Calibration
• Area %
• Normalisation %
• External Standard
• Internal Standard
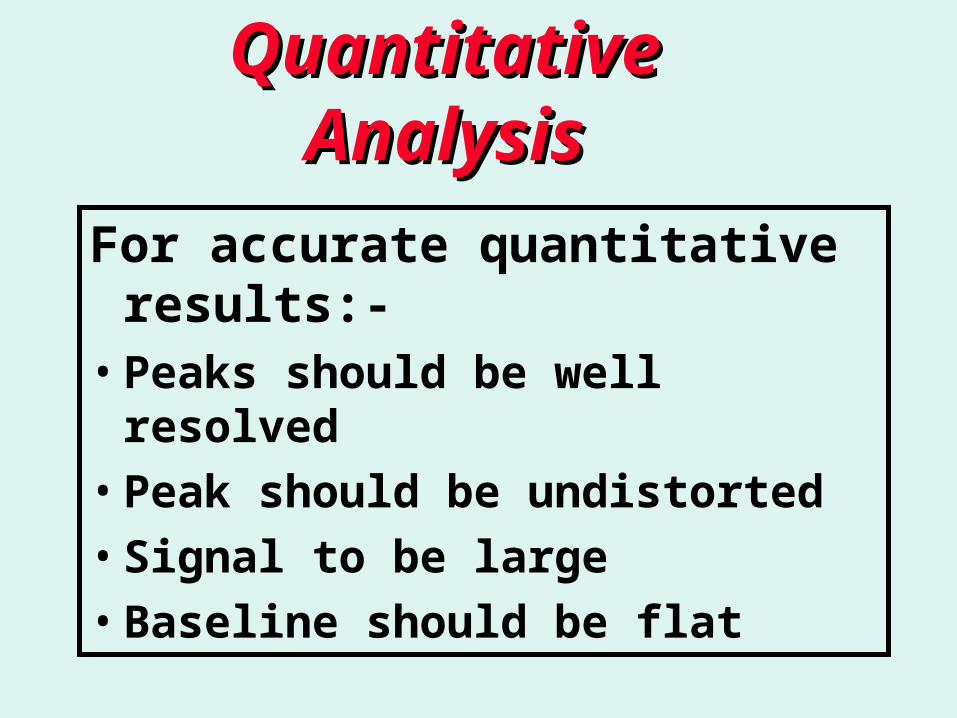
Quantitative Quantitative AnalysisAnalysis
For accurate quantitative results:-
• Peaks should be well resolved
• Peak should be undistorted
• Signal to be large
• Baseline should be flat
ADVANTAGES DISADVANTAGES
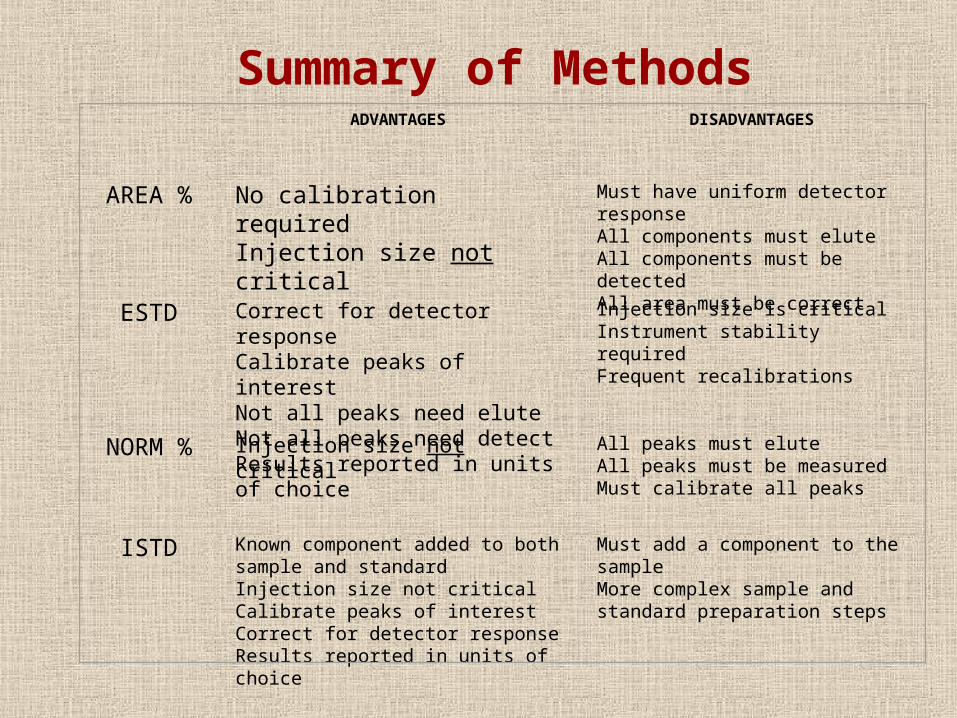
AREA % No calibration required Injection size not critical
Must have uniform detector responseAll components must eluteAll components must be detectedAll area must be correct
ESTD Correct for detector responseCalibrate peaks of interestNot all peaks need eluteNot all peaks need detectResults reported in units of choice
Injection size is criticalInstrument stability requiredFrequent recalibrations
NORM % Injection size not critical All peaks must eluteAll peaks must be measuredMust calibrate all peaks
ISTD Known component added to both sample and standardInjection size not critical Calibrate peaks of interestCorrect for detector responseResults reported in units of choice
Must add a component to the sampleMore complex sample and standard preparation steps
Summary of Methods

Quantitative AnalysisQuantitative Analysis
1. External Standard Method- Concentration of an unknown A
CA = C1/A1 x A A
C =concentration , A = peak area
2. Internal Standard Method - Concentration of an unknown X
Cx = (CA /CS)/(AA /AS) x AX /AIS x WiS
IS, S=internal standards
ConcentrationConcentration
Peak AreaPeak Area
concentration ratioconcentration ratio
peak area ratiopeak area ratio
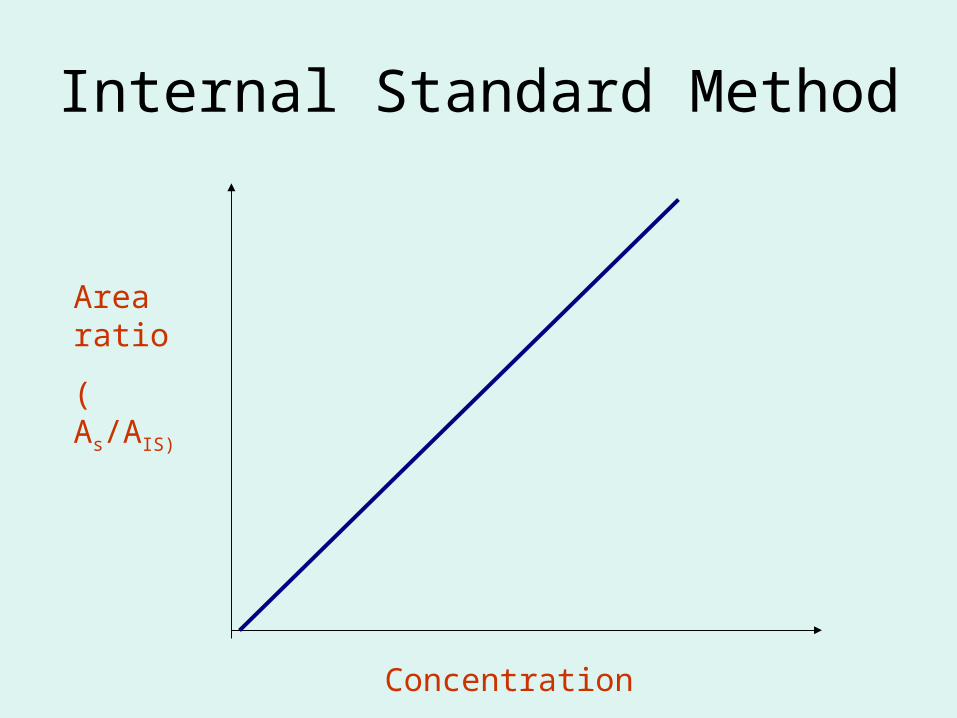
Internal Standard Method
Area ratio
( As/AIS)
Concentration
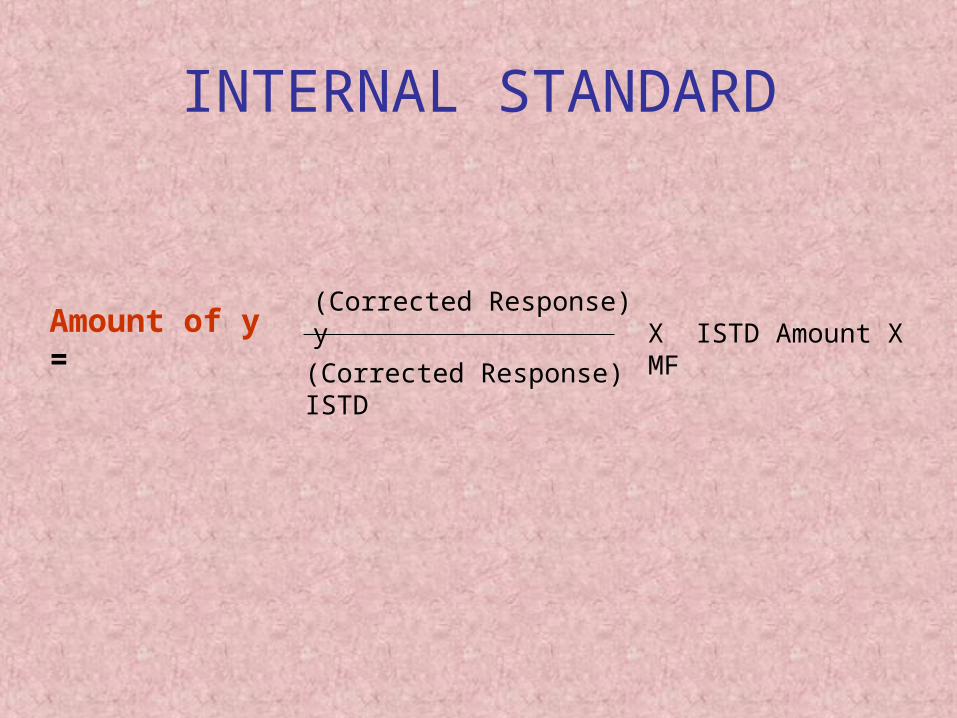
INTERNAL STANDARD
Amount of y = (Corrected Response) y
(Corrected Response) ISTD
X ISTD Amount X MF

EXTERNAL STANDARD
Amount of y = (Corrected Response) y X MF
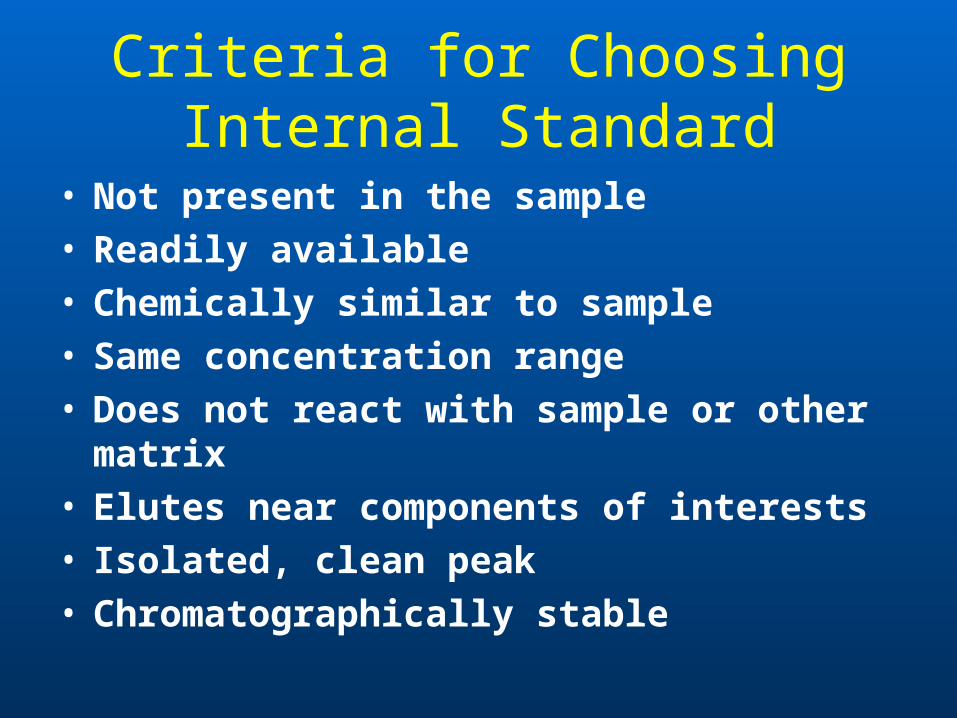
Criteria for Choosing Internal Standard
• Not present in the sample• Readily available• Chemically similar to sample• Same concentration range• Does not react with sample or other matrix• Elutes near components of interests• Isolated, clean peak• Chromatographically stable

Advantage of external standard calibration method
• Only the target compound separation can be focused.
TargetTarget TargetTarget
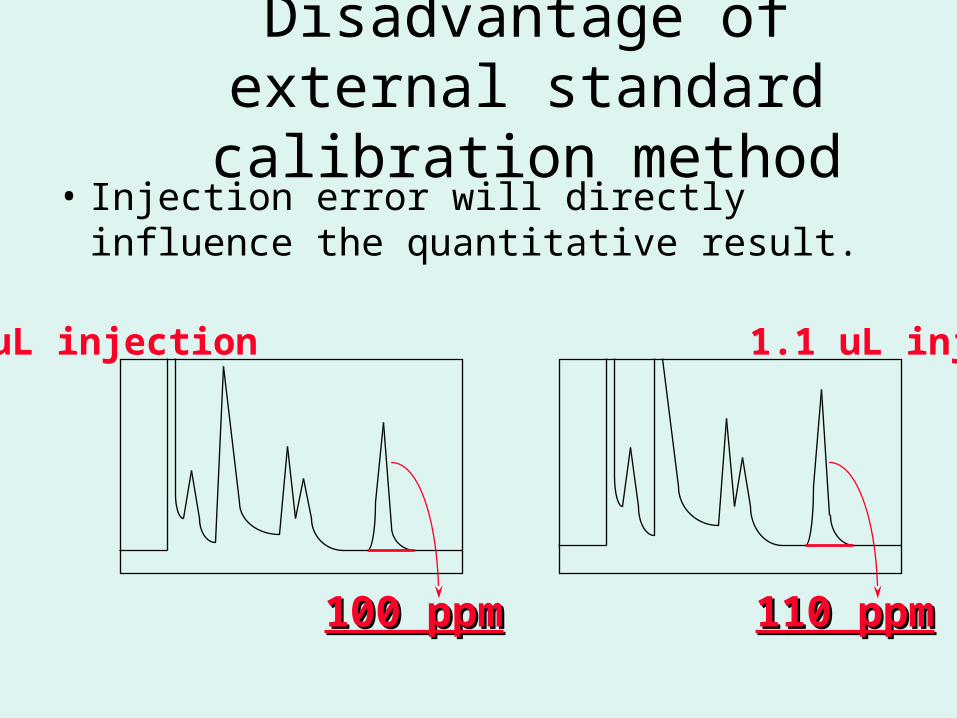
Disadvantage of external standard calibration method
• Injection error will directly influence the quantitative result.
1.0 uL injection 1.1 uL injection
100 ppm100 ppm 110 ppm110 ppm
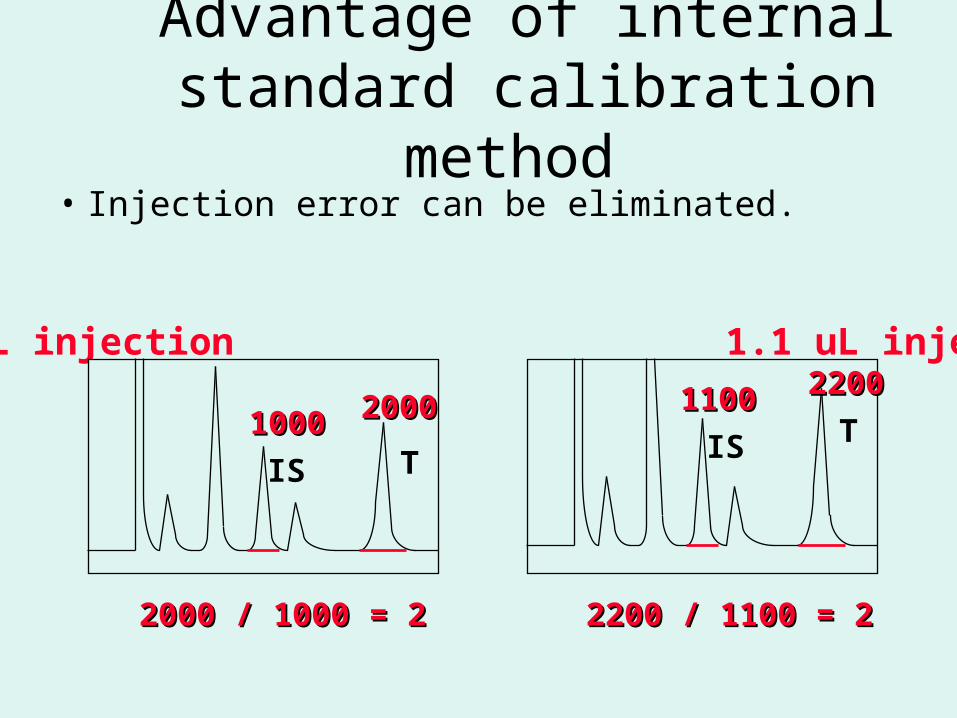
Advantage of internal standard calibration method
• Injection error can be eliminated.
2000 / 1000 = 22000 / 1000 = 2 2200 / 1100 = 22200 / 1100 = 2
1.0 uL injection 1.1 uL injection
11001100 22002200
IS10001000 20002000
IS TT

Disadvantage of internal standard calibration method
• Separation is slightly difficult.
ISISTT
TTISIS TTISIS
Disadvantage of internal standard calibration method
• It is difficult to look for the IS compound.– The chemical structure of IS compound
is similar with one of target compound.
– IS sample is not existent in the actual sample.
