journal of eta maritime science
TRANSCRIPT
Journal of ETA Maritime Science
Mustaffa et al. / JEMS, 2016; 4(4): 333-341
DOI ID: 10.5505/jems.2016.60352
Original Research (AR)
Original Research (AR)
Marine Traffic Density Over Port Klang, Malaysia Using Statistical Analysis of AIS Data: A Preliminary Study
Masnawi MUSTAFFA1, Munawwarah ABAS1, Shaharudin AHMAD2, Nazli Ahmad AINI1, Wan Faezah ABBAS3, Syahrul Afzal Che ABDULLAH4, Nur Idora Abd. RAZAK4, Mohamad Yusof DARUS3
1Faculty of Applied Sciences, Universiti Teknologi Mara, Malaysia, [email protected]; [email protected]; [email protected] of Mechanical Engineering, Universiti Teknologi Mara, Malaysia, [email protected] of Computer Sciences and Mathematical Sciences, Universiti Teknologi Mara, Malaysia, [email protected]; [email protected] of Electrical Engineering, Universiti Teknologi Mara, Malaysia, [email protected]; [email protected]
AbstractPort Klang Malaysia is the 13th busiest port in the world, the capacity at the port expected to be able to meet the demand until 2018. It is one of the busiest ports in the world and also the busiest port in Malaysia. Even though there are statistics published by Port Klang Authority showing that a lot of ships using this port, this number is only based on ships that entering Port Klang. Therefore, no study has been done to investigate on how dense the traffic is in Port Klang, Malaysia the surrounding sea including Strait of Malacca . This paper has investigated on traffic density over Port Klang Malaysia and its surrounding sea using statistical analysis from AIS data. As a preliminary study, this study only collected AIS data for 7 days to represent daily traffic weekly. As a result, an hourly number of vessels, daily number of vessels, vessels classification and sizes and also traffic paths will be plotted. Keywords: AIS, Vessel, Traffic Density, Traffic Monitoring, Port Klang Malaysia, Navigation.
AIS Verilerinin İstatistiksel Analizi Kullanılarak Klang Limanı (Malezya) Deniz Trafik Yoğunluğunun İncelenmesi: Bir Ön Çalışma
ÖzKlang Limanı (Malezya) dünyanın en yoğun 13. limanıdır. Liman kapasitesinin 2018 yılına kadar talebi karşılayabilmesi beklenmektedir. Klang Limanı, dünyadaki en yoğun limanlardan biri olmakla birlikte Malezya’daki en yoğun limandır. Klang Liman İdaresi tarafından yayınlanan, bu limanı kullanan çok sayıda gemi olduğunu gösteren istatistikler olsa da, bu sayı yalnızca Klang Limanı’na giriş yapan gemilere dayanmaktadır. Bu nedenle, Malakka Boğazı dahil olmak üzere Klang Limanı çevresindeki deniz trafik yoğunluğunu araştırmak üzere herhangi bir çalışma yapılmamıştır. Bu çalışma, AIS verilerinin istatistiksel analizini yaparak Klang Limanı ve çevresindeki deniz trafik yoğunluğunu incelemiştir. Bir ön çalışma olarak, bu çalışmada günlük trafiği haftalık olarak temsil etmek için yalnızca 7 günlük AIS verisi toplanmıştır.Sonuç olarak gemilerin saatlik sayısı, günlük sayısı, gemilerin sınıflandırılması, boyutları ve ayrıca trafik yollarının haritası çıkarılmış olacaktır.
Anahtar Kelimeler: AIS, Gemi, Trafik Yoğunluğu, Trafik Gözetleme, Klang Limanı Malezya, Seyir
Corresponding Author: Masnawi MUSTAFFA
Received: 21 April 2016 Accepted: 14 November 2016
333
334
© UCTEA The Chamber of Marine Engineers Journal of ETA Maritime Science
1. IntroductionPort Klang Malaysia is the major logistic
hub of Malaysia and one of the busiest ports in South East Asia region. There are a large number of vessels or cargo ships transporting using the waterway in Port Klang Malaysia. Group [1] reported that in the first half of 2012 Port Klang Malaysia handled 5 million Twenty-Foot Equivalent Unit (TEU) of container traffic in total, up to 67% from 4.7 million TEUs during the same period previous year.
As one of the busiest container port in South East Asia, Port Klang Malaysia is actually made up of two separate ports: West port and North port. In the first half of 2012, Port Klang Malaysia as a whole, has 53 berths with a total length of 11.348 meters, including 24 container berths, with 6079 meters in total; 11 break-bulk berths,
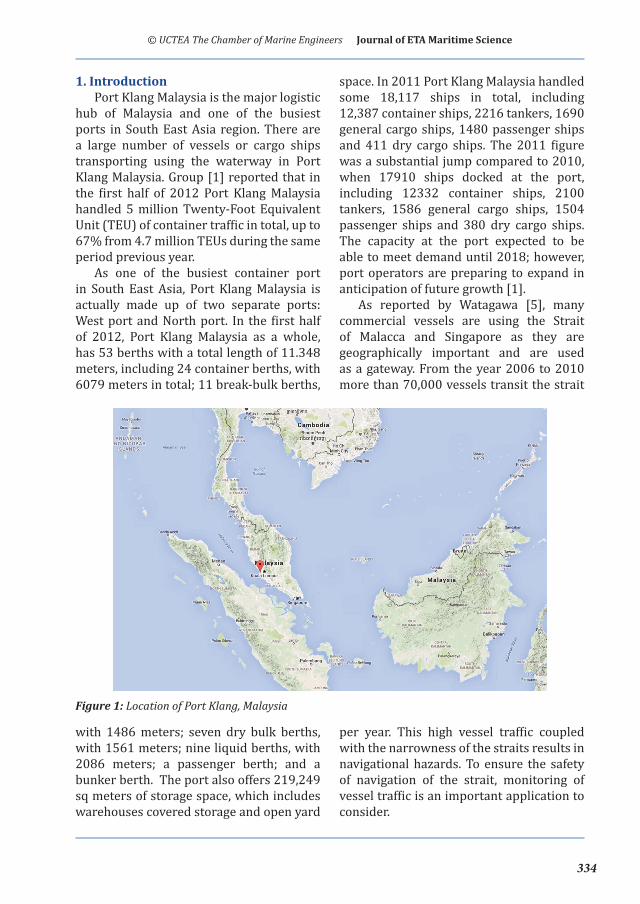
with 1486 meters; seven dry bulk berths, with 1561 meters; nine liquid berths, with 2086 meters; a passenger berth; and a bunker berth. The port also offers 219,249 sq meters of storage space, which includes warehouses covered storage and open yard
Figure 1: Location of Port Klang, Malaysia
space. In 2011 Port Klang Malaysia handled some 18,117 ships in total, including 12,387 container ships, 2216 tankers, 1690 general cargo ships, 1480 passenger ships and 411 dry cargo ships. The 2011 figure was a substantial jump compared to 2010, when 17910 ships docked at the port, including 12332 container ships, 2100 tankers, 1586 general cargo ships, 1504 passenger ships and 380 dry cargo ships. The capacity at the port expected to be able to meet demand until 2018; however, port operators are preparing to expand in anticipation of future growth [1].
As reported by Watagawa [5], many commercial vessels are using the Strait of Malacca and Singapore as they are geographically important and are used as a gateway. From the year 2006 to 2010 more than 70,000 vessels transit the strait
per year. This high vessel traffic coupled with the narrowness of the straits results in navigational hazards. To ensure the safety of navigation of the strait, monitoring of vessel traffic is an important application to consider.
335
It is possible to consider various methods of observation by using AIS system and all information about the ships movement in certain location of sea area could be obtained. Data obtained from AIS are referring to geographical position, courses, physical parameters of ship as well as kind of transportation, could be presented in the figure of a simplified diagram [3].
To identify and locate vessels by electronically exchanging data with other nearby ships, AIS was used on ships and units ashore [2]. To provide accessible, up-to-date information on vessel activity in the marine environment, AIS is used and is becoming increasingly popular with marine vessels [4]. In this study, traffics density over Port Klang, Malaysia are investigated using several variables such as number of vessels, type of cargo and also traffic path.
2. Related Research of AISTo indicate the relatively dangerous
shipping area, by using the rate of ships’ turn, speed acceleration and ship encounters are incorporated into a new index from Ship’s Automatic Identification System as a novel visualization model has been proposed to appraise the maritime traffic situation [2].
AIS data was used in Traffic Separation Scheme (TSS) of the Strait of Malacca and Singapore and produce a statistical include number of vessels, traffic density, and direction of traffic flow as a method to estimate the probability of collision from AIS data was presented to assess the collision risk [6].
In Traffic Route Measurements, the investigation is to illustrate the effort of traffic route measurement by comparison of various route version and to prognose the validity of favored route proposals for expected traffic profile or density in future [10].
A ships routing system which cover areas with high maritime traffic density, sensitive areas and areas dangerous for
shipping and mandatory vessel traffic services that will seek to address such issues was approved by IMO International Maritime Organization. The history of the present form of marine commercial activity especially the rise of the use of the container for the carriage of maritime cargoes was addressed [8].
3. Problem StatementPort Klang, Malaysia is known as the
major logistic hub in Malaysia. It is one of the busiest ports in the world and also the busiest in Malaysia. Even though there are statistics published by Port Klang Authority[13], no study had been done yet to investigate on how dense the traffics are in Port Klang, Malaysia and surrounding sea including Strait of Malacca.
4. Methodology4.1. Equipments
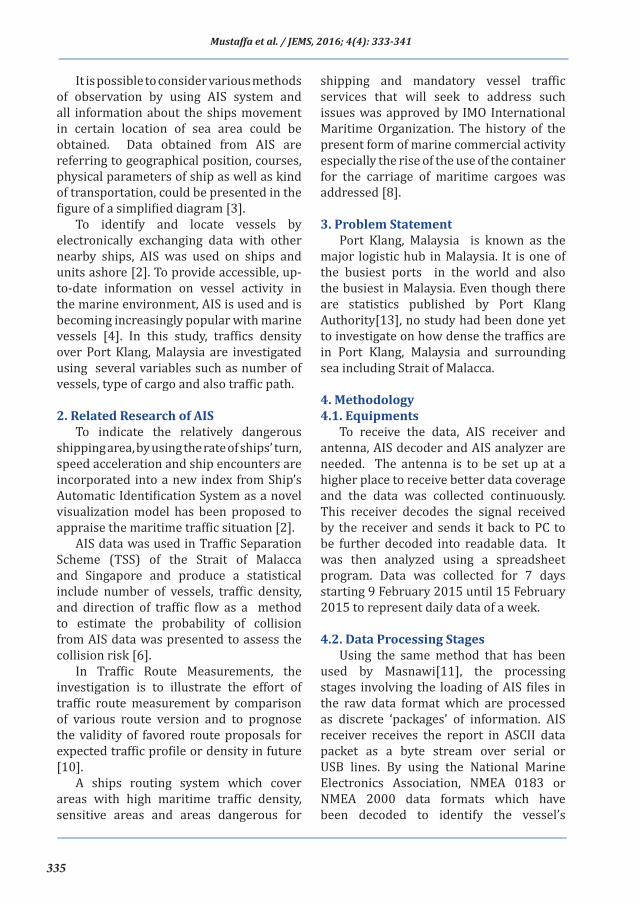
To receive the data, AIS receiver and antenna, AIS decoder and AIS analyzer are needed. The antenna is to be set up at a higher place to receive better data coverage and the data was collected continuously. This receiver decodes the signal received by the receiver and sends it back to PC to be further decoded into readable data. It was then analyzed using a spreadsheet program. Data was collected for 7 days starting 9 February 2015 until 15 February 2015 to represent daily data of a week.
4.2. Data Processing StagesUsing the same method that has been
used by Masnawi[11], the processing stages involving the loading of AIS files in the raw data format which are processed as discrete ‘packages’ of information. AIS receiver receives the report in ASCII data packet as a byte stream over serial or USB lines. By using the National Marine Electronics Association, NMEA 0183 or NMEA 2000 data formats which have been decoded to identify the vessel’s
Mustaffa et al. / JEMS, 2016; 4(4): 333-341
336
© UCTEA The Chamber of Marine Engineers Journal of ETA Maritime Science
Maritime Mobile Service Identity (MMSI), navigation status, rate of turn, speed over ground, true heading and time stamp. All the decoded data is saved in a comma separated values (CSV) file. Due to the size of the data collected and lack of processing equipment and computer, all of the CSV file collected was only analyzed using common spreadsheet program available.
Figure 2: Equipment Setup[14]
5. Result and AnalysisThe Automatic identification System
(AIS) is a system that can transmit accurate data and possible to conduct more investigation on the actual behavior of the traffic density. This system allows automatic exchange of information (ships and coastal) using very high frequency (VHF) radio waves. There are 27 message types defined in International Telecommunication Union (ITU) and two classes of shipboard equipment: class A (used mainly by commercial vessels), while class B (used mainly by fishing vessels and pleasure craft). The information contained in AIS message is decoded by using National Marine Electronic Association, NMEA 0183 or NMEA 2000 data formats. These messages are interpreted to identify the vessel’s Maritime Mobile Service Identify (MMSI), International Maritime Organization (IMO) number, ship type, length, breadth, position fix type and draught [9].
In this study of marine traffic, density over Port Klang Malaysia as a reference point for the study area and the AIS message transmitted by vessels was interpreted,
analyzed and investigated based on the AIS data recorded for 5 days received by VHF antenna and AIS receiver station.
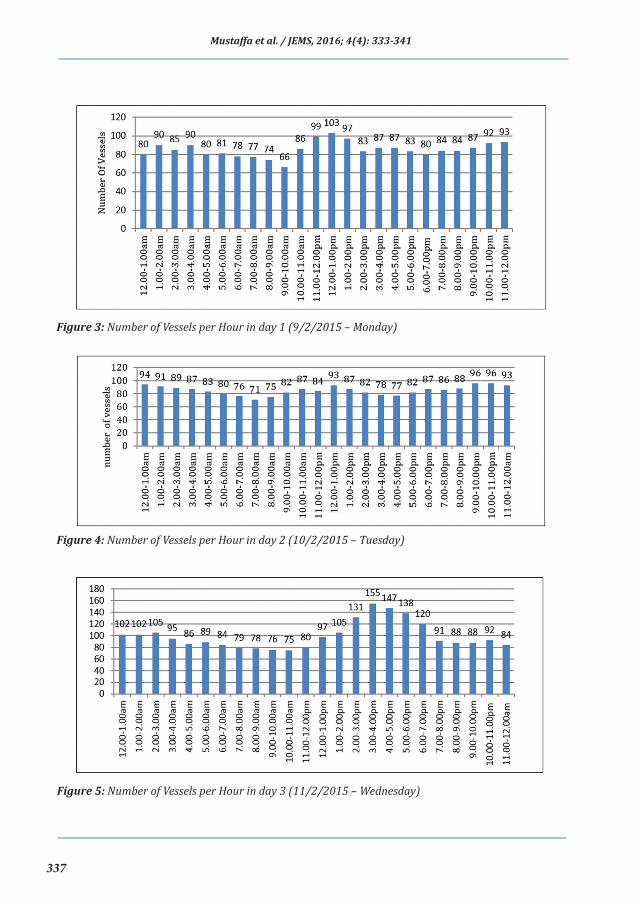
5.1. Hourly Number of VesselsIn day 1 as in Figure 3, the data was
collected per hours from 9.00 am until 12.00 pm. From the figure, the statistic shows fewer numbers of vessels from 9.00 am to 10.00 am. Then, at peak hours from 12.00 pm to 1.00 pm, the number of vessels was increased to highest. The hourly average was 87.9, and the median calculated for day 1 was in between 2.00 pm to 3.00 pm.
Figure 4 shows that in day 2. The data was collected for 24 hours and the statistic data shows fewer numbers of the vessel from 7.00 am to 8.00 am and the next lower number of the vessels from 4.00 pm to 5.00 pm. The peak hours from 9.00 pm to 11.00 pm the number of vessels recorded are 96. The hourly average for day 2 was 85.18, and the median calculated for day 2 was in between 12.00 pm to 1.00 pm.
In day 3 as shown in Figure 5, fewer number of vessels were recorded from 10.00 am to 11.00 am. Furthermore, at peak hours from 3.00 pm to 4.00 pm, the number of vessels was increased to 155. The hourly average for day 3 was 99.48, and the median for day 1 was in between 1.00 pm to 2.00 pm.
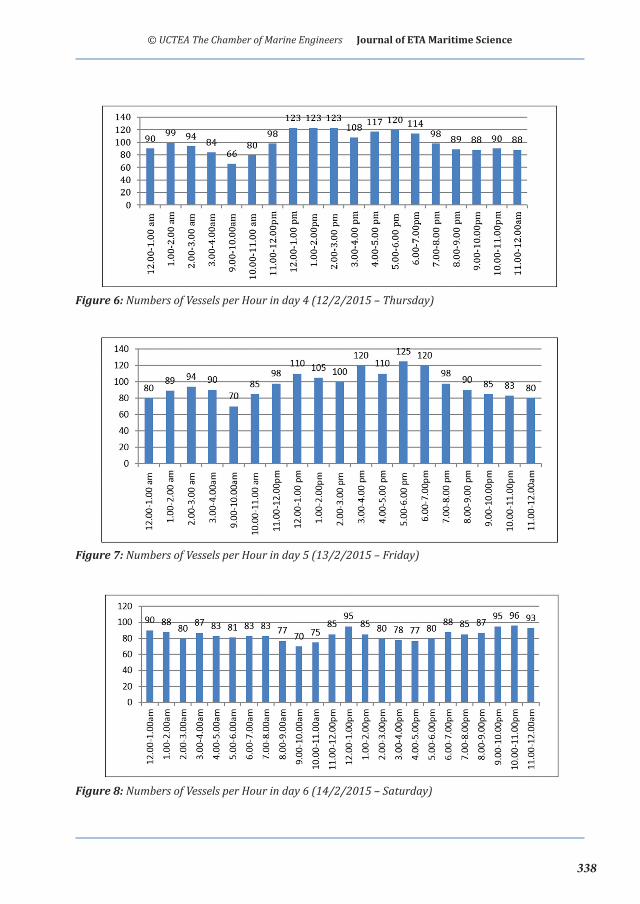
Figure 6 shows number of vessels per hour in day 4, less number of vessel recorded from 9.00 am to 10.00 am, the peak hours is from 12.00 pm to 3.00 pm, about 123 vessels was recorded from AIS data. The hourly average was 99.58, and the median for day 4 was in between 2.00 pm to 3.00 pm.
In day 5 as shows in Figure 7, number of vessels per hour shows less number of vessel recorded at 9.00 am to 10.00 am, the peak hours is from 3.00 pm to 7.00 pm, about 94 vessels was recorded from AIS data. The hourly average was 96, and the median for day 5 was in between 2.00 pm to 3.00 pm.
337
Figure 3: Number of Vessels per Hour in day 1 (9/2/2015 – Monday)
Figure 4: Number of Vessels per Hour in day 2 (10/2/2015 – Tuesday)
Figure 5: Number of Vessels per Hour in day 3 (11/2/2015 – Wednesday)
Mustaffa et al. / JEMS, 2016; 4(4): 333-341
338
© UCTEA The Chamber of Marine Engineers Journal of ETA Maritime Science
Figure 6: Numbers of Vessels per Hour in day 4 (12/2/2015 – Thursday)
Figure 7: Numbers of Vessels per Hour in day 5 (13/2/2015 – Friday)
Figure 8: Numbers of Vessels per Hour in day 6 (14/2/2015 – Saturday)
339
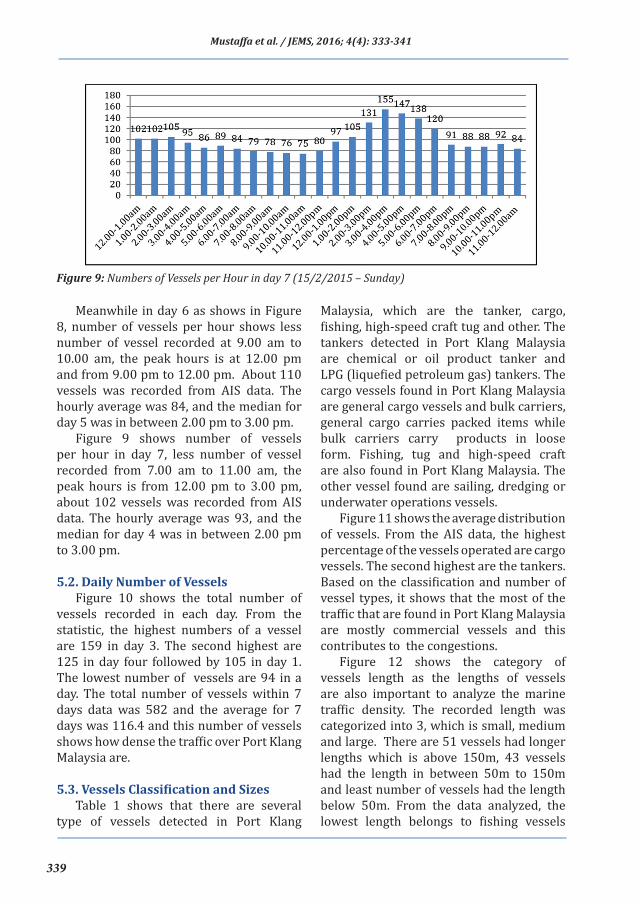
Figure 9: Numbers of Vessels per Hour in day 7 (15/2/2015 – Sunday)
Meanwhile in day 6 as shows in Figure 8, number of vessels per hour shows less number of vessel recorded at 9.00 am to 10.00 am, the peak hours is at 12.00 pm and from 9.00 pm to 12.00 pm. About 110 vessels was recorded from AIS data. The hourly average was 84, and the median for day 5 was in between 2.00 pm to 3.00 pm.
Figure 9 shows number of vessels per hour in day 7, less number of vessel recorded from 7.00 am to 11.00 am, the peak hours is from 12.00 pm to 3.00 pm, about 102 vessels was recorded from AIS data. The hourly average was 93, and the median for day 4 was in between 2.00 pm to 3.00 pm.
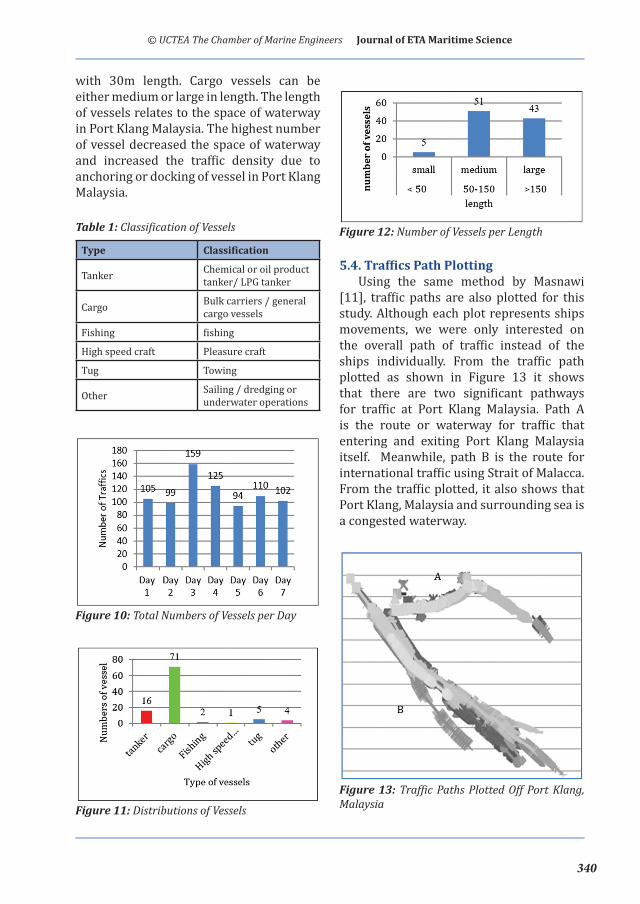
5.2. Daily Number of VesselsFigure 10 shows the total number of
vessels recorded in each day. From the statistic, the highest numbers of a vessel are 159 in day 3. The second highest are 125 in day four followed by 105 in day 1. The lowest number of vessels are 94 in a day. The total number of vessels within 7 days data was 582 and the average for 7 days was 116.4 and this number of vessels shows how dense the traffic over Port Klang Malaysia are.
5.3. Vessels Classification and SizesTable 1 shows that there are several
type of vessels detected in Port Klang
Malaysia, which are the tanker, cargo, fishing, high-speed craft tug and other. The tankers detected in Port Klang Malaysia are chemical or oil product tanker and LPG (liquefied petroleum gas) tankers. The cargo vessels found in Port Klang Malaysia are general cargo vessels and bulk carriers, general cargo carries packed items while bulk carriers carry products in loose form. Fishing, tug and high-speed craft are also found in Port Klang Malaysia. The other vessel found are sailing, dredging or underwater operations vessels.
Figure 11 shows the average distribution of vessels. From the AIS data, the highest percentage of the vessels operated are cargo vessels. The second highest are the tankers. Based on the classification and number of vessel types, it shows that the most of the traffic that are found in Port Klang Malaysia are mostly commercial vessels and this contributes to the congestions.
Figure 12 shows the category of vessels length as the lengths of vessels are also important to analyze the marine traffic density. The recorded length was categorized into 3, which is small, medium and large. There are 51 vessels had longer lengths which is above 150m, 43 vessels had the length in between 50m to 150m and least number of vessels had the length below 50m. From the data analyzed, the lowest length belongs to fishing vessels
Mustaffa et al. / JEMS, 2016; 4(4): 333-341
340
© UCTEA The Chamber of Marine Engineers Journal of ETA Maritime Science
with 30m length. Cargo vessels can be either medium or large in length. The length of vessels relates to the space of waterway in Port Klang Malaysia. The highest number of vessel decreased the space of waterway and increased the traffic density due to anchoring or docking of vessel in Port Klang Malaysia.
Table 1: Classification of Vessels
Type Classification
Tanker Chemical or oil product tanker/ LPG tanker
Cargo Bulk carriers / general cargo vessels
Fishing fishing
High speed craft Pleasure craft
Tug Towing
Other Sailing / dredging or underwater operations
Figure 10: Total Numbers of Vessels per Day
Figure 11: Distributions of Vessels
Figure 12: Number of Vessels per Length
5.4. Traffics Path PlottingUsing the same method by Masnawi
[11], traffic paths are also plotted for this study. Although each plot represents ships movements, we were only interested on the overall path of traffic instead of the ships individually. From the traffic path plotted as shown in Figure 13 it shows that there are two significant pathways for traffic at Port Klang Malaysia. Path A is the route or waterway for traffic that entering and exiting Port Klang Malaysia itself. Meanwhile, path B is the route for international traffic using Strait of Malacca. From the traffic plotted, it also shows that Port Klang, Malaysia and surrounding sea is a congested waterway.
Figure 13: Traffic Paths Plotted Off Port Klang, Malaysia
341
6. Conclusions and RecommendationsThis study has shown that Automatic
Identification System (AIS) data collected provides a very useful source of information for marine traffic density studies at Port Klang Malaysia and its surrounding sea. In addition, AIS data recorded have been used to perform statistical analysis and also visual path analysis of the marine traffic density at Port Klang Malaysia.
As a suggestion, we would like to recommend a traffic density study for whole year over Port Klang, Malaysia and also covering all traffic of Strait of Malacca starting from Penang Island, Malaysia to Johor, Malaysia and also Singapore. By using this statistical, estimation of pollutions by the ships and vessel could also be investigated.
References[1] Group, O. B. (2012). “The Report:
Malaysia 2012”. Oxford Business Group.
[2] Jiacai, P., Qingshan, J., Jinxing, H., and Zheping, S. (2012). “An AIS data Visualization Model for Assessing Maritime Traffic Situation and its Applications”. Procedia Engineering, 29(0), 365-369.
[3] Naus, Makar, A., and Apanowicz, J. (2007). “Usage AIS Data for Analyzing Ship’s Motion Intensity”. TransNav, the International Journal on Marine Navigation and Safety of Sea Transportation, 1(3), 237-242.
[4] Shelmerdine, R. L. (2015). “Teasing out the detail: How our understanding of marine AIS data can better inform industries, developments, and planning”. Marine Policy, 54(0), 17-25.
[5] Watagawa, M., Kobayashi, E., and Wakabayashi, N. (2012, 21-24 May 2012). “Monitoring of vessel traffic using AIS data and ALOS satellite image”. Paper presented at the OCEANS, 2012 - Yeosu.
[6] Olanrewaju, O. S. (2013). “Marine Technology and Sustainable Development”. Green Innovations.
[7] Richards, S. (2013). “Reeds Vol 15: Electronics, Navigational Aids and Radio Theory for Electrotechnical Officers”. A&C Black.
[8] Rowbotham, M. (2013). “Introduction to Marine Cargo Management”. Taylor, & Francis.
[9] Silveira, P. A. M., Teixeira, A.P. and Guedes Soares, C. (2013). “Use of AIS Data to Characterise Marine Traffic Patterns and Ship Collision Risk off the Coast of Portugal”. The Journal of Navigation 66(06): 879-898.
[10] Weintrit, A. (2013). “Marine Navigation and Safety of Sea Transportation: Navigational Problems”. Taylor & Francis.
[11] Mustaffa, M, Ahmat, N.H. and Ahmad, S. (2015). “Mapping Vessel Path of Marine Traffic Density of Port Klang, Malaysia using Automatic Identification System (AIS) Data”. International Journal of Science and Research 4(11): 245-248.
[12] Xiao, F., Ligteringen, H., Gulijk, C.V. and Ale, B. (2012). “Artificial Force Fields for Multi-agent Simulations of Maritime Traffic: A Case Study of Chinese Waterway”. Procedia Engineering 45(0): 807-814.
[13] Port Klang Statistics. (2015). Retrieved August 20, 2015, from http://www.pka.gov.my/index.php/en/component/content/article/127-port-klang-statistics.html.
[14] AIS (Automatic Identification System). (2015). Retrieved August 21, 2015, from http://www.discriminator.nl/ais/index-en.html.
Mustaffa et al. / JEMS, 2016; 4(4): 333-341