food chemistry monitoring the storage stability of rbd
TRANSCRIPT
Food
FOCH 4021
DISK / 19/4/04
No. of pages: 12
DTD 4.3.1 / SPS-NARTICLE IN PRESS
Food Chemistry xxx (2004) xxx–xxx
www.elsevier.com/locate/foodchem
Chemistry
Monitoring the storage stability of RBD palm olein usingthe electronic nose
H.L. Gan a, C.P. Tan a, Y.B. Che Man a,*, I. NorAini b, S.A.H. Nazimah c
a Department of Food Technology, Faculty of Food Science and Biotechnology, University Putra Malaysia, 43400 UPM, Serdang, Selangor, Malaysiab Malaysian Palm Oil Board, P.O. Box 10620, 50720 Kuala Lumpur, Malaysia
c Department of Food Science, Faculty of Food Science and Biotechnology, University Putra Malaysia, DE 43400 UPM, Serdang, Selangor, Malaysia
Received 20 October 2003; received in revised form 16 February 2004; accepted 16 February 2004
Abstract
Storage stability of RBD palm olein was monitored using a surface acoustic wave (SAW) sensor-based electronic nose. Fatty acid
composition, iodine value (IV), peroxide value (PV), and free fatty acid content (FFA) analyses were used to determine the quality
of the oils and to compliment the electronic nose data. A descriptive test was carried out by sensory analysis with ten trained
panellists. The results from the electronic nose showed significant difference between fresh oil and rancid oil. High resolution ol-
factory imaging, called VaporPrintTM, was shown to be particularly useful for assessing oil quality in its entirety. A high correlation
was observed between electronic nose responses and chemical test data, as well as sensory evaluation score, by using Pearson’s
correlation. It can be concluded that the SAW sensor based electronic nose may be utilized as an analytical tool to follow the
progress of oxidation and breakdown of vegetable oil.
� 2004 Elsevier Ltd. All rights reserved.
Keywords: Electronic nose; Fingerprint; Rancidity; RBD palm olein; Surface acoustic wave sensor
1. Introduction
Vegetable oil quality and stability are the main fac-tors that influence its acceptability and market value.
Oxidative stability is one of the most important indica-
tors of the keeping quality of vegetable oils (Tan & Che
Man, 2002). In general, the term rancidity has been used
to describe the mechanisms by which lipids alter in the
presence of oxygen or air (Hamilton, 1989). Today,
rancidity in processed food is becoming increasingly
important as manufacturers require longer shelf-livesand because of public awareness of nutritional issues.
Oxidative deterioration of fat results in the develop-
ment of a pungent and offensive off-flavour and the
destruction of vitamins (A, D, E, K and C), essential
fatty acids, chlorophylls, carotenes, amino acids, pro-
teins, or enzymes by the production of toxic or physio-
* Corresponding author. Tel.: +60-3-89468413; fax: +60-3-89423552.
E-mail address: [email protected] (Y.B.Che Man).
0308-8146/$ - see front matter � 2004 Elsevier Ltd. All rights reserved.
doi:10.1016/j.foodchem.2004.02.034
logically active compounds (Gardner, 1979) and is
believed to lead to deteriorative processes in man, in-
cluding aging (Pearson, Gray, Wolzak, & Horenstein,1983).
In general, the time before a dramatic increase in the
rate of lipid oxidation is a measure of oxidative stability
and is referred to as the induction time (Coppin & Pike,
2001). Historically, the Schaal Oven Test (SOT) and the
Active Oxygen Method (AOM) have been the most
widely used tests for evaluating oil stability (Wan, 1995).
Many objective instrumental and chemical methodshave been proposed over the years to evaluate the
quality and stability of vegetable oils.
However, faster qualitative and quantitative analyses
of chemical compounds are becoming a necessity in
today’s complex competitive environment. Of all the
devices developed, the concept of an electronic nose is
becoming popular. Electronic noses made their ap-
pearance in the market almost a decade ago. The elec-tronic nose is preferred to routine laboratory analysis
2 H.L. Gan et al. / Food Chemistry xxx (2004) xxx–xxx
FOCH 4021
DISK / 19/4/04
No. of pages: 12
DTD 4.3.1 / SPS-NARTICLE IN PRESS
because it is rapid, simple and easy-to-handle (Biswas,
Heindselmen, Wohltjen, & Staff, 2004).
An electronic nose is a vapour analyzer and, the
working principle is claimed to mimic the human nose.
The sensory array represents the sensors in the humannose. The circuitry represents the conversion of the
chemical reaction on the human sensors to electrical
signals into the brain. Finally, the software analysis
represents the brain itself. The electronic nose is there-
fore analogous to the human olfactory system.
An electronic nose must have the ability to recognize
as well as quantify many different complex fragrances.
This is achieved using a visual fragrance pattern, called aVaporPrintTM derived from the frequency of the surface
acoustic wave (SAW) detector. A VaporPrintTM is cre-
ated by transforming the time variable to a radial angle
with the beginning and end of the analysis occurring at
0� or vertical. A complete chromatogram always spans
360�. A VaporPrintTM image allows a complex ambient
environment to be viewed entirely. Using the unsur-
passed ability of humans to recognize patterns, skilledoperators are able to assess the nature of vapours and to
look for analytes of interest rapidly (Staples, 1999). The
objective of this study was to develop a rapid method to
identify and quantify the storage stability of RBD palm
olein using a SAW sensor-based electronic nose.
2. Materials and methods
2.1. Oil samples
RBD palm olein was purchased from local refineries.
The oil was stored at 2 different storage temperatures:
room temperature, 28� 1 �C and accelerated tempera-
ture using an oven at 60 �C. Data was collected every 2
days for a duration of 52 days.
2.2. Chemical analysis
The chemical analyses, namely free fatty acid con-
tent (FFA), peroxide value (PV), p-anisidine value (AV),
and iodine value (IV), were carried out using AOCS
official methods Ca 5a-40, Cd 8-53, Cd 18-90, and Cd
1b-87, respectively (AOCS, 1996). All chemicals andsolvents used were of analytical grade unless otherwise
specified.
The individual fatty acid composition of fats and oils
were analysed using gas chromatography (Hewlett-
Packard model 5890 instrument, Palo Alto, CA). 0.95
ml of petroleum spirit was added to 50 mg of sample,
followed by 0.05 ml of sodium methoxide (PORIM,
1995). Samples were transesterified to convert the fattyacids into relatively volatile methyl ester derivatives
(FAME). 0.8 ml of sample was injected into the in-
strument, with an inlet temperature at 240 �C. A capil-
lary column BPX70 was used with the column head
pressure maintained at 145 kPa. Helium (99.95%), with
a flow rate 1.3 ml/min, was the carrier gas. The tem-
perature was programmed from 160 �C, equilibrium for
1 min, and then increased to 200 �C at a rate of 10 �C/min, and equilibrium for 2 min. Finally, the temperature
was increased to 240 �C at a rate of 20 �C/min and held
for 1 min. An FID detector was used with the temper-
ature set at 275 �C.
2.3. Sensory evaluation
A descriptive test was carried out for sensory analysisconducted at the Malaysian Palm Oil Board (MPOB)
with 10 trained panellists. Two separate sessions were
conducted for oil samples stored at room temperature
and oven temperature 60 �C. Six samples, coded with 3
random digits, were evaluated during each session (2,
12, 22, 32, 42 and 52 day). 10 g of oil were weighed into
a 30 ml screw cap amber glass bottle. Before evaluation,
the bottles were kept for 30 min in a 50 �C regulatedoven to help the odour develop in the headspace. This
preparation facilitated odour perception by the panel-
lists. Panellists were then instructed to remove the lid of
the bottle and take three short sniffs. They were asked to
rate the overall intensity of the samples according to a
predetermined attribute scale, ranging from 1 (extreme)
to 10 (bland) according to Method Cg 2-83 (AOCS,
1996).
2.4. Electronic nose equipment specifications
The electronic nose (4100 vapour analysis system,
Electronic Sensor Technology, New Bury Park, USA) is
a hand held portable analyzer. The complete system
includes a sensor head, a support chassis, and a system
controller, is housed within a small carrying case. Thesensor head contains the hardware necessary to separate
and detect materials. The support chassis include a small
helium gas tank, power supply and electronics to run the
system. The system controller is based on a laptop
computer.
This electronic nose uses a single, uncoated, high
quartz SAW sensor. The SAW crystal consists of an
uncoated 500 MHz acoustic interferometer or resonatorbonded to a Peltier thermoelectric heat pump with the
ability to heat or cool the quartz crystal. This detector
possesses advantages, such as high sensitivity, easy-to-
handle signal, low power and long term stability.
Coatings are not used because they reduce the resonator
Q, introduce instability, and require excessive time for
equilibrium. Sensitivity is excellent because there is no
dilution of sample vapour. Minimum detection levels forsemi-volatile compounds typically extend well into the
part-per-trillion (ppt) range. The temperature of the
quartz substrate is held constant during chromatogra-
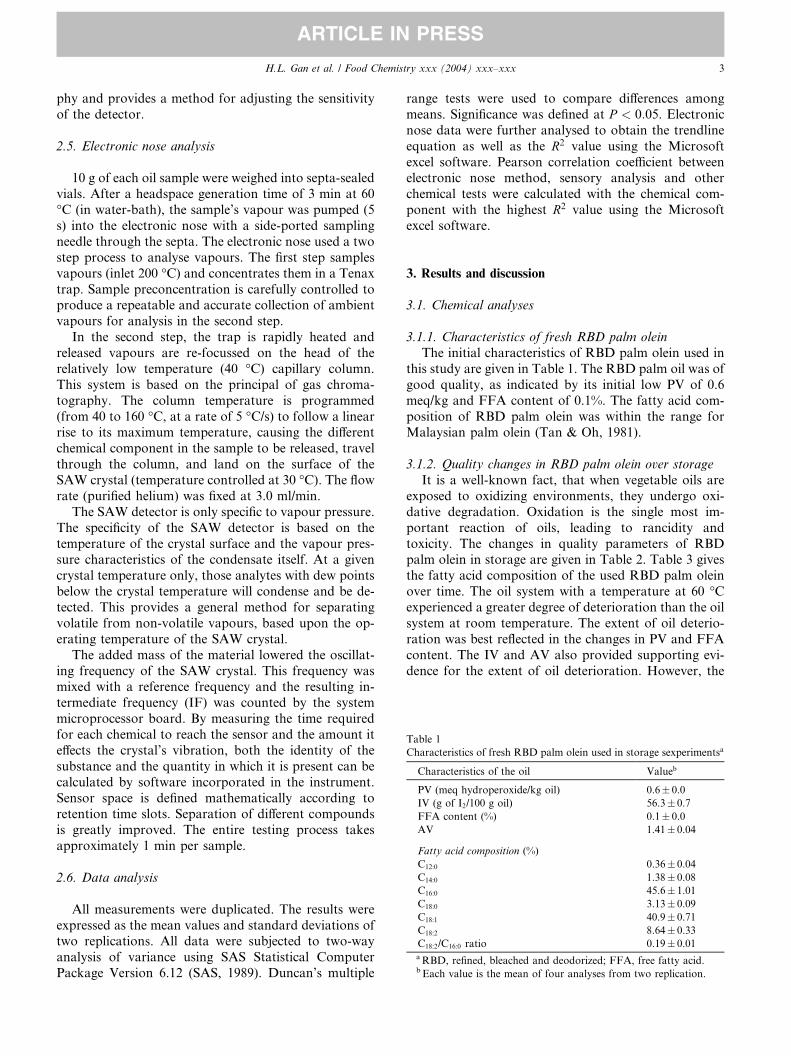
Table 1
Characteristics of fresh RBD palm olein used in storage sexperimentsa
Characteristics of the oil Valueb
PV (meq hydroperoxide/kg oil) 0.6� 0.0
IV (g of I2/100 g oil) 56.3� 0.7
FFA content (%) 0.1� 0.0
AV 1.41� 0.04
Fatty acid composition (%)
C12:0 0.36� 0.04
C14:0 1.38� 0.08
C16:0 45.6� 1.01
C18:0 3.13� 0.09
C18:1 40.9� 0.71
C18:2 8.64� 0.33
C18:2/C16:0 ratio 0.19� 0.01aRBD, refined, bleached and deodorized; FFA, free fatty acid.b Each value is the mean of four analyses from two replication.
H.L. Gan et al. / Food Chemistry xxx (2004) xxx–xxx 3
FOCH 4021
DISK / 19/4/04
No. of pages: 12
DTD 4.3.1 / SPS-NARTICLE IN PRESS
phy and provides a method for adjusting the sensitivity
of the detector.
2.5. Electronic nose analysis
10 g of each oil sample were weighed into septa-sealed
vials. After a headspace generation time of 3 min at 60
�C (in water-bath), the sample’s vapour was pumped (5
s) into the electronic nose with a side-ported sampling
needle through the septa. The electronic nose used a two
step process to analyse vapours. The first step samples
vapours (inlet 200 �C) and concentrates them in a Tenax
trap. Sample preconcentration is carefully controlled toproduce a repeatable and accurate collection of ambient
vapours for analysis in the second step.
In the second step, the trap is rapidly heated and
released vapours are re-focussed on the head of the
relatively low temperature (40 �C) capillary column.
This system is based on the principal of gas chroma-
tography. The column temperature is programmed
(from 40 to 160 �C, at a rate of 5 �C/s) to follow a linearrise to its maximum temperature, causing the different
chemical component in the sample to be released, travel
through the column, and land on the surface of the
SAW crystal (temperature controlled at 30 �C). The flowrate (purified helium) was fixed at 3.0 ml/min.
The SAW detector is only specific to vapour pressure.
The specificity of the SAW detector is based on the
temperature of the crystal surface and the vapour pres-sure characteristics of the condensate itself. At a given
crystal temperature only, those analytes with dew points
below the crystal temperature will condense and be de-
tected. This provides a general method for separating
volatile from non-volatile vapours, based upon the op-
erating temperature of the SAW crystal.
The added mass of the material lowered the oscillat-
ing frequency of the SAW crystal. This frequency wasmixed with a reference frequency and the resulting in-
termediate frequency (IF) was counted by the system
microprocessor board. By measuring the time required
for each chemical to reach the sensor and the amount it
effects the crystal’s vibration, both the identity of the
substance and the quantity in which it is present can be
calculated by software incorporated in the instrument.
Sensor space is defined mathematically according toretention time slots. Separation of different compounds
is greatly improved. The entire testing process takes
approximately 1 min per sample.
2.6. Data analysis
All measurements were duplicated. The results were
expressed as the mean values and standard deviations oftwo replications. All data were subjected to two-way
analysis of variance using SAS Statistical Computer
Package Version 6.12 (SAS, 1989). Duncan’s multiple
range tests were used to compare differences among
means. Significance was defined at P < 0:05. Electronicnose data were further analysed to obtain the trendline
equation as well as the R2 value using the Microsoft
excel software. Pearson correlation coefficient betweenelectronic nose method, sensory analysis and other
chemical tests were calculated with the chemical com-
ponent with the highest R2 value using the Microsoft
excel software.
3. Results and discussion
3.1. Chemical analyses
3.1.1. Characteristics of fresh RBD palm olein
The initial characteristics of RBD palm olein used in
this study are given in Table 1. The RBD palm oil was of
good quality, as indicated by its initial low PV of 0.6
meq/kg and FFA content of 0.1%. The fatty acid com-
position of RBD palm olein was within the range forMalaysian palm olein (Tan & Oh, 1981).
3.1.2. Quality changes in RBD palm olein over storage
It is a well-known fact, that when vegetable oils are
exposed to oxidizing environments, they undergo oxi-
dative degradation. Oxidation is the single most im-
portant reaction of oils, leading to rancidity and
toxicity. The changes in quality parameters of RBDpalm olein in storage are given in Table 2. Table 3 gives
the fatty acid composition of the used RBD palm olein
over time. The oil system with a temperature at 60 �Cexperienced a greater degree of deterioration than the oil
system at room temperature. The extent of oil deterio-
ration was best reflected in the changes in PV and FFA
content. The IV and AV also provided supporting evi-
dence for the extent of oil deterioration. However, the
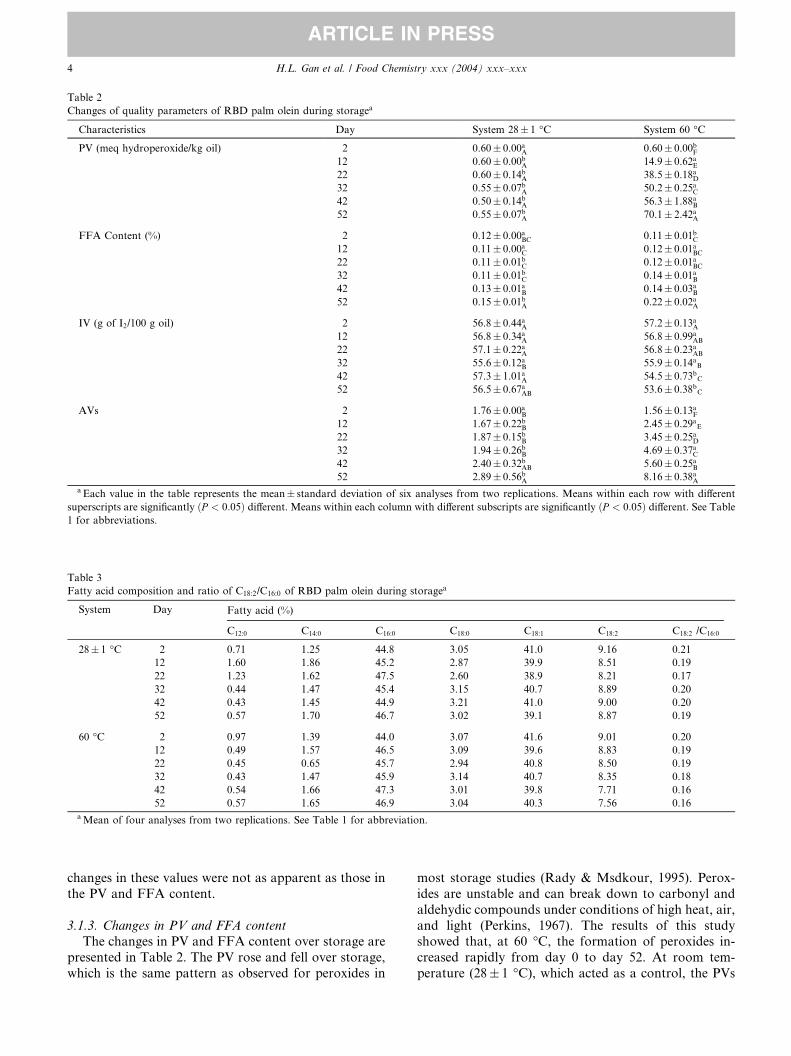
Table 2
Changes of quality parameters of RBD palm olein during storagea
Characteristics Day System 28� 1 �C System 60 �C
PV (meq hydroperoxide/kg oil) 2 0.60� 0.00aA 0.60� 0.00bF12 0.60� 0.00bA 14.9� 0.62aE22 0.60� 0.14bA 38.5� 0.18aD32 0.55� 0.07bA 50.2� 0.25aC42 0.50� 0.14bA 56.3� 1.88aB52 0.55� 0.07bA 70.1� 2.42aA
FFA Content (%) 2 0.12� 0.00aBC 0.11� 0.01bC12 0.11� 0.00aC 0.12� 0.01aBC22 0.11� 0.01bC 0.12� 0.01aBC32 0.11� 0.01bC 0.14� 0.01aB42 0.13� 0.01aB 0.14� 0.03aB52 0.15� 0.01bA 0.22� 0.02aA
IV (g of I2/100 g oil) 2 56.8� 0.44aA 57.2� 0.13aA12 56.8� 0.34aA 56.8� 0.99aAB
22 57.1� 0.22aA 56.8� 0.23aAB
32 55.6� 0.12aB 55.9� 0.14aB42 57.3� 1.01aA 54.5� 0.73bC52 56.5� 0.67aAB 53.6� 0.38bC
AVs 2 1.76� 0.00aB 1.56� 0.13aF12 1.67� 0.22bB 2.45� 0.29aE22 1.87� 0.15bB 3.45� 0.25aD32 1.94� 0.26bB 4.69� 0.37aC42 2.40� 0.32bAB 5.60� 0.25aB52 2.89� 0.56bA 8.16� 0.38aA
a Each value in the table represents the mean� standard deviation of six analyses from two replications. Means within each row with different
superscripts are significantly ðP < 0:05Þ different. Means within each column with different subscripts are significantly ðP < 0:05Þ different. See Table1 for abbreviations.
Table 3
Fatty acid composition and ratio of C18:2/C16:0 of RBD palm olein during storagea
System Day Fatty acid (%)
C12:0 C14:0 C16:0 C18:0 C18:1 C18:2 C18:2 /C16:0
28� 1 �C 2 0.71 1.25 44.8 3.05 41.0 9.16 0.21
12 1.60 1.86 45.2 2.87 39.9 8.51 0.19
22 1.23 1.62 47.5 2.60 38.9 8.21 0.17
32 0.44 1.47 45.4 3.15 40.7 8.89 0.20
42 0.43 1.45 44.9 3.21 41.0 9.00 0.20
52 0.57 1.70 46.7 3.02 39.1 8.87 0.19
60 �C 2 0.97 1.39 44.0 3.07 41.6 9.01 0.20
12 0.49 1.57 46.5 3.09 39.6 8.83 0.19
22 0.45 0.65 45.7 2.94 40.8 8.50 0.19
32 0.43 1.47 45.9 3.14 40.7 8.35 0.18
42 0.54 1.66 47.3 3.01 39.8 7.71 0.16
52 0.57 1.65 46.9 3.04 40.3 7.56 0.16aMean of four analyses from two replications. See Table 1 for abbreviation.
4 H.L. Gan et al. / Food Chemistry xxx (2004) xxx–xxx
FOCH 4021
DISK / 19/4/04
No. of pages: 12
DTD 4.3.1 / SPS-NARTICLE IN PRESS
changes in these values were not as apparent as those in
the PV and FFA content.
3.1.3. Changes in PV and FFA content
The changes in PV and FFA content over storage are
presented in Table 2. The PV rose and fell over storage,
which is the same pattern as observed for peroxides in
most storage studies (Rady & Msdkour, 1995). Perox-
ides are unstable and can break down to carbonyl and
aldehydic compounds under conditions of high heat, air,
and light (Perkins, 1967). The results of this studyshowed that, at 60 �C, the formation of peroxides in-
creased rapidly from day 0 to day 52. At room tem-
perature (28� 1 �C), which acted as a control, the PVs
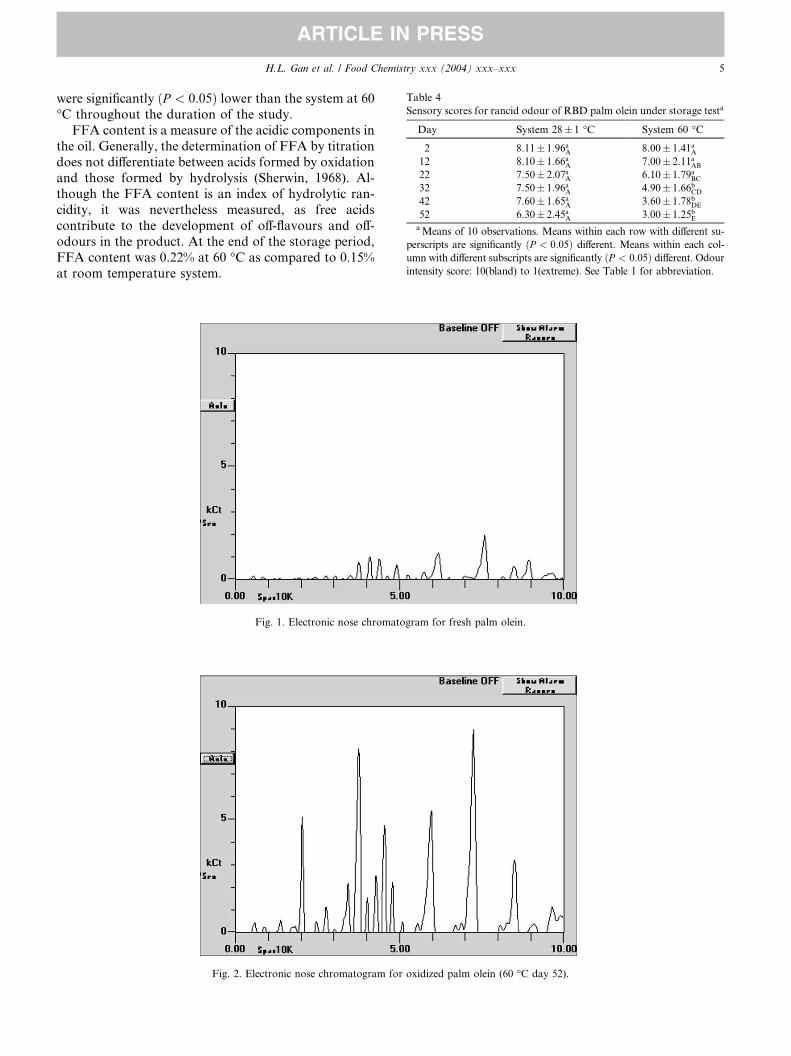
Table 4
Sensory scores for rancid odour of RBD palm olein under storage testa
Day System 28� 1 �C System 60 �C
2 8.11� 1.96aA 8.00� 1.41aA12 8.10� 1.66aA 7.00� 2.11aAB
22 7.50� 2.07aA 6.10� 1.79aBC32 7.50� 1.96aA 4.90� 1.66bCD42 7.60� 1.65aA 3.60� 1.78bDE
52 6.30� 2.45aA 3.00� 1.25bEaMeans of 10 observations. Means within each row with different su-
perscripts are significantly ðP < 0:05Þ different. Means within each col-
umn with different subscripts are significantly ðP < 0:05Þ different. Odourintensity score: 10(bland) to 1(extreme). See Table 1 for abbreviation.
H.L. Gan et al. / Food Chemistry xxx (2004) xxx–xxx 5
FOCH 4021
DISK / 19/4/04
No. of pages: 12
DTD 4.3.1 / SPS-NARTICLE IN PRESS
were significantly ðP < 0:05Þ lower than the system at 60
�C throughout the duration of the study.
FFA content is a measure of the acidic components in
the oil. Generally, the determination of FFA by titration
does not differentiate between acids formed by oxidationand those formed by hydrolysis (Sherwin, 1968). Al-
though the FFA content is an index of hydrolytic ran-
cidity, it was nevertheless measured, as free acids
contribute to the development of off-flavours and off-
odours in the product. At the end of the storage period,
FFA content was 0.22% at 60 �C as compared to 0.15%
at room temperature system.
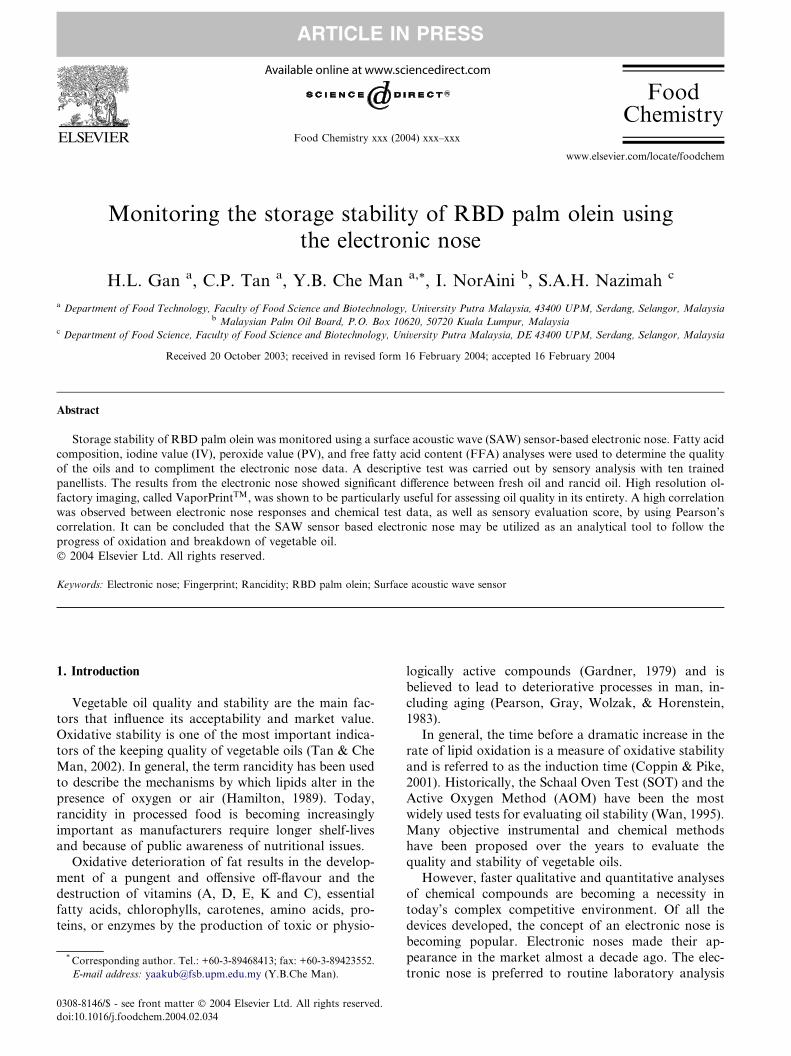
Fig. 1. Electronic nose chromatogram for fresh palm olein.
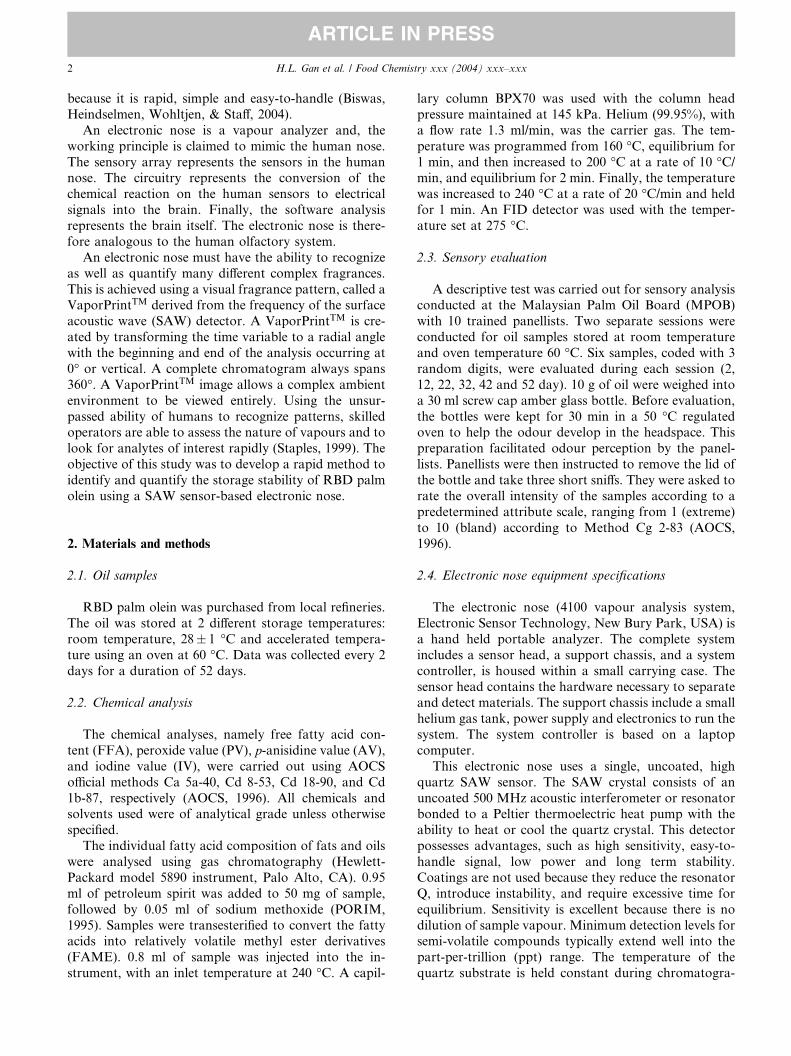
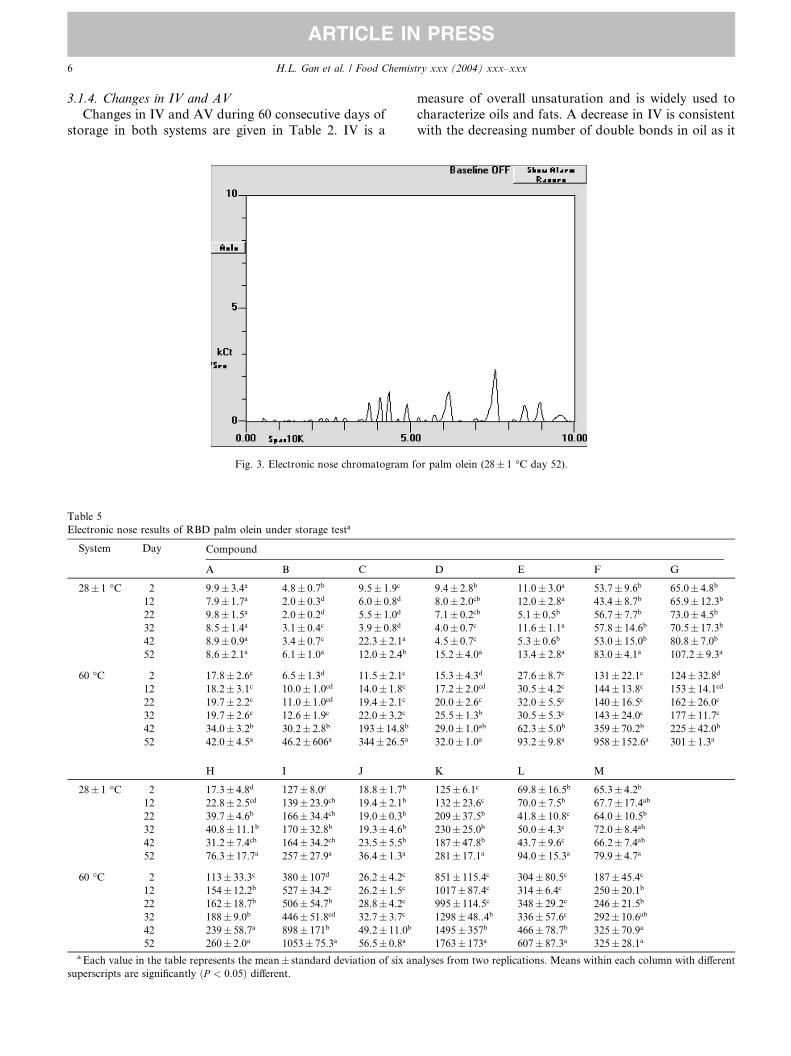
Fig. 2. Electronic nose chromatogram for oxidized palm olein (60 �C day 52).
6 H.L. Gan et al. / Food Chemistry xxx (2004) xxx–xxx
FOCH 4021
DISK / 19/4/04
No. of pages: 12
DTD 4.3.1 / SPS-NARTICLE IN PRESS
3.1.4. Changes in IV and AV
Changes in IV and AV during 60 consecutive days of
storage in both systems are given in Table 2. IV is a
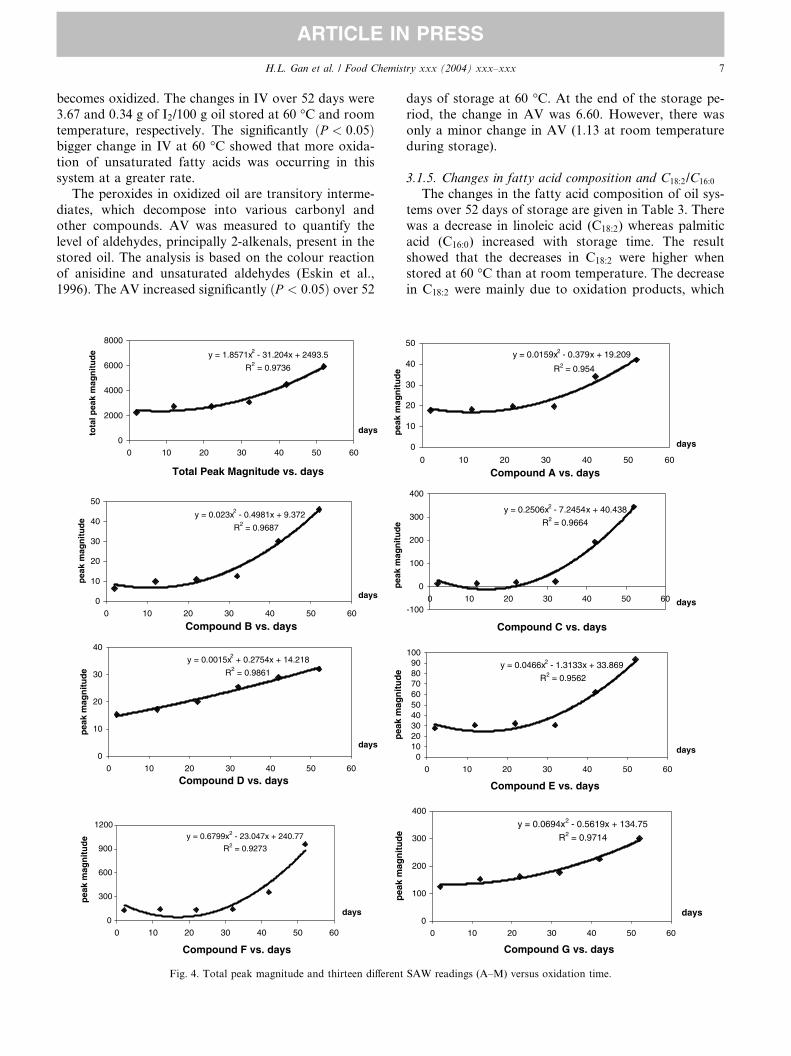
Fig. 3. Electronic nose chromatogram f
Table 5
Electronic nose results of RBD palm olein under storage testa
System Day Compound
A B C
28� 1 �C 2 9.9� 3.4a 4.8� 0.7b 9.5� 1.9c
12 7.9� 1.7a 2.0� 0.3d 6.0� 0.8d
22 9.8� 1.5a 2.0� 0.2d 5.5� 1.0d
32 8.5� 1.4a 3.1� 0.4c 3.9� 0.8d
42 8.9� 0.9a 3.4� 0.7c 22.3� 2.1a
52 8.6� 2.1a 6.1� 1.0a 12.0� 2.4b
60 �C 2 17.8� 2.6c 6.5� 1.3d 11.5� 2.1c
12 18.2� 3.1c 10.0� 1.0cd 14.0� 1.8c
22 19.7� 2.2c 11.0� 1.0cd 19.4� 2.1c
32 19.7� 2.6c 12.6� 1.9c 22.0� 3.2c
42 34.0� 3.2b 30.2� 2.8b 193� 14.8b
52 42.0� 4.5a 46.2� 606a 344� 26.5a
H I J
28� 1 �C 2 17.3� 4.8d 127� 8.0c 18.8� 1.7b
12 22.8� 2.5cd 139� 23.9cb 19.4� 2.1b
22 39.7� 4.6b 166� 34.4cb 19.0� 0.3b
32 40.8� 11.1b 170� 32.8b 19.3� 4.6b
42 31.2� 7.4cb 164� 34.2cb 23.5� 5.5b
52 76.3� 17.7a 257� 27.9a 36.4� 1.3a
60 �C 2 113� 33.3c 380� 107d 26.2� 4.2c
12 154� 12.2b 527� 34.2c 26.2� 1.5c
22 162� 18.7b 506� 54.7b 28.8� 4.2c
32 188� 9.0b 446� 51.8cd 32.7� 3.7c
42 239� 58.7a 898� 171b 49.2� 11.0b
52 260� 2.0a 1053� 75.3a 56.5� 0.8a
a Each value in the table represents the mean� standard deviation of six an
superscripts are significantly ðP < 0:05Þ different.
measure of overall unsaturation and is widely used to
characterize oils and fats. A decrease in IV is consistent
with the decreasing number of double bonds in oil as it
or palm olein (28� 1 �C day 52).
D E F G
9.4� 2.8b 11.0� 3.0a 53.7� 9.6b 65.0� 4.8b
8.0� 2.0cb 12.0� 2.8a 43.4� 8.7b 65.9� 12.3b
7.1� 0.2cb 5.1� 0.5b 56.7� 7.7b 73.0� 4.5b
4.0� 0.7c 11.6� 1.1a 57.8� 14.6b 70.5� 17.3b
4.5� 0.7c 5.3� 0.6b 53.0� 15.0b 80.8� 7.0b
15.2� 4.0a 13.4� 2.8a 83.0� 4.1a 107.2� 9.3a
15.3� 4.3d 27.6� 8.7c 131� 22.1c 124� 32.8d
17.2� 2.0cd 30.5� 4.2c 144� 13.8c 153� 14.1cd
20.0� 2.6c 32.0� 5.5c 140� 16.5c 162� 26.0c
25.5� 1.3b 30.5� 5.3c 143� 24.0c 177� 11.7c
29.0� 1.0ab 62.3� 5.0b 359� 70.2b 225� 42.0b
32.0� 1.0a 93.2� 9.8a 958� 152.6a 301� 1.3a
K L M
125� 6.1c 69.8� 16.5b 65.3� 4.2b
132� 23.6c 70.0� 7.5b 67.7� 17.4ab
209� 37.5b 41.8� 10.8c 64.0� 10.5b
230� 25.0b 50.0� 4.3c 72.0� 8.4ab
187� 47.8b 43.7� 9.6c 66.2� 7.4ab
281� 17.1a 94.0� 15.3a 79.9� 4.7a
851� 115.4c 304� 80.5c 187� 45.4c
1017� 87.4c 314� 6.4c 250� 20.1b
995� 114.5c 348� 29.2c 246� 21.5b
1298� 48..4b 336� 57.6c 292� 10.6ab
1495� 357b 466� 78.7b 325� 70.9a
1763� 173a 607� 87.3a 325� 28.1a
alyses from two replications. Means within each column with different
H.L. Gan et al. / Food Chemistry xxx (2004) xxx–xxx 7
FOCH 4021
DISK / 19/4/04
No. of pages: 12
DTD 4.3.1 / SPS-NARTICLE IN PRESS
becomes oxidized. The changes in IV over 52 days were
3.67 and 0.34 g of I2/100 g oil stored at 60 �C and room
temperature, respectively. The significantly ðP < 0:05Þbigger change in IV at 60 �C showed that more oxida-
tion of unsaturated fatty acids was occurring in thissystem at a greater rate.
The peroxides in oxidized oil are transitory interme-
diates, which decompose into various carbonyl and
other compounds. AV was measured to quantify the
level of aldehydes, principally 2-alkenals, present in the
stored oil. The analysis is based on the colour reaction
of anisidine and unsaturated aldehydes (Eskin et al.,
1996). The AV increased significantly ðP < 0:05Þ over 52
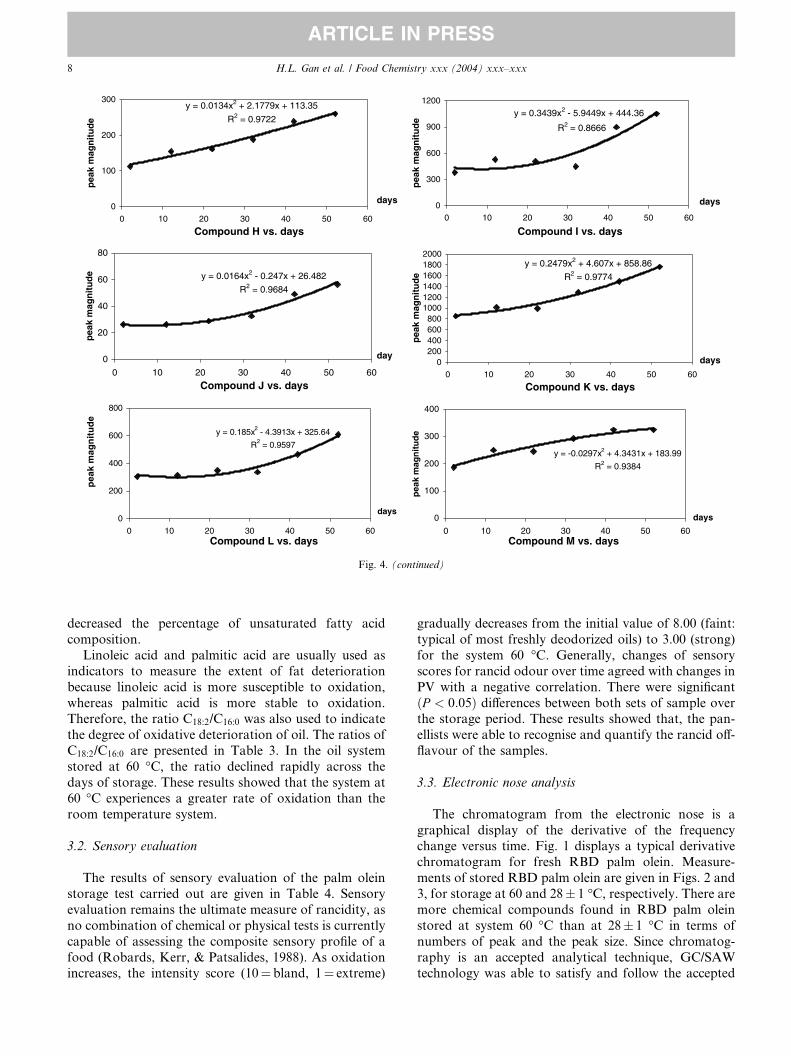
pea
k m
agn
itu
de
pea
k m
agn
itu
de
Compound B vs. days
y = 0.023x2 - 0.4981x + 9.372
R2 = 0.9687
0
10
20
30
40
50
0 10 20 30 40 50 60
days
days
pea
k m
agn
itu
de
Compound D vs. days
y = 0.0015x2 + 0.2754x + 14.218
R2 = 0.9861
0
10
20
30
40
0 10 20 30 40 50 60
pea
k m
agn
itu
de
pea
k m
agn
itu
de
Total Peak Magnitude vs. days
y = 1.8571x2 - 31.204x + 2493.5
R2 = 0.9736
0
2000
4000
6000
8000
0 10 20 30 40 50 60
daystota
l pea
k m
agn
itu
de
Compound F vs. days
y = 0.6799x2 - 23.047x + 240.77
R2 = 0.9273
0
300
600
900
1200
0 10 20 30 40 50 60
days
pea
k m
agn
itu
de
pea
k m
agn
itu
de
Fig. 4. Total peak magnitude and thirteen different
days of storage at 60 �C. At the end of the storage pe-
riod, the change in AV was 6.60. However, there was
only a minor change in AV (1.13 at room temperature
during storage).
3.1.5. Changes in fatty acid composition and C18:2/C16:0
The changes in the fatty acid composition of oil sys-
tems over 52 days of storage are given in Table 3. There
was a decrease in linoleic acid (C18:2) whereas palmitic
acid (C16:0) increased with storage time. The result
showed that the decreases in C18:2 were higher when
stored at 60 �C than at room temperature. The decrease
in C18:2 were mainly due to oxidation products, which
Compound C vs. days
y = 0.2506x2 - 7.2454x + 40.438
R2 = 0.9664
-100
0
100
200
300
400
0 10 20 30 40 50 60 days
Compound A vs. days
y = 0.0159x2 - 0.379x + 19.209
R2 = 0.954
0
10
20
30
40
50
0 10 20 30 40 50 60
days
Compound E vs. days
y = 0.0466x2 - 1.3133x + 33.869
R2 = 0.9562
0102030405060708090
100
0 10 20 30 40 50 60
days
Compound G vs. days
y = 0.0694x2 - 0.5619x + 134.75
R2 = 0.9714
0
100
200
300
400
0 10 20 30 40 50 60
days
SAW readings (A–M) versus oxidation time.
Compound H vs. days
y = 0.0134x2 + 2.1779x + 113.35
R2 = 0.9722
0
100
200
300
0 10 20 30 40 50 60
days
pea
k m
agn
itu
de
Compound I vs. days
y = 0.3439x2 - 5.9449x + 444.36
R2 = 0.8666
0
300
600
900
1200
0 10 20 30 40 50 60
days
pea
k m
agn
itu
de
Compound J vs. days
y = 0.0164x2 - 0.247x + 26.482
R2 = 0.9684
0
20
40
60
80
0 10 20 30 40 50 60
day
pea
k m
agn
itu
de
Compound K vs. days
y = 0.2479x2 + 4.607x + 858.86
R2 = 0.9774
0200400600800
100012001400160018002000
0 10 20 30 40 50 60
days
pea
k m
agn
itu
de
Compound L vs. days
y = 0.185x2 - 4.3913x + 325.64
R2 = 0.9597
0
200
400
600
800
0 10 20 30 40 50 60
days
pea
k m
agn
itu
de
Compound M vs. days
y = -0.0297x2 + 4.3431x + 183.99
R2 = 0.9384
0
100
200
300
400
0 10 20 30 40 50 60
days
pea
k m
agn
itu
de
Fig. 4. (continued)
8 H.L. Gan et al. / Food Chemistry xxx (2004) xxx–xxx
FOCH 4021
DISK / 19/4/04
No. of pages: 12
DTD 4.3.1 / SPS-NARTICLE IN PRESS
decreased the percentage of unsaturated fatty acid
composition.
Linoleic acid and palmitic acid are usually used as
indicators to measure the extent of fat deterioration
because linoleic acid is more susceptible to oxidation,
whereas palmitic acid is more stable to oxidation.Therefore, the ratio C18:2/C16:0 was also used to indicate
the degree of oxidative deterioration of oil. The ratios of
C18:2/C16:0 are presented in Table 3. In the oil system
stored at 60 �C, the ratio declined rapidly across the
days of storage. These results showed that the system at
60 �C experiences a greater rate of oxidation than the
room temperature system.
3.2. Sensory evaluation
The results of sensory evaluation of the palm olein
storage test carried out are given in Table 4. Sensory
evaluation remains the ultimate measure of rancidity, as
no combination of chemical or physical tests is currently
capable of assessing the composite sensory profile of a
food (Robards, Kerr, & Patsalides, 1988). As oxidationincreases, the intensity score (10¼ bland, 1¼ extreme)
gradually decreases from the initial value of 8.00 (faint:
typical of most freshly deodorized oils) to 3.00 (strong)
for the system 60 �C. Generally, changes of sensory
scores for rancid odour over time agreed with changes in
PV with a negative correlation. There were significant
ðP < 0:05Þ differences between both sets of sample overthe storage period. These results showed that, the pan-
ellists were able to recognise and quantify the rancid off-
flavour of the samples.
3.3. Electronic nose analysis
The chromatogram from the electronic nose is a
graphical display of the derivative of the frequencychange versus time. Fig. 1 displays a typical derivative
chromatogram for fresh RBD palm olein. Measure-
ments of stored RBD palm olein are given in Figs. 2 and
3, for storage at 60 and 28� 1 �C, respectively. There aremore chemical compounds found in RBD palm olein
stored at system 60 �C than at 28� 1 �C in terms of
numbers of peak and the peak size. Since chromatog-
raphy is an accepted analytical technique, GC/SAWtechnology was able to satisfy and follow the accepted
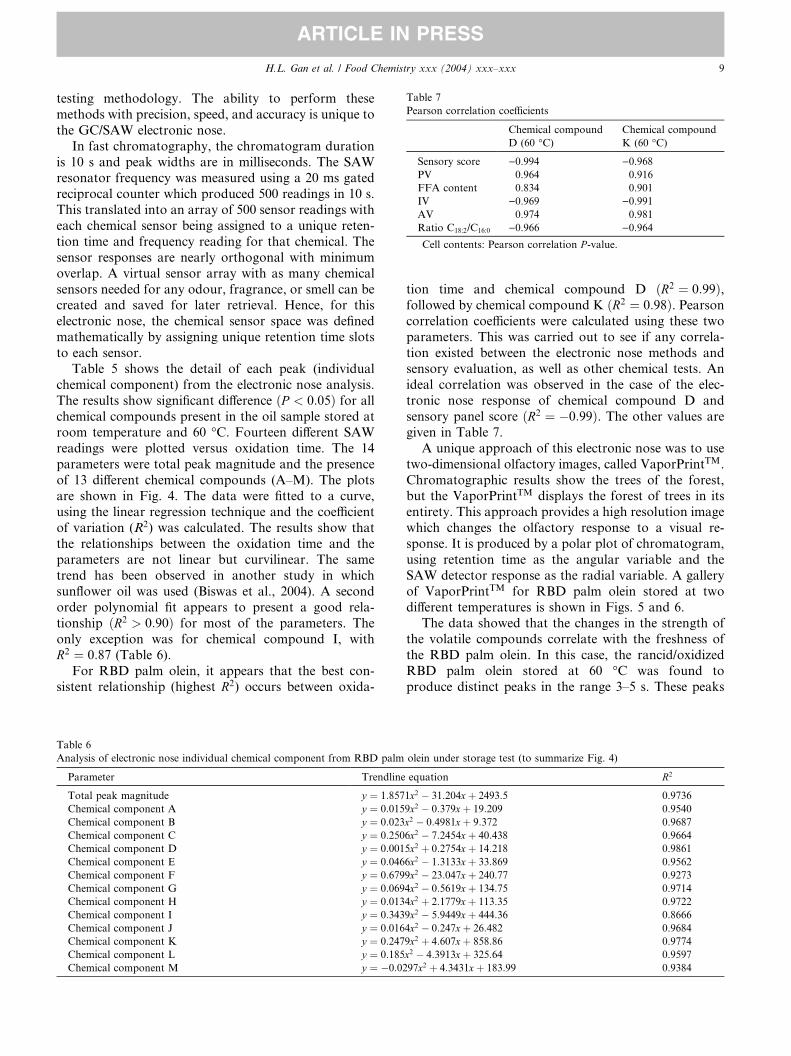
Table 7
Pearson correlation coefficients
Chemical compound
D (60 �C)Chemical compound
K (60 �C)
Sensory score )0.994 )0.968PV 0.964 0.916
FFA content 0.834 0.901
IV )0.969 )0.991AV 0.974 0.981
Ratio C18:2/C16:0 )0.966 )0.964
Cell contents: Pearson correlation P -value.
H.L. Gan et al. / Food Chemistry xxx (2004) xxx–xxx 9
FOCH 4021
DISK / 19/4/04
No. of pages: 12
DTD 4.3.1 / SPS-NARTICLE IN PRESS
testing methodology. The ability to perform these
methods with precision, speed, and accuracy is unique to
the GC/SAW electronic nose.
In fast chromatography, the chromatogram duration
is 10 s and peak widths are in milliseconds. The SAWresonator frequency was measured using a 20 ms gated
reciprocal counter which produced 500 readings in 10 s.
This translated into an array of 500 sensor readings with
each chemical sensor being assigned to a unique reten-
tion time and frequency reading for that chemical. The
sensor responses are nearly orthogonal with minimum
overlap. A virtual sensor array with as many chemical
sensors needed for any odour, fragrance, or smell can becreated and saved for later retrieval. Hence, for this
electronic nose, the chemical sensor space was defined
mathematically by assigning unique retention time slots
to each sensor.
Table 5 shows the detail of each peak (individual
chemical component) from the electronic nose analysis.
The results show significant difference ðP < 0:05Þ for allchemical compounds present in the oil sample stored atroom temperature and 60 �C. Fourteen different SAW
readings were plotted versus oxidation time. The 14
parameters were total peak magnitude and the presence
of 13 different chemical compounds (A–M). The plots
are shown in Fig. 4. The data were fitted to a curve,
using the linear regression technique and the coefficient
of variation (R2) was calculated. The results show that
the relationships between the oxidation time and theparameters are not linear but curvilinear. The same
trend has been observed in another study in which
sunflower oil was used (Biswas et al., 2004). A second
order polynomial fit appears to present a good rela-
tionship ðR2 > 0:90Þ for most of the parameters. The
only exception was for chemical compound I, with
R2 ¼ 0:87 (Table 6).
For RBD palm olein, it appears that the best con-sistent relationship (highest R2) occurs between oxida-
Table 6
Analysis of electronic nose individual chemical component from RBD palm
Parameter Trendline
Total peak magnitude y ¼ 1:857
Chemical component A y ¼ 0:015
Chemical component B y ¼ 0:023
Chemical component C y ¼ 0:250
Chemical component D y ¼ 0:001
Chemical component E y ¼ 0:046
Chemical component F y ¼ 0:679
Chemical component G y ¼ 0:069
Chemical component H y ¼ 0:013
Chemical component I y ¼ 0:343
Chemical component J y ¼ 0:016
Chemical component K y ¼ 0:247
Chemical component L y ¼ 0:185
Chemical component M y ¼ �0:02
tion time and chemical compound D ðR2 ¼ 0:99Þ,followed by chemical compound K ðR2 ¼ 0:98Þ. Pearsoncorrelation coefficients were calculated using these two
parameters. This was carried out to see if any correla-
tion existed between the electronic nose methods andsensory evaluation, as well as other chemical tests. An
ideal correlation was observed in the case of the elec-
tronic nose response of chemical compound D and
sensory panel score ðR2 ¼ �0:99Þ. The other values are
given in Table 7.
A unique approach of this electronic nose was to use
two-dimensional olfactory images, called VaporPrintTM.
Chromatographic results show the trees of the forest,but the VaporPrintTM displays the forest of trees in its
entirety. This approach provides a high resolution image
which changes the olfactory response to a visual re-
sponse. It is produced by a polar plot of chromatogram,
using retention time as the angular variable and the
SAW detector response as the radial variable. A gallery
of VaporPrintTM for RBD palm olein stored at two
different temperatures is shown in Figs. 5 and 6.The data showed that the changes in the strength of
the volatile compounds correlate with the freshness of
the RBD palm olein. In this case, the rancid/oxidized
RBD palm olein stored at 60 �C was found to
produce distinct peaks in the range 3–5 s. These peaks
olein under storage test (to summarize Fig. 4)
equation R2
1x2 � 31:204xþ 2493:5 0.9736
9x2 � 0:379xþ 19:209 0.9540
x2 � 0:4981xþ 9:372 0.9687
6x2 � 7:2454xþ 40:438 0.9664
5x2 þ 0:2754xþ 14:218 0.9861
6x2 � 1:3133xþ 33:869 0.9562
9x2 � 23:047xþ 240:77 0.9273
4x2 � 0:5619xþ 134:75 0.9714
4x2 þ 2:1779xþ 113:35 0.9722
9x2 � 5:9449xþ 444:36 0.8666
4x2 � 0:247xþ 26:482 0.9684
9x2 þ 4:607xþ 858:86 0.9774
x2 � 4:3913xþ 325:64 0.9597
97x2 þ 4:3431xþ 183:99 0.9384
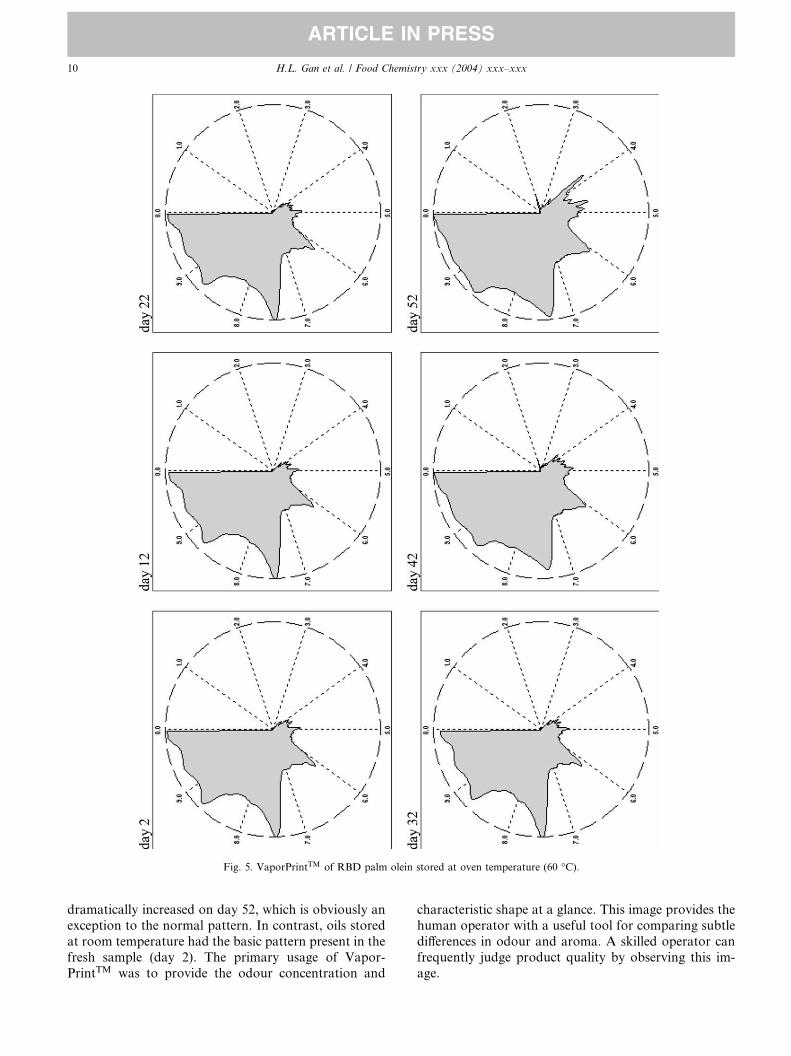
Fig. 5. VaporPrintTM of RBD palm olein stored at oven temperature (60 �C).
10 H.L. Gan et al. / Food Chemistry xxx (2004) xxx–xxx
FOCH 4021
DISK / 19/4/04
No. of pages: 12
DTD 4.3.1 / SPS-NARTICLE IN PRESS
dramatically increased on day 52, which is obviously an
exception to the normal pattern. In contrast, oils stored
at room temperature had the basic pattern present in the
fresh sample (day 2). The primary usage of Vapor-
PrintTM was to provide the odour concentration and
characteristic shape at a glance. This image provides the
human operator with a useful tool for comparing subtle
differences in odour and aroma. A skilled operator can
frequently judge product quality by observing this im-
age.
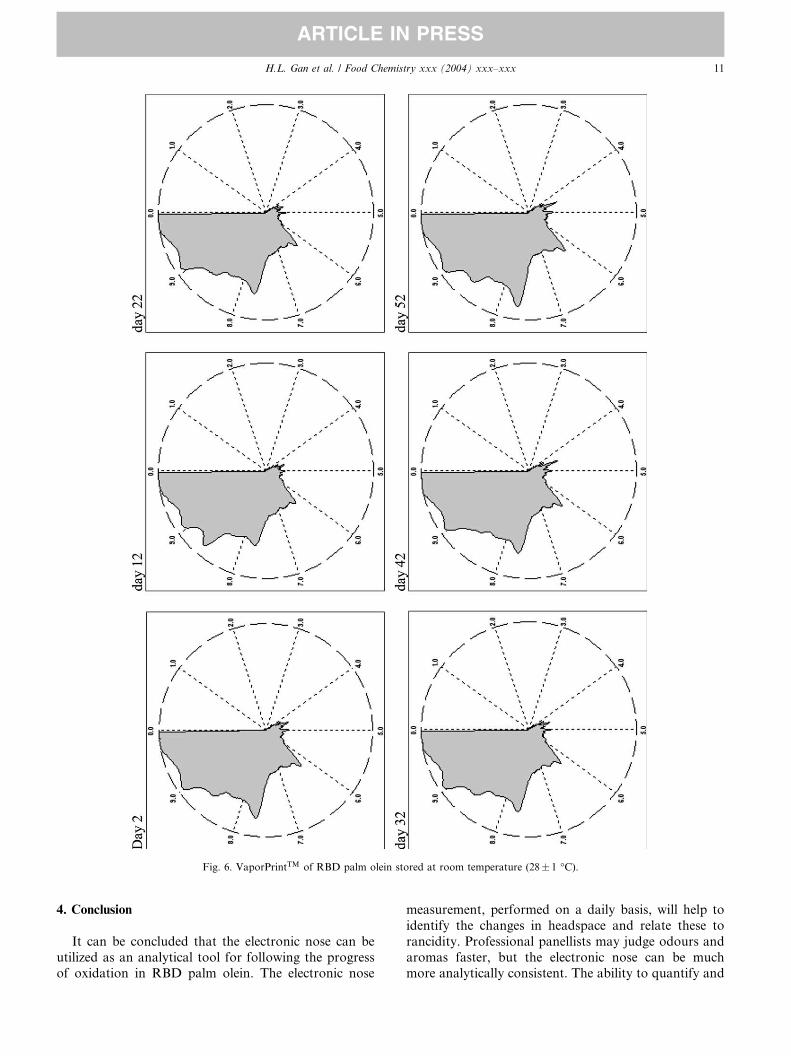
Fig. 6. VaporPrintTM of RBD palm olein stored at room temperature (28� 1 �C).
H.L. Gan et al. / Food Chemistry xxx (2004) xxx–xxx 11
FOCH 4021
DISK / 19/4/04
No. of pages: 12
DTD 4.3.1 / SPS-NARTICLE IN PRESS
4. Conclusion
It can be concluded that the electronic nose can be
utilized as an analytical tool for following the progressof oxidation in RBD palm olein. The electronic nose
measurement, performed on a daily basis, will help to
identify the changes in headspace and relate these to
rancidity. Professional panellists may judge odours and
aromas faster, but the electronic nose can be muchmore analytically consistent. The ability to quantify and
12 H.L. Gan et al. / Food Chemistry xxx (2004) xxx–xxx
FOCH 4021
DISK / 19/4/04
No. of pages: 12
DTD 4.3.1 / SPS-NARTICLE IN PRESS
understand the human perception of smell or taste may
provide valuable insights into how to define and quan-
tify food quality in chemical terms. Once the optimum
chemistry is defined, the electronic nose will be able to
compare and monitor the chemical composition andquality of the oil. Quality control personnel will be able
to analyze hundreds of samples per day, as compared
to weeks. Savings in time and labour can readily be
calculated. The practical application of the electronic
nose will possibly ensure higher quality standards for
vegetable oil refining and food processing industries as
well as detection of adulteration, with less burden and
faster results than current quality control analyticalmethods.
Acknowledgements
The authors would like to thank University Putra
Malaysia for IPRA fund (03-02-04-0172-EA001),
STRIDE of Ministry of Defence, Malaysia, and Mr.
Tibby Lim (Electronic Sensor Technology Malaysia’s
representative) for technical support.
References
Biswas, S., Heindselmen, K., Wohltjen, H., & Staff, C. (2004).
Differentiation of vegetable oils and determination of sunflower
oil oxidation using a surface acoustic wave sensing device. Food
Control, 15, 19–26.
Coppin, E. A., & Pike, O. A. (2001). Oil stability index correlated with
sensory determination of oxidative stability in light-exposed
soybean oil. Journal of the American Oil Chemists’ Society, 78,
13–18.
Eskin, N. A. M., McDonald, B. E., Przybylski, R., Malcolmson, L. J.,
Scarth, R., Mag, T., Ward, K., & Adolph, D. (1996). In Y. H. Hui
(Ed.), Bailey’s industrial oil and fat product (p. 67). New York:
Wiley.
Gardner, H. W. (1979). Lipid hydroperoxide reactivity with proteins
and amino acids: A review. Journal of Agricultural and Food
Chemistry, 27, 220–229.
Hamilton, R. J. (1989). The chemistry of rancidity in foods. In J. C.
Allen & R. J. Hamilton (Eds.), Rancidity in foods (pp. 1–22).
London: Elsevier Applied Science.
Official and Tentative Methods of the American Oil Chemists’ Society.
(1996). AOCS, Champaign (5th ed., Vol. 1), methods Ca 5a-40, Cd
8-53, Cd 18-90, Cd 1b-87.
Pearson, A. M., Gray, J. L., Wolzak, A. M., & Horenstein, N. A.
(1983). Safety implications of oxidized lipids in muscle foods. Food
Technology, 37, 121–129.
Perkins, E. G. (1967). Formation of non-volatile decomposition
products in heated fats and oils. Food Technology, 21, 125–130.
PORIM Test Methods (1995). Method p3.4 (Vol. 1, pp. 83–91). Kuala
Lumpur: Palm Oil Research Institute of Malaysia (PORIM), (now
known as Malaysia Palm Oil Board, MPOB).
Rady, A. H., & Msdkour, M. A. (1995). Changes in physical and
chemical properties of palm olein during heating. Grasas Aceites,
46, 270–275.
Robards, K. L., Kerr, A. F., & Patsalides, E. (1988). Rancidity and its
measurement in edible oils and snack foods. Analyst, 113, 213–222.
Sherwin, E. R. (1968). Methods for stability and antioxidations
measurement. Journal of American Oil Chemistry Society, 45, 632a–
648a.
Staples, E. J. (1999). Development of novel electronic nose as an
environmental tool. Presented in Air & Waste Management
Association, St. Louis, MO.
Statistical Analysis System User’s Guide. (1989). Statistics (pp. 125–
154). Cary: SAS Institute Inc.
Tan, B. K., & Oh, F. C. H. (1981). Oleins and stearins from Malaysian
palm oil – chemical and physical characteristics. PORIM Technol-
ogy, 4, 1–6.
Tan, C. P., & Che Man, Y. B. (2002). Recent development in
differential scanning calorimetry for assessing oxidative deteriora-
tion of vegetable oils. Trends in Food Science and Technology, 13,
312–318.
Wan, P. J. (1995). Accelerated stability methods. In K. Warner & N.
A. M. Eskin (Eds.), Methods for measuring changes in deep-fat
frying oils (pp. 179–189). Champaign: AOCS Press.