development of 6mo numerical child dummy model … filetable 1: measurement data 3.0 dummy...
TRANSCRIPT
Jurnal Mekanikal June 2011, No. 32, 12- 25
12
DEVELOPMENT OF 6MO NUMERICAL CHILD DUMMY MODEL FOR CRASHWORTHINESS ASSESSMENT
Mohamad Sulaiman Ibrahim1, Rakhmad Arief Siregar*1, Khairul Fuad2,
Abdul Hamid Adom1 and Shah Fenner Khan1
1School of Mechatronic Engineering, University Malaysia Perlis,
Jalan Kangar Arau 02600 Jejawi Perlis Malaysia
2Mechanical Engineering Department, University Technology Petronas,
Bandar Seri Iskandar, 31750, Perak Darul Ridzuan, Malaysia
ABSTRACT The use of finite element model crash test dummies is advantageous over physical dummies because of lower cost and repeatability. However there are not enough models representing six-month-old child dummy models. This paper presents the development of a six-months-old (6MO) finite element dummy model for crash simulation. The model was developed by using both flexible and rigid body materials. The geometry data were collected by direct measurement in a pediatric center and statistically analyzed to ensure their accuracy. Several simulations of major validation test were performed and compared with other published data. A severe crash simulation was conducted to comprehend the head injury criteria which are used as the basis to observe how the model reacts in the crash in terms of flexibility, joint stiffness, and material behavior. The result of Head Injury Criterion (HIC) for frontal and rear crash simulations was examined and it is found that the child dummy reactions are in good agreement with the threshold values. Keywords : Crashworthiness assessment, dummy model, finite element, simulations,
head injury criterion. 1.0 INTRODUCTION
In vehicle manufacturing industries, crash test are part of the requirement to ensure the safety of the product and also to learn the human response during impact. The use of real crash-test dummies and vehicle are very costly and hence are not repeated. The simulation approach using finite element models of crash test dummies can provide a feasible alternative. Various finite element models of crash test dummies have been developed over the last decade ranging from newborn to adult. These models have become increasingly important since they are cost-effective and give valuable information on crash impact scenario [1]. The development of adult crash test dummies can be considered as mature field however the development of child crash test dummies still needs a lot of improvement.
* Corresponding author : [email protected]
Jurnal Mekanikal June 2011
13
There has been some developments of child crash test dummies, either numerical
or physical dummies such as the Q-Dummy and FTSS Dummy [2, 3]. Three years old FTSS dummy was a good reference which was developed with fine meshed and geometry of head and neck and suitable for accurate analysis. Although there is development on numerical child dummy model, but the data and development of six-month-old child dummy are still insufficient.
This paper presents the development of a 6MO finite element child dummy model for crashworthiness assessment. The child dummy model was designed to represent Asian crash test dummies in view of the fact that all the anthropometric data were collected and measured locally at the Kangar Hospital Pediatric Center, Malaysia. The dummy model was developed using Solidworks for CAD design and LS-DYNA for finite element modeling.
The developed finite element model provides reliable and detailed insight into the loads and deformation experienced by the dummy in a crash environment. Several major validation tests were performed to meet the regulations for crash environment. However, due to no development of a physical dummy, the finite element child dummy was compared with scaled data from other published reports. This method is employed to validate the results obtained from the numerical dummy.
2.0 ANTHROPOMETRIC DATA In this research, the anthropometric data of six-months-child (6MO) was taken at the nearest pediatric center. A total of 30 children were measured and a simple statistical analysis was performed on all the measurement data obtained [4]. Table 1 shows the measurement data that was used for the development of six-months-old finite element dummy.
Table 1: Measurement data
3.0 DUMMY DEVELOPMENT The finite element 6MO child model consists of 66 different parts including deformable and rigid bodies. All parts are connected using shared node, contact definition (tied-surface-to-surface), and joint definition [5]. A total of 13771 elements were constructed and consist of 6784 solid elements and 6978 shell elements. The joint definition is used to constraint the relative motion of two parts and to ensure all joints rotate accordingly. Joint
Parameters Mean [mm]
Standard Deviation
Variance
Head circumference 388.8 34.46 1187.39 Head Length 158.0 8.26 68.28 Neck circumference 261.2 14.12 199.45 Neck length 65.3 8.19 67.126 Body length(thorax) 210.3 25.44 647.24 Arm length 226.2 23.4 546.00 Chest circumference 351.5 12.88 165.77 Waist circumference 443.5 16.67 277.84 Leg length 332.2 18.22 332.21 Overall Length 674.0 20.94 438.62
Jurnal Mekanikal, June 2011
14
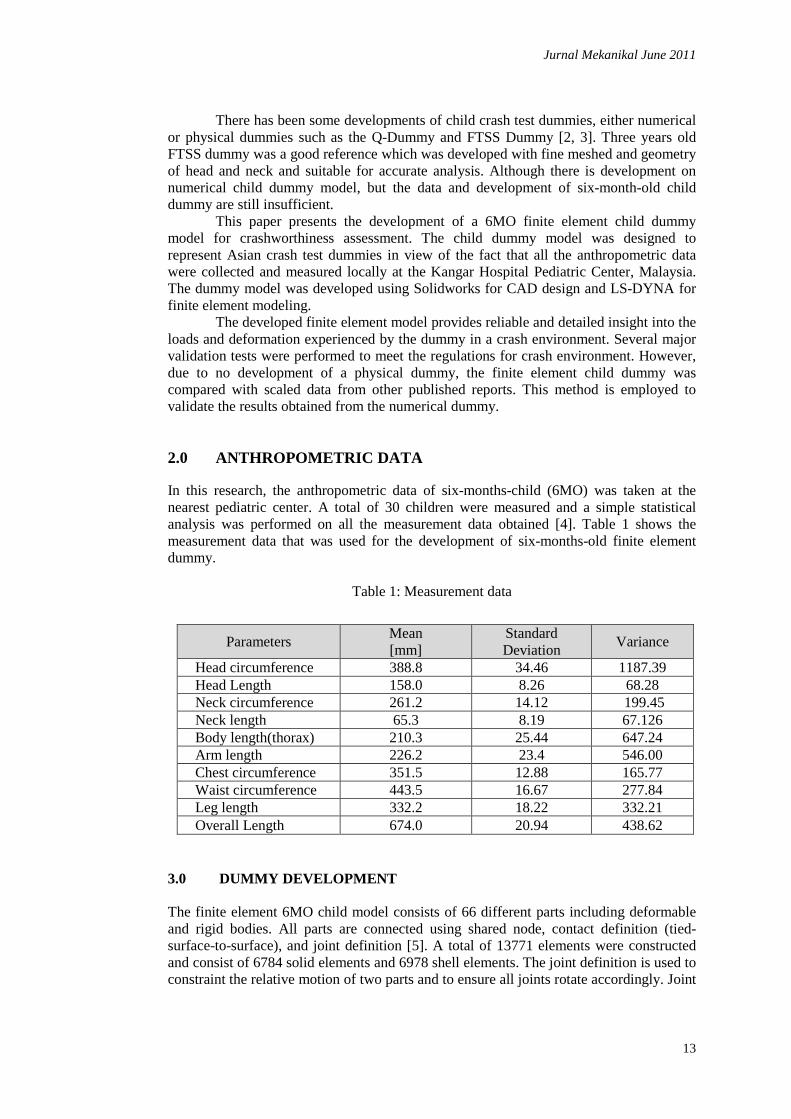
stiffness is applied to each joint using joint-stiffness-generalization command [6, 7]. All of preprocessing works were performed using LS-PREPOST. The complete 6MO CAD and numerical model can be seen in Figure 1.
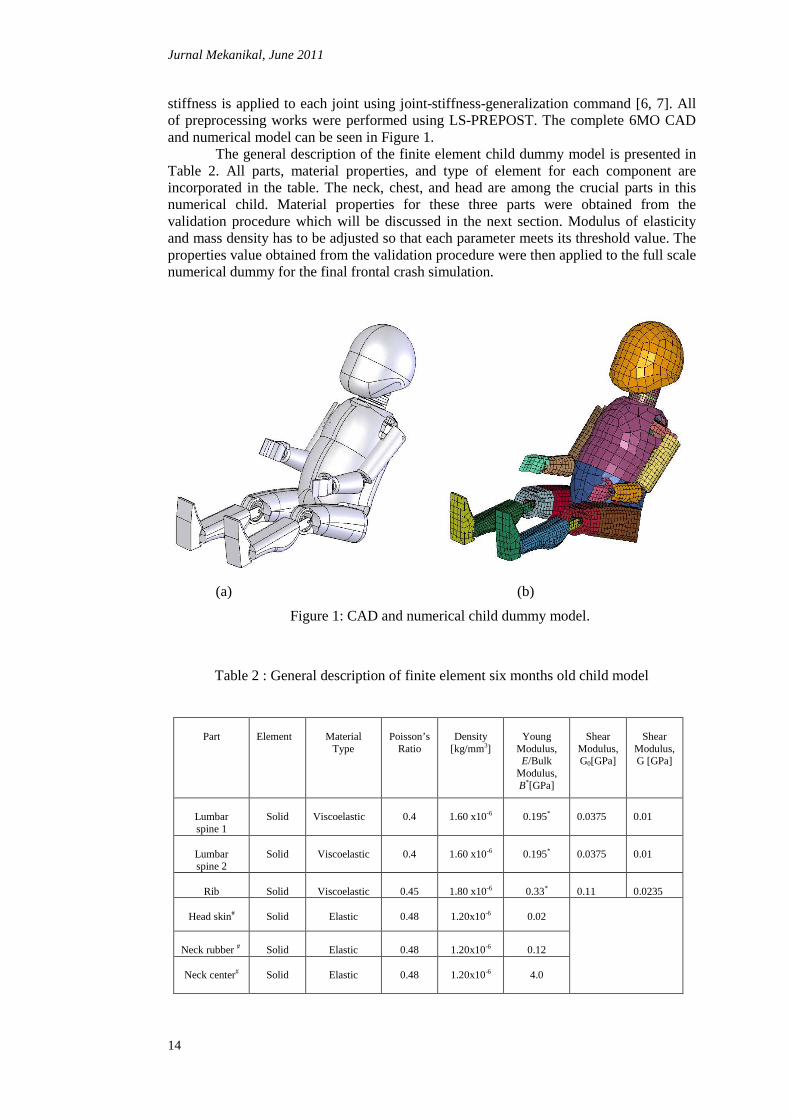
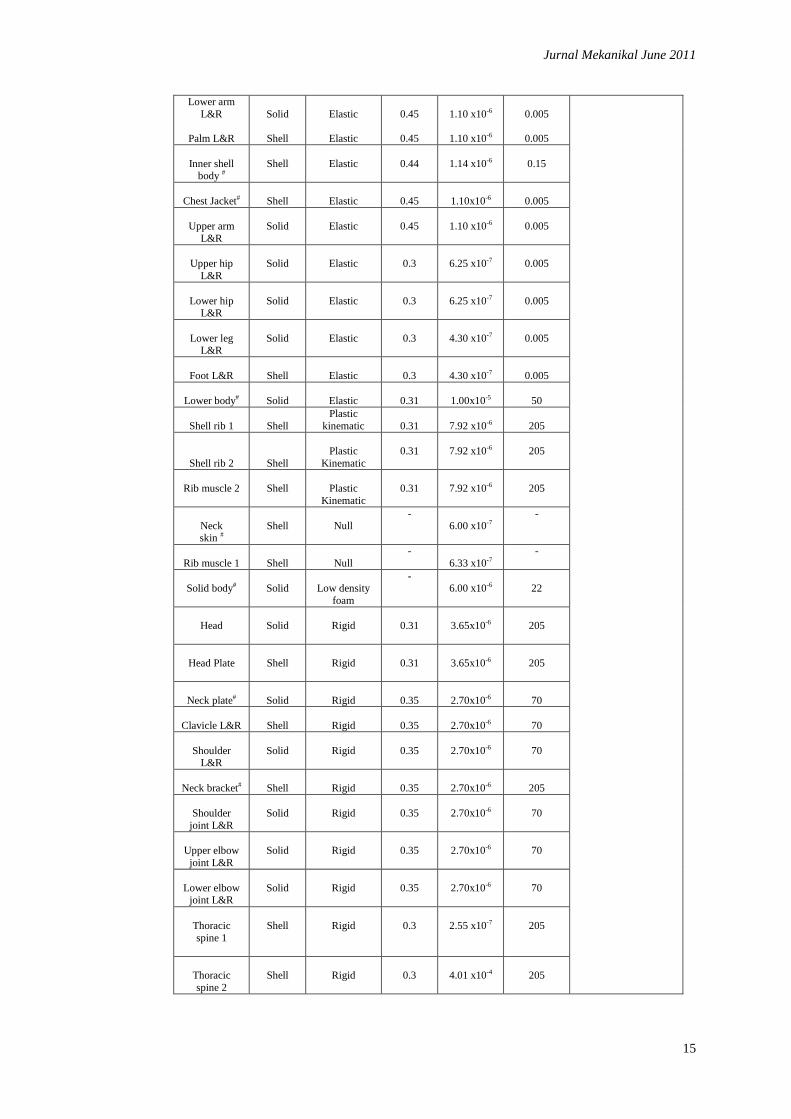
The general description of the finite element child dummy model is presented in Table 2. All parts, material properties, and type of element for each component are incorporated in the table. The neck, chest, and head are among the crucial parts in this numerical child. Material properties for these three parts were obtained from the validation procedure which will be discussed in the next section. Modulus of elasticity and mass density has to be adjusted so that each parameter meets its threshold value. The properties value obtained from the validation procedure were then applied to the full scale numerical dummy for the final frontal crash simulation.
(a) (b)
Table 2 : General description of finite element six months old child model
Part
Element
Material
Type
Poisson’s
Ratio
Density
[kg/mm3]
Young
Modulus, E/Bulk
Modulus, B*[GPa]
Shear
Modulus, G0[GPa]
Shear
Modulus, G [GPa]
Lumbar spine 1
Solid
Viscoelastic
0.4
1.60 x10⁻⁶
0.195*
0.0375
0.01
Lumbar spine 2
Solid
Viscoelastic
0.4
1.60 x10⁻⁶
0.195*
0.0375
0.01
Rib
Solid
Viscoelastic
0.45
1.80 x10⁻⁶
0.33*
0.11
0.0235
Head skin#
Solid
Elastic
0.48
1.20x10⁻⁶
0.02
Neck rubber #
Solid
Elastic
0.48
1.20x10⁻⁶
0.12
Neck center#
Solid
Elastic
0.48
1.20x10⁻⁶
4.0
Figure 1: CAD and numerical child dummy model.
Jurnal Mekanikal June 2011
15
Lower arm L&R
Solid
Elastic
0.45
1.10 x10⁻⁶
0.005
Palm L&R
Shell
Elastic
0.45
1.10 x10⁻⁶
0.005
Inner shell
body #
Shell
Elastic
0.44
1.14 x10⁻⁶
0.15
Chest Jacket#
Shell
Elastic
0.45
1.10x10⁻⁶
0.005
Upper arm
L&R
Solid
Elastic
0.45
1.10 x10⁻⁶
0.005
Upper hip
L&R
Solid
Elastic
0.3
6.25 x10⁻⁷
0.005
Lower hip
L&R
Solid
Elastic
0.3
6.25 x10⁻⁷
0.005
Lower leg
L&R
Solid
Elastic
0.3
4.30 x10⁻⁷
0.005
Foot L&R
Shell
Elastic
0.3
4.30 x10⁻⁷
0.005
Lower body#
Solid
Elastic
0.31
1.00x10⁻⁵
50
Shell rib 1
Shell
Plastic kinematic
0.31
7.92 x10⁻⁶
205
Shell rib 2
Shell
Plastic
Kinematic
0.31
7.92 x10⁻⁶
205
Rib muscle 2
Shell
Plastic
Kinematic
0.31
7.92 x10⁻⁶
205
Neck skin #
Shell
Null
- 6.00 x10⁻⁷
-
Rib muscle 1
Shell
Null
- 6.33 x10⁻⁷
-
Solid body#
Solid
Low density
foam
- 6.00 x10⁻⁶
22
Head
Solid
Rigid
0.31
3.65x10⁻⁶
205
Head Plate
Shell
Rigid
0.31
3.65x10⁻⁶
205
Neck plate#
Solid
Rigid
0.35
2.70x10⁻⁶
70
Clavicle L&R
Shell
Rigid
0.35
2.70x10⁻⁶
70
Shoulder
L&R
Solid
Rigid
0.35
2.70x10⁻⁶
70
Neck bracket#
Shell
Rigid
0.35
2.70x10⁻⁶
205
Shoulder joint L&R
Solid
Rigid
0.35
2.70x10⁻⁶
70
Upper elbow joint L&R
Solid
Rigid
0.35
2.70x10⁻⁶
70
Lower elbow
joint L&R
Solid
Rigid
0.35
2.70x10⁻⁶
70
Thoracic spine 1
Shell
Rigid
0.3
2.55 x10⁻⁷
205
Thoracic spine 2
Shell
Rigid
0.3
4.01 x10⁻⁴
205
Jurnal Mekanikal, June 2011
16
Thoracic spine 3
Solid
Rigid
0.3
2.55 x10⁻⁷
205
Pelvis
Solid
Rigid
0.3
2.14 x10⁻⁵
205
Hip joint
L&R
Solid
Rigid
0.35
2.70x10⁻⁶
70
Upper knee joint L&R
Solid
Rigid
0.35
2.70x10⁻⁶
70
Lower knee joint L&R
Solid
Rigid
0.35
2.70x10⁻⁶
70
Upper arm bone L&R
Shell
Rigid
0.35
2.70x10⁻⁶
70
Lower arm bone L&R
Shell
Rigid
0.35
2.70x10⁻⁶
70
Hip bone
L&R
Shell
Rigid
0.35
2.70x10⁻⁶
70
Lower leg bone L&R
Shell
Rigid
0.3
7.85 x10⁻⁶
210
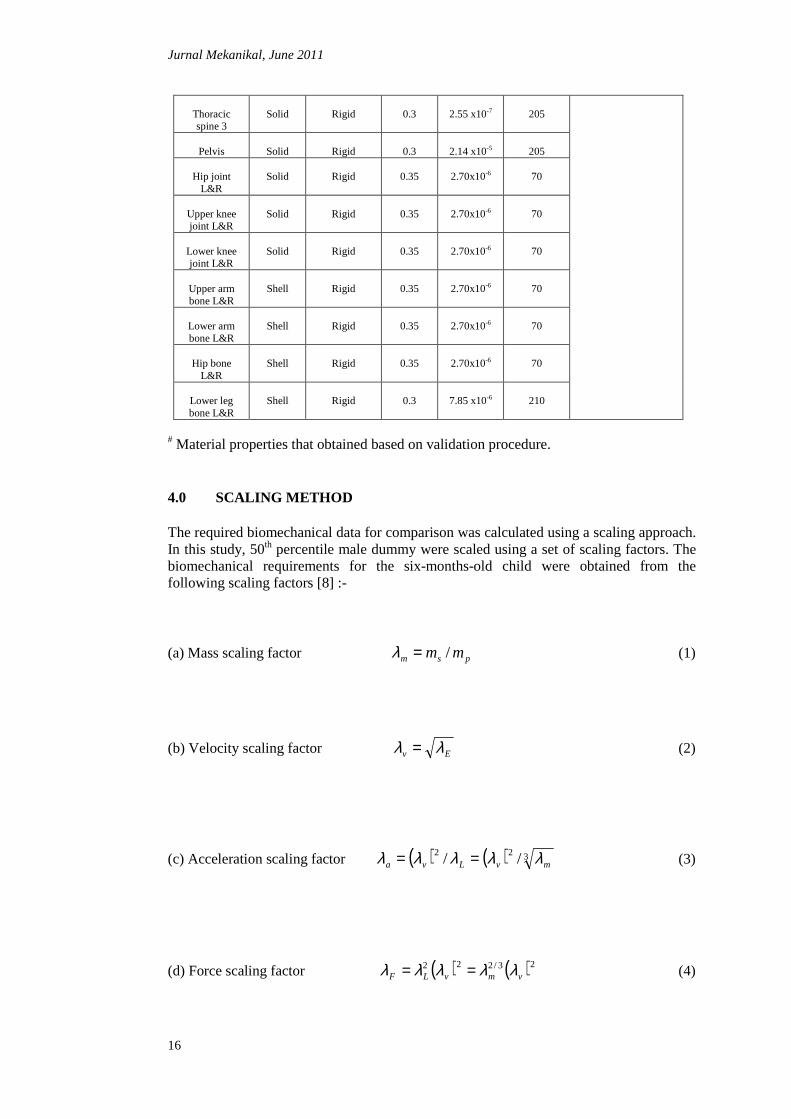
# Material properties that obtained based on validation procedure. 4.0 SCALING METHOD The required biomechanical data for comparison was calculated using a scaling approach. In this study, 50th percentile male dummy were scaled using a set of scaling factors. The biomechanical requirements for the six-months-old child were obtained from the following scaling factors [8] :-
(a) Mass scaling factor psm mm /=λ (1)
(b) Velocity scaling factor Ev λλ = (2)
(c) Acceleration scaling factor ( ) ( ) 322 // mvLva λλλλλ == (3)
(d) Force scaling factor ( ) ( )23/222vmvLF λλλλλ == (4)
Jurnal Mekanikal June 2011
17
(e) Time scaling factor vLT λλλ /= (5)
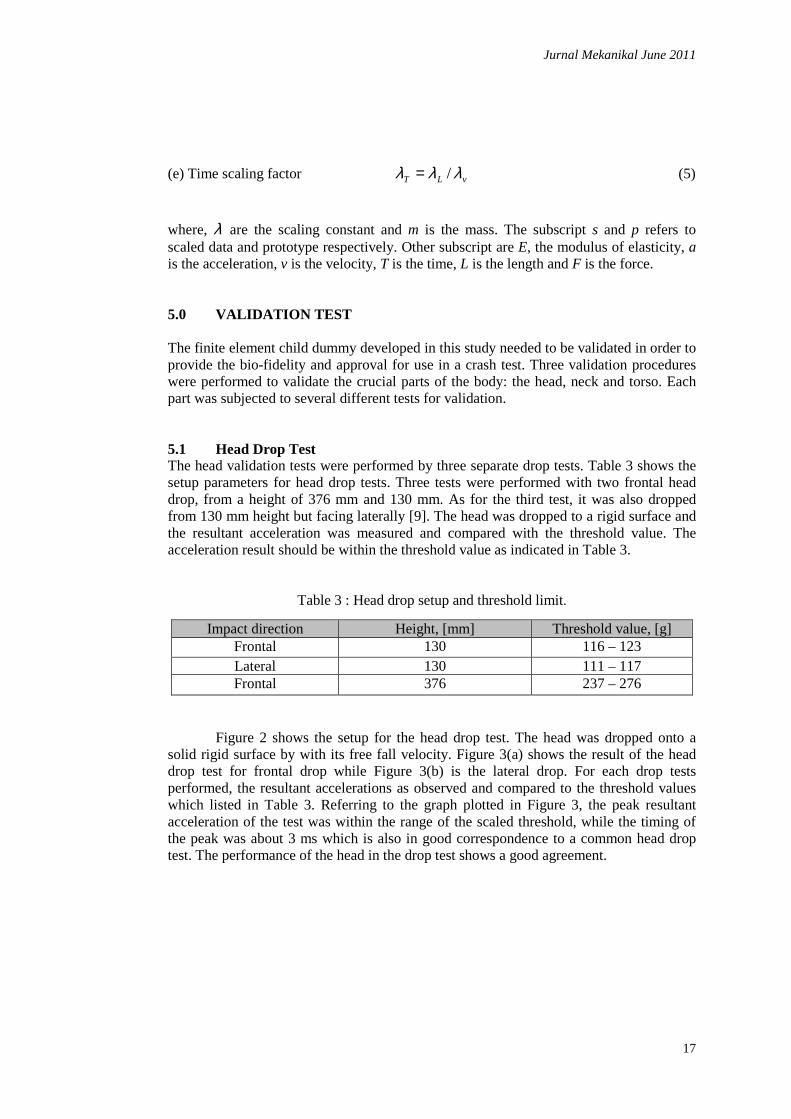
where, λ are the scaling constant and m is the mass. The subscript s and p refers to scaled data and prototype respectively. Other subscript are E, the modulus of elasticity, a is the acceleration, v is the velocity, T is the time, L is the length and F is the force. 5.0 VALIDATION TEST The finite element child dummy developed in this study needed to be validated in order to provide the bio-fidelity and approval for use in a crash test. Three validation procedures were performed to validate the crucial parts of the body: the head, neck and torso. Each part was subjected to several different tests for validation. 5.1 Head Drop Test The head validation tests were performed by three separate drop tests. Table 3 shows the setup parameters for head drop tests. Three tests were performed with two frontal head drop, from a height of 376 mm and 130 mm. As for the third test, it was also dropped from 130 mm height but facing laterally [9]. The head was dropped to a rigid surface and the resultant acceleration was measured and compared with the threshold value. The acceleration result should be within the threshold value as indicated in Table 3.
Table 3 : Head drop setup and threshold limit.
Figure 2 shows the setup for the head drop test. The head was dropped onto a solid rigid surface by with its free fall velocity. Figure 3(a) shows the result of the head drop test for frontal drop while Figure 3(b) is the lateral drop. For each drop tests performed, the resultant accelerations as observed and compared to the threshold values which listed in Table 3. Referring to the graph plotted in Figure 3, the peak resultant acceleration of the test was within the range of the scaled threshold, while the timing of the peak was about 3 ms which is also in good correspondence to a common head drop test. The performance of the head in the drop test shows a good agreement.
Impact direction Height, [mm] Threshold value, [g] Frontal 130 116 – 123 Lateral 130 111 – 117 Frontal 376 237 – 276
Jurnal Mekanikal, June 2011
18
0
50
100
150
200
250
300
0 10 20 30 40 50 60 70 80 90 100
Figure 2 : Head drop setup
Figure 3 : Head resultant acceleration reading
130mm
(b)
Lateral Drop
Rigid body 130mm
376mm (a)
Frontal Drop
0
50
100
150
200
250
300
1 29 57 85 113 141 169 197 225 253 281 309 337Time(ms)
Acc
eler
atio
n(g
)
(a) 130mm
376mm
Acc
eler
atio
n[g]
Time [ms]
130mm Acc
eler
atio
n[g]
Time [ms]
(b))
Jurnal Mekanikal June 2011
19
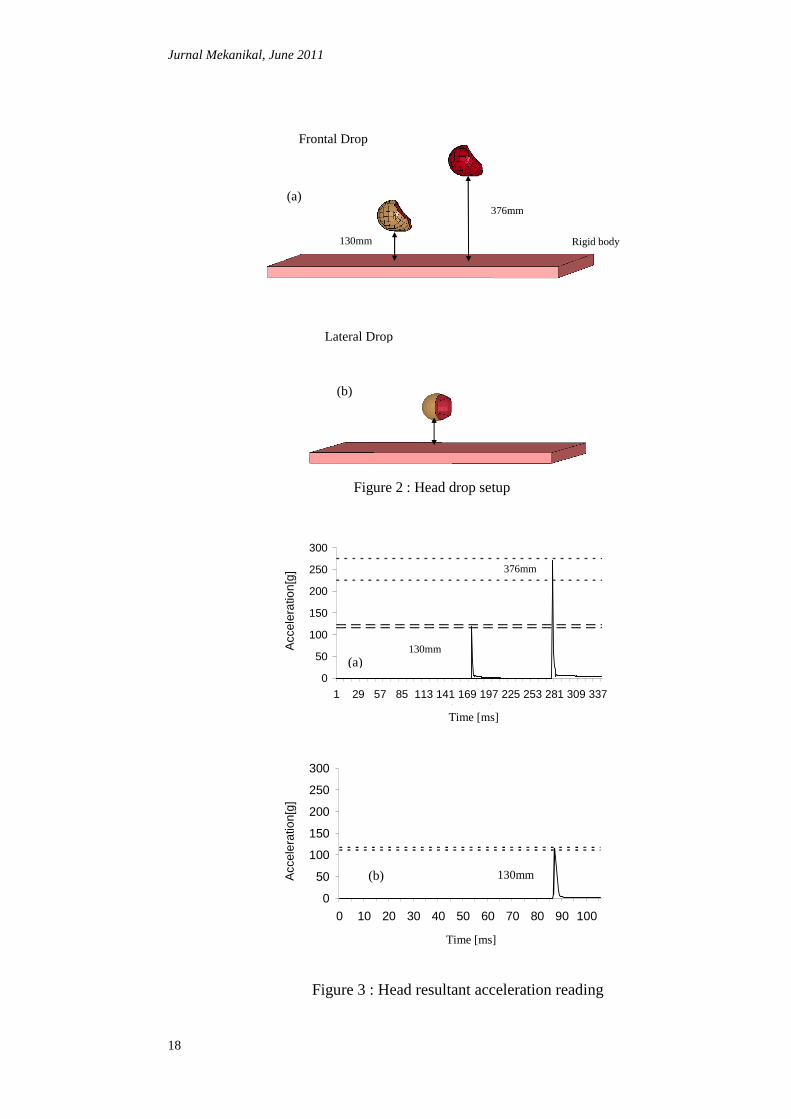
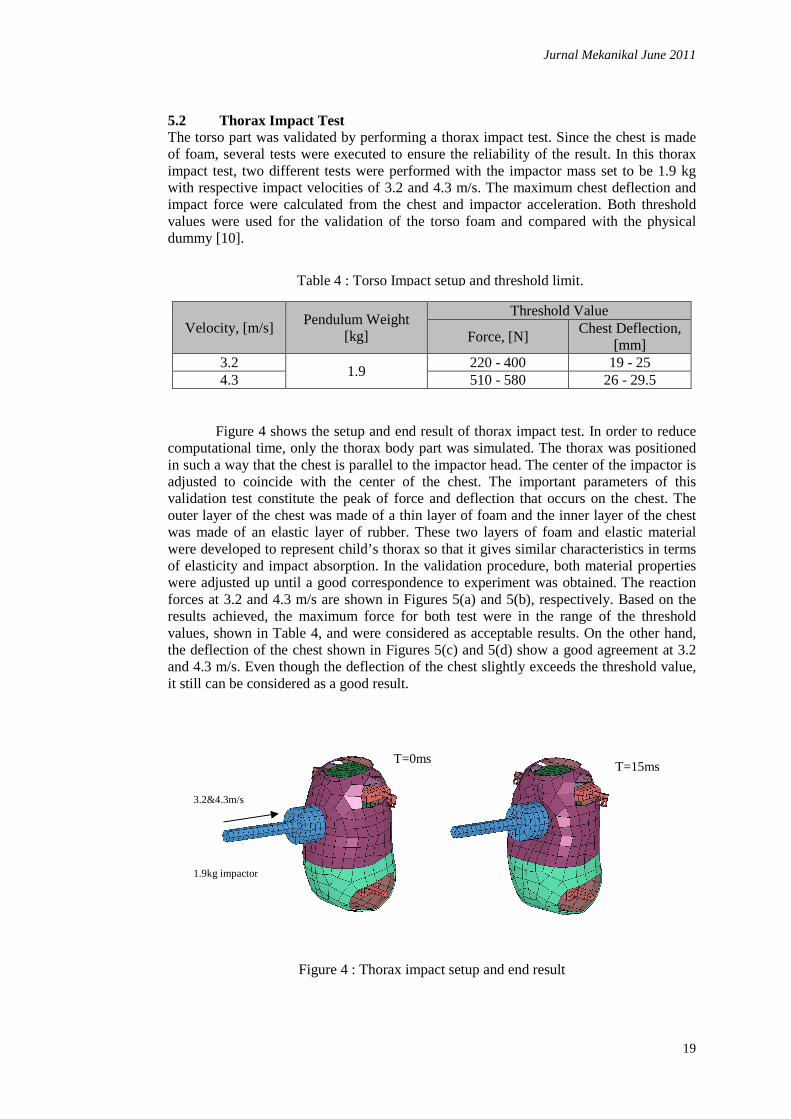
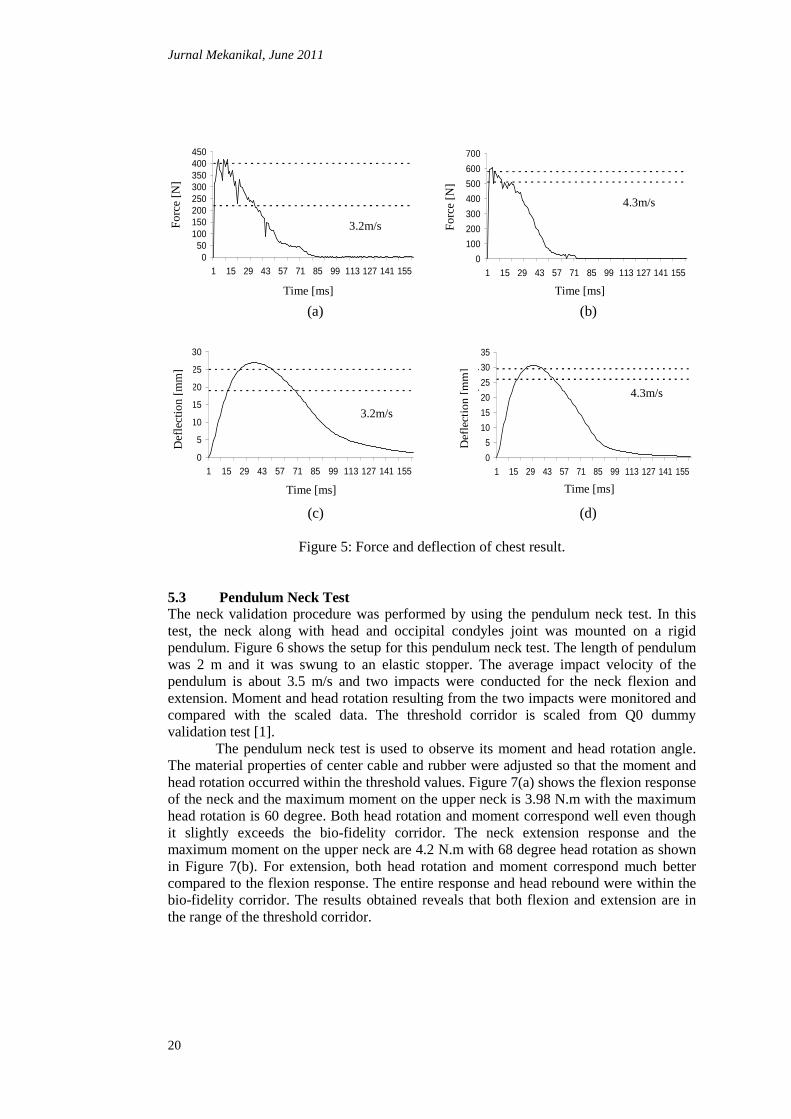
5.2 Thorax Impact Test The torso part was validated by performing a thorax impact test. Since the chest is made of foam, several tests were executed to ensure the reliability of the result. In this thorax impact test, two different tests were performed with the impactor mass set to be 1.9 kg with respective impact velocities of 3.2 and 4.3 m/s. The maximum chest deflection and impact force were calculated from the chest and impactor acceleration. Both threshold values were used for the validation of the torso foam and compared with the physical dummy [10].
Figure 4 shows the setup and end result of thorax impact test. In order to reduce computational time, only the thorax body part was simulated. The thorax was positioned in such a way that the chest is parallel to the impactor head. The center of the impactor is adjusted to coincide with the center of the chest. The important parameters of this validation test constitute the peak of force and deflection that occurs on the chest. The outer layer of the chest was made of a thin layer of foam and the inner layer of the chest was made of an elastic layer of rubber. These two layers of foam and elastic material were developed to represent child’s thorax so that it gives similar characteristics in terms of elasticity and impact absorption. In the validation procedure, both material properties were adjusted up until a good correspondence to experiment was obtained. The reaction forces at 3.2 and 4.3 m/s are shown in Figures 5(a) and 5(b), respectively. Based on the results achieved, the maximum force for both test were in the range of the threshold values, shown in Table 4, and were considered as acceptable results. On the other hand, the deflection of the chest shown in Figures 5(c) and 5(d) show a good agreement at 3.2 and 4.3 m/s. Even though the deflection of the chest slightly exceeds the threshold value, it still can be considered as a good result.
Figure 4 : Thorax impact setup and end result
Velocity, [m/s] Pendulum Weight
[kg]
Threshold Value
Force, [N] Chest Deflection,
[mm] 3.2
1.9 220 - 400 19 - 25
4.3 510 - 580 26 - 29.5
Table 4 : Torso Impact setup and threshold limit.
1.9kg impactor
3.2&4.3m/s
T=0ms T=15ms
Jurnal Mekanikal, June 2011
20
(a) (b)
(c) (d)
Figure 5: Force and deflection of chest result.
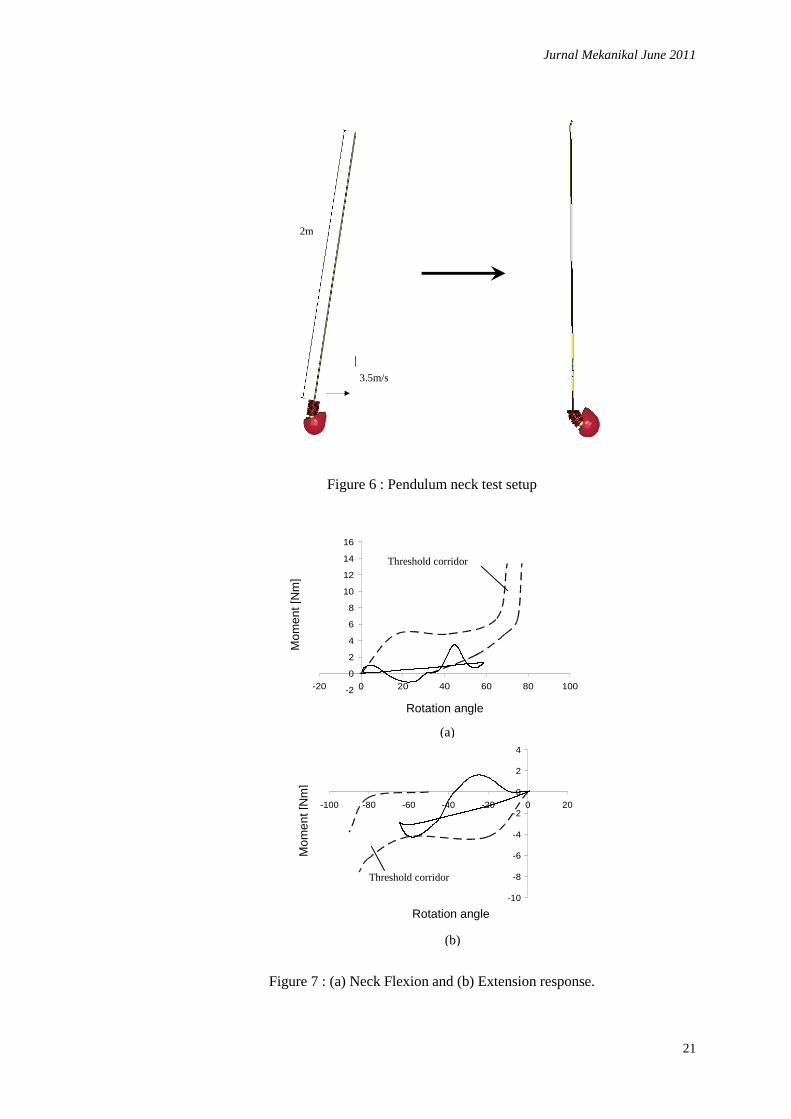
5.3 Pendulum Neck Test The neck validation procedure was performed by using the pendulum neck test. In this test, the neck along with head and occipital condyles joint was mounted on a rigid pendulum. Figure 6 shows the setup for this pendulum neck test. The length of pendulum was 2 m and it was swung to an elastic stopper. The average impact velocity of the pendulum is about 3.5 m/s and two impacts were conducted for the neck flexion and extension. Moment and head rotation resulting from the two impacts were monitored and compared with the scaled data. The threshold corridor is scaled from Q0 dummy validation test [1].
The pendulum neck test is used to observe its moment and head rotation angle. The material properties of center cable and rubber were adjusted so that the moment and head rotation occurred within the threshold values. Figure 7(a) shows the flexion response of the neck and the maximum moment on the upper neck is 3.98 N.m with the maximum head rotation is 60 degree. Both head rotation and moment correspond well even though it slightly exceeds the bio-fidelity corridor. The neck extension response and the maximum moment on the upper neck are 4.2 N.m with 68 degree head rotation as shown in Figure 7(b). For extension, both head rotation and moment correspond much better compared to the flexion response. The entire response and head rebound were within the bio-fidelity corridor. The results obtained reveals that both flexion and extension are in the range of the threshold corridor.
050
100150200250300350400450
1 15 29 43 57 71 85 99 113 127 141 155
Time(ms)
Fo
rce(
N)
3.2m/s Fo
rce [
N]
Time [ms]
0
5
10
15
20
25
30
1 15 29 43 57 71 85 99 113 127 141 155
Time(ms)
Def
lect
ion
(mm
)
3.2m/s
Def
lect
ion
[mm
]
Time [ms]
0
100
200
300
400
500
600
700
1 15 29 43 57 71 85 99 113 127 141 155
Time(ms)
Fo
rce(
N)
4.3m/s
Fo
rce [
N]
Time [ms]
0
5
10
15
20
25
30
35
1 15 29 43 57 71 85 99 113 127 141 155
Time(ms)
Def
lect
ion
(mm
)
4.3m/s
Def
lect
ion
[mm
]
Time [ms]
Jurnal Mekanikal June 2011
21
Figure 6 : Pendulum neck test setup
Figure 7 : (a) Neck Flexion and (b) Extension response.
2m
3.5m/s
(a)
-2
0
2
4
6
8
10
12
14
16
-20 0 20 40 60 80 100
Rotation angle
Mo
men
t(N
m)
Threshold corridor
Mom
ent [
Nm
]
Rotation angle
(b)
-10
-8
-6
-4
-2
0
2
4
-100 -80 -60 -40 -20 0 20
Rotation angle
Mo
men
t(N
m)
Threshold corridor
Mom
ent [
Nm
]
Rotation angle
Jurnal Mekanikal, June 2011
22
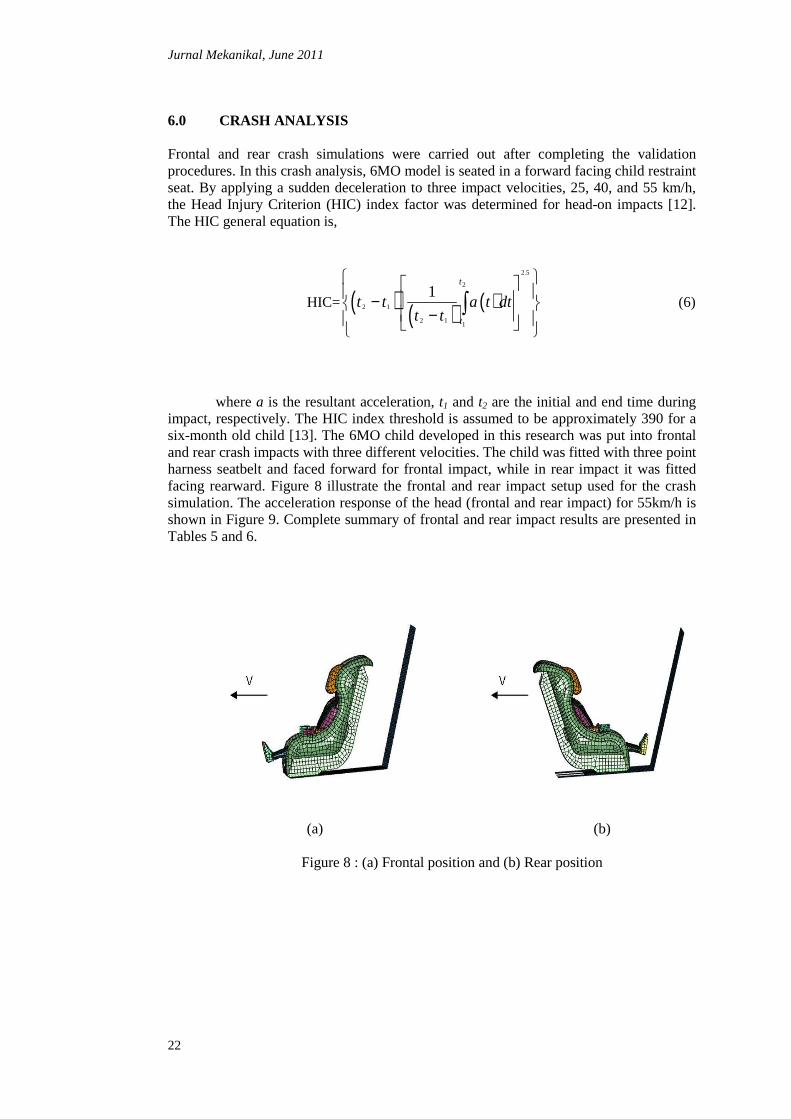
6.0 CRASH ANALYSIS Frontal and rear crash simulations were carried out after completing the validation procedures. In this crash analysis, 6MO model is seated in a forward facing child restraint seat. By applying a sudden deceleration to three impact velocities, 25, 40, and 55 km/h, the Head Injury Criterion (HIC) index factor was determined for head-on impacts [12]. The HIC general equation is,
HIC=( ) ( ) ( )2.5
2
2 1
2 11
1t
t
t t a t dtt t
− −
∫ (6)
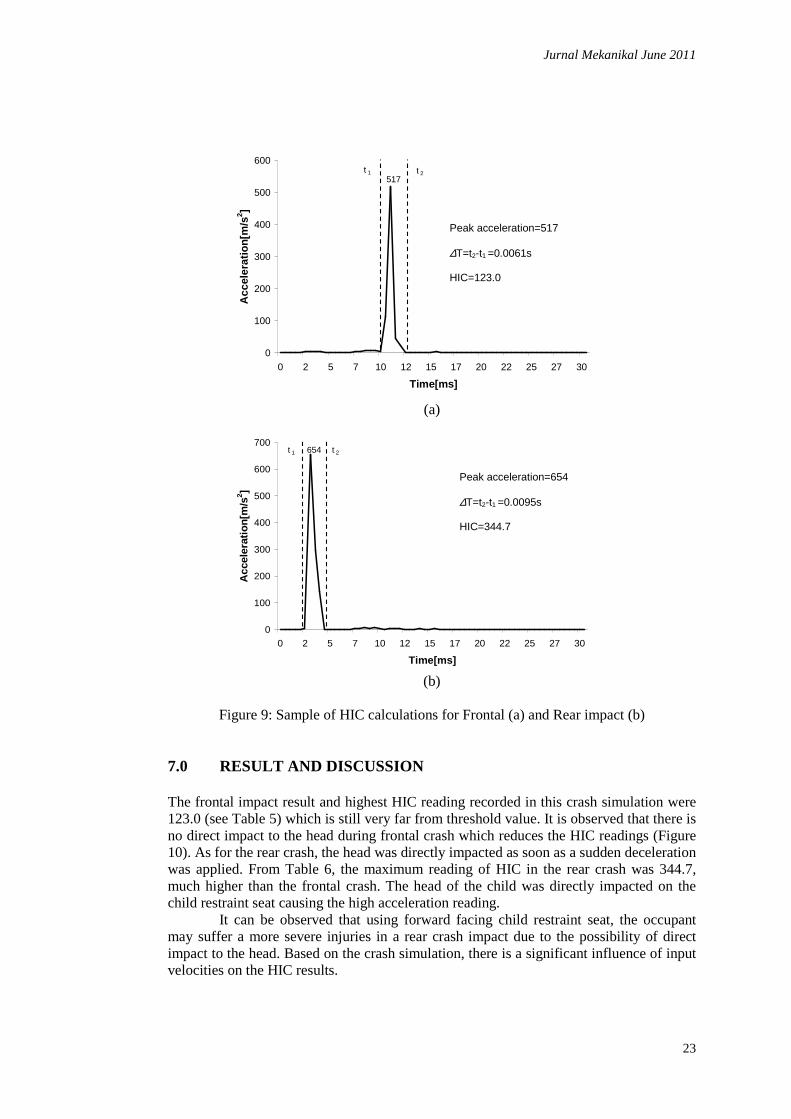
where a is the resultant acceleration, t1 and t2 are the initial and end time during impact, respectively. The HIC index threshold is assumed to be approximately 390 for a six-month old child [13]. The 6MO child developed in this research was put into frontal and rear crash impacts with three different velocities. The child was fitted with three point harness seatbelt and faced forward for frontal impact, while in rear impact it was fitted facing rearward. Figure 8 illustrate the frontal and rear impact setup used for the crash simulation. The acceleration response of the head (frontal and rear impact) for 55km/h is shown in Figure 9. Complete summary of frontal and rear impact results are presented in Tables 5 and 6.
(a) (b)
Figure 8 : (a) Frontal position and (b) Rear position
Jurnal Mekanikal June 2011
23
0
100
200
300
400
500
600
700
0 2 5 7 10 12 15 17 20 22 25 27 30
Time[ms]
Acc
eler
atio
n[m
/s2 ]
t 2t 1 654
0
100
200
300
400
500
600
0 2 5 7 10 12 15 17 20 22 25 27 30
Time[ms]
Acc
eler
atio
n[m
/s2 ]
517t 2t 1
(a)
(b)
Figure 9: Sample of HIC calculations for Frontal (a) and Rear impact (b)
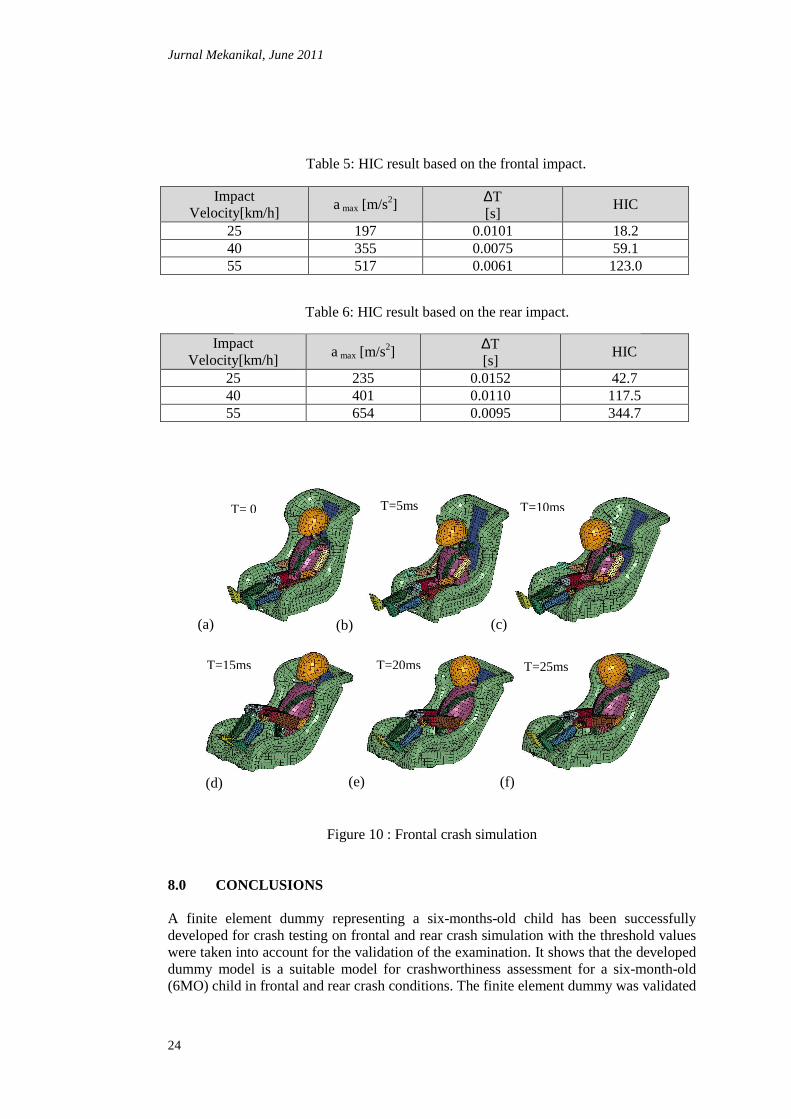
7.0 RESULT AND DISCUSSION The frontal impact result and highest HIC reading recorded in this crash simulation were 123.0 (see Table 5) which is still very far from threshold value. It is observed that there is no direct impact to the head during frontal crash which reduces the HIC readings (Figure 10). As for the rear crash, the head was directly impacted as soon as a sudden deceleration was applied. From Table 6, the maximum reading of HIC in the rear crash was 344.7, much higher than the frontal crash. The head of the child was directly impacted on the child restraint seat causing the high acceleration reading.
It can be observed that using forward facing child restraint seat, the occupant may suffer a more severe injuries in a rear crash impact due to the possibility of direct impact to the head. Based on the crash simulation, there is a significant influence of input velocities on the HIC results.
Peak acceleration=654 ∆T=t2-t1
=0.0095s HIC=344.7
Peak acceleration=517 ∆T=t2-t1
=0.0061s HIC=123.0
Jurnal Mekanikal, June 2011
24
Figure 10 : Frontal crash simulation 8.0 CONCLUSIONS
A finite element dummy representing a six-months-old child has been successfully developed for crash testing on frontal and rear crash simulation with the threshold values were taken into account for the validation of the examination. It shows that the developed dummy model is a suitable model for crashworthiness assessment for a six-month-old (6MO) child in frontal and rear crash conditions. The finite element dummy was validated
Impact Velocity[km/h]
a max [m/s2] ∆T
[s] HIC
25 197 0.0101 18.2 40 355 0.0075 59.1 55 517 0.0061 123.0
Impact Velocity[km/h]
a max [m/s2] ∆T
[s] HIC
25 235 0.0152 42.7 40 401 0.0110 117.5 55 654 0.0095 344.7
Table 5: HIC result based on the frontal impact.
T= 0
(a)
T=5ms
(b)
T=10ms
(c)
T=15ms
(d)
T=20ms
(e)
T=25ms
(f)
Table 6: HIC result based on the rear impact.
Jurnal Mekanikal June 2011
25
using scaled data which is a threshold for 6MO bio-fidelity. All validation results show good agreement to the target requirement.
In the preliminary test of the dummy, it is found the rear impact is more dangerous. The simplified crash condition was performed to observe how the numerical child dummy reacts in a crash condition.
REFERENCES 1. Mohan. P, Marzougui. D, Roel V. D. Velde, Cing D.(Steve) Kan, 2007,
Development of Detailed Finite Element Dummy Model, 6th German LS-DYNA Forum. .
2. Kate D. Jager, Michiel V. Ratingen, Lesire. P, Pastor. C, Gonçal T. Applus, Jean P. Lepretre, 2005, Assessing New Child Dummies and Criteria for Child Occupant Protection in Frontal Impact, 19th Enhance Safety Vehicle (ESV) Conference.
3. Ruff C., Eichberger A., 2005, Validation of 3yrs and 6yrs FTSS dummy models for check of OoP suitability, LS-DYNA Anwenderforum, Bamberg.
4. Richard A. Johnson, Dean W. Wichern, 2001, Applied Multivariate Statistical Analysis (5th Edition).
5. Livermore Software Technology Corporation, 2007, LS-DYNA keyword user’s manual.
6. Mohamad S. Ibrahim, Rakhmad A. Siregar, Abdul H. Adom, Shah F. Khan, Zakaria. H, 2009, Development of Numerical Child Dummy Model for Crashworthiness Assessment, 2nd International Conference on Applications and Design in Mechanical Engineering (ICADME), [pg 103].
7. Cing D. (Steve) Kan, Marzougui. D, Nabih E. Bedewi, 2003, Development of 50th Percentile Hybrid III Dummy, 4th European of LS-DYNA Users Conference.
8. Wang Y., Rangarajan N., Shams T., Fukuda T., Yamada T., Jenny C., 2005, Design of a Biofidelic Instrumented 3.4KgInfant Dummy, 19th Enhance Safety Vehicle (ESV) Conference.
9. Xiaoxia. M, Nasser Tamini, Liang. M, Tang. A, Bingyuan. P, 2006, Hybrid III Semi-Rigid Dummy Models Developed from Rigid Dummy Models in VPG Environment, www.peraglobal.com/10th/paper_car.html.
10. Naravane. A, Deb. A, 2005, Validation of a Hybrid III Dummy Model and Its Application in Simulation of Vehicle Frontal NCAP Tests, Altair CAE Users Conference.
11. Gehre. C, Schindler. V, 2005, Development of the Numerical Model of the New-Born Child Dummy Q0, 19th Enhance Safety Vehicle (ESV) Conference.
12. Brian G. Mc Henry, 2004, Head Injury Criterion and the ATB, ATB Users' Conference.
13. Eppinger. E, Sun. E, Kuppa. S, Roger Saul, 2000, Supplement: Development of Improved Injury Criteria for the Assessment of Advanced Automotive Restraint Systems Retrieve on September 15, 2009 from,www.nhtsa.dot.gov/staticfiles/DOT/NHTSA/Rulemaking/Articles/Associated%20Files/finalrule_all.pdf.