0 (prelim)noor azina et. al.indd 1 12/21/2015 9:12:45 am · pdf file0_(prelim)noor azina et....
TRANSCRIPT

0_(Prelim)Noor Azina et. al.indd 1 12/21/2015 9:12:45 AM

0_(Prelim)Noor Azina et. al.indd 2 12/21/2015 9:12:45 AM
UNIVERSITY OF MALAYAPRESS
ILMU PUNCHA KEMAJUAN
KUALA LUMPUR2016
0_(Prelim)Noor Azina et. al.indd 3 12/21/2015 9:12:46 AM
Published byUniversity of Malaya Press
Universiti Malaya50603 Kuala Lumpur
www.umpress.com.my
Founding Member of Malaysian Book Publishers Association—Membership No: 196906Founding Member of Malaysian Scholarly Publishing Council
© Noor Azina Ismail, Susila Munisamy, Ahmad Farid Osman, 2016
All rights reserved.No part of this publication may be reproduced,
stored in a retrieval system, or transmitted,in any form or by any means
electronic, mechanical, photocopying,recording or otherwise,
without the prior permission of the Publisher.
Perpustakaan Negara Malaysia Cataloging-in-Publication Data
Statistics in Research / Editors Noor Azina Ismail, Susila Munisamy, Ahmad Farid Osman ISBN 978-983-100-847-8 1. Statistics. 2 Research—Methodology. I. Noor Azina Ismail. II, Susila Munisamy. III. Ahmad Farid Osman. 001.422
Printed byUniversity of Malaya Press
Universiti Malaya50603 Kuala Lumpur
0_(Prelim)Noor Azina et. al.indd 4 12/21/2015 9:12:46 AM
v
Contents
List of Figures viiList of Tables ixPreface xiiiList of Contributors xv
1 Introduction 1 Noor Azina Ismail & Ahmad Farid Osman
2 Coherence Analysis in Identifying Factors Influencing Fatal Road Traffic Accidents 7 Noor Ismawati Mohd Jaafar, Rosmariana Ramli & Rohana Jani
3 Factors Affecting the Number of Daily Activities Participated by Older Malaysians 21 Ng Sor Tho & Tengku Aizan Hamid
4 Socio-Economic Determinants of Fertility in Indonesia 37 Tey Nai Peng
5 Examining the Relationship between Socio-economic Status and Science Achievement Using Binary Logistic Regression 51 Noor Azina Ismail & Kang Su Yun
0_(Prelim)Noor Azina et. al.indd 5 12/21/2015 9:12:46 AM
6 Determinants of Successful Adoption of E-Learning System in the Teaching and Learning Environment at the University of Malaya 63 Wee-Yeap Lau
7 A Study on Environmental Efficiency of the Manufacturing Sector in Malaysia Using Data Envelopment Analysis 75 Noor Asiah Ramli & Susila Munisamy
8 The Application of Hotelling’s T2 Control Chart in an Automotive Stamped Parts Manufacturing Plant 91 Muzalwana Abdul Talib & Susila Munisamy
9 Analysing Technical and Scale Efficiency in Asian Container Ports with Data Envelopment Analysis 109 Susila Munisamy
10 Modeling and Forecasting the Crude Palm Oil Price and Production of Malaysia 121 Jia-Ming Chong & Kim-Leng Goh
Bibliography 143Index 157
0_(Prelim)Noor Azina et. al.indd 6 12/21/2015 9:12:46 AM
vii
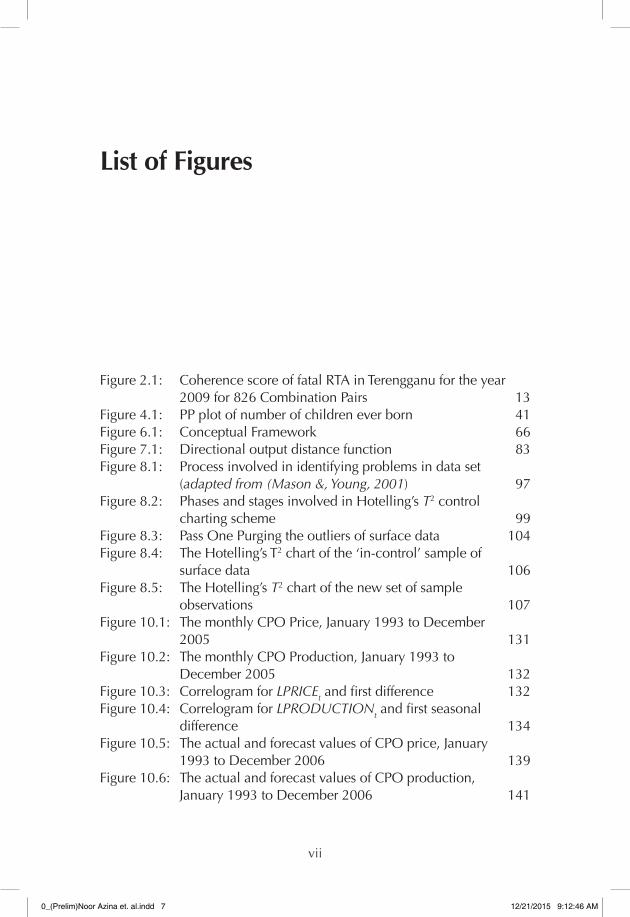
Figure 2.1: Coherence score of fatal RTA in Terengganu for the year 2009 for 826 Combination Pairs 13Figure 4.1: PP plot of number of children ever born 41Figure 6.1: Conceptual Framework 66Figure 7.1: Directional output distance function 83Figure 8.1: Process involved in identifying problems in data set (adapted from (Mason &, Young, 2001) 97Figure 8.2: Phases and stages involved in Hotelling’s T2 control charting scheme 99Figure 8.3: Pass One Purging the outliers of surface data 104Figure 8.4: The Hotelling’s T2 chart of the ‘in-control’ sample of surface data 106Figure 8.5: The Hotelling’s T2 chart of the new set of sample observations 107Figure 10.1: The monthly CPO Price, January 1993 to December 2005 131Figure 10.2: The monthly CPO Production, January 1993 to December 2005 132Figure 10.3: Correlogram for LPRICEt and first difference 132Figure 10.4: Correlogram for LPRODUCTIONt and first seasonal difference 134Figure 10.5: The actual and forecast values of CPO price, January 1993 to December 2006 139Figure 10.6: The actual and forecast values of CPO production, January 1993 to December 2006 141
List of Figures
0_(Prelim)Noor Azina et. al.indd 7 12/21/2015 9:12:46 AM

0_(Prelim)Noor Azina et. al.indd 8 12/21/2015 9:12:46 AM

ix
Table 2.1: The number of fatal RTA in Terengganu for the year 2009 by speed limit and type of collision, jij. 12Table 2.2: Coherence Scores for Combination Pairs identified as Outliers 14Table 2.3: Average Coherence Scores of coherence score of the sub-categories 17Table 3.1: Percentage and frequency distribution of respondents by socio-demographic factors, perceived health status and self-esteem 25Table 3.2: Percentage and frequency distribution of respondents by varieties of daily activity participation 26Table 3.3: Likelihood ratio statistics for Type 3 Analysis (Poisson model) 28Table 3.4: Parameter estimates for Poisson model on the number of activities participated in a day 28Table 3.5: Likelihood ratio statistics for Type 3 Analysis (Negative Binomial model) 29Table 3.6: Parameter Estimates for Negative Binomial Model on the Number of Activities Participated in a Day 29Table 3.7: Expected number of activities participated daily from the Negative Binomial Regression for various socio-demographic factors, perceived health status and self-esteem of respondents 34Table 4.1: Total fertility rate, age specific fertility rate and mean age at childbearing, Indonesia, 1967-2007 38
List of Tables
0_(Prelim)Noor Azina et. al.indd 9 12/21/2015 9:12:46 AM
x
Statistics In Research
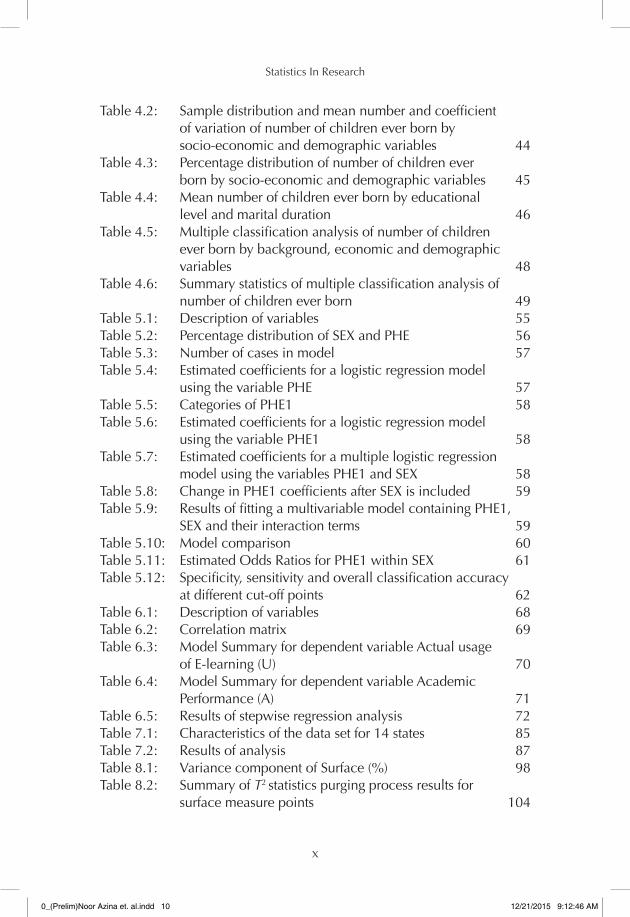
Table 4.2: Sample distribution and mean number and coefficient of variation of number of children ever born by socio-economic and demographic variables 44Table 4.3: Percentage distribution of number of children ever born by socio-economic and demographic variables 45Table 4.4: Mean number of children ever born by educational level and marital duration 46Table 4.5: Multiple classification analysis of number of children ever born by background, economic and demographic variables 48Table 4.6: Summary statistics of multiple classification analysis of number of children ever born 49Table 5.1: Description of variables 55Table 5.2: Percentage distribution of SEX and PHE 56Table 5.3: Number of cases in model 57Table 5.4: Estimated coefficients for a logistic regression model using the variable PHE 57Table 5.5: Categories of PHE1 58Table 5.6: Estimated coefficients for a logistic regression model using the variable PHE1 58Table 5.7: Estimated coefficients for a multiple logistic regression model using the variables PHE1 and SEX 58Table 5.8: Change in PHE1 coefficients after SEX is included 59Table 5.9: Results of fitting a multivariable model containing PHE1, SEX and their interaction terms 59Table 5.10: Model comparison 60Table 5.11: Estimated Odds Ratios for PHE1 within SEX 61Table 5.12: Specificity, sensitivity and overall classification accuracy at different cut-off points 62Table 6.1: Description of variables 68Table 6.2: Correlation matrix 69Table 6.3: Model Summary for dependent variable Actual usage of E-learning (U) 70Table 6.4: Model Summary for dependent variable Academic Performance (A) 71Table 6.5: Results of stepwise regression analysis 72Table 7.1: Characteristics of the data set for 14 states 85Table 7.2: Results of analysis 87Table 8.1: Variance component of Surface (%) 98Table 8.2: Summary of T2 statistics purging process results for surface measure points 104
0_(Prelim)Noor Azina et. al.indd 10 12/21/2015 9:12:46 AM
xi
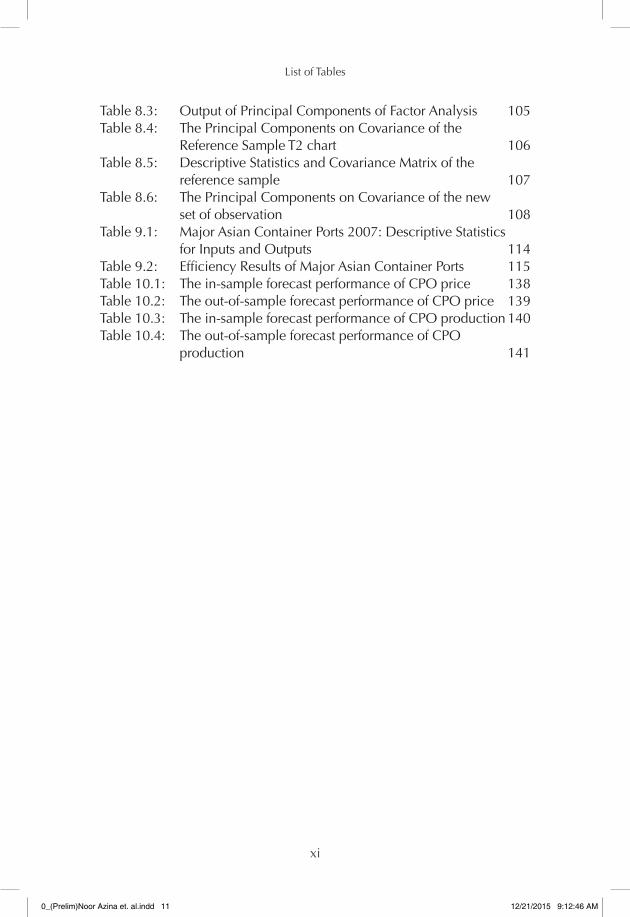
List of Tables
Table 8.3: Output of Principal Components of Factor Analysis 105Table 8.4: The Principal Components on Covariance of the Reference Sample T2 chart 106Table 8.5: Descriptive Statistics and Covariance Matrix of the reference sample 107Table 8.6: The Principal Components on Covariance of the new set of observation 108Table 9.1: Major Asian Container Ports 2007: Descriptive Statistics for Inputs and Outputs 114Table 9.2: Efficiency Results of Major Asian Container Ports 115Table 10.1: The in-sample forecast performance of CPO price 138Table 10.2: The out-of-sample forecast performance of CPO price 139Table 10.3: The in-sample forecast performance of CPO production 140Table 10.4: The out-of-sample forecast performance of CPO production 141
0_(Prelim)Noor Azina et. al.indd 11 12/21/2015 9:12:46 AM

0_(Prelim)Noor Azina et. al.indd 12 12/21/2015 9:12:46 AM
xiii
Preface
In 2006, the Department of Applied Statistics, Faculty of Economics and Administration, University of Malaya, for the first time produced a book entitled Statistics in Action, and was published by the University Malaya Press. The objective was to highlight research carried out in the department and give insights made possible through statistics. With the same aim and objective, the chapters in this second book are written by either an individual staff, in collaboration with colleagues in the department or faculty, students or authors from outside of the faculty.
While the university is focusing on publication of manuscripts in Tier 1 ISI/Web of Science journals and staff in the department are actively contributing to these journals, the department also believes that publishing a book will provide them the brand that will drive them forward. Furthermore, the benefits will go to the readers or researchers in many different ways. Given the applied nature of the research, this book should be able to attract readers among undergraduate or postgraduate students and as well as researchers.
In this book, statistical techniques are used to solve a variety of real life problems that arises in many areas of studies. The first three chapters illustrate the use of statistical techniques in public health and safety. One of the chapters presents a method of identifying factors influencing fatal road traffic accidents while another two chapters discuss on factors affecting daily activities participated by older Malaysian and determinants of fertility in Indonesia. In addition, there are two chapters that elaborate the use of statistical techniques in education. Chapter five in particular, explains a method of assessing relationship between socio-economic status and
0_(Prelim)Noor Azina et. al.indd 13 12/21/2015 9:12:46 AM

xiv
Statistics In Research
students’ achievement in science. On the other hand, chapter six analyses the determinants of successful adoption of e-learning system.
The remaining four chapters of this book, in contrast to other chapters, illustrate the use of statistical techniques in manufacturing and industry. Chapters seven and eight for instance, describe the use of statistical approaches in manufacturing sectors. The last two chapters, however, explain the use of statistical methods in ports and crude palm oil industries.
Noor Azina IsmailSusila MunisamyAhmad Farid Osman
0_(Prelim)Noor Azina et. al.indd 14 12/21/2015 9:12:46 AM
xv
List of Contributors
Dr. Ahmad Farid Osman, Senior Lecturer, Department of Applied Statistics, Faculty of Economics and Administration, University of Malaya
Dr. Kim-Leng Goh, Professor, Department of Applied Statistics, Faculty of Economics and Administration, University of Malaya
Dr. Muzalwana Abdul Talib, Senior Lecturer, Department of Applied Statistics, Faculty of Economics and Administration, University of Malaya
Dr. Ng Sor Tho, Senior Lecturer, Department of Applied Statistics, Faculty of Economics and Administration, University of Malaya
Dr. Noor Asiah Ramli, Senior Lecturer, Department of Statistical and Decision Sciences, Faculty of Computer and Mathematical Sciences, Universiti Teknologi MARA
Dr. Noor Azina Ismail, Professor, Department of Applied Statistics, Faculty of Economics and Administration, University of Malaya
Noor Ismawati Mohd Jaafar, Lecturer, Department of Applied Statistics, Faculty of Economics and Administration, University of Malaya
Dr. Rohana Jani, Associate Professor, Department of Applied Statistics, Faculty of Economics and Administration, University of Malaya
0_(Prelim)Noor Azina et. al.indd 15 12/21/2015 9:12:46 AM
xvi
Statistics In Research
Rosmariana Ramli, Graduate Student, Department of Applied Statistics, Faculty of Economics and Administration, University of Malaya
Dr. Susila Munisamy, Professor, Department of Applied Statistics, Faculty of Economics and Administration, University of Malaya
Dr. Tengku Aizan Hamid, Professor, Director, Institute of Gerontology, Universiti Putra Malaysia.
Tey Nai Peng, Senior Research Fellow, Department of Applied Statistics, Faculty of Economics and Administration, University of Malaya
Dr. Wee-Yeap, Lau, Senior Lecturer, Department of Applied Statistics, Faculty of Economics and Administration, University of Malaya
Jia-Ming Chong, Graduate Student, Department of Applied Statistics, Faculty of Economics and Administration, University of Malaya
Kang Su Yun, Graduate Student, Department of Applied Statistics, Faculty of Economics and Administration, University of Malaya
0_(Prelim)Noor Azina et. al.indd 16 12/21/2015 9:12:46 AM