mt perak modul ats
DESCRIPTION
Perak Add Maths SPM ATSTRANSCRIPT
ISI KANDUNGAN
Bil. Perkara
Halaman
1 Prakata
ii
2 Jawatankuasa Pembinaan Modul
iii
3 Panduan Penggunaan Modul
iv-v
4 Rekod Pelaksanaan Modul
vi
5 Soalan Topikal & Skema Jawapan
- Tingkatan 4
- Tingkatan 5
1 – 71
72 - 150
i
PRAKATA
Salah satu daripada tujuh sasaran utama Perancangan Strategik JPN Perak 2006-2010 ialah meningkatkan kecemerlangan keputusan peperiksaan awam. Sasaran ini adalah selari dengan fungsi ke-6 Sektor Pengurusan Akademik, JPN Perak iaitu merancang pelaksanaan program Latih Tubi untuk kelas-kelas peperiksaan peringkat negeri. Pelaksanaan Modul Latih Tubi Answer To Score (ATS) Matematik di sekolah akan dijadikan satu program dan data maklumat yang mampu meramal status kesediaan sekolah sebelum menghadapi peperiksaan awam di peringkat UPSR, PMR dan SPM. Dengan ini pihak sekolah akan lebih peka dan menjadikan data ini sebagai alat ukur tahap kecemerlangan Matematik di sekolah dan sebagai penanda aras kejayaan murid, guru dan sekolah dalam persiapan menghadapi peperiksan awam. Melalui dapatan awal ini, pihak sekolah akan dapat membetul dan menggerakkan jentera di sekolah melalui Panitia Matematik dan guru-guru yang terlibat dengan kelas peperiksaan awam agar dapat melakukan penambahbaikan mekanisme pengajaran dan pembelajaran di kelas sebagai langkah pengesanan awal dan merancang pecutan terakhir sebelum menjelangnya peperiksaan awam. Modul ATS (Matematik) ini sebenarnya adalah sokongan kepada Modul WAJA 2009 yang memberi penekanan kepada pemahaman konsep P&P murid dalam bilik darjah. Sebelum itu, pihak Sektor Pengurusan Akademik, JPN Perak juga telah melancarkan Modul WAJA (Versi 2008) yang lebih mirip kepada latih tubi Matematik untuk pelbagai peringkat kelas peperiksaan awam. Melalui rentetan modul latih tubi yang telah digubal di samping pelbagai program peningkatan profesionalisme guru yang telah dan akan dilaksanakan sama ada di peringkat JPN, PPD dan sekolah sekiranya dihayati dan dibuat perancangan yang lebih bersistematik dan bahan-bahan tersebut dimanfaatkan semaksimum mungkin di peringkat perancangan panitia, maka sewajarnya dan diharapkan semua sekolah boleh melahirkan warga yang cemerlang, gemilang dan terbilang. Semua komuniti di peringkat JPN, PPD dan sekolah serta ibu bapa mampu mewujudkan situasi dan senario ini sekiranya kita semua mengambil semangat dan motivasi daripada gagasan YAB Perdana Menteri ke arah memastikan keperluan pelanggan dan kecemerlangan iaitu murid didahulukan dan pencapaian diutamakan. Bidang Matematik Sektor Pengurusan Akademik Jabatan Pelajaran Perak Jun 2009
ii
JAWATANKUASA PEMBINAAN
MODUL LATIH TUBI ANSWER TO SCORE (ATS) 2009 (MATA PELAJARAN MATEMATIK TAMBAHAN)
PENASIHAT Tn. Hj. Rozi Bin Puteh Ismail
Ketua Sektor Pengurusan Akademik Jabatan Pelajaran Perak
PENGERUSI
Tn. Hj. Syed Mahizan Bin Syed Hashim Ketua Penolong Pengarah (Matematik)
Sektor Pengurusan Akademik Jabatan Pelajaran Perak
PENYELARAS MODUL En. Nor Hisham Bin Fahmi
Penolong Pengarah Matematik (Kurikulum Rendah) Sektor Pengurusan Akademik
Jabatan Pelajaran Perak
PENOLONG PENYELARAS MODUL Pn. Rohaya Bt. Meor Ahmad
Penyelia Matematik (Sekolah Rendah)
KETUA PENGGUBAL MATA PELAJARAN En. Krishian a/l Gopal
PARA PENGGUBAL ITEM
En. Chin Woon Woo En. Tan Teong Ghee
Pn. Zulinah Bt. Jemon Pn. Noor Laila Bt. Abdullah
Pn. Zuraini Bt. Din En. Tan Kok Cheang
En. Mohd Shafie Bin Mohd Juri En. Jamil Bin Hussain
En. Mohd Azril Bin Mohd Azlan Cik Lau Sook Hun
PARA PENYEMAK ITEM
En. Kho Choong Quan En. Noor Azam Bin Mohd Said
Pn. Lisa Bt. Abu Bakar Pn. Zulinah Bt. Jemon
iii
PANDUAN PENGGUNAAN MODUL
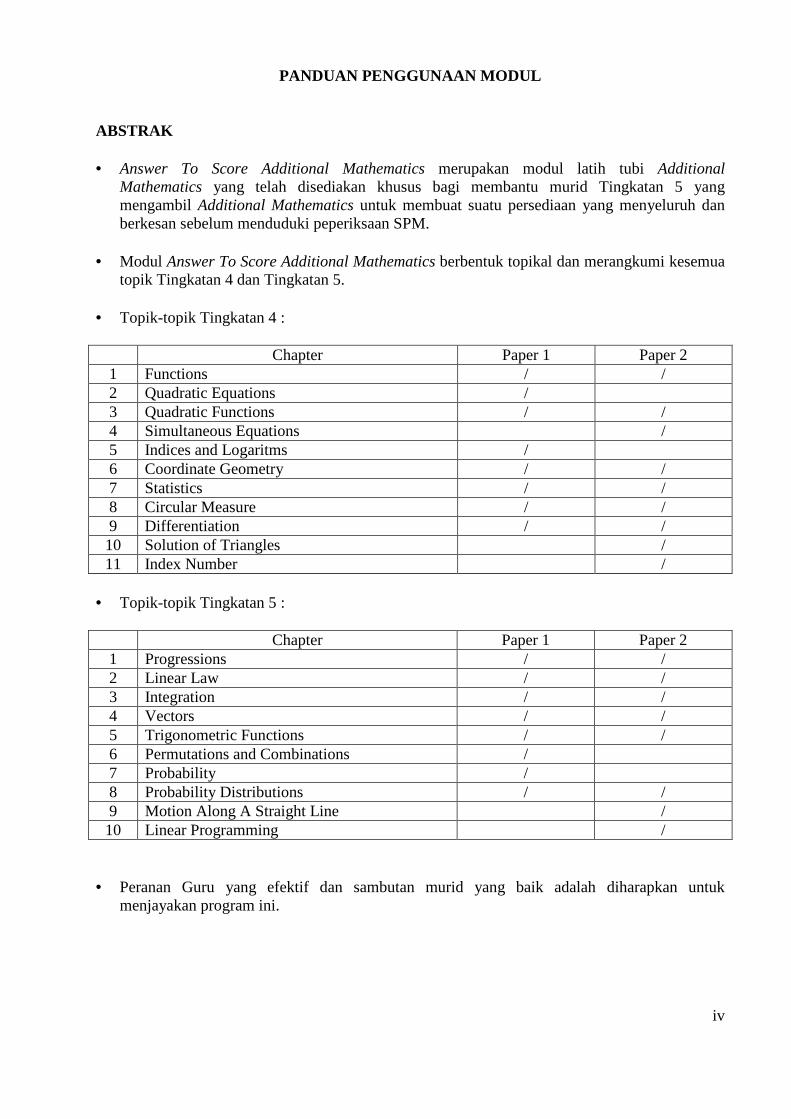
ABSTRAK • Answer To Score Additional Mathematics merupakan modul latih tubi Additional
Mathematics yang telah disediakan khusus bagi membantu murid Tingkatan 5 yang mengambil Additional Mathematics untuk membuat suatu persediaan yang menyeluruh dan berkesan sebelum menduduki peperiksaan SPM.
• Modul Answer To Score Additional Mathematics berbentuk topikal dan merangkumi kesemua
topik Tingkatan 4 dan Tingkatan 5. • Topik-topik Tingkatan 4 :
Chapter Paper 1 Paper 2 1 Functions / / 2 Quadratic Equations / 3 Quadratic Functions / / 4 Simultaneous Equations / 5 Indices and Logaritms / 6 Coordinate Geometry / / 7 Statistics / / 8 Circular Measure / / 9 Differentiation / / 10 Solution of Triangles / 11 Index Number /
• Topik-topik Tingkatan 5 :
Chapter Paper 1 Paper 2 1 Progressions / / 2 Linear Law / / 3 Integration / / 4 Vectors / / 5 Trigonometric Functions / / 6 Permutations and Combinations / 7 Probability / 8 Probability Distributions / / 9 Motion Along A Straight Line / 10 Linear Programming /
• Peranan Guru yang efektif dan sambutan murid yang baik adalah diharapkan untuk menjayakan program ini.
iv
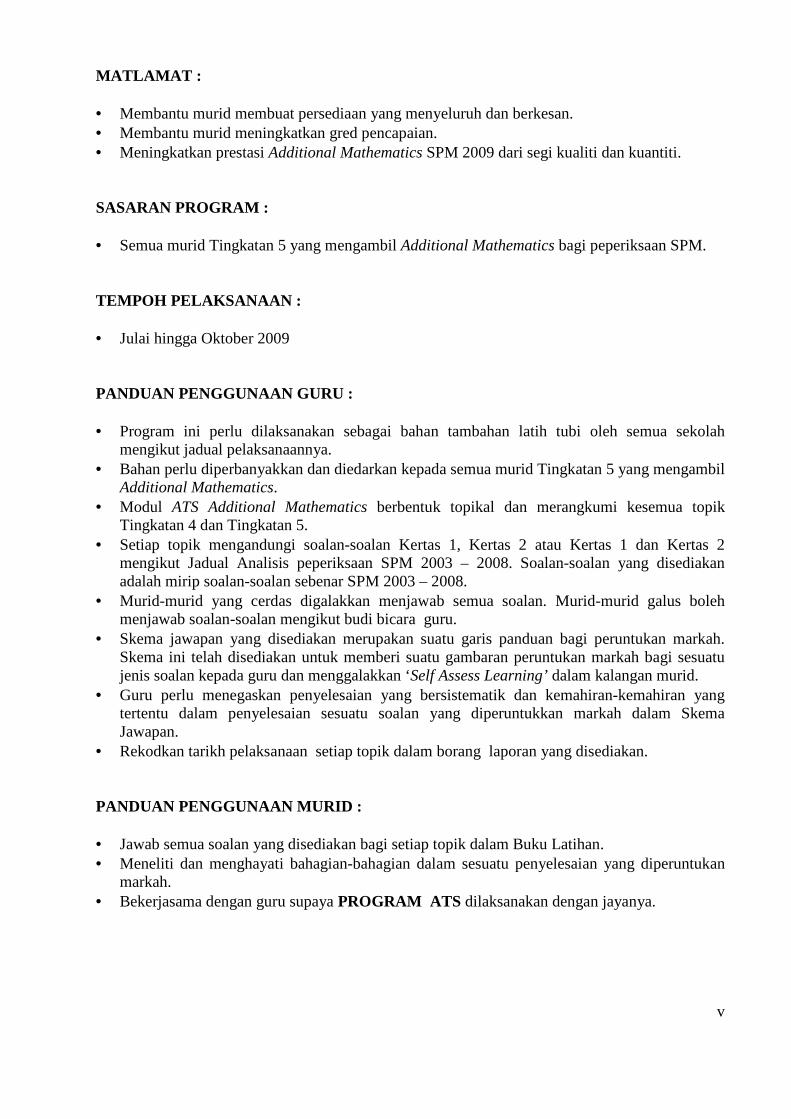
MATLAMAT : • Membantu murid membuat persediaan yang menyeluruh dan berkesan. • Membantu murid meningkatkan gred pencapaian. • Meningkatkan prestasi Additional Mathematics SPM 2009 dari segi kualiti dan kuantiti. SASARAN PROGRAM : • Semua murid Tingkatan 5 yang mengambil Additional Mathematics bagi peperiksaan SPM. TEMPOH PELAKSANAAN : • Julai hingga Oktober 2009 PANDUAN PENGGUNAAN GURU : • Program ini perlu dilaksanakan sebagai bahan tambahan latih tubi oleh semua sekolah
mengikut jadual pelaksanaannya. • Bahan perlu diperbanyakkan dan diedarkan kepada semua murid Tingkatan 5 yang mengambil
Additional Mathematics. • Modul ATS Additional Mathematics berbentuk topikal dan merangkumi kesemua topik
Tingkatan 4 dan Tingkatan 5. • Setiap topik mengandungi soalan-soalan Kertas 1, Kertas 2 atau Kertas 1 dan Kertas 2
mengikut Jadual Analisis peperiksaan SPM 2003 – 2008. Soalan-soalan yang disediakan adalah mirip soalan-soalan sebenar SPM 2003 – 2008.
• Murid-murid yang cerdas digalakkan menjawab semua soalan. Murid-murid galus boleh menjawab soalan-soalan mengikut budi bicara guru.
• Skema jawapan yang disediakan merupakan suatu garis panduan bagi peruntukan markah. Skema ini telah disediakan untuk memberi suatu gambaran peruntukan markah bagi sesuatu jenis soalan kepada guru dan menggalakkan ‘Self Assess Learning’ dalam kalangan murid.
• Guru perlu menegaskan penyelesaian yang bersistematik dan kemahiran-kemahiran yang tertentu dalam penyelesaian sesuatu soalan yang diperuntukkan markah dalam Skema Jawapan.
• Rekodkan tarikh pelaksanaan setiap topik dalam borang laporan yang disediakan. PANDUAN PENGGUNAAN MURID : • Jawab semua soalan yang disediakan bagi setiap topik dalam Buku Latihan. • Meneliti dan menghayati bahagian-bahagian dalam sesuatu penyelesaian yang diperuntukan
markah. • Bekerjasama dengan guru supaya PROGRAM ATS dilaksanakan dengan jayanya.
v
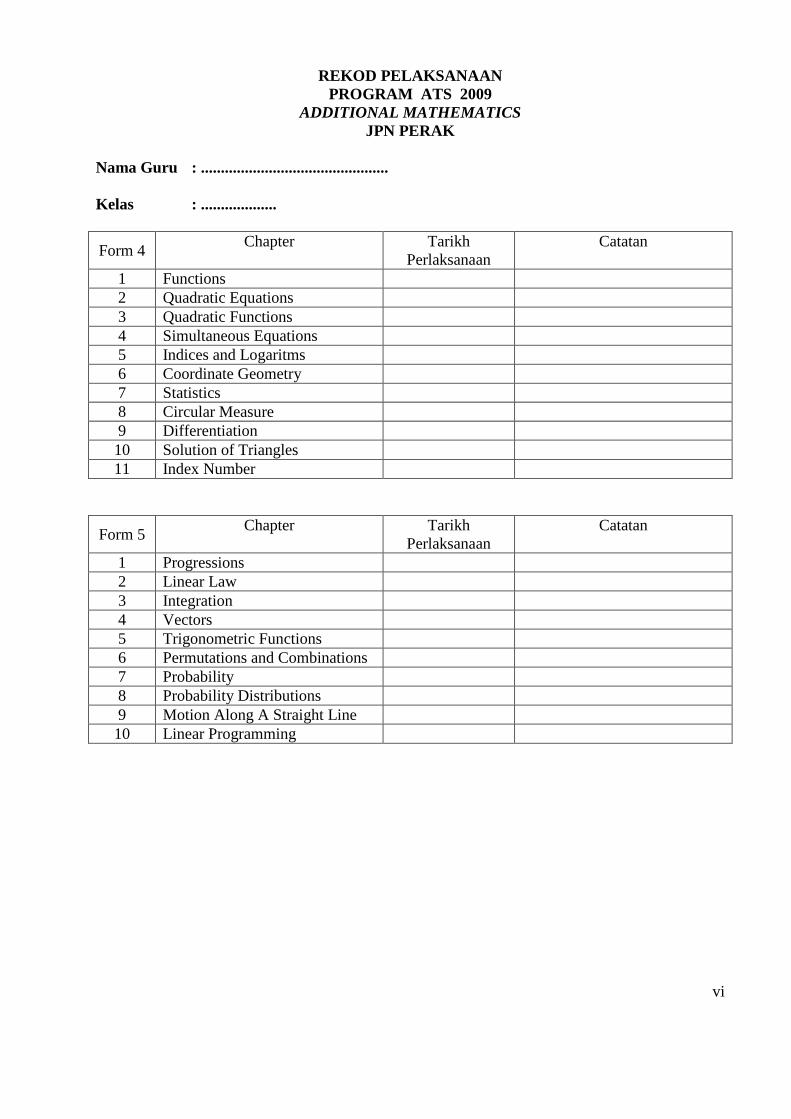
REKOD PELAKSANAAN PROGRAM ATS 2009
ADDITIONAL MATHEMATICS JPN PERAK
Nama Guru : ............................................... Kelas : ...................
Form 4 Chapter Tarikh
Perlaksanaan Catatan
1 Functions 2 Quadratic Equations 3 Quadratic Functions 4 Simultaneous Equations 5 Indices and Logaritms 6 Coordinate Geometry 7 Statistics 8 Circular Measure 9 Differentiation 10 Solution of Triangles 11 Index Number
Form 5 Chapter Tarikh
Perlaksanaan Catatan
1 Progressions 2 Linear Law 3 Integration 4 Vectors 5 Trigonometric Functions 6 Permutations and Combinations 7 Probability 8 Probability Distributions 9 Motion Along A Straight Line 10 Linear Programming
vi

JABATAN PELAJARAN PERAK
ANSWER TO SCORE ADDITIONAL MATHEMATICS SPM
(SECONDARY SCHOOL)
TOPICAL EXERCISES & ANSWERS (FORM 4)
CHAPTER 1 FUNCTIONS FORM 4
1
Diagram 1 Set BSet A
p
q
r 86
4
2
g(x)x
0246
-2
k0
4
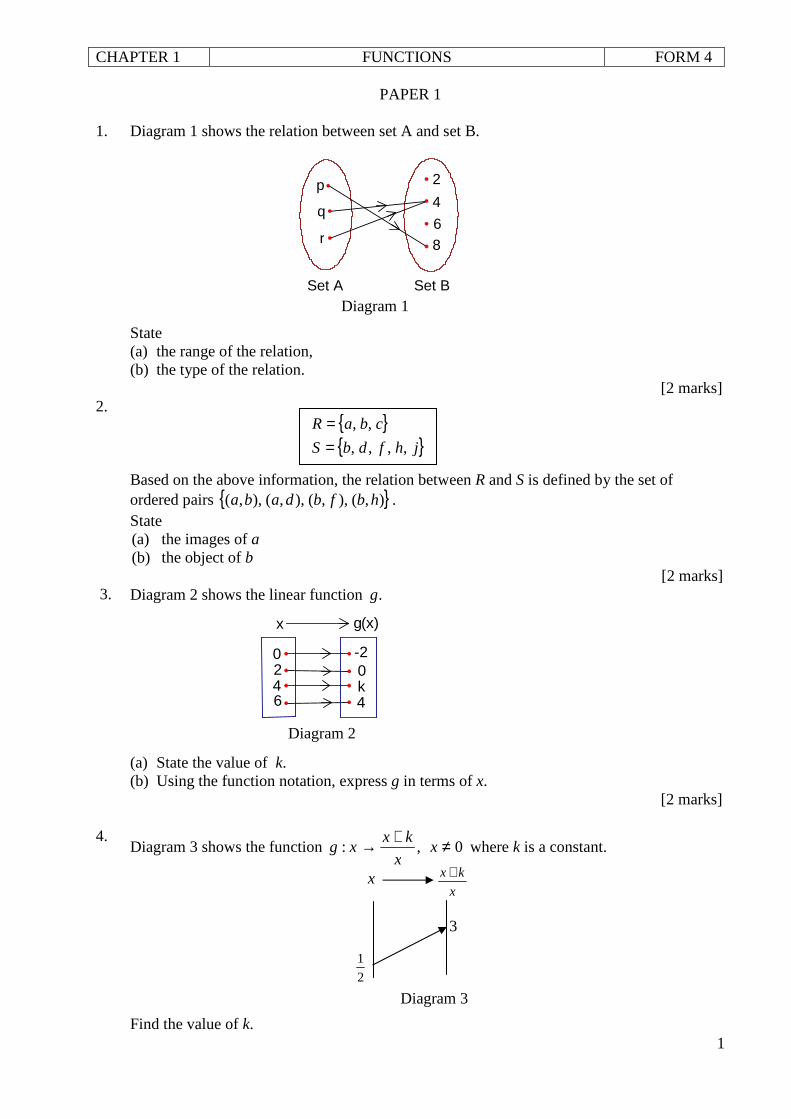
PAPER 1 1. Diagram 1 shows the relation between set A and set B.
State (a) the range of the relation, (b) the type of the relation. [2 marks]
2. Based on the above information, the relation between R and S is defined by the set of ordered pairs { }),(),,(),,(),,( hbfbdaba . State (a) the images of a (b) the object of b
[2 marks] 3. Diagram 2 shows the linear function .g
(a) State the value of k. (b) Using the function notation, express g in terms of x. [2 marks]
4. Diagram 3 shows the function 0,: ≠+→ x
x
kxxg where k is a constant.
Find the value of k.
2
1
3
x
kx + x
Diagram 2
Diagram 3
{ }{ }jhfdbS
cbaR
,,,,
,,
==
CHAPTER 1 FUNCTIONS FORM 4
2
[2 marks] 5. Given the function 1: +→ xxg , find the value of x such that 2)( =xg .
[2 marks]
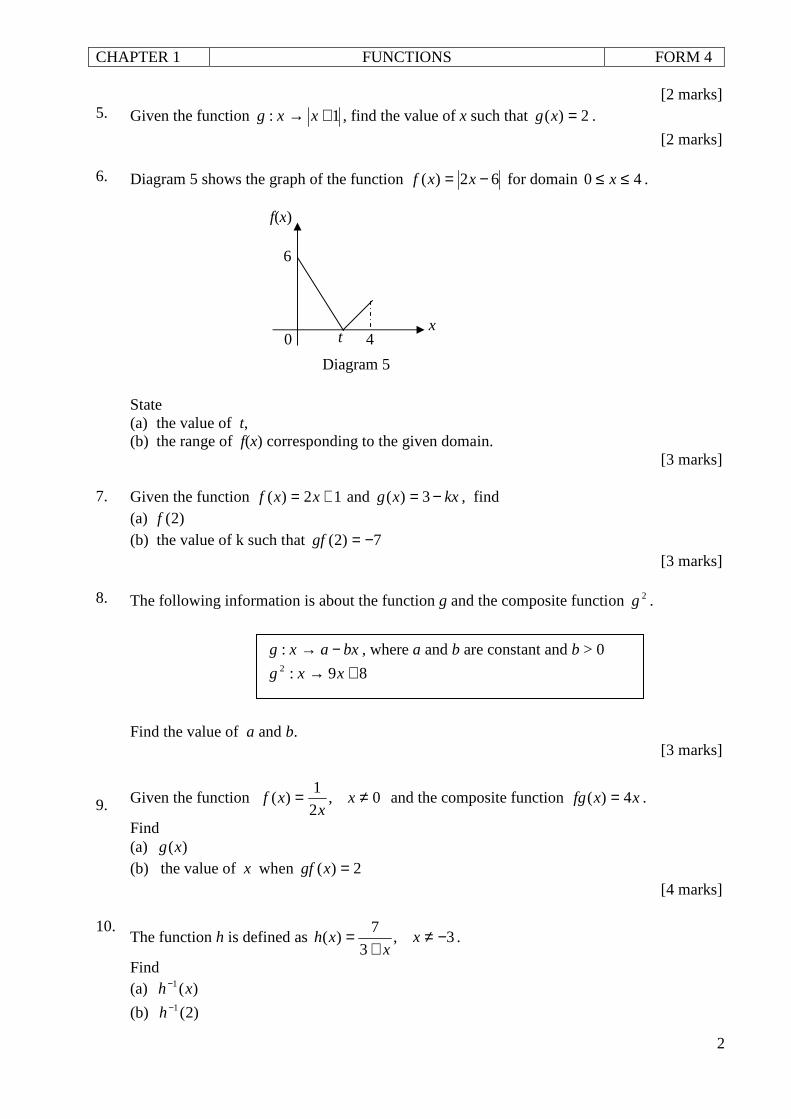
6. Diagram 5 shows the graph of the function 62)( −= xxf for domain 40 ≤≤ x .
State (a) the value of t, (b) the range of f(x) corresponding to the given domain. [3 marks]
7. Given the function 12)( += xxf and kxxg −= 3)( , find (a) )2(f (b) the value of k such that 7)2( −=gf [3 marks]
8. The following information is about the function g and the composite function 2g . Find the value of a and b. [3 marks]
9. Given the function 0,
2
1)( ≠= x
xxf and the composite function xxfg 4)( = .
Find (a) )(xg (b) the value of x when 2)( =xgf [4 marks]
10. The function h is defined as 3,
3
7)( −≠
+= x
xxh .
Find (a) )(1 xh−
(b) )2(1−h
x 4 t 0
6
f(x)
Diagram 5
bxaxg −→: , where a and b are constant and b > 0
89:2 +→ xxg
CHAPTER 1 FUNCTIONS FORM 4
3
[3 marks]
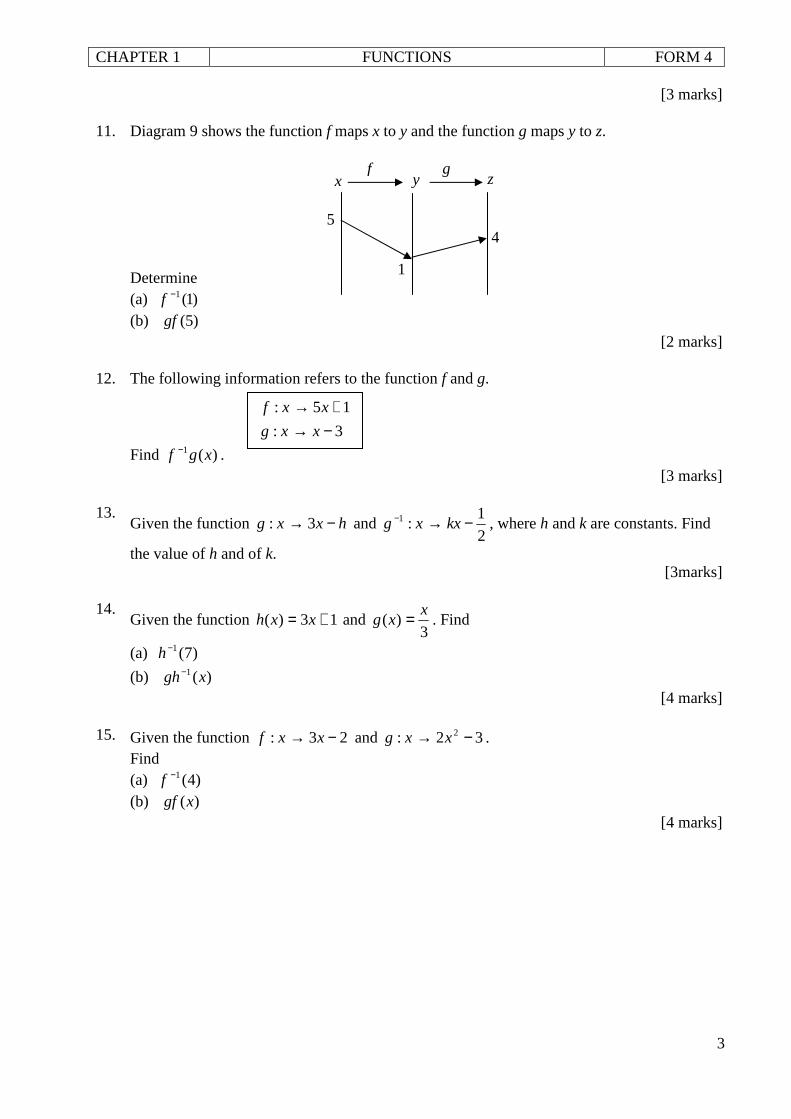
11. Diagram 9 shows the function f maps x to y and the function g maps y to z. Determine (a) )1(1−f (b) )5(gf [2 marks]
12. The following information refers to the function f and g. Find )(1 xgf − . [3 marks]
13. Given the function hxxg −→ 3: and
2
1:1 −→− kxxg , where h and k are constants. Find
the value of h and of k. [3marks]
14. Given the function 13)( += xxh and
3)(
xxg = . Find
(a) )7(1−h
(b) )(1 xgh− [4 marks]
15. Given the function 23: −→ xxf and 32: 2 −→ xxg . Find (a) )4(1−f (b) )(xgf [4 marks]
g f z y x
4
1
5
3:
15:
−→+→
xxg
xxf
CHAPTER 1 FUNCTIONS FORM 4
4
ANSWER (PAPER 1)
1 (a) { }8,4 1
(b) many-to-one 1
2 (a) b , d 1
(b) a 1
3 (a) 2=k 1
(b) 2)( −= xxg 1
4
3
2
12
1
2
1 =+
=
k
g
1
1=k 1
5 21 =+x or 2)1( =+− x 1
1=x 3−=x 1
6 (a) When 0)( =xf , 062 =−x 1
3=x
3=∴ t 1
(b) Range : 6)(0 ≤≤ xf 1
7 (a) (a) 5)2( =f 1
(b) (b) 7)5( −=g
7)5(3 −=− k 1
2=k 1
8 )()(2 bxabaxg −−= 1
xbaba 2+−=
92 =b and 8=− aba 1
3=b 4−=a 1
9 (a) x
xg4
)(2
1 = 1
0,
8
1)( ≠= x
xxg
1
CHAPTER 1 FUNCTIONS FORM 4
5
(b) 2
2
18
1 =
x
1
8
1=x 1
10 (a) 3
7 −=y
x 1
3
7)(1 −=−
xxh , 0≠x
1
(b)
2
1)2(1 =−h
1
11 (a) 5 1
(b) 4 1
12
5
1−= yx
1
5
1)3()(1 −−=− x
xgf 1
5
4−= x
1
13.
3
hyx
+= 1
3
1=k 1
2
3−=h 1
14. (a) 3
1−= yx
1
23
17)7(1 =−=−h
1
(b)
33
1
)(1
−
=−
x
xgh
1
9
1−= x
1
15 (a)
3
2+= yx
1
2)4(1 =−f 1
(b) 3)23(2)( 2 −−= xxgf 1
52418 2 +−= xx
1
CHAPTER 10 SOLUTION OF TRIANGLES FORM 4
58
65
10cm12cm
Q
R
P
PAPER 2 1.
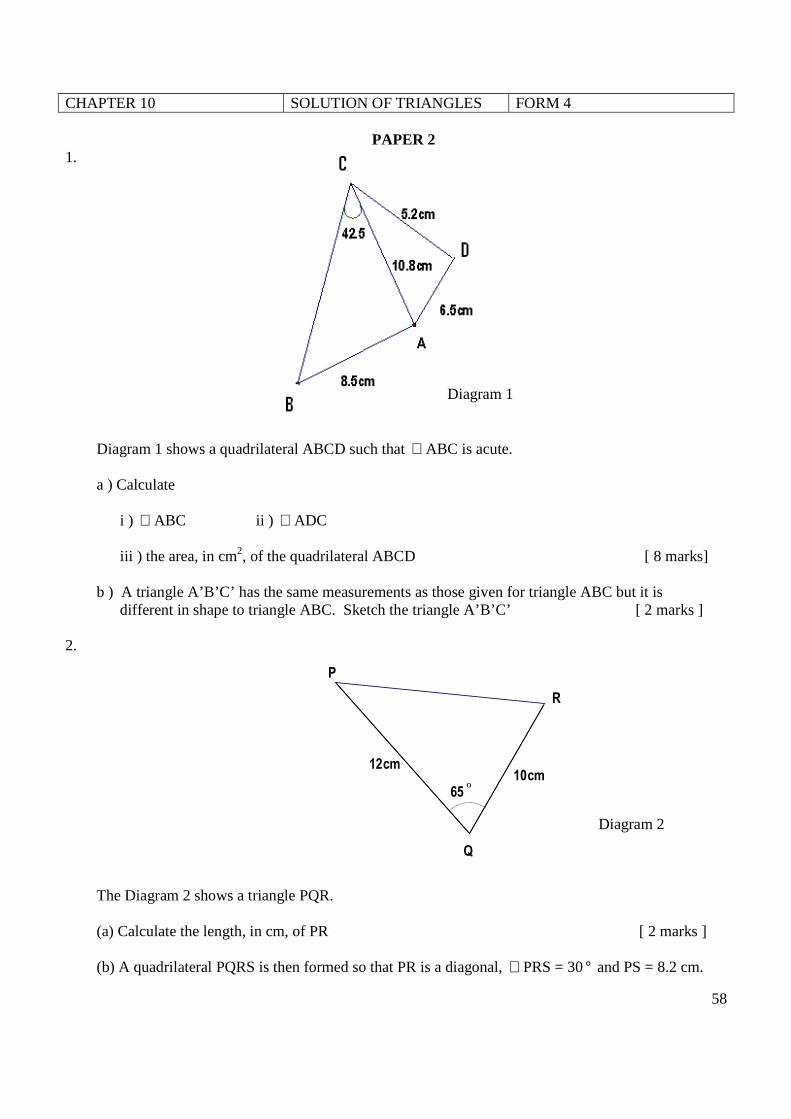
Diagram 1 shows a quadrilateral ABCD such that ∠ ABC is acute. a ) Calculate i ) ∠ ABC ii ) ∠ ADC iii ) the area, in cm2, of the quadrilateral ABCD [ 8 marks] b ) A triangle A’B’C’ has the same measurements as those given for triangle ABC but it is different in shape to triangle ABC. Sketch the triangle A’B’C’ [ 2 marks ]
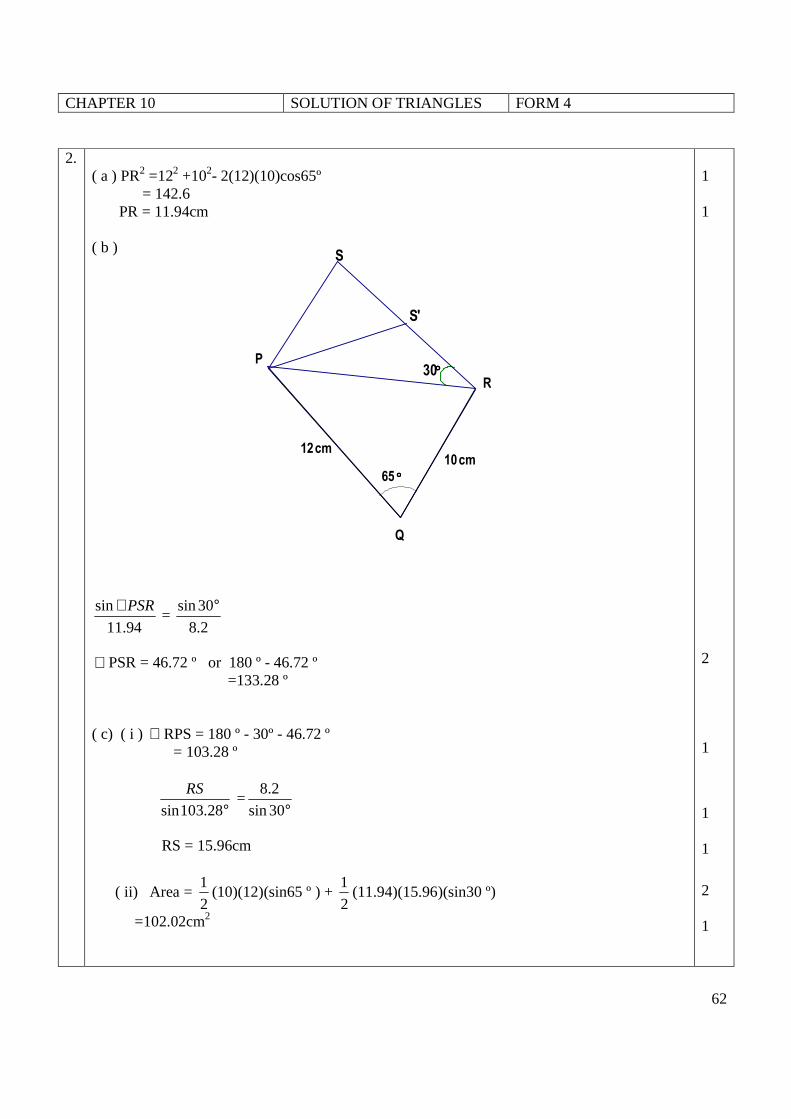
2. º Diagram 2 The Diagram 2 shows a triangle PQR. (a) Calculate the length, in cm, of PR [ 2 marks ] (b) A quadrilateral PQRS is then formed so that PR is a diagonal, ∠ PRS = 30° and PS = 8.2 cm.
Diagram 1
CHAPTER 10 SOLUTION OF TRIANGLES FORM 4
59
Calculate the two possible values of ∠ PSR. [2 marks ] (c) Using the acute ∠ PSR from ( b ) , calculate [ 6 marks] i ) the length, in cm, of RS
ii ) the area, in cm2, of quadrilateral PQRS.
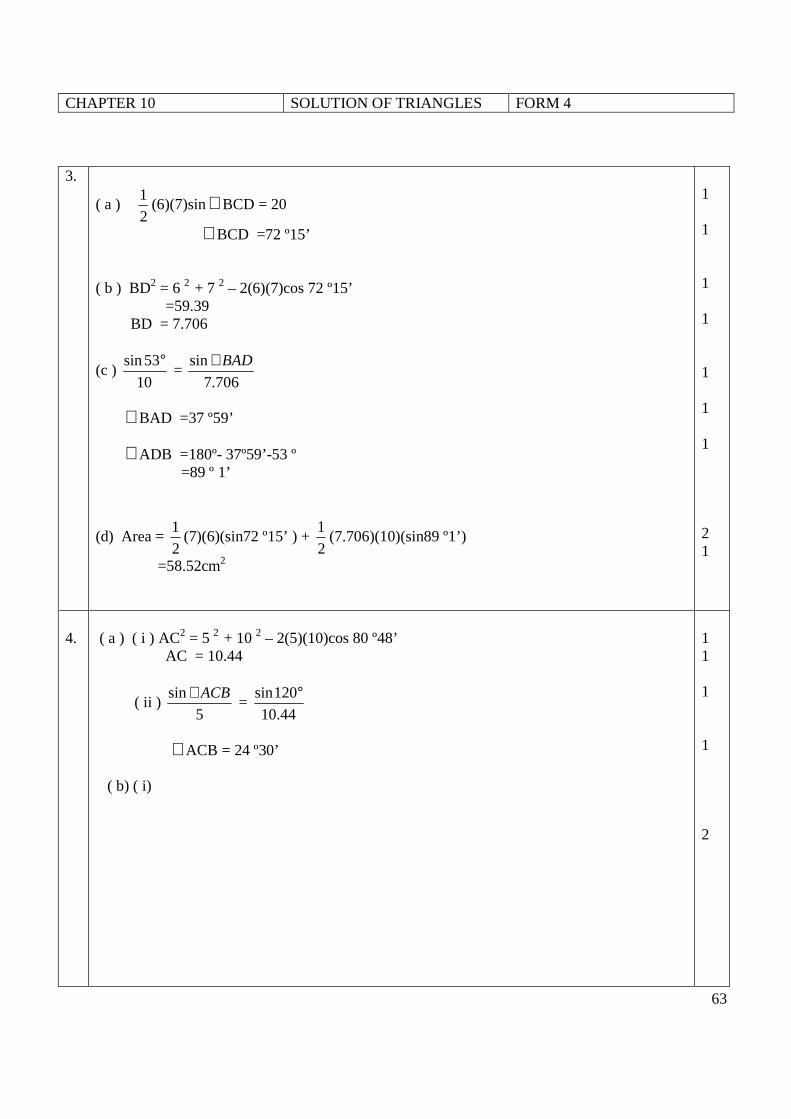
3.
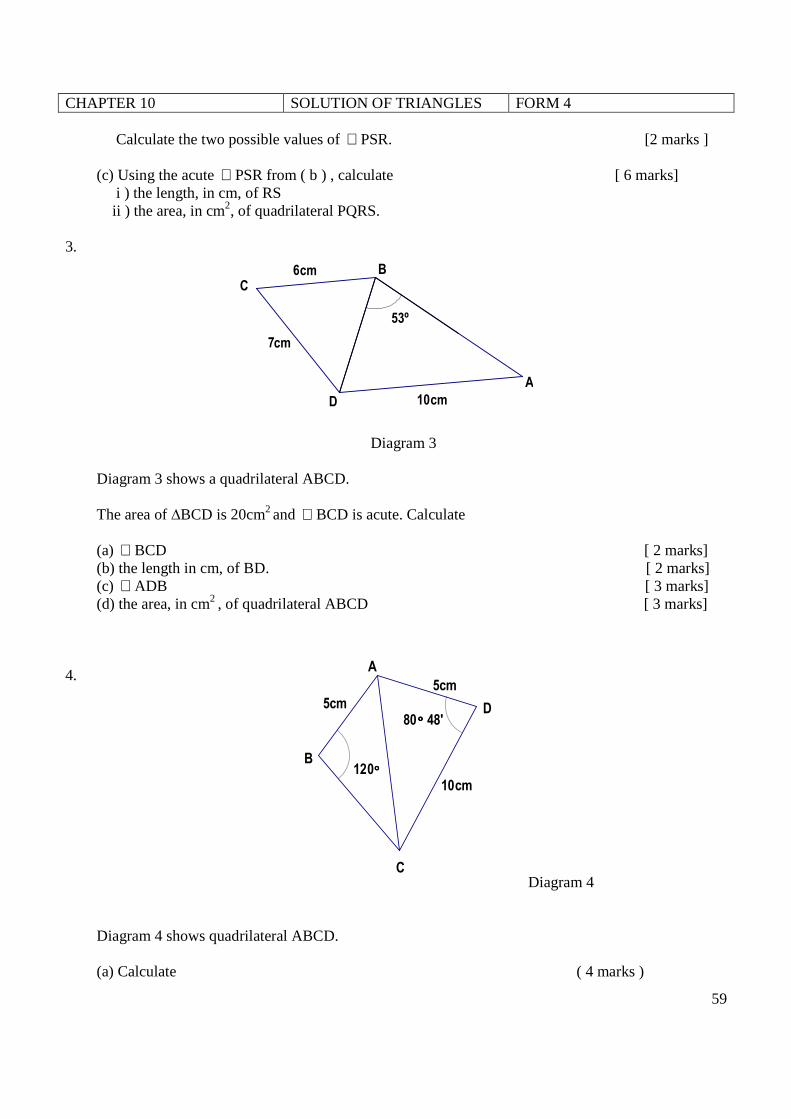
Diagram 3 Diagram 3 shows a quadrilateral ABCD. The area of ∆BCD is 20cm2 and ∠ BCD is acute. Calculate (a) ∠ BCD [ 2 marks] (b) the length in cm, of BD. [ 2 marks] (c) ∠ ADB [ 3 marks] (d) the area, in cm2 , of quadrilateral ABCD [ 3 marks]
4.
80°°°° 48'
120°°°°10cm
5cm
5cm D
C
B
A
Diagram 4 Diagram 4 shows quadrilateral ABCD. (a) Calculate ( 4 marks )
53º
10cm
7 cm
6 cm
D
A
B C
CHAPTER 10 SOLUTION OF TRIANGLES FORM 4
60
R P
Q
S
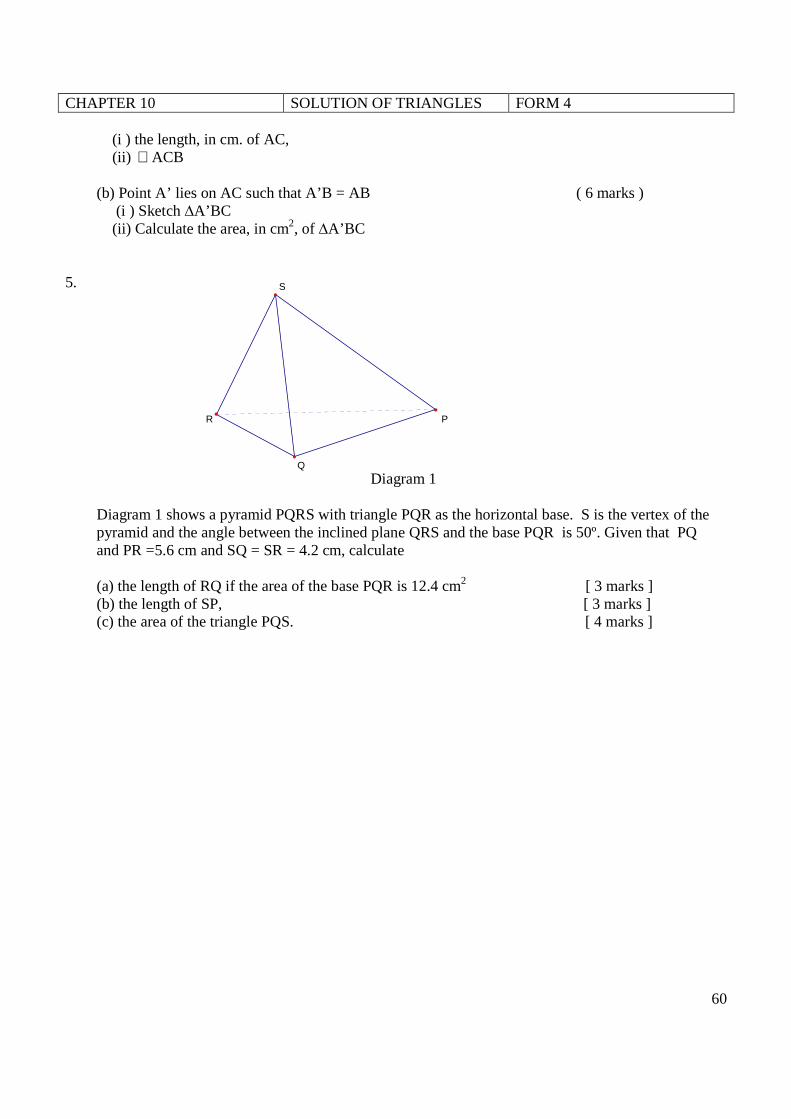
(i ) the length, in cm. of AC, (ii) ∠ ACB
(b) Point A’ lies on AC such that A’B = AB ( 6 marks ) (i ) Sketch ∆A’BC (ii) Calculate the area, in cm2, of ∆A’BC
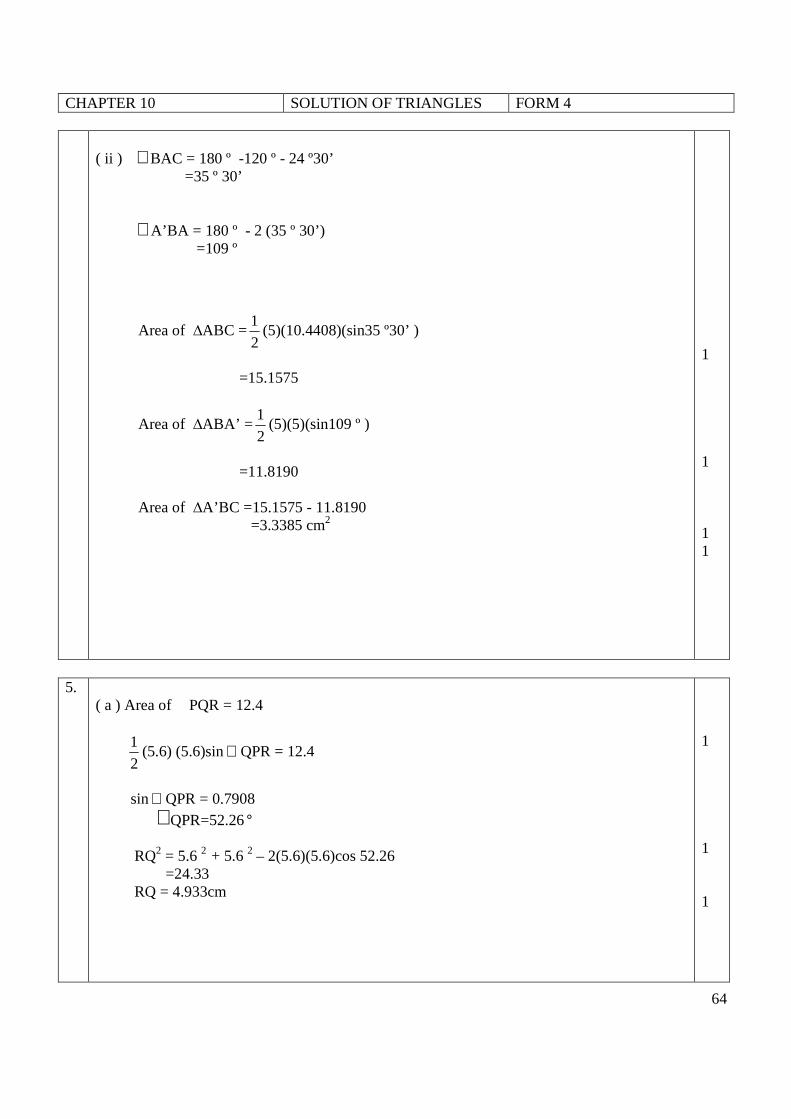
5.
Diagram 1 Diagram 1 shows a pyramid PQRS with triangle PQR as the horizontal base. S is the vertex of the pyramid and the angle between the inclined plane QRS and the base PQR is 50º. Given that PQ and PR =5.6 cm and SQ = SR = 4.2 cm, calculate (a) the length of RQ if the area of the base PQR is 12.4 cm2 [ 3 marks ] (b) the length of SP, [ 3 marks ] (c) the area of the triangle PQS. [ 4 marks ]
CHAPTER 10 SOLUTION OF TRIANGLES FORM 4
61
ANSWER(PAPER2)
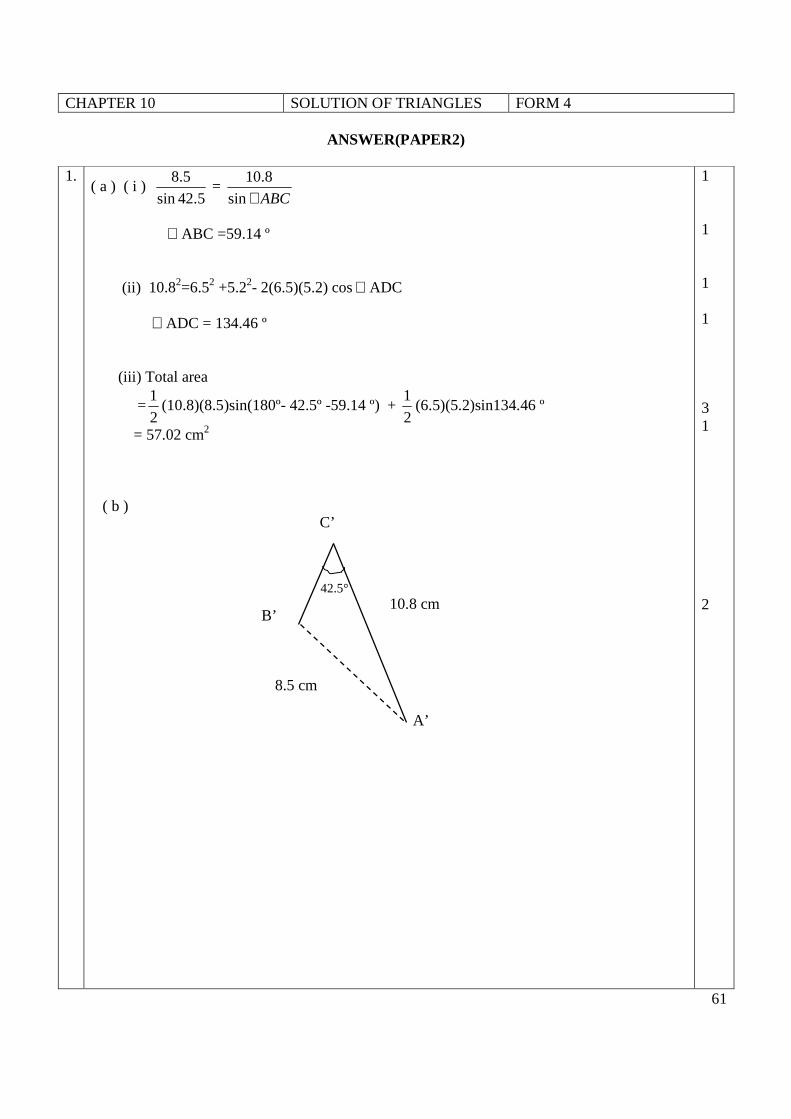
1. ( a ) ( i )
8.5
sin 42.5 =
10.8
sin ABC∠
∠ ABC =59.14 º (ii) 10.82=6.52 +5.22- 2(6.5)(5.2) cos∠ ADC ∠ ADC = 134.46 º (iii) Total area
=1
2(10.8)(8.5)sin(180º- 42.5º -59.14 º) +
1
2(6.5)(5.2)sin134.46 º
= 57.02 cm2 ( b )
1 1 1 1 3 1 2
42.5°
C’
A’
B’ 10.8 cm
8.5 cm
CHAPTER 10 SOLUTION OF TRIANGLES FORM 4
62
2.
( a ) PR2 =122 +102- 2(12)(10)cos65º = 142.6 PR = 11.94cm ( b ) sin
11.94
PSR∠ =
sin30
8.2
°
∠ PSR = 46.72 º or 180 º - 46.72 º =133.28 º ( c) ( i ) ∠ RPS = 180 º - 30º - 46.72 º = 103.28 º
sin103.28
RS
° =
8.2
sin 30°
RS = 15.96cm
( ii) Area = 1
2(10)(12)(sin65 º ) +
1
2(11.94)(15.96)(sin30 º)
=102.02cm2
1 1 2 1
1 1
2 1
30 °°°°
S '
S
65 °°°° 10 cm
12cm
Q
R
P
CHAPTER 10 SOLUTION OF TRIANGLES FORM 4
63
3.
( a ) 1
2(6)(7)sin∠BCD = 20
∠BCD =72 º15’ ( b ) BD2 = 6 2 + 7 2 – 2(6)(7)cos 72 º15’ =59.39 BD = 7.706
(c ) sin53
10
° =
706.7
sin BAD∠
∠BAD =37 º59’ ∠ADB =180º- 37º59’-53 º =89 º 1’
(d) Area = 1
2(7)(6)(sin72 º15’ ) +
1
2(7.706)(10)(sin89 º1’)
=58.52cm2
1 1 1 1 1 1 1 2 1
4.
( a ) ( i ) AC2 = 5 2 + 10 2 – 2(5)(10)cos 80 º48’ AC = 10.44
( ii ) sin
5
ACB∠ =
sin120
10.44
°
∠ACB = 24 º30’ ( b) ( i)
1 1 1 1 2
CHAPTER 10 SOLUTION OF TRIANGLES FORM 4
64
5.
( a ) Area of �PQR = 12.4
1
2(5.6) (5.6)sin∠ QPR = 12.4
sin∠ QPR = 0.7908 ∠QPR=52.26° RQ2 = 5.6 2 + 5.6 2 – 2(5.6)(5.6)cos 52.26 =24.33 RQ = 4.933cm
1 1 1
( ii ) ∠BAC = 180 º -120 º - 24 º30’ =35 º 30’ ∠A’BA = 180 º - 2 (35 º 30’) =109 º
Area of ∆ABC =1
2(5)(10.4408)(sin35 º30’ )
=15.1575
Area of ∆ABA’ =1
2(5)(5)(sin109 º )
=11.8190 Area of ∆A’BC =15.1575 - 11.8190 =3.3385 cm2
1 1 1 1
CHAPTER 10 SOLUTION OF TRIANGLES FORM 4
65
(b) QM =1
2 QR where M is the midpoint of RQ
= 1
2(4.933)
= 2.466 SM2 = 4.22- 2.4662 =11.56 SM =3.4 cm PM2 = 5.62- 2.4662 PM = 5.028 SP2 = 3.42 + 5.0282 – 2(3.4)( 5.028) cos 50º SP =3.855 cm
(c) cos ∠SQP =2 2 25.6 4.2 3.855
2(5.6)(4.2)
+ −
=0.7257 ∠SQP = 43.47 º Area of �PQS
=1
2(5.6) (4.2)sin 43.47 º
=8.091 cm2
1 1 1 1 1 1 1
CHAPTER 11 INDEX NUMBER FORM 4
66
N
ML
K
80°
100°120°
PAPER 2
1 Table 1 shows the price indices and percentage of usage of four items, P, Q, R and S, which are the main ingredients in the making of a type of cake.
Items Price index for the year 2007 based
on the year 2004 Percentage of usage
P 125 40 Q x 20 R 110 10 S 130 30
Table 1
(a) Calculate (i) the price of S in the year 2004 if its price in year 2007 is RM 44.85, (ii) the price index of P in the year 2007 based on the year 2000 if its price index in the
year 2004 based on the year 2000 is 120. [5 marks] (b) The composite index number of the cost in making the cake for the year 2007 based on the
year 2004 is 125. Calculate
(i) the value of x, (ii) the price of the cake in the year 2004 if the corresponding price in the year 2007 is
RM 40. [5 marks]
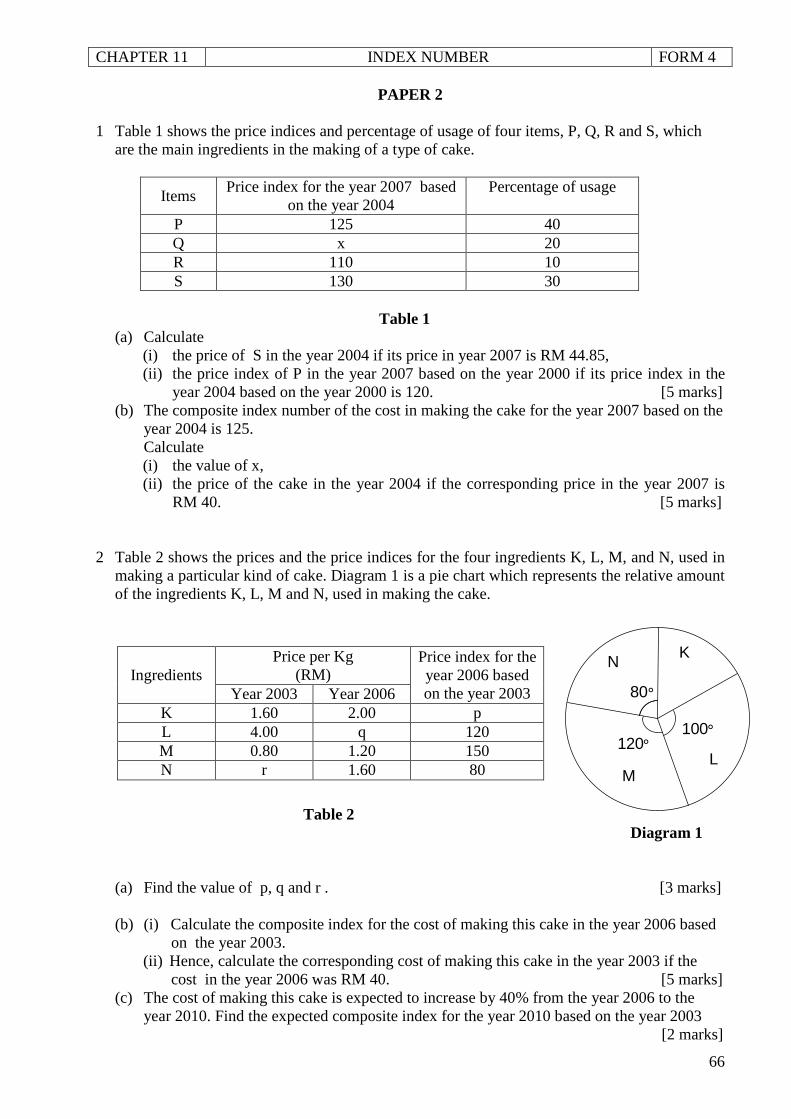
2 Table 2 shows the prices and the price indices for the four ingredients K, L, M, and N, used in making a particular kind of cake. Diagram 1 is a pie chart which represents the relative amount of the ingredients K, L, M and N, used in making the cake.
Table 2 Diagram 1
(a) Find the value of p, q and r . [3 marks] (b) (i) Calculate the composite index for the cost of making this cake in the year 2006 based
on the year 2003. (ii) Hence, calculate the corresponding cost of making this cake in the year 2003 if the
cost in the year 2006 was RM 40. [5 marks] (c) The cost of making this cake is expected to increase by 40% from the year 2006 to the
year 2010. Find the expected composite index for the year 2010 based on the year 2003 [2 marks]
Ingredients Price per Kg
(RM) Price index for the year 2006 based on the year 2003 Year 2003 Year 2006
K 1.60 2.00 p L 4.00 q 120 M 0.80 1.20 150 N r 1.60 80
CHAPTER 11 INDEX NUMBER FORM 4
67
T
S36°
Q
P
R
90°72°
144°
3 A particular type of muffin is made by using four ingredients, P, Q, R and S. Table 3 shows the prices of the ingredients.
Ingredients Price per kilogram (RM)
Year 2005 Year 2008 P 4.00 x Q 2.50 3.00 R y z S 2.00 2.20
Table 3
(a) The index number of ingredient P in the year 2008 based on the year 2005 is 125. Calculate the value of x. [2 marks]
(b) The index number of ingredient R in the year 2008 based on the year 2005 is 140. The price per kilogram of ingredient R in the year 2008 is RM2.00 more than its corresponding price in the year 2005. Calculate the value of y and z. [3 marks]
(c) The composite index for the cost of making the muffin in the year 2008 based on the year 2005 is 126 Calculate
(i) the price of the muffin in the year 2005 if its corresponding price in the year 2008 is RM 6.30
(ii) the value of r if the quantities of ingredients P, Q, R and S used are in the ratio of 6 : 3 : r : 2 [5 marks]
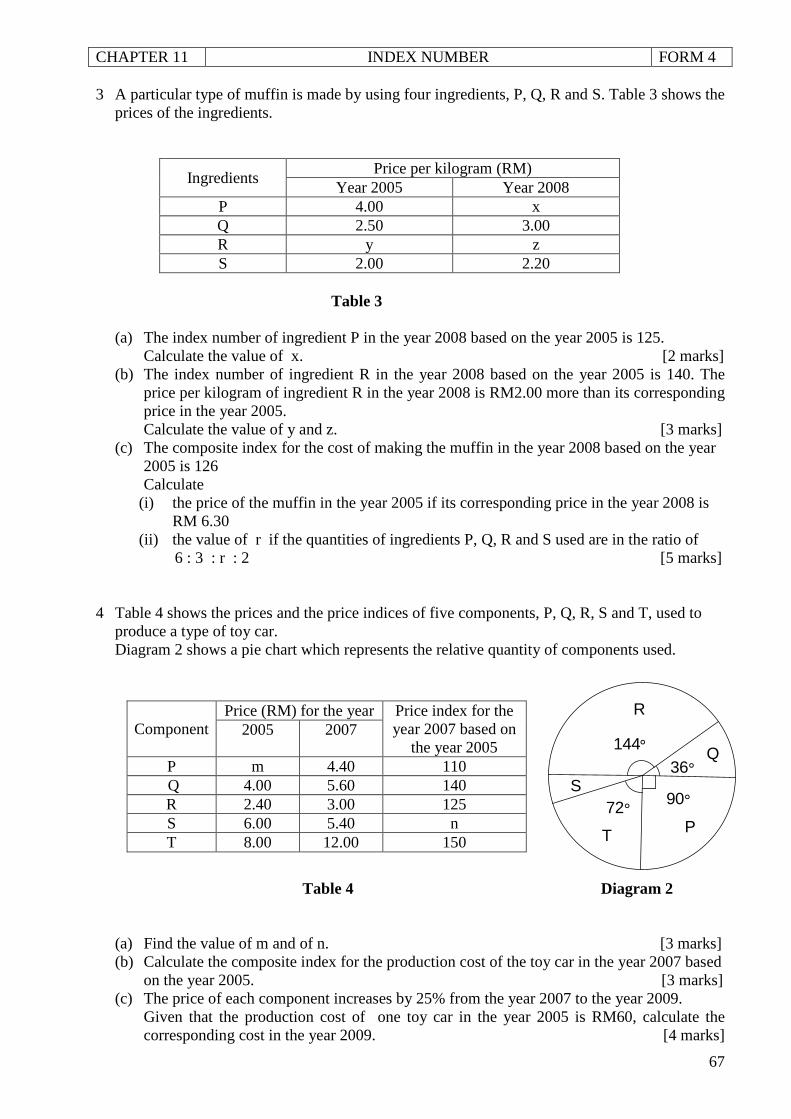
4 Table 4 shows the prices and the price indices of five components, P, Q, R, S and T, used to produce a type of toy car. Diagram 2 shows a pie chart which represents the relative quantity of components used.
Table 4 Diagram 2 (a) Find the value of m and of n. [3 marks] (b) Calculate the composite index for the production cost of the toy car in the year 2007 based
on the year 2005. [3 marks] (c) The price of each component increases by 25% from the year 2007 to the year 2009.
Given that the production cost of one toy car in the year 2005 is RM60, calculate the corresponding cost in the year 2009. [4 marks]
Component Price (RM) for the year Price index for the
year 2007 based on the year 2005
2005 2007
P m 4.40 110 Q 4.00 5.60 140 R 2.40 3.00 125 S 6.00 5.40 n T 8.00 12.00 150
CHAPTER 11 INDEX NUMBER FORM 4
68
S
R
QP
25%
40%
20%
15%
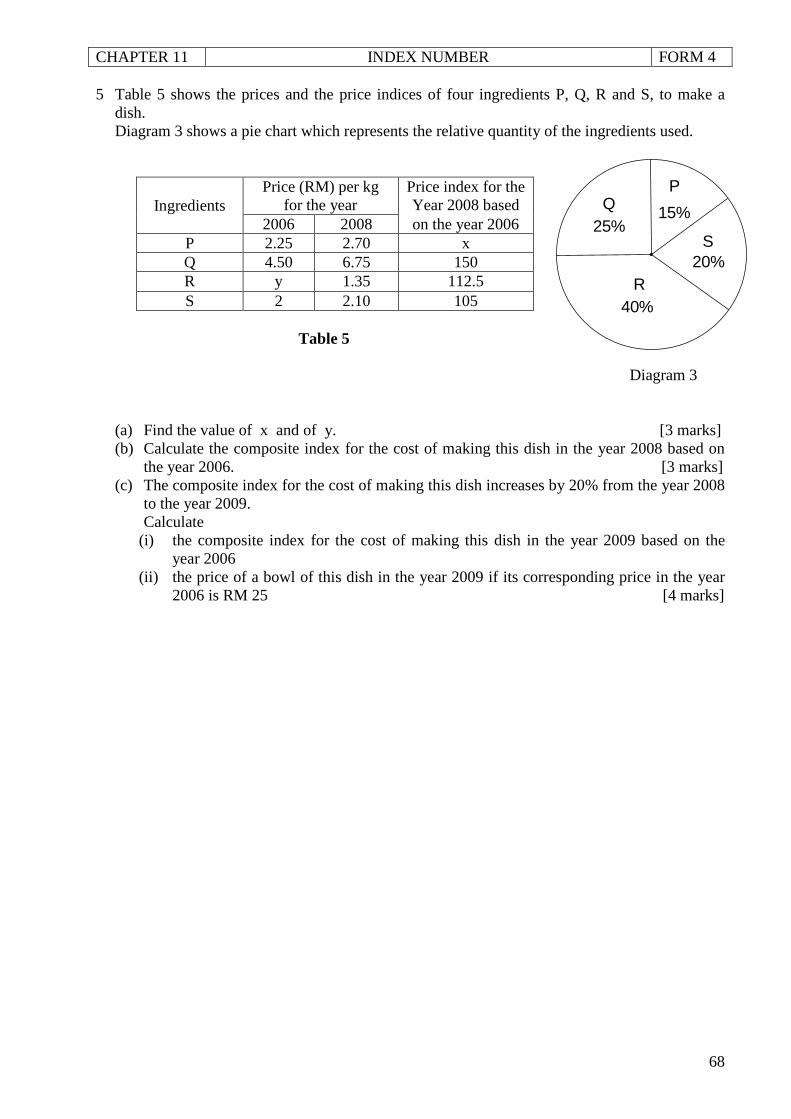
5 Table 5 shows the prices and the price indices of four ingredients P, Q, R and S, to make a dish. Diagram 3 shows a pie chart which represents the relative quantity of the ingredients used.
Ingredients Price (RM) per kg
for the year Price index for the Year 2008 based
2006 2008 on the year 2006 P 2.25 2.70 x Q 4.50 6.75 150 R y 1.35 112.5 S 2 2.10 105
Table 5 Diagram 3 (a) Find the value of x and of y. [3 marks] (b) Calculate the composite index for the cost of making this dish in the year 2008 based on
the year 2006. [3 marks] (c) The composite index for the cost of making this dish increases by 20% from the year 2008
to the year 2009. Calculate
(i) the composite index for the cost of making this dish in the year 2009 based on the year 2006
(ii) the price of a bowl of this dish in the year 2009 if its corresponding price in the year 2006 is RM 25 [4 marks]
CHAPTER 11 INDEX NUMBER FORM 4
69
ANSWERS (PAPER 2)
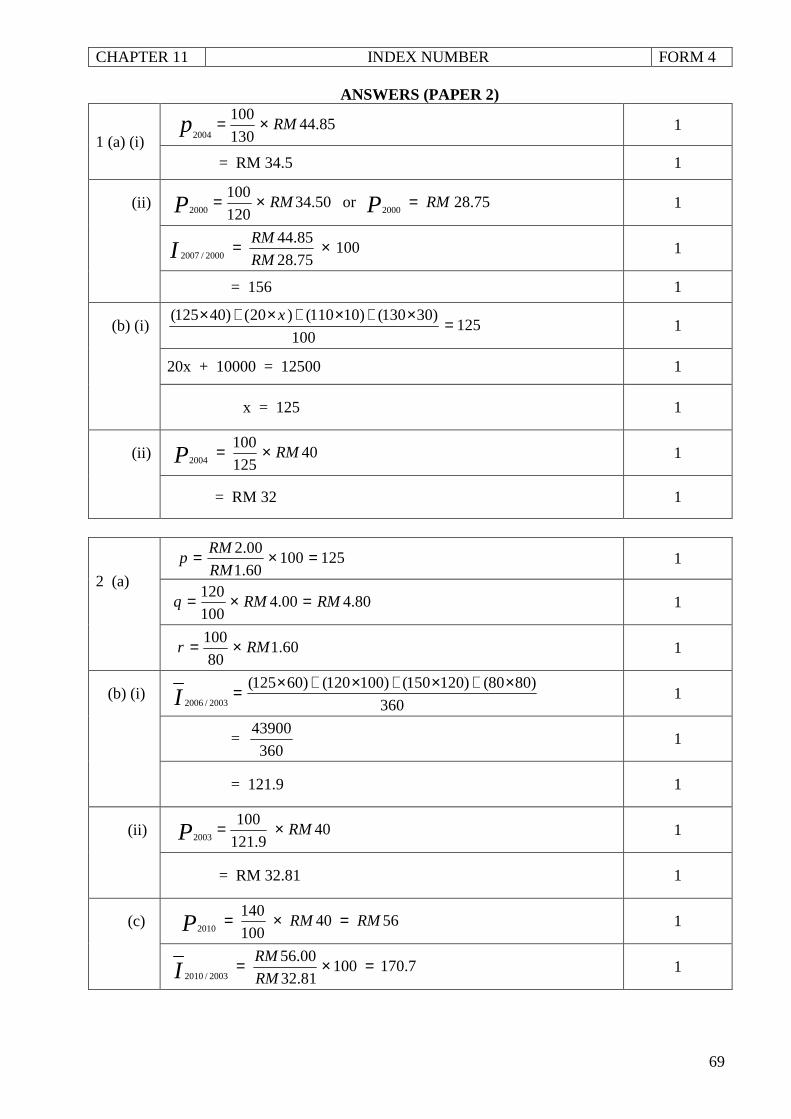
1 (a) (i) 85.44
130
1002004
RMp ×= 1
= RM 34.5 1
(ii) 50.34120
1002000
RMP ×= or 75.282000
RMP = 1
10075.28
85.442000/2007
×=RM
RMI 1
= 156 1
(b) (i) 125100
)30130()10110()20()40125( =×+×+×+× x 1
20x + 10000 = 12500 1
x = 125 1
(ii) 40125
1002004
RMP ×= 1
= RM 32 1
2 (a)
12510060.1
00.2 =×=RM
RMp 1
80.400.4100
120RMRMq =×= 1
60.1
80
100RMr ×= 1
(b) (i) 360
)8080()120150()100120()60125(2003/2006
×+×+×+×=I 1
= 360
43900 1
= 121.9 1
(ii) 409.121
1002003
RMP ×= 1
= RM 32.81 1
(c) 5640100
1402010
RMRMP =×= 1
7.17010081.32
00.562003/2010
=×=RM
RMI 1
CHAPTER 11 INDEX NUMBER FORM 4
70
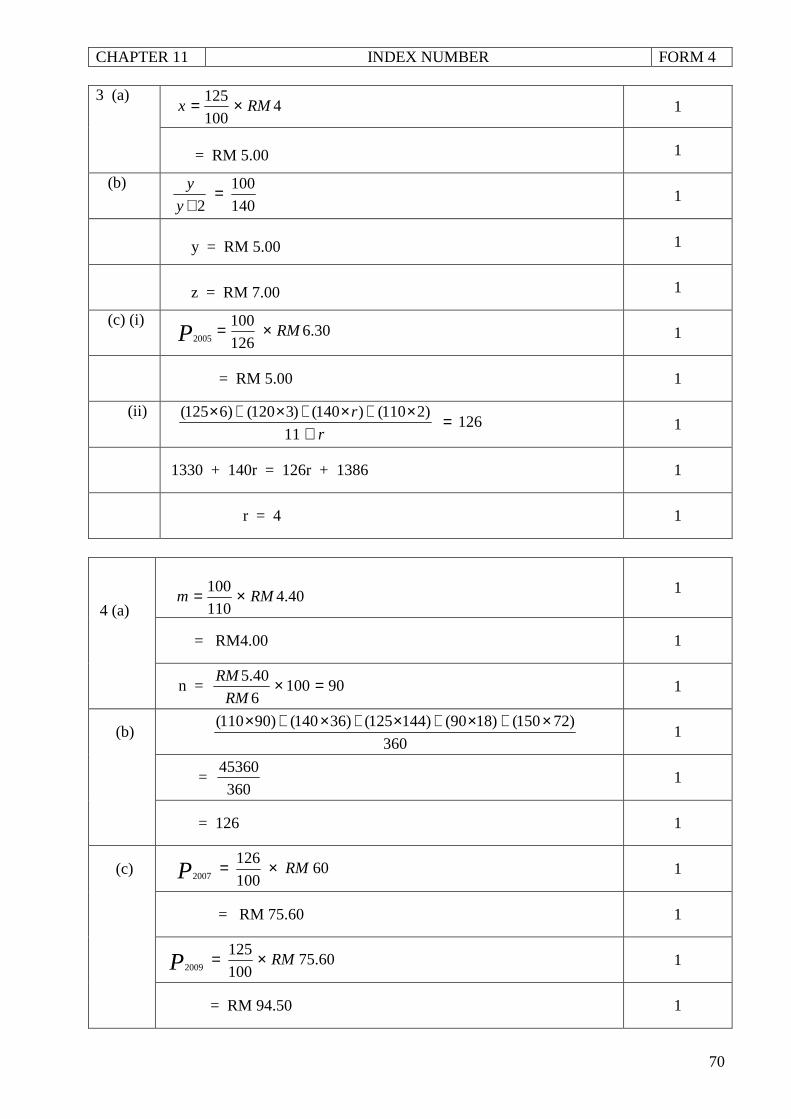
3 (a) 4
100
125RMx ×= 1
= RM 5.00 1
(b)
140
100
2=
+y
y 1
y = RM 5.00 1
z = RM 7.00 1
(c) (i) 30.6
126
1002005
RMP ×= 1
= RM 5.00 1
(ii) 126
11
)2110()140()3120()6125( =+
×+×+×+×r
r 1
1330 + 140r = 126r + 1386 1
r = 4 1
4 (a)
40.4110
100RMm ×= 1
= RM4.00 1
n = 901006
40.5 =×RM
RM 1
(b) 360
)72150()1890()144125()36140()90110( ×+×+×+×+× 1
= 360
45360 1
= 126 1
(c) 60100
1262007
RMP ×= 1
= RM 75.60 1
60.75100
1252009
RMP ×= 1
= RM 94.50 1
CHAPTER 11 INDEX NUMBER FORM 4
71
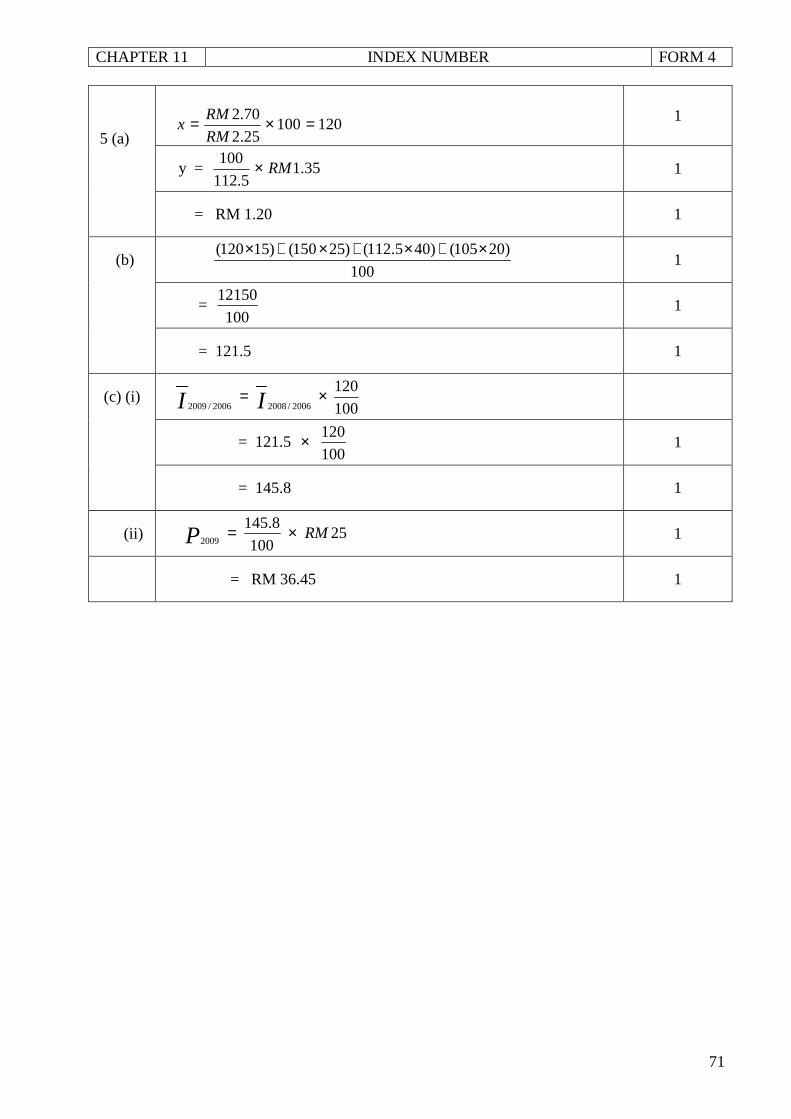
5 (a)
12010025.2
70.2 =×=RM
RMx 1
y = 35.15.112
100RM× 1
= RM 1.20 1
(b) 100
)20105()405.112()25150()15120( ×+×+×+× 1
= 100
12150 1
= 121.5 1
(c) (i) 100
1202006/20082006/2009
×= II
= 121.5 × 100
120 1
= 145.8 1
(ii) 25100
8.1452009
RMP ×= 1
= RM 36.45 1
CHAPTER 2 QUADRATIC EQUATIONS FORM 4
6
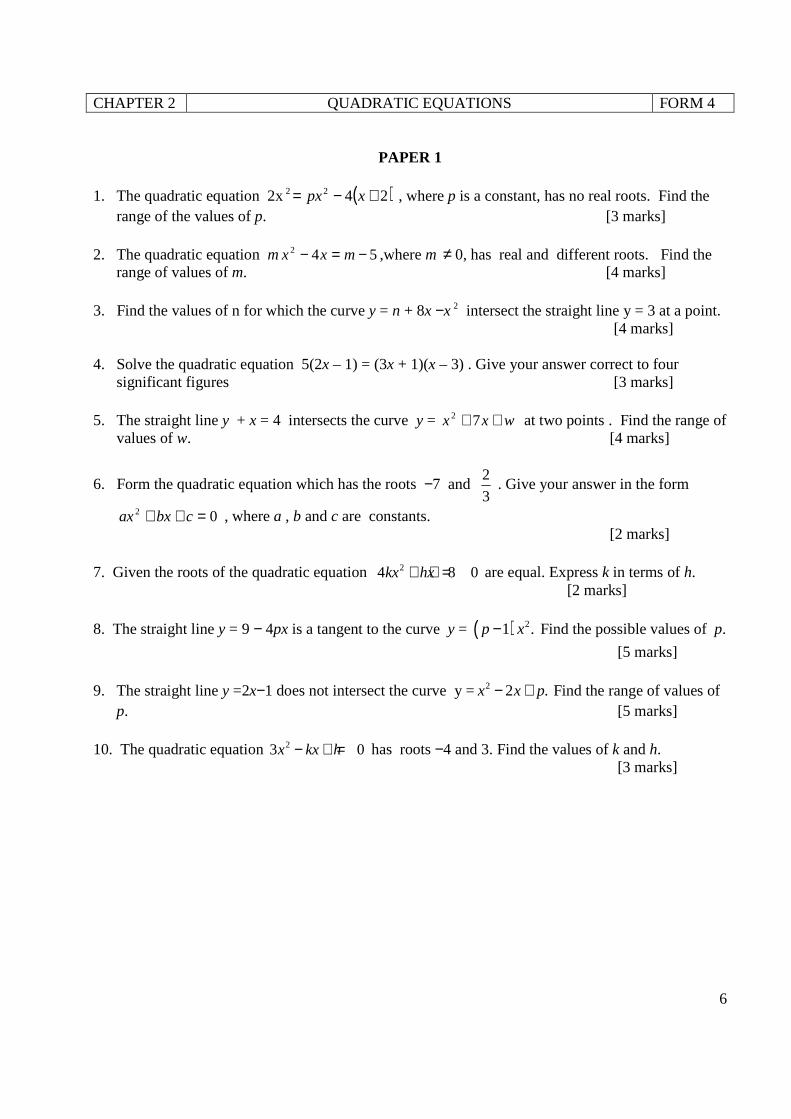
PAPER 1
1. The quadratic equation 2x ( )2422 +−= xpx , where p is a constant, has no real roots. Find the
range of the values of p. [3 marks]
2. The quadratic equation m 542 −=− mxx ,where m ≠ 0, has real and different roots. Find the range of values of m. [4 marks]
3. Find the values of n for which the curve y = n + 8x −x 2 intersect the straight line y = 3 at a point. [4 marks]
4. Solve the quadratic equation 5(2x – 1) = (3x + 1)(x – 3) . Give your answer correct to four significant figures [3 marks]
5. The straight line y + x = 4 intersects the curve y = wxx ++ 72 at two points . Find the range of values of w. [4 marks]
6. Form the quadratic equation which has the roots −7 and 3
2 . Give your answer in the form
02 =++ cbxax , where a , b and c are constants. [2 marks] 7. Given the roots of the quadratic equation 24 8 0kx hx+ + = are equal. Express k in terms of h. [2 marks] 8. The straight line y = 9 − 4px is a tangent to the curve y = ( ) 21 .p x− Find the possible values of p.
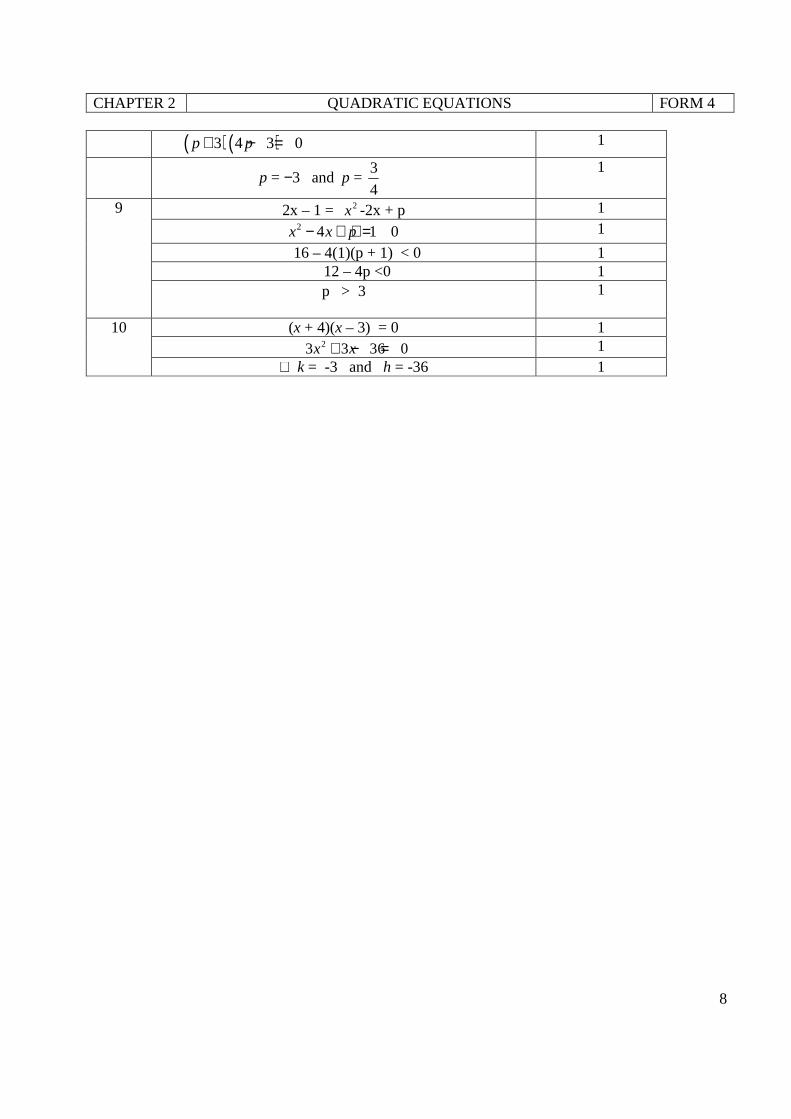
[5 marks] 9. The straight line y =2x−1 does not intersect the curve y =2 2 .x x p− + Find the range of values of p. [5 marks] 10. The quadratic equation 23 0x kx h− + = has roots −4 and 3. Find the values of k and h. [3 marks]
CHAPTER 2 QUADRATIC EQUATIONS FORM 4
7
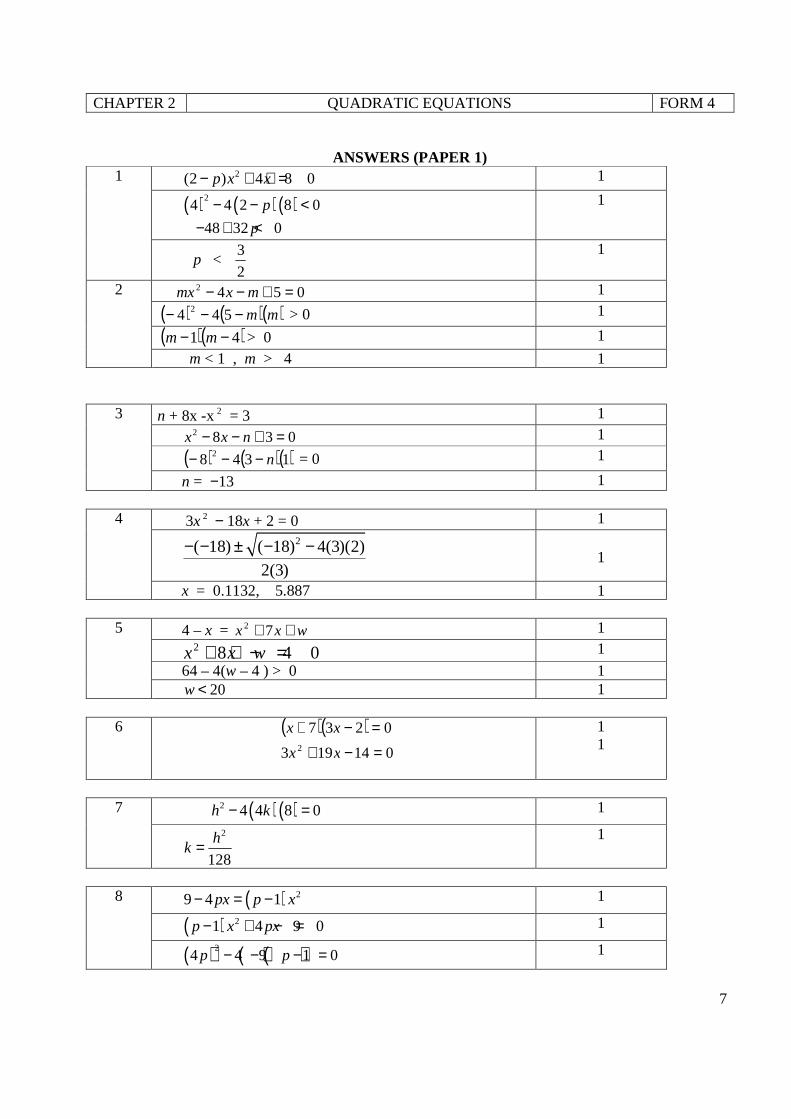
ANSWERS (PAPER 1)
1 2(2 ) 4 8 0p x x− + + = 1
( ) ( )( )24 4 2 8 0p− − <
48 32 0p− + <
1
p < 3
2
1
2 0542 =+−− mxmx 1
( ) ( )( )mm−−− 544 2 > 0 1
( )( )41 −− mm > 0 1
m < 1 , m > 4 1
3 n + 8x -x2 = 3 1
0382 =+−− nxx 1
( ) ( )( )1348 2 n−−− = 0 1
n = −13 1 4 3x 2 − 18x + 2 = 0 1
2( 18) ( 18) 4(3)(2)
2(3)
− − ± − − 1
x = 0.1132, 5.887 1 5 4 – x = wxx ++ 72 1
2 8 4 0x x w+ + − = 1
64 – 4(w – 4 ) > 0 1 20w < 1
6
( )( )
014193
02372 =−+
=−+
xx
xx
1 1
7 ( )( )2 4 4 8 0h k− = 1
2
128
hk =
1
8 ( ) 29 4 1px p x− = − 1
( ) 21 4 9 0p x px− + − = 1
( ) ( )( )24 4 9 1 0p p− − − = 1
CHAPTER 2 QUADRATIC EQUATIONS FORM 4
8
( )( )3 4 3 0p p+ − = 1
p = −3 and p =
4
3
1
9 2x – 1 = 2x -2x + p 1 2 4 1 0x x p− + + = 1
16 – 4(1)(p + 1) < 0 1 12 – 4p <0 1 p > 3
1
10 (x + 4)(x – 3) = 0 1 23 3 36 0x x+ − = 1
∴ k = -3 and h = -36 1
CHAPTER 3 QUADRATIC FUNCTIONS FORM 4
9
Paper 1
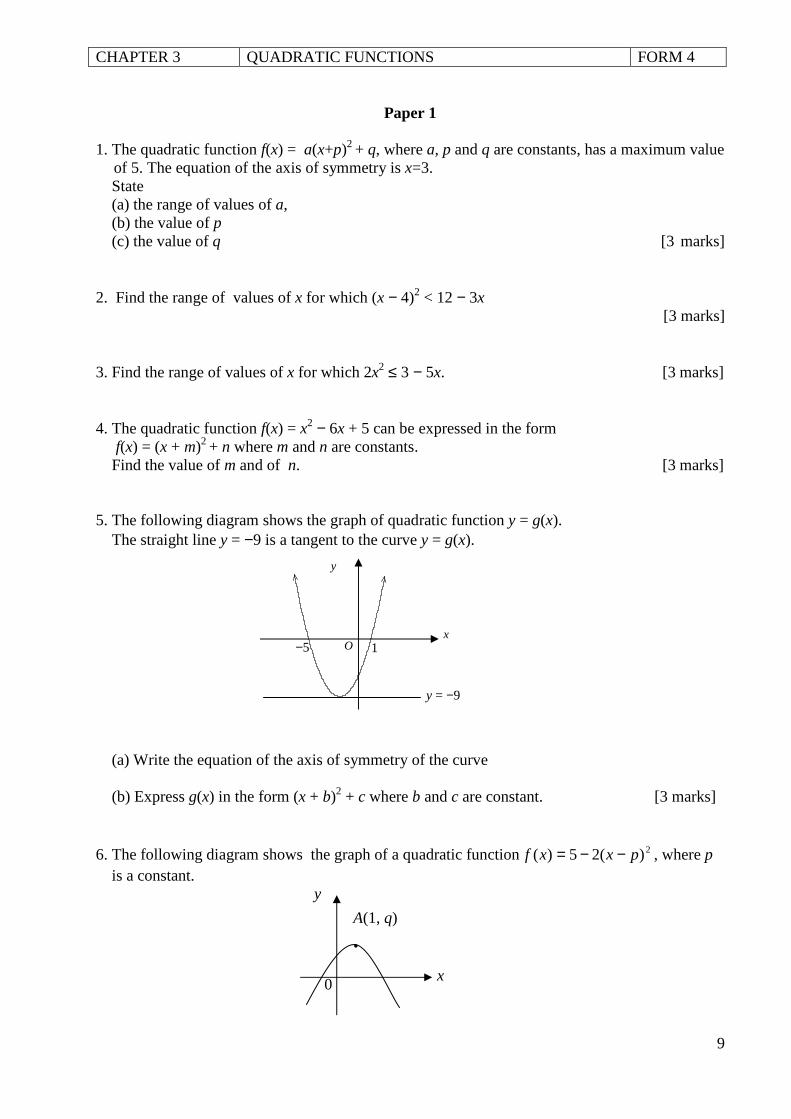
1. The quadratic function f(x) = a(x+p)2 + q, where a, p and q are constants, has a maximum value
of 5. The equation of the axis of symmetry is x=3. State (a) the range of values of a, (b) the value of p (c) the value of q [3 marks] 2. Find the range of values of x for which (x − 4)2 < 12 − 3x
[3 marks] 3. Find the range of values of x for which 2x2 ≤ 3 − 5x. [3 marks] 4. The quadratic function f(x) = x2 − 6x + 5 can be expressed in the form f(x) = (x + m)2 + n where m and n are constants. Find the value of m and of n. [3 marks] 5. The following diagram shows the graph of quadratic function y = g(x). The straight line y = −9 is a tangent to the curve y = g(x). (a) Write the equation of the axis of symmetry of the curve (b) Express g(x) in the form (x + b)2 + c where b and c are constant. [3 marks] 6. The following diagram shows the graph of a quadratic function 2)(25)( pxxf −−= , where p
is a constant.
x
y
O 1 −5
y = −9
A(1, q)
.
0 x
y
CHAPTER 3 QUADRATIC FUNCTIONS FORM 4
10
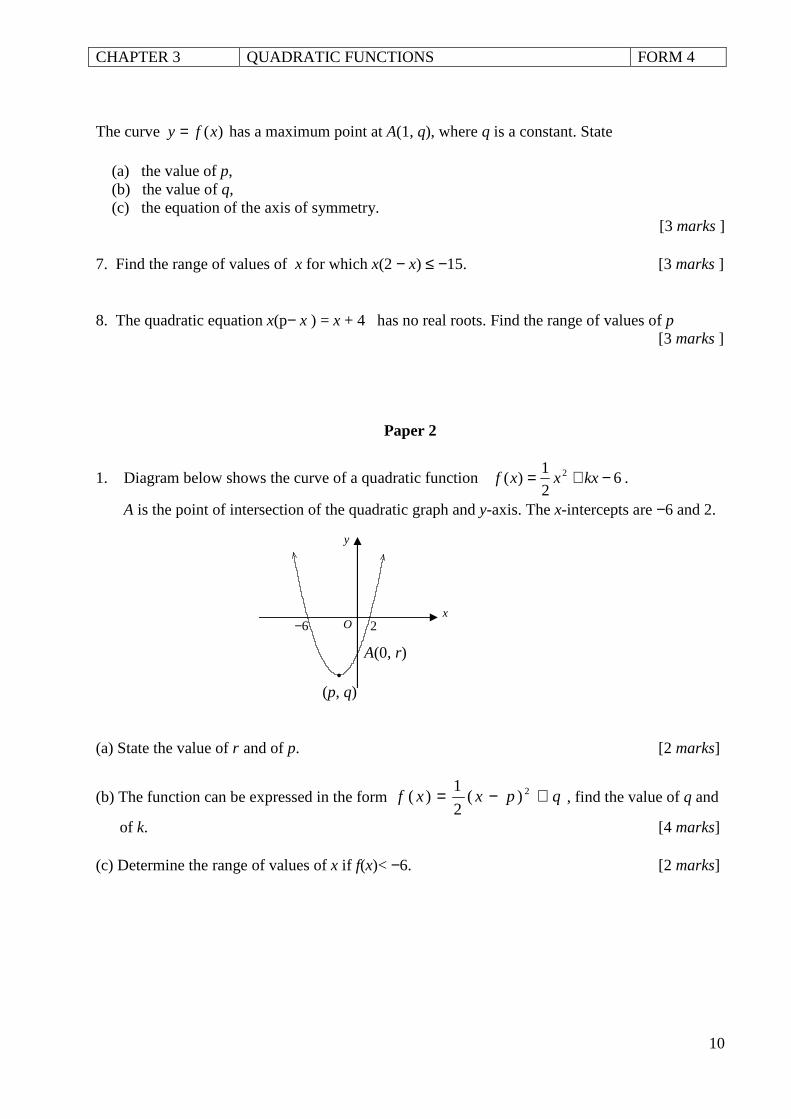
The curve )(xfy = has a maximum point at A(1, q), where q is a constant. State (a) the value of p, (b) the value of q, (c) the equation of the axis of symmetry.
[3 marks ] 7. Find the range of values of x for which x(2 − x) ≤ −15. [3 marks ] 8. The quadratic equation x(p− x ) = x + 4 has no real roots. Find the range of values of p
[3 marks ]
Paper 2
1. Diagram below shows the curve of a quadratic function 62
1)( 2 −+= kxxxf .
A is the point of intersection of the quadratic graph and y-axis. The x-intercepts are −6 and 2. (a) State the value of r and of p. [2 marks]
(b) The function can be expressed in the form qpxxf +−= 2)(2
1)( , find the value of q and
of k. [4 marks] (c) Determine the range of values of x if f(x)< −6. [2 marks]
x
y
O 2 −6
A(0, r) •
(p, q)
CHAPTER 3 QUADRATIC FUNCTIONS FORM 4
11
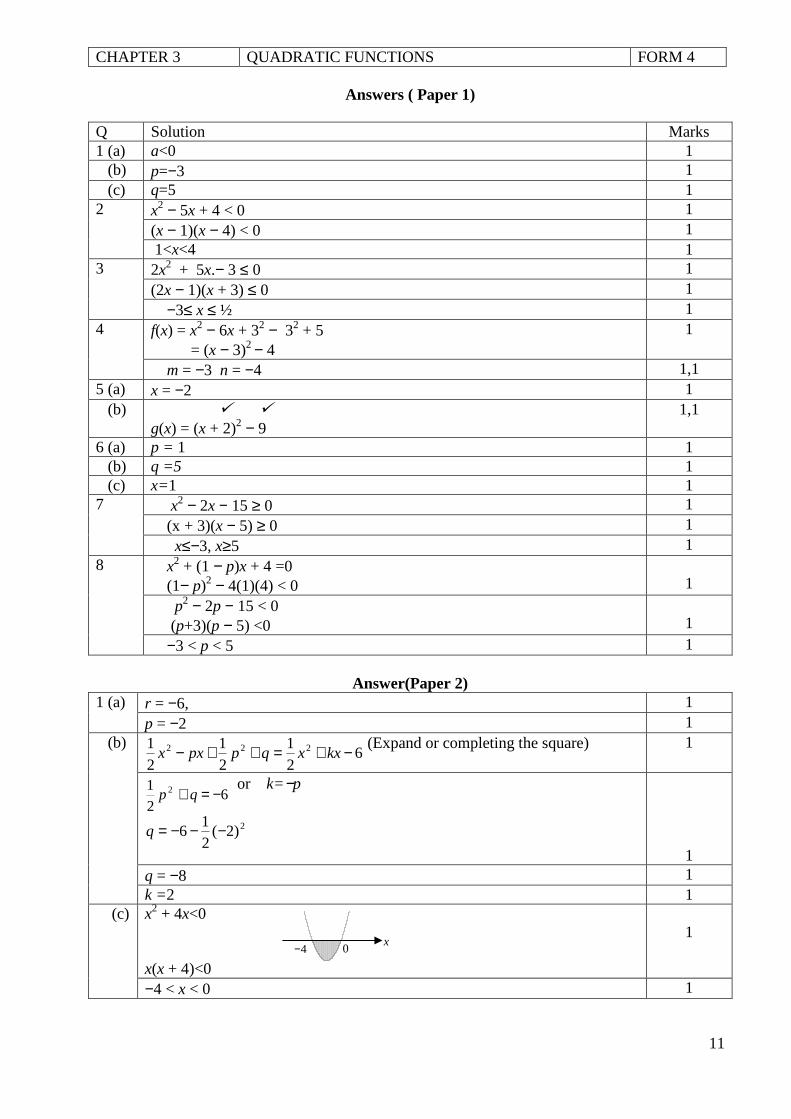
Answers ( Paper 1) Q Solution Marks 1 (a) a<0 1 (b) p=−3 1 (c) q=5 1 2 x2 − 5x + 4 < 0 1
(x − 1)(x − 4) < 0 1 1<x<4 1
3 2x2 + 5x.− 3 ≤ 0 1 (2x − 1)(x + 3) ≤ 0 1 −3≤ x ≤ ½ 1 4 f(x) = x2 − 6x + 32 − 32 + 5
= (x − 3)2 − 4 1
m = −3 n = −4 1,1 5 (a) x = −2 1 (b) � �
g(x) = (x + 2)2 − 9 1,1
6 (a) p = 1 1 (b) q =5 1 (c) x=1 1 7 x2 − 2x − 15 ≥ 0 1 (x + 3)(x − 5) ≥ 0 1 x≤−3, x≥5 1 8 x2 + (1 − p)x + 4 =0
(1− p)2 − 4(1)(4) < 0 1
p2 − 2p − 15 < 0 (p+3)(p − 5) <0
1
−3 < p < 5 1
Answer(Paper 2) 1 (a) r = −6, 1 p = −2 1 (b)
621
21
21 222 −+=++− kxxqppxx
(Expand or completing the square) 1
62
1 2 −=+ qp or k=−p
2)2(21
6 −−−=q
1
q = −8 1 k =2 1
(c) x2 + 4x<0 x(x + 4)<0
1
−4 < x < 0 1
−4 0 x
CHAPTER 4 SIMULTANEOUS EQUATIONS FORM 4
12
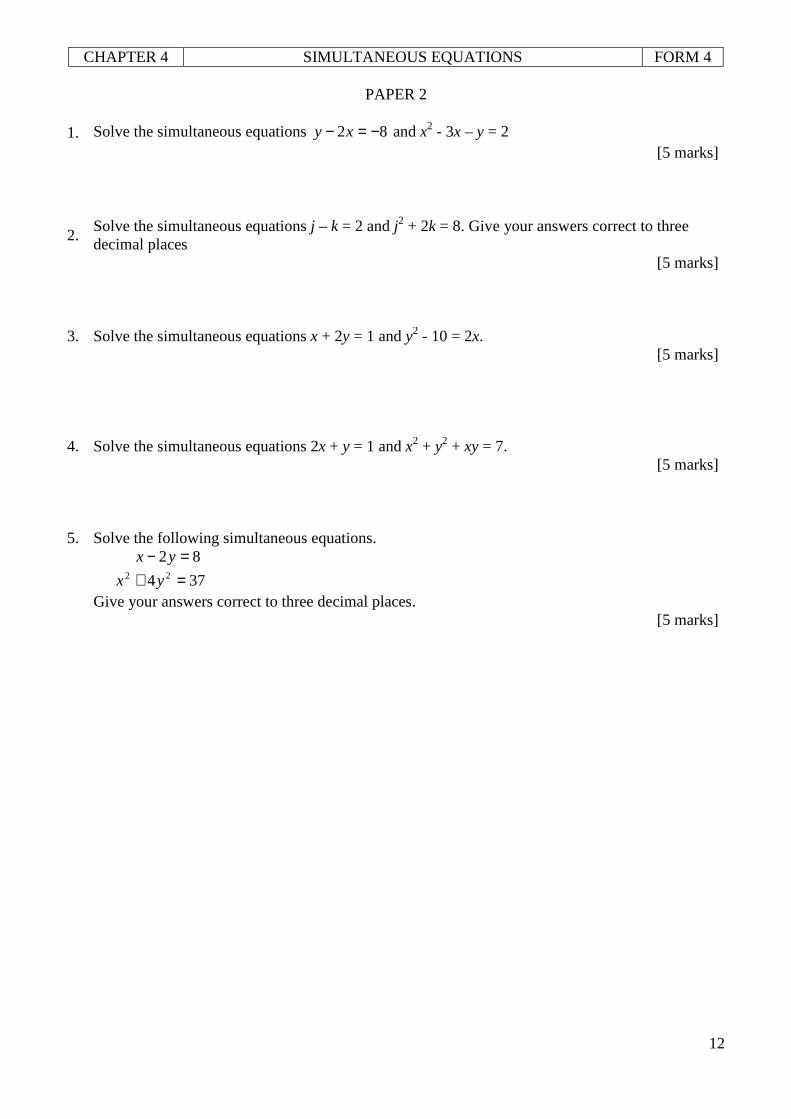
PAPER 2 1. Solve the simultaneous equations 82 −=− xy and x2 - 3x – y = 2 [5 marks]
2. Solve the simultaneous equations j – k = 2 and j2 + 2k = 8. Give your answers correct to three decimal places
[5 marks] 3. Solve the simultaneous equations x + 2y = 1 and y2 - 10 = 2x. [5 marks] 4. Solve the simultaneous equations 2x + y = 1 and x2 + y2 + xy = 7. [5 marks] 5. Solve the following simultaneous equations. 82 =− yx 374 22 =+ yx
Give your answers correct to three decimal places. [5 marks]
CHAPTER 4 SIMULTANEOUS EQUATIONS FORM 4
13
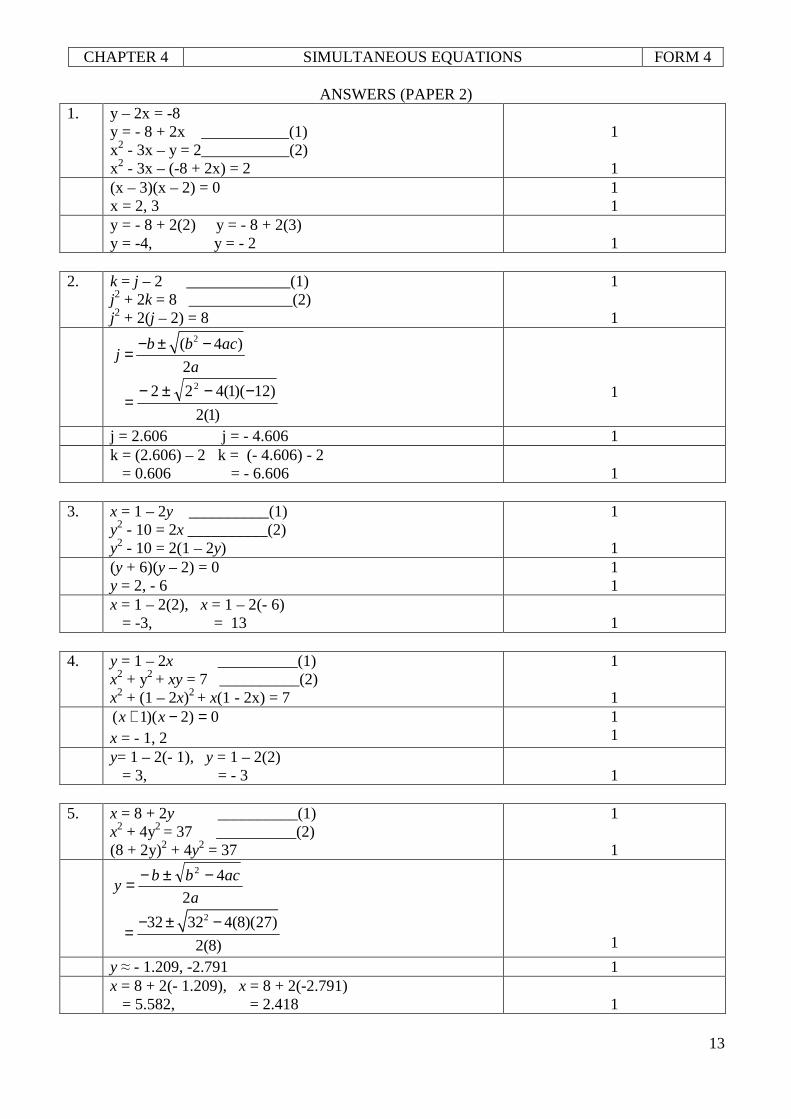
ANSWERS (PAPER 2) 1. y – 2x = -8
y = - 8 + 2x ___________(1) x2 - 3x – y = 2___________(2) x2 - 3x – (-8 + 2x) = 2
1 1
(x – 3)(x – 2) = 0 x = 2, 3
1 1
y = - 8 + 2(2) y = - 8 + 2(3) y = -4, y = - 2
1
2. k = j – 2 _____________(1)
j2 + 2k = 8 _____________(2) j2 + 2(j – 2) = 8
1 1
2( 4 )
2
b b acj
a
− ± −=
)1(2
)12)(1(422 2 −−±−=
1
j = 2.606 j = - 4.606 1 k = (2.606) – 2 k = (- 4.606) - 2
= 0.606 = - 6.606 1
3. x = 1 – 2y __________(1)
y2 - 10 = 2x __________(2) y2 - 10 = 2(1 – 2y)
1 1
(y + 6)(y – 2) = 0 y = 2, - 6
1 1
x = 1 – 2(2), x = 1 – 2(- 6) = -3, = 13
1
4. y = 1 – 2x __________(1)
x2 + y2 + xy = 7 __________(2) x2 + (1 – 2x)2 + x(1 - 2x) = 7
1 1
0)2)(1( =−+ xx x = - 1, 2
1 1
y= 1 – 2(- 1), y = 1 – 2(2) = 3, = - 3
1
5. x = 8 + 2y __________(1)
x2 + 4y2 = 37 __________(2) (8 + 2y)2 + 4y2 = 37
1 1
a
acbby
2
42 −±−=
232 32 4(8)(27)
2(8)
− ± −=
1
y ≈ - 1.209, -2.791 1 x = 8 + 2(- 1.209), x = 8 + 2(-2.791)
= 5.582, = 2.418 1
CHAPTER 5 INDICES AND LOGARITHM FORM 4
14
PAPER 1
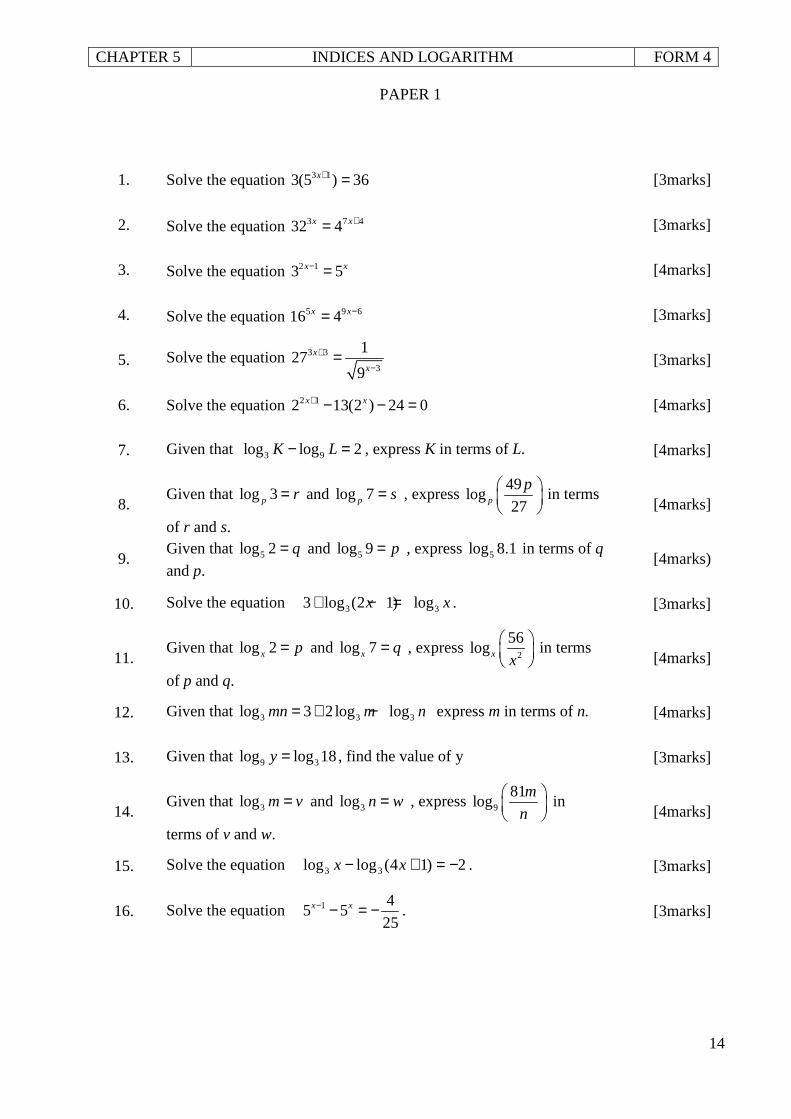
1. Solve the equation 3 13(5 ) 36x+ = [3marks]
2. Solve the equation 3 7 432 4x x+= [3marks]
3. Solve the equation 2 13 5x x− = [4marks]
4. Solve the equation 5 9 616 4x x−= [3marks]
5. Solve the equation 3 3
3
127
9
x
x
+
−= [3marks]
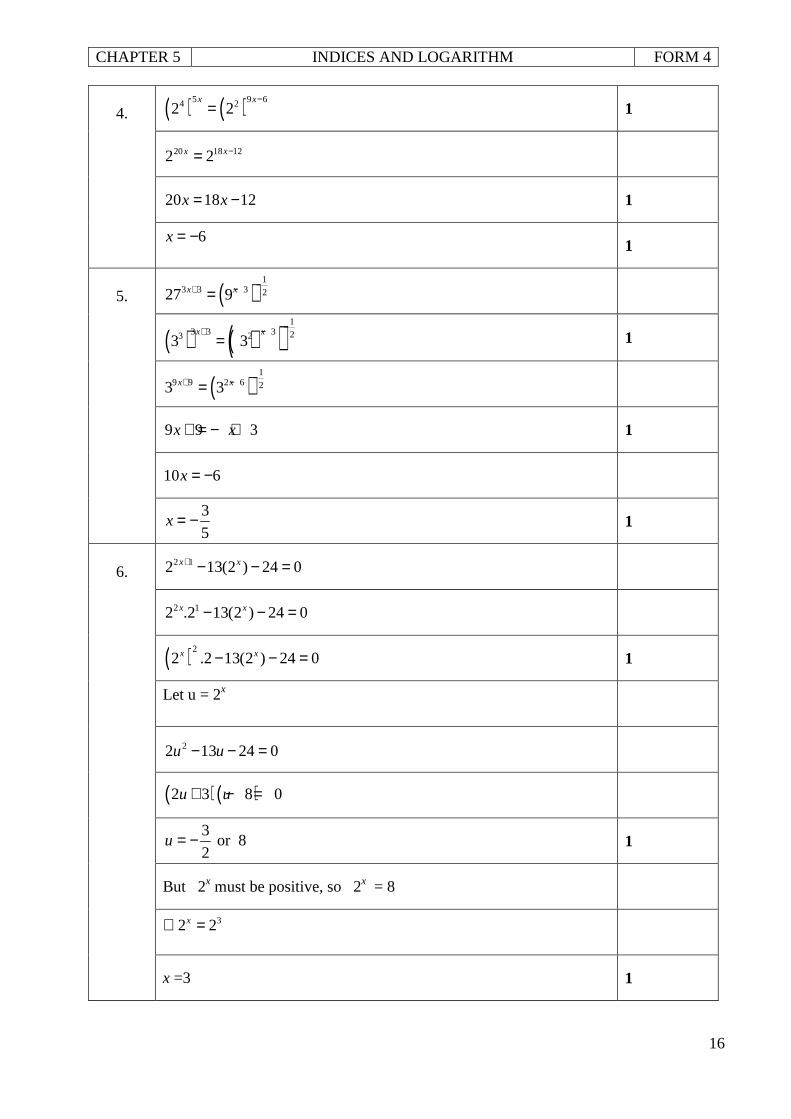
6. Solve the equation 2 12 13(2 ) 24 0x x+ − − = [4marks]
7. Given that 3 9log log 2K L− = , express K in terms of L. [4marks]
8. Given that log 3p r= and log 7p s= , express
49log
27p
p
in terms
of r and s.
[4marks]
9. Given that 5log 2 q= and 5log 9 p= , express 5log 8.1 in terms of q
and p. [4marks)
10. Solve the equation 3 33 log (2 1) logx x+ − = . [3marks]
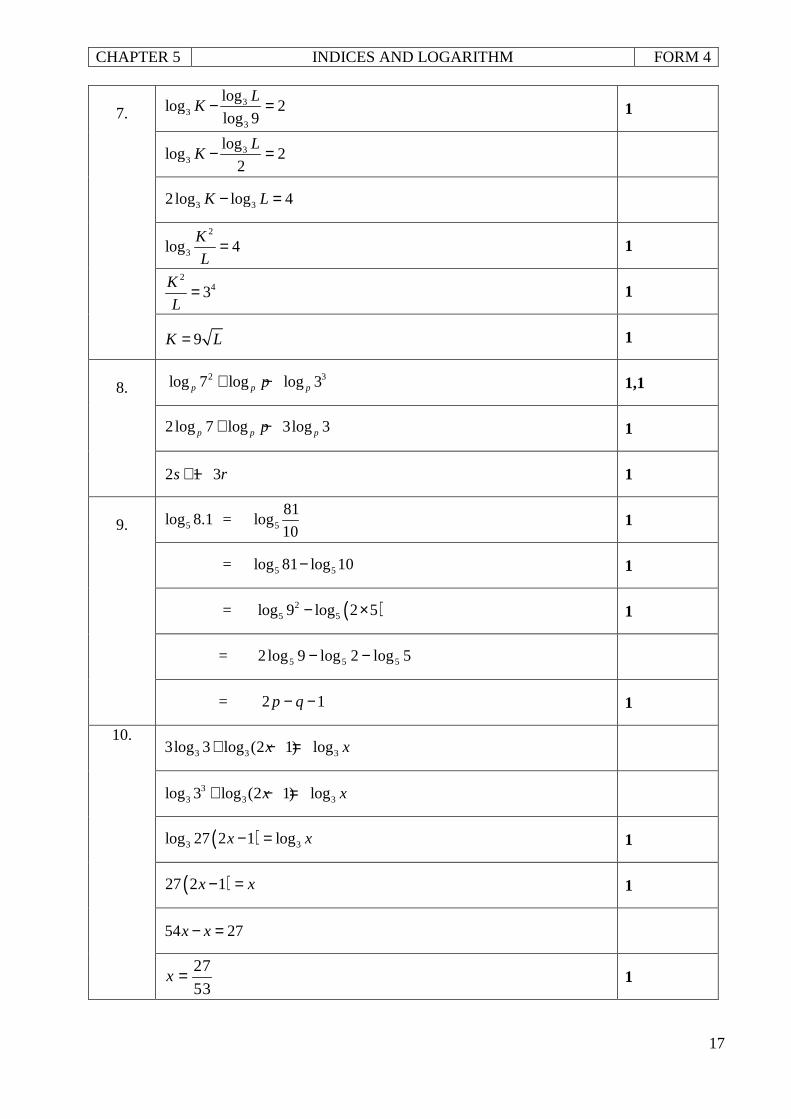
11. Given that log 2x p= and log 7x q= , express
2
56log x x
in terms
of p and q.
[4marks]
12. Given that 3 3 3log 3 2log logmn m n= + − express m in terms of n. [4marks]
13. Given that 9 3log log 18y = , find the value of y [3marks]
14. Given that 3log m v= and 3log n w= , express 9
81log
m
n
in
terms of v and w.
[4marks]
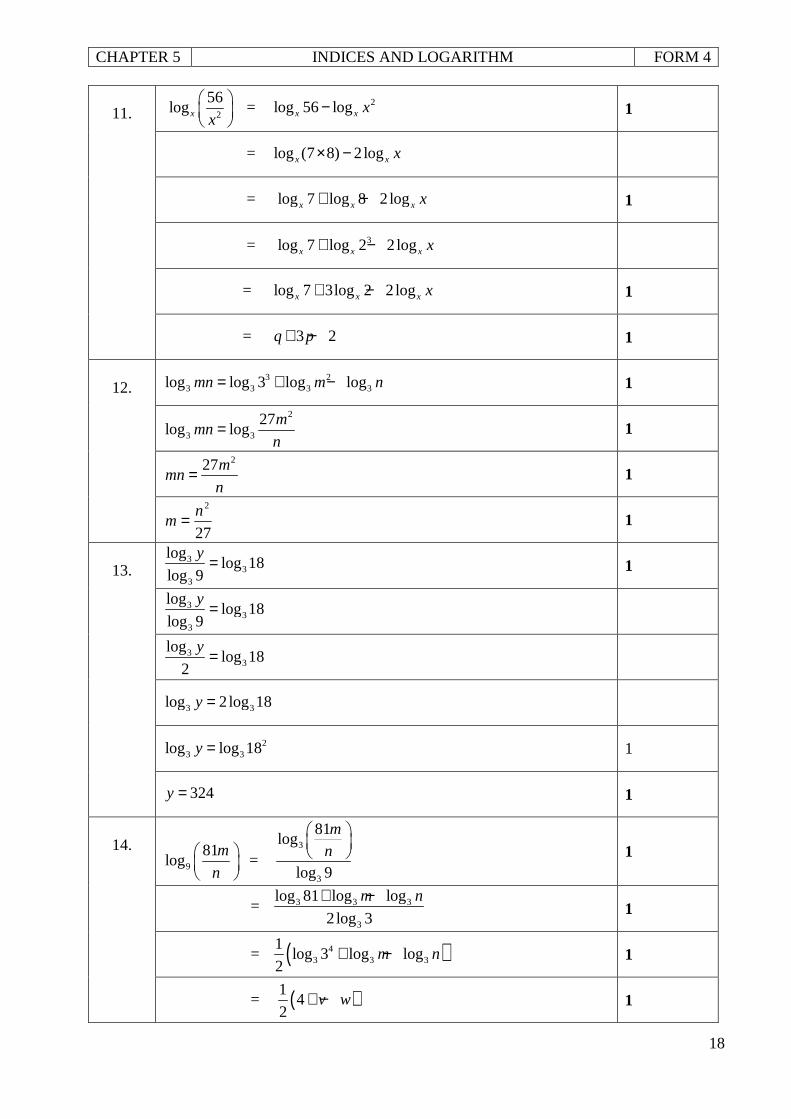
15. Solve the equation 2)14(loglog 33 −=+− xx . [3marks]
16. Solve the equation 1 45 5
25x x− − = − . [3marks]
CHAPTER 5 INDICES AND LOGARITHM FORM 4
15
ANSWERS (PAPER 1)
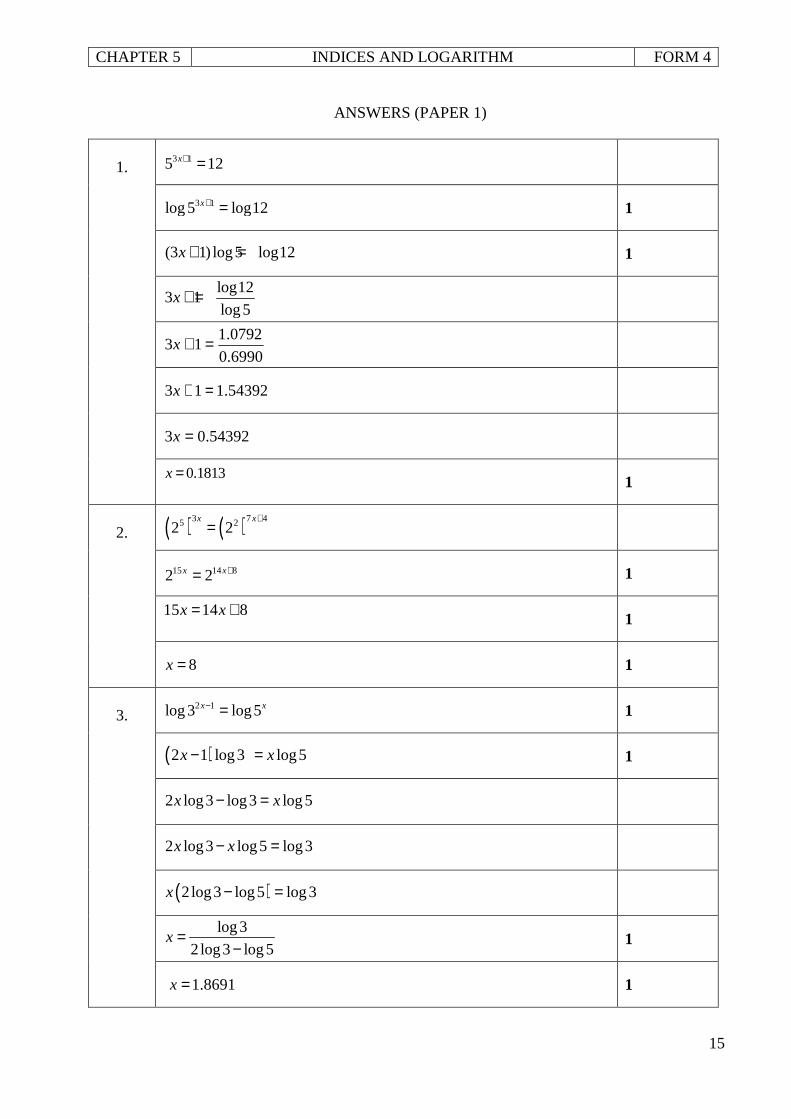
1.
3 15 12x+ =
3 1log 5 log12x+ = 1
(3 1) log5 log12x + = 1
log123 1
log 5x + =
6990.0
0792.113 =+x
54392.113 =+x
54392.03 =x
0.1813x =
1
2. ( ) ( )3 7 45 22 2
x x+=
15 14 82 2x x+= 1
15 14 8x x= +
1
8x = 1
3.
2 1log 3 log5x x− = 1
( )2 1 log 3 log5x x− = 1
2 log3 log3 log 5x x− =
2 log3 log5 log3x x− =
( )2log3 log5 log 3x − =
log 3
2log3 log 5x =
− 1
1.8691x = 1
CHAPTER 5 INDICES AND LOGARITHM FORM 4
16
4. ( ) ( )5 9 64 22 2
x x−= 1
20 18 122 2x x−=
20 18 12x x= − 1
6x = −
1
5. ( )
13 3 3 227 9x x −+ −=
( ) ( )( )1
3 3 3 23 23 3x x −+ −
= 1
( )1
9 9 2 6 23 3x x −+ −=
9 9 3x x+ = − + 1
10 6x = −
3
5x = − 1
6.
2 12 13(2 ) 24 0x x+ − − =
2 12 .2 13(2 ) 24 0x x− − =
( )22 .2 13(2 ) 24 0x x− − = 1
Let u = 2x
22 13 24 0u u− − =
( )( )2 3 8 0u u+ − =
3 or 8
2u = − 1
But 2x must be positive, so 2x = 8
32 2x∴ =
x =3 1
CHAPTER 5 INDICES AND LOGARITHM FORM 4
17
7.
33
3
loglog 2
log 9
LK − = 1
33
loglog 2
2
LK − =
3 32log log 4K L− =
2
3log 4K
L= 1
243
K
L= 1
9K L= 1
8. 2 3log 7 log log 3p p pp+ − 1,1
2log 7 log 3log 3p p pp+ − 1
2 1 3s r+ − 1
9. 5log 8.1 = 5
81log
10 1
= 5 5log 81 log 10− 1
= ( )25 5log 9 log 2 5− × 1
= 5log2log9log2 555 −−
= 12 −− qp 1
10. 3 3 33log 3 log (2 1) logx x+ − =
33 3 3log 3 log (2 1) logx x+ − =
( )3 3log 27 2 1 logx x− = 1
( )27 2 1x x− = 1
54 27x x− =
27
53x = 1
CHAPTER 5 INDICES AND LOGARITHM FORM 4
18
11.
2
56log x x
= 2log 56 logx x x− 1
= log (7 8) 2 logx x x× −
= log 7 log 8 2logx x x x+ − 1
= 3log 7 log 2 2logx x x x+ −
= log 7 3log 2 2logx x x x+ − 1
= 3 2q p+ − 1
12.
3 23 3 3 3log log 3 log logmn m n= + − 1
2
3 3
27log log
mmn
n= 1
227mmn
n= 1
27
2nm = 1
13.
33
3
loglog 18
log 9
y = 1
33
3
loglog 18
log 9
y =
33
loglog 18
2
y =
3 3log 2log 18y =
23 3log log 18y = 1
324y = 1
14.
9
81log
m
n
= 3
3
81log
log 9
m
n 1
= 3 3 3
3
log 81 log log
2log 3
m n+ − 1
= ( )43 3 3
1log 3 log log
2m n+ − 1
= ( )14
2v w+ − 1
CHAPTER 5 INDICES AND LOGARITHM FORM 4
19
15. 3 3log log (4 1) 2 0x x− + + =
3 3 3log log (4 1) 2 log 3 0x x− + + =
3
(9)log 0
4 1
x
x=
+ 1
093
4 1
x
x=
+ 1
9 4 1x x= +
5 1x =
1
5x = 1
16.
12
45 .5 5
5x x− − = −
2
1 45 1
5 5x − = −
1
2
4 45
5 5x − = −
2
4 55
5 4x = − × −
15 5x −= 1
1x = − 1
CHAPTER 6 COORDINATE GEOMETRY FORM 4
20
PAPER 1
1. A point T divides the line segment joining the points A(1, -2) and B(-5, 4) internally in the
ratio 2 : 1. Find the coordinates of point T. [2 marks]
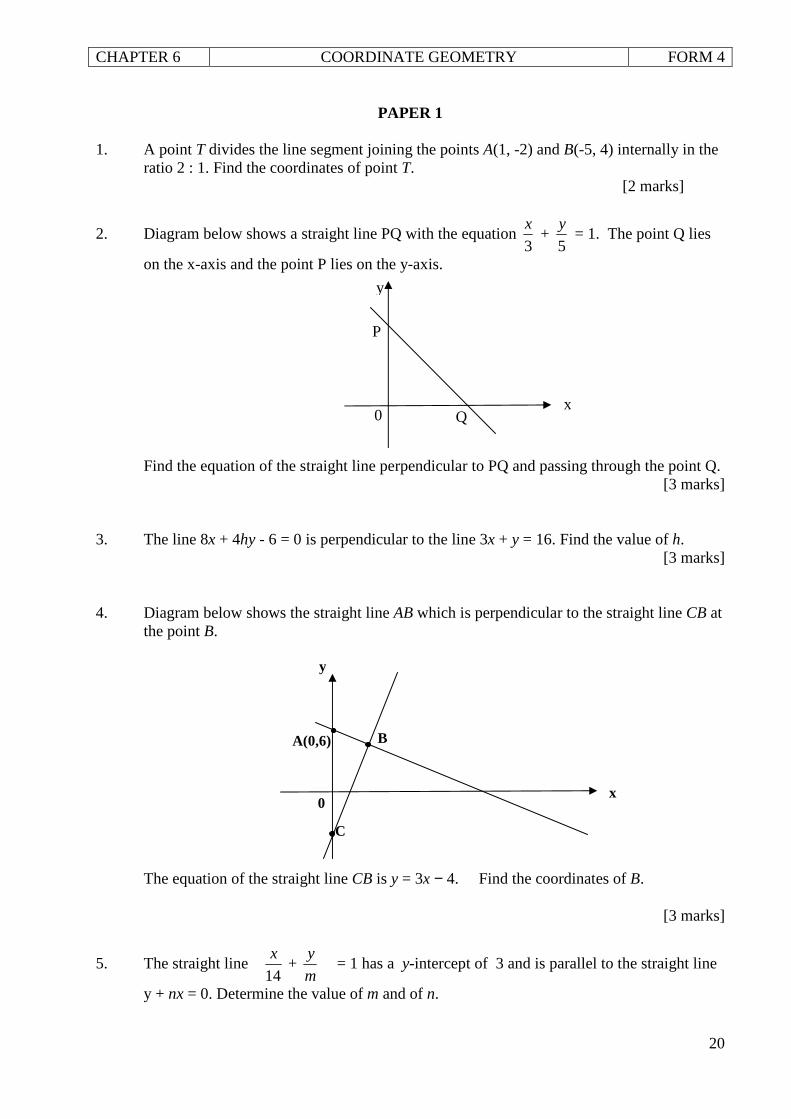
2. Diagram below shows a straight line PQ with the equation 3
x +
5
y = 1. The point Q lies
on the x-axis and the point P lies on the y-axis. Find the equation of the straight line perpendicular to PQ and passing through the point Q.
[3 marks] 3. The line 8x + 4hy - 6 = 0 is perpendicular to the line 3x + y = 16. Find the value of h.
[3 marks]
4. Diagram below shows the straight line AB which is perpendicular to the straight line CB at the point B.
The equation of the straight line CB is y = 3x − 4. Find the coordinates of B.
[3 marks]
5. The straight line 14
x +
m
y = 1 has a y-intercept of 3 and is parallel to the straight line
y + nx = 0. Determine the value of m and of n.
x
P
Q
y
0
A(0,6) B
x
y
C
0
CHAPTER 6 COORDINATE GEOMETRY FORM 4
21
[3 marks]
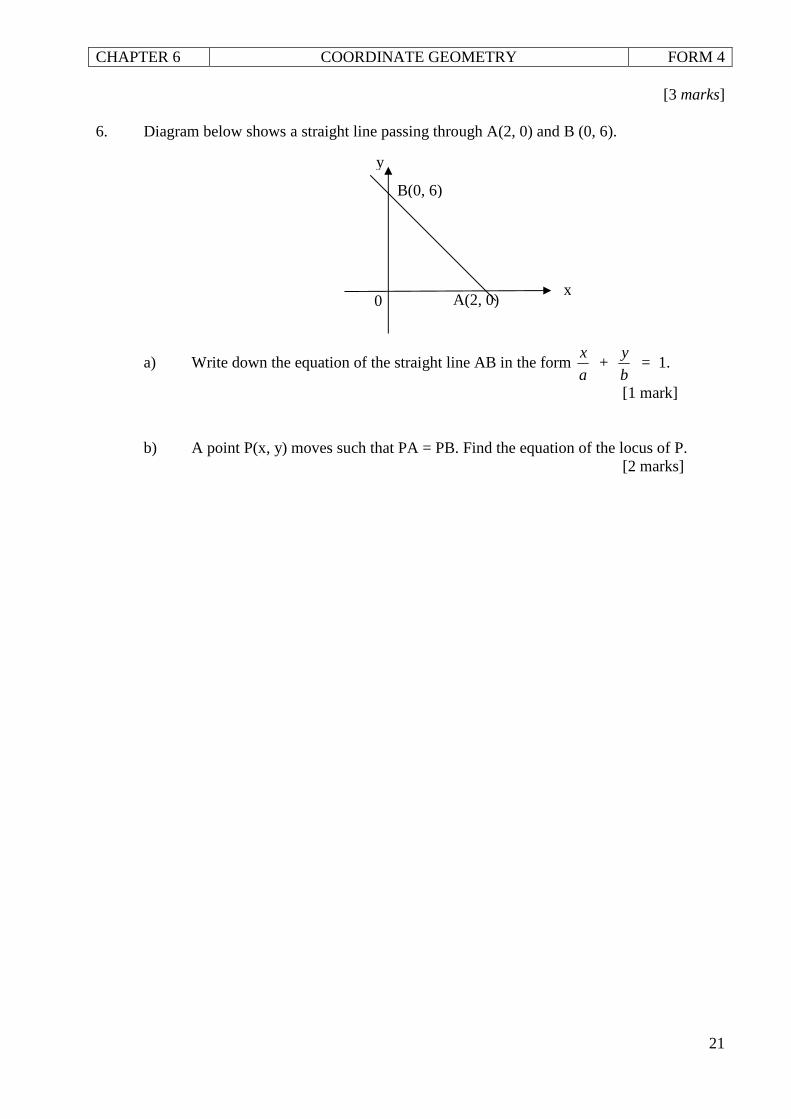
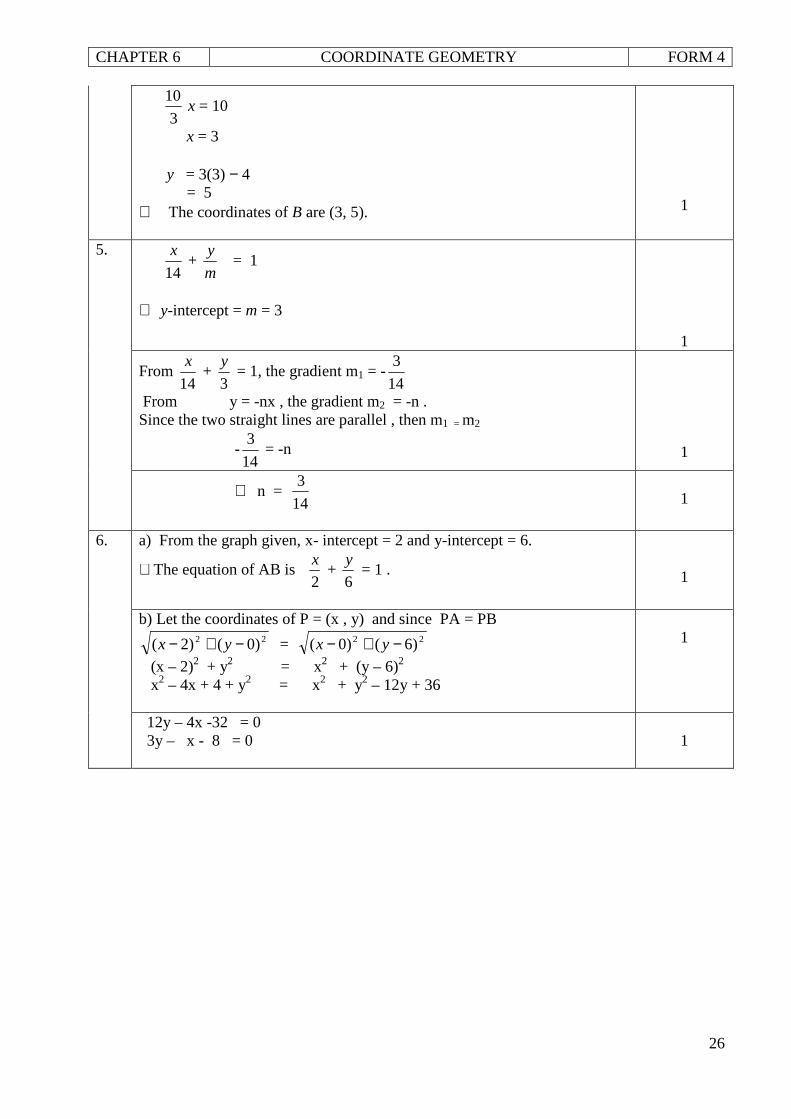
6. Diagram below shows a straight line passing through A(2, 0) and B (0, 6).
a) Write down the equation of the straight line AB in the form a
x +
b
y = 1.
[1 mark]
b) A point P(x, y) moves such that PA = PB. Find the equation of the locus of P. [2 marks]
x
B(0, 6)
A(2, 0)
y
0
CHAPTER 6 COORDINATE GEOMETRY FORM 4
22
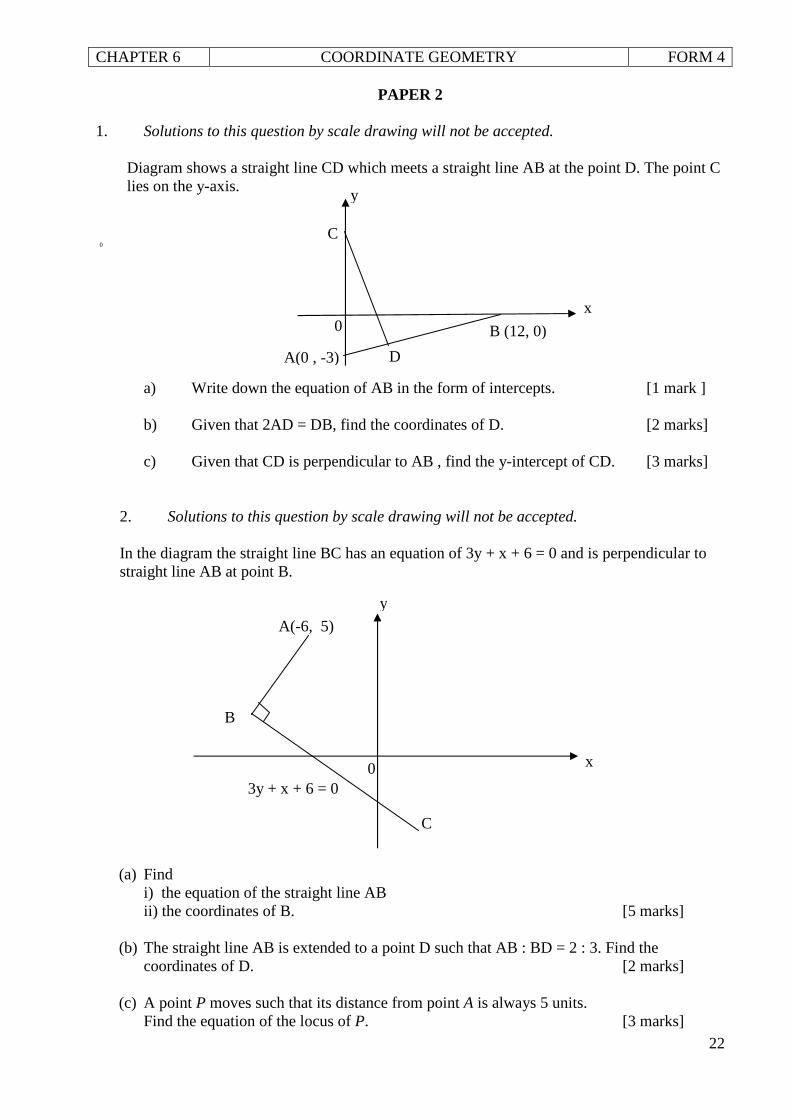
PAPER 2 1. Solutions to this question by scale drawing will not be accepted.
Diagram shows a straight line CD which meets a straight line AB at the point D. The point C lies on the y-axis.
0
a) Write down the equation of AB in the form of intercepts. [1 mark ] b) Given that 2AD = DB, find the coordinates of D. [2 marks] c) Given that CD is perpendicular to AB , find the y-intercept of CD. [3 marks]
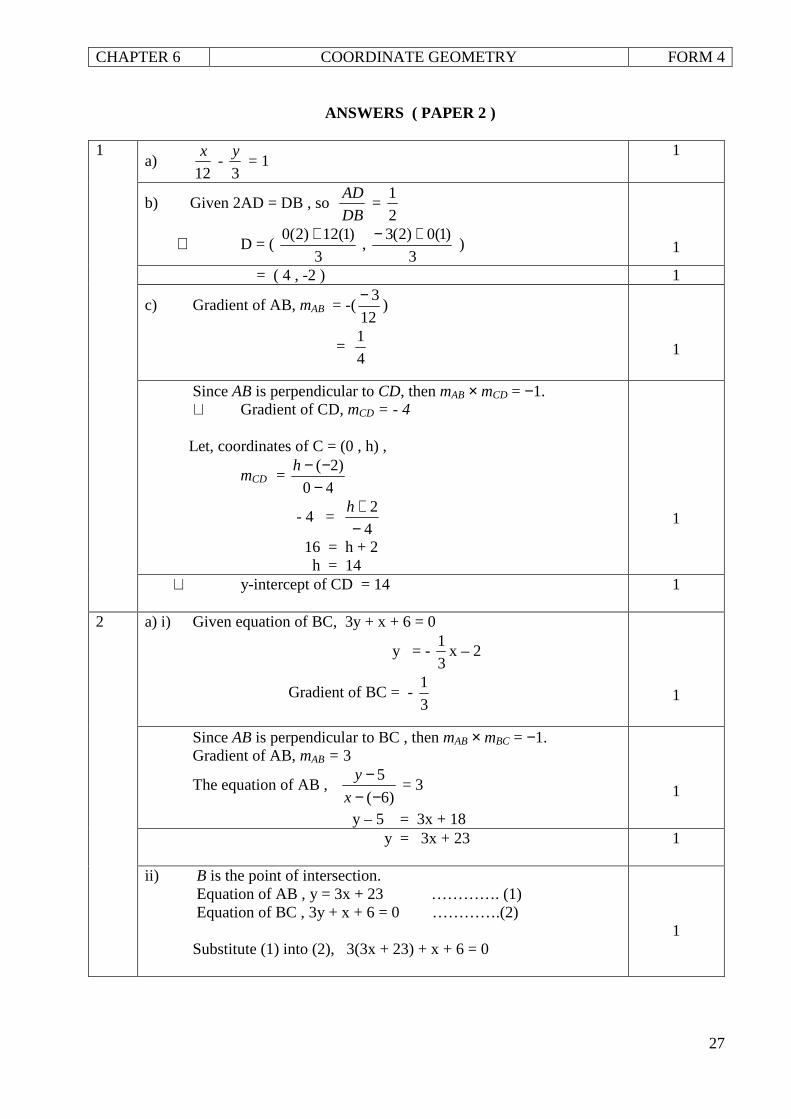
2. Solutions to this question by scale drawing will not be accepted. In the diagram the straight line BC has an equation of 3y + x + 6 = 0 and is perpendicular to straight line AB at point B.
(a) Find i) the equation of the straight line AB ii) the coordinates of B. [5 marks] (b) The straight line AB is extended to a point D such that AB : BD = 2 : 3. Find the
coordinates of D. [2 marks] (c) A point P moves such that its distance from point A is always 5 units. Find the equation of the locus of P. [3 marks]
0 x
y
D A(0 , -3)
C
B (12, 0)
A(-6, 5)
B
C
3y + x + 6 = 0
x
y
0
CHAPTER 6 COORDINATE GEOMETRY FORM 4
23
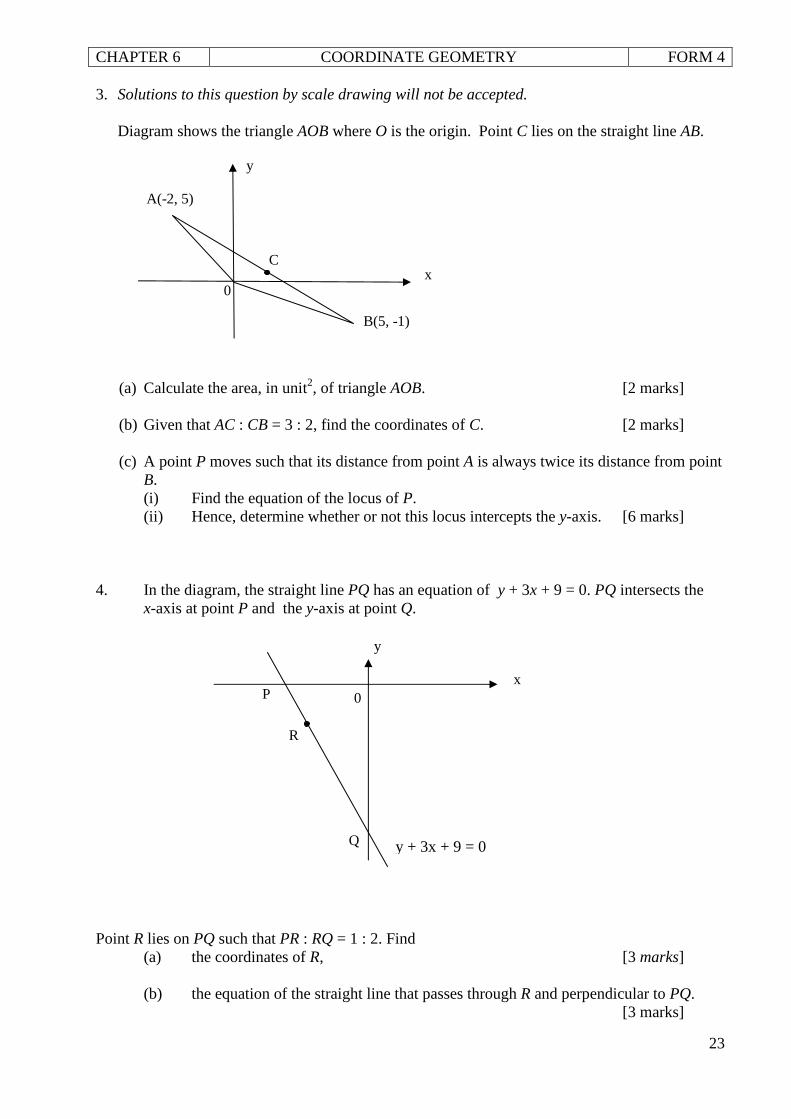
3. Solutions to this question by scale drawing will not be accepted. Diagram shows the triangle AOB where O is the origin. Point C lies on the straight line AB. (a) Calculate the area, in unit2, of triangle AOB. [2 marks] (b) Given that AC : CB = 3 : 2, find the coordinates of C. [2 marks] (c) A point P moves such that its distance from point A is always twice its distance from point
B. (i) Find the equation of the locus of P. (ii) Hence, determine whether or not this locus intercepts the y-axis. [6 marks] 4. In the diagram, the straight line PQ has an equation of y + 3x + 9 = 0. PQ intersects the
x-axis at point P and the y-axis at point Q. Point R lies on PQ such that PR : RQ = 1 : 2. Find (a) the coordinates of R, [3 marks] (b) the equation of the straight line that passes through R and perpendicular to PQ. [3 marks]
y + 3x + 9 = 0
y
x
A(-2, 5)
B(5, -1)
0
C
y
x P
Q
0
R
CHAPTER 6 COORDINATE GEOMETRY FORM 4
24
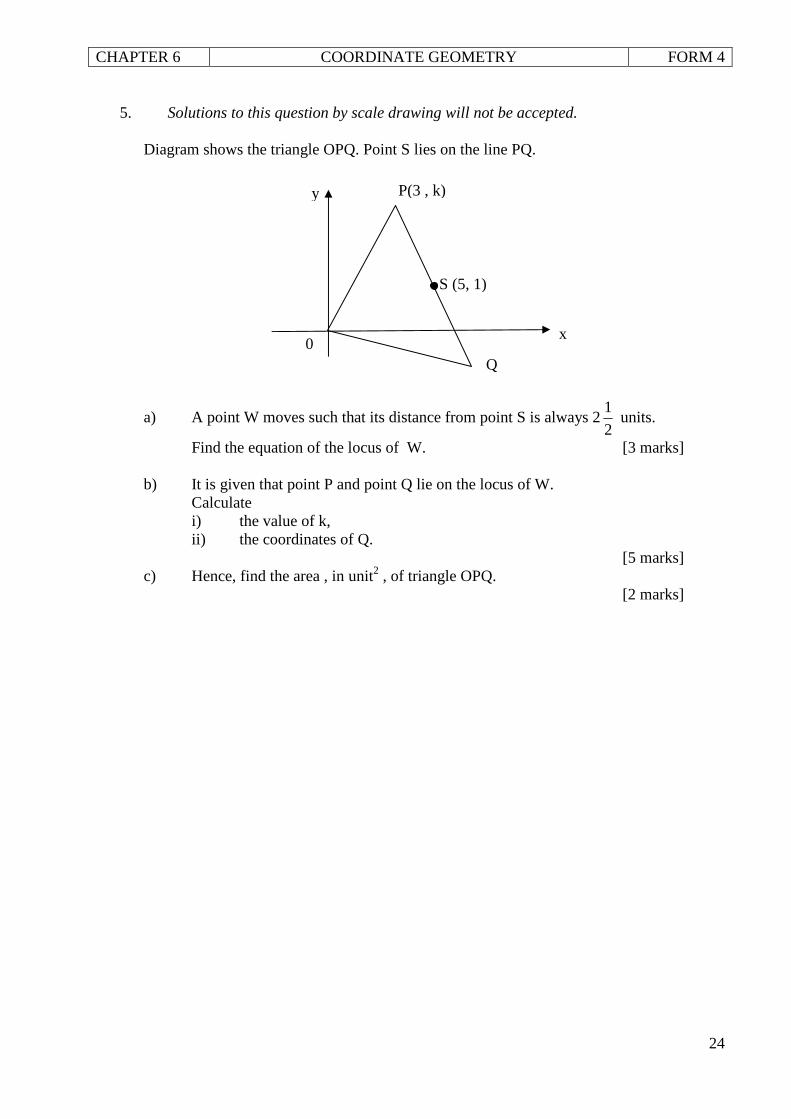
5. Solutions to this question by scale drawing will not be accepted.
Diagram shows the triangle OPQ. Point S lies on the line PQ.
a) A point W moves such that its distance from point S is always 22
1 units.
Find the equation of the locus of W. [3 marks] b) It is given that point P and point Q lie on the locus of W. Calculate
i) the value of k, ii) the coordinates of Q.
[5 marks] c) Hence, find the area , in unit2 , of triangle OPQ. [2 marks]
0 x
y P(3 , k)
S (5, 1)
Q
CHAPTER 6 COORDINATE GEOMETRY FORM 4
25
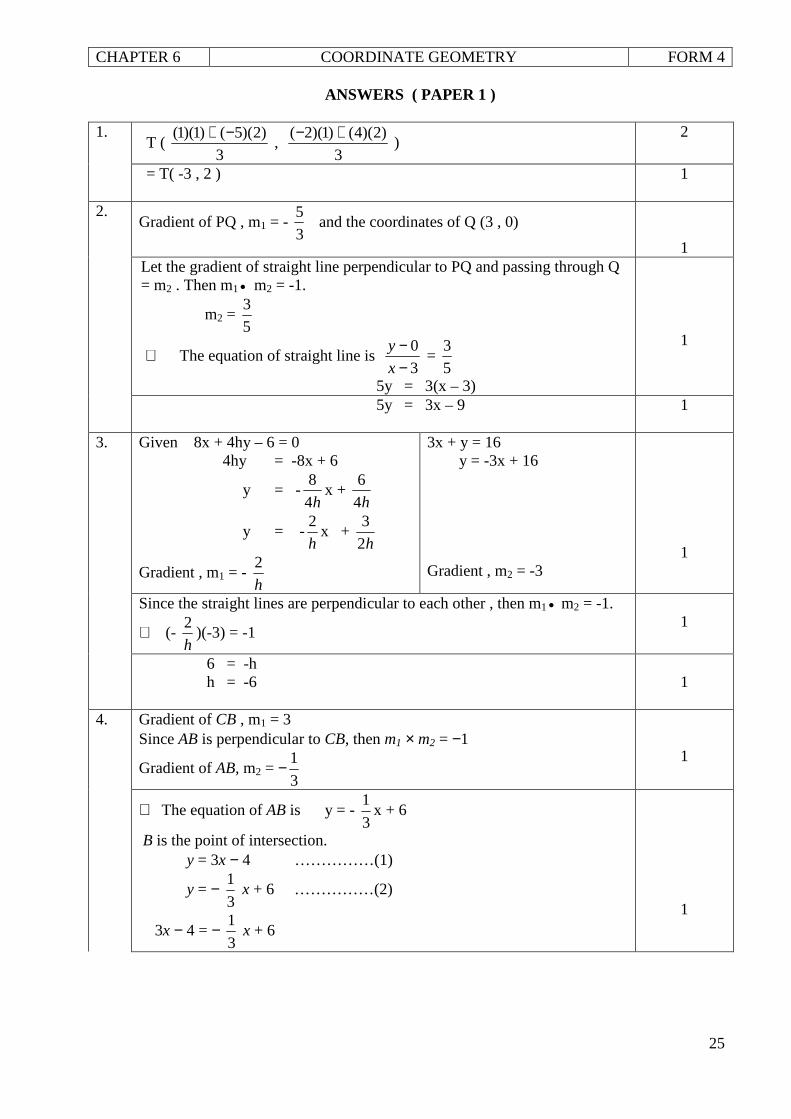
ANSWERS ( PAPER 1 ) 1.
T ( 3
)2)(5()1)(1( −+ ,
3
)2)(4()1)(2( +− )
2
= T( -3 , 2 )
1
2. Gradient of PQ , m1 = -
3
5 and the coordinates of Q (3 , 0)
1
Let the gradient of straight line perpendicular to PQ and passing through Q = m2 . Then m1• m2 = -1.
m2 = 5
3
∴ The equation of straight line is 3
0
−−
x
y =
5
3
5y = 3(x – 3)
1
5y = 3x – 9
1
3. Given 8x + 4hy – 6 = 0 4hy = -8x + 6
y = -h4
8x +
h4
6
y = -h
2x +
h2
3
Gradient , m1 = - h
2
3x + y = 16 y = -3x + 16 Gradient , m2 = -3
1
Since the straight lines are perpendicular to each other , then m1• m2 = -1.
∴ (- h
2)(-3) = -1
1
6 = -h h = -6
1
4.
Gradient of CB , m1 = 3 Since AB is perpendicular to CB, then m1 × m2 = −1
Gradient of AB, m2 = −3
1
1
∴ The equation of AB is y = - 3
1x + 6
B is the point of intersection. y = 3x − 4 ……………(1)
y = − 3
1 x + 6 ……………(2)
3x − 4 = − 3
1 x + 6
1
CHAPTER 6 COORDINATE GEOMETRY FORM 4
26
3
10 x = 10
x = 3 y = 3(3) − 4 = 5 ∴ The coordinates of B are (3, 5).
1
5.
14
x +
m
y = 1
∴ y-intercept = m = 3
1
From 14
x +
3
y = 1, the gradient m1 = -
14
3
From y = -nx , the gradient m2 = -n . Since the two straight lines are parallel , then m1 = m2
-14
3 = -n
1
∴ n = 14
3
1
6. a) From the graph given, x- intercept = 2 and y-intercept = 6.
∴The equation of AB is 2
x +
6
y = 1 .
1
b) Let the coordinates of P = (x , y) and since PA = PB 22 )0()2( −+− yx = 22 )6()0( −+− yx
(x – 2)2 + y2 = x2 + (y – 6)2 x2 – 4x + 4 + y2 = x2 + y2 – 12y + 36
1
12y – 4x -32 = 0 3y – x - 8 = 0
1
CHAPTER 6 COORDINATE GEOMETRY FORM 4
27
ANSWERS ( PAPER 2 )
1 a)
12
x -
3
y = 1
1
b) Given 2AD = DB , so DB
AD =
2
1
∴ D = ( 3
)1(12)2(0 + ,
3
)1(0)2(3 +− )
1
= ( 4 , -2 ) 1
c) Gradient of AB, mAB = -(12
3−)
= 4
1
1
Since AB is perpendicular to CD, then mAB × mCD = −1. ∴ Gradient of CD, mCD = - 4 Let, coordinates of C = (0 , h) ,
mCD = 40
)2(
−−−h
- 4 = 4
2
−+h
16 = h + 2 h = 14
1
∴ y-intercept of CD = 14
1
2 a) i) Given equation of BC, 3y + x + 6 = 0
y = - 3
1x – 2
Gradient of BC = - 3
1
1
Since AB is perpendicular to BC , then mAB × mBC = −1. Gradient of AB, mAB = 3
The equation of AB , )6(
5
−−−
x
y = 3
y – 5 = 3x + 18
1
y = 3x + 23
1
ii) B is the point of intersection. Equation of AB , y = 3x + 23 …………. (1) Equation of BC , 3y + x + 6 = 0 ………….(2) Substitute (1) into (2), 3(3x + 23) + x + 6 = 0
1
CHAPTER 6 COORDINATE GEOMETRY FORM 4
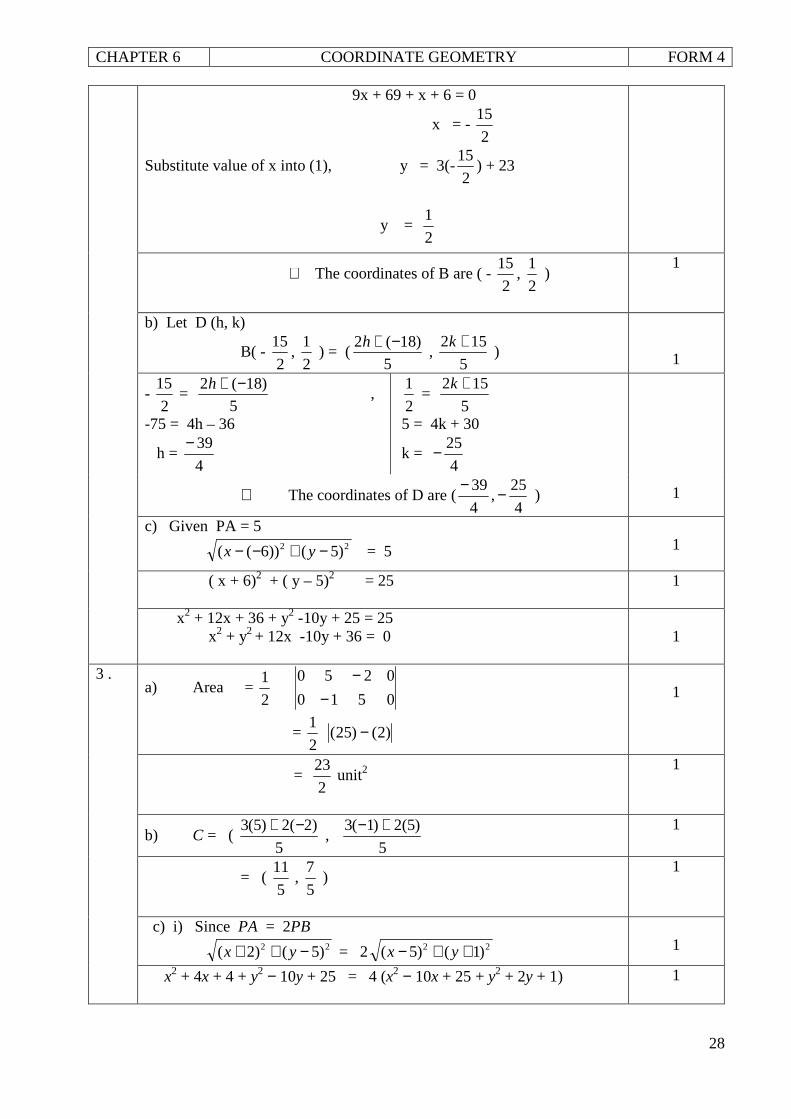
28
9x + 69 + x + 6 = 0
x = - 2
15
Substitute value of x into (1), y = 3(-2
15) + 23
y = 2
1
∴ The coordinates of B are ( - 2
15,
2
1 )
1
b) Let D (h, k)
B( - 2
15,
2
1 ) = (
5
)18(2 −+h ,
5
152 +k )
1
- 2
15 =
5
)18(2 −+h ,
-75 = 4h – 36
h = 4
39−
2
1 =
5
152 +k
5 = 4k + 30
k = 4
25−
1 ∴ The coordinates of D are (
4
39−,
4
25− )
c) Given PA = 5
22 )5())6(( −+−− yx = 5
1
( x + 6)2 + ( y – 5)2 = 25
1
x2 + 12x + 36 + y2 -10y + 25 = 25 x2 + y2 + 12x -10y + 36 = 0
1
3 .) a) Area =
2
1
0510
0250
−−
= 2
1 )2()25( −
1
= 2
23 unit2
1
b) C = ( 5
)2(2)5(3 −+ ,
5
)5(2)1(3 +−
1
= ( 5
11 ,
5
7 )
1
c) i) Since PA = 2PB
22 )5()2( −++ yx = 2 22 )1()5( ++− yx
1
x2 + 4x + 4 + y2 − 10y + 25 = 4 (x2 − 10x + 25 + y2 + 2y + 1)
1
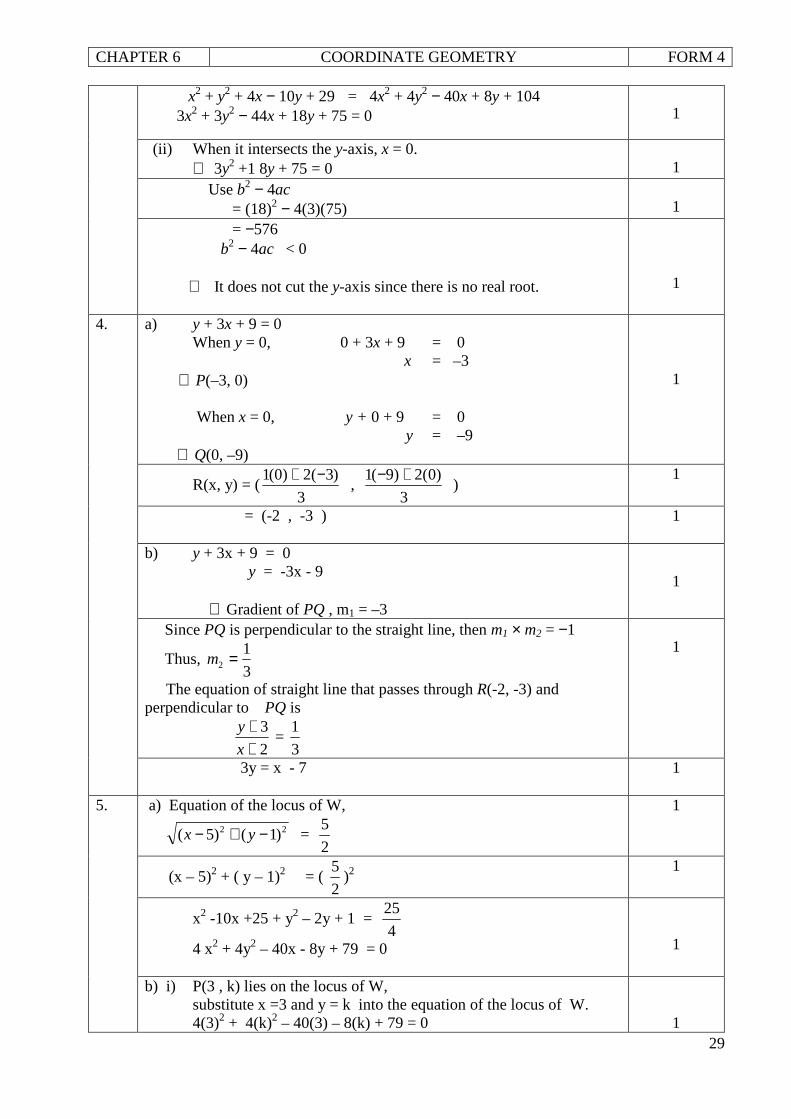
CHAPTER 6 COORDINATE GEOMETRY FORM 4
29
x2 + y2 + 4x − 10y + 29 = 4x2 + 4y2 − 40x + 8y + 104 3x2 + 3y2 − 44x + 18y + 75 = 0
1
(ii) When it intersects the y-axis, x = 0. ∴ 3y2 +1 8y + 75 = 0
1
Use b2 − 4ac = (18)2 − 4(3)(75)
1
= −576 b2 − 4ac < 0 ∴ It does not cut the y-axis since there is no real root.
1
4. a) y + 3x + 9 = 0 When y = 0, 0 + 3x + 9 = 0 x = –3 ∴ P(–3, 0) When x = 0, y + 0 + 9 = 0 y = –9 ∴ Q(0, –9)
1
R(x, y) = (3
)3(2)0(1 −+ ,
3
)0(2)9(1 +− )
1
= (-2 , -3 )
1
b) y + 3x + 9 = 0 y = -3x - 9 ∴ Gradient of PQ , m1 = –3
1
Since PQ is perpendicular to the straight line, then m1 × m2 = −1
Thus, 3
12 =m
The equation of straight line that passes through R(-2, -3) and perpendicular to PQ is
2
3
++
x
y =
3
1
1
3y = x - 7
1
5. a) Equation of the locus of W,
22 )1()5( −+− yx = 2
5
1
(x – 5)2 + ( y – 1)2 = ( 2
5)2
1
x2 -10x +25 + y2 – 2y + 1 = 4
25
4 x2 + 4y2 – 40x - 8y + 79 = 0
1
b) i) P(3 , k) lies on the locus of W, substitute x =3 and y = k into the equation of the locus of W. 4(3)2 + 4(k)2 – 40(3) – 8(k) + 79 = 0
1
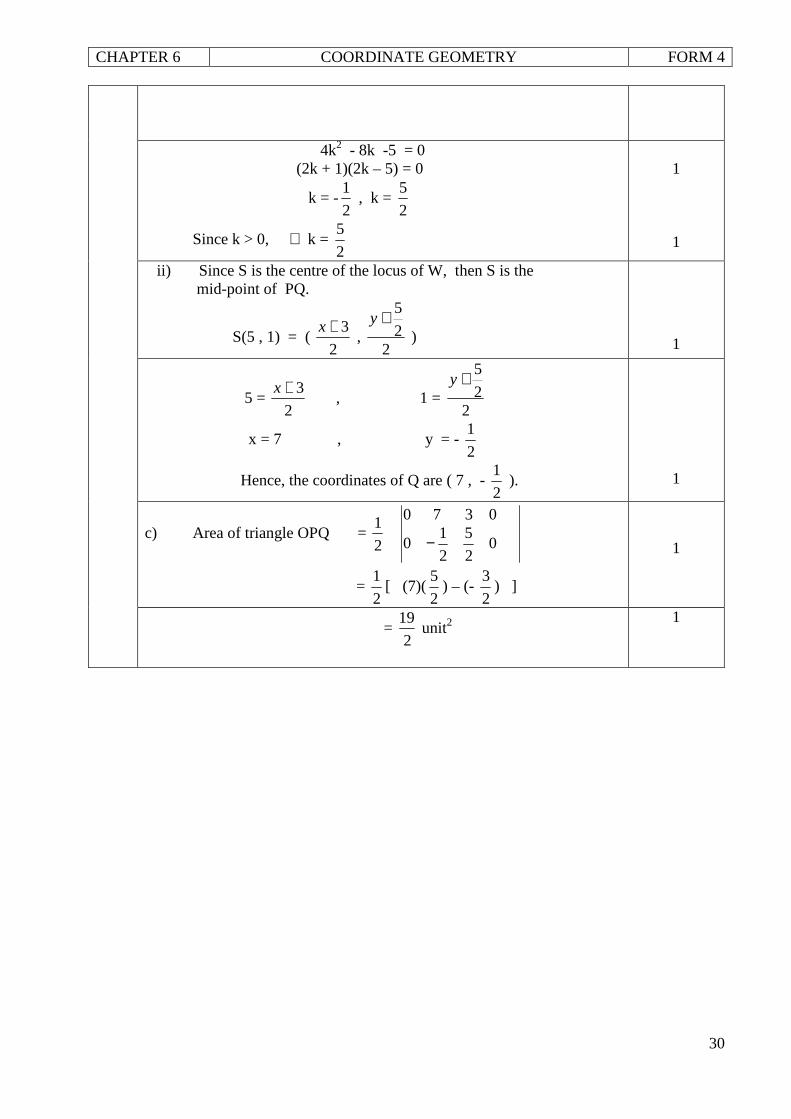
CHAPTER 6 COORDINATE GEOMETRY FORM 4
30
4k2 - 8k -5 = 0 (2k + 1)(2k – 5) = 0
k = -2
1 , k =
2
5
Since k > 0, ∴ k = 2
5
1 1
ii) Since S is the centre of the locus of W, then S is the mid-point of PQ.
S(5 , 1) = ( 2
3+x ,
22
5+y )
1
5 = 2
3+x , 1 =
22
5+y
x = 7 , y = - 2
1
Hence, the coordinates of Q are ( 7 , - 2
1 ).
1
c) Area of triangle OPQ = 2
1
02
5
2
10
0370
−
= 2
1[ (7)(
2
5) – (-
2
3) ]
1
= 2
19 unit2
1
CHAPTER 7 STATISTICS FORM 4
31
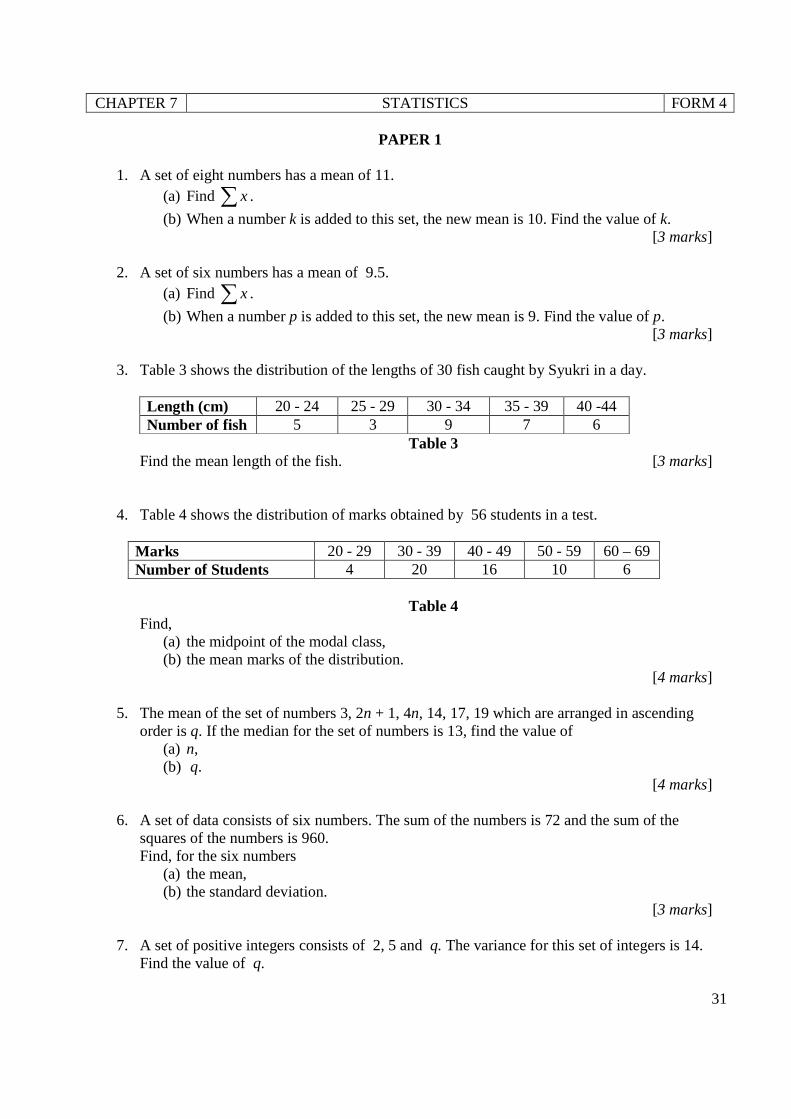
PAPER 1
1. A set of eight numbers has a mean of 11. (a) Find x∑ .
(b) When a number k is added to this set, the new mean is 10. Find the value of k. [3 marks]
2. A set of six numbers has a mean of 9.5.
(a) Find x∑ .
(b) When a number p is added to this set, the new mean is 9. Find the value of p. [3 marks]
3. Table 3 shows the distribution of the lengths of 30 fish caught by Syukri in a day.
Length (cm) 20 - 24 25 - 29 30 - 34 35 - 39 40 -44 Number of fish 5 3 9 7 6
Table 3 Find the mean length of the fish. [3 marks]
4. Table 4 shows the distribution of marks obtained by 56 students in a test.
Marks 20 - 29 30 - 39 40 - 49 50 - 59 60 – 69 Number of Students 4 20 16 10 6
Table 4 Find,
(a) the midpoint of the modal class, (b) the mean marks of the distribution.
[4 marks]
5. The mean of the set of numbers 3, 2n + 1, 4n, 14, 17, 19 which are arranged in ascending order is q. If the median for the set of numbers is 13, find the value of
(a) n, (b) q.
[4 marks]
6. A set of data consists of six numbers. The sum of the numbers is 72 and the sum of the squares of the numbers is 960. Find, for the six numbers
(a) the mean, (b) the standard deviation.
[3 marks]
7. A set of positive integers consists of 2, 5 and q. The variance for this set of integers is 14. Find the value of q.
CHAPTER 7 STATISTICS FORM 4
32
[3 marks]
8. The mean of eight numbers is p. The sum of the squares of the numbers is 200 and the standard deviation is 4m. Express p in terms of m.
[3 marks]
9. Given a set of numbers 5, 12, 17, 19 and 20. Find the standard deviation of the numbers. [3 marks]
10. The sum of 8 numbers is 120 and the sum of the squares of these eight numbers is 2 200.
(a) Find the variance of the eight numbers. (b) Two numbers with the values 6 and 12 are added to the eight numbers. Find the new
mean of the 10 numbers. [4 marks]
PAPER 2
1. A set of data consists of 11 numbers. The sum of the numbers is 176 and the sum of the squares of the numbers is 3212.
(a) Find the mean and variance of the 11 numbers
[3 marks] (b) Another number is added to the set of data and the mean is increased by 2.
Find (i) the value of this number, (ii) the standard deviation of the set of 12 numbers. [4 marks]
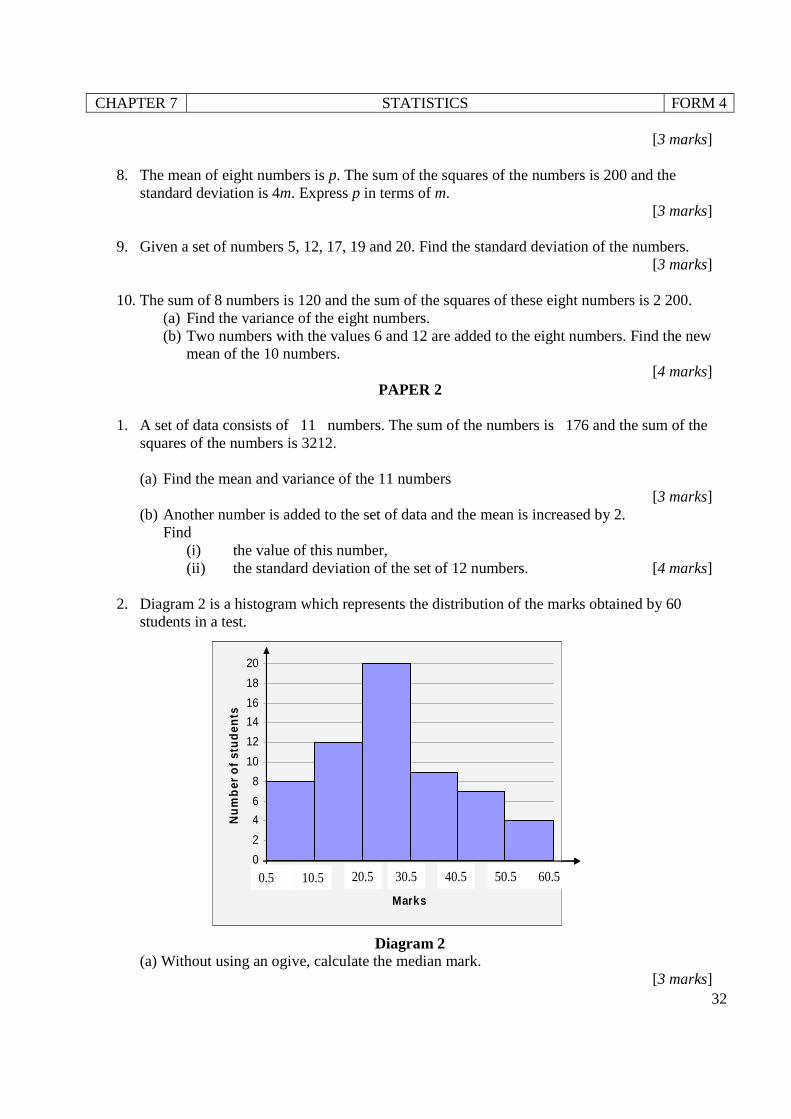
2. Diagram 2 is a histogram which represents the distribution of the marks obtained by 60
students in a test.
Diagram 2 (a) Without using an ogive, calculate the median mark.
[3 marks]
0
2
4
6
8
10
12
14
16
18
20
1
Marks
Nu
mb
er o
f st
ud
ents
0.5 10.5 20.5 30.5 40.5 50.5 60.50
2
4
6
8
10
12
14
16
18
20
1
Marks
Nu
mb
er o
f st
ud
ents
0.5 10.5 20.5 30.5 40.5 50.5 60.5
CHAPTER 7 STATISTICS FORM 4
33
(b) Calculate the standard deviation of the distribution. [4 marks]
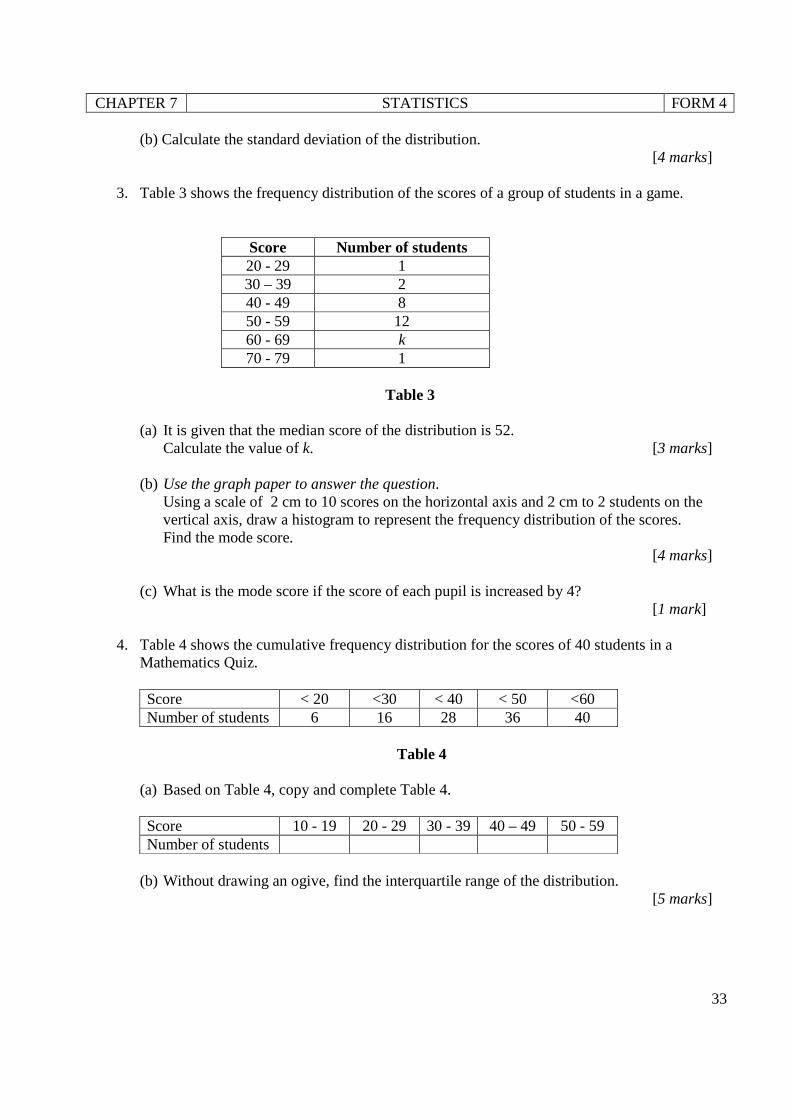
3. Table 3 shows the frequency distribution of the scores of a group of students in a game.
Score Number of students 20 - 29 1 30 – 39 2 40 - 49 8 50 - 59 12 60 - 69 k 70 - 79 1
Table 3
(a) It is given that the median score of the distribution is 52.
Calculate the value of k. [3 marks] (b) Use the graph paper to answer the question.
Using a scale of 2 cm to 10 scores on the horizontal axis and 2 cm to 2 students on the vertical axis, draw a histogram to represent the frequency distribution of the scores. Find the mode score.
[4 marks] (c) What is the mode score if the score of each pupil is increased by 4?
[1 mark]
4. Table 4 shows the cumulative frequency distribution for the scores of 40 students in a Mathematics Quiz.
Score < 20 <30 < 40 < 50 <60 Number of students 6 16 28 36 40
Table 4
(a) Based on Table 4, copy and complete Table 4.
Score 10 - 19 20 - 29 30 - 39 40 – 49 50 - 59 Number of students
(b) Without drawing an ogive, find the interquartile range of the distribution.
[5 marks]
CHAPTER 7 STATISTICS FORM 4
34
ANSWER
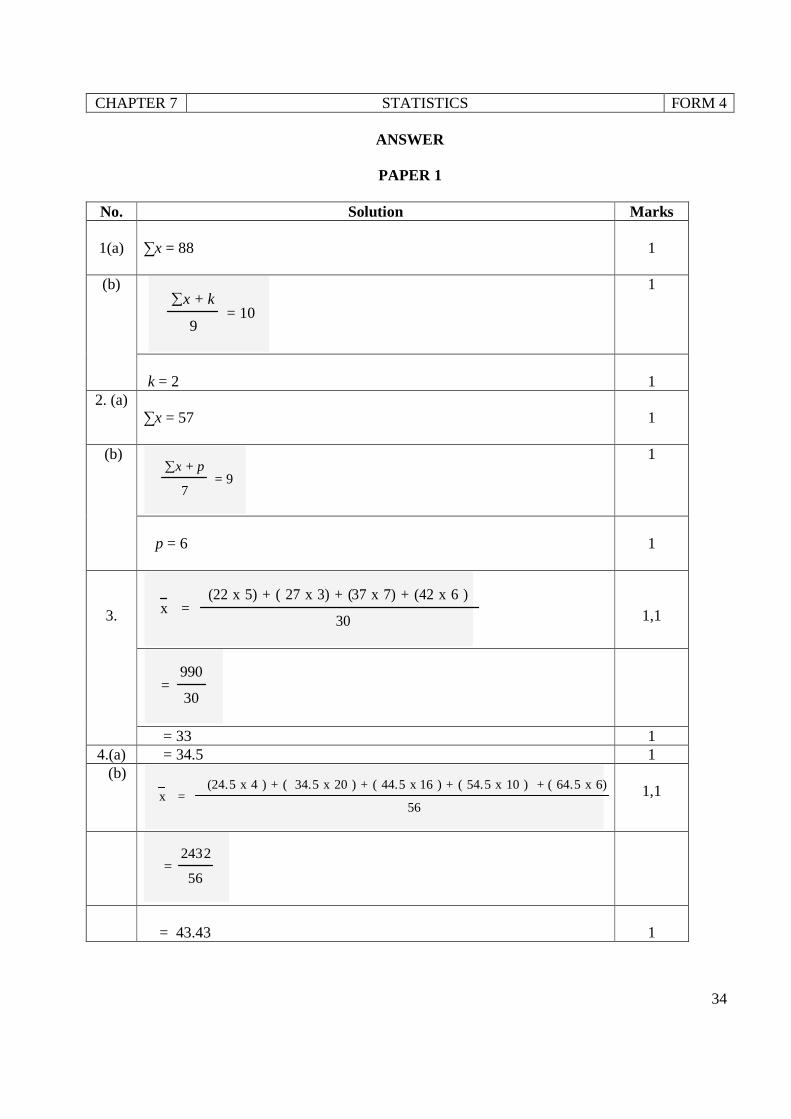
PAPER 1 No. Solution Marks
1(a)
∑x = 88
1
(b)
∑x + k
9 = 10
1
k = 2
1
2. (a) ∑x = 57
1
(b) ∑x + p
7 = 9
1
p = 6
1
3. x = (22 x 5) + ( 27 x 3) + (37 x 7) + (42 x 6 )
30
1,1
= 990
30
= 33 1 4.(a) = 34.5 1 (b)
x = (24.5 x 4 ) + ( 34.5 x 20 ) + ( 44.5 x 16 ) + ( 54.5 x 10 ) + ( 64.5 x 6)
56
1,1
= 2432
56
= 43.43
1
CHAPTER 7 STATISTICS FORM 4
35
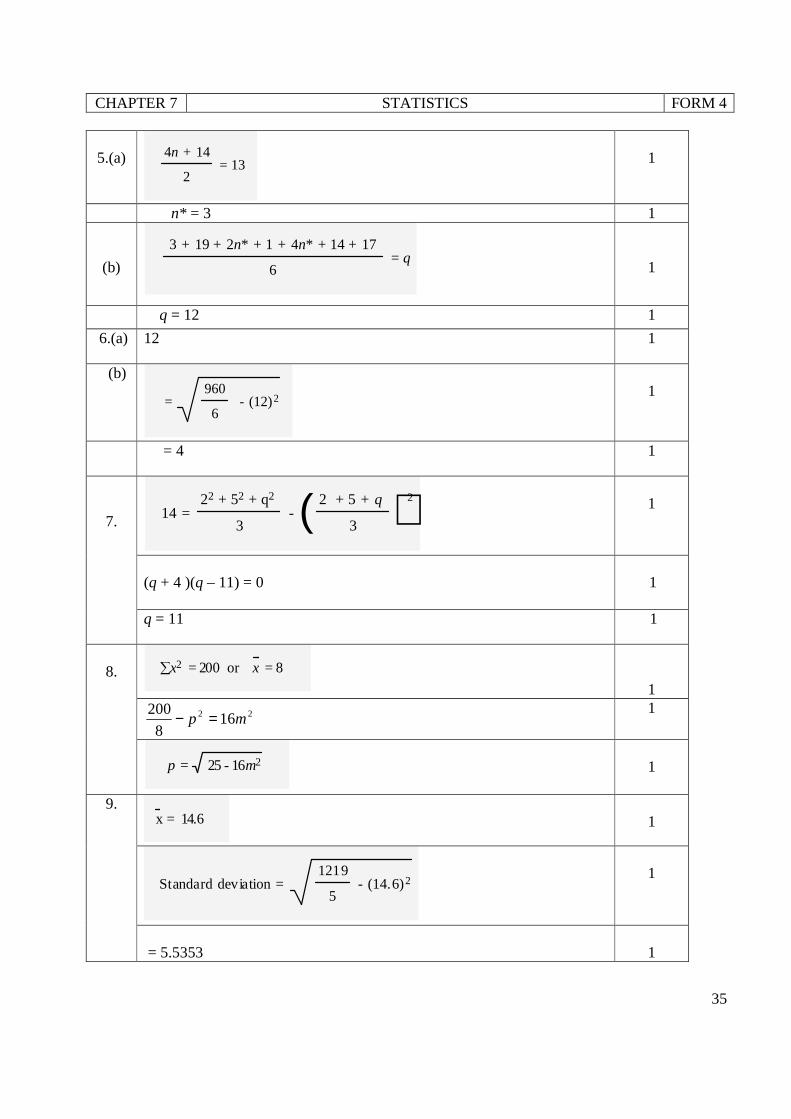
5.(a) 4n + 14
2 = 13
1
n* = 3 1
(b)
3 + 19 + 2n* + 1 + 4n* + 14 + 17
6 = q
1
q = 12 1
6.(a) 12 1
(b)
= 960
6 - (12)2
1
= 4 1
7. 14 = 22 + 52 + q2
3 -
2 + 5 + q
3( )2
1
(q + 4 )(q – 11) = 0
1
q = 11 1
8. ∑x2 = 200 or x = 8
1
22 168
200mp =−
1
p = 25 - 16m2
1
9. x = 14.6
1
Standard deviation = 1219
5 - (14.6)2
1
= 5.5353
1
CHAPTER 7 STATISTICS FORM 4
36
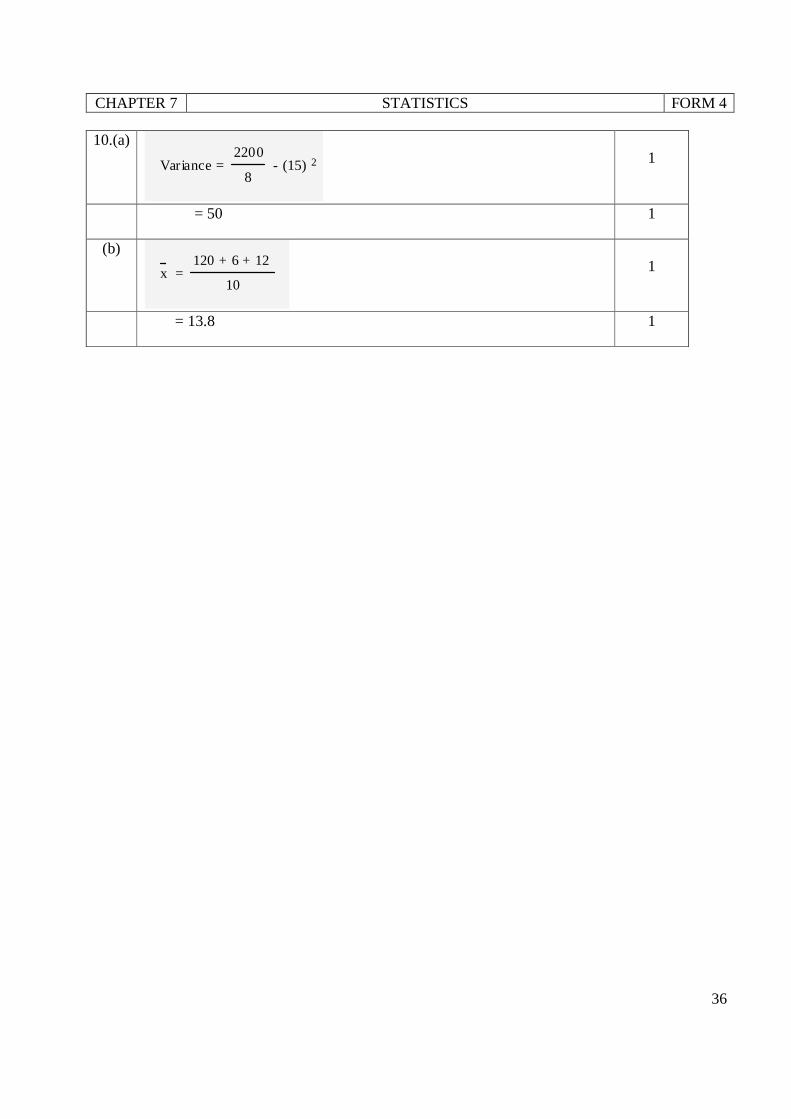
10.(a)
Variance = 2200
8 - (15) 2
1
= 50 1
(b)
x = 120 + 6 + 12
10
1
= 13.8 1
CHAPTER 7 STATISTICS FORM 4
37
PAPER 2
No. Solution Marks
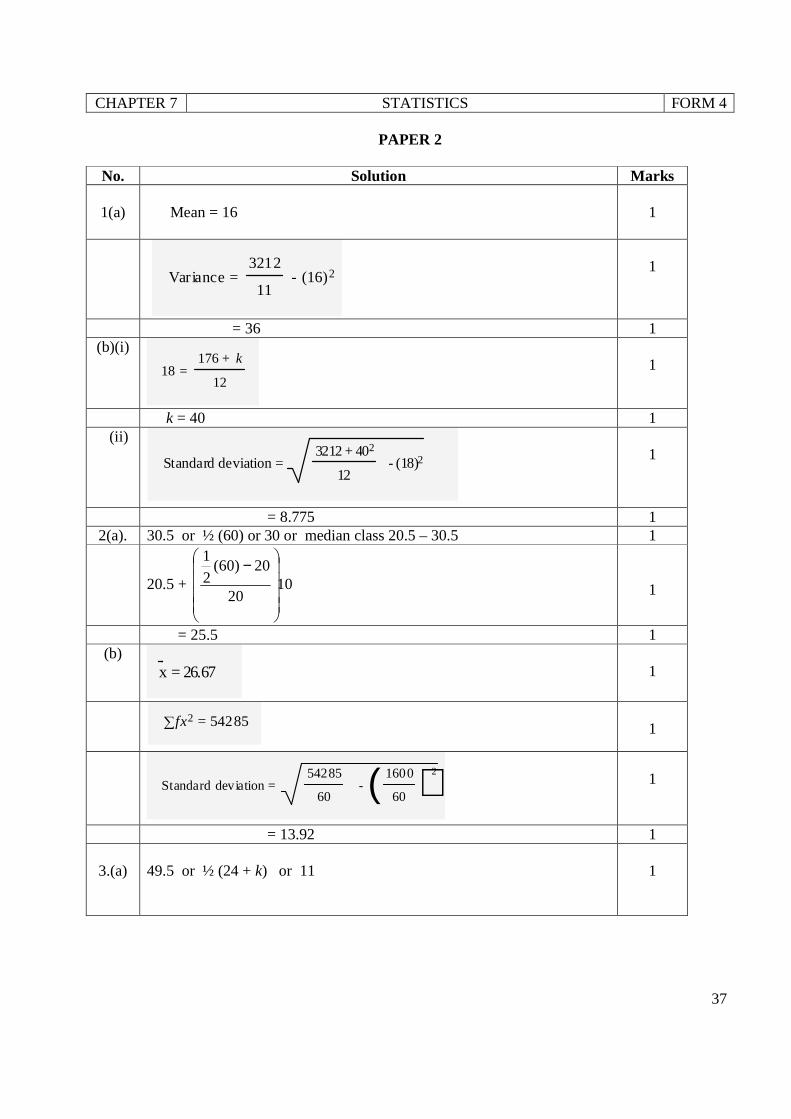
1(a) Mean = 16
1
Variance = 3212
11 - (16)2
1
= 36 1 (b)(i)
18 = 176 + k
12
1
k = 40 1 (ii)
Standard deviation = 3212 + 402
12 - (18)2
1
= 8.775 1 2(a). 30.5 or ½ (60) or 30 or median class 20.5 – 30.5 1
20.5 + 1020
20)60(2
1
−
1
= 25.5 1 (b)
x = 26.67
1
∑fx2 = 54285
1
Standard deviation = 54285
60 -
1600
60( )2
1
= 13.92 1
3.(a) 49.5 or ½ (24 + k) or 11
1
CHAPTER 7 STATISTICS FORM 4
38
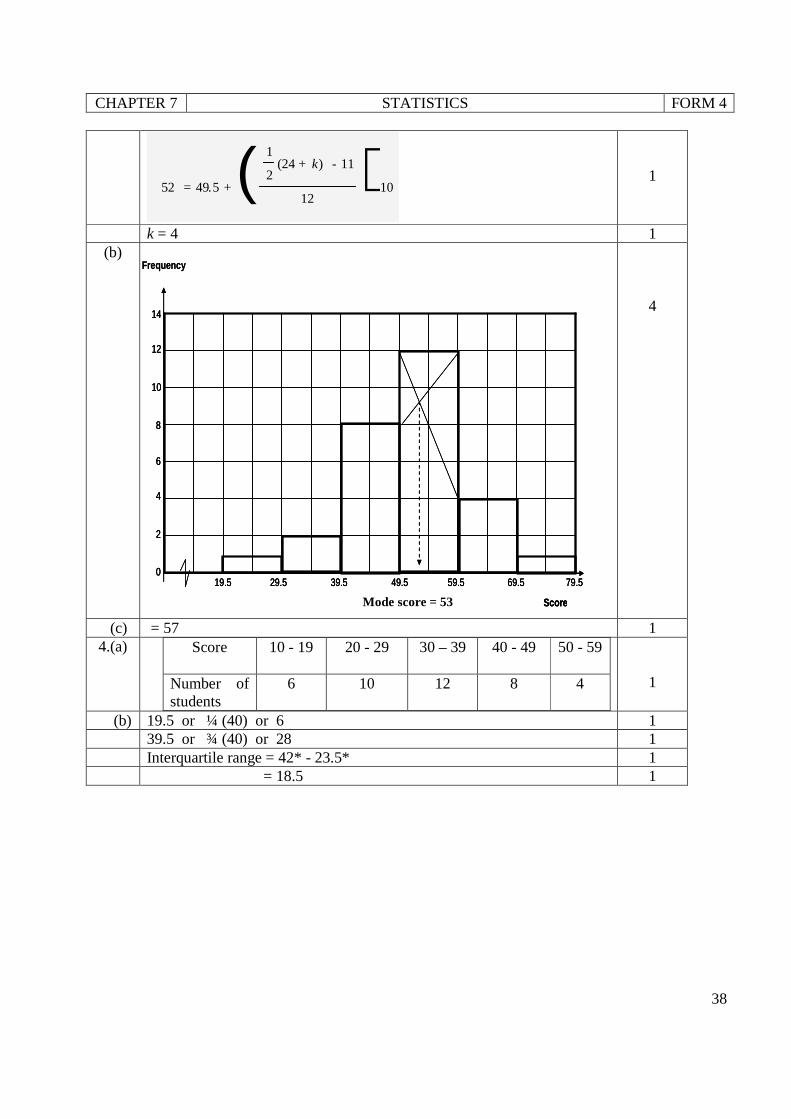
52 = 49.5 +
1
2(24 + k) - 11
12( )10
1
k = 4 1 (b)
4
(c) = 57 1 4.(a) Score 10 - 19 20 - 29 30 – 39
40 - 49 50 - 59
Number of students
6 10 12 8 4
1
(b) 19.5 or ¼ (40) or 6 1 39.5 or ¾ (40) or 28 1 Interquartile range = 42* - 23.5* 1 = 18.5 1
Frequency
19.5 29.5 39.5 49.5 59.5 69.5 79.5
Score
0
14
12
10
8
6
4
2
Frequency
19.5 29.5 39.5 49.5 59.5 69.5 79.5
Score
0
14
12
10
8
6
4
2
19.5 29.5 39.5 49.5 59.5 69.5 79.5
Score
0
14
12
10
8
6
4
2
Mode score = 53
CHAPTER 8 CIRCULAR MEASURE FORM 4
39
PAPER 1
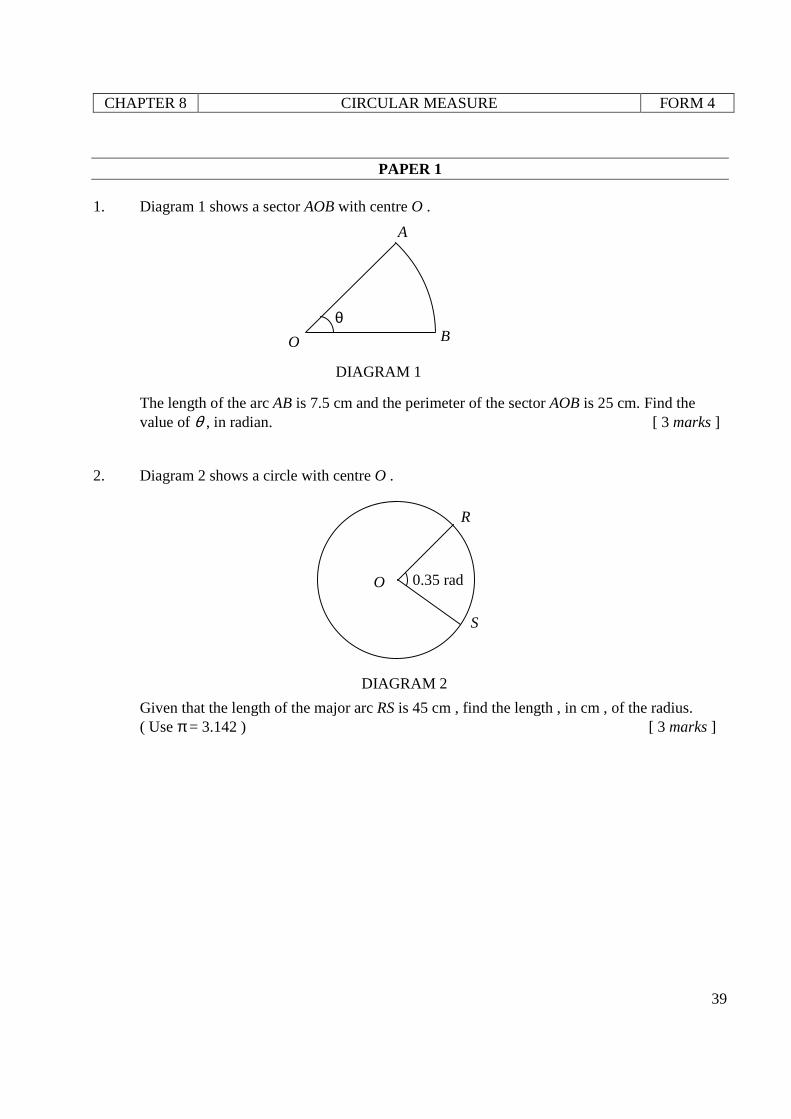
1. Diagram 1 shows a sector AOB with centre O . The length of the arc AB is 7.5 cm and the perimeter of the sector AOB is 25 cm. Find the value of θ , in radian. [ 3 marks ] 2. Diagram 2 shows a circle with centre O . Given that the length of the major arc RS is 45 cm , find the length , in cm , of the radius. ( Use π = 3.142 ) [ 3 marks ]
O
A
B θ
DIAGRAM 1
O
R
S
0.35 rad
DIAGRAM 2
CHAPTER 8 CIRCULAR MEASURE FORM 4
40
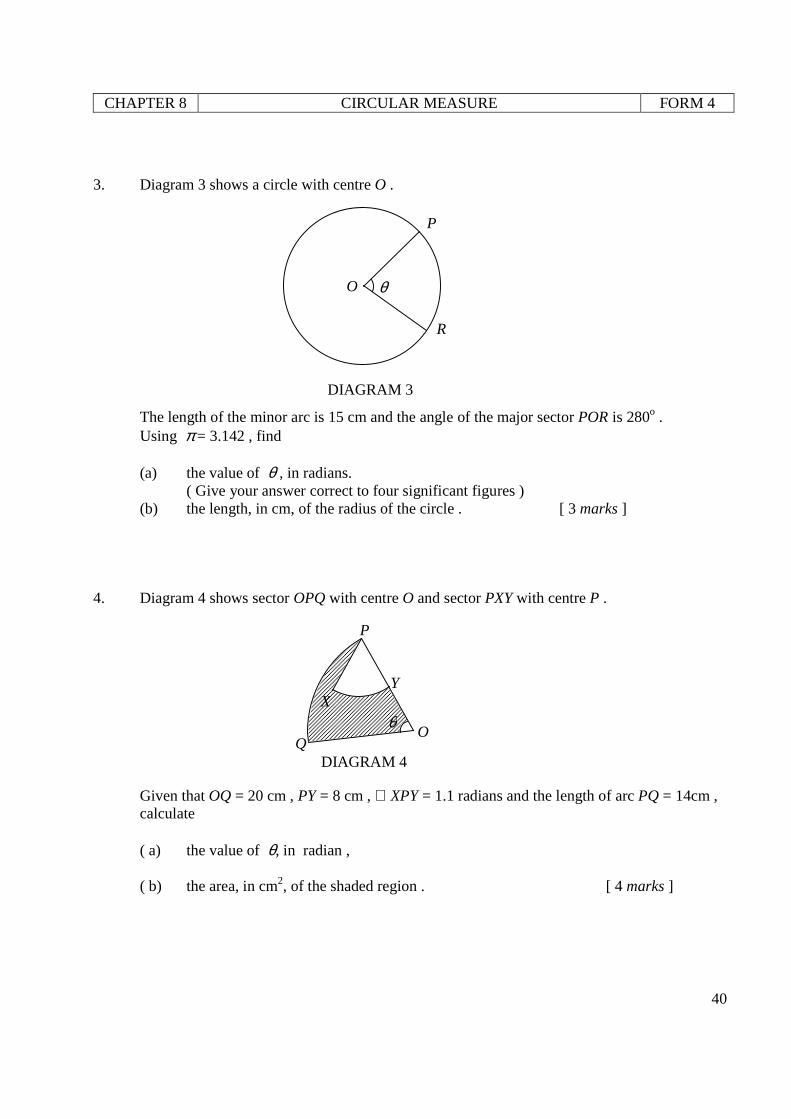
3. Diagram 3 shows a circle with centre O . The length of the minor arc is 15 cm and the angle of the major sector POR is 280o . Using π = 3.142 , find
(a) the value of θ , in radians. ( Give your answer correct to four significant figures ) (b) the length, in cm, of the radius of the circle . [ 3 marks ] 4. Diagram 4 shows sector OPQ with centre O and sector PXY with centre P . Given that OQ = 20 cm , PY = 8 cm , ∠ XPY = 1.1 radians and the length of arc PQ = 14cm , calculate ( a) the value of θ, in radian , ( b) the area, in cm2, of the shaded region . [ 4 marks ]
O
P
R
θ
DIAGRAM 3
P
Y
Q O
θ
DIAGRAM 4
X
CHAPTER 8 CIRCULAR MEASURE FORM 4
41
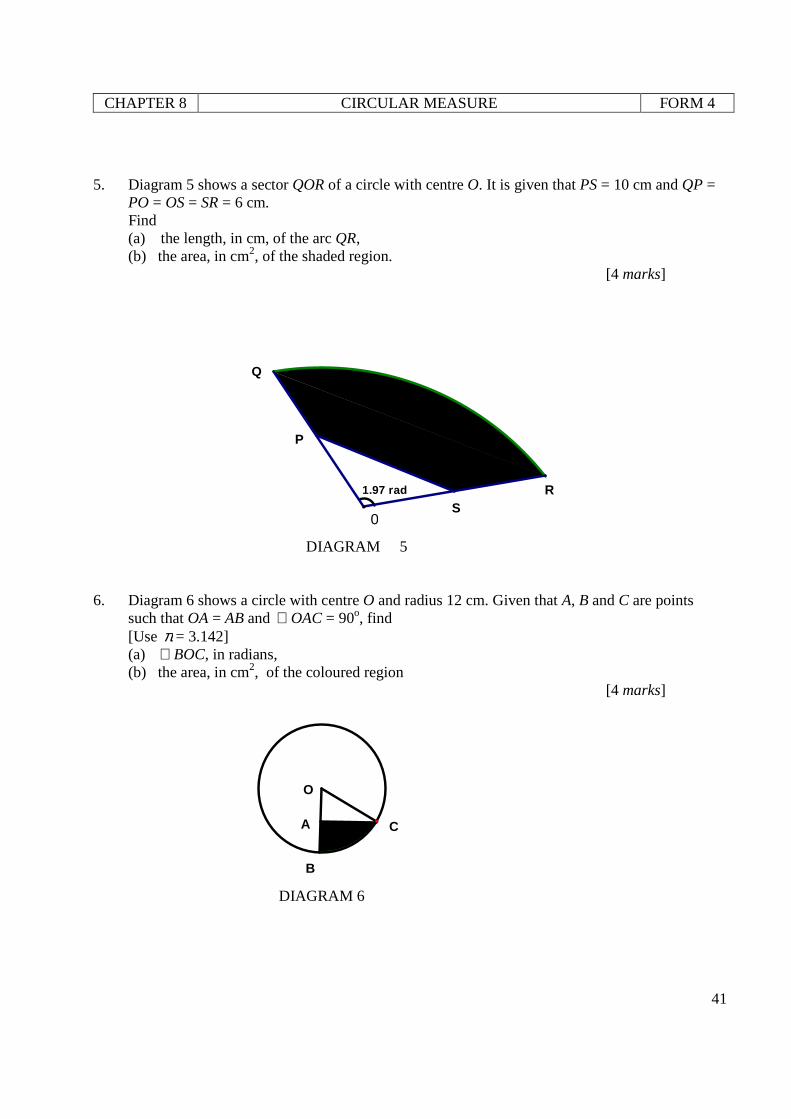
5. Diagram 5 shows a sector QOR of a circle with centre O. It is given that PS = 10 cm and QP =
PO = OS = SR = 6 cm. Find (a) the length, in cm, of the arc QR, (b) the area, in cm2, of the shaded region. [4 marks]
SR
P
Q
1.97 rad
0
DIAGRAM 5 6. Diagram 6 shows a circle with centre O and radius 12 cm. Given that A, B and C are points
such that OA = AB and ∠ OAC = 90o, find [Use π = 3.142] (a) ∠ BOC, in radians, (b) the area, in cm2, of the coloured region [4 marks]
C
B
A
O
DIAGRAM 6
CHAPTER 8 CIRCULAR MEASURE FORM 4
42
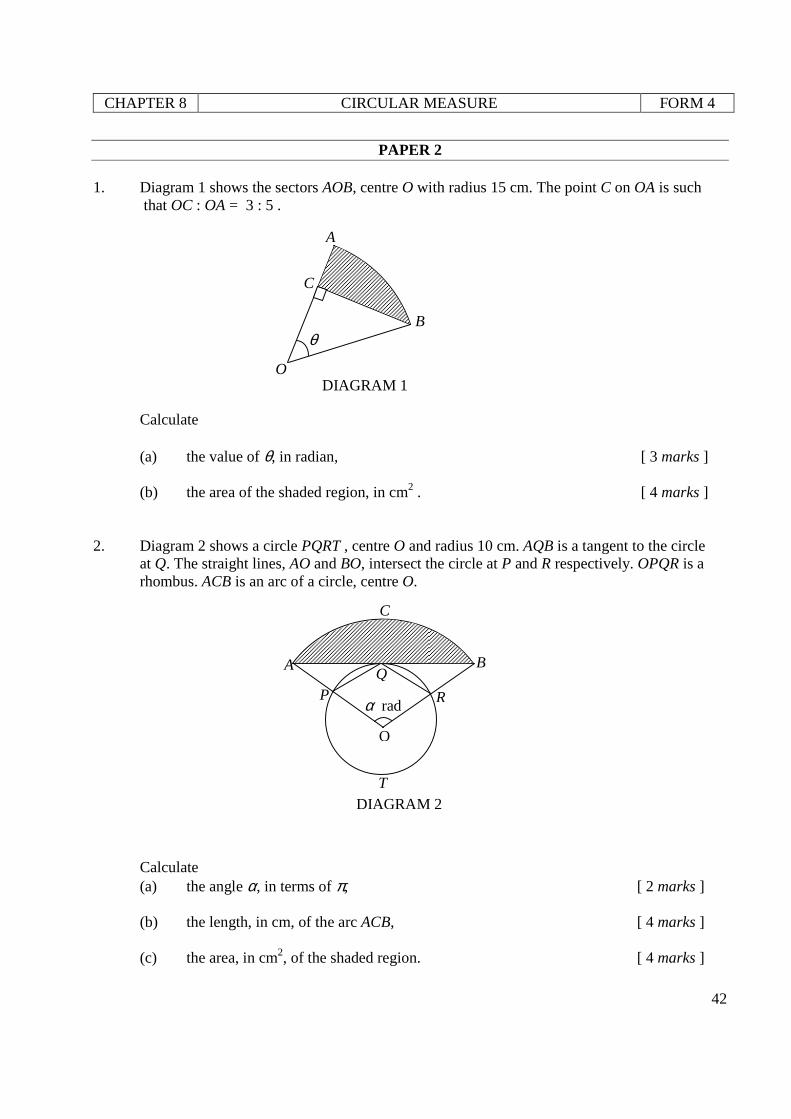
PAPER 2 1. Diagram 1 shows the sectors AOB, centre O with radius 15 cm. The point C on OA is such that OC : OA = 3 : 5 . Calculate
(a) the value of θ, in radian, [ 3 marks ] (b) the area of the shaded region, in cm2 . [ 4 marks ] 2. Diagram 2 shows a circle PQRT , centre O and radius 10 cm. AQB is a tangent to the circle at Q. The straight lines, AO and BO, intersect the circle at P and R respectively. OPQR is a rhombus. ACB is an arc of a circle, centre O. Calculate
(a) the angle α, in terms of π, [ 2 marks ]
(b) the length, in cm, of the arc ACB, [ 4 marks ]
(c) the area, in cm2, of the shaded region. [ 4 marks ]
O
C
B θ
DIAGRAM 1
A
O
α rad
Q
R P
A
C
B
T DIAGRAM 2
CHAPTER 8 CIRCULAR MEASURE FORM 4
43
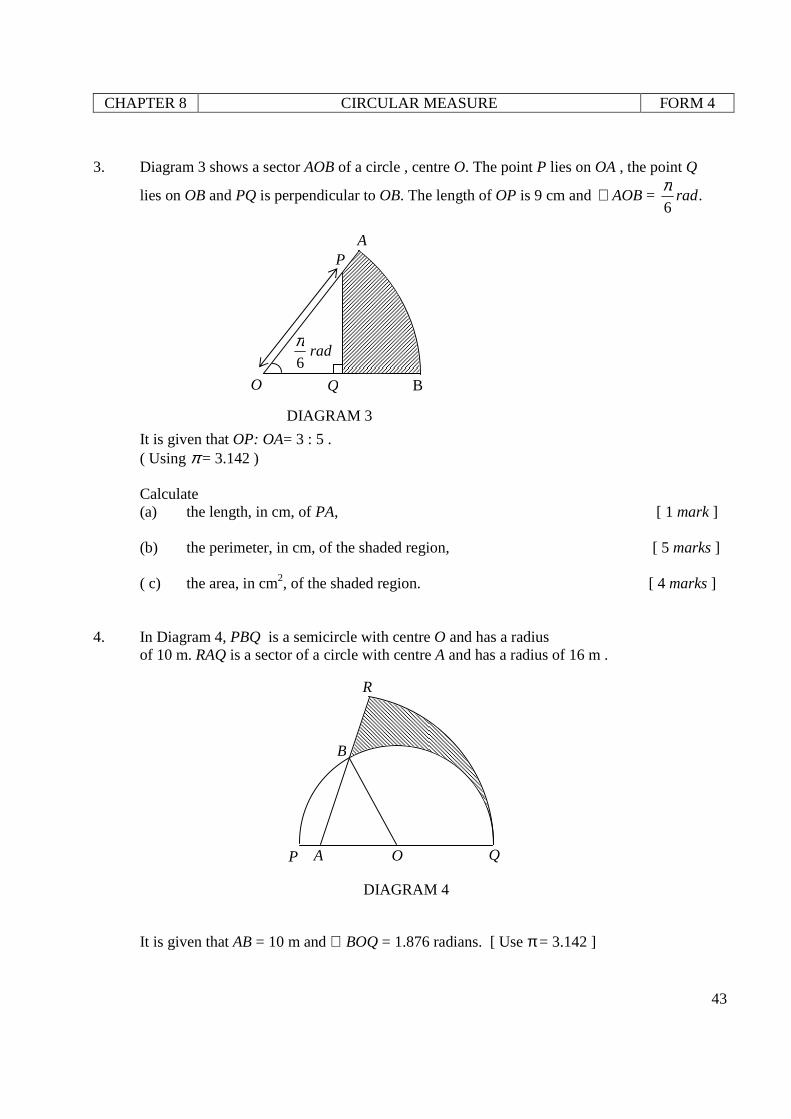
3. Diagram 3 shows a sector AOB of a circle , centre O. The point P lies on OA , the point Q
lies on OB and PQ is perpendicular to OB. The length of OP is 9 cm and ∠ AOB = .6
radπ
It is given that OP: OA= 3 : 5 . ( Using π = 3.142 ) Calculate (a) the length, in cm, of PA, [ 1 mark ]
(b) the perimeter, in cm, of the shaded region, [ 5 marks ] ( c) the area, in cm2, of the shaded region. [ 4 marks ] 4. In Diagram 4, PBQ is a semicircle with centre O and has a radius of 10 m. RAQ is a sector of a circle with centre A and has a radius of 16 m . It is given that AB = 10 m and ∠ BOQ = 1.876 radians. [ Use π = 3.142 ]
O
P A
B Q
rad6
π
DIAGRAM 3
P A O Q
R
B
DIAGRAM 4
CHAPTER 8 CIRCULAR MEASURE FORM 4
44
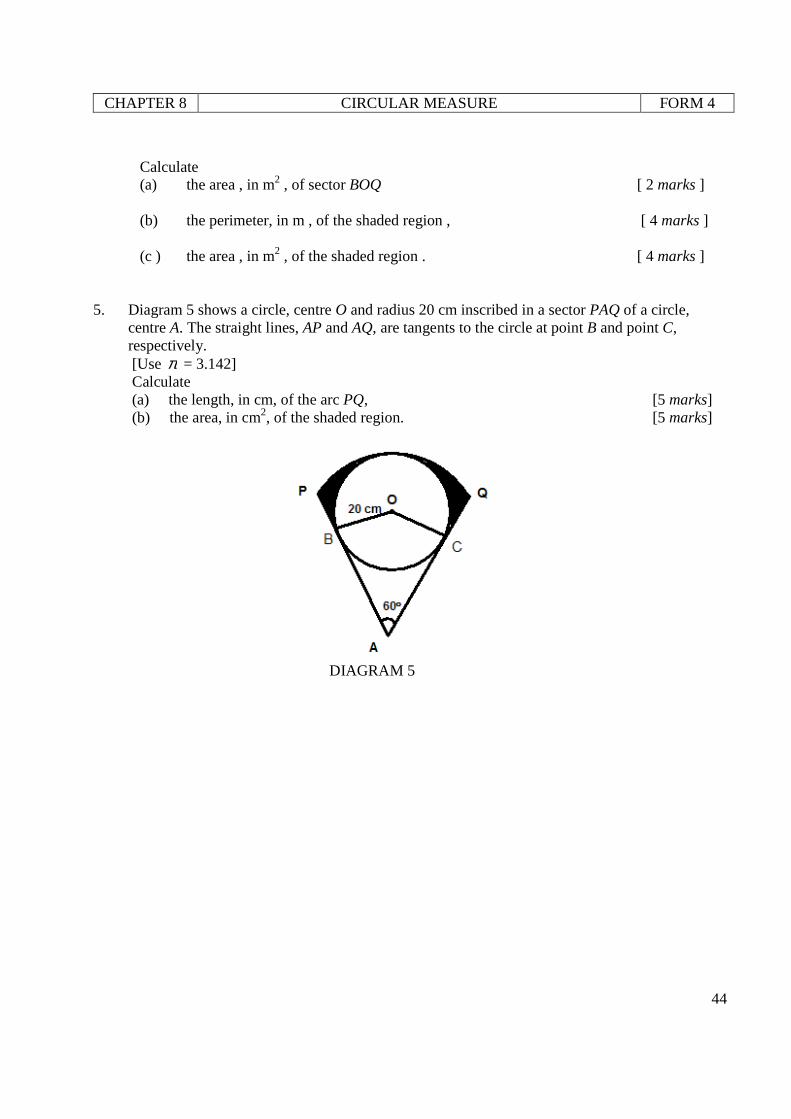
Calculate (a) the area , in m2 , of sector BOQ [ 2 marks ] (b) the perimeter, in m , of the shaded region , [ 4 marks ] (c ) the area , in m2 , of the shaded region . [ 4 marks ] 5. Diagram 5 shows a circle, centre O and radius 20 cm inscribed in a sector PAQ of a circle,
centre A. The straight lines, AP and AQ, are tangents to the circle at point B and point C, respectively.
[Use π = 3.142] Calculate (a) the length, in cm, of the arc PQ, [5 marks] (b) the area, in cm2, of the shaded region. [5 marks]
DIAGRAM 5
CHAPTER 8 CIRCULAR MEASURE FORM 4
45
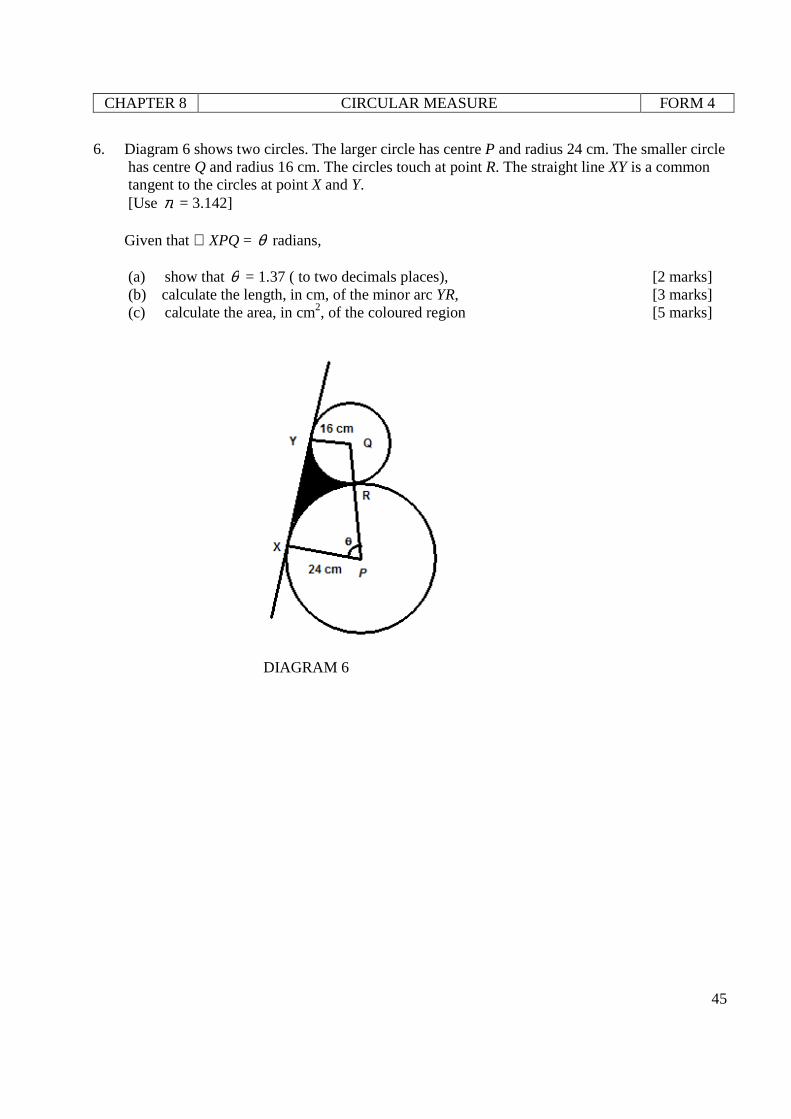
6. Diagram 6 shows two circles. The larger circle has centre P and radius 24 cm. The smaller circle has centre Q and radius 16 cm. The circles touch at point R. The straight line XY is a common tangent to the circles at point X and Y.
[Use π = 3.142] Given that ∠ XPQ = θ radians, (a) show that θ = 1.37 ( to two decimals places), [2 marks] (b) calculate the length, in cm, of the minor arc YR, [3 marks] (c) calculate the area, in cm2, of the coloured region [5 marks]
DIAGRAM 6
CHAPTER 8 CIRCULAR MEASURE FORM 4
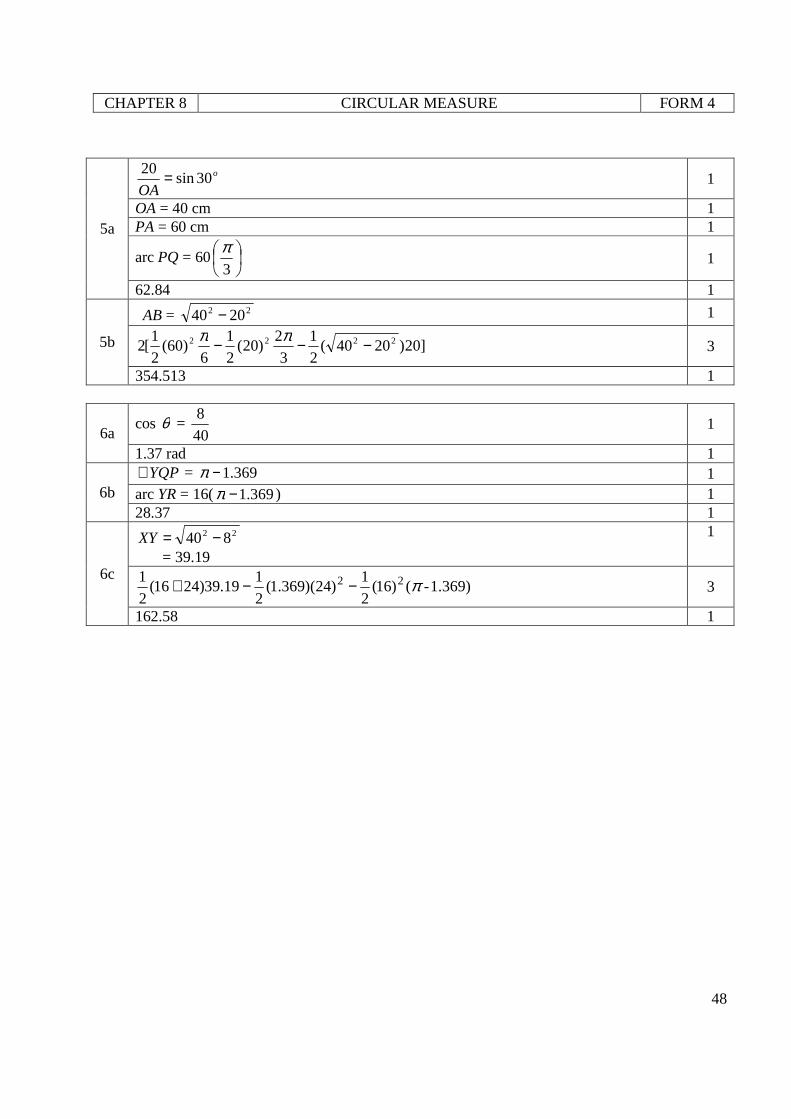
46
ANSWERS (PAPER 1)
1 2
5.725 −=OA 1
7.5 = 8.75θ 1 8571.0=θ 1
2 35.02 −= πθ 1
)35.02(45 −= πr 1 r = 7.583 1
3a 396.1=θ 1
3b 396.1
15=r 1
r = 10.74 1 4a rad7.0=θ 1
4b
)7.0()20(2
1 2 or )1.1()8(2
1 2 1
)1.1()8(2
1)7.0()20(
2
1 22 − 1
104.8 1 5a 23.64 cm 1
5b
97.1)12(2
1 2 or rad97.1sin)6(2
1 2 1
rad97.1sin)6(2
197.1)12(
2
1 22 − 1
125.26 1
6a 1.047 rad or rad3
π 1
6b
047.1)12(2
1 2 or 6)612(2
1 22 − 1
6)612(2
1047.1)12(
2
1 222 −− 1
44.21 1
CHAPTER 8 CIRCULAR MEASURE FORM 4
47
ANSWERS (PAPER 2)
1a 15
9cos =θ 1
9273.0=θ rad. 2
1b
BC = 12
)9)(12(2
1)9273.0(15
2
1 2 − 3
50.32 1
2a 120O 1
π3
2 rad 1
2b
o
OB60cos
10 = 1
OB = 20 cm 1
arc ACB = 20
π3
2 1
41.89 1
2c o120sin)20(
2
1
3
2)20(
2
1 22 −π 3
245.72 1 3a PA = 6 cm 1
3b 9sin30o + (15 − 9cos30o ) + 15 )
6(π
+ 6 4
25.56 1
3c
PQ = 4.5 cm , OQ = 9cos 30o
)30cos9)(5.4(2
1
6)15(
2
1 2 o−π 3
41.38 1
4a 876.1)10(
2
1 2 1
93.8 1
4b 10(1.876) + 16 )876.1( −π + 6 3 45.016 1
4c )91)(6(
2
1876.1)10(
2
1)876.1()16(
2
1 22 −−−π 3
39.63 1
CHAPTER 8 CIRCULAR MEASURE FORM 4
48
5a
o
OA30sin
20 = 1
OA = 40 cm 1 PA = 60 cm 1
arc PQ = 60
3
π 1
62.84 1
5b
AB = 22 2040 − 1
]20)2040(2
1
3
2)20(
2
1
6)60(
2
1[2 2222 −−− ππ
3
354.513 1
6a cos θ =
40
8 1
1.37 rad 1
6b YQP∠ = 369.1−π 1
arc YR = 16( 369.1−π ) 1 28.37 1
6c
22 840 −=XY = 39.19
1
1.369)-()16(2
1)24)(369.1(
2
119.39)2416(
2
1 22 π−−+ 3
162.58 1
CHAPTER 9 DIFFERENTIATION FORM 4
49
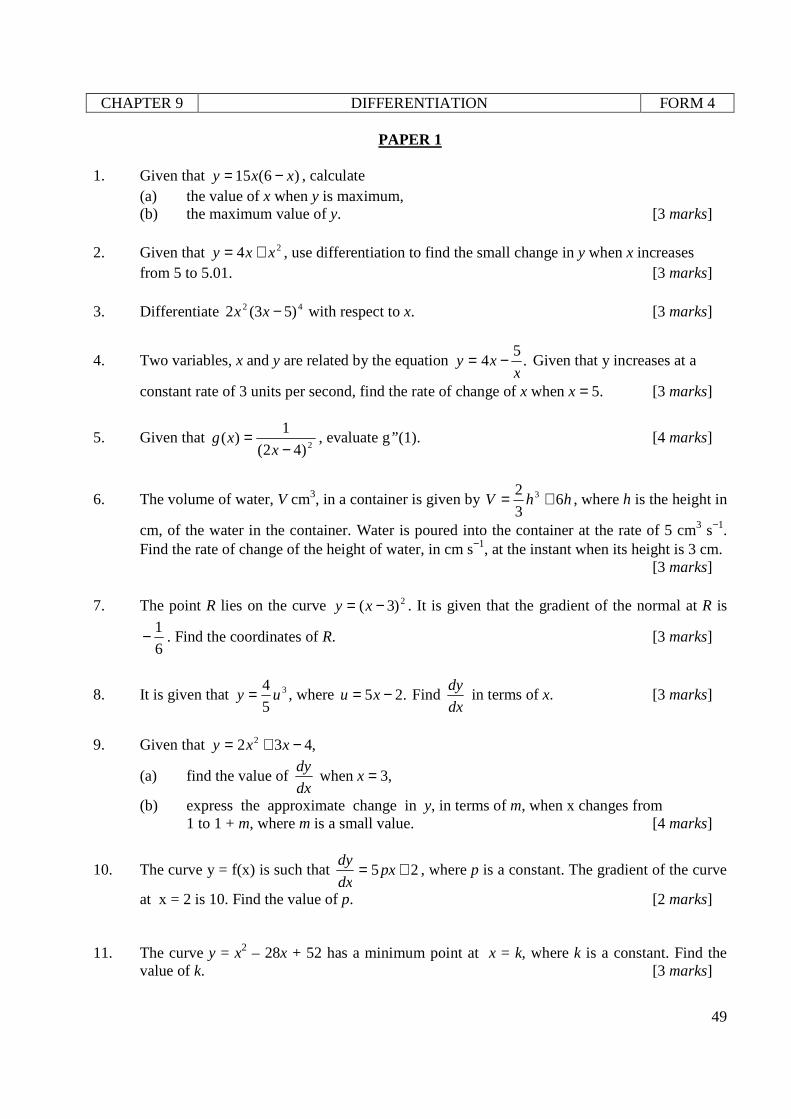
PAPER 1
1. Given that )6(15 xxy −= , calculate (a) the value of x when y is maximum, (b) the maximum value of y. [3 marks] 2. Given that 24 xxy += , use differentiation to find the small change in y when x increases
from 5 to 5.01. [3 marks] 3. Differentiate 42 )53(2 −xx with respect to x. [3 marks]
4. Two variables, x and y are related by the equation .5
4x
xy −= Given that y increases at a
constant rate of 3 units per second, find the rate of change of x when x = 5. [3 marks]
5. Given that 2)42(
1)(
−=
xxg , evaluate g” (1). [4 marks]
6. The volume of water, V cm3, in a container is given by hhV 63
2 3 += , where h is the height in
cm, of the water in the container. Water is poured into the container at the rate of 5 cm3 s−1. Find the rate of change of the height of water, in cm s−1, at the instant when its height is 3 cm.
[3 marks] 7. The point R lies on the curve 2)3( −= xy . It is given that the gradient of the normal at R is
6
1− . Find the coordinates of R. [3 marks]
8. It is given that 3
5
4uy = , where .25 −= xu Find
dx
dy in terms of x. [3 marks]
9. Given that ,432 2 −+= xxy
(a) find the value of dx
dy when x = 3,
(b) express the approximate change in y, in terms of m, when x changes from 1 to 1 + m, where m is a small value. [4 marks]
10. The curve y = f(x) is such that 25 += pxdx
dy, where p is a constant. The gradient of the curve
at x = 2 is 10. Find the value of p. [2 marks] 11. The curve y = x2 – 28x + 52 has a minimum point at x = k, where k is a constant. Find the
value of k. [3 marks]
CHAPTER 9 DIFFERENTIATION FORM 4
50
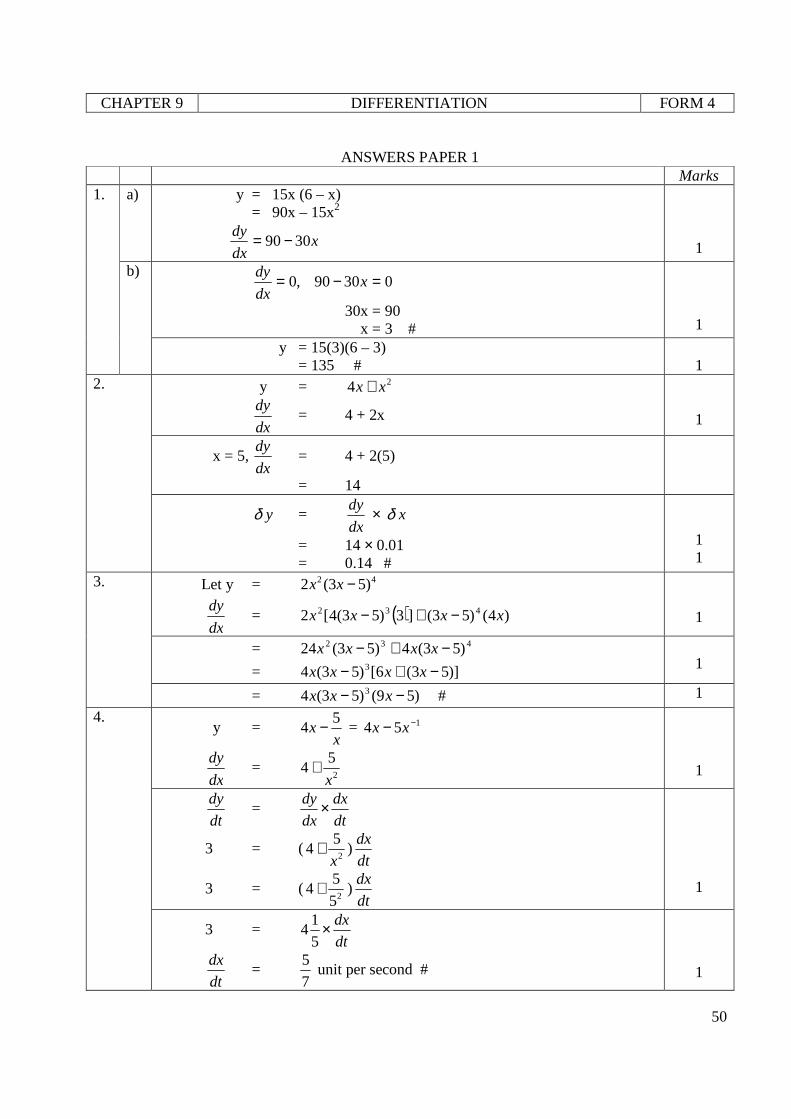
ANSWERS PAPER 1
Marks 1. a) y = 15x (6 – x)
= 90x – 15x2
xdx
dy3090−=
1
b) 03090,0 =−= x
dx
dy
30x = 90 x = 3 #
1
y = 15(3)(6 – 3) = 135 #
1
2. y = 24 xx +
dx
dy = 4 + 2x
1
x = 5, dx
dy = 4 + 2(5)
= 14
δ y = dx
dy × δ x
= 14 × 0.01 = 0.14 #
1 1
3. Let y = 42 )53(2 −xx
dx
dy = ( ) )4()53(]3)53(4[2 432 xxxx −+−
1
= 432 )53(4)53(24 −+− xxxx
= )]53(6[)53(4 3 −+− xxxx
1
= )59()53(4 3 −− xxx # 1
4. y =
xx
54 − = 154 −− xx
dx
dy =
2
54
x+
1
dt
dy =
dt
dx
dx
dy×
3 = (2
54
x+ )
dt
dx
3 = (25
54+ )
dt
dx
1
3 = dt
dx×5
14
dt
dx =
7
5 unit per second #
1
CHAPTER 9 DIFFERENTIATION FORM 4
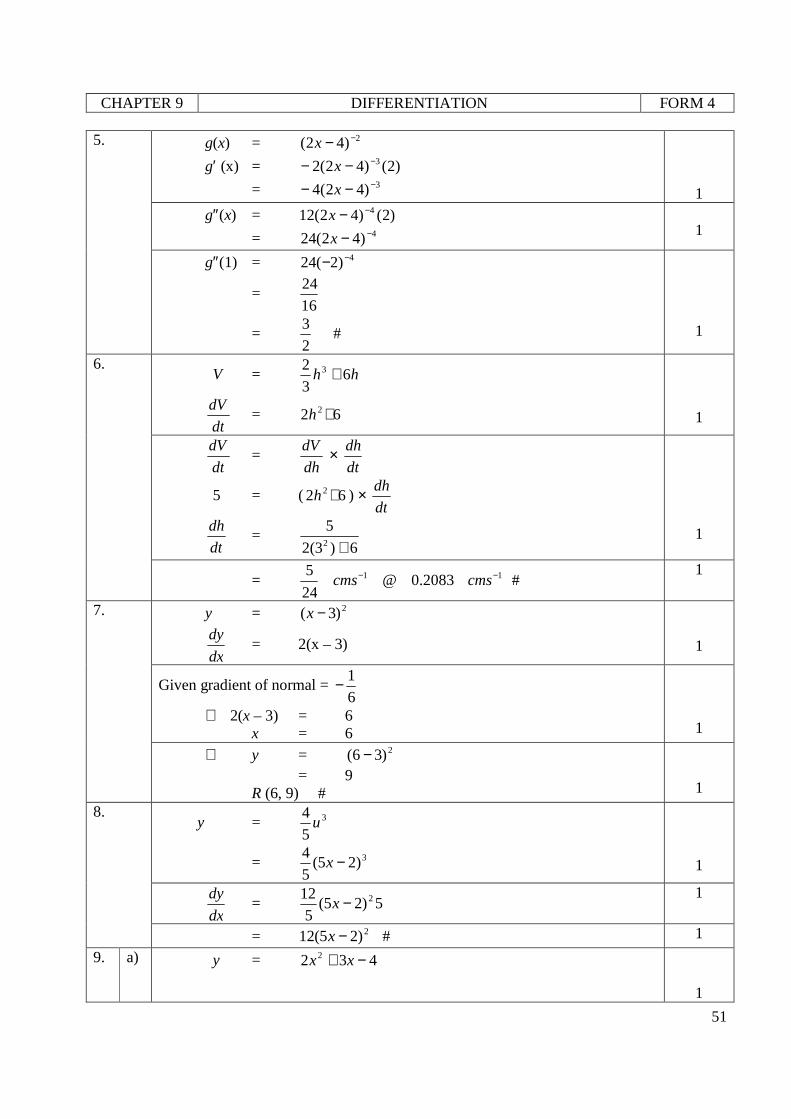
51
5. g(x) = 2)42( −−x
g′ (x) = )2()42(2 3−−− x
= 3)42(4 −−− x
1
g″(x) = )2()42(12 4−−x
= 4)42(24 −−x
1
g″(1) = 4)2(24 −−
= 16
24
= 2
3 #
1
6. V = hh 6
3
2 3 +
dt
dV = 62 2+h
1
dt
dV =
dh
dV ×
dt
dh
5 = ( 62 2+h ) × dt
dh
dt
dh =
6)3(2
52 +
1
= 11 2083.0@24
5 −− cmscms # 1
7. y = 2)3( −x
dx
dy = 2(x – 3)
1
Given gradient of normal = 6
1−
∴ 2(x – 3) = 6 x = 6
1
∴ y = 2)36( − = 9 R (6, 9) #
1
8. y = 3
5
4u
= 3)25(5
4 −x
1
dx
dy = 5)25(
5
12 2−x 1
= 2)25(12 −x # 1
9. a) y = 432 2 −+ xx 1
CHAPTER 9 DIFFERENTIATION FORM 4
52
dx
dy = 4x + 3
When x = 3,
dx
dy = 4(3) + 3
= 15 #
1
b) δ x = m
x
y
δδ
≈ dx
dy
x = 1, m
yδ ≈ 4(1) + 3 = 7
1
δ y ≈ 7m # 1 10.
dx
dy = 5px + 2
5p(2) + 2 = 10
1
10p = 8
p = 5
4 #
1
11. y = 52282 +− xx
dx
dy = 2x – 28
1
Minimum point at x = k : 2(k) – 28 = 0
1
2k = 28 k = 14 #
1
CHAPTER 9 DIFFERENTIATION FORM 4
53
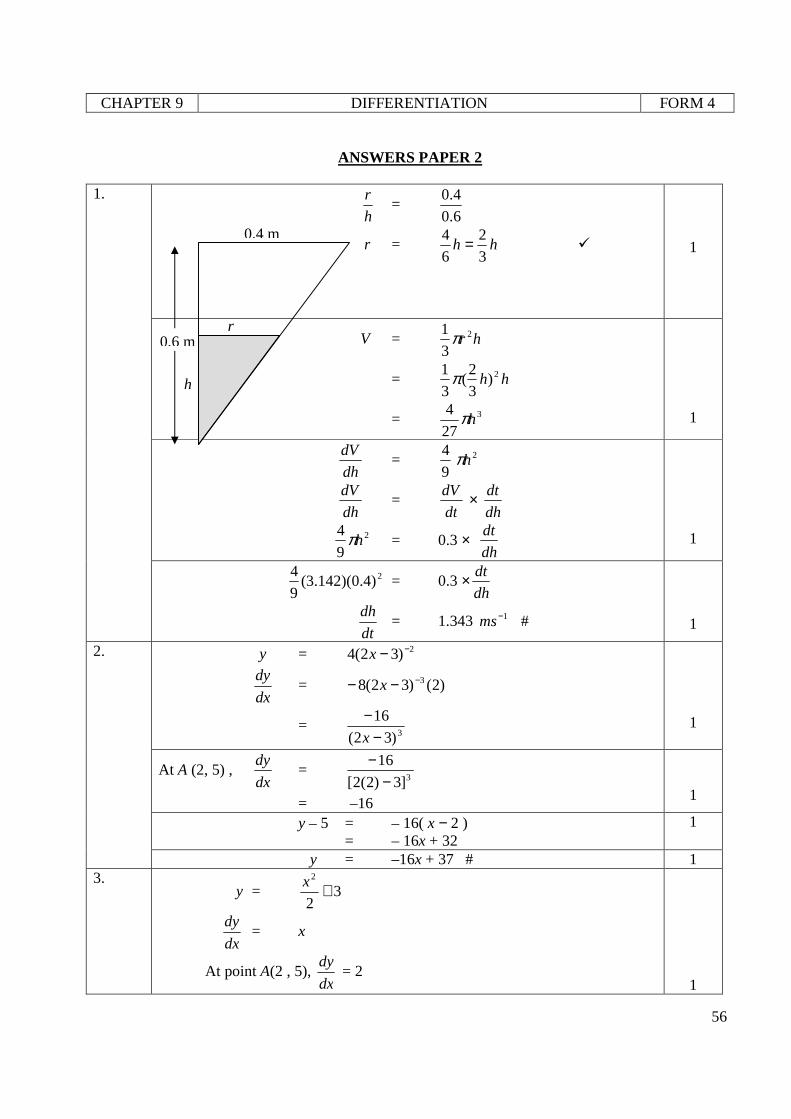
PAPER 2
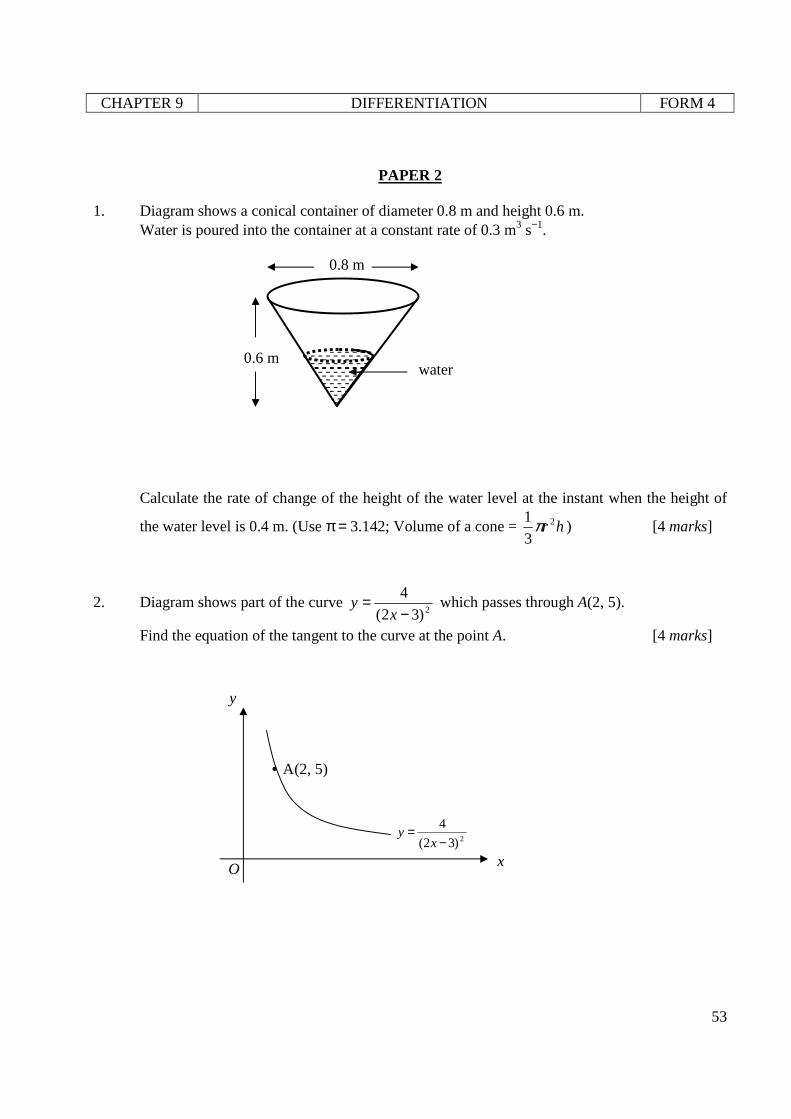
1. Diagram shows a conical container of diameter 0.8 m and height 0.6 m. Water is poured into the container at a constant rate of 0.3 m3 s−1.
Calculate the rate of change of the height of the water level at the instant when the height of
the water level is 0.4 m. (Use π = 3.142; Volume of a cone = hr 2
3
1π ) [4 marks]
2. Diagram shows part of the curve 2)32(
4
−=
xy which passes through A(2, 5).
Find the equation of the tangent to the curve at the point A. [4 marks]
2)32(
4
−=
xy
y
x O
• A(2, 5)
0.8 m
0.6 m water
CHAPTER 9 DIFFERENTIATION FORM 4
54
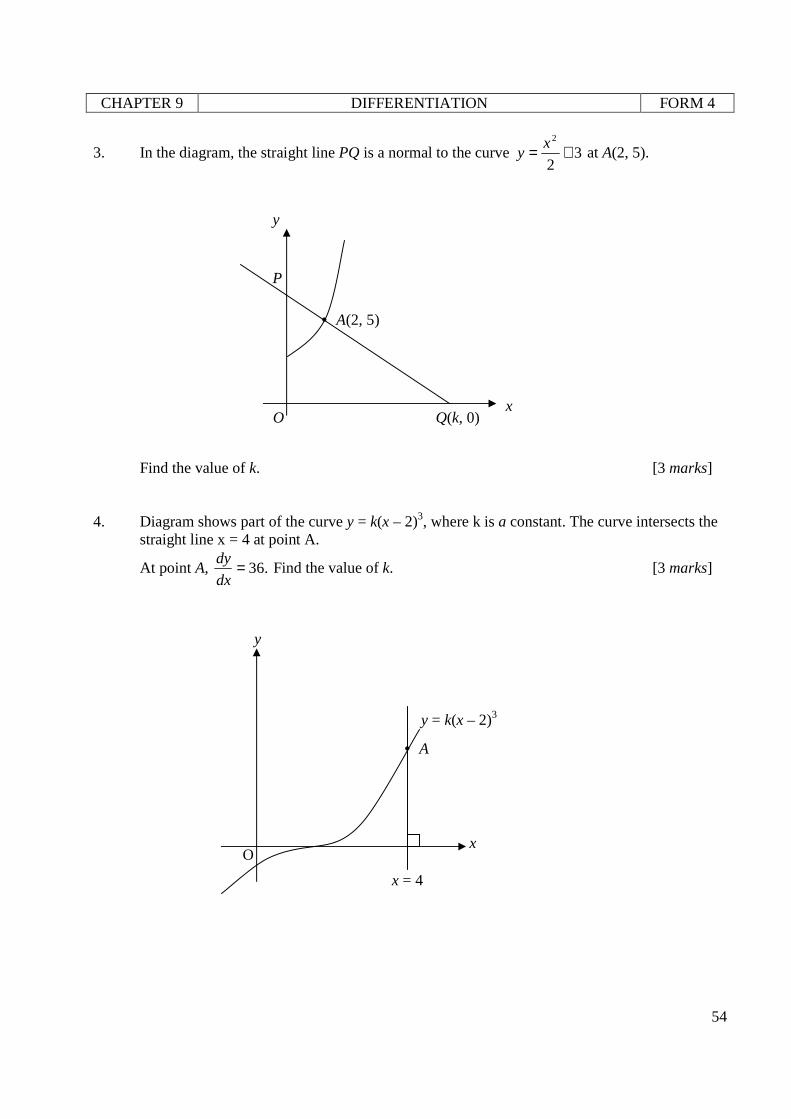
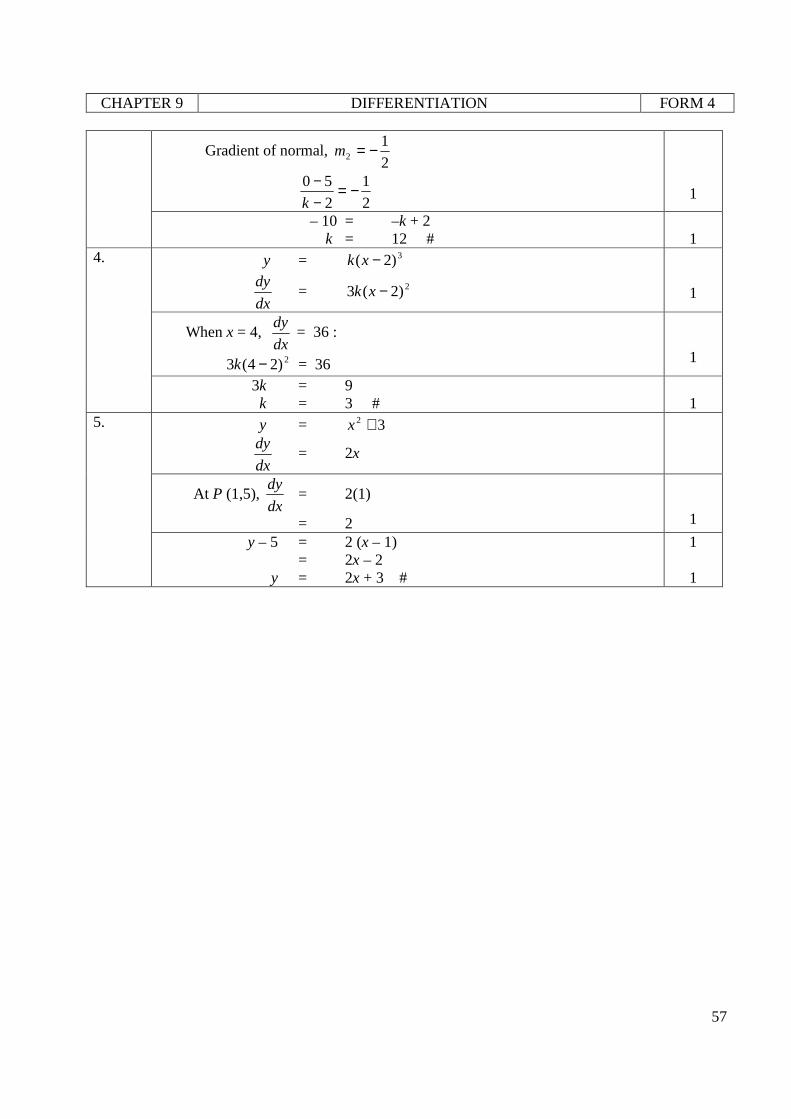
3. In the diagram, the straight line PQ is a normal to the curve 32
2
+= xy at A(2, 5).
Find the value of k. [3 marks] 4. Diagram shows part of the curve y = k(x – 2)3, where k is a constant. The curve intersects the
straight line x = 4 at point A.
At point A, .36=dx
dy Find the value of k. [3 marks]
y
x
P
• A(2, 5)
O Q(k, 0)
y = k(x – 2)3
y
x
• A
O
x = 4
CHAPTER 9 DIFFERENTIATION FORM 4
55
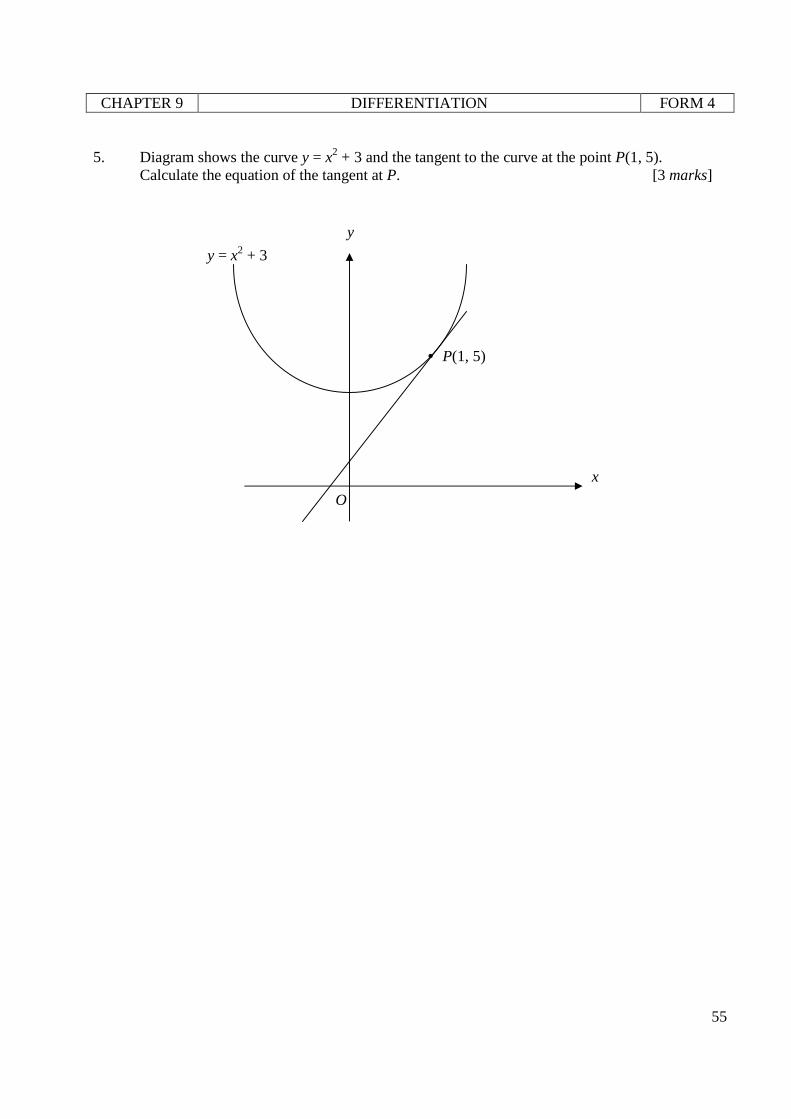
5. Diagram shows the curve y = x2 + 3 and the tangent to the curve at the point P(1, 5).
Calculate the equation of the tangent at P. [3 marks]
y
x
O
y = x2 + 3
• P(1, 5)
CHAPTER 9 DIFFERENTIATION FORM 4
56
ANSWERS PAPER 2
1.
h
r =
6.0
4.0
r = hh3
2
6
4 = �
1
V = hr 2
3
1π
= hh 2)3
2(
3
1π
= 3
27
4hπ
1
dh
dV =
9
4 2hπ
dh
dV =
dt
dV ×
dh
dt
2
9
4hπ = 0.3 ×
dh
dt
1
2)4.0)(142.3(9
4 = 0.3 ×
dh
dt
dt
dh = 1.343 1−ms #
1
2. y = 2)32(4 −−x
dx
dy = )2()32(8 3−−− x
= 3)32(
16
−−x
1
At A (2, 5) , dx
dy =
3]3)2(2[
16
−−
= –16
1
y – 5 = – 16( x − 2 ) = – 16x + 32
1
y = –16x + 37 # 1 3.
y = 32
2
+x
dx
dy = x
At point A(2 , 5), dx
dy = 2
1
0.6 m
h
r
0.4 m
CHAPTER 9 DIFFERENTIATION FORM 4
57
Gradient of normal, 2
12 −=m
2
1
2
50 −=−−
k
1
– 10 = –k + 2 k = 12 #
1
4. y = 3)2( −xk
dx
dy = 2)2(3 −xk
1
When x = 4, dx
dy = 36 :
2)24(3 −k = 36
1
3k = 9 k = 3 #
1
5. y = 32 +x
dx
dy = 2x
At P (1,5), dx
dy = 2(1)
= 2
1
y – 5 = 2 (x – 1) = 2x – 2 y = 2x + 3 #
1 1
JABATAN PELAJARAN PERAK
ANSWER TO SCORE ADDITIONAL MATHEMATICS SPM
(SECONDARY SCHOOL)
TOPICAL EXERCISES & ANSWERS (FORM 5)
CHAPTER 1 PROGRESSIONS FORM 5
72
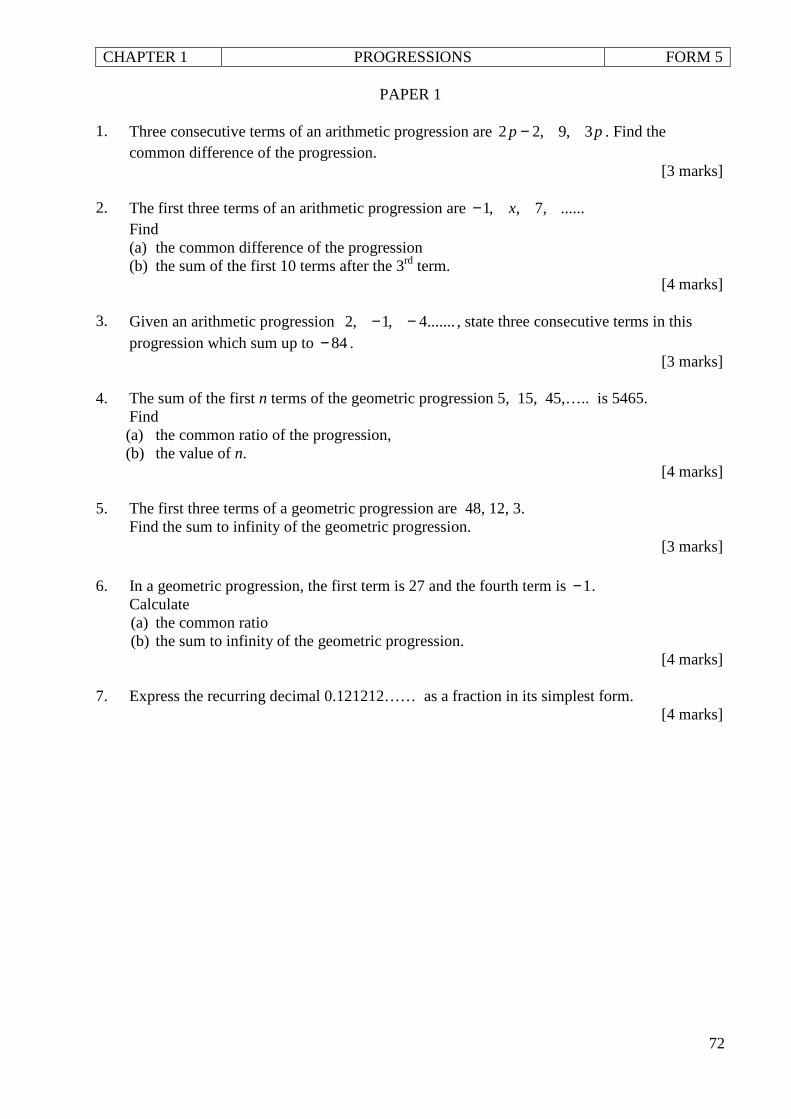
PAPER 1 1. Three consecutive terms of an arithmetic progression are pp 3,9,22 − . Find the
common difference of the progression. [3 marks]
2. The first three terms of an arithmetic progression are ......,7,,1 x−
Find (a) the common difference of the progression (b) the sum of the first 10 terms after the 3rd term.
[4 marks]
3. Given an arithmetic progression .......4,1,2 −− , state three consecutive terms in this progression which sum up to 84− .
[3 marks]
4. The sum of the first n terms of the geometric progression 5, 15, 45,….. is 5465. Find (a) the common ratio of the progression, (b) the value of n.
[4 marks]
5. The first three terms of a geometric progression are 48, 12, 3. Find the sum to infinity of the geometric progression.
[3 marks]
6. In a geometric progression, the first term is 27 and the fourth term is 1− . Calculate (a) the common ratio (b) the sum to infinity of the geometric progression.
[4 marks]
7. Express the recurring decimal 0.121212…… as a fraction in its simplest form. [4 marks]
CHAPTER 1 PROGRESSIONS FORM 5
73
PAPER 2
1. Ali and Borhan start to collect stamps at the same time.
(a) Ali collects p stamps in the first month and his collection increase constantly by q stamps every subsequent month. He collects 220 stamps in the 7th month and the total collection for the first 12 month are 2520 stamps. Find the value of p and q.
[5 marks] (b) Borhan collects 60 stamps in the first month and his collection increase constantly by 25
stamps every subsequent month. If both of them collect the same number of stamps in the nth month, find the value of n.
[2 marks]
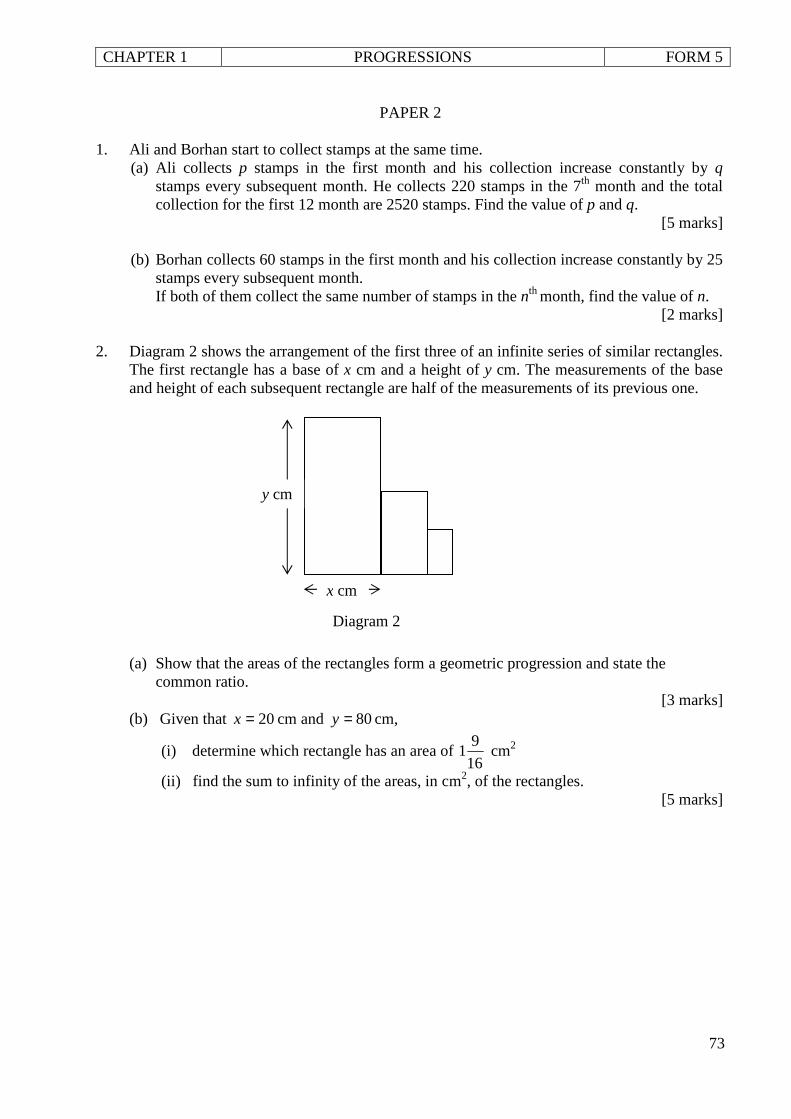
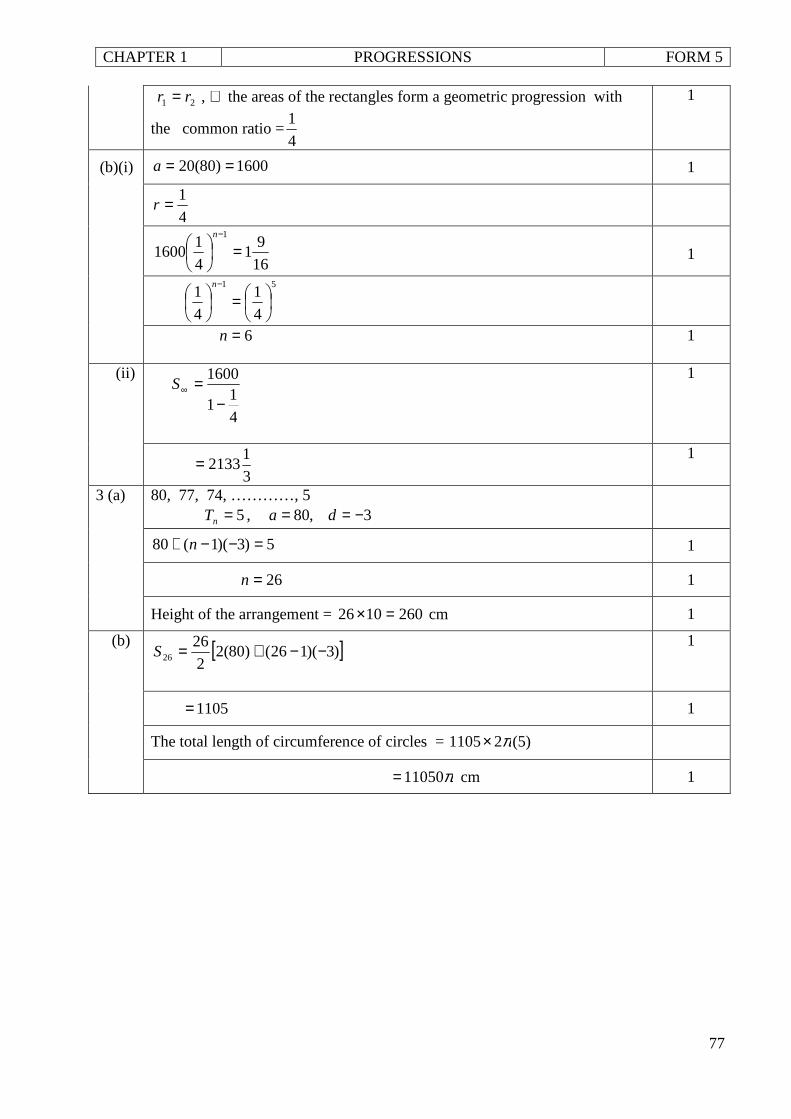
2. Diagram 2 shows the arrangement of the first three of an infinite series of similar rectangles. The first rectangle has a base of x cm and a height of y cm. The measurements of the base and height of each subsequent rectangle are half of the measurements of its previous one. (a) Show that the areas of the rectangles form a geometric progression and state the
common ratio. [3 marks]
(b) Given that 20=x cm and 80=y cm,
(i) determine which rectangle has an area of 16
91 cm2
(ii) find the sum to infinity of the areas, in cm2, of the rectangles. [5 marks]
y cm
x cm
Diagram 2
CHAPTER 1 PROGRESSIONS FORM 5
74
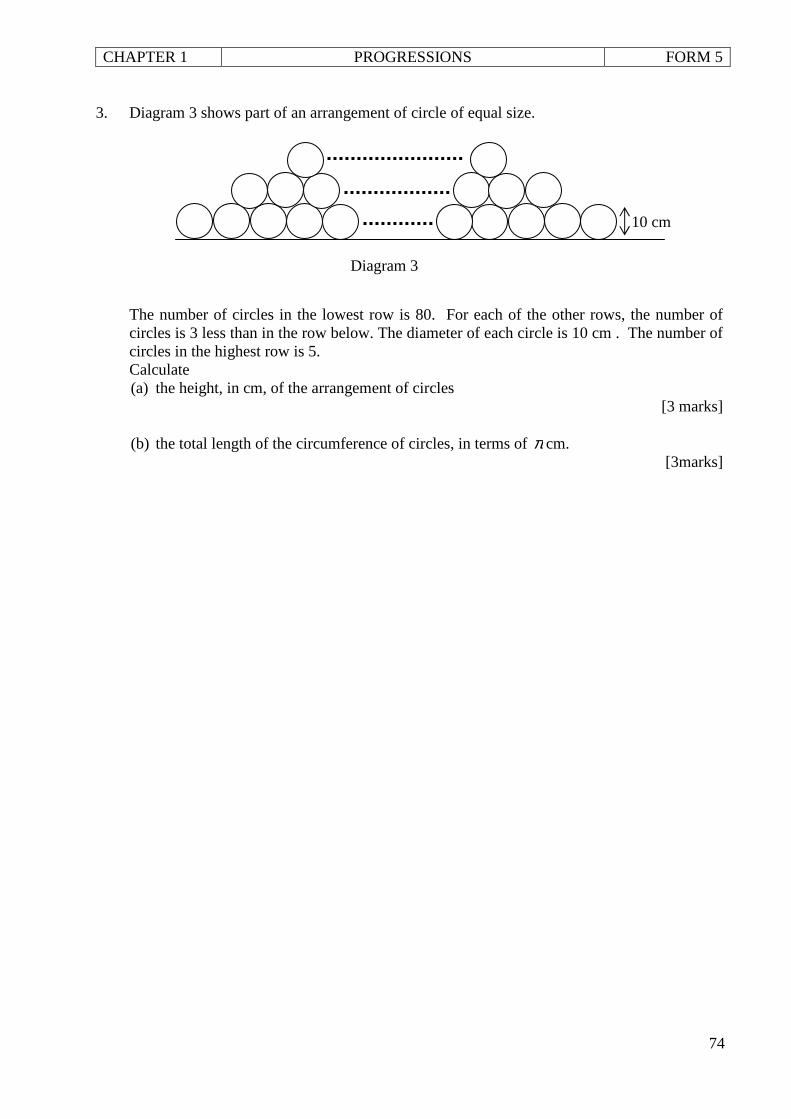
3. Diagram 3 shows part of an arrangement of circle of equal size.
The number of circles in the lowest row is 80. For each of the other rows, the number of circles is 3 less than in the row below. The diameter of each circle is 10 cm . The number of circles in the highest row is 5. Calculate (a) the height, in cm, of the arrangement of circles
[3 marks]
(b) the total length of the circumference of circles, in terms of π cm. [3marks]
10 cm
Diagram 3
CHAPTER 1 PROGRESSIONS FORM 5
75
ANSWER (PAPER 1)
1 93)22(9 −=−− pp 1
4=p 1
369 =−=∴ differencecommon 1
2 (a) xx −=−− 7)1(
3=x 1
4=∴ differencecommon 1
(b) the sum of the first 10 terms after the 3rd term:
[ ] 9)4(12)1(22
13313 −+−=− SS
1
290= 1
3 84)3()2()1( −=−++−++−+ dnadnadna 1
12=n 1
Three consecutive terms: 25,28,31 101112 −=−=−= TTT
1
4 (a) 3
5
15 ==r 1
(b)
13
)13(55465
−−=
n
1
n337 = 1
7=n 1
5
4
1
48
12 ==r
1
4
11
48
−=∞S
1
64=
1
6 (a) 1)(27 14 −=−r 1
3
1−=r 1
(b)
−−=∞
3
11
27S
1
CHAPTER 1 PROGRESSIONS FORM 5
76
4
120=
1
7. 0.121212…… = 0.12 + 0.0012 + 0.000012 + ……..
12.0=a 1
01.012.0
0012.0 ==r
1
01.01
12.0
−=∞S
1
33
4= 1
ANSWER (PAPER 2)
1 (a) 220)17( =−+ qp …….eq(1) 1
[ ] 2520)112(22
12 =−+ qp ……..eq(2)
1
eq (1) x 2 : 440122 =+ qp ……. eq(3) 1
From eq (2) : 420112 =+ qp ……. eq(4)
(3) – (4) : 20=q 1
100=p 1
(b) Ali : 20)1(100 −+= nTn
n2080+= Borhan : 25)1(60 −+= nTn
n2535+=
nn 25352080 +=+ 1
9=n 1
2 (a) Area : ..............,
16,
4,
xyxyxy
1
4
141 ==
xy
xy
r 4
1
4
162 ==
xy
xy
r both
1
either
CHAPTER 1 PROGRESSIONS FORM 5
77
21 rr = , ∴ the areas of the rectangles form a geometric progression with
the common ratio =4
1
1
(b)(i) 1600)80(20 ==a 1
4
1=r
16
91
4
11600
1
=
−n
1
51
4
1
4
1
=
−n
6=n
1
(ii)
4
11
1600
−=∞S
1
3
12133=
1
3 (a) 80, 77, 74, …………, 5 5=nT , 3,80 −== da
5)3)(1(80 =−−+ n 1
26=n 1
Height of the arrangement = 2601026 =× cm 1
(b) [ ])3)(126()80(22
2626 −−+=S
1
1105= 1
The total length of circumference of circles = )5(21105 π×
π11050= cm 1
CHAPTER 10 LINEAR PROGRAMMING FORM 5
143
PAPER 2 1.
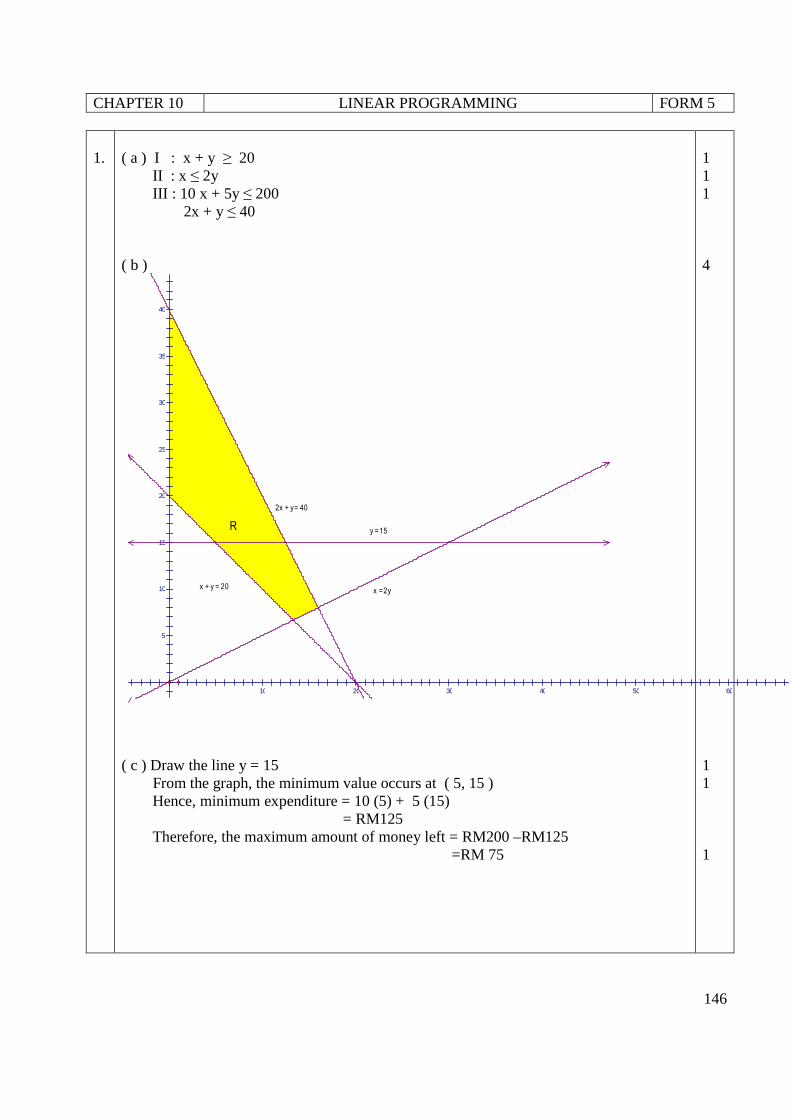
Amirah has an allocation of RM200 to buy x workbooks and y reference books. The total number of books is not less than 20. The number of workbooks is at most twice the number of the references. The price of a workbook is RM10 and that of a reference is RM5. a ) Write down three inequalities, other than x≥ 0 and y≥ 0, which satisfy all the above constraints. ( 3 marks) b ) Hence, using a scale of 2cm to 5 books on the x-axis and 2cm to 5 books on the y-axis, construct and shade the region R that satisfies all the above constraints. ( 4 marks ) c ) If Amirah buys 15 reference books, find the maximum amount of money that is left. ( 3 marks )
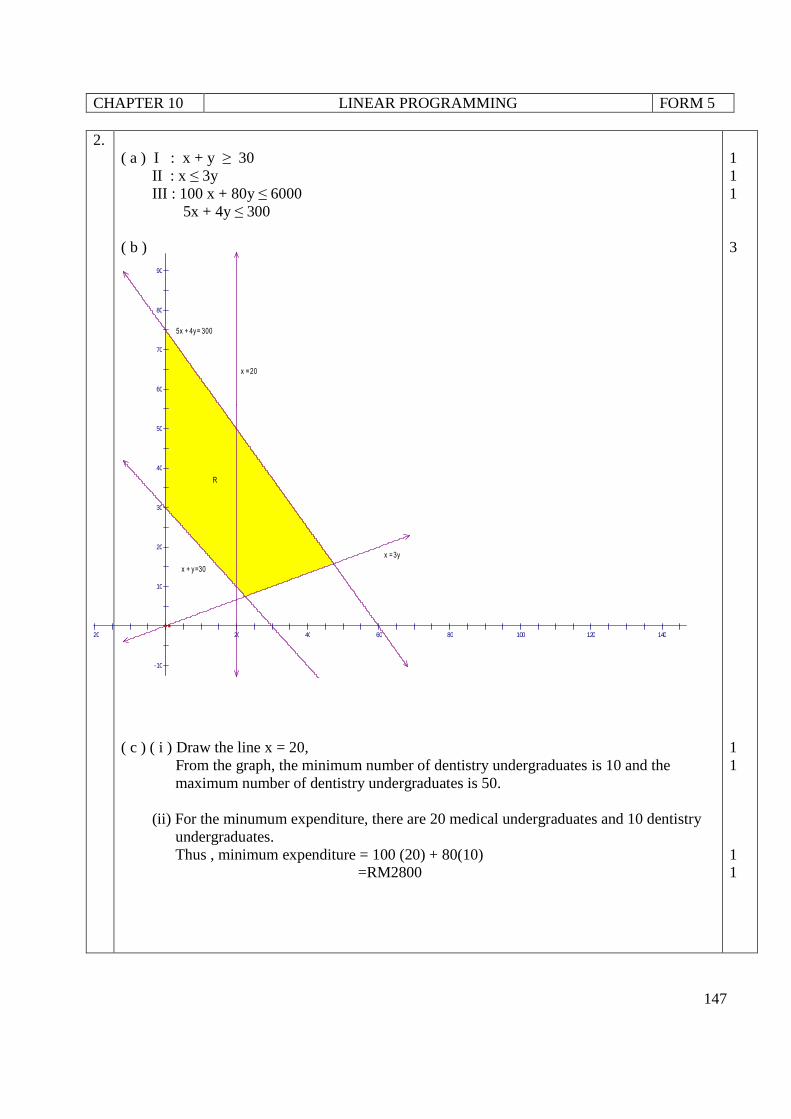
2. A university wants to organise a course for x medical undergraduates and y dentistry undergraduates. The method in which the number of medical undergraduates and dentistry undergraduates are chosen are as follows. I : The total number of participants is at least 30. II : The number of medical undergraduates is not more than three times the number of dentistry undergraduates. III : The maximum allocation for the course is RM6 000 with RM100 for a medical undergraduates and RM80 for a dentistry undergraduates. a) Write down three inequalities, other than x≥ 0 and y≥ 0, which satisfy all the above constraints. ( 3 marks )
b) Hence, by using a scale of 2cm to 10 participants on both axes, construct and shade the region R that satisfies all the above constraints. ( 3 marks )
c) Using your graph from (b), find ( i) The maximum and minimum number of dentistry undergraduates , if the number of medical undergraduates that participate in the course is 20. (ii) The minimum expenditure to run the course in this case. ( 4 marks )
3. A tuition centre offers two different subjects, science, S, and mathematics, M, for Form 4 students. The number of students for S is x and for M is y. The intake of the students is based on the following constraints.
I : The total number of students is not more than 90. II : The number of students for subject S is at most twice the number of students for subject M. III : The number of students for subject M must exceed the number of students for subject S
by at most 10
CHAPTER 10 LINEAR PROGRAMMING FORM 5
144
a) Write down three inequalities, other than x≥ 0 and y≥ 0, which satisfy all the above conditions. ( 3 marks)
b) Hence, by using a scale of 2 cm to represent 10 students on both axes, construct and shade the region R that satisfies all the above conditions. ( 3 marks )
c) Using the graph from ( b ), find ( 4 marks )
( i ) the range of the number of students for subject M if the number of students for subjects S is 20
(ii) the maximum total fees per month that can be collected if the fees per month for subject S and M are RM12 and RM10 respectively.
4
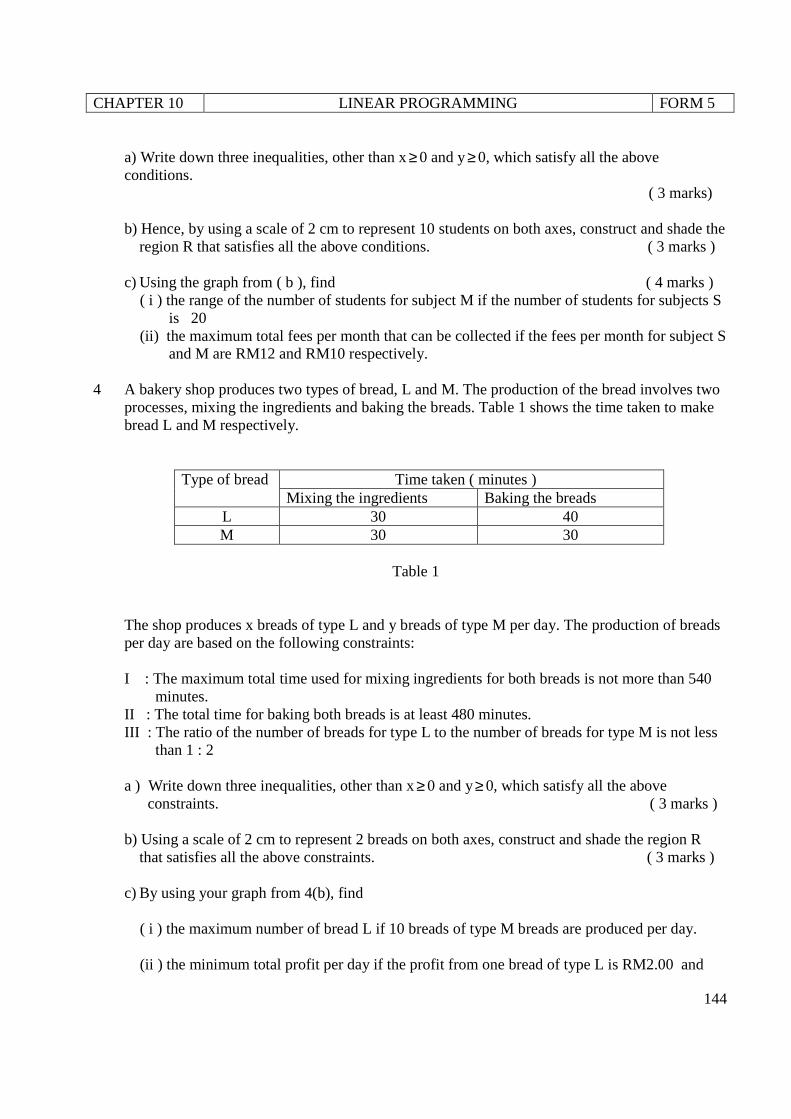
A bakery shop produces two types of bread, L and M. The production of the bread involves two processes, mixing the ingredients and baking the breads. Table 1 shows the time taken to make bread L and M respectively.
Type of bread Time taken ( minutes ) Mixing the ingredients Baking the breads
L 30 40 M 30 30
Table 1 The shop produces x breads of type L and y breads of type M per day. The production of breads per day are based on the following constraints: I : The maximum total time used for mixing ingredients for both breads is not more than 540 minutes. II : The total time for baking both breads is at least 480 minutes. III : The ratio of the number of breads for type L to the number of breads for type M is not less than 1 : 2 a ) Write down three inequalities, other than x≥ 0 and y≥ 0, which satisfy all the above constraints. ( 3 marks )
b) Using a scale of 2 cm to represent 2 breads on both axes, construct and shade the region R that satisfies all the above constraints. ( 3 marks )
c) By using your graph from 4(b), find
( i ) the maximum number of bread L if 10 breads of type M breads are produced per day. (ii ) the minimum total profit per day if the profit from one bread of type L is RM2.00 and
CHAPTER 10 LINEAR PROGRAMMING FORM 5
145
from one bread of type M is RM1.00 . ( 4 marks )
5. A factory produced x toys of model A and y toys of model B. The profit from the sales of a number of model A is RM 15 per unit and a number of model B is RM 12 per unit. The production of the models per day is based on the following conditions:- I : The total number of models produced is not more than 500. II : The number of model A produced is at most three times the number of model B. III : The minimum total profit for model A and model B is RM4200. a) Write down three inequalities, other than x≥ 0 and y≥ 0, which satisfy all the above
conditions. ( 3 marks)
b) Hence, by using a scale of 2 cm to represent 50 models on both axes, construct and shade the region R that satisfies all the above conditions. ( 3 marks )
c) Based on ypur graph, find ( 4 marks ) ( i ) the minimum number of model B if the number of model A produced on a particular
day is 100. (ii) the maximum total profit per day
CHAPTER 10 LINEAR PROGRAMMING FORM 5
146
1.
( a ) I : x + y ≥ 20 II : x ≤ 2y III : 10 x + 5y ≤ 200 2x + y ≤ 40 ( b ) ( c ) Draw the line y = 15 From the graph, the minimum value occurs at ( 5, 15 ) Hence, minimum expenditure = 10 (5) + 5 (15) = RM125 Therefore, the maximum amount of money left = RM200 –RM125 =RM 75
1 1 1 4 1 1 1
40
35
30
25
20
15
10
5
10 20 30 40 50 60
R y = 15
x + y = 20
2x + y = 40
x = 2y
CHAPTER 10 LINEAR PROGRAMMING FORM 5
147
2. ( a ) I : x + y ≥ 30 II : x ≤ 3y III : 100 x + 80y ≤ 6000 5x + 4y ≤ 300 ( b ) ( c ) ( i ) Draw the line x = 20, From the graph, the minimum number of dentistry undergraduates is 10 and the maximum number of dentistry undergraduates is 50. (ii) For the minumum expenditure, there are 20 medical undergraduates and 10 dentistry undergraduates. Thus , minimum expenditure = 100 (20) + 80(10) =RM2800
1 1 1 3 1 1 1 1
90
80
70
60
50
40
30
20
10
-10
-20 20 40 60 80 100 120 140
x = 3y
R
5x + 4y = 300
x = 20
x + y =30
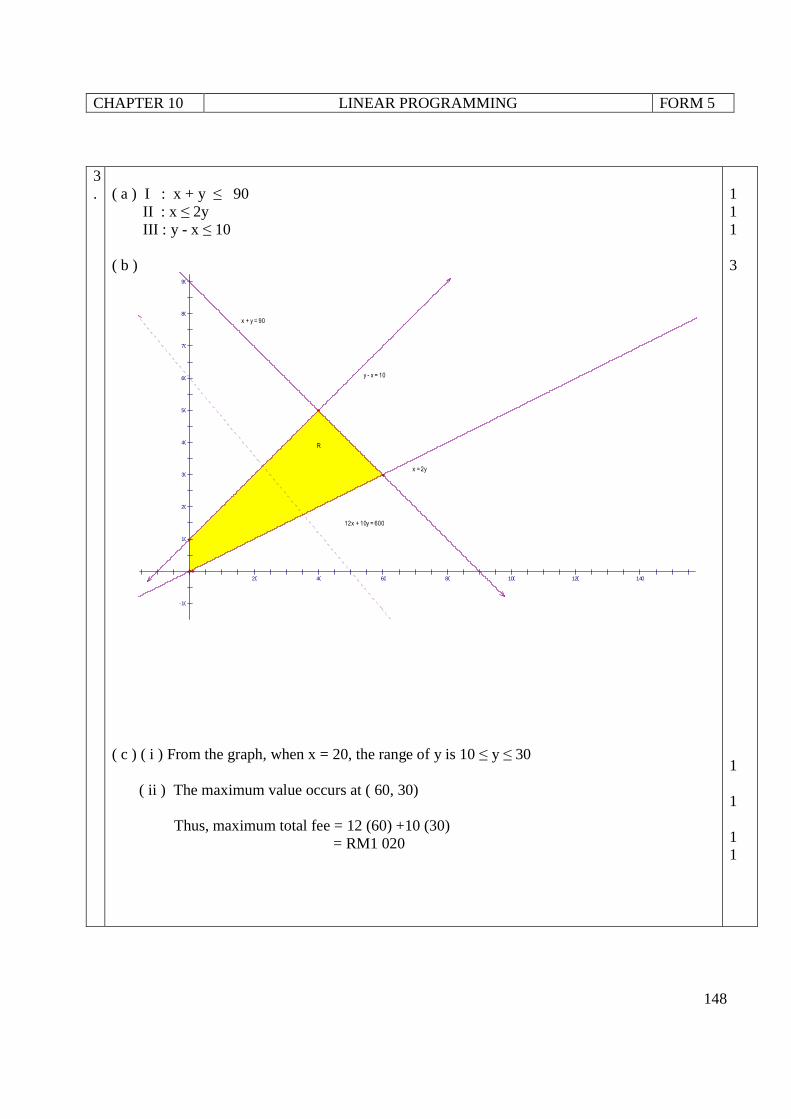
CHAPTER 10 LINEAR PROGRAMMING FORM 5
148
3.
( a ) I : x + y ≤ 90 II : x ≤ 2y III : y - x ≤ 10 ( b )
90
80
70
60
50
40
30
20
10
-10
20 40 60 80 100 120 140
12x + 10y = 600
x + y = 90
x = 2y
R
y - x = 10
( c ) ( i ) From the graph, when x = 20, the range of y is 10 ≤ y ≤ 30 ( ii ) The maximum value occurs at ( 60, 30) Thus, maximum total fee = 12 (60) +10 (30) = RM1 020
1 1 1 3 1 1 1 1
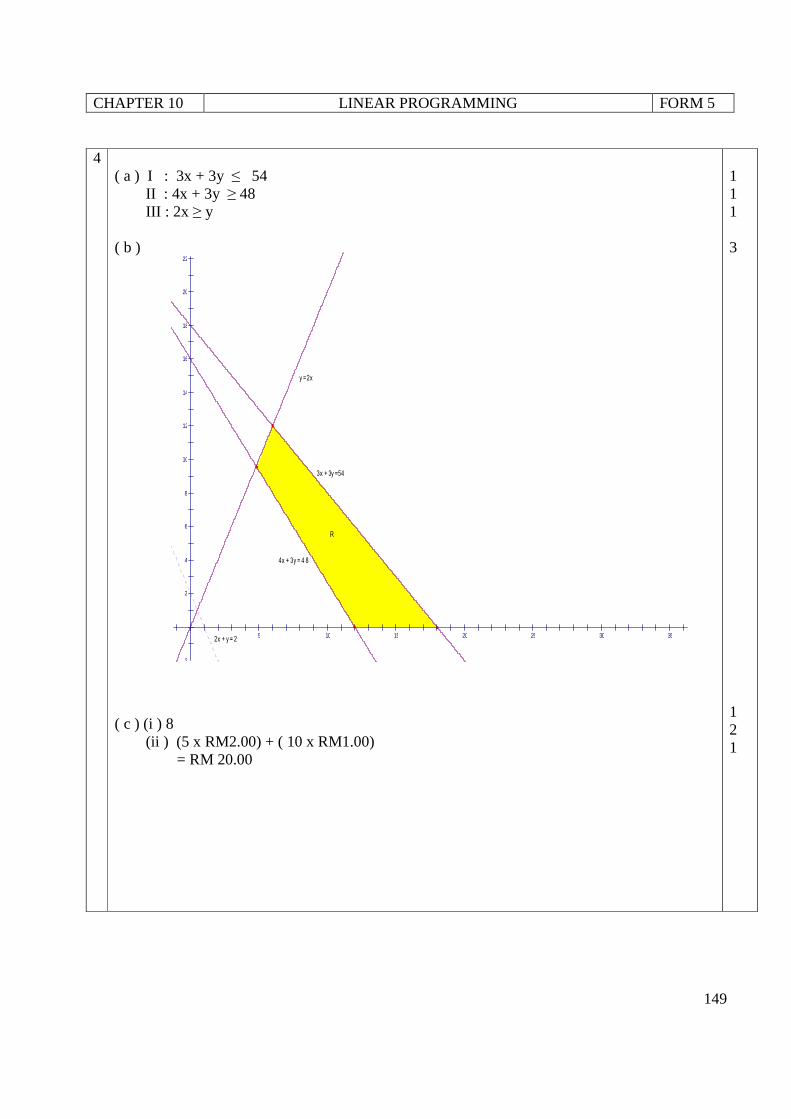
CHAPTER 10 LINEAR PROGRAMMING FORM 5
149
4 ( a ) I : 3x + 3y ≤ 54 II : 4x + 3y ≥ 48 III : 2x ≥ y ( b )
22
20
18
16
14
12
10
8
6
4
2
-2
5 10 15 20 25 30 35
R
2x + y = 2
4x + 3y = 4 8
3x + 3y =54
y = 2x
( c ) (i ) 8 (ii ) (5 x RM2.00) + ( 10 x RM1.00) = RM 20.00
1 1 1 3 1 2 1
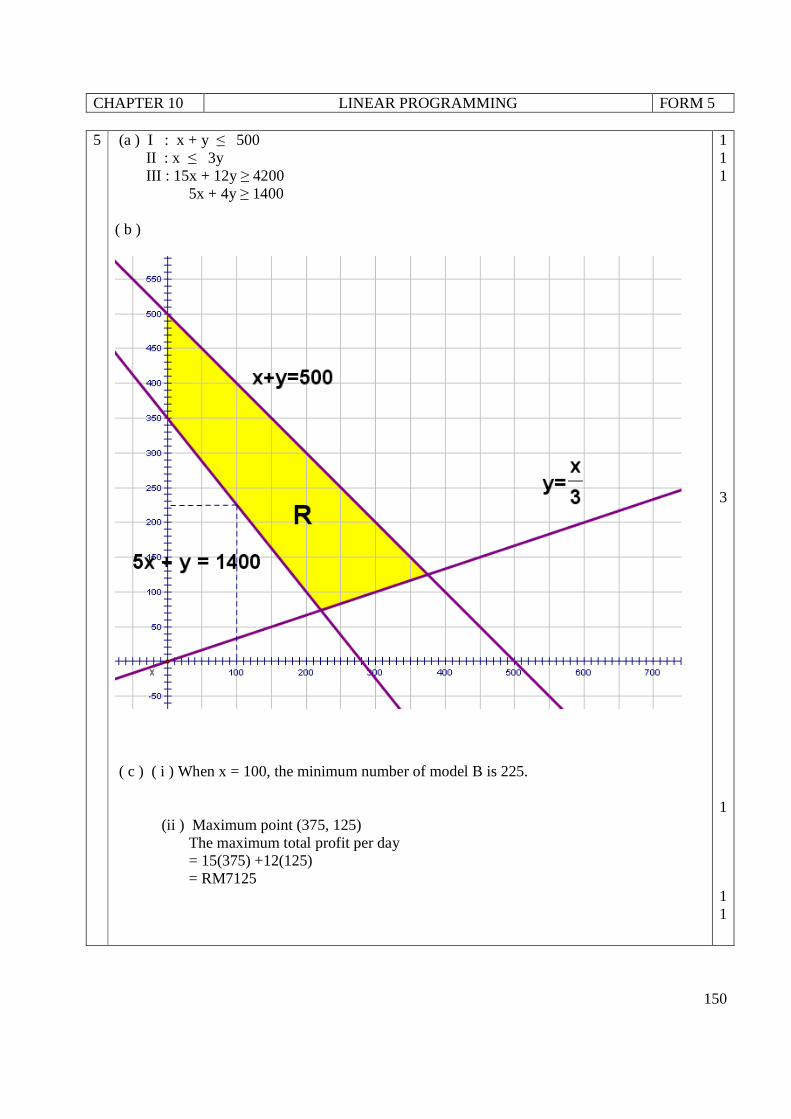
CHAPTER 10 LINEAR PROGRAMMING FORM 5
150
5 (a ) I : x + y ≤ 500 II : x ≤ 3y III : 15x + 12y ≥ 4200 5x + 4y ≥ 1400 ( b )
( c ) ( i ) When x = 100, the minimum number of model B is 225.
(ii ) Maximum point (375, 125) The maximum total profit per day = 15(375) +12(125) = RM7125
1 1 1 3
1 1 1
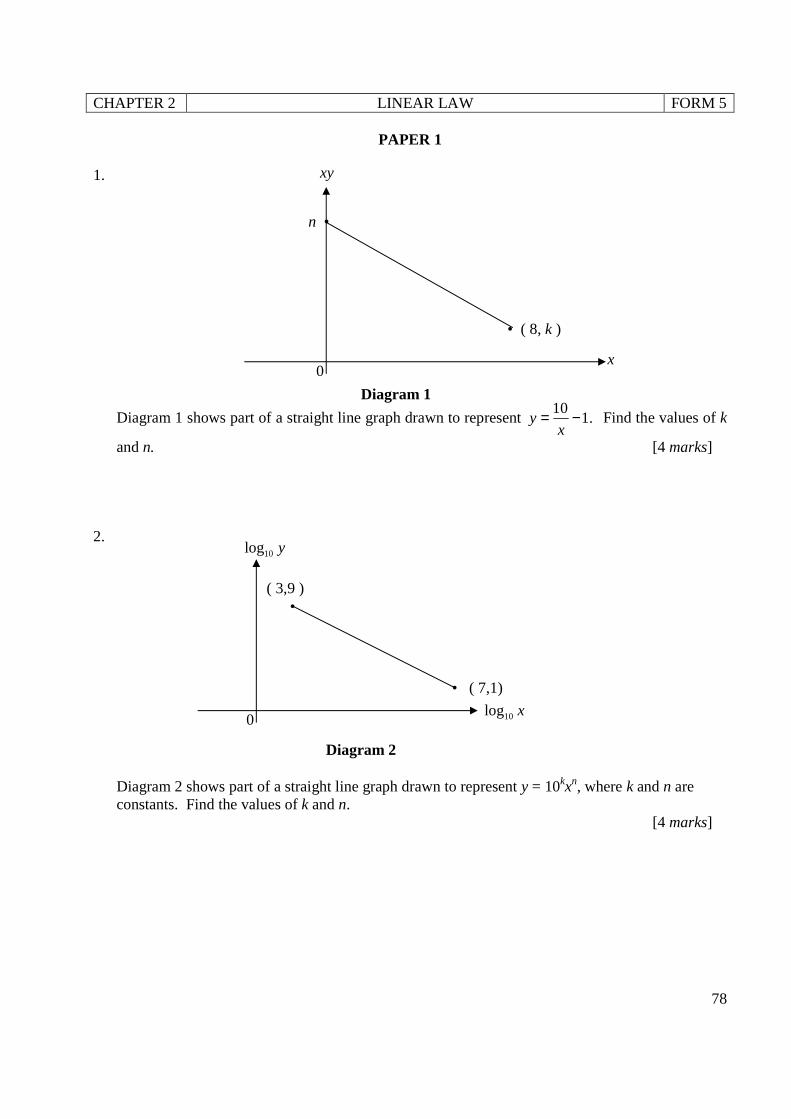
CHAPTER 2 LINEAR LAW FORM 5
78
PAPER 1
1.
Diagram 1 shows part of a straight line graph drawn to represent 10
1.yx
= − Find the values of k
and n. [4 marks] 2.
Diagram 2 shows part of a straight line graph drawn to represent y = 10kxn, where k and n are constants. Find the values of k and n.
[4 marks]
n •
• ( 8, k )
0 x
xy
• ( 7,1)
( 3,9 ) •
0 10log x
10log y
Diagram 1
Diagram 2
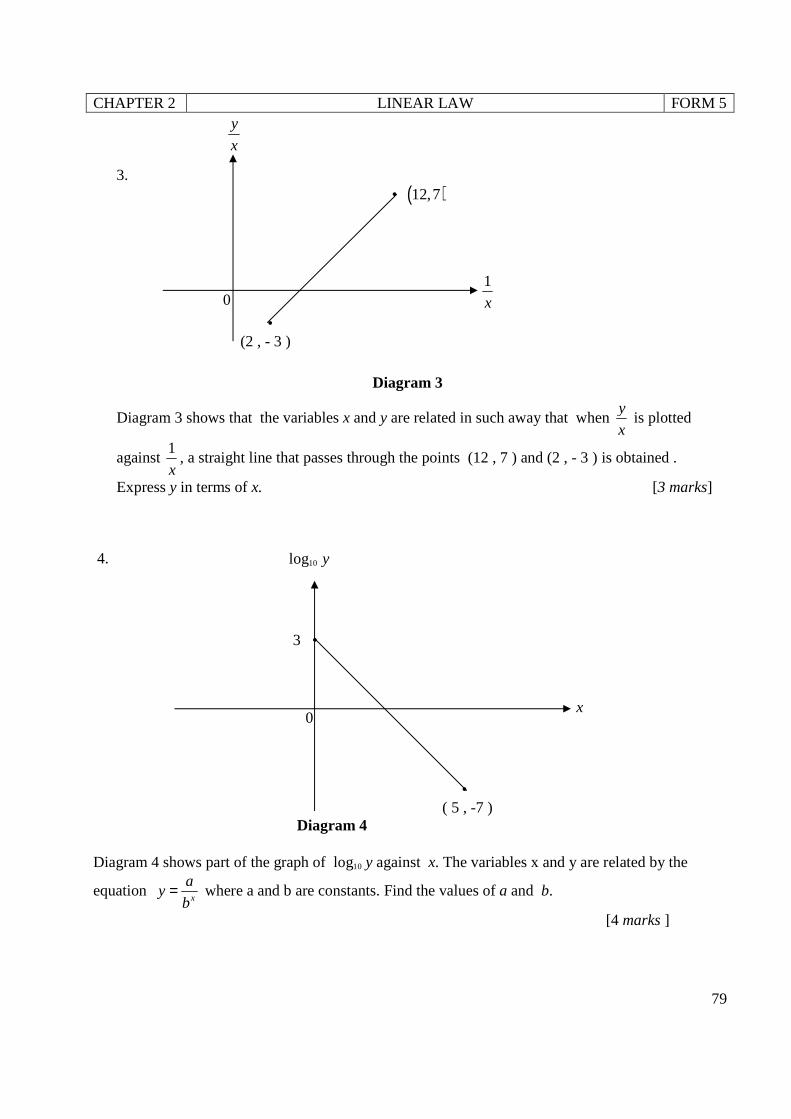
CHAPTER 2 LINEAR LAW FORM 5
79
3.
Diagram 3 shows that the variables x and y are related in such away that when y
x is plotted
against 1
x, a straight line that passes through the points (12 , 7 ) and (2 , - 3 ) is obtained .
Express y in terms of x. [3 marks]
4. Diagram 4 shows part of the graph of log10 y against x. The variables x and y are related by the
equation x
ay
b= where a and b are constants. Find the values of a and b.
[4 marks ]
0
• (2 , - 3 )
1
x
y
x
• ( )12,7
Diagram 3
log10 y
0
• ( 5 , -7 )
3 •
x
Diagram 4
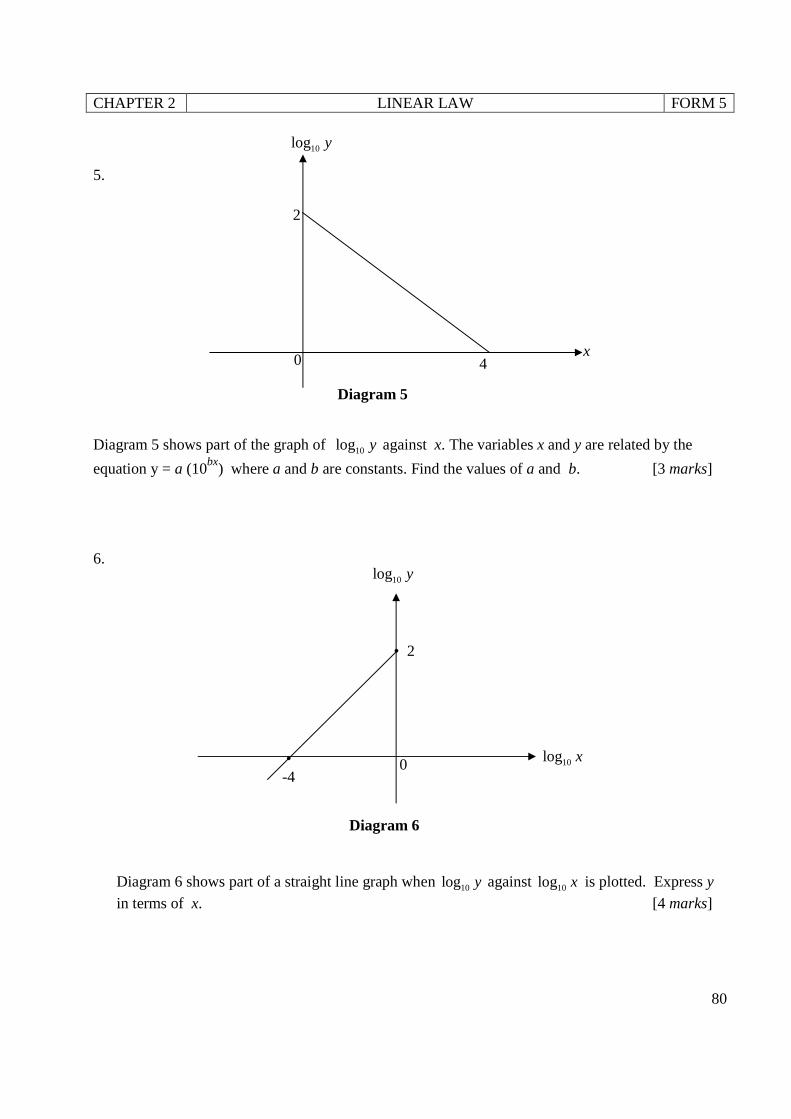
CHAPTER 2 LINEAR LAW FORM 5
80
5. Diagram 5 shows part of the graph of 10log y against x. The variables x and y are related by the
equation y = a (10bx) where a and b are constants. Find the values of a and b. [3 marks] 6.
Diagram 6 shows part of a straight line graph when 10log y against 10log x is plotted. Express y
in terms of x. [4 marks]
4
2
0
10log y
x
• -4
• 2
0
10log y
10log x
Diagram 5
Diagram 6
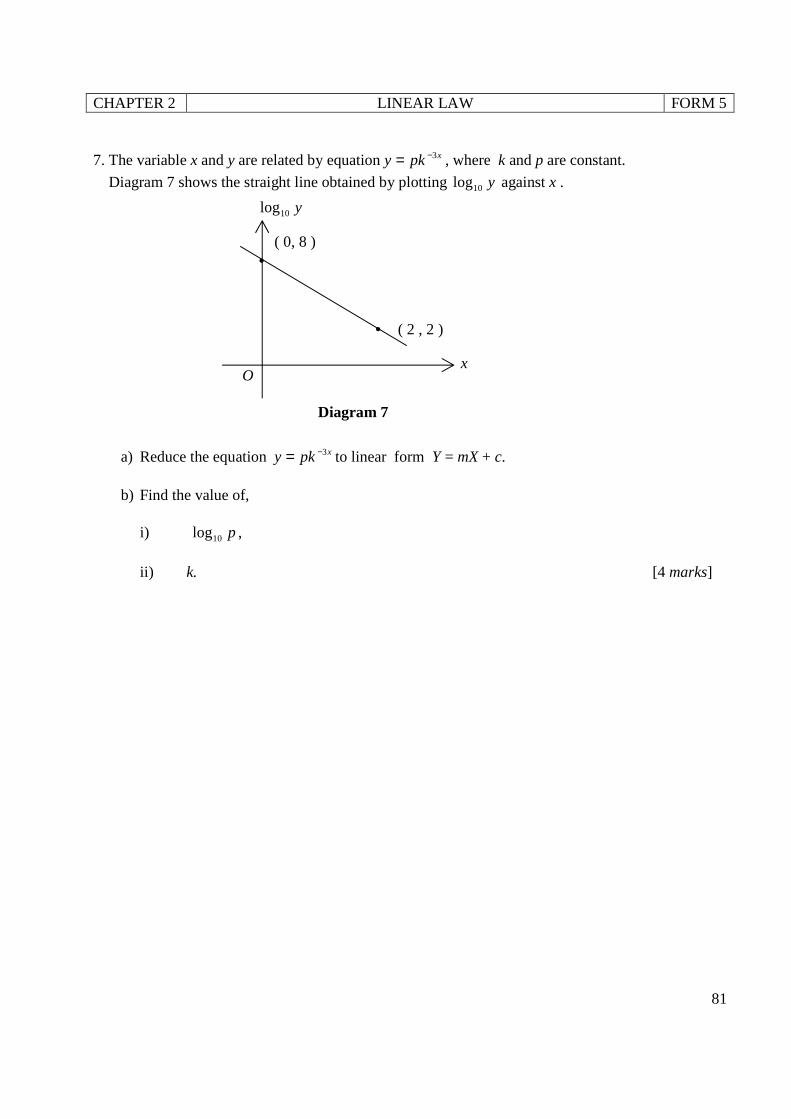
CHAPTER 2 LINEAR LAW FORM 5
81
7. The variable x and y are related by equation xpky 3−= , where k and p are constant.
Diagram 7 shows the straight line obtained by plotting y10log against x .
a) Reduce the equation xpky 3−= to linear form Y = mX + c. b) Find the value of, i) p10log ,
ii) k. [4 marks]
y10log
x O
( 0, 8 ) •
• ( 2 , 2 )
Diagram 7
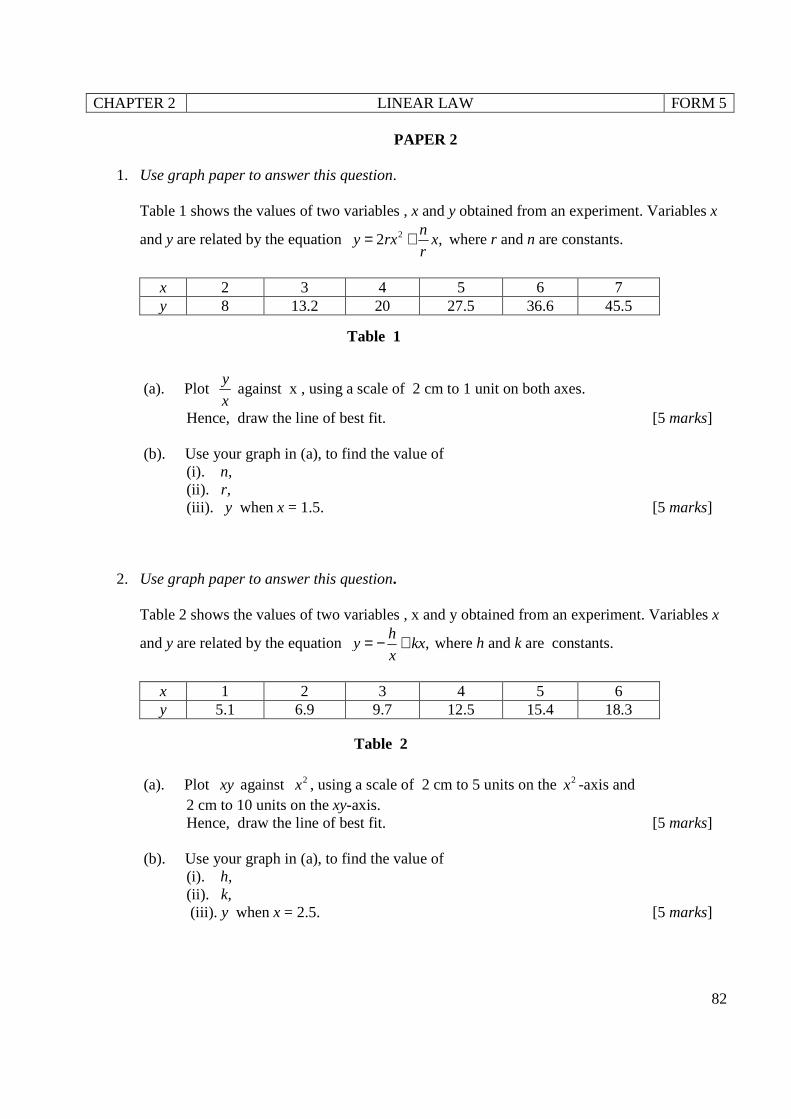
CHAPTER 2 LINEAR LAW FORM 5
82
PAPER 2
1. Use graph paper to answer this question.
Table 1 shows the values of two variables , x and y obtained from an experiment. Variables x
and y are related by the equation 22 ,n
y rx xr
= + where r and n are constants.
x 2 3 4 5 6 7 y 8 13.2 20 27.5 36.6 45.5
(a). Plot y
x against x , using a scale of 2 cm to 1 unit on both axes.
Hence, draw the line of best fit. [5 marks] (b). Use your graph in (a), to find the value of (i). n,
(ii). r, (iii). y when x = 1.5. [5 marks]
2. Use graph paper to answer this question.
Table 2 shows the values of two variables , x and y obtained from an experiment. Variables x
and y are related by the equation ,h
y kxx
= − + where h and k are constants.
x 1 2 3 4 5 6 y 5.1 6.9 9.7 12.5 15.4 18.3
(a). Plot xy against 2x , using a scale of 2 cm to 5 units on the 2x -axis and 2 cm to 10 units on the xy-axis. Hence, draw the line of best fit. [5 marks] (b). Use your graph in (a), to find the value of (i). h,
(ii). k, (iii). y when x = 2.5. [5 marks]
Table 1
Table 2
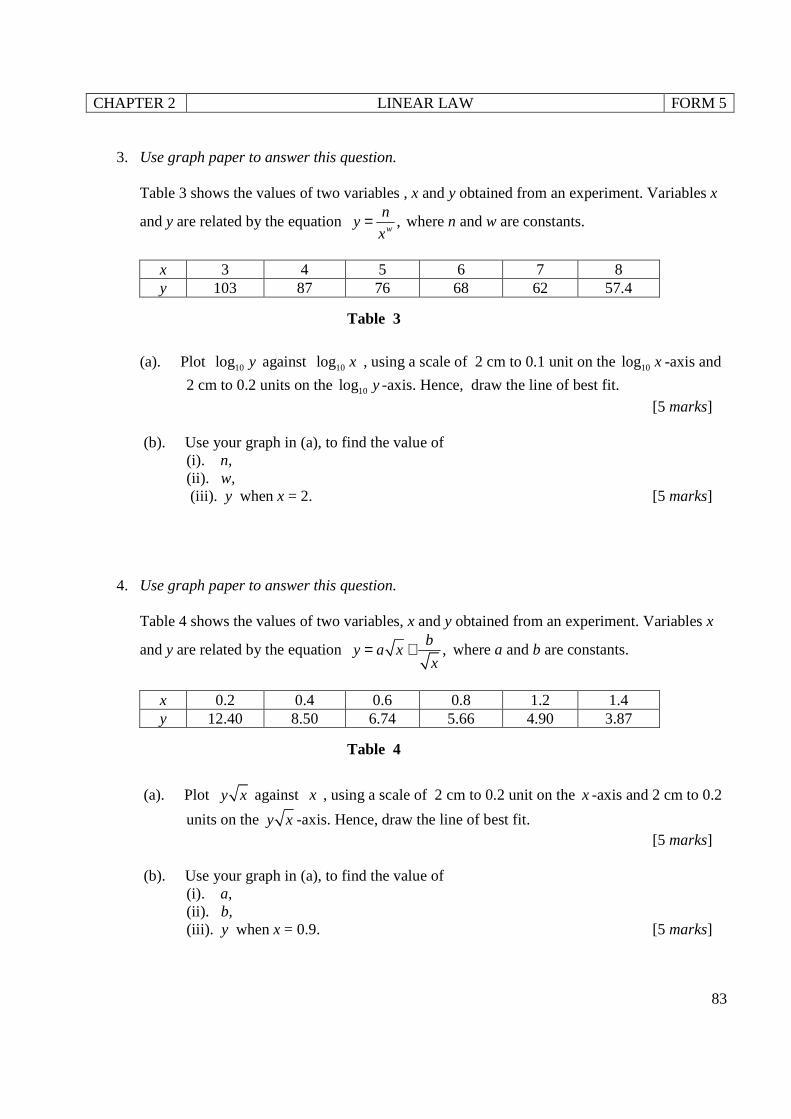
CHAPTER 2 LINEAR LAW FORM 5
83
3. Use graph paper to answer this question.
Table 3 shows the values of two variables , x and y obtained from an experiment. Variables x
and y are related by the equation ,w
ny
x= where n and w are constants.
x 3 4 5 6 7 8 y 103 87 76 68 62 57.4
(a). Plot 10log y against 10log x , using a scale of 2 cm to 0.1 unit on the 10log x -axis and
2 cm to 0.2 units on the 10log y -axis. Hence, draw the line of best fit.
[5 marks] (b). Use your graph in (a), to find the value of (i). n,
(ii). w, (iii). y when x = 2. [5 marks]
4. Use graph paper to answer this question.
Table 4 shows the values of two variables, x and y obtained from an experiment. Variables x
and y are related by the equation ,b
y a xx
= + where a and b are constants.
x 0.2 0.4 0.6 0.8 1.2 1.4 y 12.40 8.50 6.74 5.66 4.90 3.87
(a). Plot y x against x , using a scale of 2 cm to 0.2 unit on the x -axis and 2 cm to 0.2
units on the y x -axis. Hence, draw the line of best fit. [5 marks]
(b). Use your graph in (a), to find the value of (i). a,
(ii). b, (iii). y when x = 0.9. [5 marks]
Table 3
Table 4
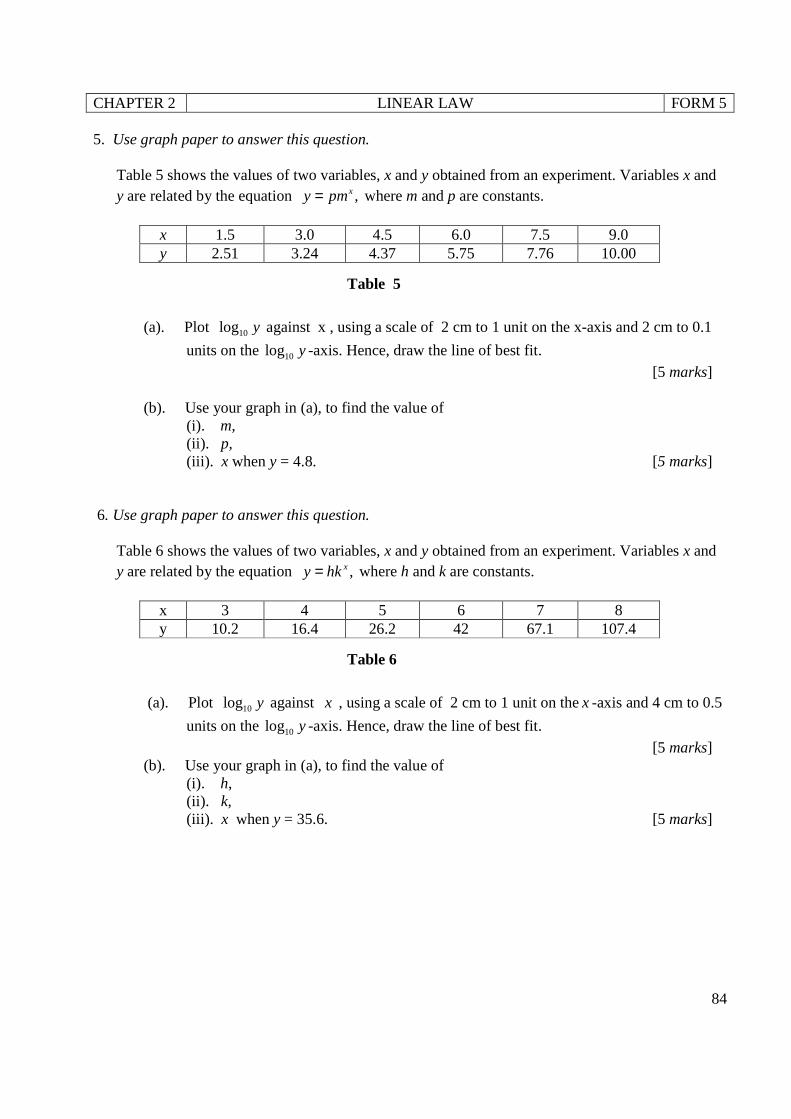
CHAPTER 2 LINEAR LAW FORM 5
84
5. Use graph paper to answer this question.
Table 5 shows the values of two variables, x and y obtained from an experiment. Variables x and y are related by the equation ,xy pm= where m and p are constants.
x 1.5 3.0 4.5 6.0 7.5 9.0 y 2.51 3.24 4.37 5.75 7.76 10.00
(a). Plot 10log y against x , using a scale of 2 cm to 1 unit on the x-axis and 2 cm to 0.1
units on the 10log y -axis. Hence, draw the line of best fit.
[5 marks] (b). Use your graph in (a), to find the value of (i). m, (ii). p, (iii). x when y = 4.8. [5 marks]
6. Use graph paper to answer this question.
Table 6 shows the values of two variables, x and y obtained from an experiment. Variables x and y are related by the equation ,xy hk= where h and k are constants.
x 3 4 5 6 7 8 y 10.2 16.4 26.2 42 67.1 107.4
(a). Plot 10log y against x , using a scale of 2 cm to 1 unit on thex -axis and 4 cm to 0.5
units on the 10log y -axis. Hence, draw the line of best fit.
[5 marks] (b). Use your graph in (a), to find the value of (i). h, (ii). k, (iii). x when y = 35.6. [5 marks]
Table 5
Table 6
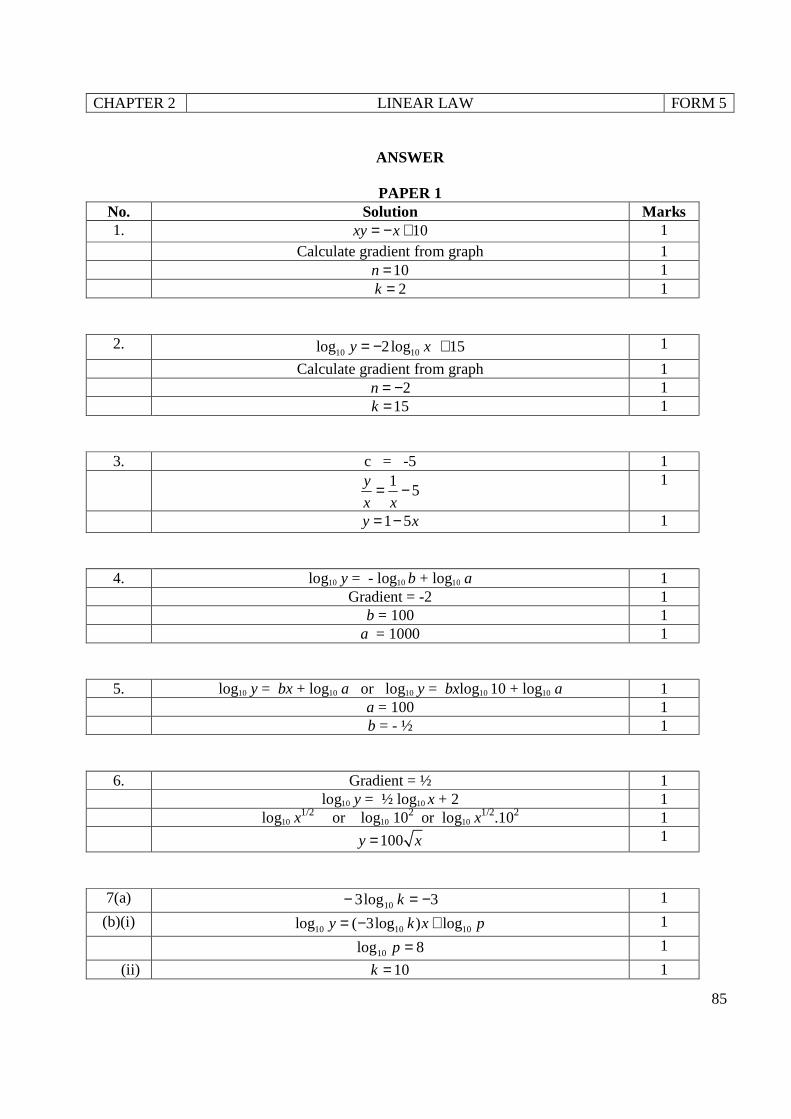
CHAPTER 2 LINEAR LAW FORM 5
85
ANSWER
PAPER 1
No. Solution Marks 1. 10xy x= − + 1 Calculate gradient from graph 1 10n = 1 2k = 1
2. 10 10log 2log 15y x= − + 1
Calculate gradient from graph 1 2n = − 1 15k = 1
3. c = -5 1 1
5y
x x= −
1
1 5y x= − 1
4. log10 y = - log10 b + log10 a 1 Gradient = -2 1 b = 100 1 a = 1000 1
5. log10 y = bx + log10 a or log10 y = bxlog10 10 + log10 a 1 a = 100 1 b = - ½ 1
6. Gradient = ½ 1 log10 y = ½ log10 x + 2 1 log10 x
1/2 or log10 102 or log10 x1/2.102 1
100y x= 1
7(a) 3log3 10 −=− k 1
(b)(i) 10 10 10log ( 3log ) logy k x p= − + 1
8log10 =p 1
(ii) 10=k 1
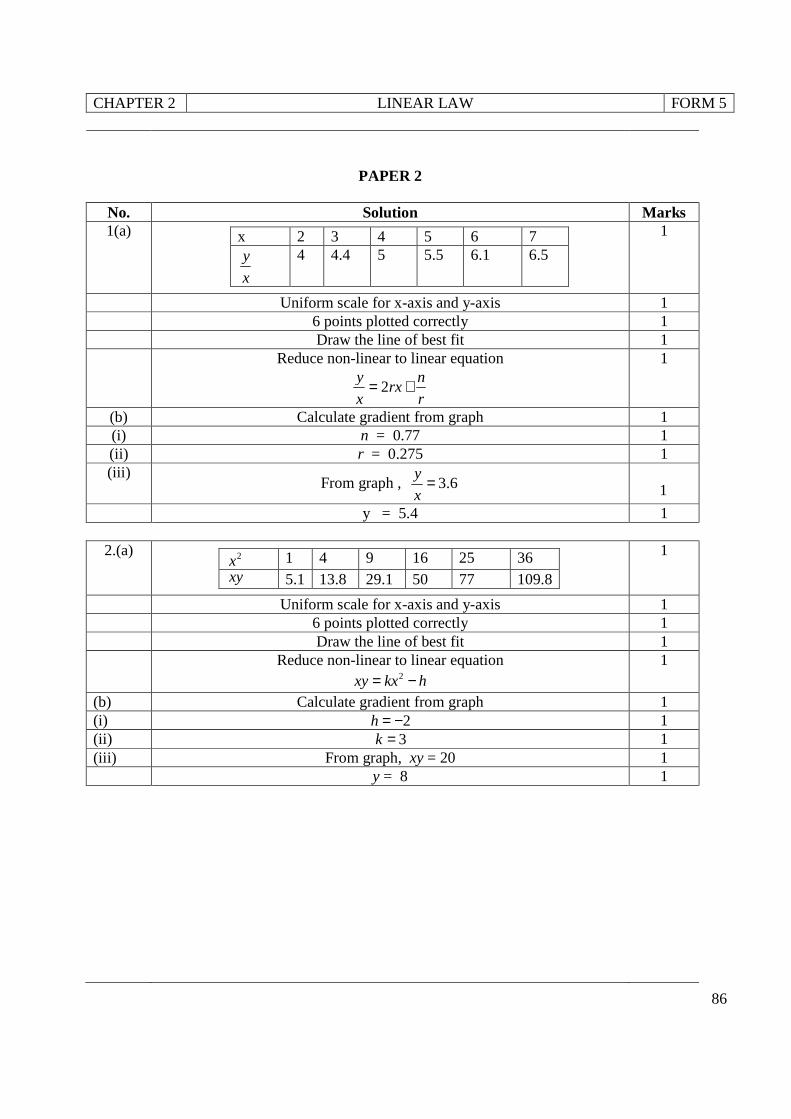
CHAPTER 2 LINEAR LAW FORM 5
86
PAPER 2
No. Solution Marks 1(a)
1
Uniform scale for x-axis and y-axis 1 6 points plotted correctly 1
Draw the line of best fit 1 Reduce non-linear to linear equation
2y n
rxx r
= +
1
(b) Calculate gradient from graph 1 (i) n = 0.77 1 (ii) r = 0.275 1 (iii)
From graph , 3.6y
x=
1
y = 5.4 1
2.(a)
1
Uniform scale for x-axis and y-axis 1 6 points plotted correctly 1 Draw the line of best fit 1 Reduce non-linear to linear equation
2xy kx h= − 1
(b) Calculate gradient from graph 1 (i) 2h = − 1 (ii) 3k = 1 (iii) From graph, xy = 20 1 y = 8 1
x 2 3 4 5 6 7 y
x
4 4.4 5 5.5 6.1 6.5
2x 1 4 9 16 25 36 xy 5.1 13.8 29.1 50 77 109.8
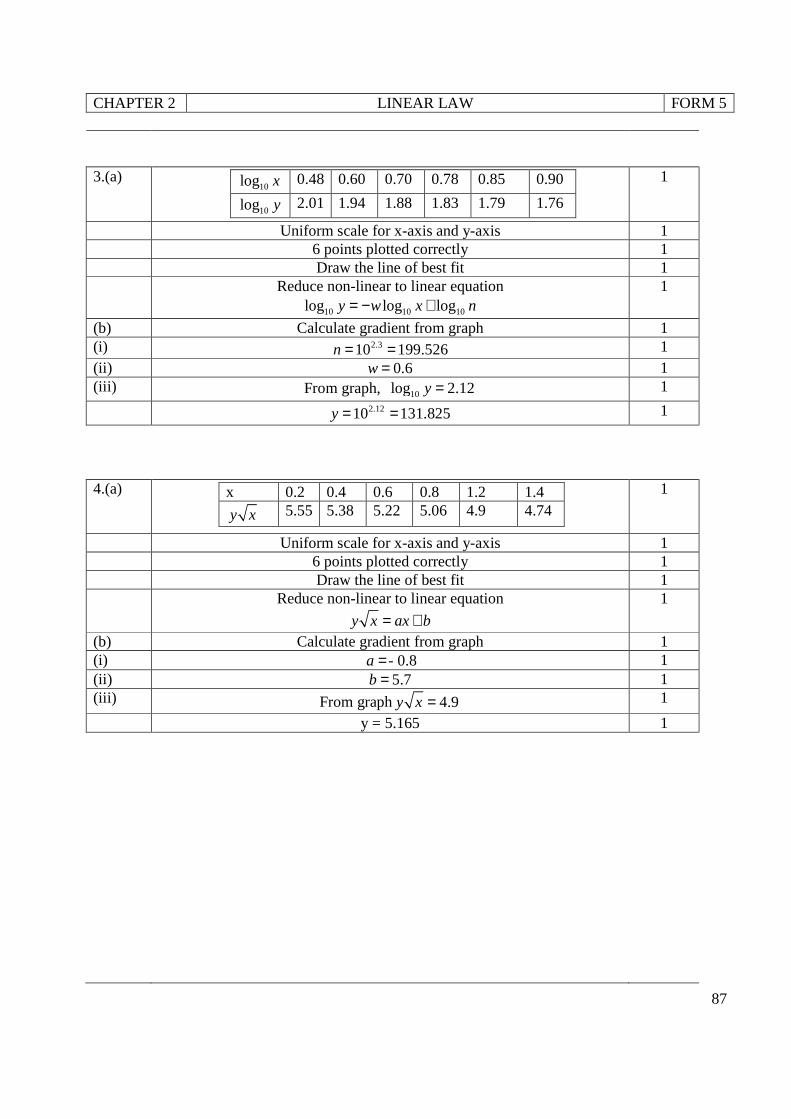
CHAPTER 2 LINEAR LAW FORM 5
87
3.(a)
1
Uniform scale for x-axis and y-axis 1 6 points plotted correctly 1 Draw the line of best fit 1
Reduce non-linear to linear equation
10 10 10log log logy w x n= − + 1
(b) Calculate gradient from graph 1 (i) 2.310 199.526n = = 1 (ii) 0.6w = 1 (iii) From graph, 10log 2.12y = 1
2.1210 131.825y = = 1
4.(a)
1
Uniform scale for x-axis and y-axis 1 6 points plotted correctly 1 Draw the line of best fit 1 Reduce non-linear to linear equation
y x ax b= +
1
(b) Calculate gradient from graph 1 (i) a = - 0.8 1 (ii) 5.7b = 1 (iii) From graph 4.9y x = 1
y = 5.165 1
x 0.2 0.4 0.6 0.8 1.2 1.4
y x 5.55 5.38 5.22 5.06 4.9 4.74
10log x 0.48 0.60 0.70 0.78 0.85 0.90
10log y 2.01 1.94 1.88 1.83 1.79 1.76
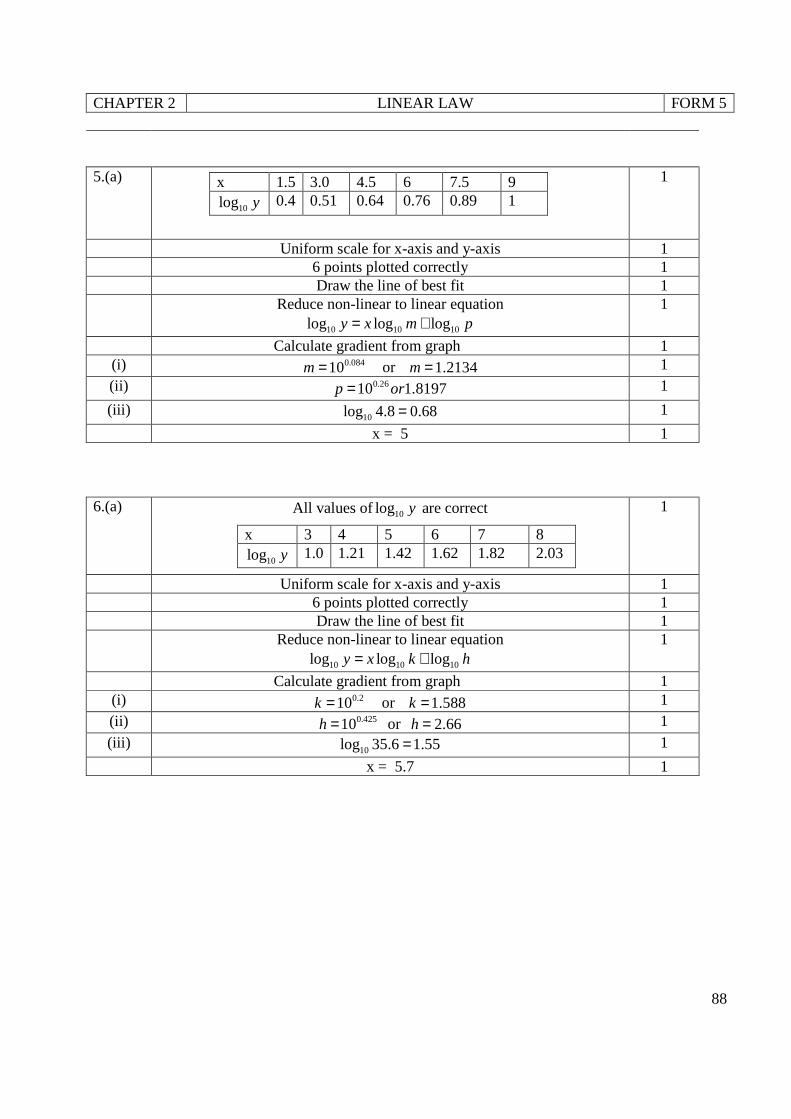
CHAPTER 2 LINEAR LAW FORM 5
88
5.(a)
1
Uniform scale for x-axis and y-axis 1 6 points plotted correctly 1 Draw the line of best fit 1 Reduce non-linear to linear equation
10 10 10log log logy x m p= + 1
Calculate gradient from graph 1 (i) 0.08410m = or 1.2134m = 1 (ii) 0.2610 1.8197p or= 1
(iii) 10log 4.8 0.68= 1
x = 5 1
6.(a) All values of 10log y are correct
1
Uniform scale for x-axis and y-axis 1 6 points plotted correctly 1 Draw the line of best fit 1 Reduce non-linear to linear equation
10 10 10log log logy x k h= + 1
Calculate gradient from graph 1 (i) 0.210k = or 1.588k = 1 (ii) 0.42510h = or 2.66h = 1 (iii)
10log 35.6 1.55= 1
x = 5.7 1
x 3 4 5 6 7 8
10log y 1.0 1.21 1.42 1.62 1.82 2.03
x 1.5 3.0 4.5 6 7.5 9
10log y 0.4 0.51 0.64 0.76 0.89 1
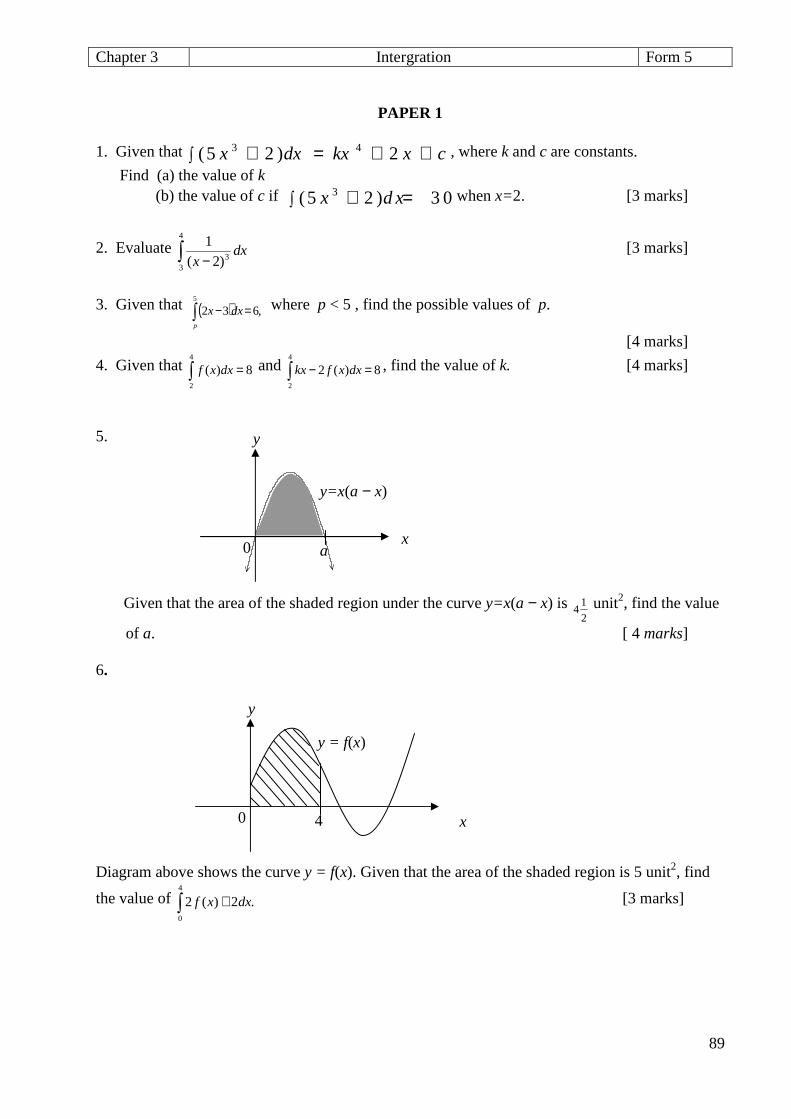
Chapter 3 Intergration Form 5
89
PAPER 1
1. Given that cxkxdxx ++=+∫ 2)25( 43 , where k and c are constants.
Find (a) the value of k (b) the value of c if 3(5 2 ) 3 0x d x∫ + = when x=2. [3 marks]
2. Evaluate ∫ −
4
33)2(
1dx
x [3 marks]
3. Given that ( )∫ =−
5
,632p
dxx where p < 5 , find the possible values of p.
[4 marks]
4. Given that 8)(4
2
=∫ dxxf and 8)(24
2
=−∫ dxxfkx , find the value of k. [4 marks]
5. Given that the area of the shaded region under the curve y=x(a − x) is
2
14 unit2, find the value
of a. [ 4 marks] 6. Diagram above shows the curve y = f(x). Given that the area of the shaded region is 5 unit2, find
the value of .2)(24
0
dxxf +∫ [3 marks]
a 0
y=x(a − x)
x
y
4 0
y = f(x)
x
y
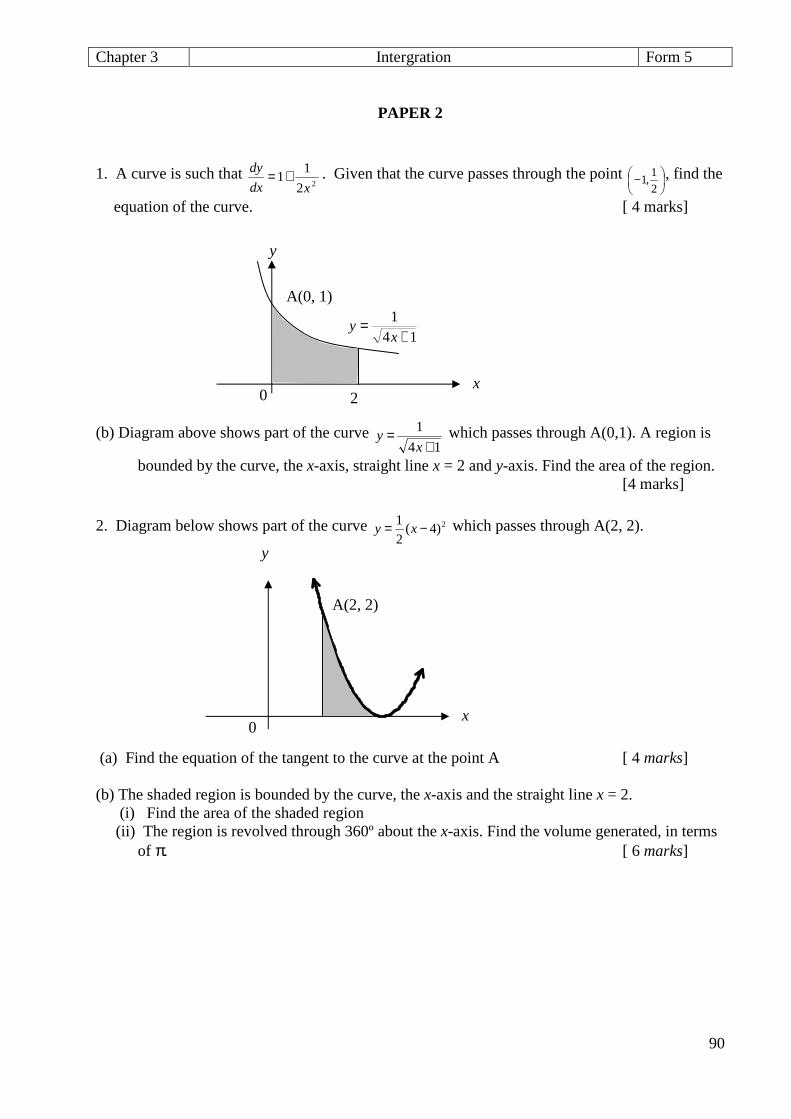
Chapter 3 Intergration Form 5
90
PAPER 2
1. A curve is such that 22
11
xdx
dy+= . Given that the curve passes through the point
−2
1,1 , find the
equation of the curve. [ 4 marks]
(b) Diagram above shows part of the curve 14
1
+=
xy which passes through A(0,1). A region is
bounded by the curve, the x-axis, straight line x = 2 and y-axis. Find the area of the region. [4 marks]
2. Diagram below shows part of the curve 2)4(2
1 −= xy which passes through A(2, 2).
(a) Find the equation of the tangent to the curve at the point A [ 4 marks] (b) The shaded region is bounded by the curve, the x-axis and the straight line x = 2. (i) Find the area of the shaded region (ii) The region is revolved through 360º about the x-axis. Find the volume generated, in terms
of π. [ 6 marks]
2 0 x
y
A(0, 1)
141
+=
xy
0 x
y
A(2, 2)
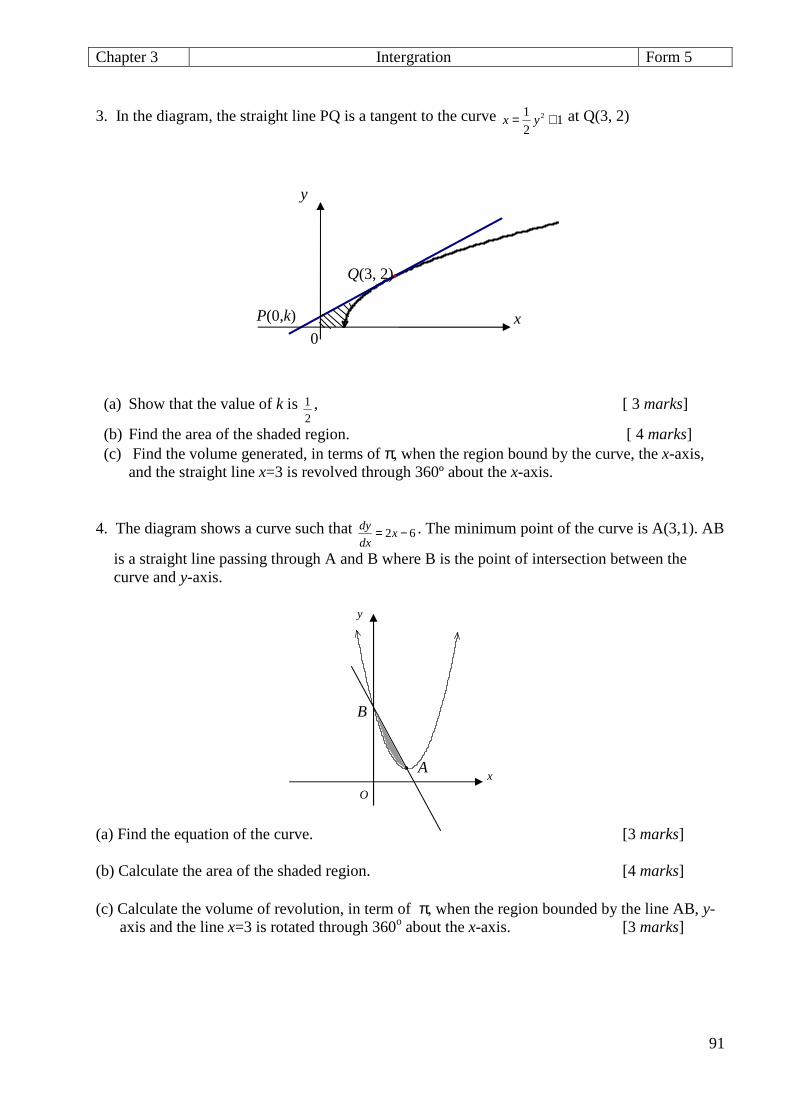
Chapter 3 Intergration Form 5
91
3. In the diagram, the straight line PQ is a tangent to the curve 1
2
1 2 += yx at Q(3, 2)
(a) Show that the value of k is
2
1 , [ 3 marks]
(b) Find the area of the shaded region. [ 4 marks] (c) Find the volume generated, in terms of π, when the region bound by the curve, the x-axis,
and the straight line x=3 is revolved through 360º about the x-axis. 4. The diagram shows a curve such that 62 −= x
dx
dy . The minimum point of the curve is A(3,1). AB
is a straight line passing through A and B where B is the point of intersection between the curve and y-axis.
(a) Find the equation of the curve. [3 marks] (b) Calculate the area of the shaded region. [4 marks] (c) Calculate the volume of revolution, in term of π, when the region bounded by the line AB, y-
axis and the line x=3 is rotated through 360o about the x-axis. [3 marks]
0 x
y
Q(3, 2)
P(0,k)
x
y
O
• A
B
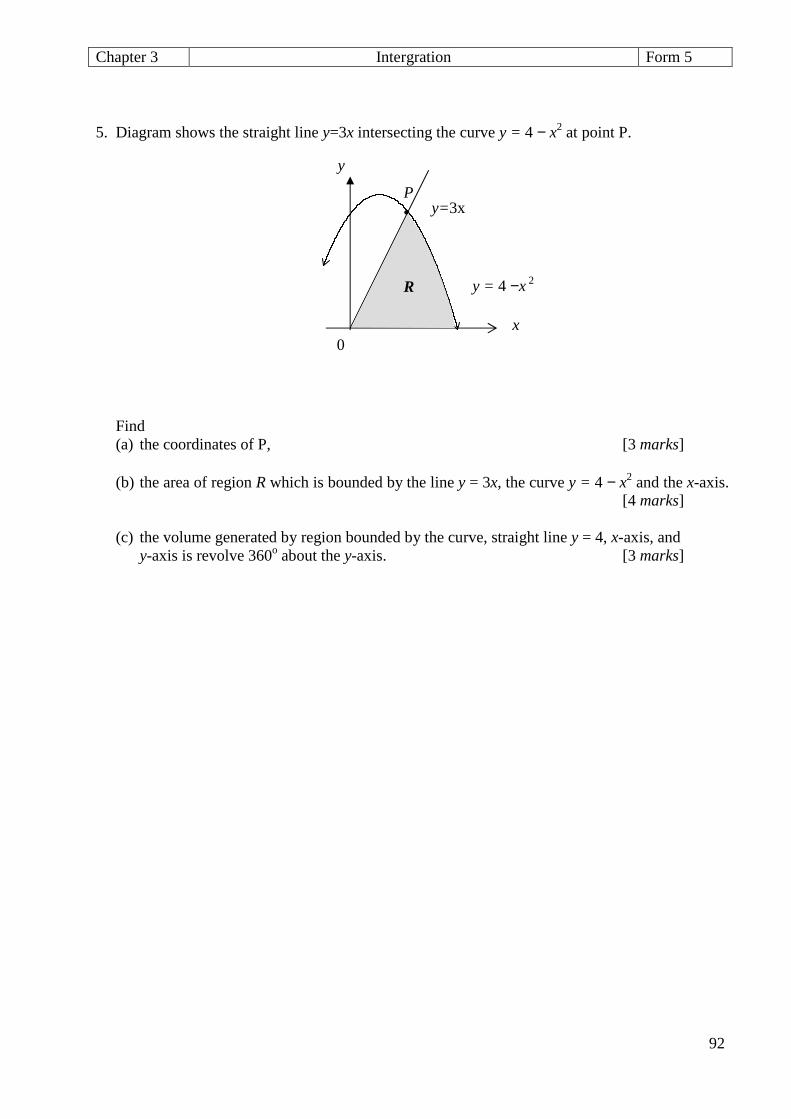
Chapter 3 Intergration Form 5
92
5. Diagram shows the straight line y=3x intersecting the curve y = 4 − x2 at point P. Find
(a) the coordinates of P, [3 marks]
(b) the area of region R which is bounded by the line y = 3x, the curve y = 4 − x2 and the x-axis. [4 marks]
(c) the volume generated by region bounded by the curve, straight line y = 4, x-axis, and y-axis is revolve 360o about the y-axis. [3 marks]
y=3x
y = 4 −x 2
0
y
x
P •
R
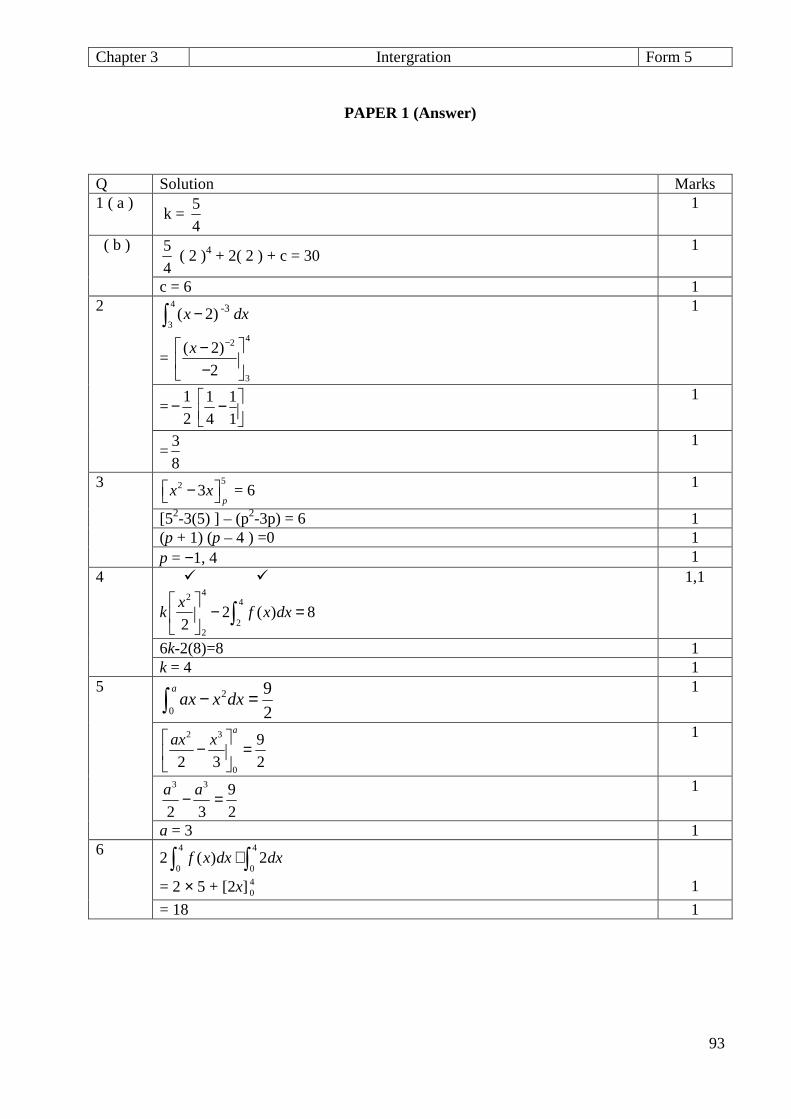
Chapter 3 Intergration Form 5
93
PAPER 1 (Answer)
Q Solution Marks 1 ( a )
k = 5
4
1
( b ) 5
4 ( 2 )4 + 2( 2 ) + c = 30
1
c = 6 1 2 4
3( 2)x −∫
-3 dx
= 42
3
( 2)
2
x − − −
1
=1
2− 1 1
4 1 −
1
=3
8
1
3 52 3p
x x − = 6 1
[52-3(5) ] – (p2-3p) = 6 1 (p + 1) (p – 4 ) =0 1 p = −1, 4 1
4 � �
k42 4
22
2 ( ) 82
xf x dx
− =
∫
1,1
6k-2(8)=8 1 k = 4 1
5 2
0
9
2
aax x dx− =∫
1
2 3
0
9
2 3 2
aax x
− =
1
3 3 9
2 3 2
a a− = 1
a = 3 1 6 2
4 4
0 0( ) 2f x dx dx+∫ ∫
= 2 × 5 + [2x] 40
1
= 18 1
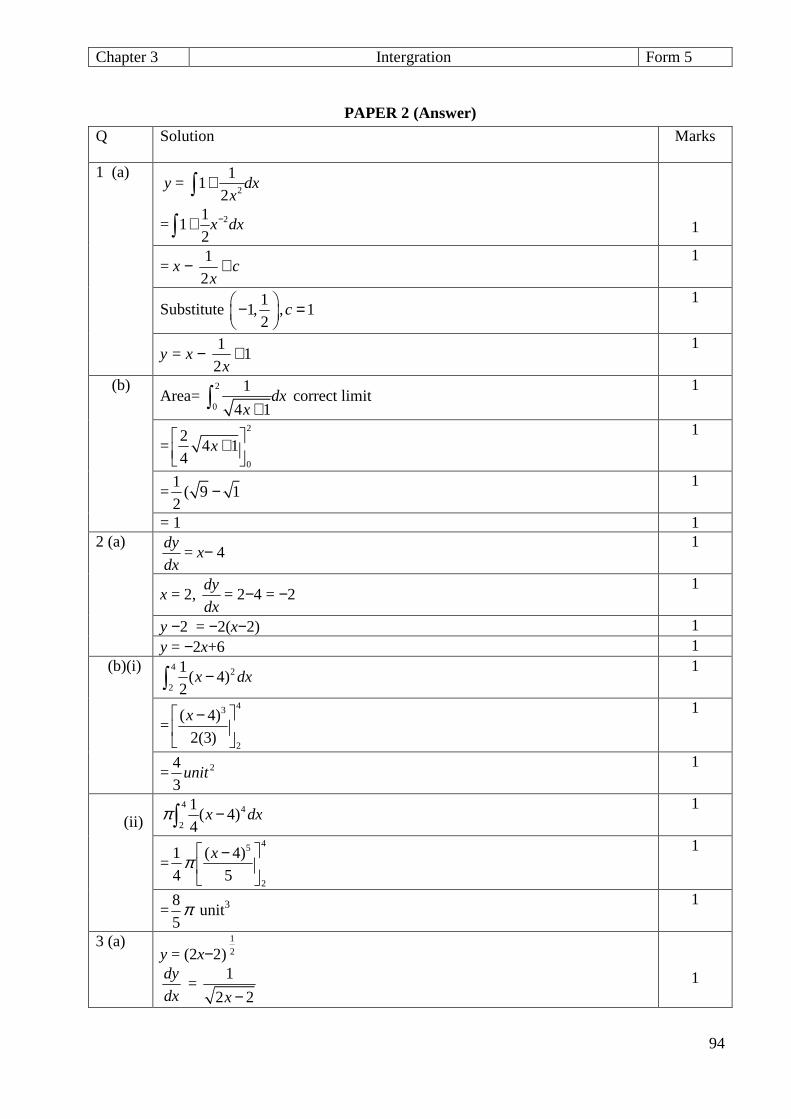
Chapter 3 Intergration Form 5
94
PAPER 2 (Answer)
Q Solution Marks
1 (a) y =
2
11
2dx
x+∫
= 211
2x dx−+∫
1
= x − 1
2c
x+
1
Substitute 1
1, , 12
c − =
1
y = x − 1
12x
+ 1
(b) Area=
2
0
1
4 1dx
x +∫ correct limit 1
=2
0
24 1
4x
+
1
=1
( 9 12
− 1
= 1 1 2 (a) dy
dx= x− 4
1
x = 2, dy
dx= 2−4 = −2
1
y −2 = −2(x−2) 1 y = −2x+6 1
(b)(i) 4 2
2
1( 4)
2x dx−∫
1
=43
2
( 4)
2(3)
x −
1
= 24
3unit
1
(ii)
4 4
2
1( 4)
4x dxπ −∫
1
=45
2
1 ( 4)
4 5
xπ −
1
=8
5π unit3
1
3 (a) y = (2x−2)
1
2 dy
dx =
1
2 2x −
1
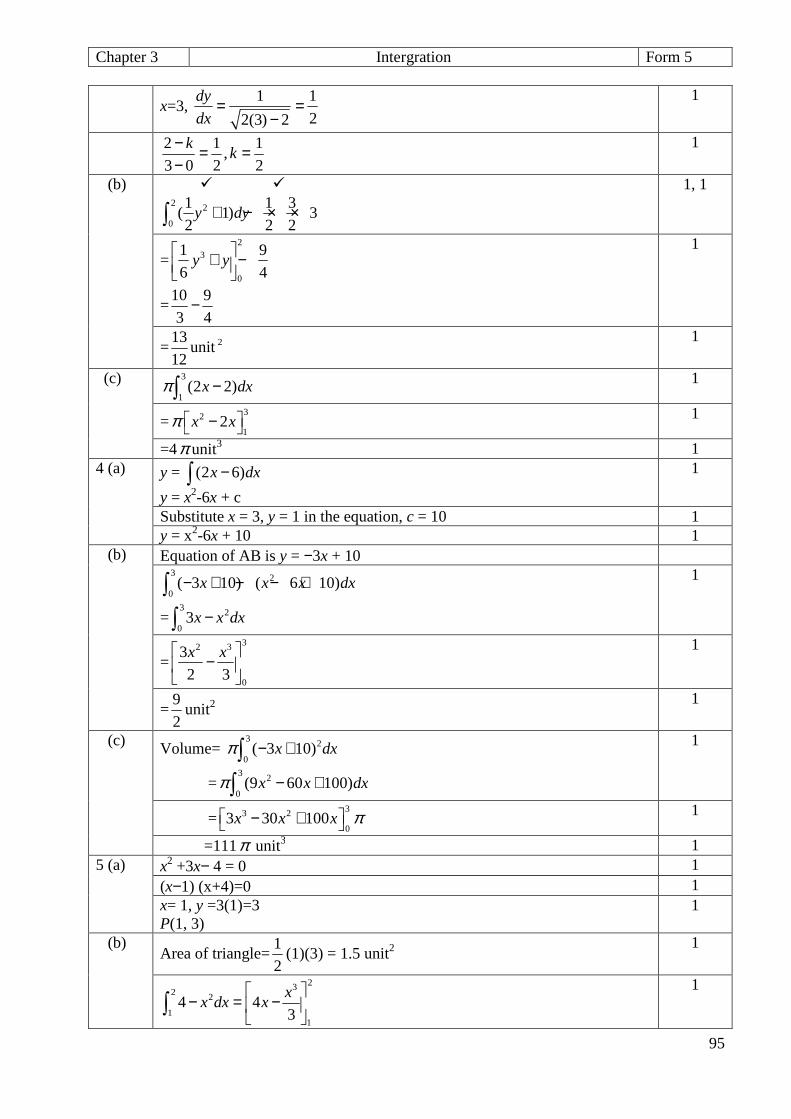
Chapter 3 Intergration Form 5
95
x=3, 1 1
22(3) 2
dy
dx= =
−
1
2 1 1,
3 0 2 2
kk
− = =−
1
(b) � � 2 2
0
1 1 3( 1) 32 2 2
y dy+ − × ×∫
1, 1
=2
3
0
1 9
6 4y y
+ −
=10 9
3 4−
1
=13
12unit 2
1
(c) 3
1(2 2)x dxπ −∫ 1
=32
12x xπ − 1
=4π unit3 1 4 (a) y = (2 6)x dx−∫
y = x2-6x + c
1
Substitute x = 3, y = 1 in the equation, c = 10 1 y = x2-6x + 10 1
(b) Equation of AB is y = −3x + 10 3 2
0( 3 10) ( 6 10)x x x dx− + − − +∫
=3 2
03x x dx−∫
1
=32 3
0
3
2 3
x x −
1
=9
2unit2
1
(c) Volume= 3 2
0( 3 10)x dxπ − +∫
=3 2
0(9 60 100)x x dxπ − +∫
1
=33 2
03 30 100x x x π − + 1
=111π unit3 1 5 (a) x2 +3x− 4 = 0 1
(x−1) (x+4)=0 1 x= 1, y =3(1)=3 P(1, 3)
1
(b) Area of triangle=
1
2(1)(3) = 1.5 unit2
1
232 2
11
4 43
xx dx x
− = −
∫
1
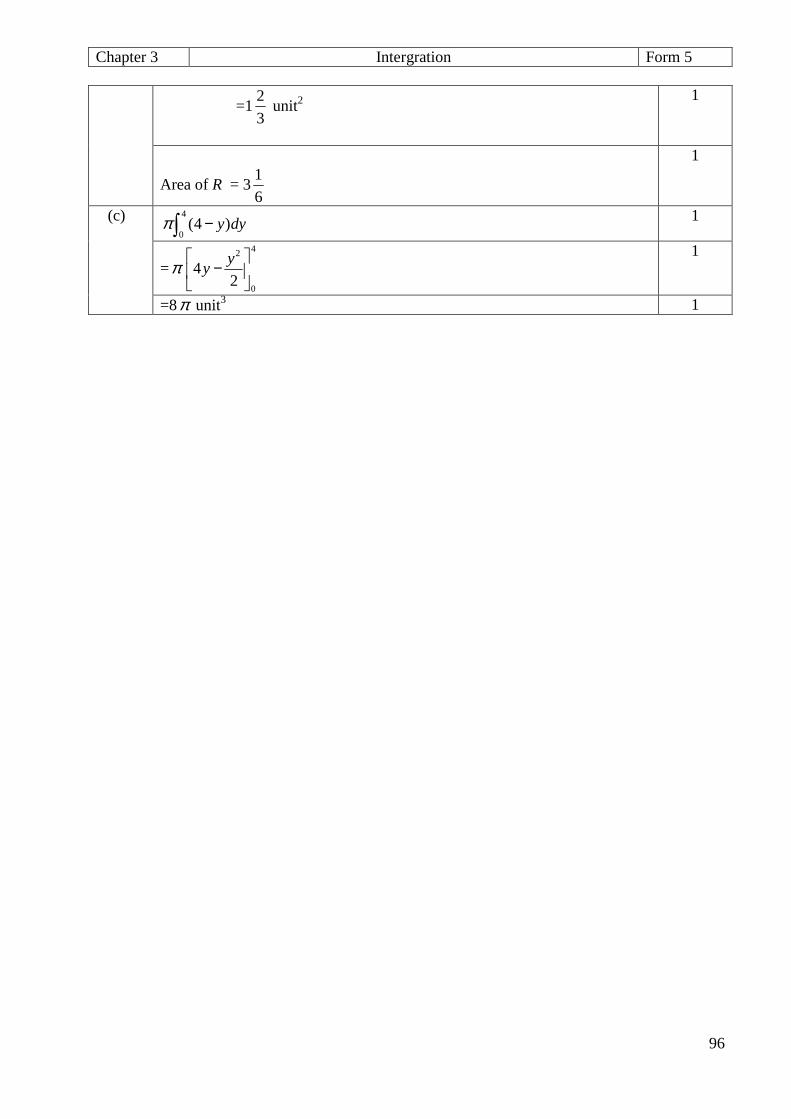
Chapter 3 Intergration Form 5
96
=1
2
3 unit2
1
Area of R = 31
6
1
(c) 4
0(4 )y dyπ −∫ 1
=π42
0
42
yy
−
1
=8π unit3 1
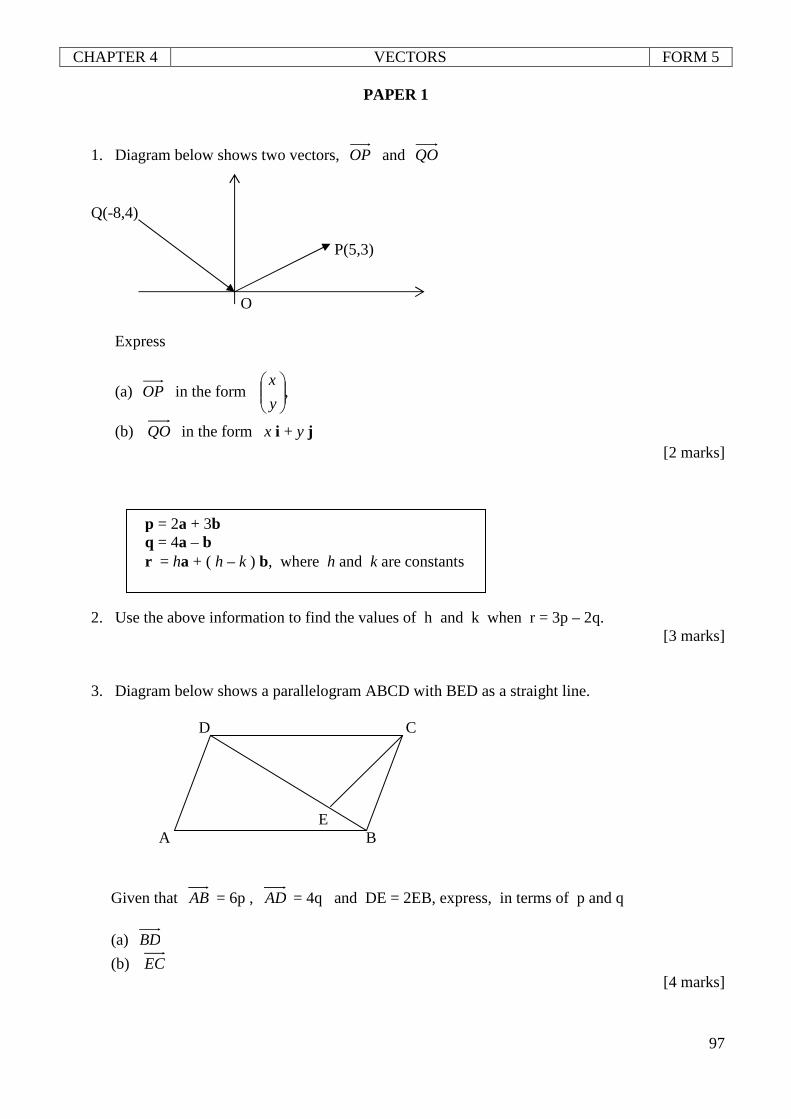
CHAPTER 4 VECTORS FORM 5
97
PAPER 1
1. Diagram below shows two vectors, OP and QO Q(-8,4) P(5,3) Express
(a) OP in the form ,
y
x
(b) QO in the form x i + y j [2 marks]
2. Use the above information to find the values of h and k when r = 3p – 2q.
[3 marks]
3. Diagram below shows a parallelogram ABCD with BED as a straight line. D C E A B
Given that AB = 6p , AD = 4q and DE = 2EB, express, in terms of p and q
(a) BD
(b) EC [4 marks]
O
p = 2a + 3b q = 4a – b r = ha + ( h – k ) b, where h and k are constants
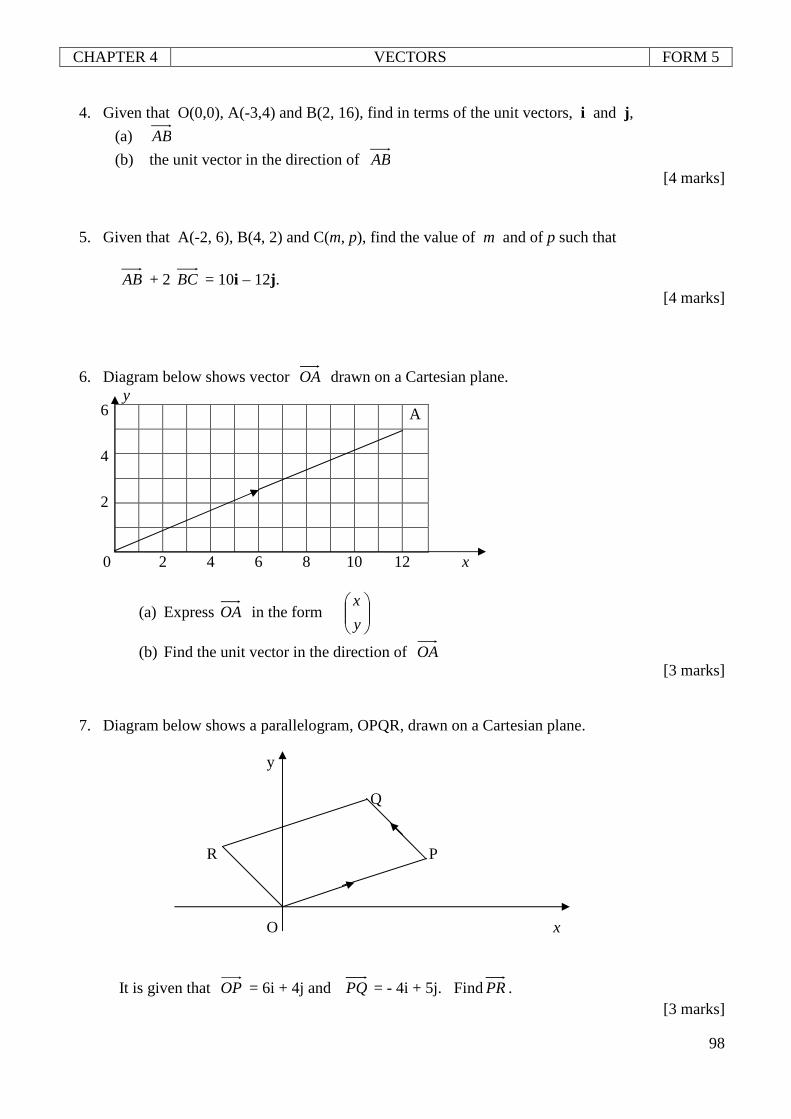
CHAPTER 4 VECTORS FORM 5
98
4. Given that O(0,0), A(-3,4) and B(2, 16), find in terms of the unit vectors, i and j,
(a) AB
(b) the unit vector in the direction of AB [4 marks]
5. Given that A(-2, 6), B(4, 2) and C(m, p), find the value of m and of p such that
AB + 2 BC = 10i – 12j. [4 marks]
6. Diagram below shows vector OA drawn on a Cartesian plane. y
A
0 2 4 6 8 10 12 x
(a) Express OA in the form
y
x
(b) Find the unit vector in the direction of OA [3 marks]
7. Diagram below shows a parallelogram, OPQR, drawn on a Cartesian plane. y Q R P O x
It is given that OP = 6i + 4j and PQ = - 4i + 5j. FindPR. [3 marks]
6
4 2
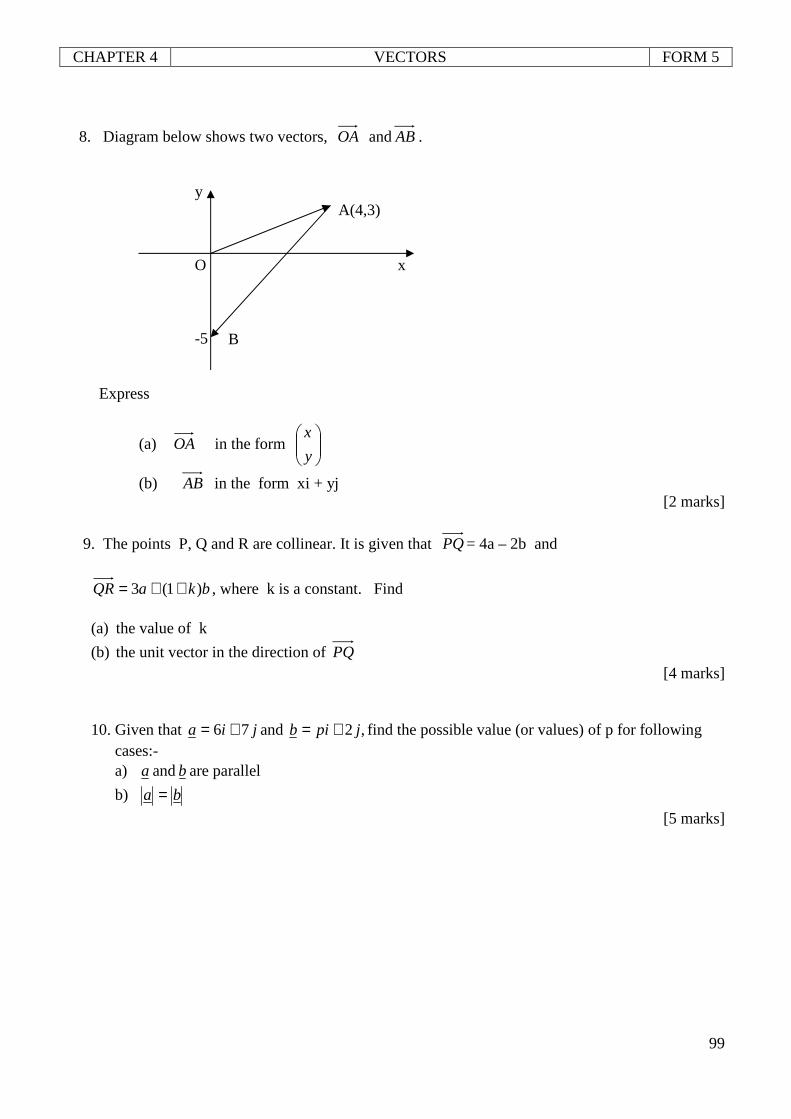
CHAPTER 4 VECTORS FORM 5
99
8. Diagram below shows two vectors, OA andAB . y A(4,3) O x -5 Express
(a) OA in the form
y
x
(b) AB in the form xi + yj [2 marks]
9. The points P, Q and R are collinear. It is given that PQ= 4a – 2b and
bkaQR )1(3 ++= , where k is a constant. Find
(a) the value of k
(b) the unit vector in the direction of PQ [4 marks]
10. Given that jia 76 += and ,2 jpib += find the possible value (or values) of p for following cases:- a) ba and are parallel
b) ba =
[5 marks]
B
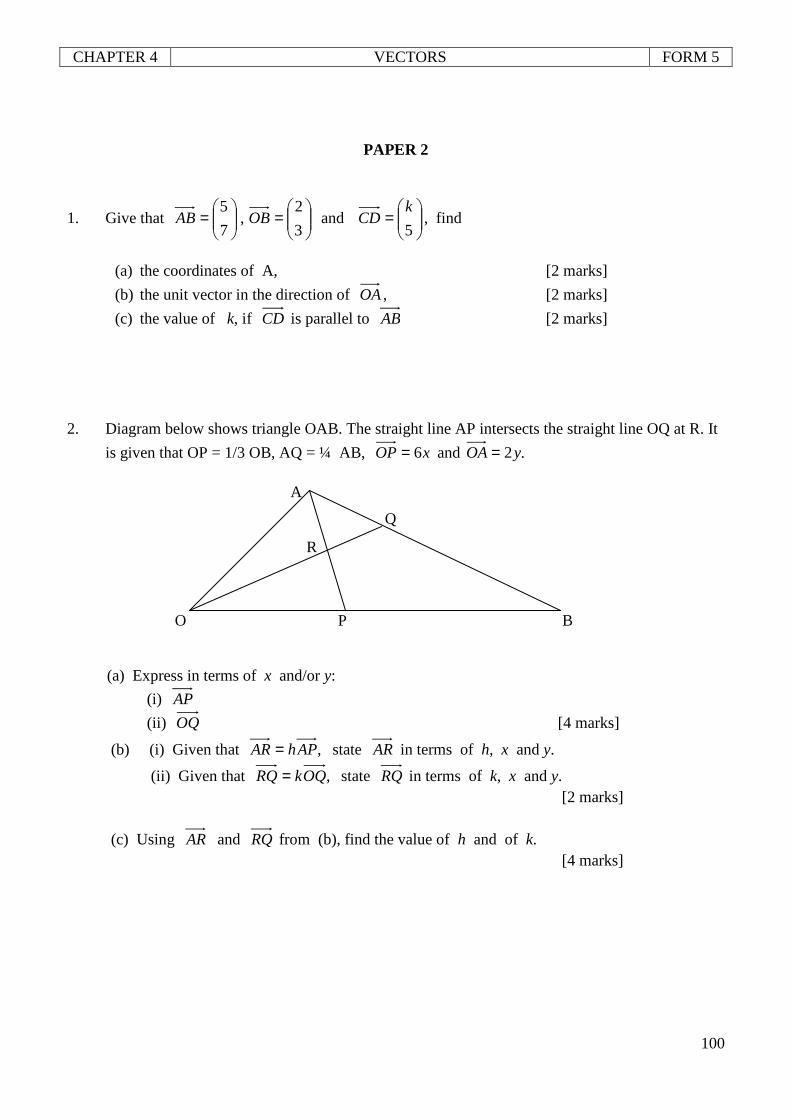
CHAPTER 4 VECTORS FORM 5
100
PAPER 2
1. Give that
=
=
3
2,
7
5OBAB and
=
5
kCD , find
(a) the coordinates of A, [2 marks]
(b) the unit vector in the direction of OA, [2 marks]
(c) the value of k, if CD is parallel to AB [2 marks] 2. Diagram below shows triangle OAB. The straight line AP intersects the straight line OQ at R. It
is given that OP = 1/3 OB, AQ = ¼ AB, xOP 6= and .2yOA= A R O P B (a) Express in terms of x and/or y:
(i) AP
(ii) OQ [4 marks]
(b) (i) Given that ,APhAR= state AR in terms of h, x and y.
(ii) Given that ,OQkRQ= state RQ in terms of k, x and y. [2 marks]
(c) Using AR and RQ from (b), find the value of h and of k. [4 marks]
Q
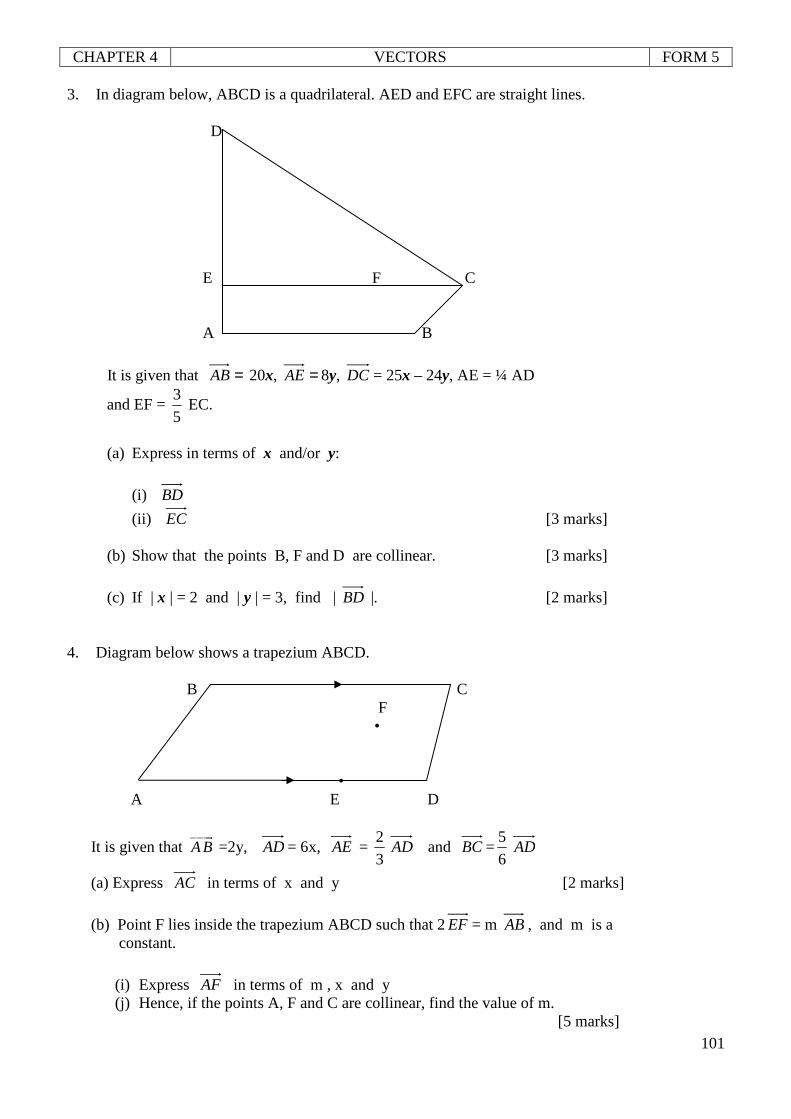
CHAPTER 4 VECTORS FORM 5
101
3. In diagram below, ABCD is a quadrilateral. AED and EFC are straight lines. D E F C A B
It is given that =AB 20x, =AE 8y, DC = 25x – 24y, AE = ¼ AD
and EF = 5
3 EC.
(a) Express in terms of x and/or y:
(i) BD
(ii) EC [3 marks] (b) Show that the points B, F and D are collinear. [3 marks]
(c) If | x | = 2 and | y | = 3, find | BD |. [2 marks]
4. Diagram below shows a trapezium ABCD.
B C F • • A E D
It is given that ABuuur
=2y, AD= 6x, AE = 3
2AD and BC=
6
5AD
(a) Express AC in terms of x and y [2 marks]
(b) Point F lies inside the trapezium ABCD such that 2EF = m AB , and m is a constant.
(i) Express AF in terms of m , x and y (j) Hence, if the points A, F and C are collinear, find the value of m.
[5 marks]
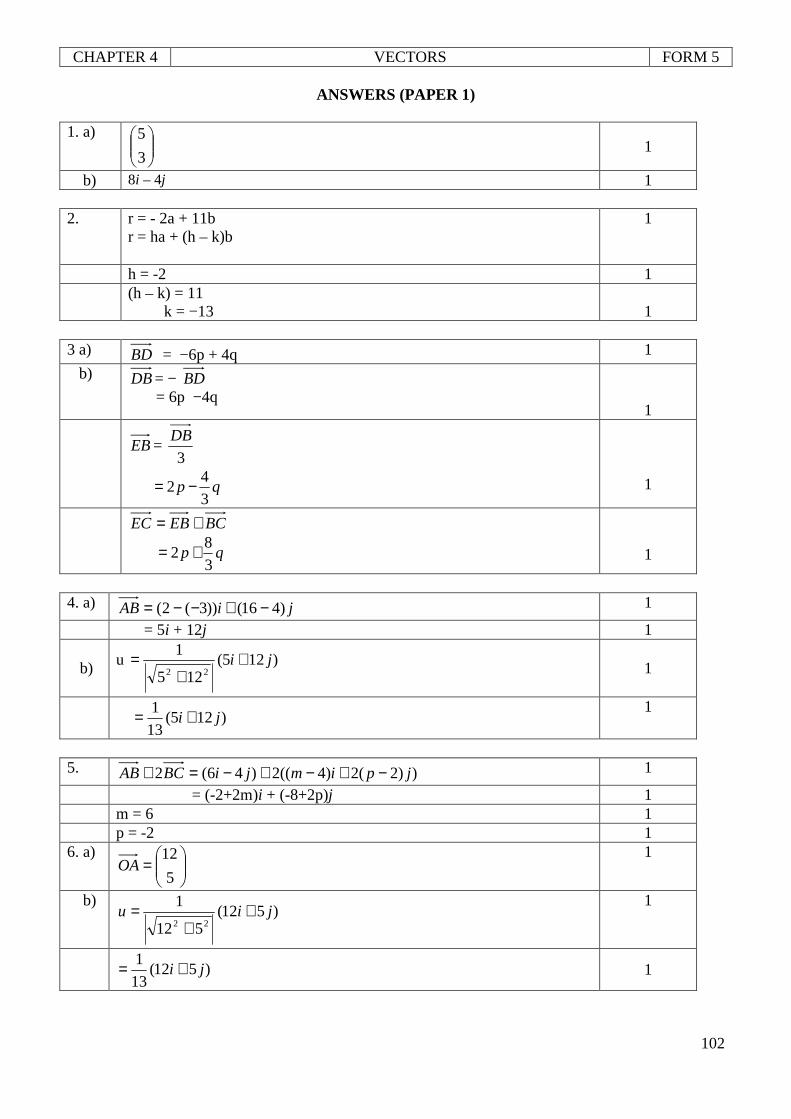
CHAPTER 4 VECTORS FORM 5
102
ANSWERS (PAPER 1) 1. a)
3
5 1
b) 8i – 4j 1 2. r = - 2a + 11b
r = ha + (h – k)b
1
h = -2 1 (h – k) = 11
k = −13 1
3 a) BD = −6p + 4q 1
b) DB= − BD = 6p −4q
1
EB=
3
DB
4
23
p q= −
1
BCEBEC +=
8
23
p q= +
1
4. a) jiAB )416())3(2( −+−−= 1
= 5i + 12j 1
b) u )125(125
122
ji ++
= 1
)125(
13
1ji +=
1
5. ))2(2)4((2)46(2 jpimjiBCAB −+−+−=+ 1
= (-2+2m)i + (-8+2p)j 1 m = 6 1
p = -2 1 6. a)
=
5
12OA
1
b) )512(
512
122
jiu ++
= 1
)512(13
1ji += 1
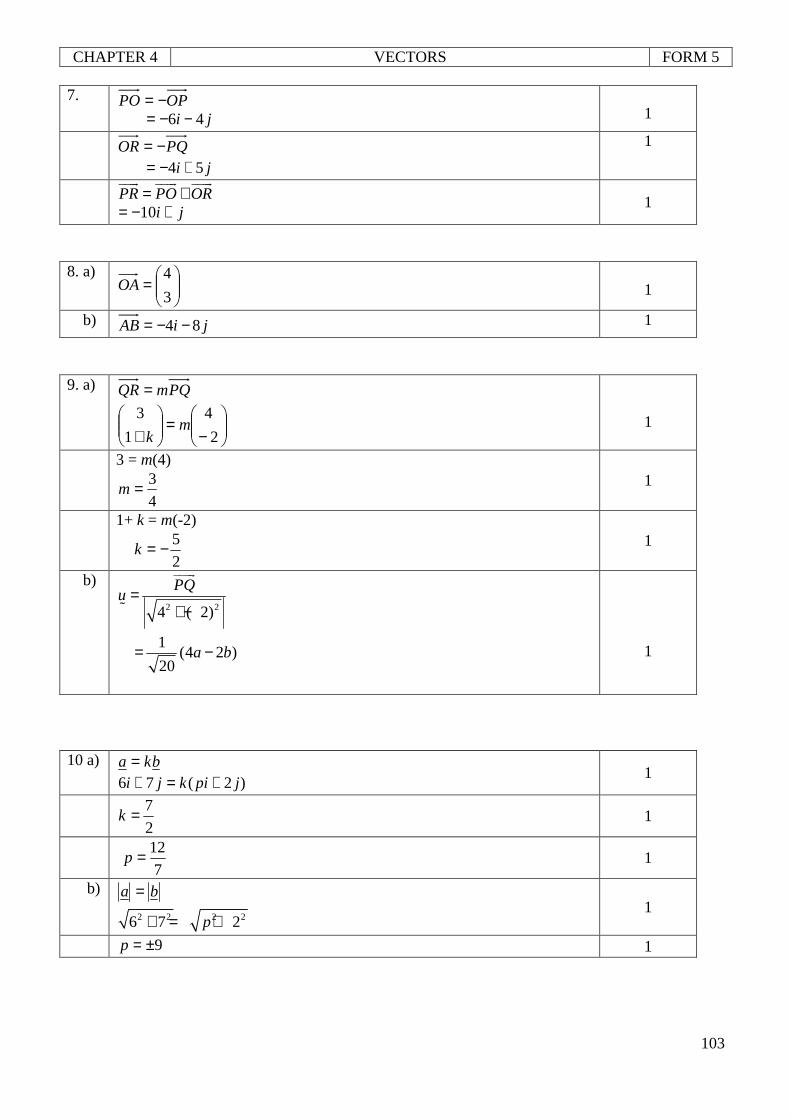
CHAPTER 4 VECTORS FORM 5
103
7. OPPO −= ji 46 −−=
1
PQOR −= ji 54 +−=
1
PR PO OR= +uuur uuur uuur
ji +−= 10
1
8. a)
=
3
4OA
1
b) jiAB 84 −−= 1
9. a) PQmQR=
−=
+ 2
4
1
3m
k
1
3 = m(4)
4
3=m 1
1+ k = m(-2)
2
5−=k 1
b)
2 24 ( 2)
PQu =
+ −
uuur
%
1
(4 2 )20
a b= −
1
10 a) bka =
)2(76 jpikji +=+ 1
2
7=k 1
7
12=p 1
b) ba =
2 2 2 26 7 2p+ = + 1
9±=p 1
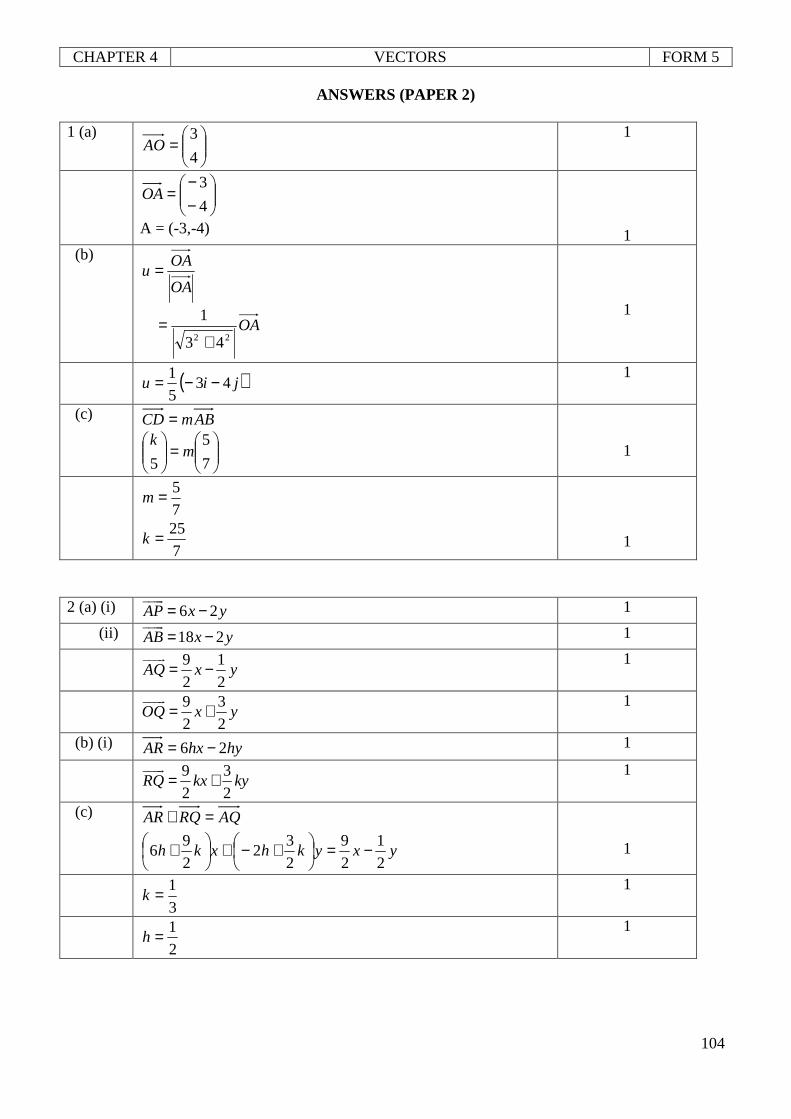
CHAPTER 4 VECTORS FORM 5
104
ANSWERS (PAPER 2) 1 (a)
=
4
3AO
1
−−
=4
3OA
A = (-3,-4)
1
(b)
OA
OAu =
OA22 43
1
+=
1
( )jiu 435
1 −−= 1
(c) ABmCD =
=
7
5
5m
k
1
7
5=m
7
25=k
1
2 (a) (i) 6 2AP x y= −
uuur 1
(ii) 18 2AB x y= −uuur
1
9 1
2 2AQ x y= −uuur
1
9 3
2 2OQ x y= +uuur
1
(b) (i) hyhxAR 26 −= 1
9 3
2 2RQ kx ky= +uuur
1
(c) AQRQAR =+
yxykhxkh2
1
2
9
2
32
2
96 −=
+−+
+
1
3
1=k 1
2
1=h 1
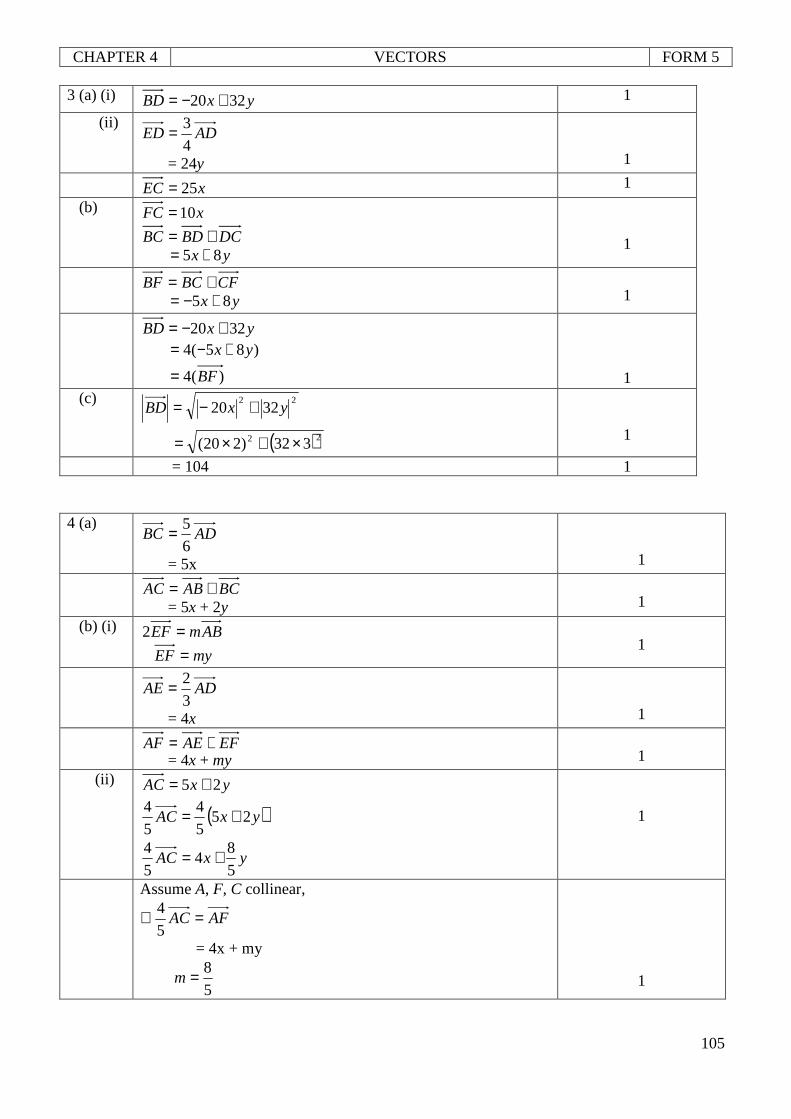
CHAPTER 4 VECTORS FORM 5
105
3 (a) (i) yxBD 3220 +−= 1
(ii) ADED
4
3=
= 24y
1
xEC 25= 1
(b) xFC 10=
DCBDBC += yx 85 +=
1
CFBCBF += yx 85 +−=
1
yxBD 3220 +−= )85(4 yx +−=
)(4 BF=
1
(c) 223220 yxBD +−=
( )22 332)220( ×+×=
1
= 104 1 4 (a)
ADBC6
5=
= 5x
1
BCABAC += = 5x + 2y
1
(b) (i) ABmEF =2
myEF =
1
ADAE
3
2=
= 4x
1
EFAEAF += = 4x + my
1
(ii) yxAC 25 +=
( )yxAC 255
4
5
4 +=
yxAC5
84
5
4 +=
1
Assume A, F, C collinear,
AFAC =∴5
4
= 4x + my
5
8=m
1
CHAPTER 5 TRIGONOMETRIC FUNCTIONS FORM 5
106
PAPER 1
1. Given θ is an acute angle andsin pθ = . Express each of the following in terms of p. [3 marks]
a) tanθ
b) ( )cos 90oec θ−
2. Given cos pθ = and 270 360o oθ≤ ≤ .Express each of the following in terms of p.
[3 marks]
a) secθ
b) ( )cot 90o θ−
3. Given tan rθ = , where r is a constant and 180 270o oθ≤ ≤ . Find in terms of r. [3 marks]
a) cotθ
b) tan 2θ
4. Solve the equation 26cos 13cot 0ec x x− = for 0 360o ox≤ ≤ [4 marks]
5. Solve the equation 2 22sin cos sin 1A A A− = + for 0 360o oA≤ ≤ [4 marks]
6. Solve the equation 2sin7cos2 2 −= yy for 0 360o oy≤ ≤ [4 marks]
7. Solve the equation 2 015cos cos 4cos60x x= + for 0 360o oA≤ ≤ [4 marks]
8. Solve the equation 3cot 2sin 0x x+ = for 0 360o ox≤ ≤ [4 marks]
CHAPTER 5 TRIGONOMETRIC FUNCTIONS FORM 5
107
PAPER 2
1. (a) Sketch the graph of sin 2y x= for 0 180o ox≤ ≤ [4 marks]
(b) (b) Hence, by drawing suitable straight line on the same axes, find the
number of solution to the equation 1
sin cos2 360o
xx x = − for
0 180o ox≤ ≤
[3 marks]
2. (a) Sketch the graph of 3cosy x= − for 0 2x π≤ ≤ [4 marks]
(b) (b) Hence, by using the same axes, sketch a suitable graph to find the
number of solution to the equation 2
3cos 0xx
π + = for 0 2x π≤ ≤ .
State number of solutions.
[3 marks]
3. (a) Sketch the graph of 3sin 2y x= for 0 2x π≤ ≤ [4 marks]
(b) Hence, by using the same axes, sketch a suitable straight line to find
the number of solution to the equation 2 3sin 22
xx
π− = for
0 2x π≤ ≤
[3 marks]
4. (a) Prove that
cot tancos 2
2
x xec x
+ = [2 marks]
(b) (i) Sketch the graph of
32sin
2y x= for 0 2x π≤ ≤
[6 marks]
(ii) Find the equation of a suitable straight line to solve the
equation3 3 1
sin2 2 2
x xπ
= − .
Hence, on the same axes, sketch the straight line and state the
number of solutions to the equation 3 3 1
sin2 2 2
x xπ
= − for
0 2x π≤ ≤ .
5. (a) Prove that 2 2 2sec 2cos tan cos 2x x x x− − = − [2 marks]
(b) (i) Sketch the graph of cos 2y x= for 0 2x π≤ ≤ [6 marks]
(ii) Hence, using the same axes, draw a suitable straight line to find
the number of solutions to the equation 22cos 1x
xπ
= − for
0 2x π≤ ≤ .
CHAPTER 5 TRIGONOMETRIC FUNCTIONS FORM 5
108
6. (a) Prove that 2 22 2sin 2cosx x− =
[2 marks]
(b) Sketch the graph of 12tan += xy for π20 ≤≤ x . By using the same
axes, draw the straight line 9
32
y xπ
= − and state the number of solution to
equation 9
tan 2 22
x xπ
+ = for π20 ≤≤ x
[6 marks]
7. (a) Prove that 2 2 2 2cot cos tan secx ec x x x= + −
[2 marks]
(b) Sketch the graph
3cos
2y x= and 2siny x= for 0 2x π≤ ≤ . State
the number of solution to equation 1 3
sin cos2 2
x x =
for
0 2x π≤ ≤
[6 marks]
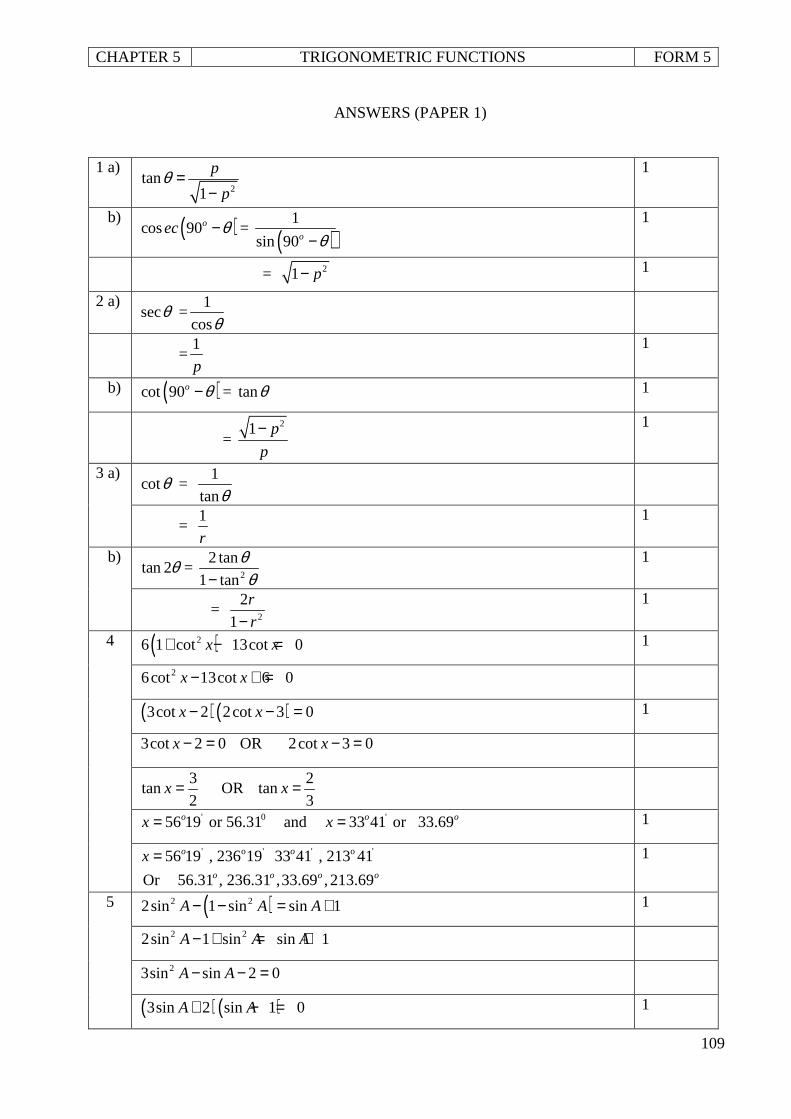
CHAPTER 5 TRIGONOMETRIC FUNCTIONS FORM 5
109
ANSWERS (PAPER 1)
1 a) 2
tan1
p
pθ =
−
1
b) ( )cos 90oec θ− = ( )1
sin 90o θ−
1
= 21 p− 1
2 a) secθ =
1
cosθ
=
1
p
1
b) ( )cot 90o θ− = tanθ 1
=
21 p
p
−
1
3 a) cotθ =
1
tanθ
= 1
r
1
b) tan 2θ =
2
2 tan
1 tan
θθ−
1
= 2
2
1
r
r−
1
4 ( )26 1 cot 13cot 0x x+ − = 1
26cot 13cot 6 0x x− + =
( ) ( )3cot 2 2cot 3 0x x− − = 1
3cot 2 0x − = OR 2cot 3 0x − =
3tan
2x = OR
2tan
3x =
' 056 19 or 56.31ox = and '33 41 or 33.69o ox = 1
' o ' ' o '56 19 , 236 19 33 41 , 213 41o ox =
Or 56.31 , 236.31 ,33.69 ,213.69o o o o
1
5 ( )2 22sin 1 sin sin 1A A A− − = + 1
2 22sin 1 sin sin 1A A A− + = +
23sin sin 2 0A A− − =
( ) ( )3sin 2 sin 1 0A A+ − = 1
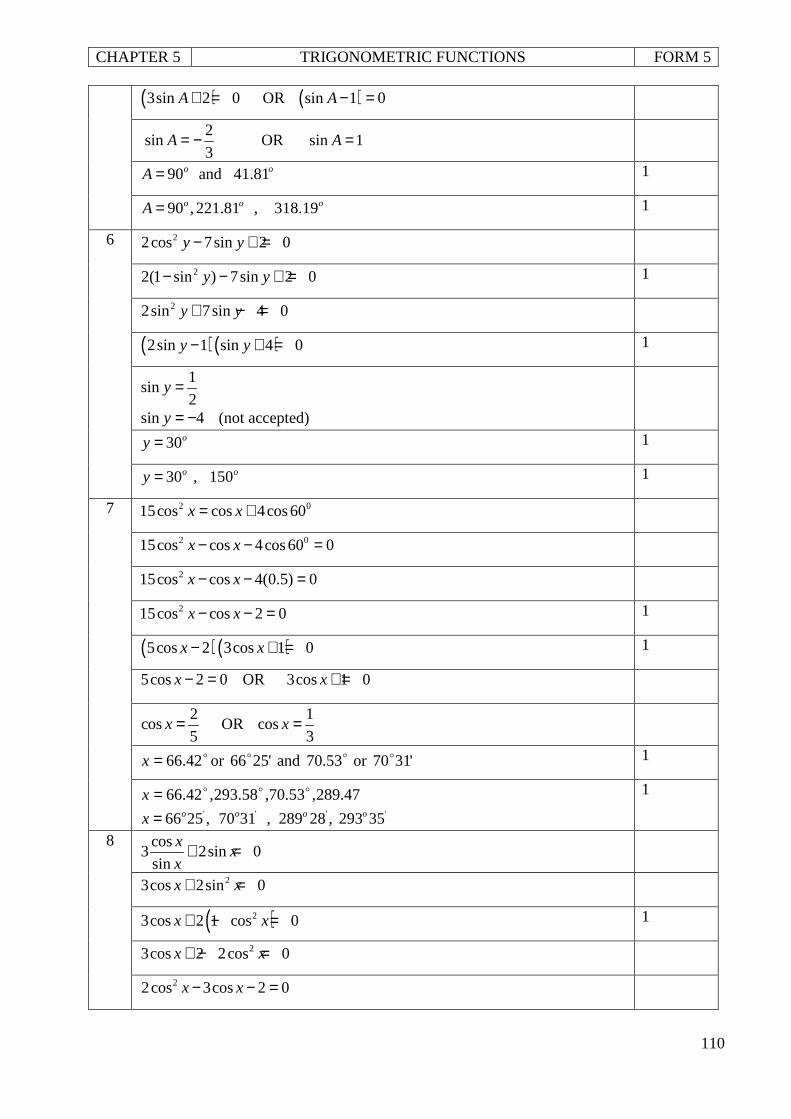
CHAPTER 5 TRIGONOMETRIC FUNCTIONS FORM 5
110
( )3sin 2 0A + = OR ( )sin 1 0A − =
2
sin3
A = − OR sin 1A =
90 and 41.81o oA = 1
90 ,221.81 , 318.19o o oA = 1
6 22cos 7sin 2 0y y− + =
22(1 sin ) 7sin 2 0y y− − + = 1
22sin 7sin 4 0y y+ − =
( ) ( )2sin 1 sin 4 0y y− + = 1
1sin
2y =
sin 4y = − (not accepted)
30oy = 1
30 , 150o oy = 1
7 2 015cos cos 4cos60x x= +
2 015cos cos 4cos60 0x x− − =
215cos cos 4(0.5) 0x x− − =
215cos cos 2 0x x− − = 1
( )( )5cos 2 3cos 1 0x x− + = 1
5cos 2 0x − = OR 3cos 1 0x + =
2cos
5x = OR
1cos
3x =
o42.66=x or '2566o and o53.70 or '3170o 1
47.289,53.70,58.293,42.66 ooo=x ' ' ' o '66 25 , 70 31 , 289 28 , 293 35o o ox =
1
8 cos3 2sin 0
sin
xx
x+ =
23cos 2sin 0x x+ =
( )23cos 2 1 cos 0x x+ − = 1
23cos 2 2cos 0x x+ − =
22cos 3cos 2 0x x− − =
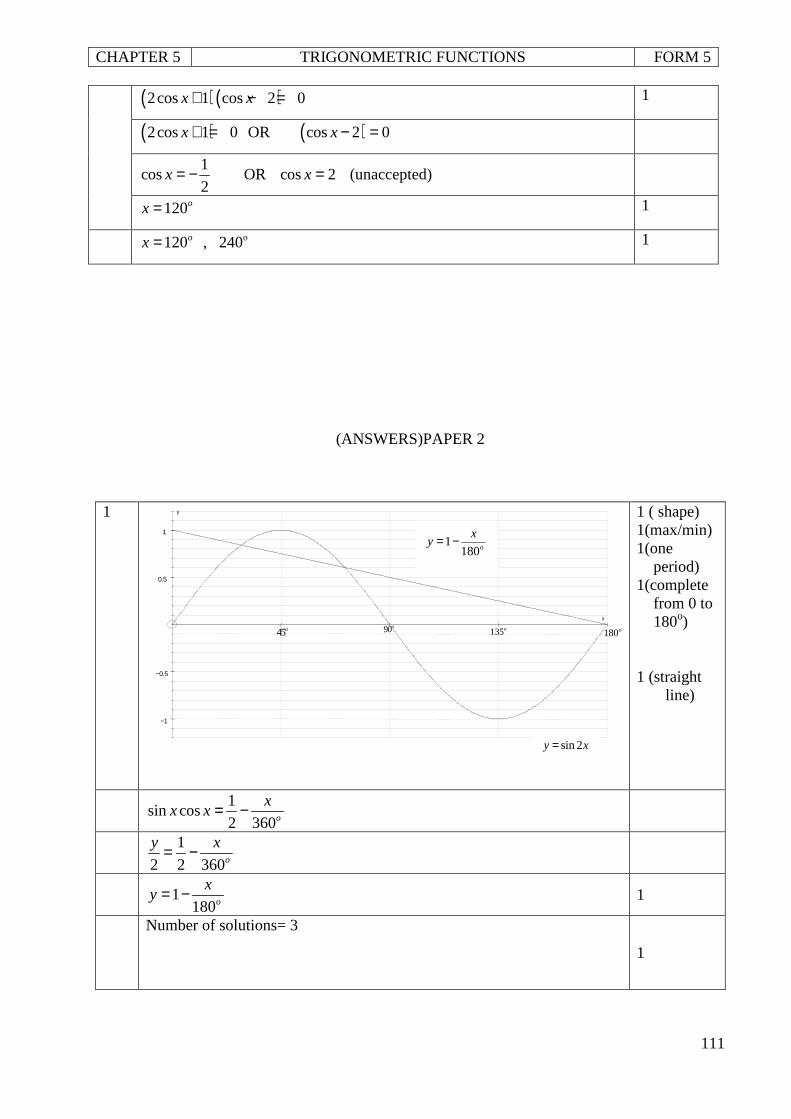
CHAPTER 5 TRIGONOMETRIC FUNCTIONS FORM 5
111
45o 90o 135o
−1
−0.5
0.5
1
x
y
1180o
xy = −
180o
sin 2y x=
(ANSWERS)PAPER 2
( ) ( )2cos 1 cos 2 0x x+ − = 1
( )2cos 1 0x + = OR ( )cos 2 0x − =
1cos
2x = − OR cos 2x = (unaccepted)
120ox = 1
o120 , 240ox = 1
1
1 ( shape) 1(max/min) 1(one
period) 1(complete
from 0 to 180o)
1 (straight
line)
1sin cos
2 360o
xx x = −
1
2 2 360o
y x= −
1
180o
xy = − 1
Number of solutions= 3
1
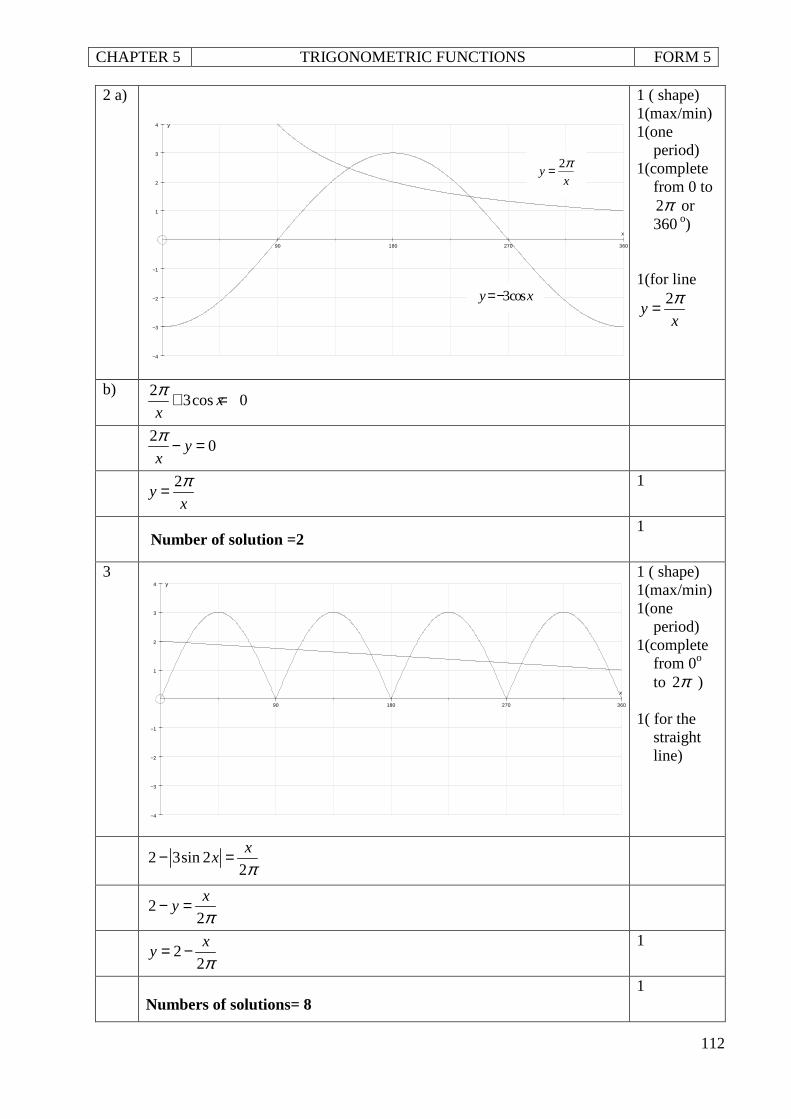
CHAPTER 5 TRIGONOMETRIC FUNCTIONS FORM 5
112
90 180 270 360
−4
−3
−2
−1
1
2
3
4
x
y
2 a)
1 ( shape) 1(max/min) 1(one
period) 1(complete
from 0 to 2π or 360 o)
1(for line
2y
x
π=
b) 23cos 0x
x
π + =
20y
x
π − =
(b)
2y
x
π= 1
Number of solution =2
1
3
90 180 270 360
−4
−3
−2
−1
1
2
3
4
x
y
1 ( shape) 1(max/min) 1(one
period) 1(complete
from 0o to 2π )
1( for the
straight line)
2 3sin 2
2
xx
π− =
2
2
xy
π− =
2
2
xy
π= −
1
Numbers of solutions= 8
1
2y
x
π=
3cosy x=−
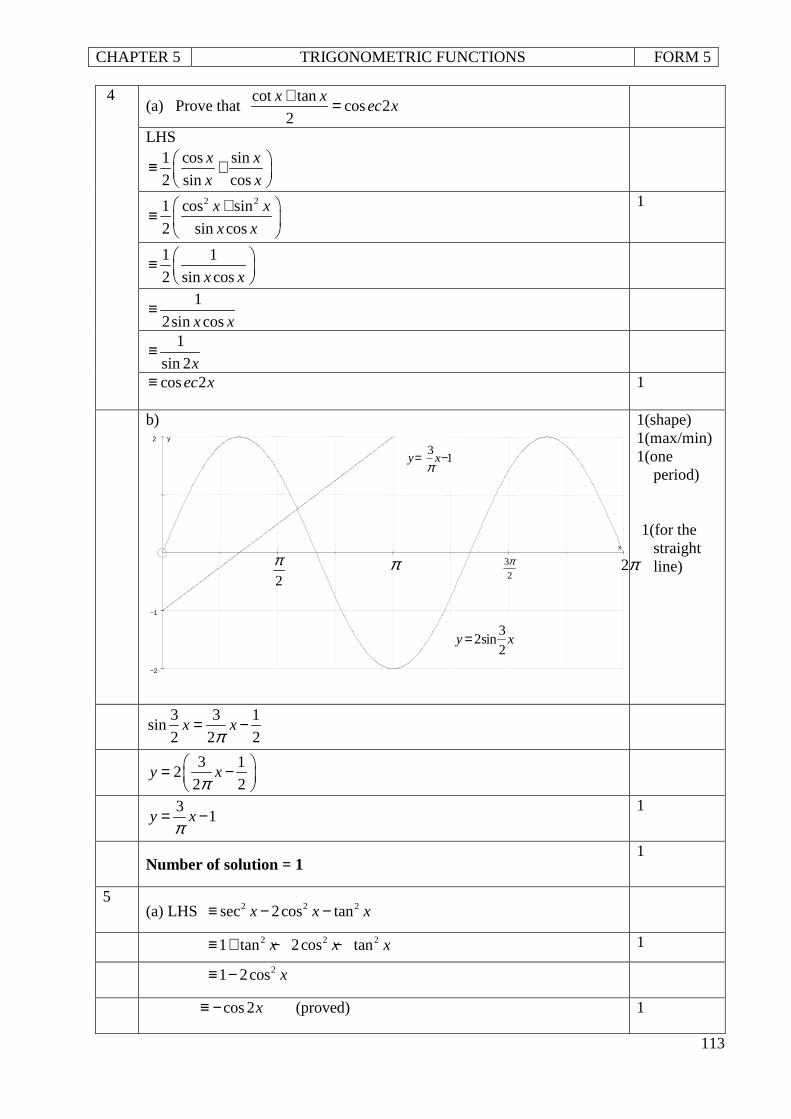
CHAPTER 5 TRIGONOMETRIC FUNCTIONS FORM 5
113
4 (a) Prove that
cot tancos 2
2
x xec x
+ =
LHS 1 cos sin
2 sin cos
x x
x x ≡ +
2 21 cos sin
2 sin cos
x x
x x
+≡
1
1 1
2 sin cosx x ≡
1
2sin cosx x≡
1
sin 2x≡
cos 2ec x≡
1
b)
1(shape) 1(max/min) 1(one
period) 1(for the
straight line)
3 3 1sin
2 2 2x x
π= −
3 12
2 2y x
π = −
31y x
π= −
1
Number of solution = 1
1
5 (a) LHS 2 2 2sec 2cos tanx x x≡ − −
2 2 21 tan 2cos tanx x x≡ + − − 1
21 2cos x≡ −
cos 2 (proved)x≡ − 1
2
π π 3
2
π 2π
−2
−1
�
2
x
y 3
1y xπ
= −
32sin
2y x=
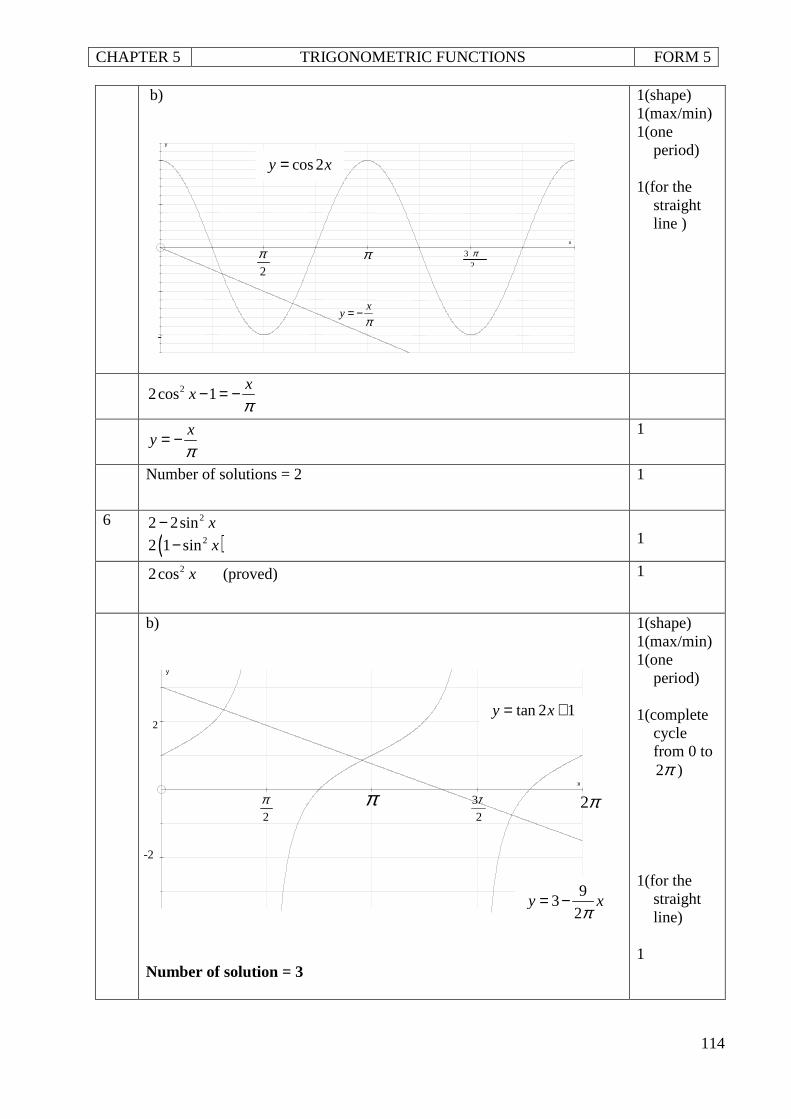
CHAPTER 5 TRIGONOMETRIC FUNCTIONS FORM 5
114
xy
π= −
2
π π 3
2
π
�-�
�
x
y
cos 2y x=
b)
1(shape) 1(max/min) 1(one
period) 1(for the
straight line )
22cos 1x
xπ
− = −
xy
π= −
1
Number of solutions = 2 1
6 22 2sin x−
( )22 1 sin x−
1
22cos x (proved) 1
b) Number of solution = 3
1(shape) 1(max/min) 1(one
period) 1(complete
cycle from 0 to 2π )
1(for the
straight line)
1
2
π π 3
2
π 2π
2
x
y
tan 2 1y x= +
93
2y x
π= −
-2
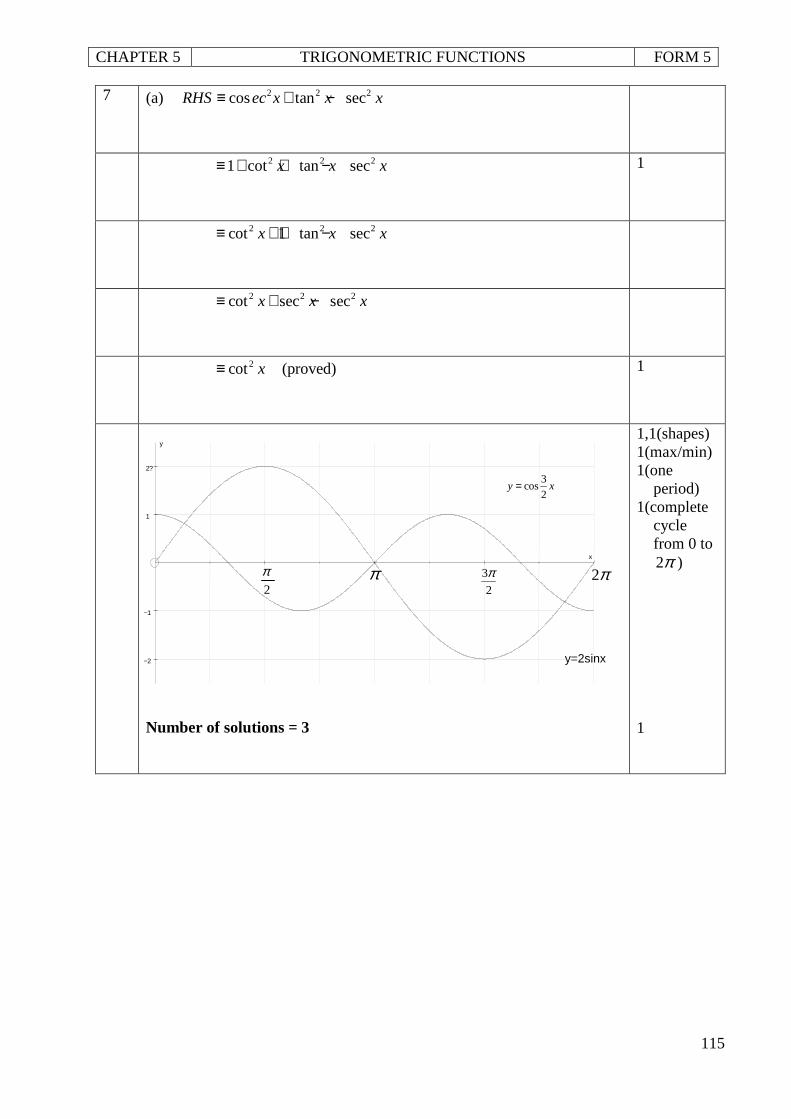
CHAPTER 5 TRIGONOMETRIC FUNCTIONS FORM 5
115
3cos
2y x=
7 (a) 2 2 2cos tan secRHS ec x x x≡ + −
2 2 21 cot tan secx x x≡ + + − 1
2 2 2cot 1 tan secx x x≡ + + −
2 2 2cot sec secx x x≡ + −
2cot (proved)x≡ 1
Number of solutions = 3
1,1(shapes) 1(max/min) 1(one
period) 1(complete
cycle from 0 to 2π )
1
y=2sinx
2
π π 3
2
π 2π
−2
−1
1
2?
x
y
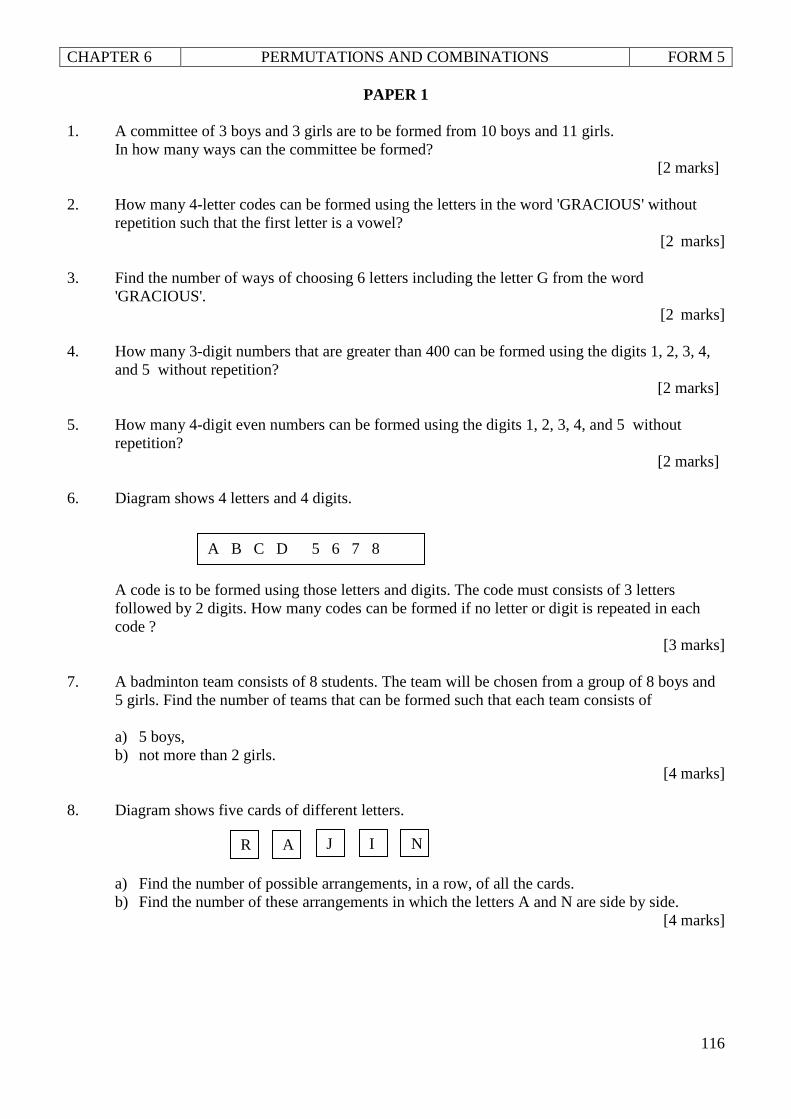
CHAPTER 6 PERMUTATIONS AND COMBINATIONS FORM 5
116
PAPER 1 1. A committee of 3 boys and 3 girls are to be formed from 10 boys and 11 girls.
In how many ways can the committee be formed? [2 marks] 2. How many 4-letter codes can be formed using the letters in the word 'GRACIOUS' without
repetition such that the first letter is a vowel? [2 marks]
3. Find the number of ways of choosing 6 letters including the letter G from the word 'GRACIOUS'. [2 marks]
4. How many 3-digit numbers that are greater than 400 can be formed using the digits 1, 2, 3, 4, and 5 without repetition? [2 marks]
5. How many 4-digit even numbers can be formed using the digits 1, 2, 3, 4, and 5 without repetition? [2 marks]
6. Diagram shows 4 letters and 4 digits.
A code is to be formed using those letters and digits. The code must consists of 3 letters followed by 2 digits. How many codes can be formed if no letter or digit is repeated in each code ?
[3 marks]
7. A badminton team consists of 8 students. The team will be chosen from a group of 8 boys and 5 girls. Find the number of teams that can be formed such that each team consists of a) 5 boys, b) not more than 2 girls.
[4 marks]
8. Diagram shows five cards of different letters.
a) Find the number of possible arrangements, in a row, of all the cards. b) Find the number of these arrangements in which the letters A and N are side by side.
[4 marks]
A B C D 5 6 7 8
R A J I N
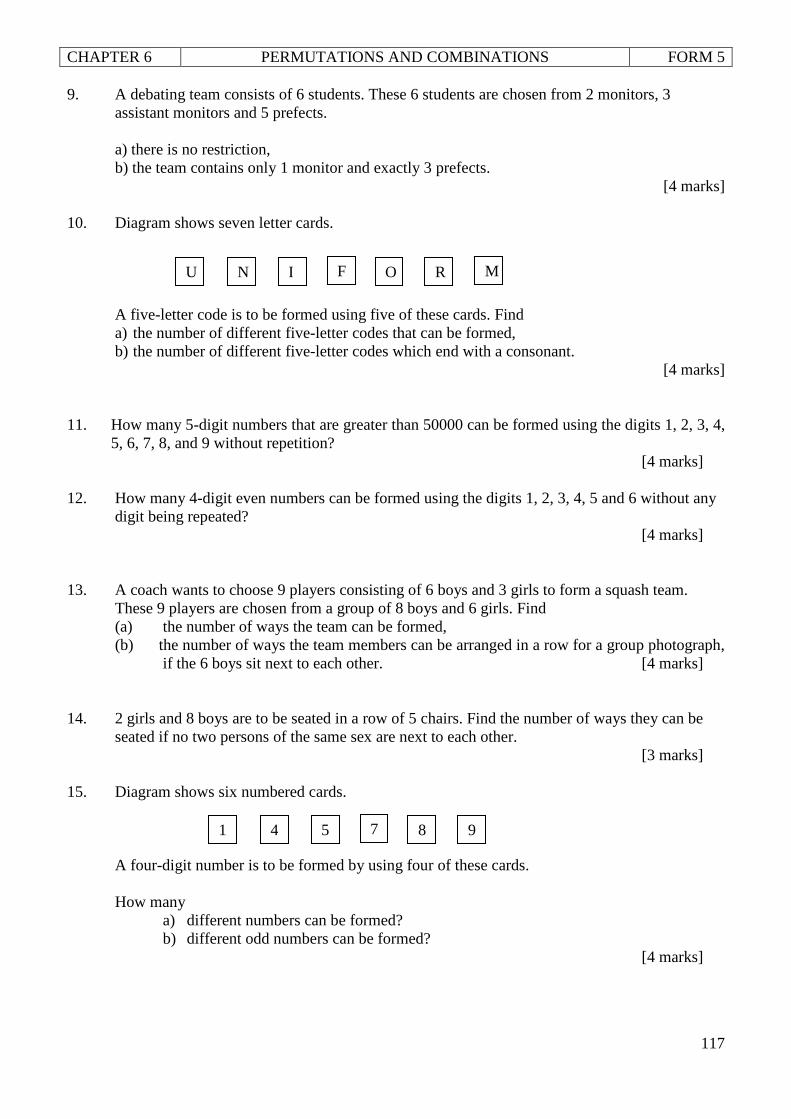
CHAPTER 6 PERMUTATIONS AND COMBINATIONS FORM 5
117
9. A debating team consists of 6 students. These 6 students are chosen from 2 monitors, 3 assistant monitors and 5 prefects.
a) there is no restriction, b) the team contains only 1 monitor and exactly 3 prefects.
[4 marks]
10. Diagram shows seven letter cards.
A five-letter code is to be formed using five of these cards. Find a) the number of different five-letter codes that can be formed, b) the number of different five-letter codes which end with a consonant.
[4 marks] 11. How many 5-digit numbers that are greater than 50000 can be formed using the digits 1, 2, 3, 4,
5, 6, 7, 8, and 9 without repetition? [4 marks]
12. How many 4-digit even numbers can be formed using the digits 1, 2, 3, 4, 5 and 6 without any digit being repeated?
[4 marks]
13. A coach wants to choose 9 players consisting of 6 boys and 3 girls to form a squash team.
These 9 players are chosen from a group of 8 boys and 6 girls. Find (a) the number of ways the team can be formed, (b) the number of ways the team members can be arranged in a row for a group photograph, if the 6 boys sit next to each other. [4 marks] 14. 2 girls and 8 boys are to be seated in a row of 5 chairs. Find the number of ways they can be
seated if no two persons of the same sex are next to each other. [3 marks]
15. Diagram shows six numbered cards. A four-digit number is to be formed by using four of these cards. How many
a) different numbers can be formed? b) different odd numbers can be formed?
[4 marks]
R O F I N U M
9 8 7 5 4 1
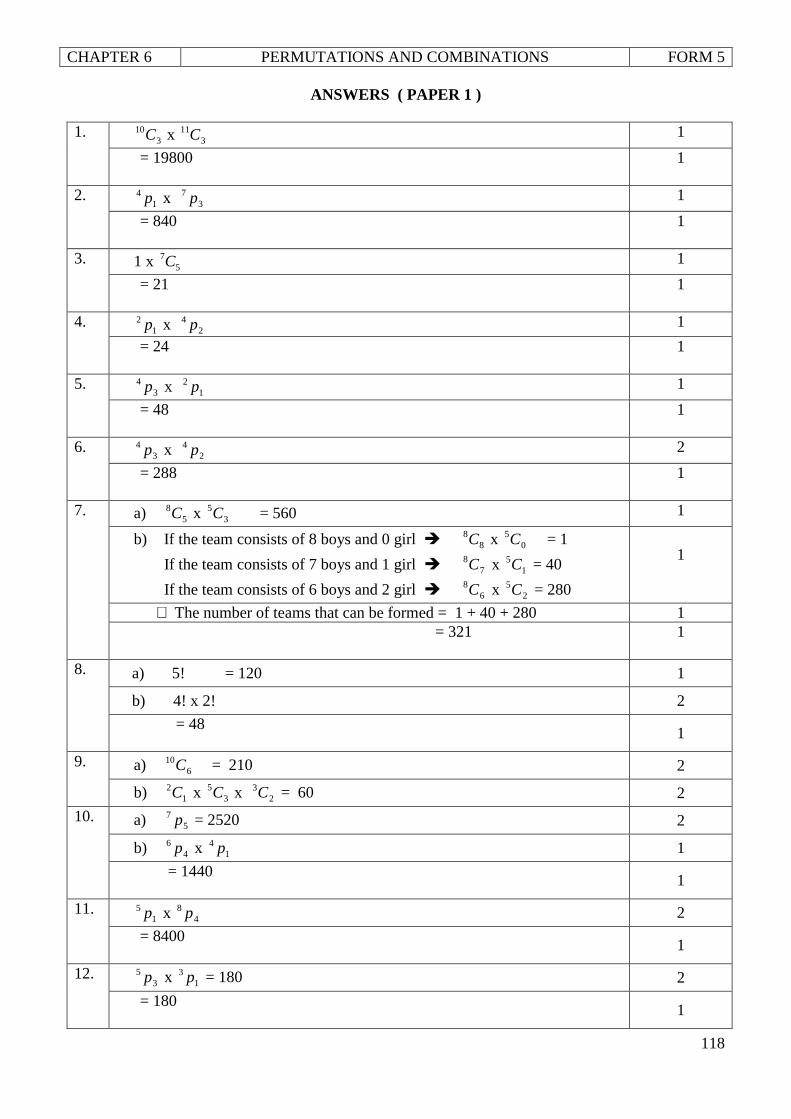
CHAPTER 6 PERMUTATIONS AND COMBINATIONS FORM 5
118
ANSWERS ( PAPER 1 ) 1.
310C x 3
11C 1
= 19800
1
2. 1
4 p x 37 p 1
= 840
1
3. 1 x 57C 1
= 21
1
4. 1
2 p x 24 p 1
= 24
1
5. 3
4 p x 12 p 1
= 48
1
6. 34 p x 2
4 p 2
= 288
1
7. a) 58C x 3
5C = 560 1
b) If the team consists of 8 boys and 0 girl � 88C x 0
5C = 1
If the team consists of 7 boys and 1 girl � 78C x 1
5C = 40
If the team consists of 6 boys and 2 girl � 68C x 2
5C = 280
1
∴ The number of teams that can be formed = 1 + 40 + 280 1 = 321
1
8. a) 5! = 120 1
b) 4! x 2! 2
= 48
1
9. a) 610C = 210 2
b) 12C x 3
5C x 23C = 60 2
10. a) 57 p = 2520 2
b) 46 p x 1
4 p 1
= 1440
1
11. 1
5 p x 48 p 2
= 8400
1
12. 3
5 p x 13 p = 180 2
= 180
1
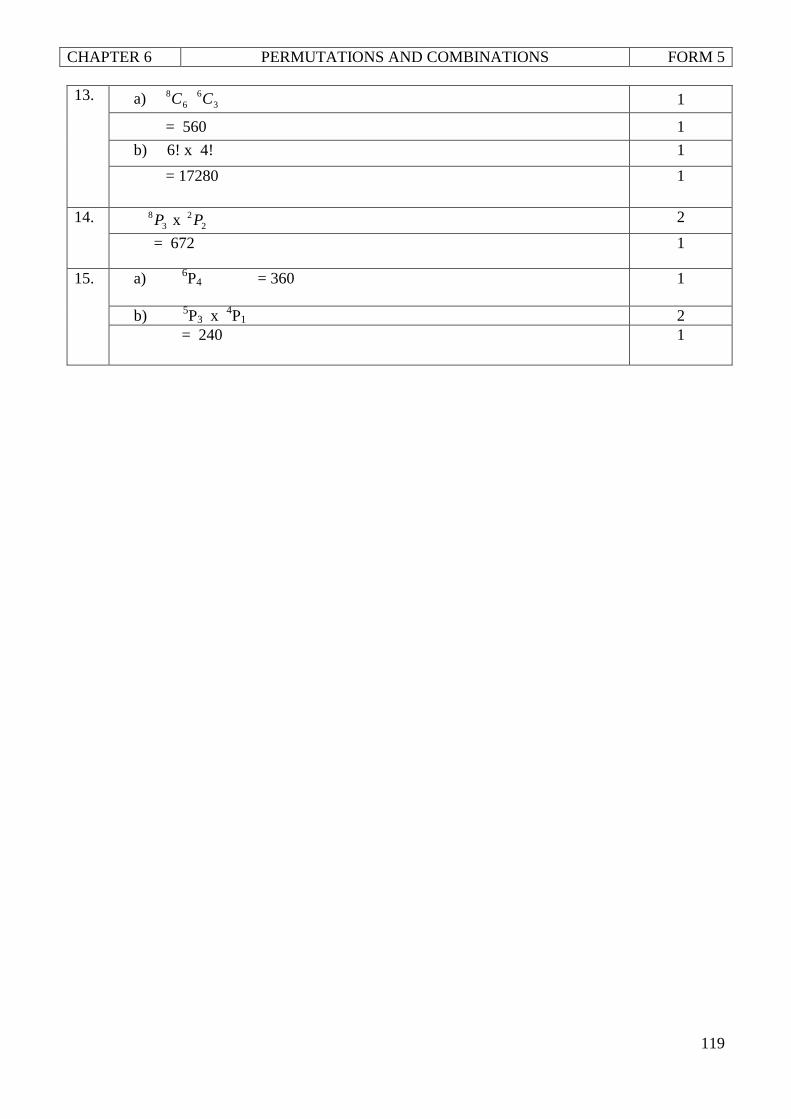
CHAPTER 6 PERMUTATIONS AND COMBINATIONS FORM 5
119
13. a) 68C 3
6C 1
= 560 1
b) 6! x 4! 1
= 17280 1
14. 38P x 2
2P 2
= 672 1
15. a) 6P4 = 360
1
b) 5P3 x 4P1 2 = 240 1
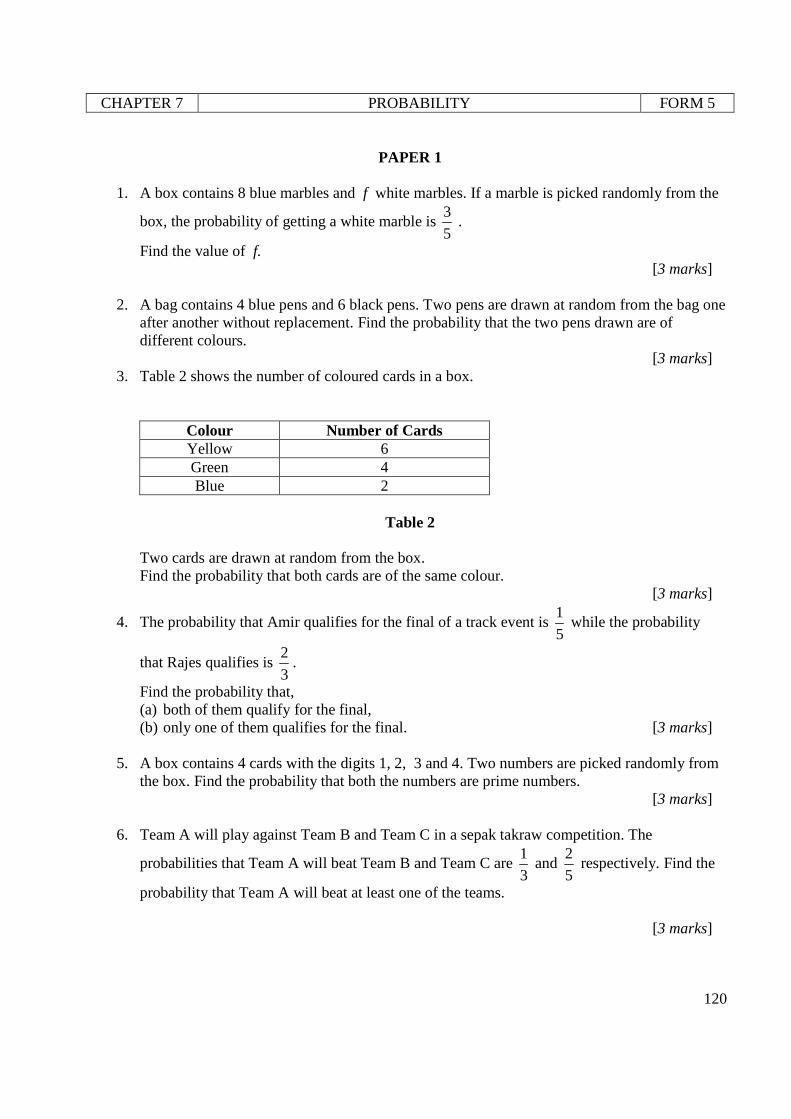
CHAPTER 7 PROBABILITY FORM 5
120
PAPER 1
1. A box contains 8 blue marbles and f white marbles. If a marble is picked randomly from the
box, the probability of getting a white marble is 3
5 .
Find the value of f. [3 marks]
2. A bag contains 4 blue pens and 6 black pens. Two pens are drawn at random from the bag one after another without replacement. Find the probability that the two pens drawn are of different colours.
[3 marks] 3. Table 2 shows the number of coloured cards in a box.
Colour Number of Cards Yellow 6 Green 4 Blue 2
Table 2
Two cards are drawn at random from the box. Find the probability that both cards are of the same colour.
[3 marks]
4. The probability that Amir qualifies for the final of a track event is 1
5 while the probability
that Rajes qualifies is 2
3.
Find the probability that, (a) both of them qualify for the final, (b) only one of them qualifies for the final. [3 marks]
5. A box contains 4 cards with the digits 1, 2, 3 and 4. Two numbers are picked randomly from
the box. Find the probability that both the numbers are prime numbers. [3 marks]
6. Team A will play against Team B and Team C in a sepak takraw competition. The
probabilities that Team A will beat Team B and Team C are 1
3 and
2
5 respectively. Find the
probability that Team A will beat at least one of the teams. [3 marks]
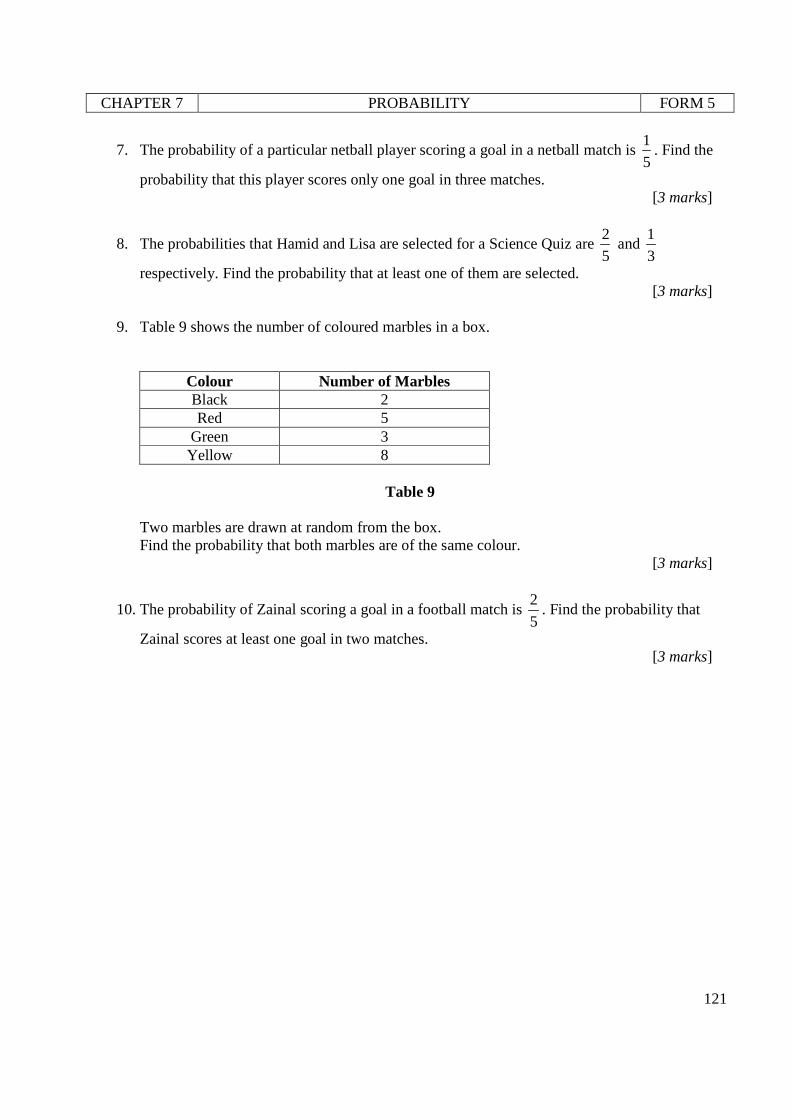
CHAPTER 7 PROBABILITY FORM 5
121
7. The probability of a particular netball player scoring a goal in a netball match is 1
5. Find the
probability that this player scores only one goal in three matches. [3 marks]
8. The probabilities that Hamid and Lisa are selected for a Science Quiz are 2
5 and
1
3
respectively. Find the probability that at least one of them are selected. [3 marks]
9. Table 9 shows the number of coloured marbles in a box.
Colour Number of Marbles Black 2 Red 5
Green 3 Yellow 8
Table 9
Two marbles are drawn at random from the box. Find the probability that both marbles are of the same colour.
[3 marks]
10. The probability of Zainal scoring a goal in a football match is 2
5. Find the probability that
Zainal scores at least one goal in two matches. [3 marks]
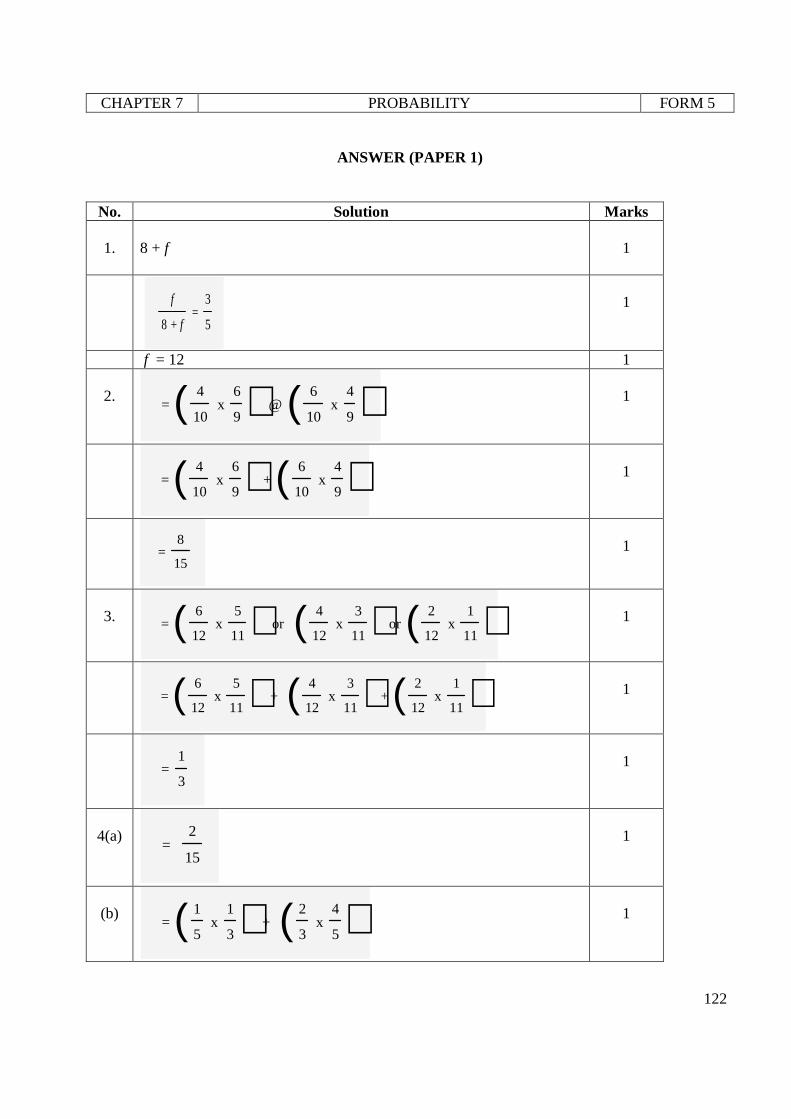
CHAPTER 7 PROBABILITY FORM 5
122
ANSWER (PAPER 1)
No. Solution Marks
1. 8 + f
1
f
8 + f =
3
5
1
f = 12 1
2. =
4
10 x
6
9( ) @ 6
10 x
4
9( )
1
= 4
10 x
6
9( ) + 6
10 x
4
9( )
1
= 8
15
1
3. =
6
12 x
5
11( ) or 4
12 x
3
11( ) or 2
12 x
1
11( )
1
= 6
12 x
5
11( ) + 4
12 x
3
11( ) + 2
12 x
1
11( )
1
= 1
3
1
4(a)
= 2
15
1
(b)
= 1
5 x
1
3( ) + 2
3 x
4
5( )
1
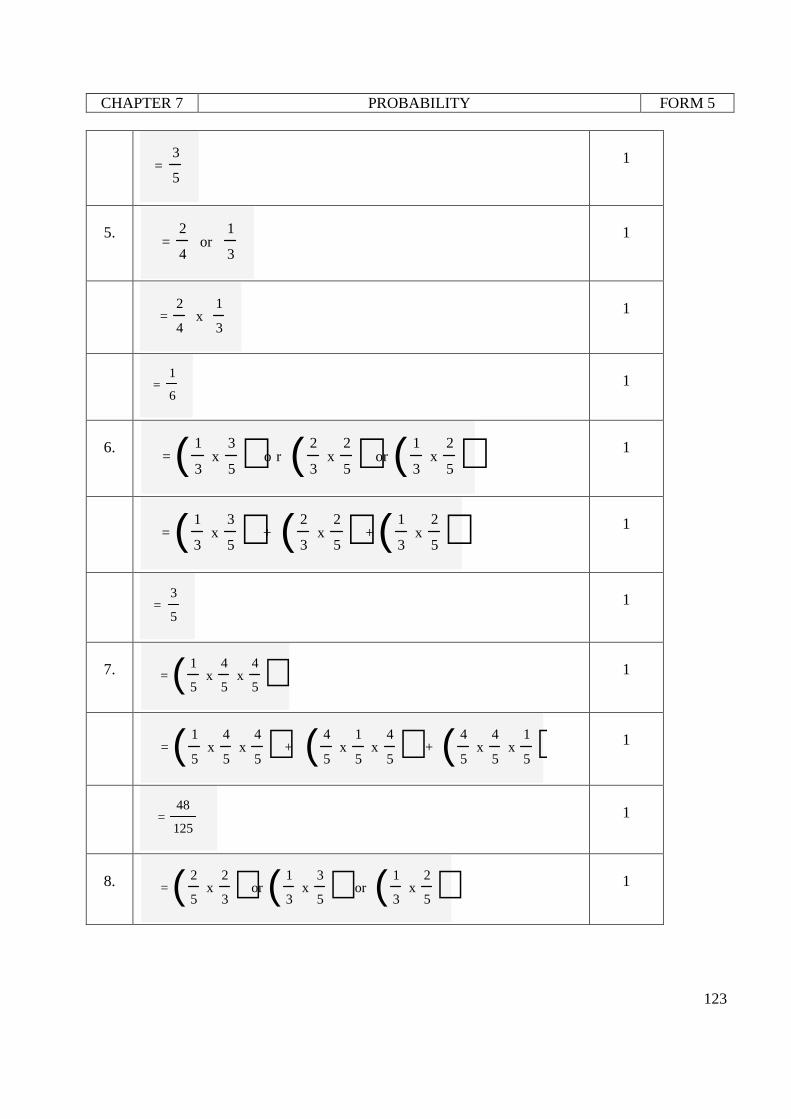
CHAPTER 7 PROBABILITY FORM 5
123
= 3
5
1
5.
= 2
4 or
1
3
1
= 2
4 x
1
3
1
=
1
6
1
6.
= 1
3 x
3
5( ) o r 2
3 x
2
5( ) or 1
3 x
2
5( )
1
= 1
3 x
3
5( ) + 2
3 x
2
5( ) + 1
3 x
2
5( )
1
= 3
5
1
7. =
1
5 x
4
5 x
4
5( )
1
= 1
5 x
4
5 x
4
5( ) + 4
5 x
1
5 x
4
5( ) + 4
5 x
4
5 x
1
5( )
1
= 48
125
1
8. =
2
5 x
2
3( ) or 1
3 x
3
5( ) or 1
3 x
2
5( )
1
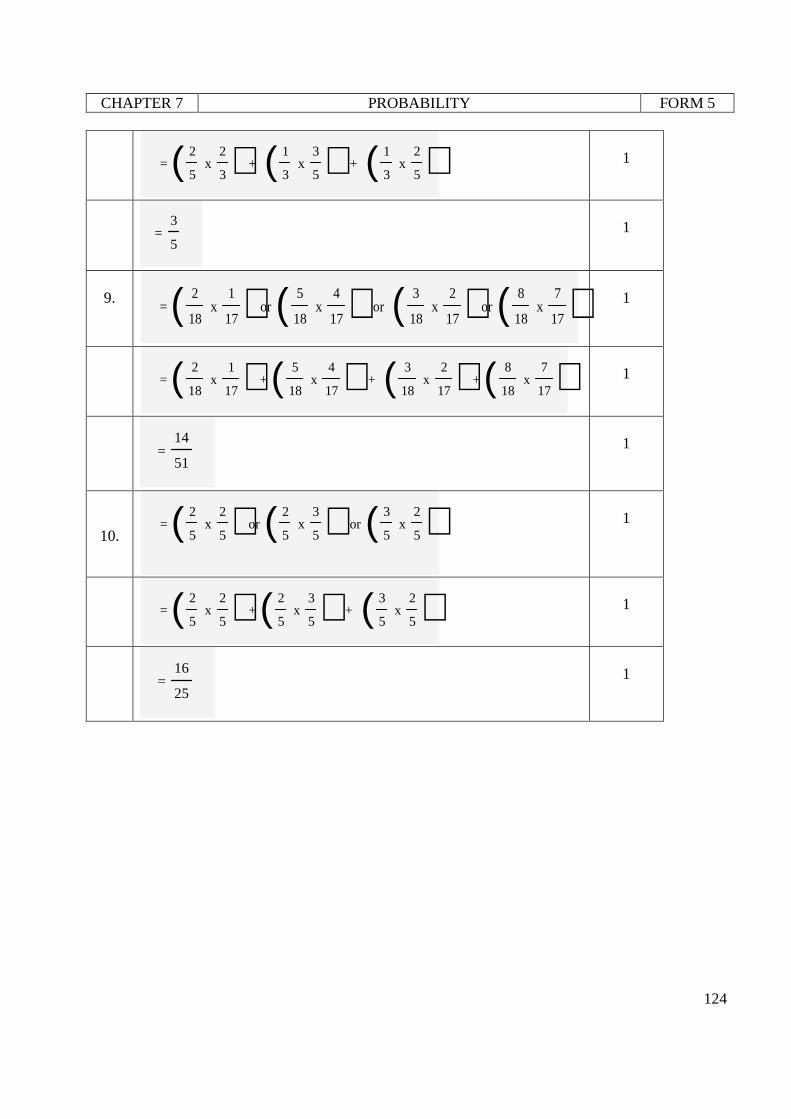
CHAPTER 7 PROBABILITY FORM 5
124
= 2
5 x
2
3( ) + 1
3 x
3
5( ) + 1
3 x
2
5( )
1
= 3
5
1
9.
= 2
18 x
1
17( ) or 5
18 x
4
17( ) or 3
18 x
2
17( ) or 8
18 x
7
17( )
1
= 2
18 x
1
17( ) + 5
18 x
4
17( ) + 3
18 x
2
17( ) + 8
18 x
7
17( )
1
= 14
51
1
10. =
2
5 x
2
5( ) or 2
5 x
3
5( ) or 3
5 x
2
5( )
1
= 2
5 x
2
5( ) + 2
5 x
3
5( ) + 3
5 x
2
5( )
1
= 16
25
1
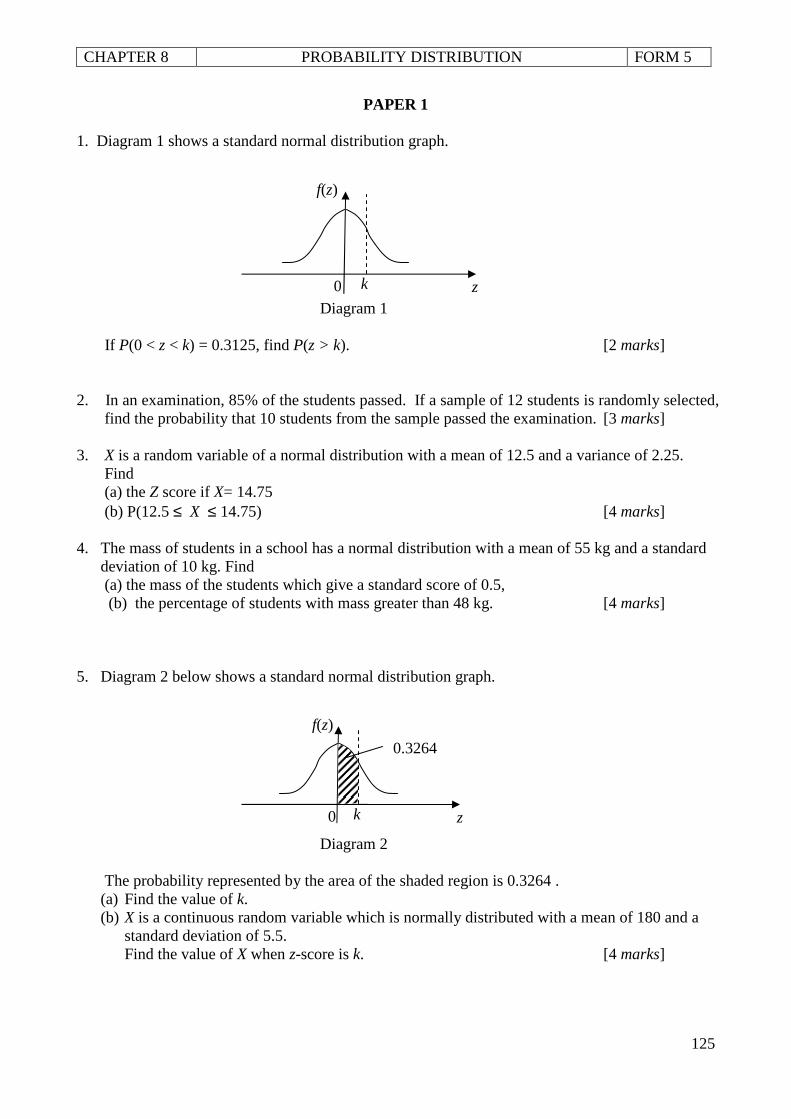
CHAPTER 8 PROBABILITY DISTRIBUTION FORM 5
125
PAPER 1 1. Diagram 1 shows a standard normal distribution graph.
Diagram 1 If P(0 < z < k) = 0.3125, find P(z > k). [2 marks] 2. In an examination, 85% of the students passed. If a sample of 12 students is randomly selected, find the probability that 10 students from the sample passed the examination. [3 marks] 3. X is a random variable of a normal distribution with a mean of 12.5 and a variance of 2.25. Find (a) the Z score if X= 14.75 (b) P(12.5 ≤ X ≤ 14.75) [4 marks] 4. The mass of students in a school has a normal distribution with a mean of 55 kg and a standard
deviation of 10 kg. Find (a) the mass of the students which give a standard score of 0.5, (b) the percentage of students with mass greater than 48 kg. [4 marks] 5. Diagram 2 below shows a standard normal distribution graph.
Diagram 2 The probability represented by the area of the shaded region is 0.3264 .
(a) Find the value of k. (b) X is a continuous random variable which is normally distributed with a mean of 180 and a
standard deviation of 5.5. Find the value of X when z-score is k. [4 marks]
f(z)
0 k z
f(z)
0 k z
0.3264
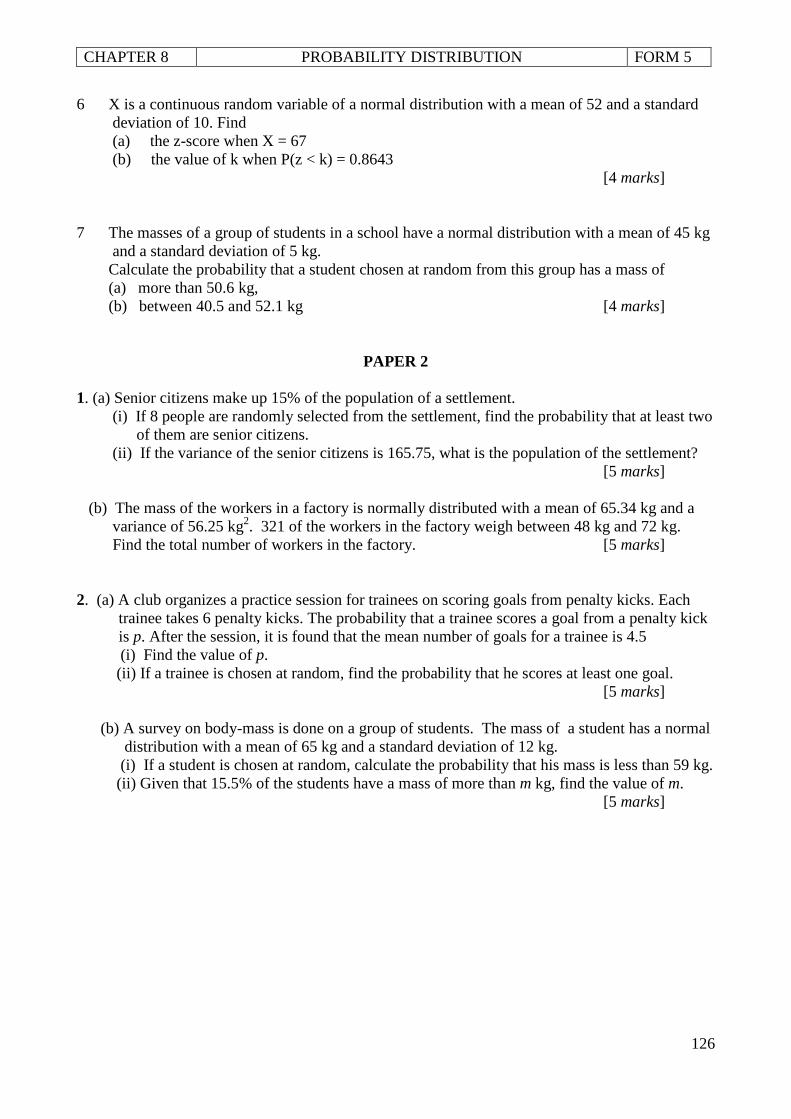
CHAPTER 8 PROBABILITY DISTRIBUTION FORM 5
126
6 X is a continuous random variable of a normal distribution with a mean of 52 and a standard deviation of 10. Find
(a) the z-score when X = 67 (b) the value of k when P(z < k) = 0.8643 [4 marks] 7 The masses of a group of students in a school have a normal distribution with a mean of 45 kg
and a standard deviation of 5 kg. Calculate the probability that a student chosen at random from this group has a mass of (a) more than 50.6 kg, (b) between 40.5 and 52.1 kg [4 marks]
PAPER 2 1. (a) Senior citizens make up 15% of the population of a settlement. (i) If 8 people are randomly selected from the settlement, find the probability that at least two
of them are senior citizens. (ii) If the variance of the senior citizens is 165.75, what is the population of the settlement?
[5 marks] (b) The mass of the workers in a factory is normally distributed with a mean of 65.34 kg and a
variance of 56.25 kg2. 321 of the workers in the factory weigh between 48 kg and 72 kg. Find the total number of workers in the factory. [5 marks] 2. (a) A club organizes a practice session for trainees on scoring goals from penalty kicks. Each
trainee takes 6 penalty kicks. The probability that a trainee scores a goal from a penalty kick is p. After the session, it is found that the mean number of goals for a trainee is 4.5
(i) Find the value of p. (ii) If a trainee is chosen at random, find the probability that he scores at least one goal. [5 marks] (b) A survey on body-mass is done on a group of students. The mass of a student has a normal
distribution with a mean of 65 kg and a standard deviation of 12 kg. (i) If a student is chosen at random, calculate the probability that his mass is less than 59 kg. (ii) Given that 15.5% of the students have a mass of more than m kg, find the value of m. [5 marks]
CHAPTER 8 PROBABILITY DISTRIBUTION FORM 5
127
3. For this question, give your answer correct to three significant figures. (a) The result of a study shows that 18% of pupils in a city cycle to school. If 10 pupils from the city are chosen at random, calculate the probability that (i) exactly 2 of them cycle to school, (ii) less than 3 of them cycle to school. [4 marks] (b) The mass of water-melons produced from an orchard follows a normal distribution with a
mean of 4.8 kg and a standard deviation of 0.6 kg. Find (i) the probability that a water-melon chosen randomly from the orchard has a mass of not
more than 5.7 kg, (ii) the value of m if 80% of the water-melons from the orchard has a mass of more than
m kg. [6 marks] 4. An orchard produces oranges. Only oranges with diameter, x greater than k cm are graded and marketed. Table below shows the grades of the oranges based on their diameters.
Grade A B C Diameter, x (cm) x > 6.5 6.5 ≥ x > 4.5 4.5 ≥ x > k
It is given that the diameter of oranges has a normal distribution with a mean of 5.3 cm and a
standard deviation of 0.75 cm. (a) If an orange is picked at random, calculate the probability that it is of grade A. [2 marks] (b) In a basket of 312 oranges, estimate the number of grade B oranges. [4 marks] (c) If 78.76% of the oranges is marketed, find the value of k. [4 marks]
5 (a) In a survey carried out in a school, it is found that 3 out of 5 students have handphones. If
8 students from the school are chosen at random, calculate the probability that (i) exactly 2 students have handphones. (ii) more than 2 students have handphones. [5 marks] (b) A group of teachers are given medical check up. The blood pressure of a teacher has a
normal distribution with a mean of 128 mmHg and a standard deviation of 10 mmHg. Blood pressure that is more than 140 mmHg is classified as “high blood pressure”.
(i) A teacher is chosen at random from the group. Find the probability that the teacher has a pressure between 110 mmHg and 140
mmHg. (ii) It is found that 16 teachers have “high blood pressure”. Find the total number of
teachers in the group. [5 marks]
CHAPTER 8 PROBABILITY DISTRIBUTION FORM 5
128
6 The masses of mangoes from an orchard has a normal distribution with a mean of 285 g and a standard deviation of 75 g.
(a) Find the probability that a mango chosen randomly from this orchard has a mass of more than 191.25 g. [3 marks]
(b) A random sample of 520 mangoes is chosen. (i) Calculte the number of mangoes from this sample that have a mass of more than
191.25. (ii) Given that 416 mangoes from this sample have a mass of more than m g, find the
value of m. [7 marks]
ANSWERS (PAPER 1)
1 0.5 - 0.3125 1 0.1875 1
2
21010
12 )15.0()85.0(C 1
0.2924 1 p = 0.85, q = 0.15 1
3a 5.1
5.1275.14 − 1
1.5 1
3b 5.1
5.125.12 − or
5.1
5.1275.14 − 1
0.4332 1
4a 10
555.0
−= X 1
60 1
4b 10
5548− 1
75.8% 1
5a 0.5 - 0.3264 1 0.94 1
5b 94.0
5.5
180 =−X 1
X = 185.17 1
6a 10
5267−=z 1
1.5 1
6b 1 - 0.8643 1 k=1.1 1
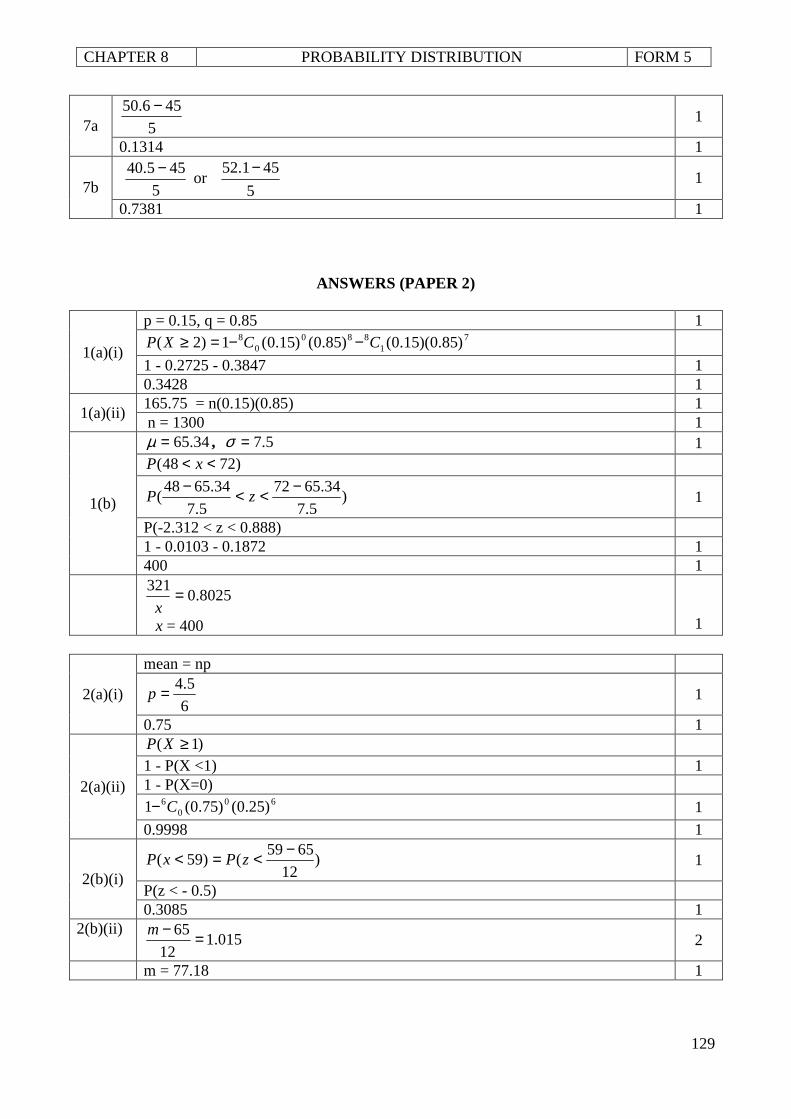
CHAPTER 8 PROBABILITY DISTRIBUTION FORM 5
129
7a 5
456.50 − 1
0.1314 1
7b
5
455.40 − or
5
451.52 − 1
0.7381 1
ANSWERS (PAPER 2)
1(a)(i)
p = 0.15, q = 0.85 1 7
1880
08 )85.0)(15.0()85.0()15.0(1)2( CCXP −−=≥
1 - 0.2725 - 0.3847 1 0.3428 1
1(a)(ii) 165.75 = n(0.15)(0.85) 1 n = 1300 1
1(b)
34.65=µ , 5.7=σ 1 )7248( << xP
)5.7
34.6572
5.7
34.6548(
−<<−zP 1
P(-2.312 < z < 0.888) 1 - 0.0103 - 0.1872 1 400 1
8025.0
321=x
x = 400
1
2(a)(i)
mean = np
6
5.4=p 1
0.75 1
2(a)(ii)
)1( ≥XP 1 - P(X <1) 1 1 - P(X=0)
600
6 )25.0()75.0(1 C− 1
0.9998 1
2(b)(i) )
12
6559()59(
−<=< zPxP 1
P(z < - 0.5) 0.3085 1
2(b)(ii) 015.1
12
65 =−m 2
m = 77.18 1
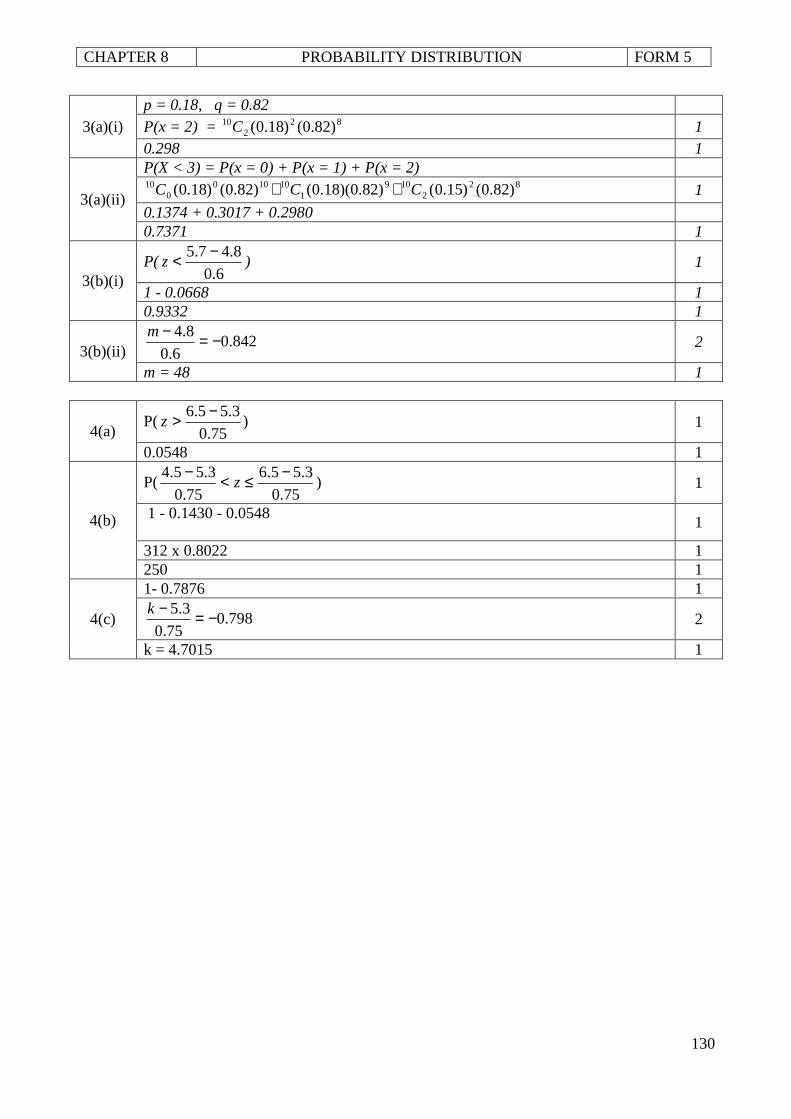
CHAPTER 8 PROBABILITY DISTRIBUTION FORM 5
130
3(a)(i) p = 0.18, q = 0.82 P(x = 2) = 82
210 )82.0()18.0(C 1
0.298 1
3(a)(ii)
P(X < 3) = P(x = 0) + P(x = 1) + P(x = 2) 82
2109
110100
010 )82.0()15.0()82.0)(18.0()82.0()18.0( CCC ++ 1
0.1374 + 0.3017 + 0.2980 0.7371 1
3(b)(i) P(
6.0
8.47.5 −<z ) 1
1 - 0.0668 1 0.9332 1
3(b)(ii) 842.0
6.0
8.4 −=−m 2
m = 48 1
4(a) P(
75.0
3.55.6 −>z ) 1
0.0548 1
4(b)
P(75.0
3.55.6
75.0
3.55.4 −≤<−z ) 1
1 - 0.1430 - 0.0548
1
312 x 0.8022 1 250 1
4(c)
1- 0.7876 1
798.075.0
3.5 −=−k 2
k = 4.7015 1
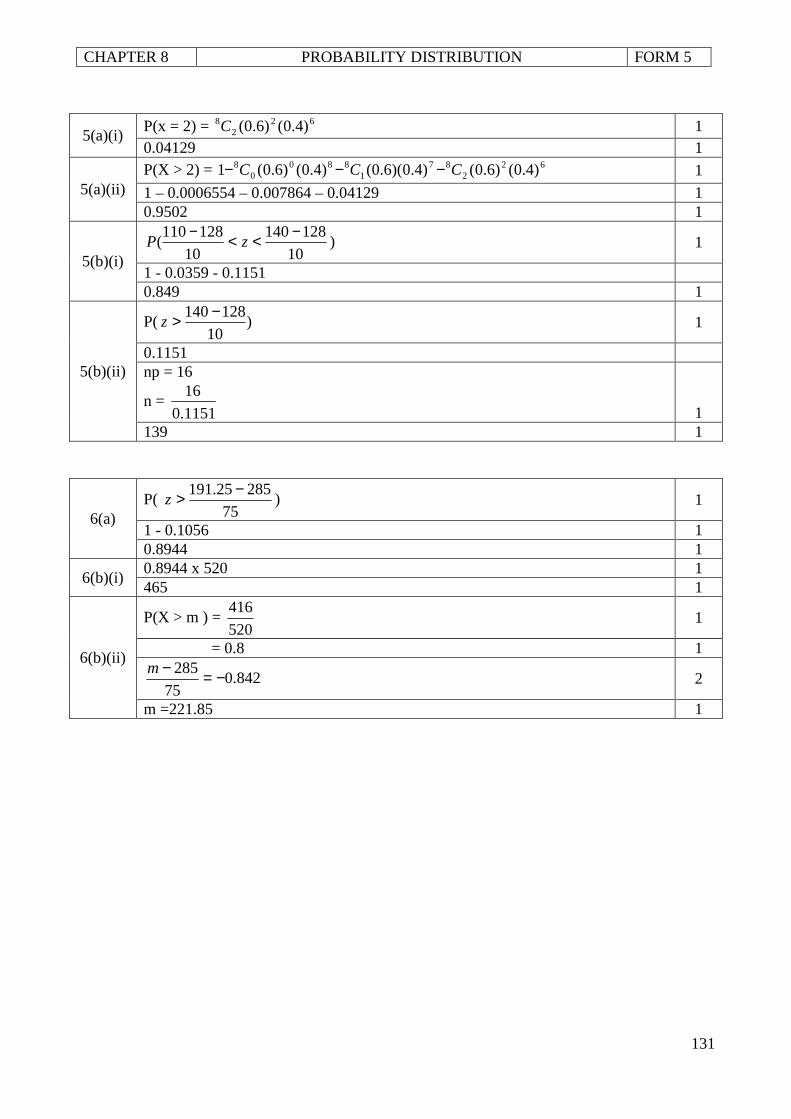
CHAPTER 8 PROBABILITY DISTRIBUTION FORM 5
131
5(a)(i) P(x = 2) = 62
28 )4.0()6.0(C 1
0.04129 1
5(a)(ii) P(X > 2) = 62
287
1880
08 )4.0()6.0()4.0)(6.0()4.0()6.0(1 CCC −−− 1
1 – 0.0006554 – 0.007864 – 0.04129 1 0.9502 1
5(b)(i) 10
128140
10
128110(
−<<−zP ) 1
1 - 0.0359 - 0.1151 0.849 1
5(b)(ii)
P( )10
128140−>z 1
0.1151 np = 16
n = 1151.0
16
1 139 1
6(a) P(
75
28525.191 −>z ) 1
1 - 0.1056 1 0.8944 1
6(b)(i) 0.8944 x 520 1 465 1
6(b)(ii)
P(X > m ) = 520
416 1
= 0.8 1
842.075
285 −=−m 2
m =221.85 1
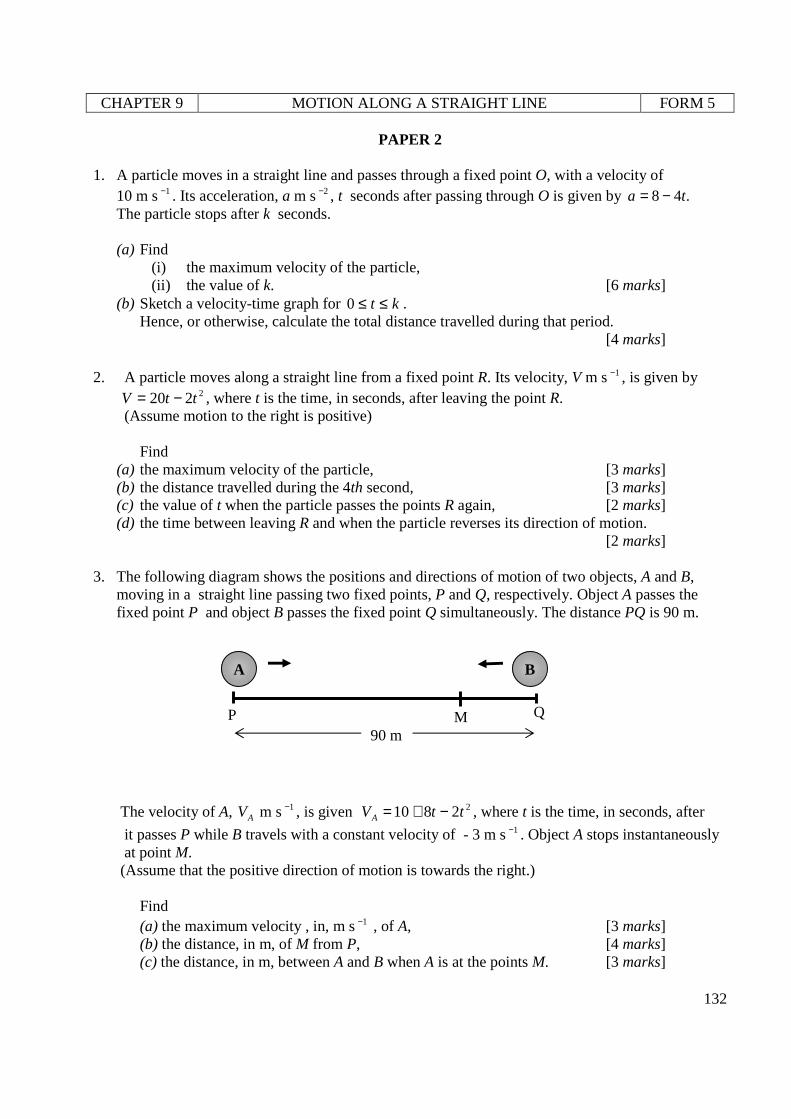
CHAPTER 9 MOTION ALONG A STRAIGHT LINE FORM 5
132
PAPER 2 1. A particle moves in a straight line and passes through a fixed point O, with a velocity of 10 m s1− . Its acceleration, a m s 2− , t seconds after passing through O is given by .48 ta −=
The particle stops after k seconds. (a) Find
(i) the maximum velocity of the particle, (ii) the value of k. [6 marks]
(b) Sketch a velocity-time graph for kt ≤≤0 . Hence, or otherwise, calculate the total distance travelled during that period.
[4 marks] 2. A particle moves along a straight line from a fixed point R. Its velocity, V m s 1− , is given by 2220 ttV −= , where t is the time, in seconds, after leaving the point R. (Assume motion to the right is positive) Find
(a) the maximum velocity of the particle, [3 marks] (b) the distance travelled during the 4th second, [3 marks] (c) the value of t when the particle passes the points R again, [2 marks] (d) the time between leaving R and when the particle reverses its direction of motion.
[2 marks] 3. The following diagram shows the positions and directions of motion of two objects, A and B,
moving in a straight line passing two fixed points, P and Q, respectively. Object A passes the fixed point P and object B passes the fixed point Q simultaneously. The distance PQ is 90 m.
The velocity of A, AV m s 1− , is given 22810 ttVA −+= , where t is the time, in seconds, after
it passes P while B travels with a constant velocity of - 3 m s1− . Object A stops instantaneously at point M. (Assume that the positive direction of motion is towards the right.) Find
(a) the maximum velocity , in, m s1− , of A, [3 marks] (b) the distance, in m, of M from P, [4 marks] (c) the distance, in m, between A and B when A is at the points M. [3 marks]
A B
P M Q
90 m
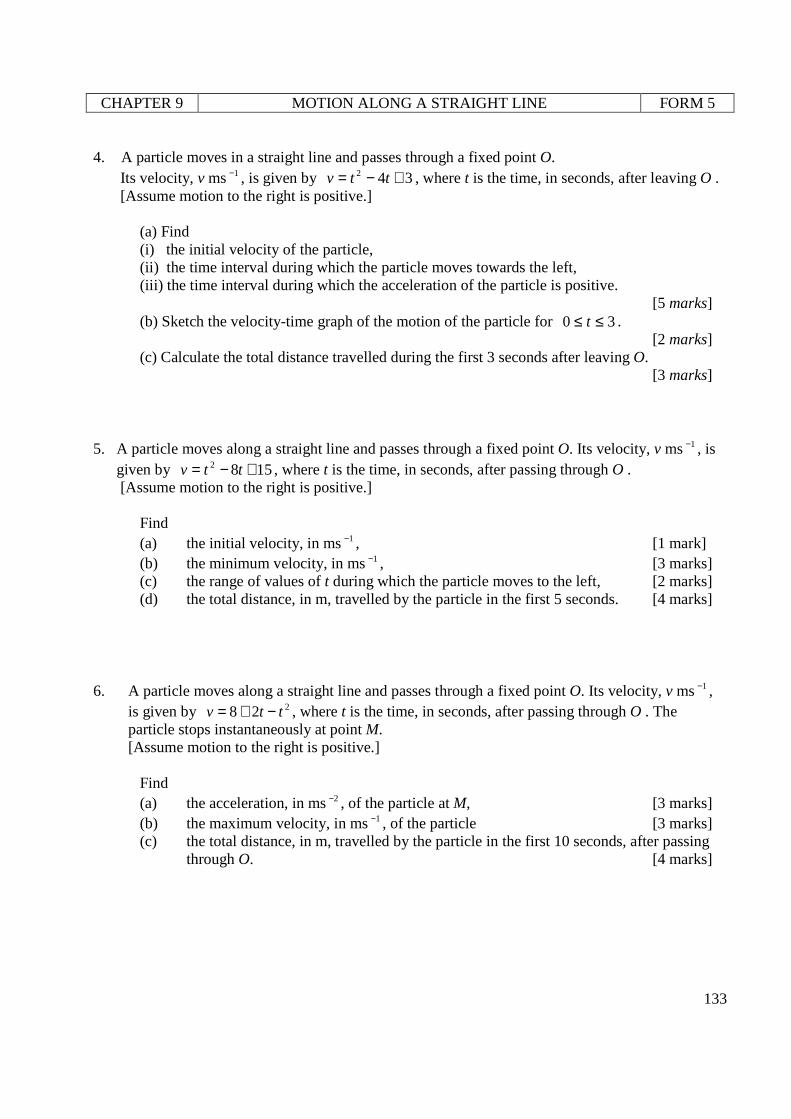
CHAPTER 9 MOTION ALONG A STRAIGHT LINE FORM 5
133
4. A particle moves in a straight line and passes through a fixed point O. Its velocity, v ms 1− , is given by 342 +−= ttv , where t is the time, in seconds, after leaving O . [Assume motion to the right is positive.]
(a) Find (i) the initial velocity of the particle, (ii) the time interval during which the particle moves towards the left, (iii) the time interval during which the acceleration of the particle is positive. [5 marks] (b) Sketch the velocity-time graph of the motion of the particle for 30 ≤≤ t .
[2 marks] (c) Calculate the total distance travelled during the first 3 seconds after leaving O.
[3 marks] 5. A particle moves along a straight line and passes through a fixed point O. Its velocity, v ms 1− , is
given by 1582 +−= ttv , where t is the time, in seconds, after passing through O . [Assume motion to the right is positive.] Find (a) the initial velocity, in ms1− , [1 mark] (b) the minimum velocity, in ms1− , [3 marks] (c) the range of values of t during which the particle moves to the left, [2 marks] (d) the total distance, in m, travelled by the particle in the first 5 seconds. [4 marks] 6. A particle moves along a straight line and passes through a fixed point O. Its velocity, v ms 1− ,
is given by 228 ttv −+= , where t is the time, in seconds, after passing through O . The particle stops instantaneously at point M.
[Assume motion to the right is positive.] Find (a) the acceleration, in ms2− , of the particle at M, [3 marks] (b) the maximum velocity, in ms1− , of the particle [3 marks]
(c) the total distance, in m, travelled by the particle in the first 10 seconds, after passing through O. [4 marks]
CHAPTER 9 MOTION ALONG A STRAIGHT LINE FORM 5
134
7. A particle moves along a straight line and passes through a fixed point O, with velocity of 20 ms 1− . Its acceleration, a ms 2− , is given by a = – 2t + 8 where t is the time, in seconds, after passing through point O. The particle stops after k s. (a) Find: (i) the maximum velocity of the particle, (ii) the value of k [6 marks] (b) Sketch a velocity-time graph of the motion of the particle for kt ≤≤0 .
Hence, or otherwise, calculate the total distance travelled during that period. [4 marks]
8. A particle moves along a straight line. Its velocity, v ms- 1 , from a fixed point, O, is given by
v = t2 – 10t + 24 where t is the time, in seconds, after passing through point O. [Assume motion to the right is positive.] Find (a) the initial velocity of the particle, [1 marks] (b) the minimum velocity of the particle, [3 marks]
(c) the range of values of t during which the particle moves to the left, [2 marks] (d) the total distance travelled by the particle in the first 6 seconds. [4 marks]
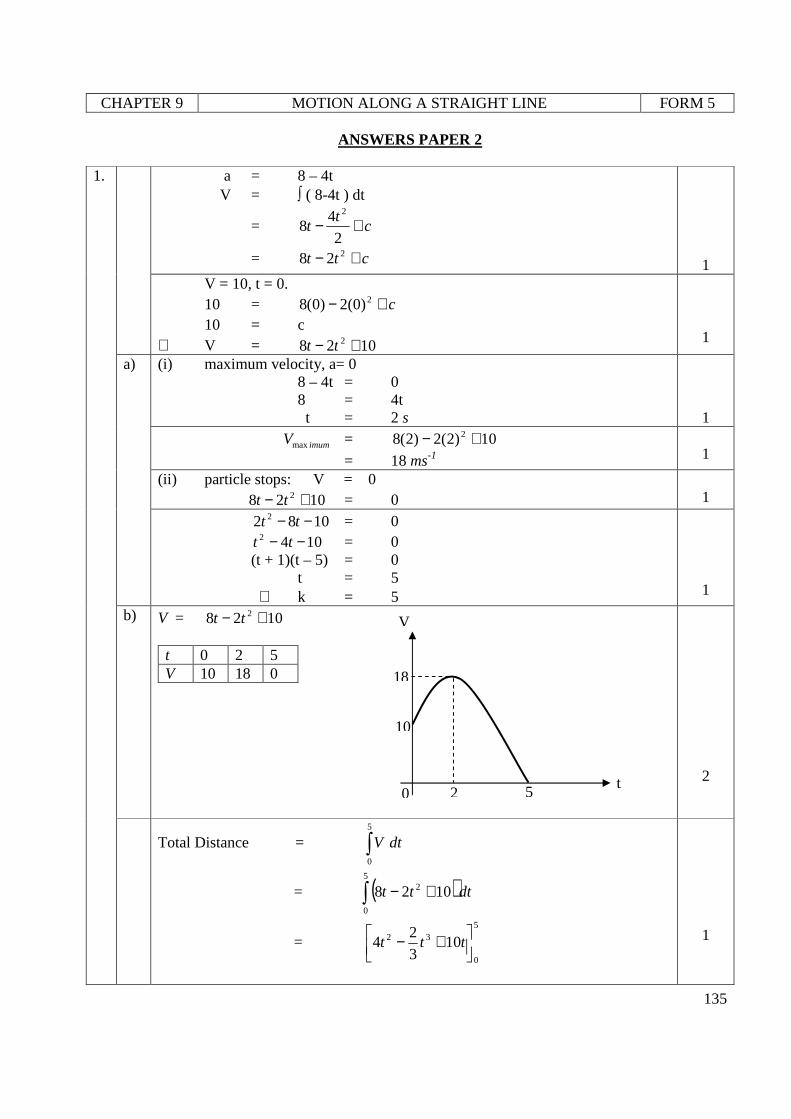
CHAPTER 9 MOTION ALONG A STRAIGHT LINE FORM 5
135
ANSWERS PAPER 2
1. a = 8 – 4t V = ∫ ( 8-4t ) dt
= ct
t +−2
48
2
= ctt +− 228
1
V = 10, t = 0. 10 = c+− 2)0(2)0(8 10 = c ∴ V = 1028 2 +− tt
1
a) (i) maximum velocity, a= 0 8 – 4t = 0 8 = 4t t = 2 s
1
imumVmax = 10)2(2)2(8 2 +−
= 18 ms-1
1
(ii) particle stops: V = 0 1028 2 +− tt = 0
1
1082 2 −− tt = 0 1042 −− tt = 0 (t + 1)(t – 5) = 0 t = 5
∴ k = 5
1
b) V = 1028 2 +− tt
t 0 2 5 V 10 18 0
2
Total Distance = ∫
5
0
dtV
= ( ) dttt∫ +−5
0
2 1028
= 5
0
32 103
24
+− ttt
1
V
10
18
0 2 5 t
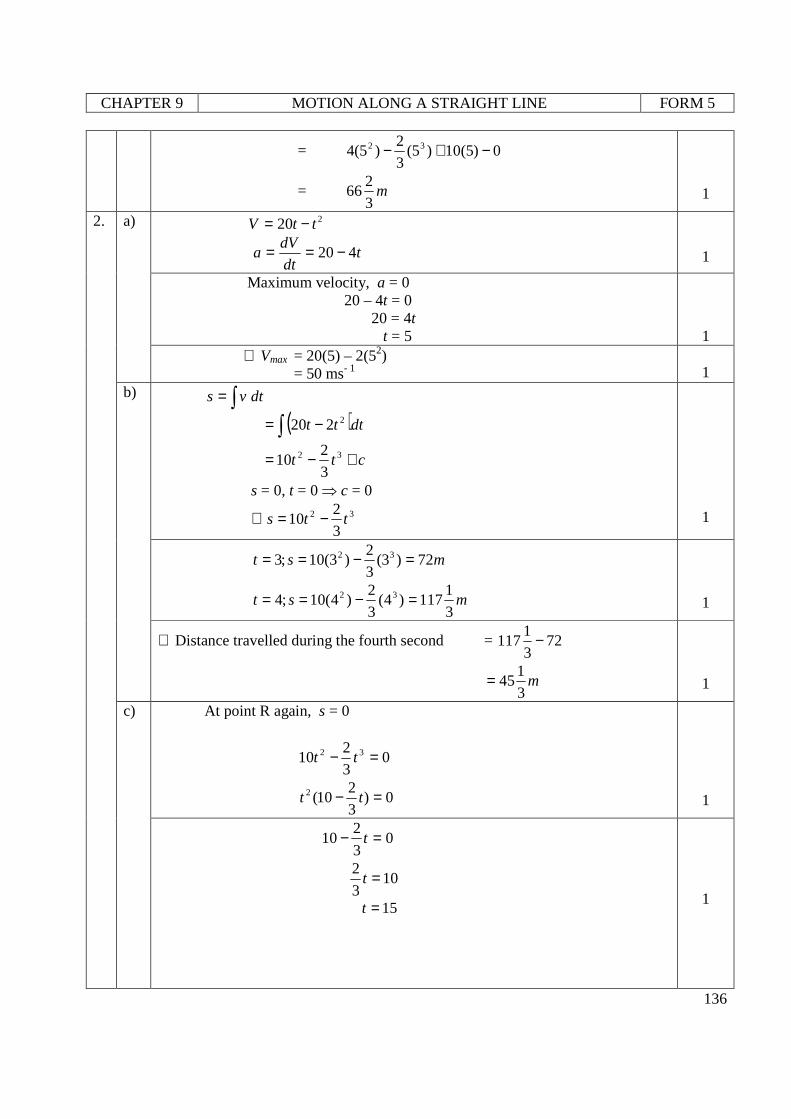
CHAPTER 9 MOTION ALONG A STRAIGHT LINE FORM 5
136
= 0)5(10)5(3
2)5(4 32 −+−
= m3
266
1
2. a) 220 ttV −=
tdt
dVa 420−==
1
Maximum velocity, a = 0 20 – 4t = 0 20 = 4t t = 5
1
∴ Vmax = 20(5) – 2(52) = 50 ms- 1
1
b) ∫= dtvs
( )∫ −= dttt 2220
ctt +−= 32
3
210
s = 0, t = 0 ⇒ c = 0
∴ 32
3
210 tts −=
1
mst 72)3(3
2)3(10;3 32 =−==
mst3
1117)4(
3
2)4(10;4 32 =−==
1
∴ Distance travelled during the fourth second = 723
1117 −
m3
145=
1
c) At point R again, s = 0
03
210 32 =− tt
0)3
210(2 =− tt
1
03
210 =− t
103
2 =t
15=t
1
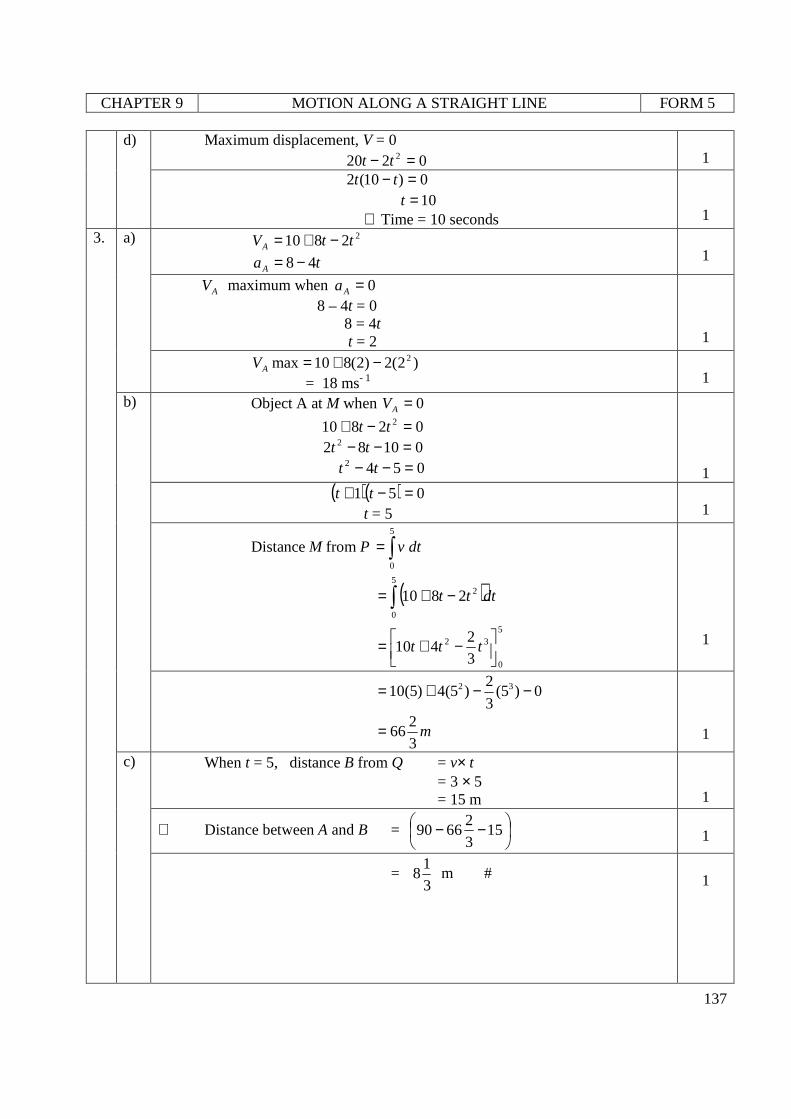
CHAPTER 9 MOTION ALONG A STRAIGHT LINE FORM 5
137
d) Maximum displacement, V = 0 0220 2 =− tt
1
0)10(2 =− tt 10=t
∴ Time = 10 seconds
1
3. a) 22810 ttVA −+=
taA 48−=
1
AV maximum when 0=Aa 8 – 4t = 0 8 = 4t t = 2
1
)2(2)2(810max 2−+=AV = 18 ms- 1
1
b) Object A at M when 0=AV
02810 2 =−+ tt 01082 2 =−− tt
0542 =−− tt
1
( )( ) 051 =−+ tt t = 5
1
Distance M from P ∫=5
0
dtv
( )∫ −+=5
0
22810 dttt
5
0
32
3
2410
−+= ttt
1
0)5(3
2)5(4)5(10 32 −−+=
m3
266=
1
c) When t = 5, distance B from Q = v× t = 3 × 5 = 15 m
1
∴ Distance between A and B =
−− 153
26690
1
= 3
18 m #
1
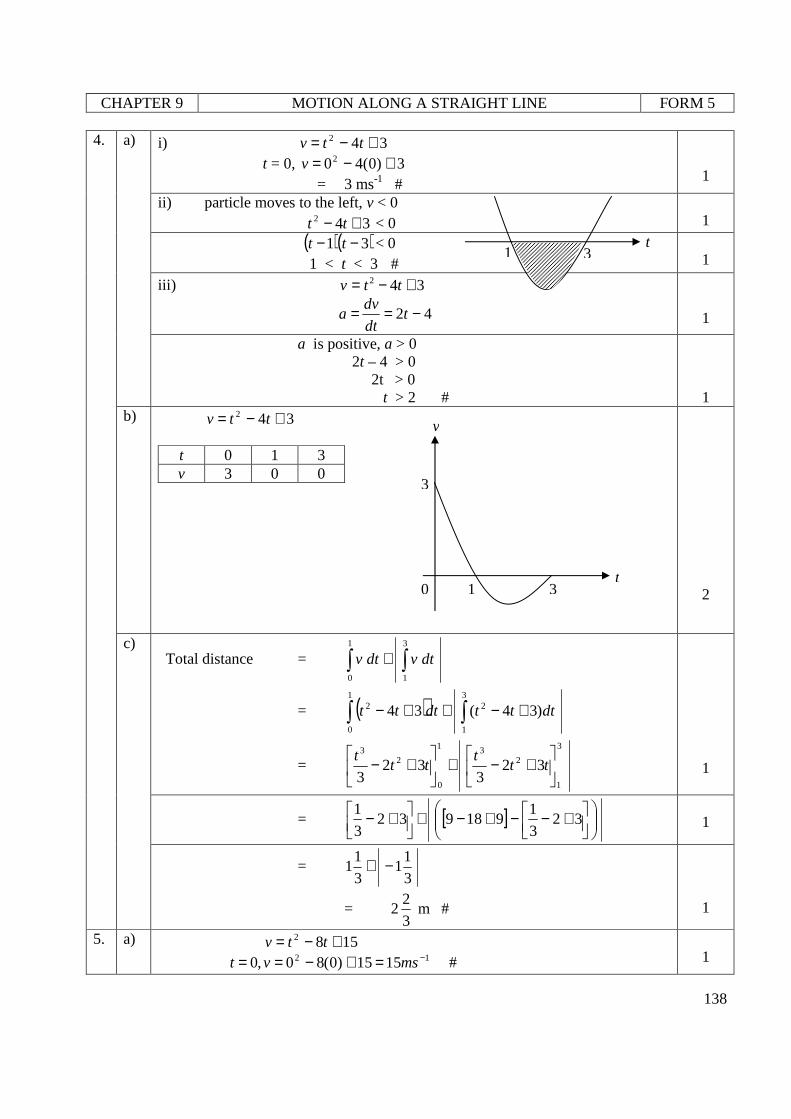
CHAPTER 9 MOTION ALONG A STRAIGHT LINE FORM 5
138
4. a) i) 342 +−= ttv t = 0, 3)0(402 +−=v = 3 ms-1 #
1
ii) particle moves to the left, v < 0 342 +− tt < 0
1
( )( )31 −− tt < 0 1 < t < 3 #
1
iii) 342 +−= ttv
42 −== tdt
dva
1
a is positive, a > 0 2t – 4 > 0 2t > 0
t > 2 #
1
b) 342 +−= ttv
t 0 1 3 v 3 0 0
2
c) Total distance = ∫∫ +
3
1
1
0
dtvdtv
= ( )∫ ∫ +−++−1
0
3
1
22 )34(34 dtttdttt
= 3
1
231
0
23
323
323
+−+
+− tt
ttt
t
1
= [ ]
+−−+−+
+− 323
1918932
3
1
1
= 3
11
3
11 −+
= 23
2 m #
1
5. a) 1582 +−= ttv 12 1515)0(80,0 −=+−== msvt #
1
v
3
0 1 3 t
1 3 t
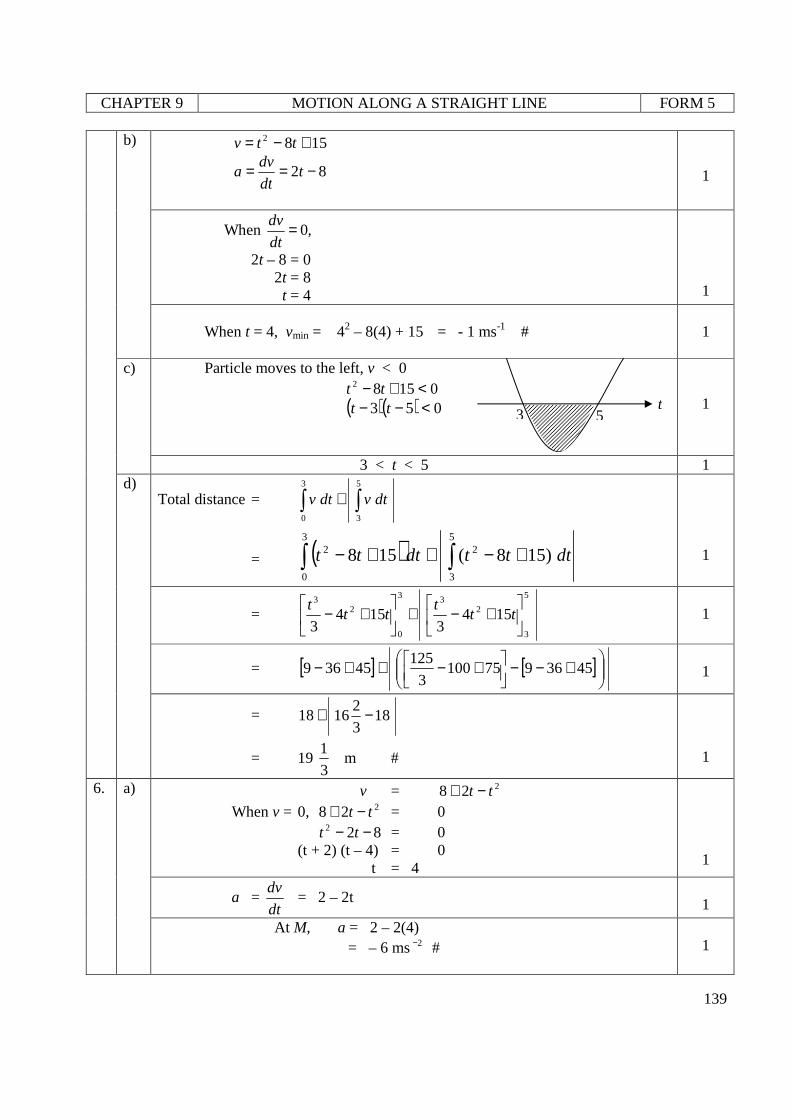
CHAPTER 9 MOTION ALONG A STRAIGHT LINE FORM 5
139
b) 1582 +−= ttv
82 −== tdt
dva
1
When ,0=dt
dv
2t – 8 = 0 2t = 8 t = 4
1
When t = 4, vmin = 42 – 8(4) + 15 = - 1 ms-1 #
1
c) Particle moves to the left, v < 0 01582 <+− tt
( )( ) 053 <−− tt
1
3 < t < 5 1 d)
Total distance = ∫∫ +5
3
3
0
dtvdtv
= ( )∫ ∫ +−++−3
0
5
3
22 )158(158 dtttdttt
1
= 5
3
233
0
23
1543
1543
+−+
+− tt
ttt
t
1
= [ ] [ ]
+−−
+−++− 45369751003
12545369
1
= 183
21618 −+
= 19 3
1 m #
1
6. a) v = 228 tt −+ When v = 0, 228 tt −+ = 0 822 −− tt = 0 (t + 2) (t – 4) = 0 t = 4
1
a = dt
dv = 2 – 2t
1
At M, a = 2 – 2(4) = – 6 ms2− #
1
3 5 t
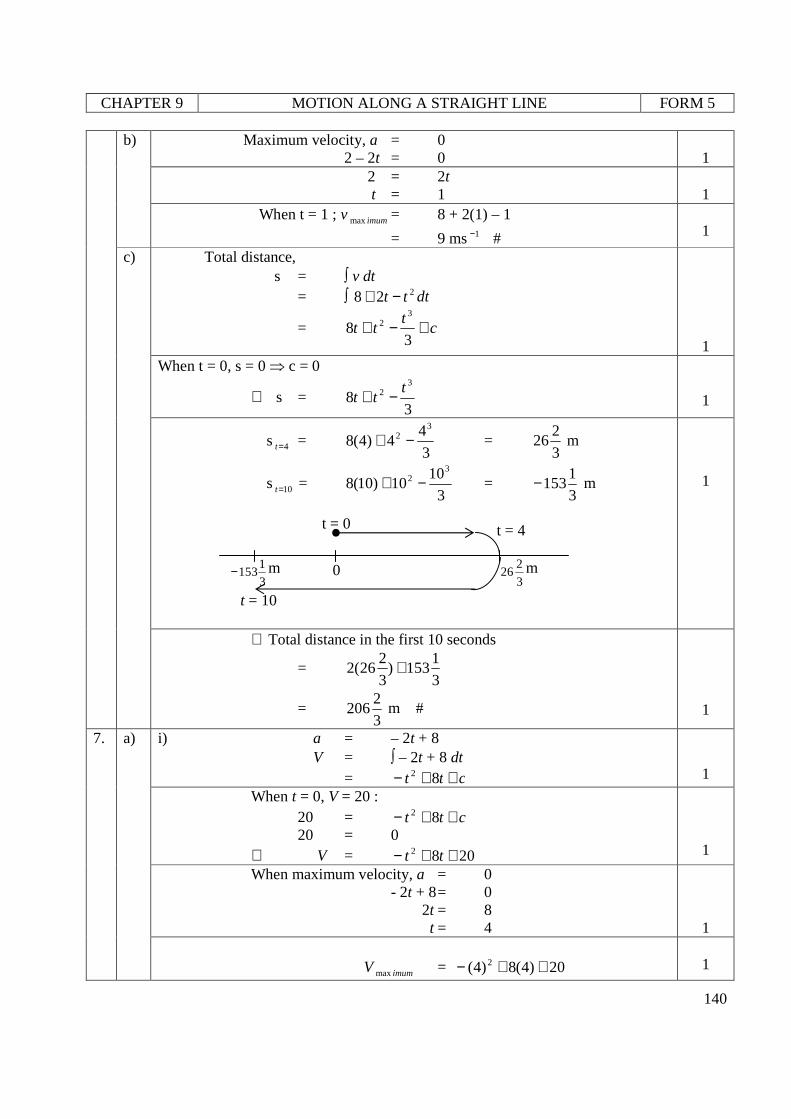
CHAPTER 9 MOTION ALONG A STRAIGHT LINE FORM 5
140
b) Maximum velocity, a = 0 2 – 2t = 0
1
2 = 2t t = 1
1
When t = 1 ; v imummax = 8 + 2(1) – 1
= 9 ms1− #
1
c) Total distance, s = ∫ v dt
= ∫ 228 tt −+ dt
= ct
tt +−+3
83
2
1
When t = 0, s = 0 ⇒ c = 0
∴ s = 3
83
2 ttt −+
1
s 4=t = 3
44)4(8
32 −+ =
3
226 m
s 10=t = 3
1010)10(8
32 −+ =
3
1153− m
1
∴ Total distance in the first 10 seconds
= 3
1153)
3
226(2 +
= 3
2206 m #
1
7. a) i) a = – 2t + 8 V = ∫ – 2t + 8 dt = ctt ++− 82
1
When t = 0, V = 20 : 20 = ctt ++− 82 20 = 0 ∴ V = 2082 ++− tt
1
When maximum velocity, a = 0 - 2t + 8 = 0 2t = 8 t = 4
1
V imummax = 20)4(8)4( 2 ++−
1
t = 0
0 3
1153− m
3
226 m
t = 4
t = 10
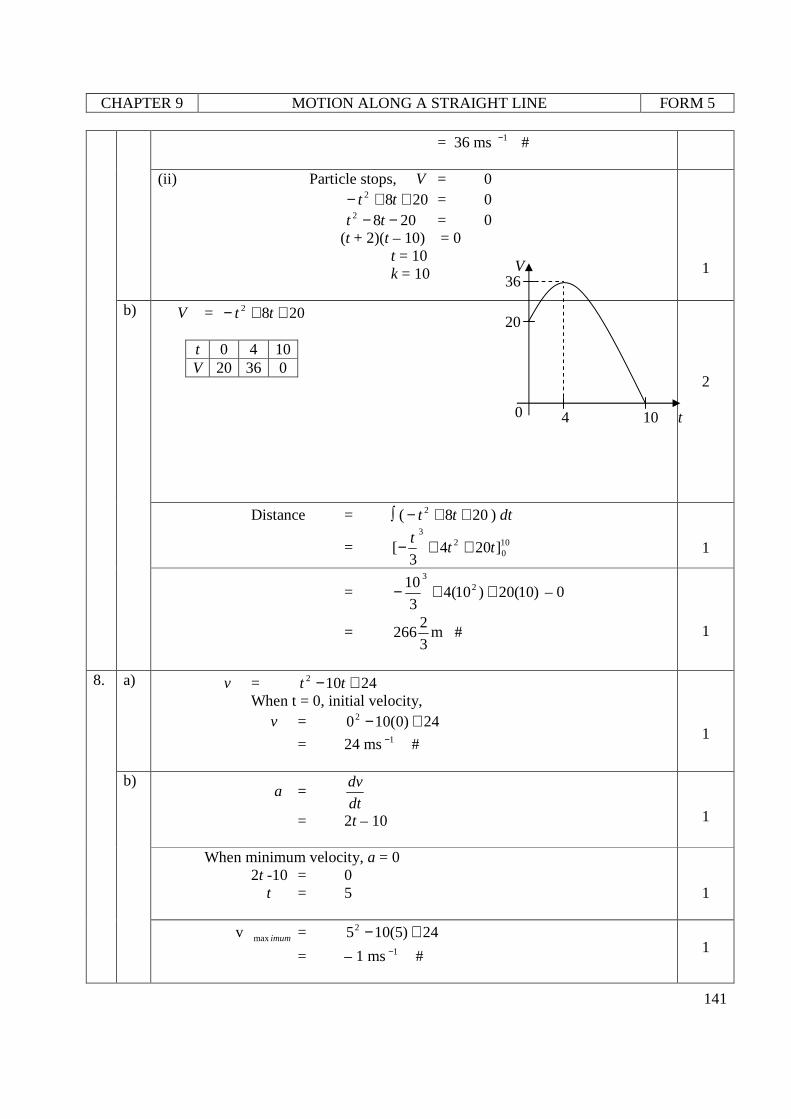
CHAPTER 9 MOTION ALONG A STRAIGHT LINE FORM 5
141
= 36 ms 1− # (ii) Particle stops, V = 0 2082 ++− tt = 0 2082 −− tt = 0 (t + 2)(t – 10) = 0 t = 10 k = 10
1
b) V = 2082 ++− tt
t 0 4 10 V 20 36 0
2
Distance = ∫ ( 2082 ++− tt ) dt
= 100
23
]2043
[ ttt ++−
1
= )10(20)10(43
10 23
++− – 0
= 3
2266 m #
1
8. a) v = 24102 +− tt When t = 0, initial velocity, v = 24)0(1002 +−
= 24 ms1− #
1
b) a =
dt
dv
= 2t – 10
1
When minimum velocity, a = 0 2t -10 = 0 t = 5
1
v imummax = 24)5(1052 +−
= – 1 ms1− #
1
V 36
20
0 4 10 t
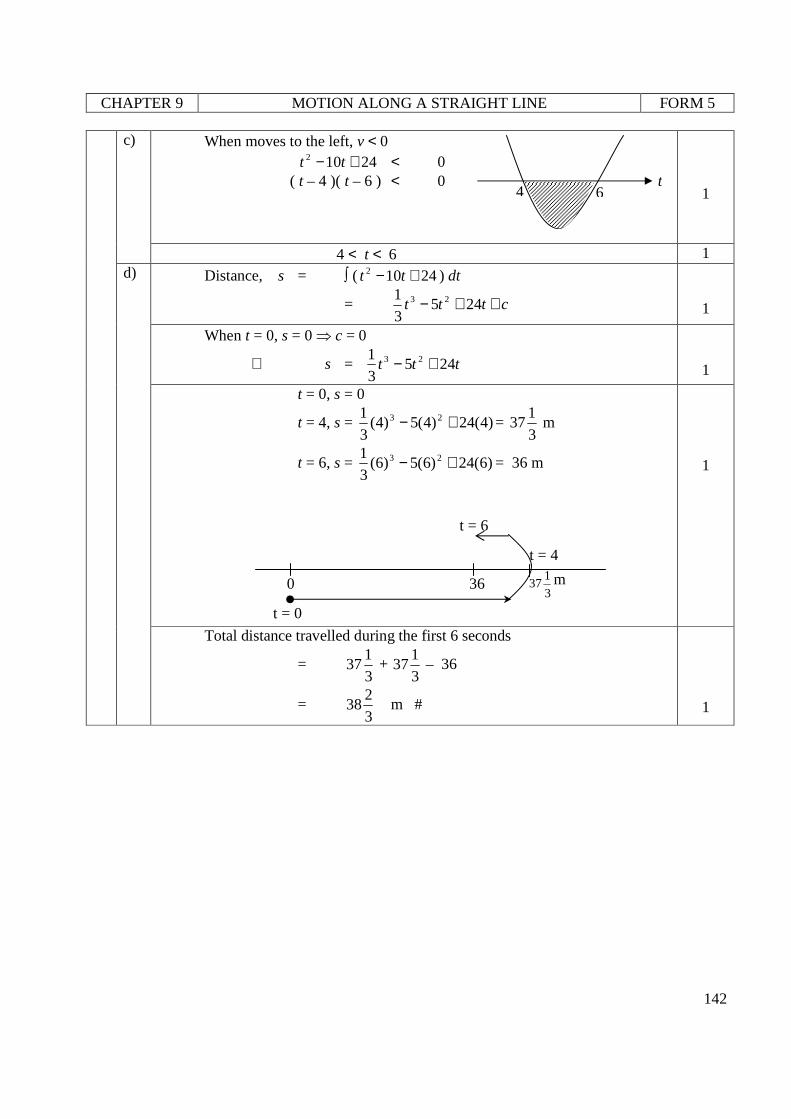
CHAPTER 9 MOTION ALONG A STRAIGHT LINE FORM 5
142
c) When moves to the left, v < 0 24102 +− tt < 0
( t – 4 )( t – 6 ) < 0
1
4 < t < 6 1 d) Distance, s = ∫ ( 24102 +− tt ) dt
= cttt ++− 2453
1 23
1
When t = 0, s = 0 ⇒ c = 0
∴ s = ttt 2453
1 23 +−
1
t = 0, s = 0
t = 4, s = )4(24)4(5)4(3
1 23 +− = 3
137 m
t = 6, s = )6(24)6(5)6(3
1 23 +− = 36 m
1
Total distance travelled during the first 6 seconds
= 3
137 +
3
137 – 36
= 3
238 m #
1
4 6 t
t = 0
36 3
137 m
t = 4
0
t = 6