k-means clustering for acute leukemia blood cells image · pdf file9 k-means clustering for...
TRANSCRIPT
9
K-Means Clustering For Acute Leukemia Blood
Cells Image
Farah H. A. Jabar1,Waidah Ismail
1, Khairi A. Rahim
1, Rosline Hassan
3
1Faculty of Science and Technology, Universiti Sains Islam Malaysia, Negeri Sembilan, Malaysia
3Hematology Department Universiti Hospital, Universiti Sains Malaysia, Kelantan, Malaysia,
[email protected], {waidah, khairiabdulrahim}@usim.edu.my, [email protected]
Abstract: Image segmentation is a major task and important steps in
the blood cell image analysis due to the fact that it has significant
effect of the next processing of images. Automated segmentation
technique has become an interesting area in clinical practices for
the blood cell diagnosis. Clustering is one of the most common
automated segmentation techniques used for image segmentation
analysis. Recently many scientists have performed tremendous
research in helping the hematologists in the issue of segmenting the
blood cells in the early of prognosis. This paper is focus on
processing the blood cell images of patients suffering from acute
leukemia via automated segmentation using an adaptive K-Means
clustering algorithm. The experimental result has produced
comprehensive output images without applying any filtering
technique to remove the background scene
Keywords: image segmentation, k-means, leukemia cells.
1. Introduction
Image processing has become significant to human life
especially in medical, environmental and socioeconomic
applications. By the increasing use of direct digital imaging
systems for medical diagnostics, digital image processing
becomes more important in biomedical diagnosis and health
care. Image segmentation is among of the image processing
method that has been, and yet still a relevant area in digital
image processing due to its wide spread usage and
applications. Image segmentation is a complex process
which is commonly used for images segmentation in medical
analysis. The goal of image segmentation is to partition of an
image into a set of image regions, which is corresponding to
certain properties or characteristics, for object identification,
classification and processing [1].
Image segmentation can be categorized into two types,
supervised and unsupervised. Practically in lab, the most
common method for evaluating the effectiveness of a
segmentation method is a human supervision. Hematologist
will make comparison with the segmented results for
separate segmentation algorithms. This is known as
supervised segmentation. However, this process is tedious
and limits the depth of evaluation to a relatively small
number of segmentation comparisons over a set of images
[2]. An unsupervised method provides more effective and
accurate results of the segmented images. Unsupervised
segmentation method are fully automated and it uses
different kind of automated algorithm such as region or
boundary based [3], edge based and thresholding [4]. The
goal of the automated segmentation tools is to automate the
process with faster and accurate results.
Automated segmentation for blood cell image has
tremendous growth in the study of diagnostic pathology. It
has become a great attention for clinical researcher
especially for hematologist to analyze the human blood and
classify the area of interest such as texture, shape or color.
They can identify the clinical behavior of the disease and
predict the abnormalities of the blood cell. Many automated
segmentation techniques have been proposed in the literature
to overcome the issue of image segmentation specifically in
blood cell such as morphological features, watershed
clustering and thresholding. All of this effort is to provide
valuable information to experts in diagnosis of several
diseases related to blood cells.
2. Image segmentation
Digital Image processing has been utilized in many areas of
biomedical research and applications. In automated imaging
technique, the existing techniques for image recognition and
visualization [5], and object based image compression [6] is
highly depend on the segmentation results. Segmentation is
the process of partitioning a digital image into sets of pixels.
The goal of segmentation is to simplify the representation of
an image into something that is more meaningful and easier
to analyze. Image segmentation is typically used to locate
objects and boundaries in images. Recently many
segmentation tools have been proposed and develop to
produce better segmentation on medical images such as
clustering [7], active contour [8], thresholding [9] and
region-based [10,11].
Thresholding is among the initial techniques developed
for image segmentation due to its simplicity and intuitive
properties that provides image thresholding a central position
[9]. The active contour model known as snake model (Kass,
1988) had also been used to segment white blood cells in
bone marrow to extract features using the deformable model
[8]. Model based algorithm is proposed to solve the cluster-
separation problem in leukocytes cluster using moving
interface models and model-based combinatorial
optimization scheme [12]. A combination technique is used
to segment white blood cells on color space images using
feature space clustering techniques, scale-space filtering for
nucleus extraction, and watershed clustering for cytoplasm
extraction [13]. Many automated segmentation methods are
based on two basic properties of the pixels related to their
local neighborhood; discontinuity and similarity. Methods
based on discontinuity and similarity property of the pixels
are called boundary-based methods and region-based
10
methods. Unfortunately, both techniques, boundary-based
and region-based often fail to produce accurate segmentation
results [14]. Recently there are some approaches that have
been developed to perform automated detection for leukemia
cells which utilized Otsu method combine with artificial
intelligence which includes Cellular Automata and heuristic
search [15] and thresholding technique [16].
2.1 K-Means Clustering
In recent years there has been a growing interest in
developing effective methods for image clustering.
Unsupervised learning has become common technique for
statistical data analysis used in many fields such as pattern
recognition, image analysis and bioinformatics. Clustering
techniques classifies the pixels with same characteristics into
one cluster, thus forming different clusters according to
coherence between pixels in a cluster. Image clustering is a
means for description of image content. The aim is to map
the archived images into groups (clusters) with the exact
information about the archived image collection. This
approach was one of the first techniques used for the
segmentation natural images due to its simplicity and
efficiency [17]. Image clustering provides an efficient
retrieval algorithms and the creation of a user-friendly
interface to the database. The quality of clustering depends
on the method and implementation measure which able to
discover hidden patterns. A good clustering consists of high
intra-class similarity and low inter-class similarity.
K-Means clustering algorithm is one of the recent
techniques that have been proposed in the area of blood cells
analysis. K-Means algorithm is an unsupervised clustering
algorithm that classifies the input data points into multiple
classes based on their minimum distance. In medical
imaging, K-Means clustering has been proven to give good
segmentation image performance due its performance in
clustering massive datasets [18]. The final clustering result
of the K-Means clustering algorithm is highly dependable on
the correctness of the initial centroids. In 2011, Filipczuk
used a threshloding method prior k-means algorithm to
distinguish nuclei from red blood cells and other objects
[19]. Recent paper suggested hybrid K-Means merging with
median-cut algorithms for blood cell image segmentation to
produce better segmented image of the blood cells [20]. In
2000, Moving K-Means (Mashor, 2000) is used to segment
the blast cell in acute leukemia blood samples. The
clustering was performed after applying the threshold
method using saturation component formula [22]. All of
these shows that the K-Means method would yield better
segmentation as we input a priori information to the
clustering process. Due to this issue, this study is to focus on
the classic K-Means which imposed an efficient way of
choosing the initial centroid during the initialization step for
better segmentation of the blast cells.
3. Method
3.1 Image acquisition
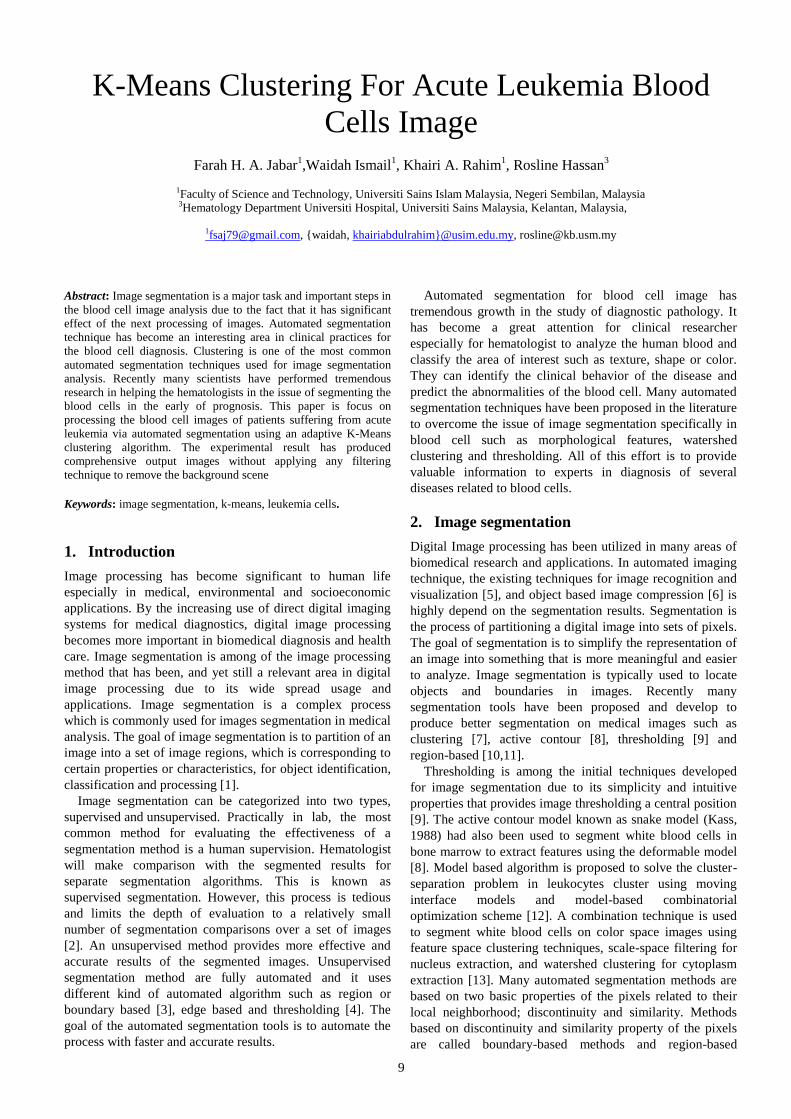
The datasets used in this study consists of 10 of real images,
which taken from patients suffering from AML. The size of
the image is 1280 by 960 pixels. All of these images are
provided by the Department of Hematology in University
Sains Malaysia (USM) located in Kota Bharu, Kelantan,
Malaysia. Figure 1 show the example of the leukemia
images.
Figure1. Example of leukemia images
3.2 K-Means Algorithm
K-means (MacQueen, 1967) is one of the simplest
unsupervised learning algorithms that solve the well known
clustering problem. The simple method is to classify a given
data set through a certain number of clusters (assume k
clusters) fixed a priori. The main idea of the clustering
process is divided into 2 phases: first phase is defining the k-
centroids, one for each cluster. This step is likely name
initializations step which contribute to the initial steps for the
whole process. The placement of the k-centroids is very
crucial because different location will give different result.
Then each point from data set will be mapped to the nearest
centroids until all points are assigned using Euclidean
Distance. Second phase observed the updates each of the
points. The k-centroids need to be recalculated as new k-
centroids and new mapping need to be done between the
points and the new k-centroids. This process will give
changes in k-centroids location step by step until the location
of centroids is retain.
2
1
)( ij
SiX
N
i
XCWj
(1)
where i is the mean of the i-th cluster based on the
assignment C. The interest is to minimize the sum of square
distance within-cluster and such assignments have to map
each point to its nearest centroids.
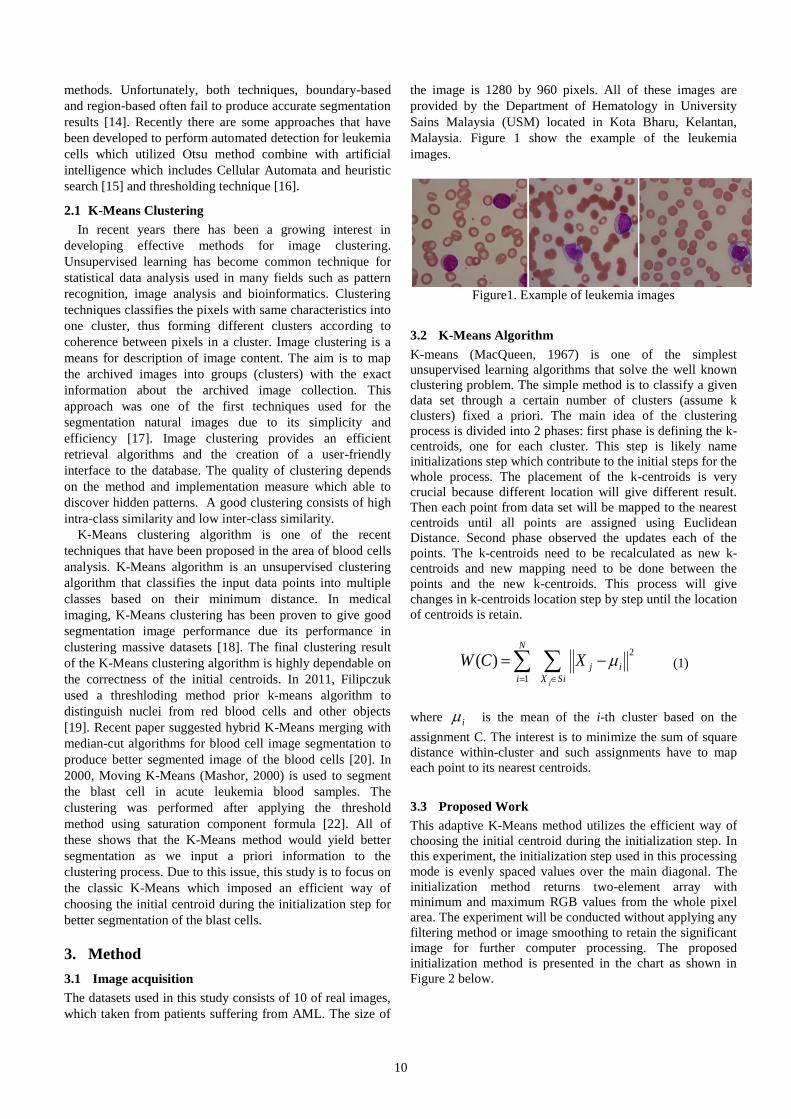
3.3 Proposed Work
This adaptive K-Means method utilizes the efficient way of
choosing the initial centroid during the initialization step. In
this experiment, the initialization step used in this processing
mode is evenly spaced values over the main diagonal. The
initialization method returns two-element array with
minimum and maximum RGB values from the whole pixel
area. The experiment will be conducted without applying any
filtering method or image smoothing to retain the significant
image for further computer processing. The proposed
initialization method is presented in the chart as shown in
Figure 2 below.
11
Figure 2. Method of adaptive K-Means during initialization
step
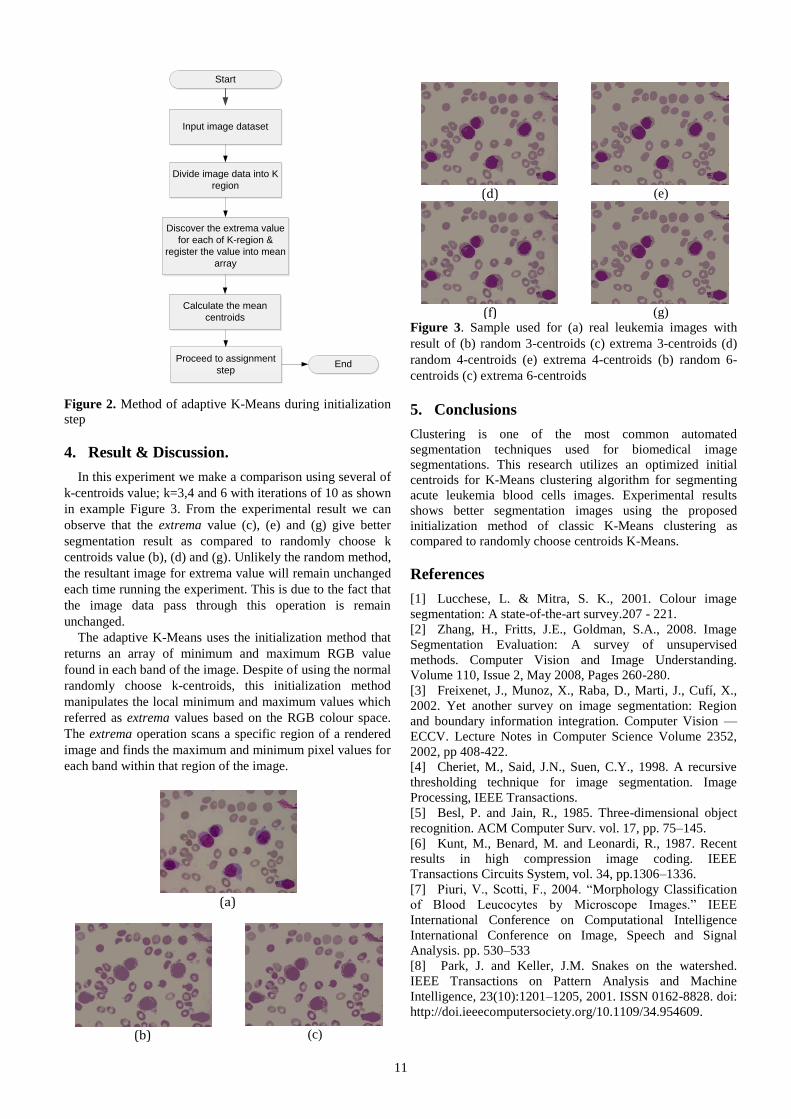
4. Result & Discussion.
In this experiment we make a comparison using several of
k-centroids value; k=3,4 and 6 with iterations of 10 as shown
in example Figure 3. From the experimental result we can
observe that the extrema value (c), (e) and (g) give better
segmentation result as compared to randomly choose k
centroids value (b), (d) and (g). Unlikely the random method,
the resultant image for extrema value will remain unchanged
each time running the experiment. This is due to the fact that
the image data pass through this operation is remain
unchanged.
The adaptive K-Means uses the initialization method that
returns an array of minimum and maximum RGB value
found in each band of the image. Despite of using the normal
randomly choose k-centroids, this initialization method
manipulates the local minimum and maximum values which
referred as extrema values based on the RGB colour space.
The extrema operation scans a specific region of a rendered
image and finds the maximum and minimum pixel values for
each band within that region of the image.
(a)
(b)
(c)
(d)
(e)
(f)
(g)
Figure 3. Sample used for (a) real leukemia images with
result of (b) random 3-centroids (c) extrema 3-centroids (d)
random 4-centroids (e) extrema 4-centroids (b) random 6-
centroids (c) extrema 6-centroids
5. Conclusions
Clustering is one of the most common automated
segmentation techniques used for biomedical image
segmentations. This research utilizes an optimized initial
centroids for K-Means clustering algorithm for segmenting
acute leukemia blood cells images. Experimental results
shows better segmentation images using the proposed
initialization method of classic K-Means clustering as
compared to randomly choose centroids K-Means.
References
[1] Lucchese, L. & Mitra, S. K., 2001. Colour image
segmentation: A state-of-the-art survey.207 - 221.
[2] Zhang, H., Fritts, J.E., Goldman, S.A., 2008. Image
Segmentation Evaluation: A survey of unsupervised
methods. Computer Vision and Image Understanding.
Volume 110, Issue 2, May 2008, Pages 260-280.
[3] Freixenet, J., Munoz, X., Raba, D., Marti, J., Cufí, X.,
2002. Yet another survey on image segmentation: Region
and boundary information integration. Computer Vision —
ECCV. Lecture Notes in Computer Science Volume 2352,
2002, pp 408-422.
[4] Cheriet, M., Said, J.N., Suen, C.Y., 1998. A recursive
thresholding technique for image segmentation. Image
Processing, IEEE Transactions.
[5] Besl, P. and Jain, R., 1985. Three-dimensional object
recognition. ACM Computer Surv. vol. 17, pp. 75–145.
[6] Kunt, M., Benard, M. and Leonardi, R., 1987. Recent
results in high compression image coding. IEEE
Transactions Circuits System, vol. 34, pp.1306–1336.
[7] Piuri, V., Scotti, F., 2004. “Morphology Classification
of Blood Leucocytes by Microscope Images.” IEEE
International Conference on Computational Intelligence
International Conference on Image, Speech and Signal
Analysis. pp. 530–533
[8] Park, J. and Keller, J.M. Snakes on the watershed.
IEEE Transactions on Pattern Analysis and Machine
Intelligence, 23(10):1201–1205, 2001. ISSN 0162-8828. doi:
http://doi.ieeecomputersociety.org/10.1109/34.954609.
Start
Discover the extrema value
for each of K-region &
register the value into mean
array
Divide image data into K
region
Input image dataset
Calculate the mean
centroids
Proceed to assignment
stepEnd
12
[9] Cseke, I., 1992. A Fast Segmentation Scheme for White
Blood Cell Images. Proceeding 11th IAPR for Measurement
Systems and Applications Boston, MA, USA.
[10] Wu, J., Zheng, P, Zhou, Y and Olivier, C., 2006. “A
Novel Colour Image Segmentation Method and Its
Application to White Blood Cell Image Analysis” 8th
International Conference On Signal Processing, ISCP 2006,
Guilin, China, IEEE.
[11] O'Neill, P., 2005. Improved Analysis of Microarray
Images. School of Information System and Computing.,
Brunel University. (Doctoral Dissertation).
[12] Nilsson, B. and Heyden, A. “Model-based
Segmentation of Leukocytes Clusters”. Pattern Recognition,
2002. Proceedings. 16th International Conference on,Vol. 1,
pp.727 – 730, 2002.
[13] Jiang, K., Liao, Q., Dai, S., 2003. “A novel white blood
cell segmentation scheme using scale-space filtering and
watershed clustering.” Machine Learning and Cybernetics,
2003 International Conference on. 2003;5:2820–2825.
[14] Yadav, R. and Sharma, A., 2012. Advanced Methods to
Improve Performance of K-Means Algorithm: A Review.
Global Journal of Computer Science and Technology
Volume 12 Issue 9, Ver. 1.0.
[15] Ismail, W., Hassan, R., Swift, S., 2010. Detecting
Leukaemia (AML) Blood Cells Using Cellular Automata and
Heuristic Search. Advances in Intelligent Data Analysis IX
Lecture Notes in Computer Science Volume 6065, 2010, pp
54-66.
[16] Nasir, A. S., Mustafa, N., Nasir, N. F., 2009.
“Application of Thresholding Technique in Determining
Ratio of Blood Cells for Leukaemia Detection.” Proceedings
of the International Conference on Man-Machine Systems.
[17] Lloyd, S. P. (1982) Least squares quantization in PCM.
IEEE Trans. Inf.Theory, vol. IT-28, no. 2, pp. 129–136.
[18] Małyszko,D., Wierzchoń, S. T., 2007. Standard and
Genetic K-Means Clustering Techniques in Image
Segmentation. (CISIM'07) 0-7695-2894-5/07 IEEE.
[19] Filipczuk, P., Kowal, M., Obuchowicz, A., 2011.
Automatic Breast Cancer Diagnosis Based on K-Means
Clustering and Adaptive Thresholding Hybrid Segmentation.
Image Processing and Communications Challenges. 3, 295-
302
[20] Muda, T.Z., Salam, R.A., 2011. “Blood cell image
segmentation using hybrid K-Means and median-cut
algorithms” IEEE International Conference on Control
System, Computing and Engineering (ICCSCE), 2011.
[21] Samma, A.S., Salam, R.A., 2009. Adaptation of K-
Means Algorithm for Image Segmentation. International
Journal of Information and Communication Engineering 5:4.
[22] Harun, N.H., Mashor, M.Y. and Hassan, R., 2011.
Automated Blasts Segmentation Techniques Based on
Clustering Algorithm for Acute Leukaemia Blood Samples.
Journal of Advanced Computer Science and Technology
Research 1. 96-109
[23] Hassan, R., 1996. Diagnosis and outcome of patients
with Acute leukaemia. Degree of Master of Medicine,
Haematology department University Science Malaysia.
[24] Hoffbrand, A.V., Pettit, J.E. and Moss, P.A.H, 2001.
Essential Hematology. Fourth Edition. Forth ed.: Blackwell
Science.
[25] Hall, L.O, Bensaid, A.M., Clarke, L.P., Velthuizen,
R.P., Silbiger, M.S. and Bezdek, J.C., 1992. A comparison of
neural network and fuzzy clustering techniques in
segmenting magnetic resonance images of the brain. IEEE
Transactions on Neural Networks. Vol. 3, No. 5, pp. 672-
682.
[26] Hohne, K., Fuchs, H. and Pizer, S., 1990. 3D Imaging
in Medicine: Algorithms, Systems, Applications. Berlin,
Germany: Springer-Verlag.
[27] Mittal, P. and Meehan, K.R., 2001. The Acute
Leukaemia. Clinical Review Article, Hospital Physician. 37–
44.
[28] Nipon, T.U and Gader, P., 2002. System level training
of neural network for counting white blood cell. IEEE
Transactions SMS-C, Vol.32 (1). 48-53.
[29] Otsu, N., 1979. A Threshold Selection Method from
Gray-Level Histograms. IEEE Transactions on Systems,
Man, And Cybernetics, SMC-9, 62 - 66.
[30] Shapiro, L.G. and Stockman, G.C., 2001. Computer
Vision. pp 279-325, New Jersey, Prentice-Hall.