jpke.gov.bnjpke.gov.bn/depd documents library/dos/bdsyb/bdsyb_2018/bdsyb_2018.pdfii perpustakaan...
TRANSCRIPT
BRUNEI DARUSSALAMSTATISTICAL YEARBOOK 2018
DEPARTMENT OF STATISTICS
DEPARTMENT OF ECONOMIC PLANNING AND DEVELOPMENT (DEPD)
MINISTRY OF FINANCE AND ECONOMY
BRUNEI DARUSSALAM
JABATAN PERANGKAAN
JABATAN PERANCANGAN DAN KEMAJUAN EKONOMI (JPKE)
KEMENTERIAN KEWANGAN DAN EKONOMI
NEGARA BRUNEI DARUSSALAM
I
BRUNEI DARUSSALAM STATISTICAL YEARBOOK
2018
JABATAN PERANGKAANJABATAN PERANCANGAN DAN KEMAJUAN EKONOMI (JPKE)
KEMENTERIAN KEWANGAN DAN EKONOMINEGARA BRUNEI DARUSSALAM
DEPARTMENT OF STATISTICSDEPARTMENT OF ECONOMIC PLANNING AND DEVELOPMENT (DEPD)
MINISTRY OF FINANCE AND ECONOMYBRUNEI DARUSSALAM
II
Perpustakaan Dewan Bahasa dan Pustaka BruneiPengkatalogan Data-dalam-Penerbitan
BRUNEIDarussalamstatisticalyearbook2018.--BandarSeriBegawan: DepartmentofStatistics,DeparmentofEconomicPlanningandDevelopment (DEPD),MinistryofFinanceandEconomy,2019. 340p.cm. ISBN978-99917-72-19-6(Softcover) 1.BruneiDarussalam--Statistics--Periodicals2.BruneiDarussalam--Islamicconditions--Statistics--Periodicals3.BruneiDarussalam--Economicconditions--Statistics--Periodicals4.BruneiDarussalam--Handbooks,manuals,etc5.BruneiDarussalam--Population--StatisticsPeriodicals6.BruneiDarussalam--Laborsupply--StatisticsPeriodicals7.BruneiDarussalam--Unemployed--StatisticsPeriodicalsI.TitleII.JabatanPerancangandanKemajuanEkonomi
315.955BRU(DDC23)

III
IV
KATA PENGANTAR
Buku Perangkaan Tahunan Negara Brunei Darussalam (BDSYB) adalah buku terbitantahunanJabatanPerangkaandiJabatanPerancangandanKemajuanEkonomi(JPKE),KementerianKewangandanEkonomi.Tujuanutamapenerbitaniniadalahuntukmenyebarluaskanperangkaanrasmiyangterkinimengenaiciri-ciriamdemografi,sosialdanekonomiNegaraBruneiDarussalambagikegunaanperancang,penggubaldasar,penyelidik,akademiadanorangramai.BDSYB2018adalahkeluaranedisikeempatpuluhduadalamsiriyangsama.
Buku Perangkaan ini memuatkan anggaran penduduk pertengahan tahun 2017 yang telahdisemaksemula.Disamping itu,hasildariBanciEkonomiPerusahaan/Perniagaan2016danBanciTahunanPerusahaan2017jugatelahdimuatkandalamedisiini.
Saya sukacita merakamkan setinggi-tinggi penghargaan dan ucapan terima kasih kepadaKementerian-KementeriandanJabatan-JabatanKerajaanyangterlibatdanlain-lainpihakataskerjasamadanbantuanyangberterusandalammembekalkanperangkaanyangberkaitan.JPKEmelaluiJabatanPerangkaanakanterusmemperbaikipenerbitaninidarimasakesemasaselarasdenganpeningkatanpermintaandanperkembanganperangkaansemasa.Ulasandancadanganbagimemperbaikilagikandungandanspesifikasijadualdalamterbitaniniadalahdialu-alukan.
HAJAH MARIAH BINTI HAJI YAHYA Pengarah Perangkaan
Jabatan Perancangan dan Kemajuan EkonomiKementerian Kewangan dan Ekonomi
Negara Brunei Darussalam
V
FOREWORD
Brunei Darussalam Statistical Yearbook (BDSYB) is an annual publication of Department of Statistics, Department of Economic Planning and Development (DEPD), Ministry of Finance and Economy. Its main aim is to disseminate up-to-date official statistics on the general demographic, social and economic characteristics of Brunei Darussalam for the use of planners, policy makers, researchers, academician and the general public. BDSYB 2018 is the 42nd edition in the same series.
This Statistical Yearbook presents the revised mid-year population estimates for the year 2017. Furthermore, results from the Economic Census of Enterprises 2016 and Annual Census of Enterprises 2017 are also included in this edition.
I would like to record my sincere thanks and appreciation to all relevant Government Ministries and Departments and others for their continuous assistance and support in providing the relevant statistics. JPKE through the Department of Statistics will continue to improve this publication from time to time in line with the increasing demand and current statistical development. Comments and suggestions forfurther improvement on the contents and tabulation specifications in the publication are most welcome.
HAJAH MARIAH BINTI HAJI YAHYA Director of Statistics
Department of Economic Planning and DevelopmentMinistry of Finance and Economy
Brunei Darussalam
VI
ISI KANDUNGANCONTENTS
NEGARA BRUNEI DARUSSALAM: PENGENALAN BRUNEI DARUSSALAM: AN INTRODUCTION
PENUNJUK PERANGKAAN STATISTICAL INDICATORS
SEKSYEN 1 PENDUDUK DAN PERANGKAAN VITALSECTION 1 POPULATION AND VITAL STATISTICS
NotaKeteranganExplanatory Notes
2-5
1.1 PendudukmengikutJantina,NisbahJantinadanKadarPertumbuhanTahunanPopulation by Sex, Sex Ratio and Annual Growth Rate
6
1.2 PendudukmengikutDaerahPopulation by Districts
7
1.3 PendudukmengikutTarafPendudukPopulation by Residential Status
8
1.4 PendudukmengikutBangsaPopulation by Race
9
1.5 PendudukmengikutDaerahdanJantinaPopulation by District and Sex
10
1.6 KadarPertumbuhanTahunanPendudukmengikutDaerahdanJantinaAnnual Population Growth Rate by District and Sex
11
1.7 KepadatanPendudukmengikutDaerahdanJantinaPopulation Density by District and Sex
12
1.8 PendudukmengikutBangsadanJantinaPopulation by Race and Sex
13
VII
1.9 PendudukmengikutTarafPendudukdanJantinaPopulation by Residential Status and Sex
14
1.10 PendudukmengikutKumpulanUmurdanJantinaPopulation by Age Group and Sex
15-16
1.11 AnggaranPendudukPertengahanTahunmengikutBangsa,JantinadanDaerah,2018Mid-Year Population Estimates by Race, Sex and District, 2018
17
1.12 KelahiranHidup,KematianBerdaftardanKadar-KadarVitalRegistered Live Births, Deaths and Vital Rates
18-19
1.13 KelahiranHidupyangDidaftarkanmengikutDaerahdanJantinaRegistered Live Birth by District and Sex
20
1.14 KelahiranHidupyangDidaftarkanmengikutBeratKelahiranRegistered Live Birth by Birth Weight
21
1.15 KelahiranHidupyangDidaftarkanmengikutUmurIbuRegistered Live Birth by Age of Mother
22
1.16 KelahiranHidupyangDidaftarkanmengikutBangsaBapadanJantinaRegistered Live Birth by Race of Father and Sex
23
1.17 KelahiranHidupyangDidaftarkanmengikutSusunanKelahiranRegistered Live Birth by Live Birth Order
24
1.18 KematianyangDidaftarkanmengikutDaerahdanJantinaDeath Registered by District and Sex
25
1.19 KematianyangDidaftarkanmengikutKumpulanUmurdanJantina,2018Death Registered by Age Group and Sex, 2018
26
1.20 PerkahwinanmengikutJenisPerkahwinandanDaerahMarriages by Type of Marriage and District
27
1.21 PerkahwinanmengikutKumpulanUmurbagiPengantinLelakidanPerempuanMarriages by Age Group of Grooms and Brides
28

VIII
1.22 PerceraianmengikutDaerahDivorces by District
29
1.23 PerceraianmengikutTempohPerkahwinanDivorces by Duration of Marriage
30
1.24 PerceraianmengikutKumpulanUmurdanJantina Divorces by Age Group and Sex
31
SEKSYEN 2 TENAGA KERJA SECTION 2 LABOUR FORCE
NotaKeteranganExplanatory Notes
33
2.1 TenagaKerjaUmur15TahundanKeatasHasildariKajiandanBanciLabour Force Aged 15 Years and Above from Survey and Census Results
34
2.2 TenagaKerjamengikutKumpulanUmurbagiTahun2017dan2018Labour Force by Age Group for Year 2017 and 2018
35-36
2.3 KadarPenyertaanTenagaKerjamengikutKumpulanUmurbagiTahun2014,2017dan2018Labour Force Participation Rate by Age Group for Year 2014, 2017 and 2018
37
2.4 TenagaKerjaBerumur18hingga59TahunbagiKajianTenagaKerja2018Labour Force Aged 18 to 59 Years for Labour Force Survey 2018
38
2.5 PekerjaKerajaanmengikutBahagianGovernment Employees by Division
39

IX
SEKSYEN 3 PERANGKAAN AKAUN NEGARASECTION 3 NATIONAL ACCOUNTS STATISTICS
NotaKeteranganExplanatory Notes
41-46
3.1 KeluaranDalamNegeriKasarmengikutSektorMinyakdanGas,SektorBukanMinyakdanGasdanPendekatanPendapatanGross Domestic Product by Oil and Gas Sector, Non-Oil and Gas Sector and Income Approach
47-48
3.2 KeluaranDalamNegeriKasarPerKapitaGross Domestic Product Per Capita
49
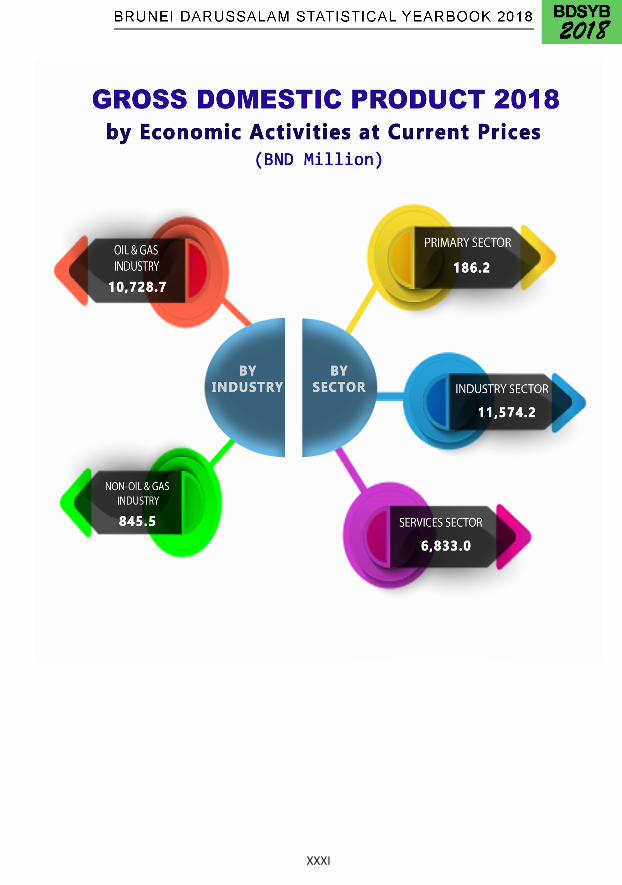
3.3 KeluaranDalamNegeriKasarmengikutJenisAktivitiEkonomipadaHargaSemasaGross Domestic Product by Kind of Economic Activity at Current Prices
50-51
3.4 PeratusAgihanKeluaranDalamNegeriKasarmengikutJenisAktivitiEkonomipadaHargaSemasaGross Domestic Product Per Cent Distribution by Kind of Economic Activity at Current Prices
52-53
3.5 KeluaranDalamNegeriKasarmengikutJenisAktivitiEkonomipadaHargaTetap2010Gross Domestic Product by Kind of Economic Activity at Constant 2010 Prices
54-55
3.6 KadarPertumbuhanKeluaranDalamNegeriKasarmengikutJenisAktivitiEkonomipadaHargaTetap2010Gross Domestic Product Growth Rates by Kind of Economic Activity at Constant 2010 Prices
56-57
3.7 KeluaranDalamNegeriKasarmengikutJenisPerbelanjaanpadaHargaSemasaGross Domestic Product by Type of Expenditure at Current Prices
58
3.8 PeratusAgihanKeluaranDalamNegeriKasarmengikutJenisPerbelanjaanpadaHargaSemasaGross Domestic Product Per Cent Distribution by Type of Expenditure at Current Prices
59
X
3.9 KeluaranDalamNegeriKasarmengikutJenisPerbelanjaanpadaHargaTetap2010Gross Domestic Product by Type of Expenditure at Constant 2010 Prices
60
3.10 KadarPertumbuhanKeluaranDalamNegeriKasarmengikutJenisPerbelanjaanpadaHargaTetap2010Gross Domestic Product Growth Rates by Type of Expenditure at Constant 2010 Prices
61
3.11 KeluaranDalamNegeriKasarmengikutJenisAktivitiEkonomipadaHargaSemasaGross Domestic Product by Kind of Economic Activity at Current Prices
62-63
3.12 PeratusAgihanNilaiTambahKasarpadaHargaAsasmengikutJenisAktivitiEkonomipadaHargaSemasaGross Value Added at Basic Prices Per Cent Distribution by Kind of Economic Activity at Current Prices
64-65
3.13 KeluaranDalamNegeriKasarmengikutJenisAktivitiEkonomipadaHargaTetap2010Gross Domestic Product by Kind of Economic Activity at Constant 2010 Prices
66-67
3.14 KadarPertumbuhanKeluaranDalamNegeriKasarmengikutJenisAktivitiEkonomipadaHargaTetap2010Gross Domestic Product Growth Rates by Kind of Economic Activity at Constant 2010 Prices
68-69
SEKSYEN 4 HARGA SECTION 4 PRICES
NotaKeteranganExplanatory Notes
71-74
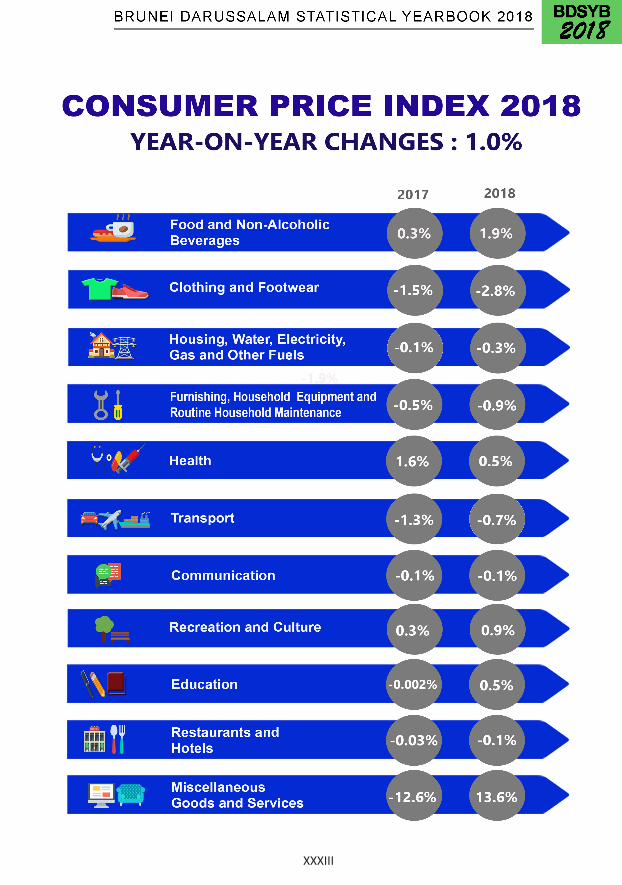
4.1 IndeksHargaPenggunaConsumer Price Index
75
XI
4.2 PeratusanPerubahanTahunanpadaIndeksHargaPengguna
Annual Percentage Change in Consumer Price Index76
4.3 IndeksHargaPenggunaBaranganmengikutKetahanandanPerkhidmatanConsumer Price Index of Goods According to Durability and Services
77
4.4 PeratusanPerubahanTahunanIndeksHargaPenggunaBaranganmengikutKetahanandanPerkhidmatanAnnual Percentage Change in Consumer Price Index of Goods According to Durability and Services
78
4.5 HargaRuncitPuratabagiBaranganMakananTerpilihAverage Retail Price of Selected Food Items
79-80
4.6 HargaRuncitPuratabagiBaranganTerpilihbagiBaranganBukanMakananAverage Retail Price of Selected Non-Food Items
81
4.7 HargaRuncitPuratabagiBaranganBersubsididandibawahKawalanHargaAverage Retail Price of Subsidised Items and under Price Control
82
SEKSYEN 5 IMBANGAN PEMBAYARAN SECTION 5 BALANCE OF PAYMENTS
NotaKeteranganExplanatory Notes
84-85
5.1 ImbanganPembayaranBalance of Payments
86-87
5.2 TransaksiPerkhidmatanServices Transactions
88
5.3 AkaunKewanganFinancial Account
89-92
XII
SEKSYEN 6 PERANGKAAN BARANGAN PERDAGANGAN ANTARABANGSASECTION 6 INTERNATIONAL MERCHANDISE TRADE STATISTICS
NotaKeteranganExplanatory Notes
94-97
PenjenisanBarangDaganganClassification of Trade Commodities
98
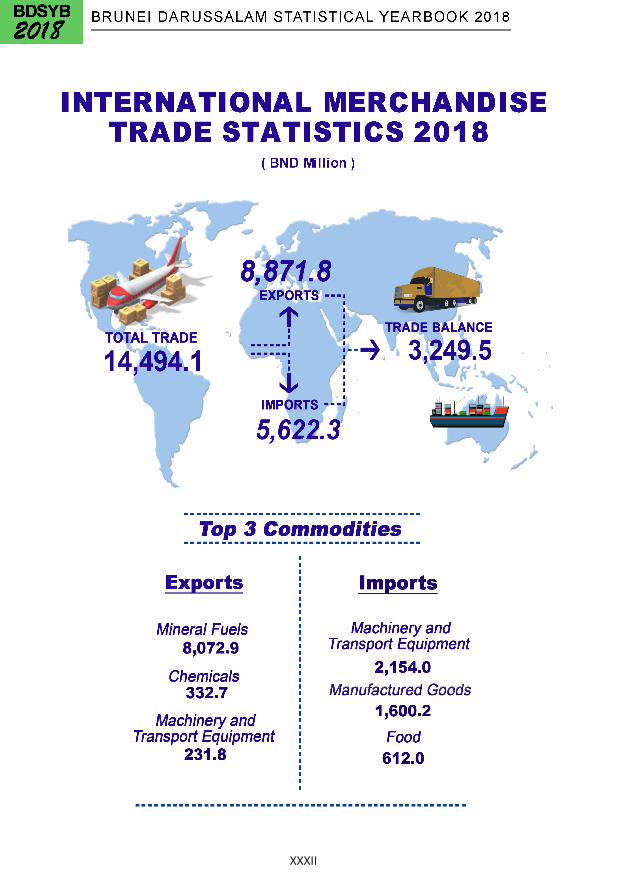
6.1 Eksport,Import,JumlahPerdagangandanImbanganPerdaganganExports, Imports, Total Trade and Trade Balance
99
6.2 KadarPertumbuhanEksport,Import,JumlahPerdagangandanImbanganPerdaganganGrowth Rates of Exports, Imports, Total Trade and Trade Balance
100
6.3 ImportmengikutSeksyenBaranganImports by Commodity Section
101
6.4 EksportmengikutSeksyenBaranganExports by Commodity Section
102
6.5 ImportBaranganUtamadanTerpilihImports of Major and Selected Commodities
103-104
6.6 EksportBaranganUtamadanTerpilihExports of Major and Selected Commodities
105
6.7 ImportmengikutRakanDagangandanSeksyenBarangan2018Imports by Trading Partners and Commodity Section 2018
106-111
6.8 EksportmengikutRakanDagangandanSeksyenBarangan2018Exports by Trading Partners and Commodity Section 2018
112-115
6.9 ImportmengikutRakanDaganganImports by Trading Partners
116-117
6.10 EksportmengikutRakanDaganganExports by Trading Partners
118-119
XIII
6.11 NilaiEksportUtamamengikutRakanDagangan,2018Value of Major Exports by Trading Partners, 2018
120
6.12 JumlahPeratusImportNegaraBruneiDarussalammengikutSeksyenBaranganTotal Percentage of Brunei Darussalam Imports by Commodity Section
121
6.13 JumlahPeratusEksportNegaraBruneiDarussalammengikutSeksyenBaranganTotal Percentage of Brunei Darussalam Exports by Commodity Section
122
6.14 ImportmengikutKategoriPenggunaanAkhirImports by End Use Categories
123
6.15 EksportdanImportmengikutModPengangkutanExports dan Imports by Mode of Transport
124
SEKSYEN 7 PELABURAN LANGSUNG ASINGSECTION 7 FOREIGN DIRECT INVESTMENT
NotaKeteranganExplanatory Notes
126
7.1 PenyertaanPelaburandiNegaraBruneiDarussalam Investment Participation in Brunei Darussalam
127
7.2 PelaburanLangsungAsingmengikutKomponenForeign Direct Investment by Components
128
7.3 PelaburanLangsungAsingmengikutNegaraForeign Direct Investment by Country
129
7.4 PelaburanLangsungAsingmengikutAktivitiEkonomiForeign Direct Investment by Economic Activity
130
XIV
SEKSYEN 8 KEWANGAN KERAJAANSECTION 8 GOVERNMENT FINANCE
8.1 KewanganKerajaanGovernment Finance
132
8.2 HasilKerajaanGovernment Revenue
133
8.3 PerbelanjaanKerajaanGovernment Expenditure
134
8.4 PerbelanjaanRancanganKemajuanNegara(RKN)National Development Plan Expenditure (NDP)
135
8.5 PerbelanjaanKerajaanmengikutKementerianGovernment Expenditure by Ministry
136
8.6 PerbelanjaanKerajaanmengikutJabatanGovernment Expenditure by Department
137-144
8.7 JenisCukaidanDutiDikutipType of Taxes and Duties Collected
145-146
SEKSYEN 9 PERKHIDMATAN KEWANGANSECTION 9 FINANCIAL SERVICES
9.1 MatawangdalamEdaranCurrency in Circulation
148
9.2 SistemPerbankan:AsetBanking System : Assets
149

XV
9.3 SistemPerbankan:LiabilitiBanking System : Liabilities
150
9.4 AgregatMonetariMonetary Aggregates
151
9.5 KadarPertukaranExchange Rates
152-153
9.6 SistemPerbankan:HalatujuPinjaman/PembiayaanBanking System : Direction of Lending
154-155
9.7 NilaidanTransaksiKirimanWangKeluarOutward Remittance Value and Transaction
156
9.8 AkseskepadaKewanganAccess to Finance
157-158
9.9 AsetKelasUtamaInstitusiKewanganAssets of the Major Classes of Financial Institution
159-160
9.10 SekuritiKerajaanBrunei:PengeluaranSukukAl-IjarahBrunei Government Securities : Sukuk Al-Ijarah Issuances
161
9.11 JumlahAset,Premium/SumbangandanTuntutanIndustriInsurans/TakafulTotal Assets, Premiums / Contributions and Claims of Insurance / Takaful Industry
162
9.12 BilanganPemegangPolisiDilindungiolehPerniagaanInsurans/TakafulPerniagaanNyawadanBukanNyawaNumber of Policyholders Covered by Life Insurance / Takaful and Non-Life Business
163
9.13 Premium/SumbanganKasardanTuntutanKasarbagiPerniagaanInsurans/TakafulBukanNyawaGross Premiums / Contributions and Gross Claims for Non-Life Insurance / Takaful Business
164
XVI
SEKSYEN 10 UGAMA SECTION 10 RELIGION
10.1 PendudukmengikutAgama,JantinadanTahunBanciPopulation by Religion, Sex and Census Year
166
10.2 BilanganMasjid,SuraudanBalaiIbadatmengikutDaerahNumber of Mosques, Suraus and Worship Halls by District
167
10.3 BilanganSaudaraBaruyangMemelukIslam(Muallaf)Number of New Muslim Converts
168
10.4 PungutanZakatCollection of Zakat
169
10.5 PengagihanZakatDistribution of Zakat
170
10.6 BilanganJemaahMenunaikanfardhuHajimengikutJantinaNumber of Pilgrims Who Performed Haj Pilgrimage by Sex
171
SEKSYEN 11 PENDIDIKANSECTION 11 EDUCATION
11.1 BilanganSekolah,GurudanPenuntutmengikutSektordanDaerahNumber of Schools, Teachers and Students by Sector and District
173-174
11.2 BilanganSekolahmengikutSektordanPeringkatPendidikanNumber of Schools by Sector and Level of Education
175
11.3 JumlahGurumengikutPeringkatPendidikanTotal Number of Teachers by Level of Education
176
XVII
11.4 BilanganGurudiSektorKerajaanmengikutPeringkatPendidikanNumber of Teachers in Government Sector by Level of Education
177
11.5 BilanganGurudiSektorSwastamengikutPeringkatPendidikanNumber of Teachers in Private Sector by Level of Education
178
11.6 BilanganGurumengikutSektordanTarafPendudukNumber of Teachers by Sector and Residential Status
179
11.7 JumlahPenuntutmengikutPeringkatPendidikanTotal Number of Students by Level of Education
180
11.8 BilanganPenuntutdiSektorKerajaanmengikutPeringkatPendidikanNumber of Students in Government Sector by Level of Education
181
11.9 BilanganPenuntutdiSektorSwastamengikutPeringkatPendidikan Number of Students in Private Sector by Level of Education
182
11.10 PendaftaranPenuntutmengikutPeringkat,UmurdanJantinaStudent Enrolments by Level, Age and Sex
183-184
11.11 BilanganSekolahUgama,GurudanPenuntutmengikutDaerahNumber of Religious Schools, Teachers and Students by District
185
11.12 BilanganPenuntutSekolahUgamamengikutKelasdanJantinaNumber of Students in Religious School by Class and Sex
186
11.13 BilanganPenuntutmengikutPeringkat,PengambilanBaru,Pendaftaran,GraduandanJantinaNumber of Students by Level, New Intake, Enrolment, Graduates and Sex
187-189
11.14 PengambilanBaruPeringkatTeknikaldanVokasionalNew Intakes at Technical and Vocational Level
190-191
11.15 PendaftaranPenuntutPeringkatTeknikaldanVokasionalStudent Enrolments at Technical and Vocational Level
192-193
XVIII
11.16 GraduanPeringkatTeknikaldanVokasionalTechnical and Vocational Graduates
194-195
11.17 PengambilanBaruPeringkatPengajianTinggimengikutSektor New Intakes at Tertiary Level by Sector
196-197
11.18 PendaftaranPenuntutPeringkatPengajianTinggimengikutSektorStudent Enrolments at Tertiary Level by Sector
198-199
11.19 GraduanPeringkatPengajianTinggimengikutSektor Graduates at Tertiary Level by Sector
200-201
11.20 PenuntutBiasiswaScholarship Students
202-205
11.21 PerbelanjaanKerajaandibawahKementerianPendidikanGovernment Expenditure under Ministry of Education
206
11.22 BilanganCalonMendudukidanLulusPeperiksaan-PeperiksaanAwamNumber of Candidates Sitting and Passing Public Examinations
207-210
11.23 KadarCelikHurufbagiPendudukBerumur9TahundanKeatasmengikutBahasaLiteracy Rate of the Population Aged 9 and Above by Language
211
11.24 CelikHurufbagiPendudukBerumur9TahundanKeatasmengikutBangsadanJantinaLiteracy of the Population Aged 9 and Above by Race and Sex
212
11.25 BilanganBukuyangTerdapatdiPerpustakaanDewanBahasadanPustakaVolume of Books Available at the Library of Language and Literature Bureau
213
11.26 Keahlian,PenggunadanPinjamanBukuPerpustakaandiDewanBahasadanPustakaLibrary Memberships, Users and Book Lending at the Language and Literature Bureau
214
XIX
SEKSYEN 12 KESIHATANSECTION 12 HEALTH
12.1 BilanganHospital,PusatKesihatandanKlinikKesihatanNumber of Hospitals, Health Centres and Health Clinics
216
12.2 BilanganKakitanganPerubatanNumber of Medical Personnels
217
12.3 PerkhidmatanHospitalmengikutAktivitidanPrestasiIndeksbagiTahun2018Hospital Services by Activity and Performance Indices for the Year 2018
218
12.4 BilanganPesakityangMenerimaRawatandiLuarNegerimengikutJenisRawatandanNegeriNumber of Patients Receiving Treatment Abroad by Types of Treatment and Country
219-220
12.5 KematianmengikutPuncaUtamaDeath by Major Causes
221-222
12.6 JadualJangkaHayatmengikutJantinaAbridged Life Table by Sex
223
12.7 SepuluhPenyebabUtamaKematianmengikutJantinabagiTahun2018Ten Leading Causes of Deaths by Sex for the Year 2018
224-225
SEKSYEN 13 PERUMAHANSECTION 13 HOUSING
13.1 BilanganUnitPerumahanDidiamimengikutJenis,DaerahdanTahunBanciNumber of Occupied Housing Units by Type, District and Census Year
227-228
13.2 AgihanUnitPerumahanDidiamimengikutHakmilik,DaerahBancidanStratum1991,2001dan2011Distribution of Occupied Housing Units by Ownership, Census District and Stratum 1991, 2001 and 2011
229-230
XX
SEKSYEN 14 KESELAMATAN AWAMSECTION 14 PUBLIC SAFETY
14.1 KemalanganJalanRayamengikutDaerahRoad Accidents by District
232
14.2 PerangkaanJenayah,2018Crime Statistics, 2018
233
14.3 KebakaranFire Breakouts
234
SEKSYEN 15 ALAM SEKITARSECTION 15 ENVIRONMENT
15.1 AlamSekitarEnvironment
236
15.2 JumlahHujanTurundiStesen-StesenPertanianTotal Rainfall in Agricultural Stations
237
15.3 PurataSuhu,KelembapanRelatif,SinaranMatahariCerahdanJumlahTurunanHujanDicatatkandiLapanganTerbangAntarabangsaBruneiMean Temperatures, Relative Humidity, Bright Sunshine and Total Rainfall Recorded at the Brunei International Airport
238
SEKSYEN 16 KESELAMATAN SOSIALSECTION 16 SOCIAL SECURITY
16.1 TabungAmanahPekerjaEmployees Trust Fund
240
16.2 PermohonanPengeluaranTabungAmanahPekerjamengikutJenisSkimPengeluaranWithdrawals Application of Employee Trust Fund by Type of Withdrawal Scheme
241
XXI
16.3 PermohonanPengeluaranSkimTabunganPerumahanmengikutSukatanGajiHousing Fund Scheme Withdrawal Application by Salary Range
242
16.4 JumlahPenerimaPencenUmurTuamengikutDaerahPersons Receiving Old Age Pensions by District
243
SEKSYEN 17 PERNIAGAAN SEKTOR SWASTASECTION 17 PRIVATE SECTOR BUSINESSES
17.1 Syarikat/PerusahaanyangBaruBerdaftardanDibubarkanNewly Registered and Dissolve Companies / Enterprises
245
17.2 StatistikUtamamengikutSaizPerusahaanKey Statistics by Business Size
246
17.3 BilanganPekerjadiSektorSwastamengikutSaizPerusahaanNumber of Employees in Private Sector by Business Size
247
17.4 BilanganPerusahaandiSektorSwastamengikutSektorNumber of Enterprises in Private Sector by Sectors
248
17.5 BilanganPekerjaandiSektorSwastamengikutSektorNumber of Employees in Private Sector by Sectors
249
17.6 BayaranPekerjadiSektorSwastamengikutJenisAktivitiEkonomiPayment to Employees in Private Sector by Kind of Economic Activity
250
17.7 PendapatanOperasidiSektorSwastamengikutJenisAktivitiEkonomiOperating Revenue in Private Sector by kind of Economic Activity
251
17.8 BilanganPermohonanPaten,RekaBentukPerindustriandanCapDagangNumber of Patent, Industrial Designs and Trademark Applications
252
17.9 BilanganPaten,RekaBentukPerindustriandanCapDagangmengikutResidenyangDibenarkanNumber of Granted Patent, Industrial Designs and Trademark Applications by Residents
253
XXII
SEKSYEN 18 PERTANIAN, PERHUTANAN DAN PERIKANANSECTION 18 AGRICULTURE, FORESTRY AND FISHERY
18.1 KawasanDitanamidanPengeluaranTanamanUtamaArea Under Cultivation and Production of Main Crops
255
18.2 PengeluaranPadiTempatanmengikutMusim,KeluasanBertanamdanPurataHasilLocal Paddy Production by Season, Planted Area and Average Yield
256-257
18.3 HasilKeseluruhanBerasmengikutMusimdanDaerah,2018Overall Yield of Rice by Season and District, 2018
258
18.4 PengeluaranTernakandanTelurLivestock and Eggs Production
259-262
18.5 PengeluaranBalakdanKeluaran-KeluaranHutanLainProduction of Timber and Other Forestry Products
263
18.6 PengeluaranPerikanan-IndustriTangkapan,AkuakulturdanPemerosesanProduction of Fishery - Capture, Aquaculture and Processing Industry
264-265
18.7 IkanSegardanMakananLautTempatandanImportDipasarkandiNegaraBruneiDarussalamLocal and Imported Fresh Fish and Seafood Marketed in Brunei Darussalam
266-267
18.8 NilaidanKuantitiIkanDipasarkan,2018Value and Quantity of Fish Marketed, 2018
268
18.9 BilanganPerkakasdanKapalMenangkapIkanBerlesenNumber of Licensed Fishing Gears and Fishing Vessels
269
SEKSYEN 19 PERLOMBONGANSECTION 19 MINING
19.1 PengeluaranMinyak,EksportdanKewajaranHargaPurataOil Production, Export and Weighted Average Price
271
XXIII
19.2 PengeluaranGas,EksportLNGdanKewajaranHargaPurataGas Production, LNG Export and Weighted Average Price
272
19.3 PengeluaranProduk-ProdukPetroleumProduction of Petroleum Products
273
19.4 PenggunaanDomestikMinyakdanGasDomestic Consumption of Oil and Gas
274
SEKSYEN 20 LOGISTIK SECTION 20 LOGISTICS
20.1 MeldanMuatanMail and Freight
276
20.2 PemunggahandanPengisianKargoPengangkutanLautmengikutNegaraAsalatauDestinasiSeaborne Cargo Discharged and Loaded by Country of Origin or Destination
277
20.3 PerkhidmatanPosPostal Services
278
SEKSYEN 21 ELEKTRIK DAN AIR SECTION 21 ELECTRICITY AND WATER
21.1 PengeluarandanPenggunaanElektrikProduction and Consumption of Electricity
280
21.2 PengeluarandanPenggunaanAirProduction and Consumption of Water
281
XXIV
SEKSYEN 22 PENGANGKUTAN DAN PERHUBUNGAN SECTION 22 TRANSPORT AND COMMUNICATION
22.1 PanjangJalanRayamengikutKlasifikasiJalanLength of Road by Road Classification
283
22.2 PanjangJalanRayamengikutJenisPermukaanLength of Road by Surface Type
284
22.3 BilanganKenderaanBukanKerajaanyangBaruBerdaftarNumber of Newly Registered Non-Government Vehicles
285
22.4 BilanganKenderaanKerajaanyangBaruBerdaftarNumber of Newly Registered Government Vehicles
286
22.5 BilanganKenderaanBukanKerajaanBerdaftardanDilesenkanNumber of Registered Non-Government Vehicles and Licensed
287
22.6 BilanganKenderaanKerajaanBerdaftardanDilesenkanNumber of Registered Government Vehicles and Licensed
288
22.7 PerjalananPesawatdanPenumpangAircraft Movement and Passenger
289
22.8 BilanganKapal/BotBerlesenNumber of Vessels / Boats Licensed
290
22.9 TelekomunikasiTelecommunication
291-292
22.10 OrangKeluardanMasukNegaraBruneiDarussalamPersons Entering and Leaving Brunei Darussalam
293
22.11 KetibaandanBertolakmelaluiUdara,LautdanDaratArrivals and Departures by Air, Sea and Land
294
22.12 KetibaanPelancongmengikutKerakyatanTourists Arrivals by Nationality
295-296
22.13 KetibaanmengikutKerakyatandanTujuanMelawat,2018Arrivals by Nationality and Purpose of Visit, 2018
297-300

XXV
TATATANDA / NOTATIONS
- Kosong / Nil
... TidakDapatDiperolehi/ Not Available
0 DibawahUnit/ Below Unit
() NilaiNegatif/ Negative Value
B.B/D.W BeratBersih/ Dressed Weight
Bil./No. Bilangan/ Number
BND RinggitBruneiDarussalam/Brunei Darussalam Dollar
e Anggaran/Estimate
f.o.b Free On Board
gm Gram/Gramme
GWj/GWh GigaWattJam/ Giga Watt Hour
HA Hektar/Hectare
Kboe PersamaanRibuTongMinyak/Thousand Barrels of Oil Equivalent
Kbbl RibuTong / Thousand Barrels
Kg Kilogram/Kilogramme
MMBtu JutaBritishtermaunit/Million British thermal unit
MW Mega Watt
p Sementara/Provisional
r SemakanSemula/Revised
TM/MT TanMetrik/Metric Tonne
USD DollarU.S./U.S. Dollar

XXVI
UNIT PENGUKURAN / UNIT OF MEASUREMENT
1tanmetrik/metric tonne = 0.9842longtan/long tonne
1kilogram/kilogramme = 2.2046paun/pound
1kilometer/kilometre = 0.6214batu/mile
1liter/litre = 0.2200gelenimperial/imperial gallon
1hektar/hectare = 2.4710ekar/acres
1meterpadu/cubic metre = 35.3147kakipadu/cubic feet
= 220gelenimperial/imperial gallon
1millimeter/millimetre = 0.0394inci/inch
Jumlahdidalamsebahagianjadual-jadualmungkintidakselaraskeranaangkadigenapkanTotal inside the tables may not tally due to rounding
XXVII
PERTANYAAN / ENQUIRIES:
XXVIII
NEGARA BRUNEI DARUSSALAM: PENGENALAN
NegaraBruneiDarussalamterletakdibaratlautPulauBorneo,diantaragaris-garisbujurtimur114°04’dan11°23’dangaris-garis lintangutara4°00’dan5°05’.Keluasannya ialah5,765kmpersegidanmempunyaipesisirpantaisepanjangkira-kira168kmmenghadapLautCinaSelatan.LautCinaSelatanmenjadisempadandiutaradanbahagian-bahagianlainbersempadankanSarawak(sebuahnegeridalamMalaysia)yangmembahagikanNegaraBruneiDarussalamkepadaduabahagian, iaitudibahagiantimur ialah DaerahTemburong dan dibahagian barat terdiri dari Daerah-DaerahBruneiMuara,TutongdanBelait.
Bandar Seri Begawan adalah ibu negeri bagi Negara Brunei Darussalam dengan keluasannyakira-kira 100.36 km persegi dan penduduk seramai lebih kurang 423 ribu orang (KemaskiniBanci Penduduk dan Perumahan 2016) termasuk Kampong Ayer. Letaknya ialah di DaerahBrunei Muara. Bandar-bandar kecil ialah Pekan Muara, terletak di Daerah Brunei Muara, PekanSeria di Daerah Belait, Pekan Tutong di Daerah Tutong dan Pekan Bangar di Daerah Temburong.
Dalam terbitan ini Bangsa Melayu ditafsirkan sebagai Melayu Brunei, Melayu dari Singapura danMalaysia. Mengikut Akta Kebangsaan Brunei 1961, Melayu Brunei secara rasmi terdiri dari puakasli Melayu, iaitu Brunei, Tutong, Belait, Kedayan, Dusun, Bisaya dan Murut. Bangsa Melayuadalah kumpulan bangsa yang terbesar, diikuti oleh Bangsa Cina dan lain-lain bangsa. BahasaMelayu adalah bahasa rasmi negara dan Bahasa Inggeris adalah juga digunakan secara meluas.
Negara BruneiDarussalam telahmencapai kemerdekaan sepenuhnya pada 1 Januari 1984denganmengamalkansistemkerajaanberkementerian.StrukturKementerianterkiniterdiridariJabatanPerdanaMenteri,KementerianPertahanan,KementerianKewangandanEkonomi,KementerianHal Ehwal Luar Negeri,KementerianPendidikan,KementerianHalEhwalUgama,KementerianSumber-SumberUtamadanPelancongan,KementerianPerhubungan,KementerianHalEhwalDalamNegeri, Kementerian Kesihatan, Kementerian Pembangunan dan Kementerian Kebudayaan, BeliadanSukan.
Negara Brunei Darussalam adalah ahli kepada beberapa organisasi serantau dan antarabangsasepertiASEAN,APEC,Commonwealth,GP77,IMF,OIC,ILO,UNESCO,UNESCAP,UNSD,WTOdanADB.
XXIX
BRUNEI DARUSSALAM: AN INTRODUCTION
Brunei Darussalam is situated on the north west of the Island of Borneo, between east longitude 114° 04’ and 11° 23’ and north latitudes of 4° 00’ and 5° 05’. It has a total land area of 5,765 sq. km with a coast line of about 168 km along the South China Sea. It is bounded by the South China Sea in the north and all other sides are bounded by the Malaysian State of Sarawak which divides Brunei Darussalam into two parts i.e. the eastern part which is the Temburong district and the western part which consists of Brunei Muara, Tutong and Belait districts.
Bandar Seri Begawan is the capital of Brunei Darussalam with an area of about 100.36 sq. km. and a population of about 423 thousand (Population and Housing Census Update 2016) including Kampong Ayer (Water Village). It is located in the Brunei Muara District. Other smaller towns are Pekan Muara located in the Brunei Muara District, Pekan Seria located in the Belait District, Pekan Tutong located in the Tutong District and Pekan Bangar located in the Temburong District.
In this publication Malays consist of Brunei Malays, Malays from Singapore and Malays from Malaysia. As applied in the Brunei Nationality Act 1961, Brunei Malay comprises of Brunei, Belait, Tutong, Dusun, Bisaya, Murut and Kedayan. Malay is the largest ethnic group, followed by Chinese and Other Races. In Brunei Darussalam, Malay or Bahasa Melayu is the official language and English is also widely used.
Brunei Darussalam resumed its international responsibilities as a fully independent and sovereign nation on 1st January 1984 and adopted the Ministerial System of Government. The Ministerial structure of Brunei Darussalam consists of Prime Minister’s Office, Ministry of Defence, Ministry of Finance and Economy, Ministry of Foreign Affairs, Ministry of Education, Ministry of Religious Affairs, Ministry of Primary Resources and Tourism, Ministry of Communications, Ministry of Home Affairs, Ministry of Health, Ministry of Development and Ministry of Culture, Youth and Sports.
Brunei Darussalam is a member of several regional and international organizations such as ASEAN, APEC, Commonwealth, GP 77, IMF, OIC, ILO, UNESCO, UNESCAP, UNSD, WTO and ADB.
XXX
XXXI
XXXII
XXXIII

PENDUDUK DAN PERANGKAAN VITALPOPULATION AND VITAL STATISTICS
1

2
Nota Keterangan
Kumpulan Bangsamempunyai3kategoriiaituMelayu,CinadanLain-lainbangsa.
BagaimanapunbagidataKemaskiniBanciPendudukdanPerumahan2016,BangsaMelayuditafsirkansebagaipuakasliMelayuBruneisahajaiaitusecararasmiterdiridaripuakBrunei,Tutong,Belait,Kedayan,Dusun,Bisaya,danMurutmengikutAktaKebangsaanBrunei1961.
Bangsa Cinamerujuk kepada semua orang yang termasuk di dalam kumpulan kaumCina.Manakala lain-lainBangsaadalahterdiridaripadalain-lainpendudukyangtidaktermasuksepertikategoriyangdinyatakandiatas.
Kadar Pertumbuhan Purata Tahunan
r=In(Pn/Po)/nyangmanarialahkadarpertumbuhantahunanpuratanialahbilangantahunyangtepatdiantaraPodanPnPoialahpendudukpadatahunasalPnialahpendudukpadatahunkemudiannya
Kepadatan Penduduk
Kepadatan penduduk merujuk kepada kepadatan ramai orang setiap satu kilometer sebagai nisbah bilanganpendudukdalamsesebuahkawasangeografitertentudengankeluasankilometerpersegidikawasanyangsama.
Nisbah Jantina
Nisbahjantinaialahbilanganlelakibagisetiap1,000orangperempuan.
1 PENDUDUK

3
Taraf Penduduk
Tarafpenduduk ialahtaraforangberkenaanyangberhubungkaitdenganundang-undang imigresennegara ini.Kategoritarafpendudukialah:
i) RakyatBrunei,iaitupemegangkadpengenalankuningNegaraBruneiDarussalam; ii) Penduduktetap,iaitupemegangkadpengenalanunguNegaraBruneiDarussalam; iii) Penduduksementara,iaitupemegangkadpengenalanhijauNegaraBruneiDarussalam;dan iv) Lain-lain
Kategori‘Lain-lain‘termasuksaudara-maraataurakan-rakanyangmengunjungiisirumahsemasatempohbanci.
Kadar Pertambahan Semula Jadi
KadarPertambahan (BilanganKelahiranhidup-BilanganKematian)dalamtahuntSemulaJadi= ----------------------------------------------------------------------------------x1,000
Pendudukpertengahantahundalamtahun t
Kadar Kelahiran
KadarKelahiran= BilanganKelahiranhidupdalamtahunt ----------------------------------------------------------------------------------x1,000 Pendudukpertengahantahundalamtahunt
Kadar Kematian
KadarKematian= BilanganKematiandalamtahunt ----------------------------------------------------------------------------------x1,000
Pendudukpertengahantahundalamtahunt
Kadar Mortaliti Anak Damit
Kadar BilanganKematianumurkurangdaripada1tahundalamtahuntMortalitiAnakDamit= ----------------------------------------------------------------------------------x1,000
BilanganKelahiranhidupdalamtahunt
Perkahwinan di Luar Brunei
PerkahwinandiluarBruneimerujukkepadaperkahwinanyangdidaftarkansemuladiNegaraBruneiDarussalamdibawahperkahwinanAdatdanlain-lain.
Perkahwinan Sivil
PerkahwinanSiviltidaktermasukperkahwinanCina(Bab126)danperkahwinanPuakAsli(Bab124).
4
Explanatory Note
1 POPULATION
Race Group is divided into 3 main categories namely Malay, Chinese and Other Race.
However for Population and Housing Census Update 2016 data, Malays comprised of persons officially belonging to one of the following indigenous groups of the Malay race, namely Brunei, Tutong, Belait, Kedayan, Dusun, Bisaya and Murut as applied in the Brunei Nationality Act, 1961. Chinese refers to all persons who belong to the Chinese ethnic group, while Other Race consists of the rest of the population not included in the Malay and Chinese group.
Average Annual Growth Rate
r = In(Pn/Po)/n wherer is the average annual rate of growth n is the exact number of years between Po and Pn Po is the population at the initial yearPn is the population at the later year
Population Density
Population Density refers to the density of persons per square kilometer. It is the ratio of the population of a given geographic area to the number of square kilometres of the same area.
Sex Ratio
Sex Ratio refers to number of males per 1,000 females.

5
Residential Status
Residential Status is the status of the person in relation to the immigration laws of the country. The categories of residential status are :
i) Brunei citizen, i.e. holder of Brunei Darussalam yellow identity card; ii) Permanent resident, i.e. holder of Brunei Darussalam purple identity card; iii) Temporary resident, i.e. holder of Brunei Darussalam green identity card; and iv) Others
The category ‘Others‘ included relatives or friends who visited the household during the census period.
Rate of Natural Increase
Rate of (No. of live births – No. of deaths) in year tNatural Increase = ------------------------------------------------------------ x 1,000 Mid-year population in year t
Birth Rate
Birth Rate = No. of live births in year t ------------------------------------------------------------ x 1,000 Mid-year population in year t Death Rate
Death Rate = No. of deaths in year t ------------------------------------------------------------ x 1,000
Mid-year population in year t Infant Mortality Rate
Infant Mortality No. of deaths under 1 year of age in year tRate = ------------------------------------------------------------ x 1,000 No. of live births in year t
Marriages Outside Brunei
Marriages outside Brunei refer to marriages re-registered in Bunei Darussalam under Customary marriages and others.
Civil Marriages
Civil marriages exclude Chinese marriages (Cap 126) and Indigenous Marriages (Cap 124).
6
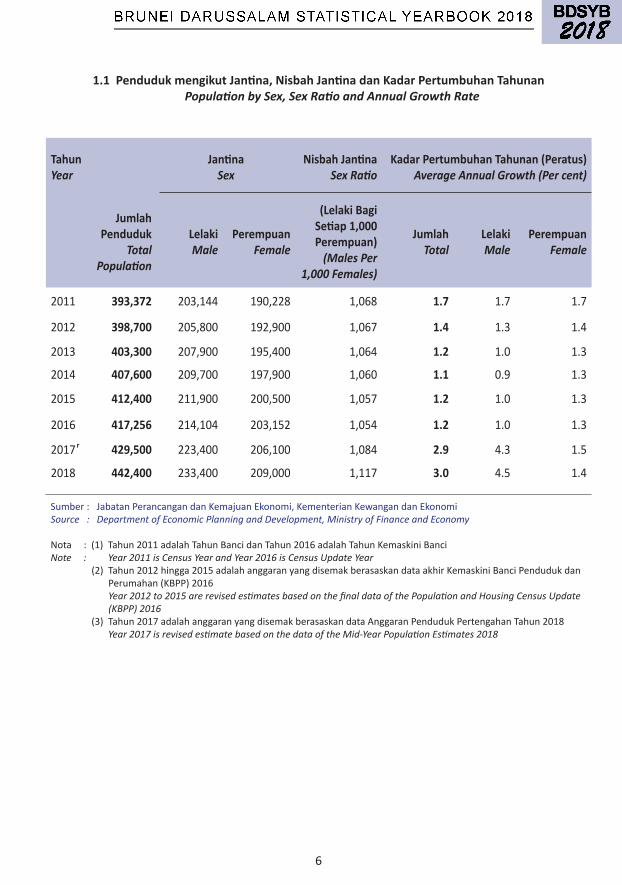
1.1 Penduduk mengikut Jantina, Nisbah Jantina dan Kadar Pertumbuhan Tahunan Population by Sex, Sex Ratio and Annual Growth Rate
TahunYear
JantinaSex
Nisbah JantinaSex Ratio
Kadar Pertumbuhan Tahunan (Peratus)Average Annual Growth (Per cent)
Jumlah Penduduk
TotalPopulation
LelakiMale
PerempuanFemale
(Lelaki Bagi Setiap 1,000 Perempuan)
(Males Per 1,000 Females)
JumlahTotal
LelakiMale
PerempuanFemale
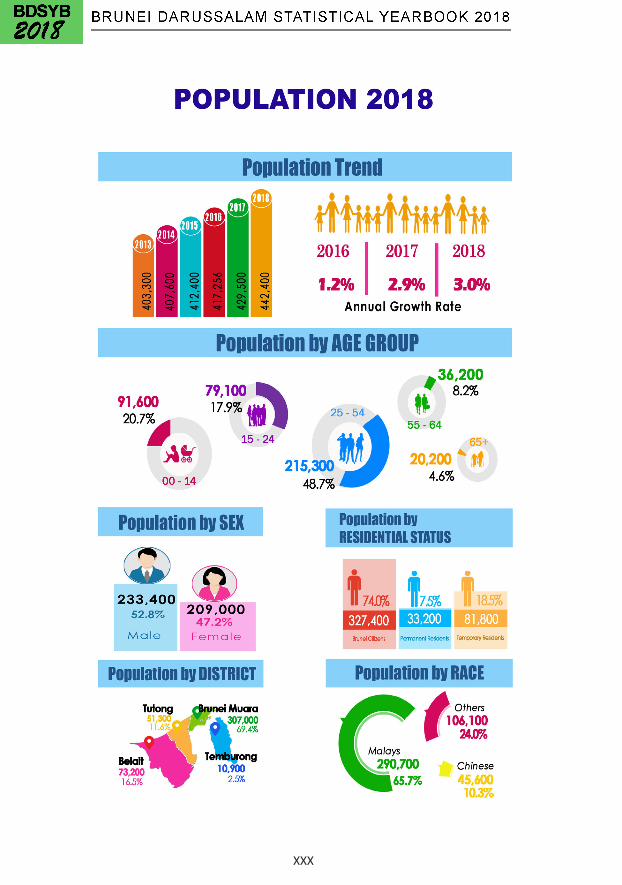
2011 393,372 203,144 190,228 1,068 1.7 1.7 1.7
2012 398,700 205,800 192,900 1,067 1.4 1.3 1.4
2013 403,300 207,900 195,400 1,064 1.2 1.0 1.3
2014 407,600 209,700 197,900 1,060 1.1 0.9 1.3
2015 412,400 211,900 200,500 1,057 1.2 1.0 1.3
2016 417,256 214,104 203,152 1,054 1.2 1.0 1.3
2017 429,500 223,400 206,100 1,084 2.9 4.3 1.5
2018 442,400 233,400 209,000 1,117 3.0 4.5 1.4
Sumber:JabatanPerancangandanKemajuanEkonomi,KementerianKewangandanEkonomiSource : Department of Economic Planning and Development, Ministry of Finance and Economy
Nota:(1)Tahun2011adalahTahunBancidanTahun2016adalahTahunKemaskiniBanci Note : Year 2011 is Census Year and Year 2016 is Census Update Year (2)Tahun2012hingga2015adalahanggaranyangdisemakberasaskandataakhirKemaskiniBanciPendudukdanPerumahan(KBPP)2016 Year 2012 to 2015 are revised estimates based on the final data of the Population and Housing Census Update (KBPP) 2016 (3)Tahun2017adalahanggaranyangdisemakberasaskandataAnggaranPendudukPertengahanTahun2018 Year 2017 is revised estimate based on the data of the Mid-Year Population Estimates 2018
r

7
1.2 Penduduk mengikut Daerah Population by Districts
TahunYear
JumlahTotal
DaerahDistricts
Brunei Muara Belait Tutong Temburong
2011 393,372 279,924 60,744 43,852 8,852
2012 398,700 276,700 66,000 46,200 9,800
2013 403,300 279,900 66,800 46,700 9,900
2014 407,600 282,900 67,500 47,200 10,000
2015 412,400 286,200 68,300 47,800 10,100
2016 417,256 289,630 69,062 48,313 10,251
2017 429,500 298,100 71,000 49,800 10,600
2018 442,400 307,000 73,200 51,300 10,900
Sumber:JabatanPerancangandanKemajuanEkonomi,KementerianKewangandanEkonomiSource : Department of Economic Planning and Development, Ministry of Finance and Economy
Nota:(1)Tahun2011adalahTahunBancidanTahun2016adalahTahunKemaskiniBanci Note : Year 2011 is Census Year and Year 2016 is Census Update Year (2)Tahun2012hingga2015adalahanggaranyangdisemakberasaskandataakhirKemaskiniBanciPendudukdanPerumahan(KBPP)2016 Year 2012 to 2015 are revised estimates based on the final data of the Population and Housing Census Update (KBPP) 2016 (3)Tahun2017adalahanggaranyangdisemakberasaskandataAnggaranPendudukPertengahanTahun2018 Year 2017 is revised estimate based on the data of the Mid-Year Population Estimates 2018
r

8
1.3 Penduduk mengikut Taraf Penduduk Population by Residential Status
TahunYear
JumlahTotal
Taraf PendudukResidential Status
Rakyat BruneiBrunei Citizens
Penduduk TetapPermanent Residents
Penduduk Sementara dan Lain-lainTemporary Residents and Others
2011 393,372 281,660 25,792 85,920
2012 398,700 289,600 27,200 81,900
2013 403,300 297,000 28,600 77,700
2014 407,600 304,200 30,000 73,400
2015 412,400 311,700 31,400 69,300
2016 417,256 319,325 32,803 65,128
2017 429,500 323,600 33,000 72,900
2018 442,400 327,400 33,200 81,800
Sumber:JabatanPerancangandanKemajuanEkonomi,KementerianKewangandanEkonomiSource : Department of Economic Planning and Development, Ministry of Finance and Economy
Nota:(1)Tahun2011adalahTahunBancidanTahun2016adalahTahunKemaskiniBanci Note : Year 2011 is Census Year and Year 2016 is Census Update Year (2)Tahun2012hingga2015adalahanggaranyangdisemakberasaskandataakhirKemaskiniBanciPendudukdanPerumahan(KBPP)2016 Year 2012 to 2015 are revised estimates based on the final data of the Population and Housing Census Update (KBPP) 2016 (3)Tahun2017adalahanggaranyangdisemakberasaskandataAnggaranPendudukPertengahanTahun2018 Year 2017 is revised estimate based on the data of the Mid-Year Population Estimates 2018
r

9
1.4 Penduduk mengikut Bangsa Population by Race
TahunYear
JumlahTotal
BangsaRace
MelayuMalay
CinaChinese
Lain-lainOthers
2011 393,372 258,446 40,534 94,392
2012 398,700 261,900 41,100 95,700
2013 403,300 265,000 41,500 96,800
2014 407,600 267,800 42,000 97,800
2015 412,400 270,900 42,500 99,000
2016 417,256 274,138 42,995 100,123
2017 429,500 282,100 44,400 103,000
2018 442,400 290,700 45,600 106,100
Sumber:JabatanPerancangandanKemajuanEkonomi,KementerianKewangandanEkonomiSource : Department of Economic Planning and Development, Ministry of Finance and Economy
Nota:(1)Tahun2011adalahTahunBancidanTahun2016adalahTahunKemaskiniBanci Note : Year 2011 is Census Year and Year 2016 is Census Update Year (2)Tahun2012hingga2015adalahanggaranyangdisemakberasaskandataakhirKemaskiniBanciPendudukdanPerumahan(KBPP)2016 Year 2012 to 2015 are revised estimates based on the final data of the Population and Housing Census Update (KBPP) 2016 (3)Tahun2017adalahanggaranyangdisemakberasaskandataAnggaranPendudukPertengahanTahun2018 Year 2017 is revised estimate based on the data of the Mid-Year Population Estimates 2018
r
10
DaerahDistrict 2014 2015 2016 2017 2018
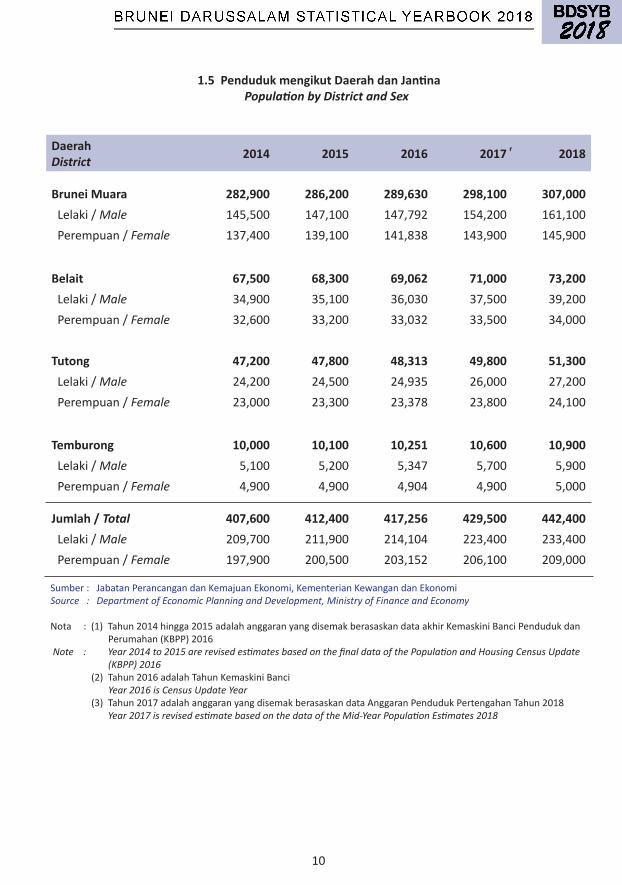
Brunei Muara 282,900 286,200 289,630 298,100 307,000Lelaki/Male 145,500 147,100 147,792 154,200 161,100Perempuan/Female 137,400 139,100 141,838 143,900 145,900
Belait 67,500 68,300 69,062 71,000 73,200Lelaki/Male 34,900 35,100 36,030 37,500 39,200Perempuan/Female 32,600 33,200 33,032 33,500 34,000
Tutong 47,200 47,800 48,313 49,800 51,300Lelaki/Male 24,200 24,500 24,935 26,000 27,200Perempuan/Female 23,000 23,300 23,378 23,800 24,100
Temburong 10,000 10,100 10,251 10,600 10,900Lelaki/Male 5,100 5,200 5,347 5,700 5,900Perempuan/Female 4,900 4,900 4,904 4,900 5,000
Jumlah / Total 407,600 412,400 417,256 429,500 442,400Lelaki/Male 209,700 211,900 214,104 223,400 233,400Perempuan/Female 197,900 200,500 203,152 206,100 209,000
1.5 Penduduk mengikut Daerah dan Jantina Population by District and Sex
Sumber:JabatanPerancangandanKemajuanEkonomi,KementerianKewangandanEkonomiSource : Department of Economic Planning and Development, Ministry of Finance and Economy
Nota:(1)Tahun2014hingga2015adalahanggaranyangdisemakberasaskandataakhirKemaskiniBanciPendudukdanPerumahan(KBPP)2016 Note : Year 2014 to 2015 are revised estimates based on the final data of the Population and Housing Census Update (KBPP) 2016 (2)Tahun2016adalahTahunKemaskiniBanci Year 2016 is Census Update Year (3)Tahun2017adalahanggaranyangdisemakberasaskandataAnggaranPendudukPertengahanTahun2018 Year 2017 is revised estimate based on the data of the Mid-Year Population Estimates 2018
r
11
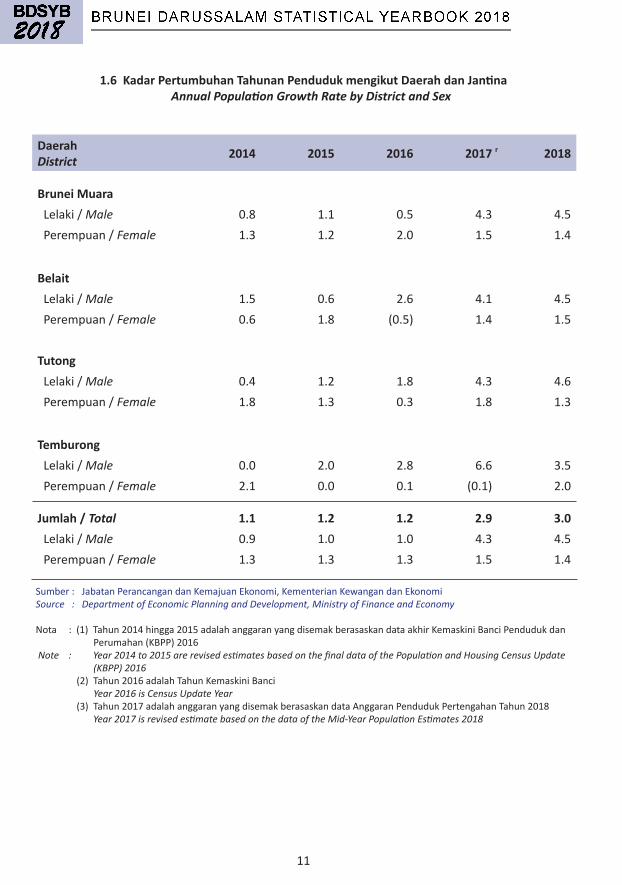
1.6 Kadar Pertumbuhan Tahunan Penduduk mengikut Daerah dan Jantina Annual Population Growth Rate by District and Sex
DaerahDistrict 2014 2015 2016 2017 2018
Brunei MuaraLelaki/Male 0.8 1.1 0.5 4.3 4.5Perempuan/Female 1.3 1.2 2.0 1.5 1.4
BelaitLelaki/Male 1.5 0.6 2.6 4.1 4.5Perempuan/Female 0.6 1.8 (0.5) 1.4 1.5
TutongLelaki/Male 0.4 1.2 1.8 4.3 4.6Perempuan/Female 1.8 1.3 0.3 1.8 1.3
TemburongLelaki/Male 0.0 2.0 2.8 6.6 3.5Perempuan/Female 2.1 0.0 0.1 (0.1) 2.0
Jumlah / Total 1.1 1.2 1.2 2.9 3.0Lelaki/Male 0.9 1.0 1.0 4.3 4.5Perempuan/Female 1.3 1.3 1.3 1.5 1.4
r
Sumber:JabatanPerancangandanKemajuanEkonomi,KementerianKewangandanEkonomiSource : Department of Economic Planning and Development, Ministry of Finance and Economy
Nota:(1)Tahun2014hingga2015adalahanggaranyangdisemakberasaskandataakhirKemaskiniBanciPendudukdanPerumahan(KBPP)2016 Note : Year 2014 to 2015 are revised estimates based on the final data of the Population and Housing Census Update (KBPP) 2016 (2)Tahun2016adalahTahunKemaskiniBanci Year 2016 is Census Update Year (3)Tahun2017adalahanggaranyangdisemakberasaskandataAnggaranPendudukPertengahanTahun2018 Year 2017 is revised estimate based on the data of the Mid-Year Population Estimates 2018
12
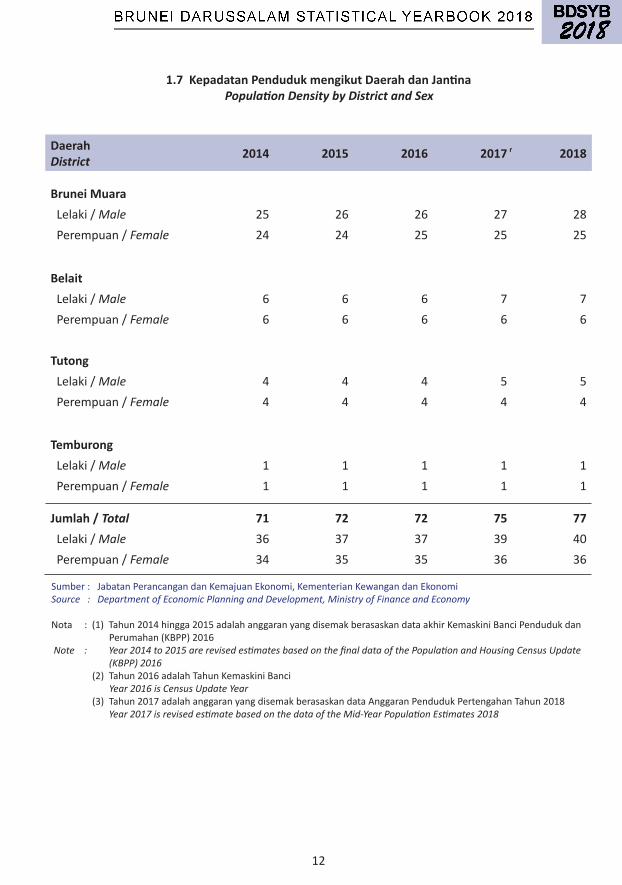
1.7 Kepadatan Penduduk mengikut Daerah dan Jantina Population Density by District and Sex
DaerahDistrict 2014 2015 2016 2017 2018
Brunei MuaraLelaki/Male 25 26 26 27 28Perempuan/Female 24 24 25 25 25
BelaitLelaki/Male 6 6 6 7 7Perempuan/Female 6 6 6 6 6
TutongLelaki/Male 4 4 4 5 5Perempuan/Female 4 4 4 4 4
TemburongLelaki/Male 1 1 1 1 1Perempuan/Female 1 1 1 1 1
Jumlah / Total 71 72 72 75 77Lelaki/Male 36 37 37 39 40Perempuan/Female 34 35 35 36 36
r
Sumber:JabatanPerancangandanKemajuanEkonomi,KementerianKewangandanEkonomiSource : Department of Economic Planning and Development, Ministry of Finance and Economy
Nota:(1)Tahun2014hingga2015adalahanggaranyangdisemakberasaskandataakhirKemaskiniBanciPendudukdanPerumahan(KBPP)2016 Note : Year 2014 to 2015 are revised estimates based on the final data of the Population and Housing Census Update (KBPP) 2016 (2)Tahun2016adalahTahunKemaskiniBanci Year 2016 is Census Update Year (3)Tahun2017adalahanggaranyangdisemakberasaskandataAnggaranPendudukPertengahanTahun2018 Year 2017 is revised estimate based on the data of the Mid-Year Population Estimates 2018
13
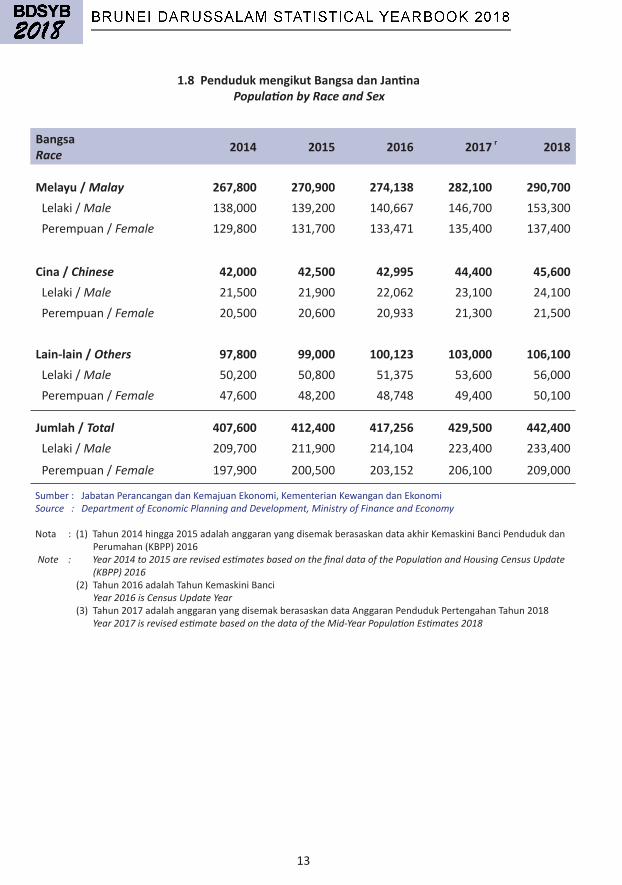
1.8 Penduduk mengikut Bangsa dan Jantina Population by Race and Sex
BangsaRace 2014 2015 2016 2017 2018
Melayu / Malay 267,800 270,900 274,138 282,100 290,700Lelaki/Male 138,000 139,200 140,667 146,700 153,300Perempuan/Female 129,800 131,700 133,471 135,400 137,400
Cina / Chinese 42,000 42,500 42,995 44,400 45,600Lelaki/Male 21,500 21,900 22,062 23,100 24,100Perempuan/Female 20,500 20,600 20,933 21,300 21,500
Lain-lain / Others 97,800 99,000 100,123 103,000 106,100Lelaki/Male 50,200 50,800 51,375 53,600 56,000Perempuan/Female 47,600 48,200 48,748 49,400 50,100
Jumlah / Total 407,600 412,400 417,256 429,500 442,400Lelaki/Male 209,700 211,900 214,104 223,400 233,400
Perempuan/Female 197,900 200,500 203,152 206,100 209,000
r
Sumber:JabatanPerancangandanKemajuanEkonomi,KementerianKewangandanEkonomiSource : Department of Economic Planning and Development, Ministry of Finance and Economy
Nota:(1)Tahun2014hingga2015adalahanggaranyangdisemakberasaskandataakhirKemaskiniBanciPendudukdanPerumahan(KBPP)2016 Note : Year 2014 to 2015 are revised estimates based on the final data of the Population and Housing Census Update (KBPP) 2016 (2)Tahun2016adalahTahunKemaskiniBanci Year 2016 is Census Update Year (3)Tahun2017adalahanggaranyangdisemakberasaskandataAnggaranPendudukPertengahanTahun2018 Year 2017 is revised estimate based on the data of the Mid-Year Population Estimates 2018
14
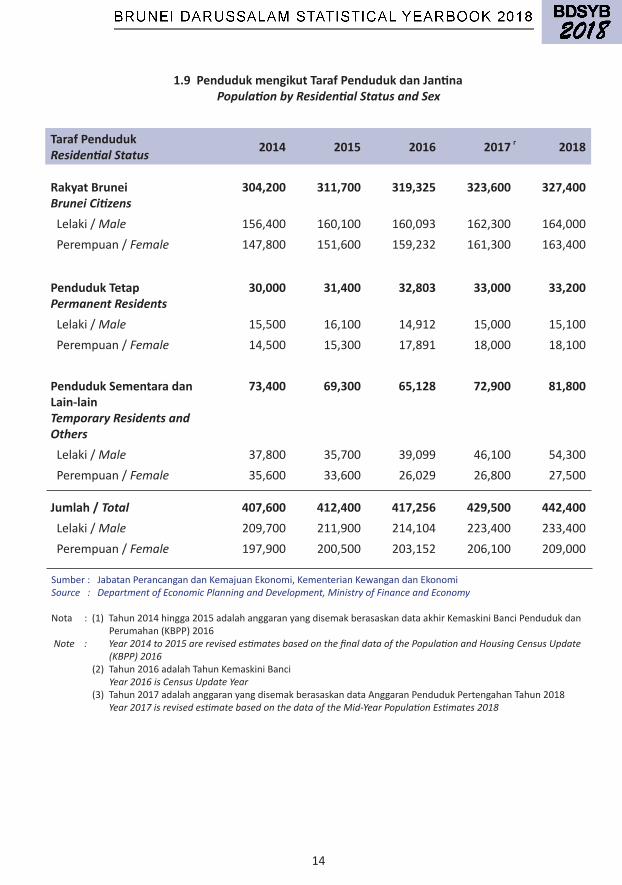
1.9 Penduduk mengikut Taraf Penduduk dan Jantina Population by Residential Status and Sex
Taraf PendudukResidential Status 2014 2015 2016 2017 2018
Rakyat BruneiBrunei Citizens
304,200 311,700 319,325 323,600 327,400
Lelaki/Male 156,400 160,100 160,093 162,300 164,000Perempuan/Female 147,800 151,600 159,232 161,300 163,400
Penduduk TetapPermanent Residents
30,000 31,400 32,803 33,000 33,200
Lelaki/Male 15,500 16,100 14,912 15,000 15,100Perempuan/Female 14,500 15,300 17,891 18,000 18,100
Penduduk Sementara dan Lain-lainTemporary Residents and Others
73,400 69,300 65,128 72,900 81,800
Lelaki/Male 37,800 35,700 39,099 46,100 54,300Perempuan/Female 35,600 33,600 26,029 26,800 27,500
Jumlah / Total 407,600 412,400 417,256 429,500 442,400Lelaki/Male 209,700 211,900 214,104 223,400 233,400Perempuan/Female 197,900 200,500 203,152 206,100 209,000
r
Sumber:JabatanPerancangandanKemajuanEkonomi,KementerianKewangandanEkonomiSource : Department of Economic Planning and Development, Ministry of Finance and Economy
Nota:(1)Tahun2014hingga2015adalahanggaranyangdisemakberasaskandataakhirKemaskiniBanciPendudukdanPerumahan(KBPP)2016 Note : Year 2014 to 2015 are revised estimates based on the final data of the Population and Housing Census Update (KBPP) 2016 (2)Tahun2016adalahTahunKemaskiniBanci Year 2016 is Census Update Year (3)Tahun2017adalahanggaranyangdisemakberasaskandataAnggaranPendudukPertengahanTahun2018 Year 2017 is revised estimate based on the data of the Mid-Year Population Estimates 2018

15
1.10 Penduduk mengikut Kumpulan Umur dan Jantina Population by Age Group and Sex
15
Kumpulan UmurAge Group
2015 2016Jumlah
TotalLelakiMale
PerempuanFemale
JumlahTotal
LelakiMale
PerempuanFemale
0-4 28,800 14,700 14,100 28,427 14,864 13,563
5-9 31,100 16,000 15,100 30,426 15,673 14,753
10-14 34,500 17,700 16,800 34,306 17,663 16,643
15-19 36,100 18,600 17,500 36,417 18,949 17,468
20-24 38,900 20,000 18,900 39,027 20,544 18,483
25-29 39,700 20,400 19,300 39,812 21,416 18,396
30-34 36,900 18,900 18,000 36,895 19,313 17,582
35-39 34,400 17,700 16,700 34,492 17,815 16,677
40-44 31,000 16,000 15,000 31,164 15,743 15,421
45-49 27,100 13,900 13,200 27,701 13,682 14,019
50-54 22,500 11,600 10,900 23,160 11,651 11,509
55-59 18,200 9,300 8,900 19,239 9,462 9,777
60-64 13,400 6,900 6,500 14,591 7,068 7,523
65-69 8,200 4,200 4,000 8,958 4,257 4,701
70-74 4,900 2,500 2,400 5,095 2,537 2,558
75-79 3,500 1,800 1,700 3,780 1,737 2,043
80-84 2,000 1,000 1,000 2,206 974 1,232
85danKeatas85 and Above
1,200 700 500 1,560 756 804
JumlahTotal 412,400 211,900 200,500 417,256 214,104 203,152
Sumber:JabatanPerancangandanKemajuanEkonomi,KementerianKewangandanEkonomiSource : Department of Economic Planning and Development, Ministry of Finance and Economy
Nota:(1)Tahun2015adalahanggaranyangdisemakberasaskandataakhirKemaskiniBanciPendudukdanPerumahan(KBPP)2016 Note : Year 2015 is revised estimates based on the final data of the Population and Housing Census Update (KBPP) 2016 (2)Tahun2016adalahTahunKemaskiniBanci Year 2016 is Census Update Year
16
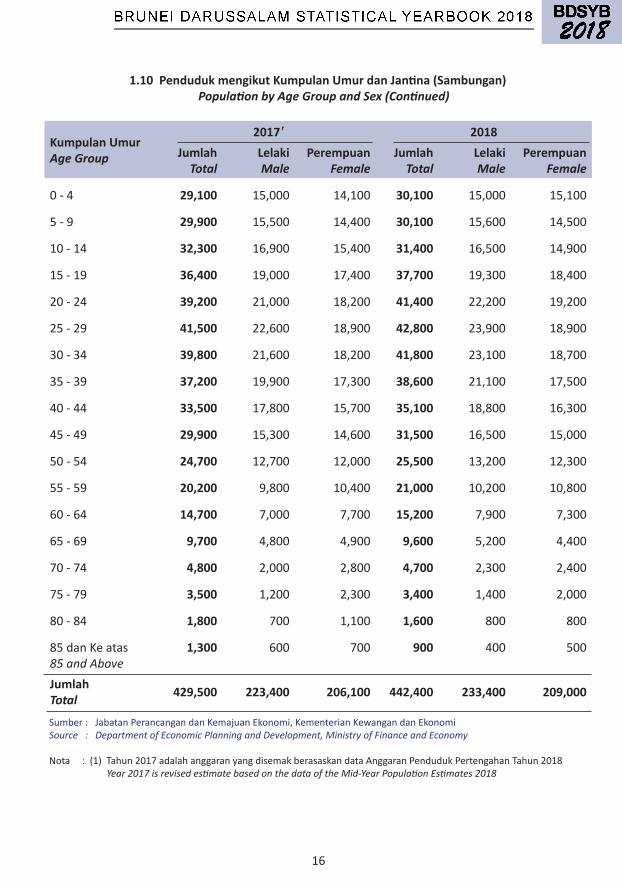
1.10 Penduduk mengikut Kumpulan Umur dan Jantina (Sambungan) Population by Age Group and Sex (Continued)
Kumpulan UmurAge Group
2017 2018Jumlah
TotalLelakiMale
PerempuanFemale
JumlahTotal
LelakiMale
PerempuanFemale
0-4 29,100 15,000 14,100 30,100 15,000 15,100
5-9 29,900 15,500 14,400 30,100 15,600 14,500
10-14 32,300 16,900 15,400 31,400 16,500 14,900
15-19 36,400 19,000 17,400 37,700 19,300 18,400
20-24 39,200 21,000 18,200 41,400 22,200 19,200
25-29 41,500 22,600 18,900 42,800 23,900 18,900
30-34 39,800 21,600 18,200 41,800 23,100 18,700
35-39 37,200 19,900 17,300 38,600 21,100 17,500
40-44 33,500 17,800 15,700 35,100 18,800 16,300
45-49 29,900 15,300 14,600 31,500 16,500 15,000
50-54 24,700 12,700 12,000 25,500 13,200 12,300
55-59 20,200 9,800 10,400 21,000 10,200 10,800
60-64 14,700 7,000 7,700 15,200 7,900 7,300
65-69 9,700 4,800 4,900 9,600 5,200 4,400
70-74 4,800 2,000 2,800 4,700 2,300 2,400
75-79 3,500 1,200 2,300 3,400 1,400 2,000
80-84 1,800 700 1,100 1,600 800 800
85danKeatas85 and Above
1,300 600 700 900 400 500
JumlahTotal 429,500 223,400 206,100 442,400 233,400 209,000
Sumber:JabatanPerancangandanKemajuanEkonomi,KementerianKewangandanEkonomiSource : Department of Economic Planning and Development, Ministry of Finance and Economy
Nota:(1)Tahun2017adalahanggaranyangdisemakberasaskandataAnggaranPendudukPertengahanTahun2018 Year 2017 is revised estimate based on the data of the Mid-Year Population Estimates 2018
r

17
1.11 Anggaran Penduduk Pertengahan Tahun mengikut Bangsa, Jantina dan Daerah, 2018 Mid-Year Population Estimates by Race, Sex and District, 2018
BangsaRace Brunei Muara Belait Tutong Temburong Jumlah
Total
Melayu 201,700 48,100 33,700 7,200 290,700
MalayLelaki 105,800 25,700 17,900 3,900 153,300 MalePerempuan 95,900 22,400 15,800 3,300 137,400 FemaleCina 31,600 7,600 5,300 1,100 45,600
Chinese
Lelaki 16,600 4,100 2,800 600 24,100 MalePerempuan 15,000 3,500 2,500 500 21,500 FemaleLain-lain 73,700 17,500 12,300 2,600 106,100OthersLelaki 38,700 9,400 6,500 1,400 56,000 MalePerempuan 35,000 8,100 5,800 1,200 50,100 Female
Jumlah 307,000 73,200 51,300 10,900 442,400Total Lelaki 161,100 39,200 27,200 5,900 233,400 Male Perempuan 145,900 34,000 24,100 5,000 209,000 Female
Sumber:JabatanPerancangandanKemajuanEkonomi,KementerianKewangandanEkonomiSource : Department of Economic Planning and Development, Ministry of Finance and Economy
18
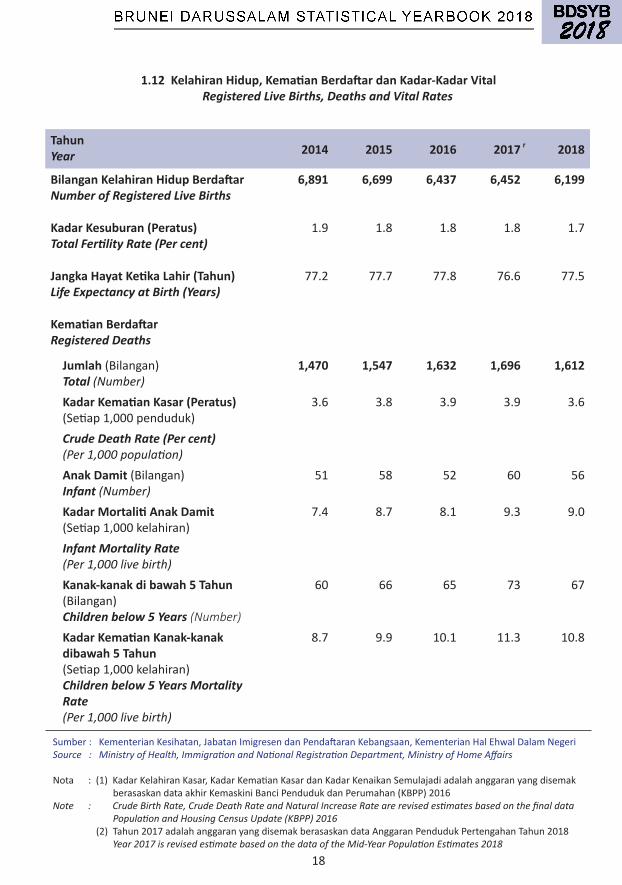
1.12 Kelahiran Hidup, Kematian Berdaftar dan Kadar-Kadar Vital Registered Live Births, Deaths and Vital Rates
Sumber:KementerianKesihatan,JabatanImigresendanPendaftaranKebangsaan,KementerianHalEhwalDalamNegeriSource : Ministry of Health, Immigration and National Registration Department, Ministry of Home Affairs
Nota:(1)KadarKelahiranKasar,KadarKematianKasardanKadarKenaikanSemulajadiadalahanggaranyangdisemakberasaskandataakhirKemaskiniBanciPendudukdanPerumahan(KBPP)2016 Note : Crude Birth Rate, Crude Death Rate and Natural Increase Rate are revised estimates based on the final data Population and Housing Census Update (KBPP) 2016 (2)Tahun2017adalahanggaranyangdisemakberasaskandataAnggaranPendudukPertengahanTahun2018 Year 2017 is revised estimate based on the data of the Mid-Year Population Estimates 2018
TahunYear 2014 2015 2016 2017 2018
Bilangan Kelahiran Hidup BerdaftarNumber of Registered Live Births
6,891 6,699 6,437 6,452 6,199
Kadar Kesuburan (Peratus)Total Fertility Rate (Per cent)
1.9 1.8 1.8 1.8 1.7
Jangka Hayat Ketika Lahir (Tahun)Life Expectancy at Birth (Years)
77.2 77.7 77.8 76.6 77.5
Kematian BerdaftarRegistered Deaths
Jumlah (Bilangan) Total (Number)
1,470 1,547 1,632 1,696 1,612
Kadar Kematian Kasar (Peratus) (Setiap1,000penduduk)
3.6 3.8 3.9 3.9 3.6
Crude Death Rate (Per cent) (Per 1,000 population) Anak Damit(Bilangan) Infant (Number)
51 58 52 60 56
Kadar Mortaliti Anak Damit(Setiap1,000kelahiran)
7.4 8.7 8.1 9.3 9.0
Infant Mortality Rate (Per 1,000 live birth) Kanak-kanak di bawah 5 Tahun (Bilangan) Children below 5 Years (Number)
60 66 65 73 67
Kadar Kematian Kanak-kanak dibawah 5 Tahun (Setiap1,000kelahiran) Children below 5 Years Mortality Rate (Per 1,000 live birth)
8.7 9.9 10.1 11.3 10.8
r

19
TahunYear 2014 2015 2016 2017 2018
Kadar Kelahiran Kasar (Peratus) 16.9 16.2 15.4 15.0 14.0(Setiap1,000penduduk)Crude Birth Rate (Per cent)(Per 1,000 population)
Kadar Kenaikan Semula Jadi 13.3 12.5 11.5 11.1 10.4(Setiap1,000penduduk)Natural Increase Rate(Per 1,000 population)
1.12 Kelahiran Hidup, Kematian Berdaftar dan Kadar-Kadar Vital (Sambungan) Registered Live Births, Deaths and Vital Rates (Continued)
r
Sumber:KementerianKesihatan,JabatanImigresendanPendaftaranKebangsaan,KementerianHalEhwalDalamNegeriSource : Ministry of Health, Immigration and National Registration Department, Ministry of Home Affairs
Nota:(1)KadarKelahiranKasar,KadarKematianKasardanKadarKenaikanSemulajadiadalahanggaranyangdisemakberasaskandataakhirKemaskiniBanciPendudukdanPerumahan(KBPP)2016 Note : Crude Birth Rate, Crude Death Rate and Natural Increase Rate are revised estimates based on the final data Population and Housing Census Update (KBPP) 2016 (2)Tahun2017adalahanggaranyangdisemakberasaskandataAnggaranPendudukPertengahanTahun2018 Year 2017 is revised estimate based on the data of the Mid-Year Population Estimates 2018
20
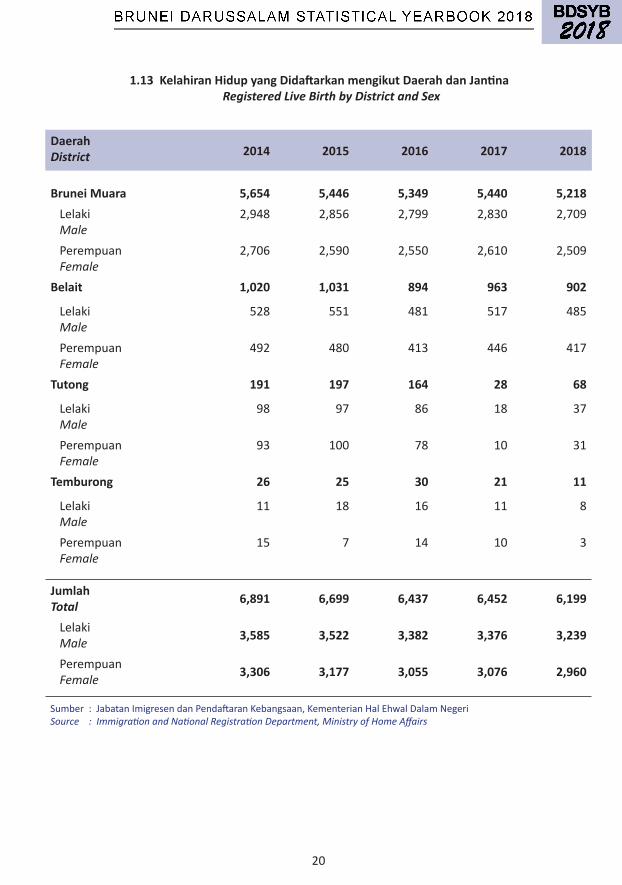
Daerah District 2014 2015 2016 2017 2018
Brunei Muara 5,654 5,446 5,349 5,440 5,218Lelaki Male
2,948 2,856 2,799 2,830 2,709
Perempuan Female
2,706 2,590 2,550 2,610 2,509
Belait 1,020 1,031 894 963 902
Lelaki Male
528 551 481 517 485
Perempuan Female
492 480 413 446 417
Tutong 191 197 164 28 68
Lelaki Male
98 97 86 18 37
Perempuan Female
93 100 78 10 31
Temburong 26 25 30 21 11
Lelaki Male
11 18 16 11 8
Perempuan Female
15 7 14 10 3
JumlahTotal 6,891 6,699 6,437 6,452 6,199
Lelaki Male 3,585 3,522 3,382 3,376 3,239
Perempuan Female 3,306 3,177 3,055 3,076 2,960
1.13 Kelahiran Hidup yang Didaftarkan mengikut Daerah dan Jantina Registered Live Birth by District and Sex
Sumber:JabatanImigresendanPendaftaranKebangsaan,KementerianHalEhwalDalamNegeriSource : Immigration and National Registration Department, Ministry of Home Affairs
21
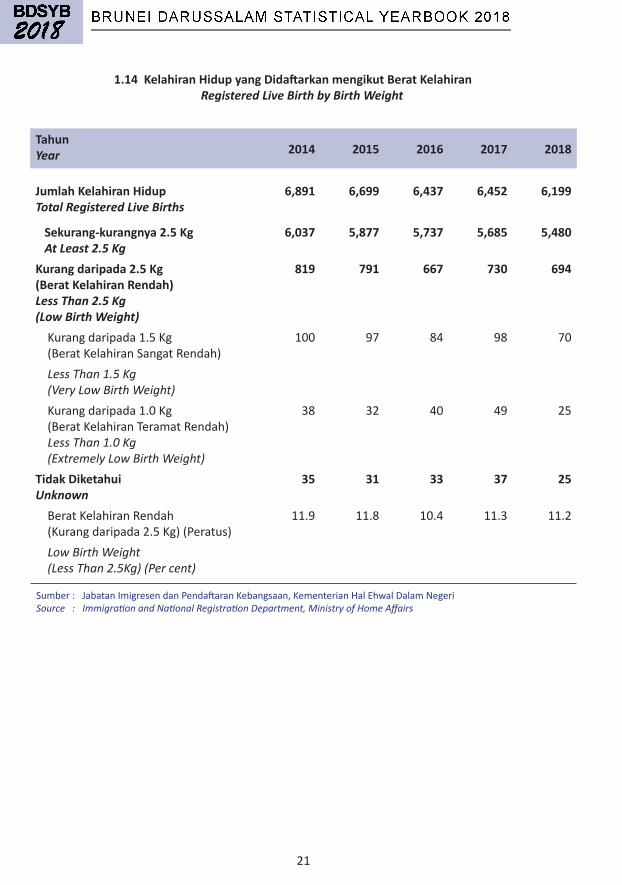
1.14 Kelahiran Hidup yang Didaftarkan mengikut Berat Kelahiran Registered Live Birth by Birth Weight
Sumber:JabatanImigresendanPendaftaranKebangsaan,KementerianHalEhwalDalamNegeriSource : Immigration and National Registration Department, Ministry of Home Affairs
TahunYear 2014 2015 2016 2017 2018
Jumlah Kelahiran HidupTotal Registered Live Births
6,891 6,699 6,437 6,452 6,199
Sekurang-kurangnya 2.5 Kg At Least 2.5 Kg
6,037 5,877 5,737 5,685 5,480
Kurang daripada 2.5 Kg(Berat Kelahiran Rendah)Less Than 2.5 Kg (Low Birth Weight)
819 791 667 730 694
Kurangdaripada1.5Kg(BeratKelahiranSangatRendah)
100 97 84 98 70
Less Than 1.5 Kg (Very Low Birth Weight)Kurangdaripada1.0Kg(BeratKelahiranTeramatRendah) Less Than 1.0 Kg (Extremely Low Birth Weight)
38 32 40 49 25
Tidak DiketahuiUnknown
35 31 33 37 25
BeratKelahiranRendah(Kurangdaripada2.5Kg)(Peratus)
11.9 11.8 10.4 11.3 11.2
Low Birth Weight (Less Than 2.5Kg) (Per cent)
22
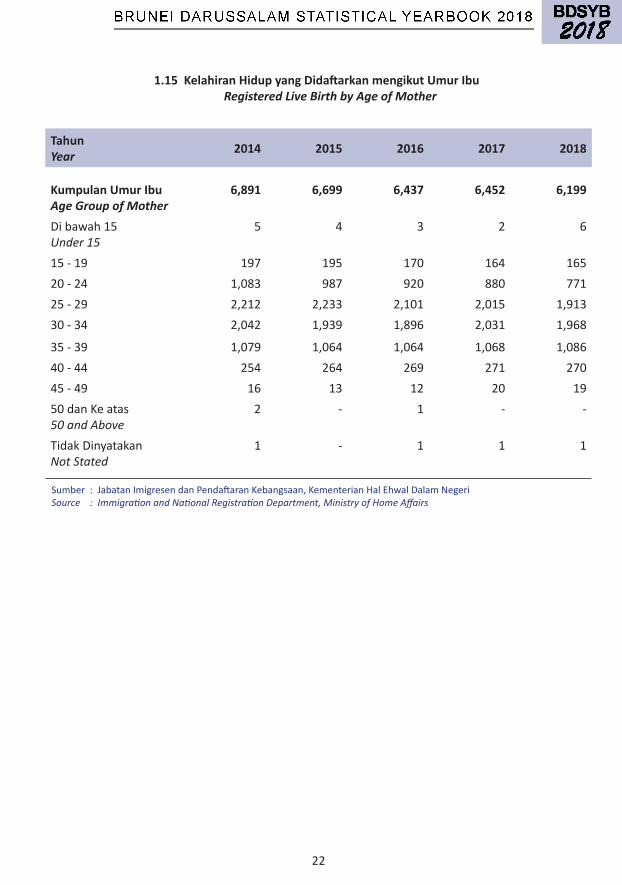
1.15 Kelahiran Hidup yang Didaftarkan mengikut Umur Ibu Registered Live Birth by Age of Mother
TahunYear 2014 2015 2016 2017 2018
Kumpulan Umur IbuAge Group of Mother
6,891 6,699 6,437 6,452 6,199
Dibawah15Under 15
5 4 3 2 6
15-19 197 195 170 164 16520-24 1,083 987 920 880 77125-29 2,212 2,233 2,101 2,015 1,91330-34 2,042 1,939 1,896 2,031 1,968
35-39 1,079 1,064 1,064 1,068 1,08640-44 254 264 269 271 27045-49 16 13 12 20 1950danKeatas50 and Above
2 - 1 - -
TidakDinyatakanNot Stated
1 - 1 1 1
Sumber:JabatanImigresendanPendaftaranKebangsaan,KementerianHalEhwalDalamNegeriSource : Immigration and National Registration Department, Ministry of Home Affairs
23
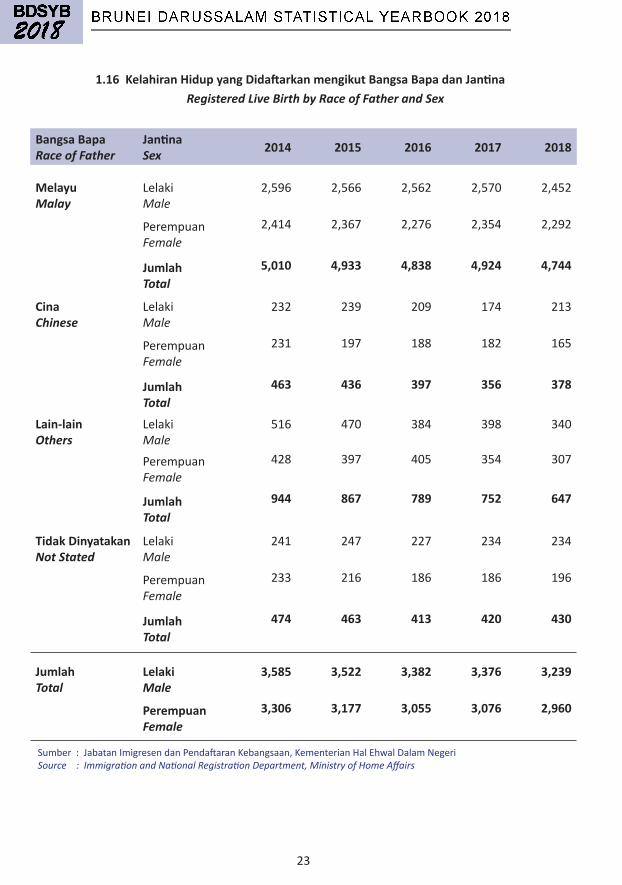
1.16 Kelahiran Hidup yang Didaftarkan mengikut Bangsa Bapa dan Jantina Registered Live Birth by Race of Father and Sex
Sumber:JabatanImigresendanPendaftaranKebangsaan,KementerianHalEhwalDalamNegeriSource : Immigration and National Registration Department, Ministry of Home Affairs
Bangsa BapaRace of Father
JantinaSex 2014 2015 2016 2017 2018
MelayuMalay
LelakiMale
2,596 2,566 2,562 2,570 2,452
PerempuanFemale
2,414 2,367 2,276 2,354 2,292
Jumlah Total
5,010 4,933 4,838 4,924 4,744
CinaChinese
LelakiMale
232 239 209 174 213
PerempuanFemale
231 197 188 182 165
Jumlah Total
463 436 397 356 378
Lain-lainOthers
LelakiMale
516 470 384 398 340
PerempuanFemale
428 397 405 354 307
Jumlah Total
944 867 789 752 647
Tidak DinyatakanNot Stated
LelakiMale
241 247 227 234 234
PerempuanFemale
233 216 186 186 196
Jumlah Total
474 463 413 420 430
JumlahTotal
LelakiMale
3,585 3,522 3,382 3,376 3,239
PerempuanFemale
3,306 3,177 3,055 3,076 2,960
24
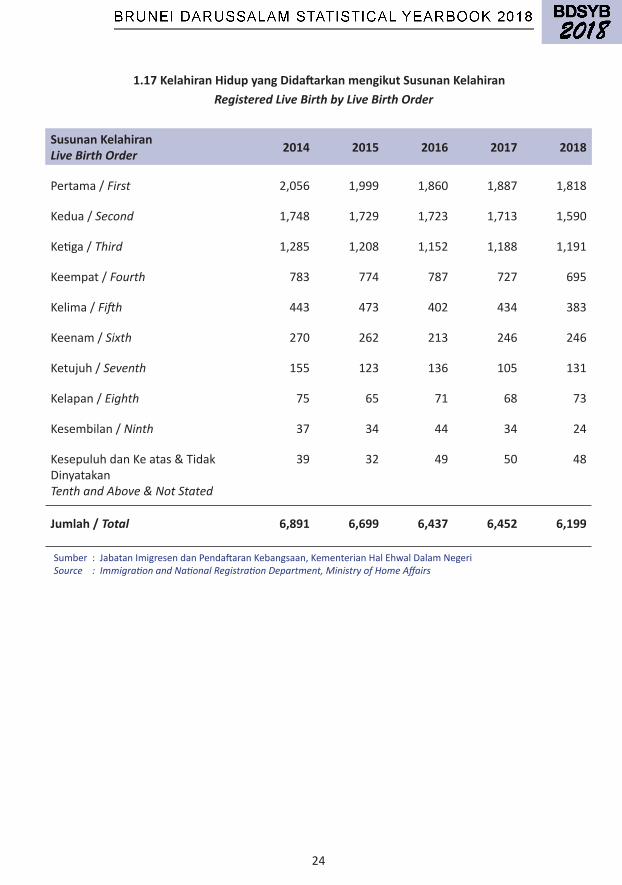
Susunan KelahiranLive Birth Order 2014 2015 2016 2017 2018
Pertama/First 2,056 1,999 1,860 1,887 1,818
Kedua/Second 1,748 1,729 1,723 1,713 1,590
Ketiga/Third 1,285 1,208 1,152 1,188 1,191
Keempat/Fourth 783 774 787 727 695
Kelima/Fifth 443 473 402 434 383
Keenam/Sixth 270 262 213 246 246
Ketujuh/Seventh 155 123 136 105 131
Kelapan/Eighth 75 65 71 68 73
Kesembilan/Ninth 37 34 44 34 24
KesepuluhdanKeatas&TidakDinyatakanTenth and Above & Not Stated
39 32 49 50 48
Jumlah / Total 6,891 6,699 6,437 6,452 6,199
1.17 Kelahiran Hidup yang Didaftarkan mengikut Susunan Kelahiran Registered Live Birth by Live Birth Order
Sumber:JabatanImigresendanPendaftaranKebangsaan,KementerianHalEhwalDalamNegeriSource : Immigration and National Registration Department, Ministry of Home Affairs
25
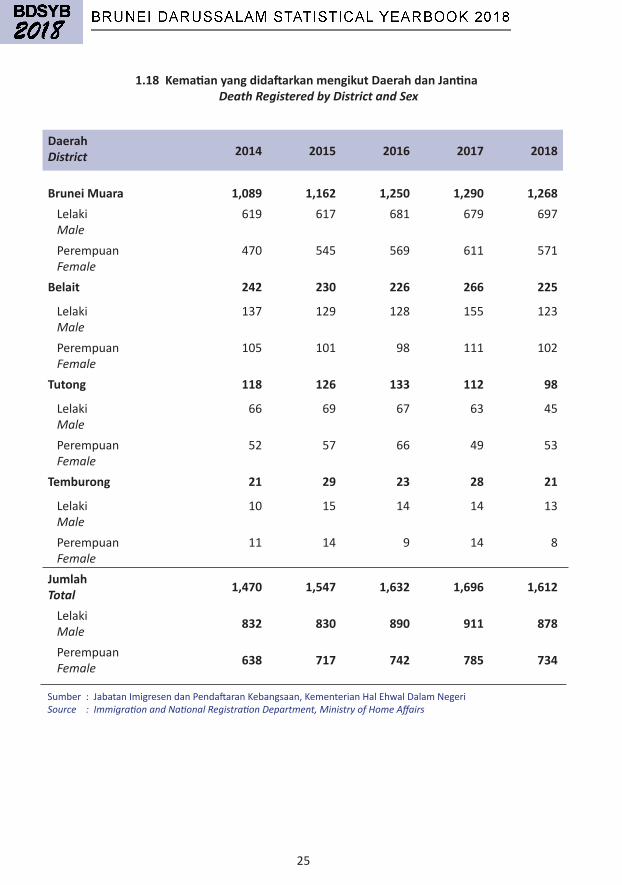
Daerah District 2014 2015 2016 2017 2018
Brunei Muara 1,089 1,162 1,250 1,290 1,268Lelaki Male
619 617 681 679 697
Perempuan Female
470 545 569 611 571
Belait 242 230 226 266 225
Lelaki Male
137 129 128 155 123
Perempuan Female
105 101 98 111 102
Tutong 118 126 133 112 98
Lelaki Male
66 69 67 63 45
Perempuan Female
52 57 66 49 53
Temburong 21 29 23 28 21
Lelaki Male
10 15 14 14 13
Perempuan Female
11 14 9 14 8
JumlahTotal 1,470 1,547 1,632 1,696 1,612
Lelaki Male 832 830 890 911 878
Perempuan Female 638 717 742 785 734
1.18 Kematian yang didaftarkan mengikut Daerah dan Jantina Death Registered by District and Sex
Sumber:JabatanImigresendanPendaftaranKebangsaan,KementerianHalEhwalDalamNegeriSource : Immigration and National Registration Department, Ministry of Home Affairs
26
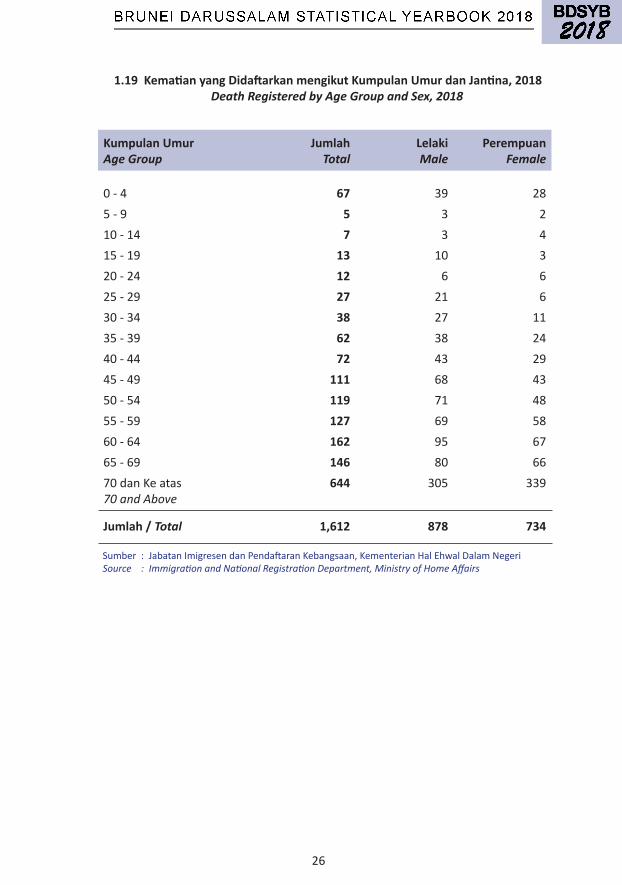
1.19 Kematian yang Didaftarkan mengikut Kumpulan Umur dan Jantina, 2018 Death Registered by Age Group and Sex, 2018
Kumpulan UmurAge Group
JumlahTotal
LelakiMale
PerempuanFemale
0-4 67 39 285-9 5 3 210-14 7 3 415-19 13 10 320-24 12 6 625-29 27 21 630-34 38 27 1135-39 62 38 2440-44 72 43 2945-49 111 68 4350-54 119 71 4855-59 127 69 5860-64 162 95 6765-69 146 80 6670danKeatas70 and Above
644 305 339
Jumlah / Total 1,612 878 734
Sumber:JabatanImigresendanPendaftaranKebangsaan,KementerianHalEhwalDalamNegeriSource : Immigration and National Registration Department, Ministry of Home Affairs

27
Jenis PerkahwinanType of Marriages 2014 2015 2016 2017 2018
IslamMuslim
2,693 2,529 2,309 2,331 2,445
BruneiMuara 1,889 1,746 1,666 1,665 1,787Belait 354 335 241 300 266Tutong 323 272 267 245 265Temburong 66 110 54 34 41DiluarBrunei 61 66 81 87 86 Outside Brunei
SivilCivil
138 134 135 144 125
BruneiMuara 93 106 92 105 89Belait 45 28 43 39 36Tutong - - - - -Temburong - - - - -DiluarBrunei Outside Brunei
- - - - -
Adat dan Lain-lainCustomary and Others
161 87 88 65 83
BruneiMuara 6 8 7 1 8Belait 20 7 14 11 15Tutong 35 21 22 15 16Temburong 19 14 13 12 16DiluarBrunei 81 37 32 26 28 Outside Brunei
Jumlah / Total 2,992 2,750 2,532 2,540 2,653
1.20 Perkahwinan mengikut Jenis Perkahwinan dan Daerah Marriages by Type of Marriage and District
Sumber:JabatanKehakimanNegaradanJabatanPeguamNegara,JabatanPerdanaMenteriSource : State Judiciary Department and Attorney General Chambers, Prime Minister’s Office

28
1.21 Perkahwinan mengikut Kumpulan Umur bagi Pengantin Lelaki dan Perempuan
Marriages by Age Group of Grooms and Brides
Sumber:JabatanKehakimanNegaradanJabatanPeguamNegara,JabatanPerdanaMenteriSource : State Judiciary Department and Attorney General Chambers, Prime Minister’s Office
Nota:TermasukperkahwinanIslam,Sivil,Adatdanlain-lainNote : Include Muslim, Civil, Customary and other marriages
Kumpulan UmurAge Group
2017 2018
OrangPersons
Pengantin Lelaki
Grooms
Pengantin Perempuan
Brides
OrangPersons
Pengantin Lelaki
Grooms
Pengantin Perempuan
Brides
Dibawah15Below 15
3 - 3 1 - 1
15-19 231 57 174 235 68 167
20-24 1,224 512 712 1,278 541 73725-29 2,025 1,050 975 2,072 1,040 1,032
30-34 784 469 315 880 511 369
35-39 338 167 171 342 204 13840-44 189 93 96 197 105 9245-49 128 75 53 134 70 6450-54 68 48 20 69 42 2755-59 47 33 14 46 30 1660-64 24 18 6 28 24 465-69 6 6 - 10 6 470danKeatas70 and Above
11 11 - 13 11 2
TidakDinyatakanNot Stated
2 1 1 1 1 -
Jumlah / Total 5,080 2,540 2,540 5,306 2,653 2,653
29
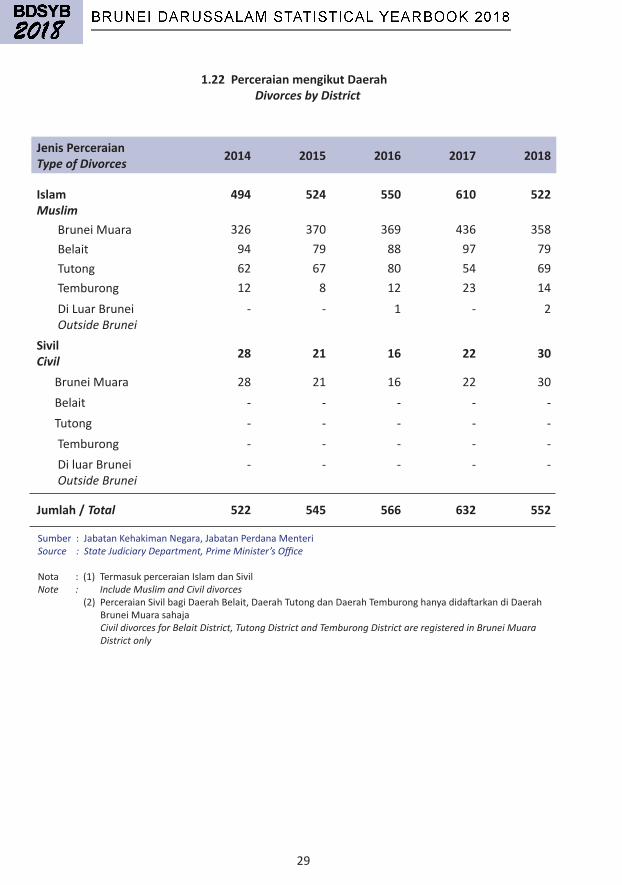
1.22 Perceraian mengikut Daerah Divorces by District
Jenis PerceraianType of Divorces 2014 2015 2016 2017 2018
IslamMuslim
494 524 550 610 522
BruneiMuara 326 370 369 436 358Belait 94 79 88 97 79Tutong 62 67 80 54 69Temburong 12 8 12 23 14 DiLuarBrunei Outside Brunei
- - 1 - 2
SivilCivil 28 21 16 22 30
BruneiMuara 28 21 16 22 30Belait - - - - -Tutong - - - - -Temburong - - - - -DiluarBrunei Outside Brunei
- - - - -
Jumlah / Total 522 545 566 632 552
Sumber:JabatanKehakimanNegara,JabatanPerdanaMenteriSource : State Judiciary Department, Prime Minister’s Office
Nota:(1)TermasukperceraianIslamdanSivilNote : Include Muslim and Civil divorces (2)PerceraianSivilbagiDaerahBelait,DaerahTutongdanDaerahTemburonghanyadidaftarkandiDaerahBruneiMuarasahaja Civil divorces for Belait District, Tutong District and Temburong District are registered in Brunei Muara District only
30
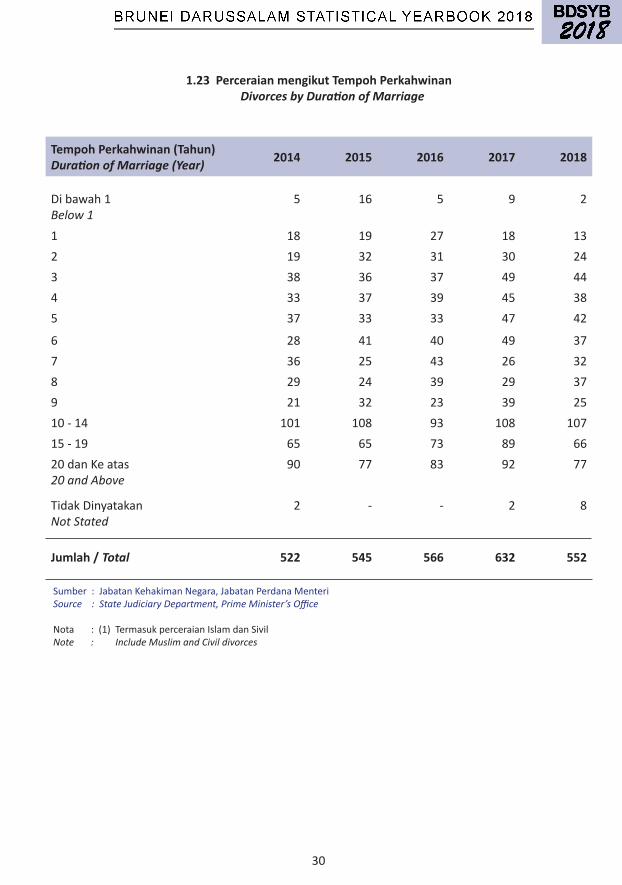
1.23 Perceraian mengikut Tempoh Perkahwinan Divorces by Duration of Marriage
Tempoh Perkahwinan (Tahun)Duration of Marriage (Year) 2014 2015 2016 2017 2018
Dibawah1Below 1
5 16 5 9 2
1 18 19 27 18 132 19 32 31 30 243 38 36 37 49 444 33 37 39 45 385 37 33 33 47 42
6 28 41 40 49 377 36 25 43 26 328 29 24 39 29 379 21 32 23 39 2510-14 101 108 93 108 10715-19 65 65 73 89 6620danKeatas20 and Above
90 77 83 92 77
TidakDinyatakanNot Stated
2 - - 2 8
Jumlah / Total 522 545 566 632 552
Sumber:JabatanKehakimanNegara,JabatanPerdanaMenteriSource : State Judiciary Department, Prime Minister’s Office
Nota:(1)TermasukperceraianIslamdanSivilNote : Include Muslim and Civil divorces

31
1.24 Perceraian mengikut Kumpulan Umur dan Jantina Divorces by Age Group and Sex
Kumpulan UmurAge Group
2017 2018
JumlahTotal
LelakiMale
PerempuanFemale
JumlahTotal
LelakiMale
PerempuanFemale
Dibawah15Under 15
- - - - - -
15-19 12 1 11 8 1 7
20-24 96 31 65 58 23 3525-29 202 91 111 162 67 9530-34 266 132 134 256 131 12535-39 268 137 131 211 102 10940-44 171 91 80 146 77 6945-49 129 68 61 100 57 4350-54 60 36 24 60 31 2955-59 33 25 8 28 19 960-64 17 12 5 36 22 1465-69 5 5 - 4 4 -70-74 3 2 1 3 2 175danKeatas75 and Above
1 1 - 5 4 1
TidakDinyatakanNot Stated
1 - 1 27 12 15
Jumlah / Total 1,264 632 632 1,104 552 552
Sumber:JabatanKehakimanNegara,JabatanPerdanaMenteriSource : State Judiciary Department, Prime Minister’s Office
Nota:(1)TermasukperceraianIslamdanSivilNote : Include Muslim and Civil divorces
2 TENAGA KERJALABOUR FORCE
33
Nota Keterangan
2 TENAGA KERJA
Tenaga Kerjaterdiridaripadapendudukberumur15tahunkeatas,yangmanasamaadamempunyaipekerjaanataumenganggurdalamtempohmasarujukan.
Bekerjamerujukkepadaorangpadamasaminggurujukanadalahbekerjauntukmendapatkangaji,untungataufaedahataupekerjakeluarga.Orangyangtidakbekerjadalamminggurujukankeranamisalnyasakitataubercutitetapimempunyaipekerjaanadalahjugadipertimbangkansebagaibekerja.
Pencari Kerjamerujukkepadaorangyangtidakmempunyaipekerjaantetapiaktifmencarikerjadalamtempohmasarujukan.
Kadar Penyertaan Tenaga Kerjamerujukkepadajumlahtenagakerjamengikutumurtertentuberbandingdenganjumlahpendudukdalamlingkunganumuryangsama.
Kadar Pengangguranmerujukkepadajumlahpencarikerjayangmenganggurberbandingdenganjumlahtenagakerja(peratus).
Explanatory Note
2 LABOUR FORCE
Labour Force comprises all persons aged 15 and above, who were employed and unemployed during the reference period.
Employed refers to persons who, during the reference period worked for pay, profit or family gain. [Persons who did not work during the reference week because of, for example illness or vacation but had a job to return to are also considered as employed].
Job Seekers refers to persons who were not working but were actively seeking for employment during the reference period.
Labour Force Participation Rate refers to total labour force at given ages divided by the total population of the same age.
Unemployment Rate refers to total of unemployed divided by total labour force (percentage).
34
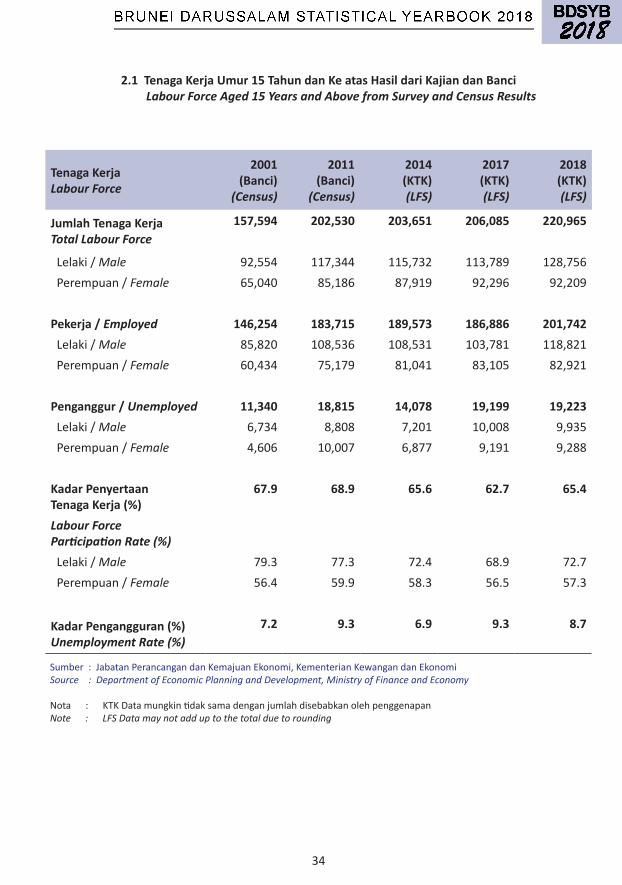
2.1 Tenaga Kerja Umur 15 Tahun dan Ke atas Hasil dari Kajian dan Banci Labour Force Aged 15 Years and Above from Survey and Census Results
Tenaga KerjaLabour Force
2001(Banci)
(Census)
2011(Banci)
(Census)
2014(KTK)(LFS)
2017(KTK)(LFS)
2018(KTK)(LFS)
Jumlah Tenaga KerjaTotal Labour Force
157,594 202,530 203,651 206,085 220,965
Lelaki/Male 92,554 117,344 115,732 113,789 128,756Perempuan/Female 65,040 85,186 87,919 92,296 92,209
Pekerja / Employed 146,254 183,715 189,573 186,886 201,742Lelaki/Male 85,820 108,536 108,531 103,781 118,821Perempuan/Female 60,434 75,179 81,041 83,105 82,921
Penganggur / Unemployed 11,340 18,815 14,078 19,199 19,223Lelaki/Male 6,734 8,808 7,201 10,008 9,935Perempuan/Female 4,606 10,007 6,877 9,191 9,288
Kadar Penyertaan Tenaga Kerja (%)
67.9 68.9 65.6 62.7 65.4
Labour Force Participation Rate (%)Lelaki/Male 79.3 77.3 72.4 68.9 72.7Perempuan/Female 56.4 59.9 58.3 56.5 57.3
Kadar Pengangguran (%)Unemployment Rate (%)
7.2 9.3 6.9 9.3 8.7
Sumber:JabatanPerancangandanKemajuanEkonomi,KementerianKewangandanEkonomiSource : Department of Economic Planning and Development, Ministry of Finance and Economy
Nota:KTKDatamungkintidaksamadenganjumlahdisebabkanolehpenggenapanNote : LFS Data may not add up to the total due to rounding
35
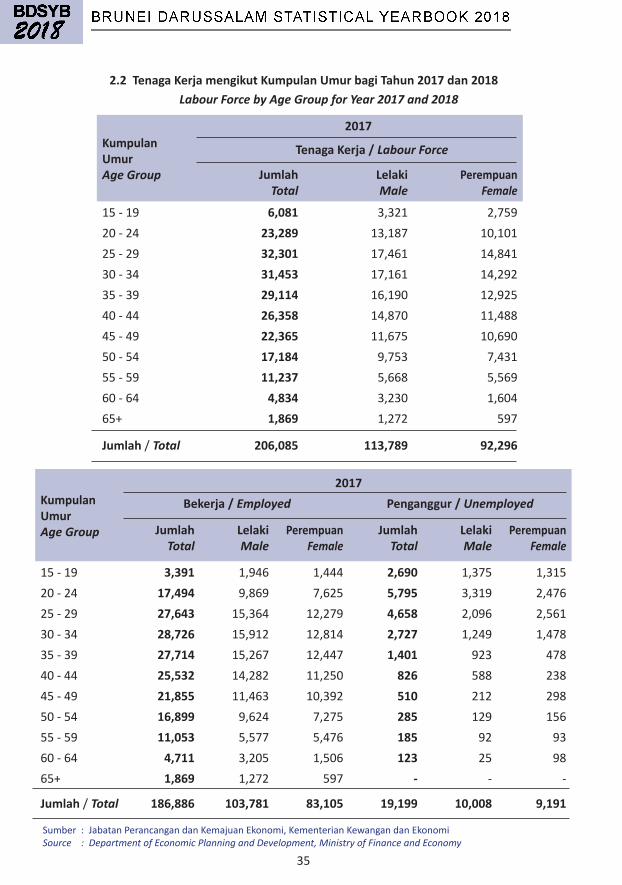
2.2 Tenaga Kerja mengikut Kumpulan Umur bagi Tahun 2017 dan 2018 Labour Force by Age Group for Year 2017 and 2018
Sumber:JabatanPerancangandanKemajuanEkonomi,KementerianKewangandanEkonomiSource : Department of Economic Planning and Development, Ministry of Finance and Economy
Kumpulan UmurAge Group
2017Bekerja / Employed Penganggur / Unemployed
JumlahTotal
LelakiMale
PerempuanFemale
JumlahTotal
LelakiMale
PerempuanFemale
15-19 3,391 1,946 1,444 2,690 1,375 1,31520-24 17,494 9,869 7,625 5,795 3,319 2,47625-29 27,643 15,364 12,279 4,658 2,096 2,56130-34 28,726 15,912 12,814 2,727 1,249 1,47835-39 27,714 15,267 12,447 1,401 923 47840-44 25,532 14,282 11,250 826 588 23845-49 21,855 11,463 10,392 510 212 29850-54 16,899 9,624 7,275 285 129 15655-59 11,053 5,577 5,476 185 92 9360-64 4,711 3,205 1,506 123 25 9865+ 1,869 1,272 597 - - -
Jumlah/Total 186,886 103,781 83,105 19,199 10,008 9,191
Kumpulan UmurAge Group
2017
Tenaga Kerja / Labour Force
JumlahTotal
LelakiMale
PerempuanFemale
15-19 6,081 3,321 2,75920-24 23,289 13,187 10,10125-29 32,301 17,461 14,84130-34 31,453 17,161 14,29235-39 29,114 16,190 12,92540-44 26,358 14,870 11,48845-49 22,365 11,675 10,69050-54 17,184 9,753 7,43155-59 11,237 5,668 5,56960-64 4,834 3,230 1,60465+ 1,869 1,272 597
Jumlah/Total 206,085 113,789 92,296
36
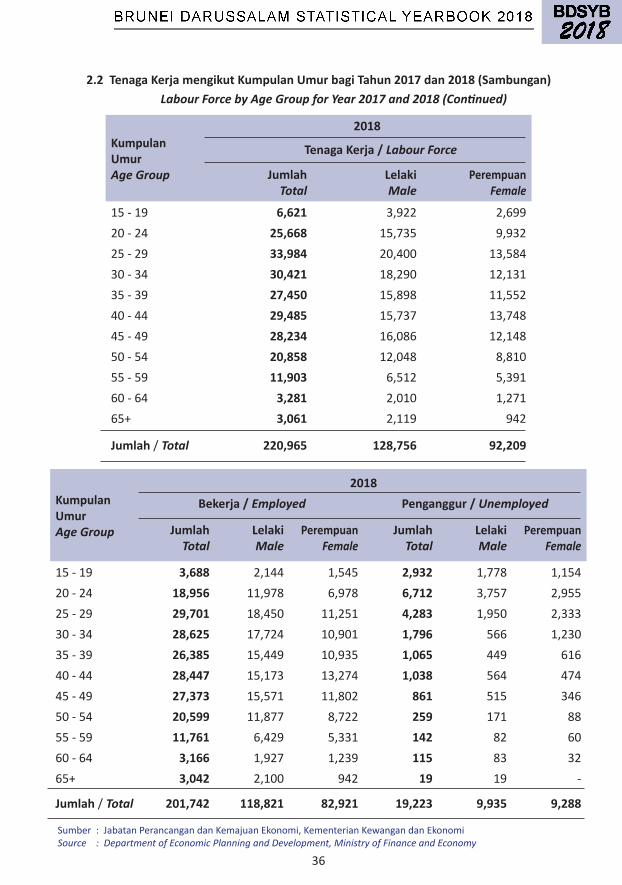
2.2 Tenaga Kerja mengikut Kumpulan Umur bagi Tahun 2017 dan 2018 (Sambungan) Labour Force by Age Group for Year 2017 and 2018 (Continued)
Sumber:JabatanPerancangandanKemajuanEkonomi,KementerianKewangandanEkonomiSource : Department of Economic Planning and Development, Ministry of Finance and Economy
Kumpulan UmurAge Group
2018Bekerja / Employed Penganggur / Unemployed
JumlahTotal
LelakiMale
PerempuanFemale
JumlahTotal
LelakiMale
PerempuanFemale
15-19 3,688 2,144 1,545 2,932 1,778 1,15420-24 18,956 11,978 6,978 6,712 3,757 2,95525-29 29,701 18,450 11,251 4,283 1,950 2,33330-34 28,625 17,724 10,901 1,796 566 1,23035-39 26,385 15,449 10,935 1,065 449 61640-44 28,447 15,173 13,274 1,038 564 47445-49 27,373 15,571 11,802 861 515 34650-54 20,599 11,877 8,722 259 171 8855-59 11,761 6,429 5,331 142 82 6060-64 3,166 1,927 1,239 115 83 3265+ 3,042 2,100 942 19 19 -
Jumlah/Total 201,742 118,821 82,921 19,223 9,935 9,288
Kumpulan UmurAge Group
2018
Tenaga Kerja / Labour Force
JumlahTotal
LelakiMale
PerempuanFemale
15-19 6,621 3,922 2,69920-24 25,668 15,735 9,93225-29 33,984 20,400 13,58430-34 30,421 18,290 12,13135-39 27,450 15,898 11,55240-44 29,485 15,737 13,74845-49 28,234 16,086 12,14850-54 20,858 12,048 8,81055-59 11,903 6,512 5,39160-64 3,281 2,010 1,27165+ 3,061 2,119 942
Jumlah/Total 220,965 128,756 92,209
37
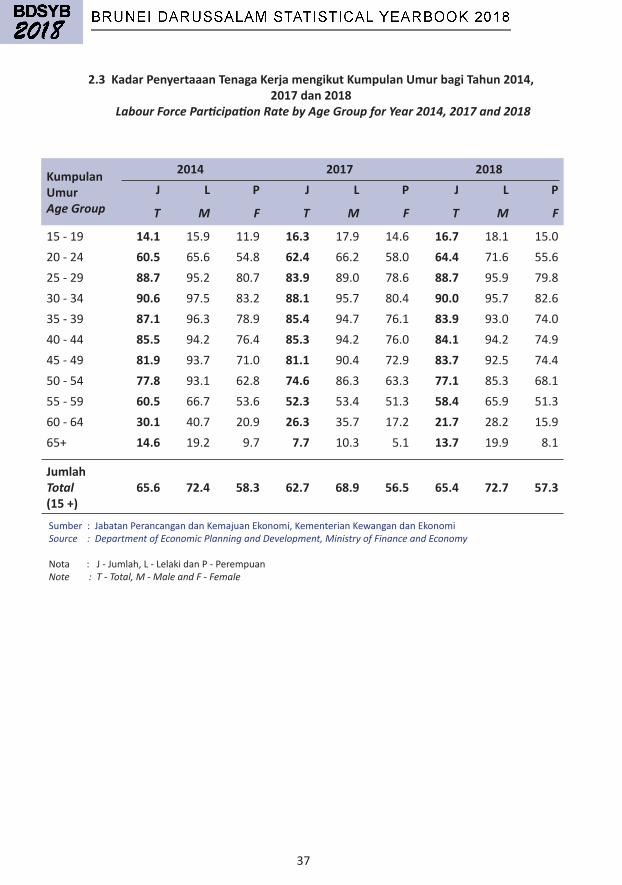
2.3 Kadar Penyertaaan Tenaga Kerja mengikut Kumpulan Umur bagi Tahun 2014, 2017 dan 2018
Labour Force Participation Rate by Age Group for Year 2014, 2017 and 2018
Sumber:JabatanPerancangandanKemajuanEkonomi,KementerianKewangandanEkonomiSource : Department of Economic Planning and Development, Ministry of Finance and Economy
Nota:J-Jumlah,L-LelakidanP-PerempuanNote : T - Total, M - Male and F - Female
Kumpulan UmurAge Group
2014 2017 2018J L P J L P J L P
T M F T M F T M F
15-19 14.1 15.9 11.9 16.3 17.9 14.6 16.7 18.1 15.020-24 60.5 65.6 54.8 62.4 66.2 58.0 64.4 71.6 55.625-29 88.7 95.2 80.7 83.9 89.0 78.6 88.7 95.9 79.830-34 90.6 97.5 83.2 88.1 95.7 80.4 90.0 95.7 82.635-39 87.1 96.3 78.9 85.4 94.7 76.1 83.9 93.0 74.040-44 85.5 94.2 76.4 85.3 94.2 76.0 84.1 94.2 74.945-49 81.9 93.7 71.0 81.1 90.4 72.9 83.7 92.5 74.450-54 77.8 93.1 62.8 74.6 86.3 63.3 77.1 85.3 68.155-59 60.5 66.7 53.6 52.3 53.4 51.3 58.4 65.9 51.360-64 30.1 40.7 20.9 26.3 35.7 17.2 21.7 28.2 15.965+ 14.6 19.2 9.7 7.7 10.3 5.1 13.7 19.9 8.1
JumlahTotal(15 +)
65.6 72.4 58.3 62.7 68.9 56.5 65.4 72.7 57.3
38
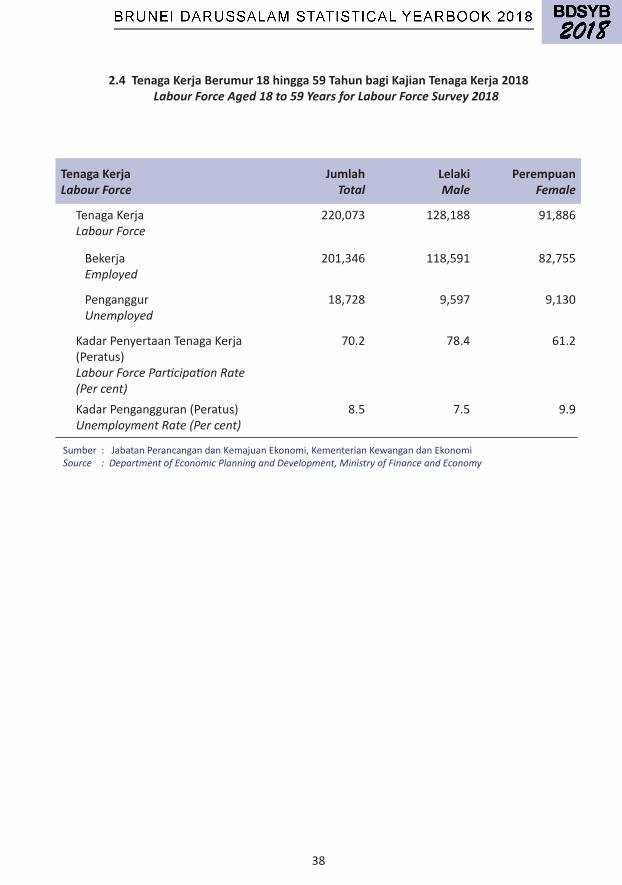
2.4 Tenaga Kerja Berumur 18 hingga 59 Tahun bagi Kajian Tenaga Kerja 2018 Labour Force Aged 18 to 59 Years for Labour Force Survey 2018
Sumber:JabatanPerancangandanKemajuanEkonomi,KementerianKewangandanEkonomiSource : Department of Economic Planning and Development, Ministry of Finance and Economy
Tenaga KerjaLabour Force
JumlahTotal
LelakiMale
PerempuanFemale
TenagaKerjaLabour Force
220,073 128,188 91,886
Bekerja Employed
201,346 118,591 82,755
Penganggur Unemployed
18,728 9,597 9,130
KadarPenyertaanTenagaKerja(Peratus)Labour Force Participation Rate(Per cent)
70.2 78.4 61.2
KadarPengangguran(Peratus)Unemployment Rate (Per cent)
8.5 7.5 9.9
39
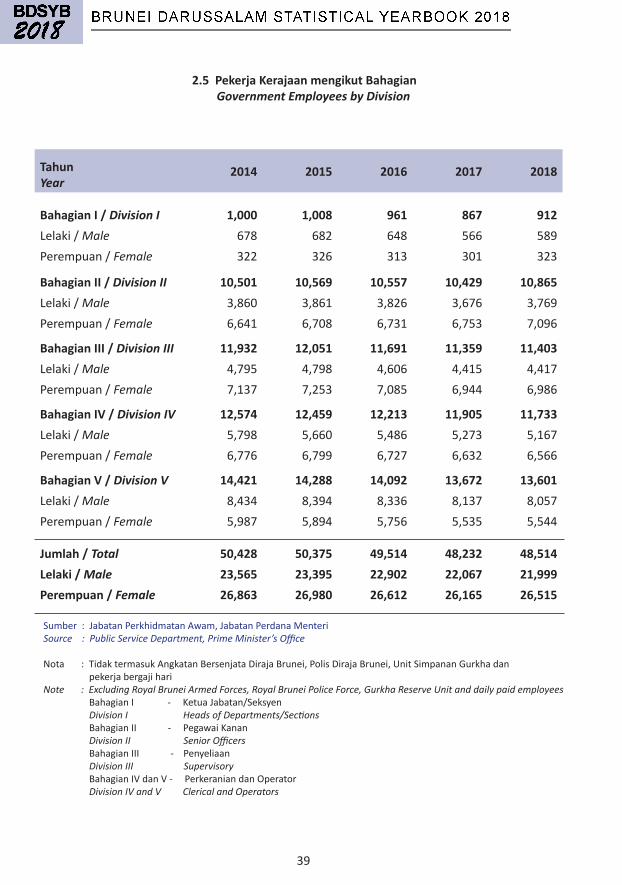
2.5 Pekerja Kerajaan mengikut Bahagian Government Employees by Division
TahunYear
2014 2015 2016 2017 2018
Bahagian I / Division I 1,000 1,008 961 867 912Lelaki/Male 678 682 648 566 589Perempuan/Female 322 326 313 301 323
Bahagian II / Division II 10,501 10,569 10,557 10,429 10,865Lelaki/Male 3,860 3,861 3,826 3,676 3,769Perempuan/Female 6,641 6,708 6,731 6,753 7,096
Bahagian III / Division III 11,932 12,051 11,691 11,359 11,403Lelaki/Male 4,795 4,798 4,606 4,415 4,417Perempuan/Female 7,137 7,253 7,085 6,944 6,986
Bahagian IV / Division IV 12,574 12,459 12,213 11,905 11,733Lelaki/Male 5,798 5,660 5,486 5,273 5,167Perempuan/Female 6,776 6,799 6,727 6,632 6,566
Bahagian V / Division V 14,421 14,288 14,092 13,672 13,601Lelaki/Male 8,434 8,394 8,336 8,137 8,057Perempuan/Female 5,987 5,894 5,756 5,535 5,544
Jumlah / Total 50,428 50,375 49,514 48,232 48,514Lelaki / Male 23,565 23,395 22,902 22,067 21,999Perempuan / Female 26,863 26,980 26,612 26,165 26,515
Sumber:JabatanPerkhidmatanAwam,JabatanPerdanaMenteriSource : Public Service Department, Prime Minister’s Office
Nota:TidaktermasukAngkatanBersenjataDirajaBrunei,PolisDirajaBrunei,UnitSimpananGurkhadanpekerjabergajihariNote : Excluding Royal Brunei Armed Forces, Royal Brunei Police Force, Gurkha Reserve Unit and daily paid employees BahagianI-KetuaJabatan/Seksyen Division I Heads of Departments/Sections BahagianII-PegawaiKanan Division II Senior Officers BahagianIII-Penyeliaan Division III Supervisory BahagianIVdanV-PerkeraniandanOperator Division IV and V Clerical and Operators

3 PERANGKAAN AKAUN NEGARANATIONAL ACCOUNTS STATISTICS
41
Nota Keterangan
3 KELUARAN DALAM NEGERI KASAR (KDNK)
Perangkaan Akaun Negara (2010 = 100)
Padatahun2013,JabatanPerangkaan(JPKE)telahmenggunakansiriakaunnegaratahunasas2010yangtelahdikemaskinibagimenggantikansiriakaunnegaratahunasas2000.SiriKeluaranDalamNegeriKasar(KDNK)yangbarubagiNegaraBruneiDarussalam(NBD)adalahkonsistendenganSistemAkaunNegara1993dan2008.
Mulai tahun tersebut juga, KDNK telah menggunakan tiga pendekatan baru iaitu pendekatan pengeluaran,pendekatan perbelanjaan dan pendekatan pendapatan. Dengan penggunaan siri KDNK yang telah disemak,menunjukkangambaranyanglebihtepattentangperkembanganekonomiNBDmasakini.Agregatmakro-ekonomiyanglainsepertiPendapatanNegaraKasar(PNK)danTabungNegaraKasar(TNK)jugatelahdihasilkan.
Keluaran Dalam Negeri Kasar (KDNK) adalah ukuran bagi jumlah nilai pengeluaran barang-barang danperkhidmatanolehunitpengeluaryangmenetapdalamsesebuahekonomidalamtempohperakaunan,biasanyasatutahunatausatusukutahun.
KDNKbolehdikiramenggunakantigapendekatan:
(a)pendekatanpengeluaran, (b)pendekatanperbelanjaan,dan (c)pendekatanpendapatan.
DidalamsiriKDNKberasaskantahun2000bagiNegaraBruneiDarussalam,duapendekatantelahdigunakan,iaitupendekatanpengeluarandanpendekatanperbelanjaan.Siriberasaskantahun1974yanglaluhanyamenggunakanpendekatanpengeluaransahaja.

42
KDNK Mengikut Pendekatan Pengeluaran Dibawahpendekatanini,KDNKialahjumlahNilaiTambahKasar(GVA)bagiindustridalamekonomi.GVAdikirabagisetiapaktivitiekonomidankemudiannyadicampuruntukmendapatkanjumlahnilaitambahkasaratauKDNKbagikeseluruhanekonomi,iaitu:
KDNK = Σ GVA + Cukai tolak subsidi ke atas produk
GVA diperolehidenganmenolaknilaibarang-barangdanperkhidmatanyangdigunakandalamprosespengeluaran(dirujuk sebagaipenggunaanperantaraan, IC)daripadanilaibarang-barangdanperkhidmatanyangdihasilkan(disebutsebagaikeluarankasar,GO),iaitu:
GVA = GO - IC
KDNKmengikutpendekatanpengeluaranditunjukkanmengikut jenisaktivitiekonomi,berpandukan Klasifikasi Standard Industri Negara Brunei Darussalam (BDSIC 2011), yang berasaskan Klasifikasi Standard Industri Antarabangsa (ISIC), Semakan 4.
KDNK Mengikut Pendekatan Perbelanjaan
Pendekatan ini menilai penggunaan akhir bagi pengeluaran negara. Komponen perbelanjaan KDNK adalahberasaskan pembelian barang dan perkhidmatan untuk penggunaan akhir, dan kadangkala disebut sebagaiagregat ‘permintaanakhir’ atau ‘perbelanjaanakhir’. Pembelianperantaraanbarangdanperkhidmatanuntukpemerosesanselanjutnyaadalahdikecualikan.
KDNK ialah jumlah perbelanjaan penggunaan persendirian (PCE), perbelanjaan penggunaan kerajaan (GCE),pembentukanmodalkasarataupelaburan(I)daneksport(X)dikurangkanimport(M)barangdanperkhidmatan,iaitu:
KDNK = PCE + GCE + I + X - M
Diskrepansi perangkaan (SD) dicampur kepada KDNK perbelanjaan untukmencatatkan perbezaan dalam nilaiKDNKdaripadapendekatanpengeluarandanperbelanjaan.
KDNK Mengikut Pendekatan Pendapatan
Pendekatan pendapatan adalah jumlah bayaran pekerja (CoE), penggunaan modal tetap (CFC), pendapatanlebihanoperasikasardanpendapatanbercampur(OS)ditambahcukaibersihsubsidipadapengeluaran.
GDP = CoE + CFC + OS + Cukai tolak subsidi ke atas produk
43
KDNK Pada Harga Semasa dan Tetap
Bagimembolehkanberbagaijenisbarangdanperkhidmatandicampurdalamsatuunitukuranyangsama,KDNKdikiradalamnilaimatawang.KDNKpadahargasemasamerujukkepadaKDNKyangdikirapadahargasemasadalamtempohperakaunan.KDNKpadahargasemasajugadisebutsebagaiKDNKnominal.
Memandangkan harga barang dan perkhidmatan berubah dari satu masa ke satu masa, perubahan dalamnilai KDNK mungkin disebabkan oleh perubahan dalam kuantiti barang dan perkhidmatan yang dihasilkanatau disebabkan perubahan harga. Oleh yang demikian, kesan dari perubahan harga perlu diasingkan untukmembolehkanperbandinganyangbermaknauntukmelihatperubahandalamparasataukuantitiaktivitiekonomisepanjangmasatertentu.InimemerlukanpertukaranKDNKhargasemasakepadahargatetap.KDNKpadahargatetapjugadigelarKDNKsebenar.
Kadar Pertumbuhan KDNK
PerubahandalamKDNKhargasemasa,yangdikiraolehkadarpertumbuhan,menggambarkankesancantumandariperubahandalamparashargadanjugakuantitipengeluaranbarangdanperkhidmatandarisatutempohkesatutempohyanglain.
Kadar pertumbuhan bagi KDNK pada harga tetap memberikan ukuran bagi pertumbuhan ‘sebenar’ dalamekonomikeranakesandariperubahanhargatelahdikecualikan.
Kadarpertumbuhantahunan,r,dalamperatusbagiKDNKhargatetap(misalnyabagi2017dibandingkandengan2016)dikirasepertiberikut:
r = ((KDNK2017 / KDNK2016 ) – 1) x 100
KDNK per kapitadiperolehidenganmembahagiKDNKpadahargasemasadengansaizpenduduk.Inidigunakanuntuk menunjukkan tahap perkembangan ekonomi sebagai perbandingan dengan negara-negara lain. KDNKperkapitajugadikiradalamhargatetap.PerubahandalamKDNKperkapitapadahargatetapdigunakanuntukmenunjukkankesejahteraankeseluruhandalamekonomi.
44
Explanatory Note
3 GROSS DOMESTIC PRODUCT (GDP)
National Accounts Statistics (2010 = 100)
In 2013, the Department of Statistics (JPKE) has implemented the new series of national accounts with base year 2010 to replace the national accounts series with base year 2000. The new series for Brunei Darussalam (NBD) is consistent with the System of National Accounts 1993 and 2008.
Starting from that year, Gross Domestic Product (GDP) uses the three approaches namely the production approach, expenditure approach and income approach. Other macro-economic aggregates such as Gross National Income (GNI) and Gross National Savings (GNS) are also compiled in the new series.
Gross Domestic Product (GDP) is a measure of the total value of production of goods and services by all resident producing units in an economy during an accounting period, which is usually one year or one quarter.
GDP can be calculated by using three approaches:
(a) the production approach, (b) the expenditure approach, and (c) the income approach.
In the 2000-based GDP series for Brunei Darussalam, two approaches are used, namely the production approach and the expenditure approach. The previous 1974-based series only used the production approach.

45
GDP by Production Approach
Under this approach, GDP is the sum of the value-added of the various industries in the economy. Gross Value Added (GVA) is calculated for every economic activity and then summed up to obtain the total gross value added or GDP for the whole economy, i.e.
GDP = Σ GVA + Taxes less subsidies on products
GVA is derived by deducting the value of goods and services used in the production processes (referred to as intermediate consumption, IC) from the value of goods and services produced (referred to as output, GO), i.e.
GVA = GO - IC
GDP by production approach is presented by kind of economic activities according to the Brunei Darussalam Standard Industrial Classification (BDSIC 2011), which is based on the International Standard Industrial Classification (ISIC), Revision 4.
GDP by Expenditure Approach
This approach evaluates the final uses of the country’s output. The GDP expenditure components are based on the purchases of goods and services for final use, and are sometimes referred to as ‘final demand’ or ‘final expenditure’ aggregates. Intermediate purchases of goods and services used for further processing are excluded.
GDP is the sum of private consumption expenditure (PCE), government consumption expenditure (GCE), capital formation or investment (I) and exports (X) less imports (M) of goods and services, i.e. :
GDP = PCE + GCE + I + X – M
A statistical discrepancy (SD) is added to the GDP by expenditure to record the difference in the GDP values obtained from the production and expenditure approaches.
GDP by Income Approach
The income approach is the sum of compensation of employees (CoE), consumption of fixed capital (CFC), gross operating surplus and gross mixed income (OS) plus taxes net of subsidies on production.
GDP = CoE + CFC + OS + Taxes less subsidies on products
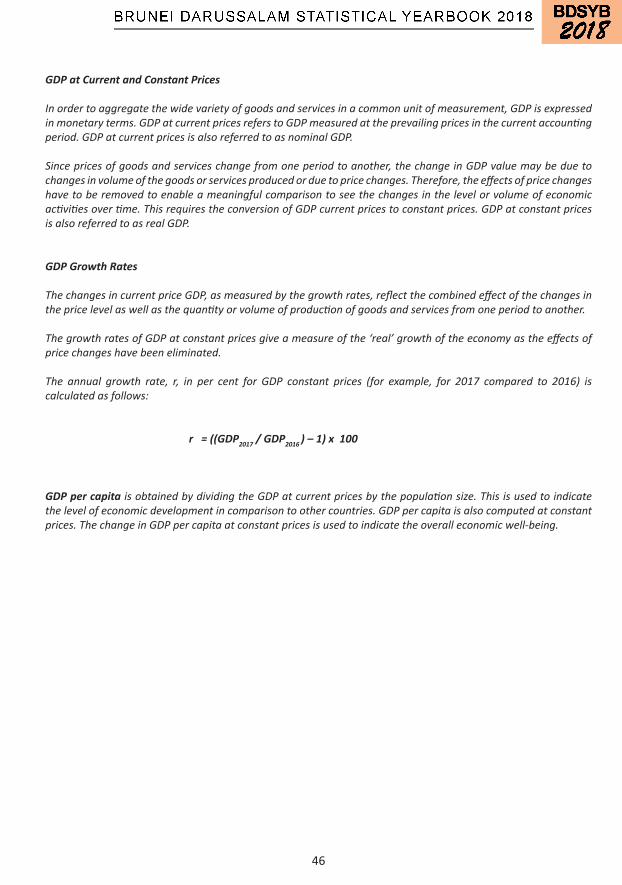
46
GDP at Current and Constant Prices
In order to aggregate the wide variety of goods and services in a common unit of measurement, GDP is expressed in monetary terms. GDP at current prices refers to GDP measured at the prevailing prices in the current accounting period. GDP at current prices is also referred to as nominal GDP.
Since prices of goods and services change from one period to another, the change in GDP value may be due to changes in volume of the goods or services produced or due to price changes. Therefore, the effects of price changes have to be removed to enable a meaningful comparison to see the changes in the level or volume of economic activities over time. This requires the conversion of GDP current prices to constant prices. GDP at constant prices is also referred to as real GDP.
GDP Growth Rates
The changes in current price GDP, as measured by the growth rates, reflect the combined effect of the changes in the price level as well as the quantity or volume of production of goods and services from one period to another.
The growth rates of GDP at constant prices give a measure of the ‘real’ growth of the economy as the effects of price changes have been eliminated.
The annual growth rate, r, in per cent for GDP constant prices (for example, for 2017 compared to 2016) is calculated as follows:
r = ((GDP2017 / GDP2016 ) – 1) x 100
GDP per capita is obtained by dividing the GDP at current prices by the population size. This is used to indicate the level of economic development in comparison to other countries. GDP per capita is also computed at constant prices. The change in GDP per capita at constant prices is used to indicate the overall economic well-being.
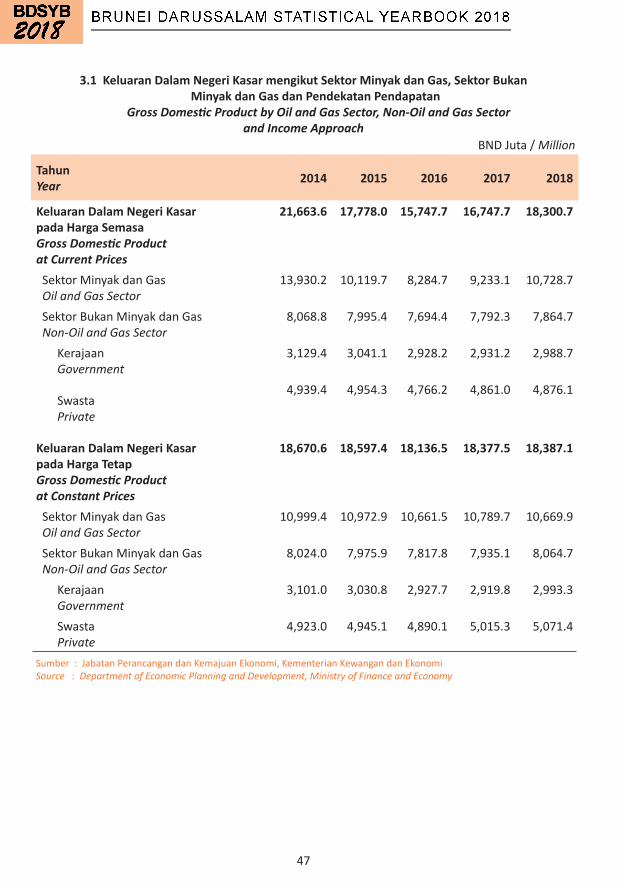
47
3.1 Keluaran Dalam Negeri Kasar mengikut Sektor Minyak dan Gas, Sektor Bukan Minyak dan Gas dan Pendekatan Pendapatan
Gross Domestic Product by Oil and Gas Sector, Non-Oil and Gas Sectorand Income Approach
Sumber:JabatanPerancangandanKemajuanEkonomi,KementerianKewangandanEkonomiSource : Department of Economic Planning and Development, Ministry of Finance and Economy
TahunYear 2014 2015 2016 2017 2018
Keluaran Dalam Negeri Kasar pada Harga SemasaGross Domestic Product at Current Prices
21,663.6 17,778.0 15,747.7 16,747.7 18,300.7
SektorMinyakdanGas Oil and Gas Sector
13,930.2 10,119.7 8,284.7 9,233.1 10,728.7
SektorBukanMinyakdanGas Non-Oil and Gas Sector
8,068.8 7,995.4 7,694.4 7,792.3 7,864.7
Kerajaan Government
3,129.4 3,041.1 2,928.2 2,931.2 2,988.7
Swasta Private
4,939.4 4,954.3 4,766.2 4,861.0 4,876.1
Keluaran Dalam Negeri Kasar pada Harga TetapGross Domestic Product at Constant Prices
18,670.6 18,597.4 18,136.5 18,377.5 18,387.1
SektorMinyakdanGas Oil and Gas Sector
10,999.4 10,972.9 10,661.5 10,789.7 10,669.9
SektorBukanMinyakdanGas Non-Oil and Gas Sector
8,024.0 7,975.9 7,817.8 7,935.1 8,064.7
Kerajaan Government
3,101.0 3,030.8 2,927.7 2,919.8 2,993.3
Swasta Private
4,923.0 4,945.1 4,890.1 5,015.3 5,071.4
BNDJuta/ Million

48
3.1 Keluaran Dalam Negeri Kasar mengikut Sektor Minyak dan Gas, Sektor Bukan Minyak dan Gas dan Pendekatan Pendapatan (Sambungan)
Gross Domestic Product by Oil and Gas Sector, Non-Oil and Gas Sectorand Income Approach (Continued)
Sumber:JabatanPerancangandanKemajuanEkonomi,KementerianKewangandanEkonomiSource : Department of Economic Planning and Development, Ministry of Finance and Economy
TahunYear 2014 2015 2016 2017 2018
Keluaran Dalam Negeri Kasar mengikut Pendekatan Pendapatan pada Harga Semasa Gross Domestic Product by Income Approach at Current Prices
21,663.6 17,778.0 15,747.7 16,747.7 18,300.7
PampasanPekerjaCompensation of Employees
5,137.2 5,060.3 5,071.4 5,027.0 5,217.3
PenggunaanModalTetapConsumption of Fixed Capital
968.7 865.7 803.1 837.1 886.7
Lain-lainCukaipadaPengeluaranOther Taxes on Production
14.7 15.5 13.6 14.2 14.9
LebihanKendalianBersih/PendapatanBercampurNet Operating Surplus / Mixed Income
15,878.4 12,173.7 10,090.9 11,147.1 12,474.5
CukaiTolakSubsidikeatasPengeluaranTaxes less Subsidies on Products
(335.5) (337.1) (231.3) (277.7) (292.8)
Pendapatan Negara Kasar (PNK)Gross National Income (GNI)
21,644.3 18,672.5 16,901.3 17,742.5 18,586.4
Tabung Negara Kasar (TNK)Gross National Savings (GNS)
12,956.7 10,155.0 8,884.1 9,269.0 9,911.2
BNDJuta/ Million
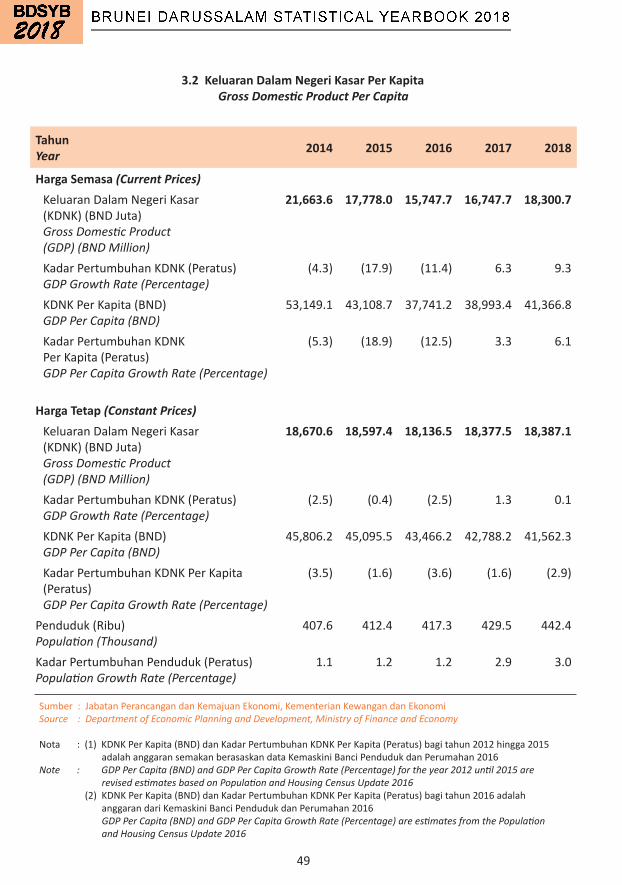
49
3.2 Keluaran Dalam Negeri Kasar Per Kapita Gross Domestic Product Per Capita
Sumber:JabatanPerancangandanKemajuanEkonomi,KementerianKewangandanEkonomiSource : Department of Economic Planning and Development, Ministry of Finance and Economy
Nota:(1)KDNKPerKapita(BND)danKadarPertumbuhanKDNKPerKapita(Peratus)bagitahun2012hingga2015adalahanggaransemakanberasaskandataKemaskiniBanciPendudukdanPerumahan2016Note : GDP Per Capita (BND) and GDP Per Capita Growth Rate (Percentage) for the year 2012 until 2015 are revised estimates based on Population and Housing Census Update 2016 (2)KDNKPerKapita(BND)danKadarPertumbuhanKDNKPerKapita(Peratus)bagitahun2016adalahanggarandariKemaskiniBanciPendudukdanPerumahan2016 GDP Per Capita (BND) and GDP Per Capita Growth Rate (Percentage) are estimates from the Population and Housing Census Update 2016
TahunYear 2014 2015 2016 2017 2018
Harga Semasa (Current Prices)KeluaranDalamNegeriKasar(KDNK)(BNDJuta)Gross Domestic Product (GDP) (BND Million)
21,663.6 17,778.0 15,747.7 16,747.7 18,300.7
KadarPertumbuhanKDNK(Peratus)GDP Growth Rate (Percentage)
(4.3) (17.9) (11.4) 6.3 9.3
KDNKPerKapita(BND)GDP Per Capita (BND)
53,149.1 43,108.7 37,741.2 38,993.4 41,366.8
KadarPertumbuhanKDNKPerKapita(Peratus)GDP Per Capita Growth Rate (Percentage)
(5.3) (18.9) (12.5) 3.3 6.1
Harga Tetap (Constant Prices)KeluaranDalamNegeriKasar(KDNK)(BNDJuta)Gross Domestic Product (GDP) (BND Million)
18,670.6 18,597.4 18,136.5 18,377.5 18,387.1
KadarPertumbuhanKDNK(Peratus)GDP Growth Rate (Percentage)
(2.5) (0.4) (2.5) 1.3 0.1
KDNKPerKapita(BND)GDP Per Capita (BND)
45,806.2 45,095.5 43,466.2 42,788.2 41,562.3
KadarPertumbuhanKDNKPerKapita(Peratus)GDP Per Capita Growth Rate (Percentage)
(3.5) (1.6) (3.6) (1.6) (2.9)
Penduduk(Ribu)Population (Thousand)
407.6 412.4 417.3 429.5 442.4
KadarPertumbuhanPenduduk(Peratus)Population Growth Rate (Percentage)
1.1 1.2 1.2 2.9 3.0
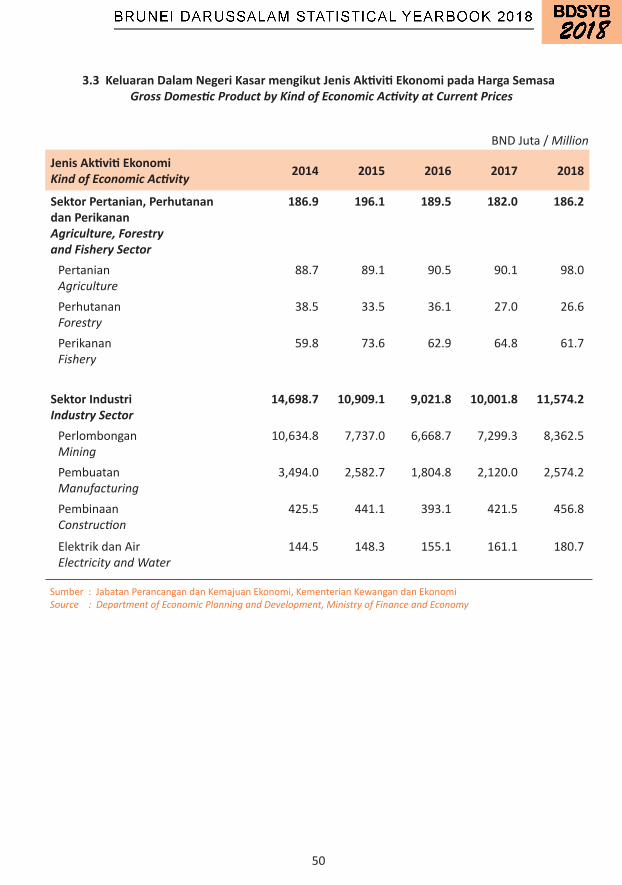
50
Jenis Aktiviti EkonomiKind of Economic Activity 2014 2015 2016 2017 2018
Sektor Pertanian, Perhutanan dan PerikananAgriculture, Forestry and Fishery Sector
186.9 196.1 189.5 182.0 186.2
PertanianAgriculture
88.7 89.1 90.5 90.1 98.0
PerhutananForestry
38.5 33.5 36.1 27.0 26.6
PerikananFishery
59.8 73.6 62.9 64.8 61.7
Sektor IndustriIndustry Sector
14,698.7 10,909.1 9,021.8 10,001.8 11,574.2
PerlombonganMining
10,634.8 7,737.0 6,668.7 7,299.3 8,362.5
PembuatanManufacturing
3,494.0 2,582.7 1,804.8 2,120.0 2,574.2
PembinaanConstruction
425.5 441.1 393.1 421.5 456.8
ElektrikdanAirElectricity and Water
144.5 148.3 155.1 161.1 180.7
3.3 Keluaran Dalam Negeri Kasar mengikut Jenis Aktiviti Ekonomi pada Harga Semasa Gross Domestic Product by Kind of Economic Activity at Current Prices
Sumber:JabatanPerancangandanKemajuanEkonomi,KementerianKewangandanEkonomiSource : Department of Economic Planning and Development, Ministry of Finance and Economy
BNDJuta/ Million
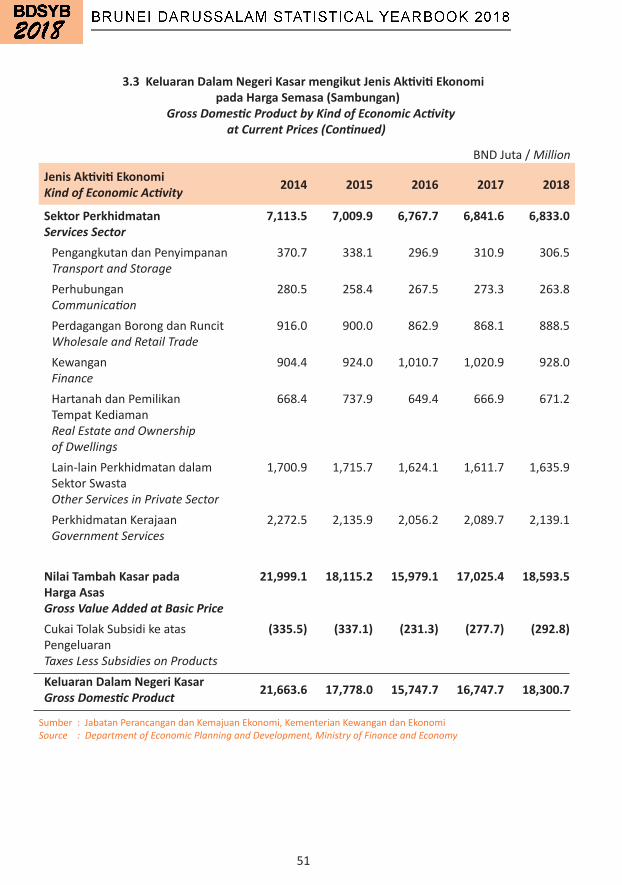
51
Jenis Aktiviti EkonomiKind of Economic Activity 2014 2015 2016 2017 2018
Sektor PerkhidmatanServices Sector
7,113.5 7,009.9 6,767.7 6,841.6 6,833.0
PengangkutandanPenyimpananTransport and Storage
370.7 338.1 296.9 310.9 306.5
PerhubunganCommunication
280.5 258.4 267.5 273.3 263.8
PerdaganganBorongdanRuncitWholesale and Retail Trade
916.0 900.0 862.9 868.1 888.5
KewanganFinance
904.4 924.0 1,010.7 1,020.9 928.0
HartanahdanPemilikanTempatKediamanReal Estate and Ownership of Dwellings
668.4 737.9 649.4 666.9 671.2
Lain-lainPerkhidmatandalamSektorSwastaOther Services in Private Sector
1,700.9 1,715.7 1,624.1 1,611.7 1,635.9
PerkhidmatanKerajaanGovernment Services
2,272.5 2,135.9 2,056.2 2,089.7 2,139.1
Nilai Tambah Kasar pada Harga AsasGross Value Added at Basic Price
21,999.1 18,115.2 15,979.1 17,025.4 18,593.5
CukaiTolakSubsidikeatasPengeluaranTaxes Less Subsidies on Products
(335.5) (337.1) (231.3) (277.7) (292.8)
Keluaran Dalam Negeri KasarGross Domestic Product 21,663.6 17,778.0 15,747.7 16,747.7 18,300.7
3.3 Keluaran Dalam Negeri Kasar mengikut Jenis Aktiviti Ekonomi pada Harga Semasa (Sambungan)
Gross Domestic Product by Kind of Economic Activity at Current Prices (Continued)
BNDJuta/ Million
Sumber:JabatanPerancangandanKemajuanEkonomi,KementerianKewangandanEkonomiSource : Department of Economic Planning and Development, Ministry of Finance and Economy

52
3.4 Peratus Agihan Keluaran Dalam Negeri Kasar mengikut Jenis Aktiviti Ekonomi pada Harga Semasa
Gross Domestic Product Per Cent Distribution by Kind of Economic Activity at Current Prices
Jenis Aktiviti EkonomiKind of Economic Activity 2014 2015 2016 2017 2018
Sektor Pertanian, Perhutanan dan PerikananAgriculture, Forestry and Fishery Sector
0.9 1.1 1.2 1.1 1.0
PertanianAgriculture
0.4 0.5 0.6 0.5 0.5
PerhutananForestry
0.2 0.2 0.2 0.2 0.1
PerikananFishery
0.3 0.4 0.4 0.4 0.3
Sektor IndustriIndustry Sector
67.8 61.4 57.3 59.7 63.2
PerlombonganMining
49.1 43.5 42.3 43.6 45.7
PembuatanManufacturing
16.1 14.5 11.5 12.7 14.1
PembinaanConstruction
2.0 2.5 2.5 2.5 2.5
ElektrikdanAirElectricity and Water
0.7 0.8 1.0 1.0 1.0
Peratus/Per cent
Sumber:JabatanPerancangandanKemajuanEkonomi,KementerianKewangandanEkonomiSource : Department of Economic Planning and Development, Ministry of Finance and Economy
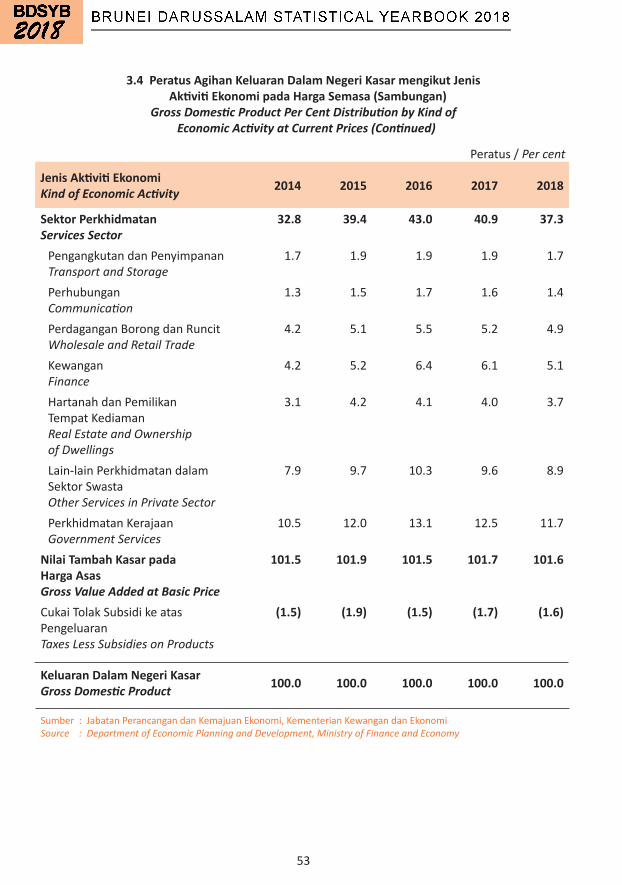
53
Peratus/Per cent
3.4 Peratus Agihan Keluaran Dalam Negeri Kasar mengikut Jenis Aktiviti Ekonomi pada Harga Semasa (Sambungan)
Gross Domestic Product Per Cent Distribution by Kind of Economic Activity at Current Prices (Continued)
Jenis Aktiviti EkonomiKind of Economic Activity 2014 2015 2016 2017 2018
Sektor PerkhidmatanServices Sector
32.8 39.4 43.0 40.9 37.3
PengangkutandanPenyimpananTransport and Storage
1.7 1.9 1.9 1.9 1.7
PerhubunganCommunication
1.3 1.5 1.7 1.6 1.4
PerdaganganBorongdanRuncitWholesale and Retail Trade
4.2 5.1 5.5 5.2 4.9
KewanganFinance
4.2 5.2 6.4 6.1 5.1
HartanahdanPemilikanTempatKediamanReal Estate and Ownership of Dwellings
3.1 4.2 4.1 4.0 3.7
Lain-lainPerkhidmatandalamSektorSwastaOther Services in Private Sector
7.9 9.7 10.3 9.6 8.9
PerkhidmatanKerajaanGovernment Services
10.5 12.0 13.1 12.5 11.7
Nilai Tambah Kasar pada Harga AsasGross Value Added at Basic Price
101.5 101.9 101.5 101.7 101.6
CukaiTolakSubsidikeatasPengeluaranTaxes Less Subsidies on Products
(1.5) (1.9) (1.5) (1.7) (1.6)
Keluaran Dalam Negeri KasarGross Domestic Product 100.0 100.0 100.0 100.0 100.0
Sumber:JabatanPerancangandanKemajuanEkonomi,KementerianKewangandanEkonomiSource : Department of Economic Planning and Development, Ministry of Finance and Economy
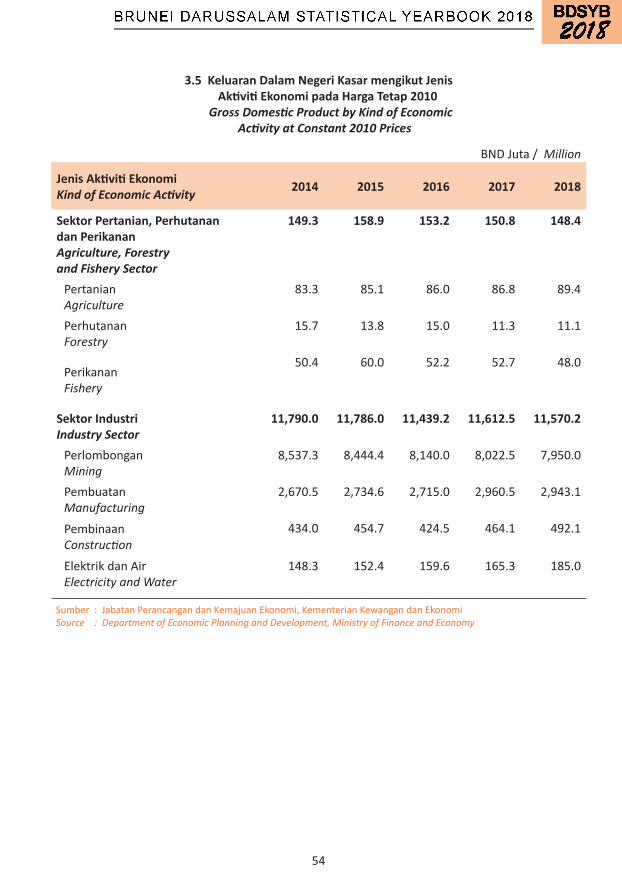
54
3.5 Keluaran Dalam Negeri Kasar mengikut Jenis Aktiviti Ekonomi pada Harga Tetap 2010
Gross Domestic Product by Kind of Economic Activity at Constant 2010 Prices
Jenis Aktiviti EkonomiKind of Economic Activity 2014 2015 2016 2017 2018
Sektor Pertanian, Perhutanan dan PerikananAgriculture, Forestry and Fishery Sector
149.3 158.9 153.2 150.8 148.4
PertanianAgriculture
83.3 85.1 86.0 86.8 89.4
PerhutananForestry
15.7 13.8 15.0 11.3 11.1
PerikananFishery
50.4 60.0 52.2 52.7 48.0
Sektor IndustriIndustry Sector
11,790.0 11,786.0 11,439.2 11,612.5 11,570.2
PerlombonganMining
8,537.3 8,444.4 8,140.0 8,022.5 7,950.0
PembuatanManufacturing
2,670.5 2,734.6 2,715.0 2,960.5 2,943.1
PembinaanConstruction
434.0 454.7 424.5 464.1 492.1
ElektrikdanAirElectricity and Water
148.3 152.4 159.6 165.3 185.0
BNDJuta/Million
Sumber:JabatanPerancangandanKemajuanEkonomi,KementerianKewangandanEkonomiSource : Department of Economic Planning and Development, Ministry of Finance and Economy

55
3.5 Keluaran Dalam Negeri Kasar mengikut Jenis Aktiviti Ekonomi pada Harga Tetap 2010 (Sambungan)
Gross Domestic Product by Kind of Economic Activity at Constant 2010 Prices (Continued)
Jenis Aktiviti EkonomiKind of Economic Activity 2014 2015 2016 2017 2018
Sektor PerkhidmatanServices Sector
7,084.1 7,003.9 6,886.9 6,961.6 7,016.0
PengangkutandanPenyimpananTransport and Storage
381.0 365.5 332.3 347.7 346.5
PerhubunganCommunication
276.1 281.2 291.0 293.6 290.3
PerdaganganBorongdanRuncitWholesale and Retail Trade
917.0 925.2 893.0 899.1 919.4
KewanganFinance
904.4 908.6 993.5 1,008.0 940.9
HartanahdanPemilikanTempatKediamanReal Estate and Ownership of Dwellings
679.0 698.7 711.9 731.1 748.4
Lain-lainPerkhidmatandalamSektorSwastaOther Services in Private Sector
1,664.2 1,689.3 1,588.0 1,572.6 1,590.0
PerkhidmatanKerajaanGovernment Services
2,262.5 2,135.4 2,077.1 2,109.4 2,180.5
Nilai Tambah Kasar Pada Harga AsasGross Value Added at Basic Price
19,023.5 18,948.8 18,479.3 18,724.8 18,734.6
CukaiTolakSubsidikeatasPengeluaranTaxes Less Subsidies on Products
(352.8) (351.4) (342.7) (347.3) (347.5)
Keluaran Dalam Negeri KasarGross Domestic Product 18,670.6 18,597.4 18,136.5 18,377.5 18,387.1
BNDJuta/Million
Sumber:JabatanPerancangandanKemajuanEkonomi,KementerianKewangandanEkonomiSource : Department of Economic Planning and Development, Ministry of Finance and Economy
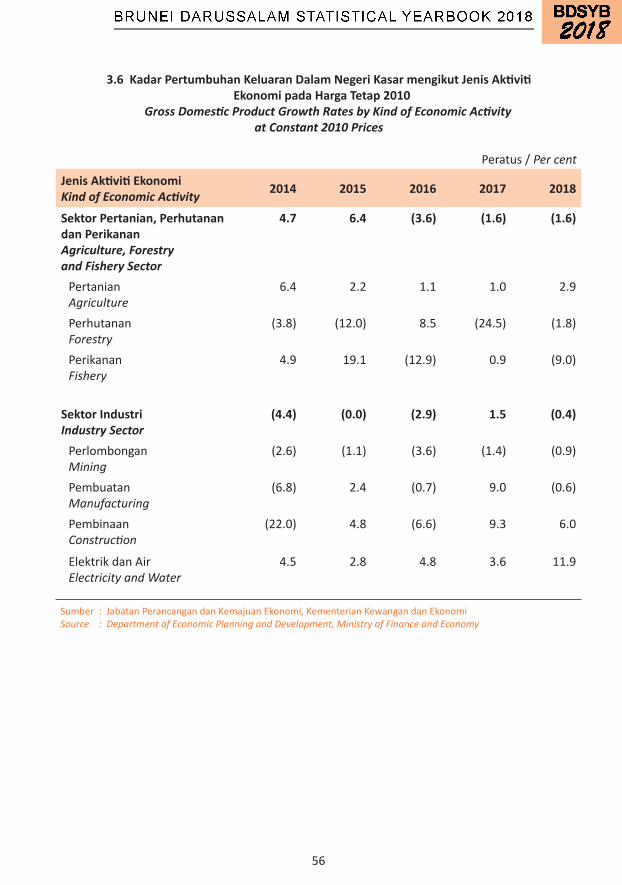
56
3.6 Kadar Pertumbuhan Keluaran Dalam Negeri Kasar mengikut Jenis Aktiviti Ekonomi pada Harga Tetap 2010
Gross Domestic Product Growth Rates by Kind of Economic Activity at Constant 2010 Prices
Jenis Aktiviti EkonomiKind of Economic Activity 2014 2015 2016 2017 2018
Sektor Pertanian, Perhutanan dan PerikananAgriculture, Forestry and Fishery Sector
4.7 6.4 (3.6) (1.6) (1.6)
PertanianAgriculture
6.4 2.2 1.1 1.0 2.9
PerhutananForestry
(3.8) (12.0) 8.5 (24.5) (1.8)
PerikananFishery
4.9 19.1 (12.9) 0.9 (9.0)
Sektor IndustriIndustry Sector
(4.4) (0.0) (2.9) 1.5 (0.4)
PerlombonganMining
(2.6) (1.1) (3.6) (1.4) (0.9)
PembuatanManufacturing
(6.8) 2.4 (0.7) 9.0 (0.6)
PembinaanConstruction
(22.0) 4.8 (6.6) 9.3 6.0
ElektrikdanAirElectricity and Water
4.5 2.8 4.8 3.6 11.9
Peratus/Per cent
Sumber:JabatanPerancangandanKemajuanEkonomi,KementerianKewangandanEkonomiSource : Department of Economic Planning and Development, Ministry of Finance and Economy
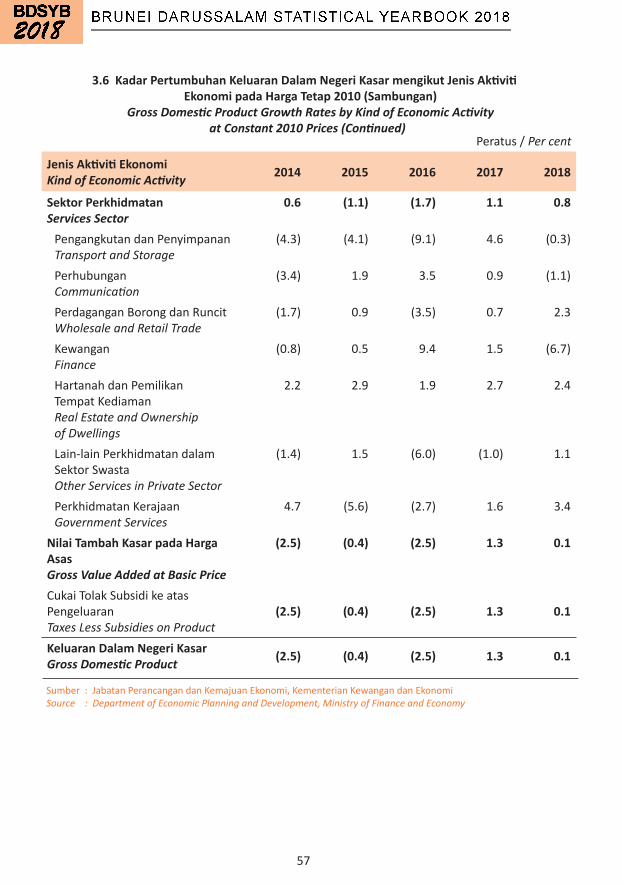
57
3.6 Kadar Pertumbuhan Keluaran Dalam Negeri Kasar mengikut Jenis Aktiviti Ekonomi pada Harga Tetap 2010 (Sambungan)
Gross Domestic Product Growth Rates by Kind of Economic Activity at Constant 2010 Prices (Continued)
Jenis Aktiviti EkonomiKind of Economic Activity 2014 2015 2016 2017 2018
Sektor PerkhidmatanServices Sector
0.6 (1.1) (1.7) 1.1 0.8
PengangkutandanPenyimpananTransport and Storage
(4.3) (4.1) (9.1) 4.6 (0.3)
PerhubunganCommunication
(3.4) 1.9 3.5 0.9 (1.1)
PerdaganganBorongdanRuncitWholesale and Retail Trade
(1.7) 0.9 (3.5) 0.7 2.3
KewanganFinance
(0.8) 0.5 9.4 1.5 (6.7)
HartanahdanPemilikanTempatKediamanReal Estate and Ownership of Dwellings
2.2 2.9 1.9 2.7 2.4
Lain-lainPerkhidmatandalamSektorSwastaOther Services in Private Sector
(1.4) 1.5 (6.0) (1.0) 1.1
PerkhidmatanKerajaanGovernment Services
4.7 (5.6) (2.7) 1.6 3.4
Nilai Tambah Kasar pada Harga AsasGross Value Added at Basic Price
(2.5) (0.4) (2.5) 1.3 0.1
CukaiTolakSubsidikeatasPengeluaranTaxes Less Subsidies on Product
(2.5) (0.4) (2.5) 1.3 0.1
Keluaran Dalam Negeri KasarGross Domestic Product (2.5) (0.4) (2.5) 1.3 0.1
Peratus/Per cent
Sumber:JabatanPerancangandanKemajuanEkonomi,KementerianKewangandanEkonomiSource : Department of Economic Planning and Development, Ministry of Finance and Economy
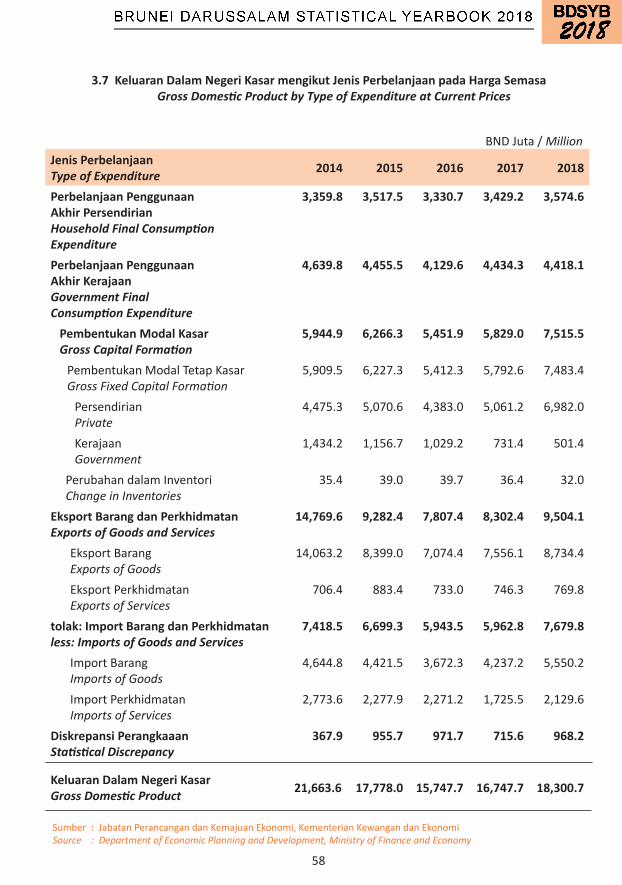
58
3.7 Keluaran Dalam Negeri Kasar mengikut Jenis Perbelanjaan pada Harga Semasa Gross Domestic Product by Type of Expenditure at Current Prices
Jenis PerbelanjaanType of Expenditure 2014 2015 2016 2017 2018
Perbelanjaan Penggunaan Akhir PersendirianHousehold Final Consumption Expenditure
3,359.8 3,517.5 3,330.7 3,429.2 3,574.6
Perbelanjaan Penggunaan Akhir KerajaanGovernment Final Consumption Expenditure
4,639.8 4,455.5 4,129.6 4,434.3 4,418.1
Pembentukan Modal Kasar Gross Capital Formation
5,944.9 6,266.3 5,451.9 5,829.0 7,515.5
PembentukanModalTetapKasar Gross Fixed Capital Formation
5,909.5 6,227.3 5,412.3 5,792.6 7,483.4
Persendirian Private
4,475.3 5,070.6 4,383.0 5,061.2 6,982.0
Kerajaan Government
1,434.2 1,156.7 1,029.2 731.4 501.4
PerubahandalamInventori Change in Inventories
35.4 39.0 39.7 36.4 32.0
Eksport Barang dan PerkhidmatanExports of Goods and Services
14,769.6 9,282.4 7,807.4 8,302.4 9,504.1
EksportBarang Exports of Goods
14,063.2 8,399.0 7,074.4 7,556.1 8,734.4
EksportPerkhidmatan Exports of Services
706.4 883.4 733.0 746.3 769.8
tolak: Import Barang dan Perkhidmatanless: Imports of Goods and Services
7,418.5 6,699.3 5,943.5 5,962.8 7,679.8
ImportBarang Imports of Goods
4,644.8 4,421.5 3,672.3 4,237.2 5,550.2
ImportPerkhidmatan Imports of Services
2,773.6 2,277.9 2,271.2 1,725.5 2,129.6
Diskrepansi PerangkaaanStatistical Discrepancy
367.9 955.7 971.7 715.6 968.2
Keluaran Dalam Negeri KasarGross Domestic Product 21,663.6 17,778.0 15,747.7 16,747.7 18,300.7
BNDJuta/ Million
Sumber:JabatanPerancangandanKemajuanEkonomi,KementerianKewangandanEkonomiSource : Department of Economic Planning and Development, Ministry of Finance and Economy

59
3.8 Peratus Agihan Keluaran Dalam Negeri Kasar mengikut Jenis Perbelanjaan pada Harga Semasa Gross Domestic Product Per Cent Distribution by Type of Expenditure at Current Prices
Peratus/ Per centJenis PerbelanjaanType of Expenditure 2014 2015 2016 2017 2018
Perbelanjaan Penggunaan Akhir PersendirianHousehold Final Consumption Expenditure
15.5 19.8 21.2 20.5 19.5
Perbelanjaan Penggunaan Akhir KerajaanGovernment Final Consumption Expenditure
21.4 25.1 26.2 26.5 24.1
Pembentukan Modal Kasar Gross Capital Formation
27.4 35.2 34.6 34.8 41.1
PembentukanModalTetapKasar Gross Fixed Capital Formation
27.3 35.0 34.4 34.6 40.9
Persendirian Private
20.7 28.5 27.8 30.2 38.2
Kerajaan Government
6.6 6.5 6.5 4.4 2.7
PerubahandalamInventori Change in Inventories
0.2 0.2 0.3 0.2 0.2
Eksport Barang dan PerkhidmatanExports of Goods and Services
68.2 52.2 49.6 49.6 51.9
EksportBarang Exports of Goods
64.9 47.2 44.9 45.1 47.7
EksportPerkhidmatan Exports of Services
3.3 5.0 4.7 4.5 4.2
tolak: Import Barang dan Perkhidmatanless: Imports of Goods and Services
34.2 37.7 37.7 35.6 42.0
ImportBarang Imports of Goods
21.4 24.9 23.3 25.3 30.3
ImportPerkhidmatanImports of Services
12.8 12.8 14.4 10.3 11.6
Diskrepansi PerangkaaanStatistical Discrepancy
1.7 5.4 6.2 4.3 5.3
Keluaran Dalam Negeri KasarGross Domestic Product 100.0 100.0 100.0 100.0 100.0
Sumber:JabatanPerancangandanKemajuanEkonomi,KementerianKewangandanEkonomiSource : Department of Economic Planning and Development, Ministry of Finance and Economy

60
Jenis PerbelanjaanType of Expenditure 2014 2015 2016 2017 2018
Perbelanjaan Penggunaan Akhir PersendirianHousehold Final Consumption Expenditure
3,215.8 3,383.9 3,339.3 3,497.1 3,573.4
Perbelanjaan Penggunaan Akhir KerajaanGovernment Final Consumption Expenditure
4,620.0 4,454.5 4,166.7 4,476.1 4,547.3
Pembentukan Modal Kasar Gross Capital Formation
6,022.1 6,416.6 5,704.7 6,159.8 7,888.6
PembentukanModalTetapKasar Gross Fixed Capital Formation
5,986.3 6,376.9 5,664.1 6,122.4 7,855.6
Persendirian Private
4,529.8 5,186.4 4,574.0 5,330.0 7,312.5
Kerajaan Government
1,456.6 1,190.5 1,090.1 792.3 543.1
PerubahandalamInventori Change in Inventories
35.7 39.7 40.6 37.5 33.0
Eksport Barang dan PerkhidmatanExports of Goods and Services
11,655.1 10,495.6 10,297.1 9,747.7 10,303.8
EksportBarang Exports of Goods
10,952.1 9,612.4 9,550.5 8,985.6 9,519.5
EksportPerkhidmatan Exports of Services
703.1 883.2 746.6 762.1 784.2
tolak: Import Barang dan Perkhidmatanless: Imports of Goods and Services
7,444.3 6,780.3 6,047.8 6,125.5 7,845.1
ImportBarang Imports of Goods
4,683.4 4,502.9 3,759.9 4,363.6 5,675.7
ImportPerkhidmatan Imports of Services
2,761.0 2,277.4 2,287.9 1,761.9 2,169.5
Diskrepansi PerangkaaanStatistical Discrepancy
602.0 627.1 676.5 622.4 (80.8)
Keluaran Dalam Negeri KasarGross Domestic Product 18,670.6 18,597.4 18,136.5 18,377.5 18,387.1
3.9 Keluaran Dalam Negeri Kasar mengikut Jenis Perbelanjaan pada Harga Tetap 2010 Gross Domestic Product by Type of Expenditure at Constant 2010 Prices
BNDJuta/ Million
Sumber:JabatanPerancangandanKemajuanEkonomi,KementerianKewangandanEkonomiSource : Department of Economic Planning and Development, Ministry of Finance and Economy

61
Jenis PerbelanjaanType of Expenditure 2014 2015 2016 2017 2018
Perbelanjaan Penggunaan Akhir PersendirianHousehold Final Consumption Expenditure
(3.7) 5.2 (1.3) 4.7 2.2
Perbelanjaan Penggunaan Akhir KerajaanGovernment Final Consumption Expenditure
1.9 (3.6) (6.5) 7.4 1.6
Pembentukan Modal Kasar Gross Capital Formation
(31.2) 6.6 (11.1) 8.0 28.1
PembentukanModalTetapKasar Gross Fixed Capital Formation
(31.3) 6.5 (11.2) 8.1 28.3
Persendirian Private
(35.5) 14.5 (11.8) 16.5 37.2
Kerajaan Government
(14.2) (18.3) (8.4) (27.3) (31.5)
PerubahandalamInventori Change in Inventories
16.9 11.2 2.2 (7.7) (11.9)
Eksport Barang dan PerkhidmatanExports of Goods and Services
(0.1) (9.9) (1.9) (5.3) 5.7
EksportBarang Exports of Goods
(0.9) (12.2) (0.6) (5.9) 5.9
EksportPerkhidmatan Exports of Services
14.8 25.6 (15.5) 2.1 2.9
tolak: Import Barang dan Perkhidmatanless: Imports of Goods and Services
(22.9) (8.9) (10.8) 1.3 28.1
ImportBarang Imports of Goods
(23.2) (3.9) (16.5) 16.1 30.1
ImportPerkhidmatan Imports of Services
(22.3) (17.5) 0.5 (23.0) 23.1
Keluaran Dalam Negeri KasarGross Domestic Product (2.5) (0.4) (2.5) 1.3 0.1
3.10 Kadar Pertumbuhan Keluaran Dalam Negeri Kasar mengikut Jenis Perbelanjaan pada Harga Tetap 2010
Gross Domestic Product Growth Rates by Type of Expenditure at Constant 2010 Prices
Peratus/ Per cent
Sumber:JabatanPerancangandanKemajuanEkonomi,KementerianKewangandanEkonomiSource : Department of Economic Planning and Development, Ministry of Finance and Economy
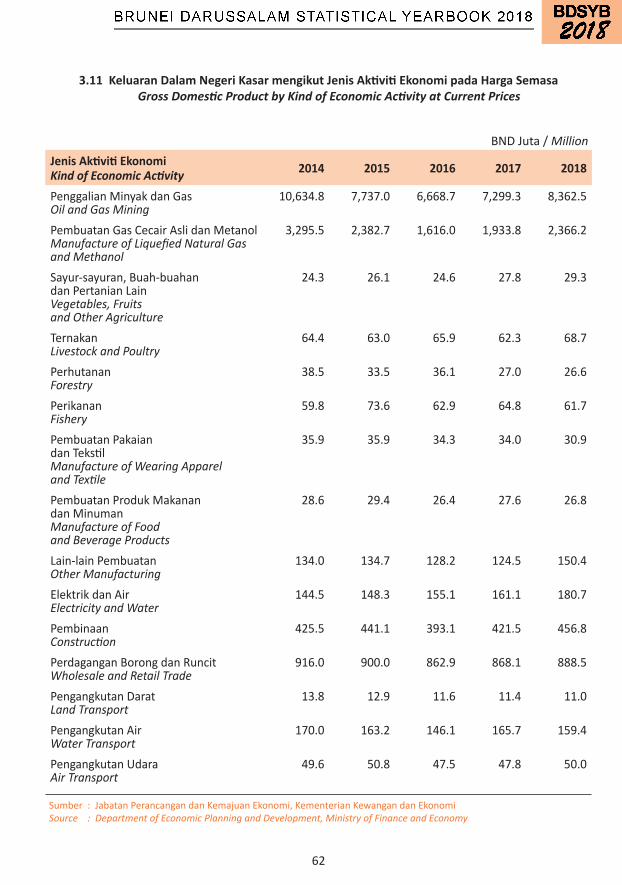
62
3.11 Keluaran Dalam Negeri Kasar mengikut Jenis Aktiviti Ekonomi pada Harga Semasa Gross Domestic Product by Kind of Economic Activity at Current Prices
Jenis Aktiviti EkonomiKind of Economic Activity 2014 2015 2016 2017 2018
PenggalianMinyakdanGasOil and Gas Mining
10,634.8 7,737.0 6,668.7 7,299.3 8,362.5
PembuatanGasCecairAslidanMetanolManufacture of Liquefied Natural Gas and Methanol
3,295.5 2,382.7 1,616.0 1,933.8 2,366.2
Sayur-sayuran,Buah-buahandanPertanianLainVegetables, Fruits and Other Agriculture
24.3 26.1 24.6 27.8 29.3
TernakanLivestock and Poultry
64.4 63.0 65.9 62.3 68.7
PerhutananForestry
38.5 33.5 36.1 27.0 26.6
PerikananFishery
59.8 73.6 62.9 64.8 61.7
PembuatanPakaiandanTekstilManufacture of Wearing Apparel and Textile
35.9 35.9 34.3 34.0 30.9
PembuatanProdukMakanandanMinumanManufacture of Food and Beverage Products
28.6 29.4 26.4 27.6 26.8
Lain-lainPembuatanOther Manufacturing
134.0 134.7 128.2 124.5 150.4
ElektrikdanAirElectricity and Water
144.5 148.3 155.1 161.1 180.7
PembinaanConstruction
425.5 441.1 393.1 421.5 456.8
PerdaganganBorongdanRuncitWholesale and Retail Trade
916.0 900.0 862.9 868.1 888.5
PengangkutanDaratLand Transport
13.8 12.9 11.6 11.4 11.0
PengangkutanAirWater Transport
170.0 163.2 146.1 165.7 159.4
PengangkutanUdaraAir Transport
49.6 50.8 47.5 47.8 50.0
BNDJuta/Million
Sumber:JabatanPerancangandanKemajuanEkonomi,KementerianKewangandanEkonomiSource : Department of Economic Planning and Development, Ministry of Finance and Economy
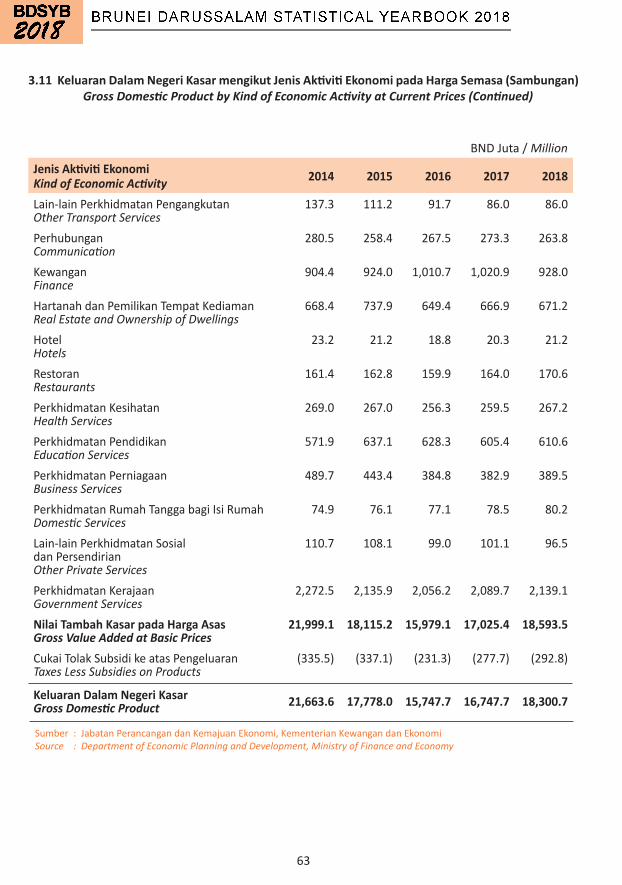
63
3.11 Keluaran Dalam Negeri Kasar mengikut Jenis Aktiviti Ekonomi pada Harga Semasa (Sambungan) Gross Domestic Product by Kind of Economic Activity at Current Prices (Continued)
Jenis Aktiviti EkonomiKind of Economic Activity 2014 2015 2016 2017 2018
Lain-lainPerkhidmatanPengangkutanOther Transport Services
137.3 111.2 91.7 86.0 86.0
PerhubunganCommunication
280.5 258.4 267.5 273.3 263.8
KewanganFinance
904.4 924.0 1,010.7 1,020.9 928.0
HartanahdanPemilikanTempatKediamanReal Estate and Ownership of Dwellings
668.4 737.9 649.4 666.9 671.2
HotelHotels
23.2 21.2 18.8 20.3 21.2
RestoranRestaurants
161.4 162.8 159.9 164.0 170.6
PerkhidmatanKesihatanHealth Services
269.0 267.0 256.3 259.5 267.2
PerkhidmatanPendidikanEducation Services
571.9 637.1 628.3 605.4 610.6
PerkhidmatanPerniagaanBusiness Services
489.7 443.4 384.8 382.9 389.5
PerkhidmatanRumahTanggabagiIsiRumahDomestic Services
74.9 76.1 77.1 78.5 80.2
Lain-lainPerkhidmatanSosialdanPersendirianOther Private Services
110.7 108.1 99.0 101.1 96.5
PerkhidmatanKerajaanGovernment Services
2,272.5 2,135.9 2,056.2 2,089.7 2,139.1
Nilai Tambah Kasar pada Harga AsasGross Value Added at Basic Prices
21,999.1 18,115.2 15,979.1 17,025.4 18,593.5
CukaiTolakSubsidikeatasPengeluaranTaxes Less Subsidies on Products
(335.5) (337.1) (231.3) (277.7) (292.8)
Keluaran Dalam Negeri KasarGross Domestic Product 21,663.6 17,778.0 15,747.7 16,747.7 18,300.7
BNDJuta/Million
Sumber:JabatanPerancangandanKemajuanEkonomi,KementerianKewangandanEkonomiSource : Department of Economic Planning and Development, Ministry of Finance and Economy
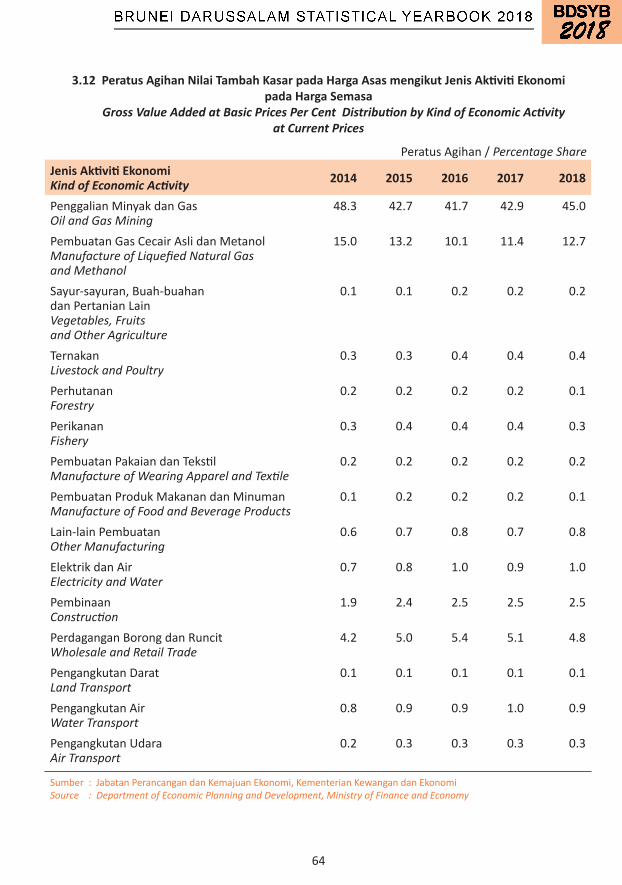
64
3.12 Peratus Agihan Nilai Tambah Kasar pada Harga Asas mengikut Jenis Aktiviti Ekonomi pada Harga Semasa
Gross Value Added at Basic Prices Per Cent Distribution by Kind of Economic Activity at Current Prices
PeratusAgihan/Percentage ShareJenis Aktiviti EkonomiKind of Economic Activity 2014 2015 2016 2017 2018
PenggalianMinyakdanGasOil and Gas Mining
48.3 42.7 41.7 42.9 45.0
PembuatanGasCecairAslidanMetanolManufacture of Liquefied Natural Gas and Methanol
15.0 13.2 10.1 11.4 12.7
Sayur-sayuran,Buah-buahandanPertanianLainVegetables, Fruits and Other Agriculture
0.1 0.1 0.2 0.2 0.2
TernakanLivestock and Poultry
0.3 0.3 0.4 0.4 0.4
PerhutananForestry
0.2 0.2 0.2 0.2 0.1
PerikananFishery
0.3 0.4 0.4 0.4 0.3
PembuatanPakaiandanTekstilManufacture of Wearing Apparel and Textile
0.2 0.2 0.2 0.2 0.2
PembuatanProdukMakanandanMinumanManufacture of Food and Beverage Products
0.1 0.2 0.2 0.2 0.1
Lain-lainPembuatanOther Manufacturing
0.6 0.7 0.8 0.7 0.8
ElektrikdanAirElectricity and Water
0.7 0.8 1.0 0.9 1.0
PembinaanConstruction
1.9 2.4 2.5 2.5 2.5
PerdaganganBorongdanRuncitWholesale and Retail Trade
4.2 5.0 5.4 5.1 4.8
PengangkutanDaratLand Transport
0.1 0.1 0.1 0.1 0.1
PengangkutanAirWater Transport
0.8 0.9 0.9 1.0 0.9
PengangkutanUdaraAir Transport
0.2 0.3 0.3 0.3 0.3
Sumber:JabatanPerancangandanKemajuanEkonomi,KementerianKewangandanEkonomiSource : Department of Economic Planning and Development, Ministry of Finance and Economy

65
PeratusAgihan/Percentage Share
Jenis Aktiviti EkonomiKind of Economic Activity 2014 2015 2016 2017 2018
Lain-lainPerkhidmatanPengangkutanOther Transport Services
0.6 0.6 0.6 0.5 0.5
PerhubunganCommunication
1.3 1.4 1.7 1.6 1.4
KewanganFinance
4.1 5.1 6.3 6.0 5.0
HartanahdanPemilikanTempatKediamanReal Estate and Ownership of Dwellings
3.0 4.1 4.1 3.9 3.6
HotelHotels
0.1 0.1 0.1 0.1 0.1
RestoranRestaurants
0.7 0.9 1.0 1.0 0.9
PerkhidmatanKesihatanHealth Services
1.2 1.5 1.6 1.5 1.4
PerkhidmatanPendidikanEducation Services
2.6 3.5 3.9 3.6 3.3
PerkhidmatanPerniagaanBusiness Services
2.2 2.4 2.4 2.2 2.1
PerkhidmatanRumahTanggabagiIsiRumahDomestic Services
0.3 0.4 0.5 0.5 0.4
Lain-lainPerkhidmatanSosialdanPersendirianOther Private Services
0.5 0.6 0.6 0.6 0.5
PerkhidmatanKerajaanGovernment Services
10.3 11.8 12.9 12.3 11.5
Nilai Tambah Kasar pada Harga AsasGross Value Added at Basic Prices 100.0 100.0 100.0 100.0 100.0
Sumber:JabatanPerancangandanKemajuanEkonomi,KementerianKewangandanEkonomiSource : Department of Economic Planning and Development, Ministry of Finance and Economy
3.12 Peratus Agihan Nilai Tambah Kasar pada Harga Asas mengikut Jenis Aktiviti Ekonomi pada Harga Semasa (Sambungan)
Gross Value Added at Basic Prices Per Cent Distribution by Kind of Economic Activity at Current Prices (Continued)

66
3.13 Keluaran Dalam Negeri Kasar mengikut Jenis Aktiviti Ekonomi pada Harga Tetap 2010 Gross Domestic Product by Kind of Economic Activity at Constant 2010 Prices
Jenis Aktiviti EkonomiKind of Economic Activity 2014 2015 2016 2017 2018
PenggalianMinyakdanGasOil and Gas Mining
8,537.3 8,444.4 8,140.0 8,022.5 7,950.0
PembuatanGasCecairAslidanMetanolManufacture of Liquefied Natural Gas and Methanol
2,462.2 2,528.5 2,521.4 2,767.2 2,719.9
Sayur-sayuran,Buah-buahandanPertanianLainVegetables, Fruits and Other Agriculture
21.2 23.3 22.9 24.7 24.6
TernakanLivestock and Poultry
62.0 61.8 63.1 62.1 64.7
PerhutananForestry
15.7 13.8 15.0 11.3 11.1
PerikananFishery
50.4 60.0 52.2 52.7 48.0
PembuatanPakaiandanTekstilManufacture of Wearing Apparel and Textile
37.5 38.6 37.7 38.1 36.6
PembuatanProdukMakanandanMinumanManufacture of Food and Beverage Products
28.6 29.2 26.4 27.7 26.5
Lain-lainPembuatanOther Manufacturing
142.2 138.2 129.4 127.5 160.1
ElektrikdanAirElectricity and Water
148.3 152.4 159.6 165.3 185.0
PembinaanConstruction
434.0 454.7 424.5 464.1 492.1
PerdaganganBorongdanRuncitWholesale and Retail Trade
917.0 925.2 893.0 899.1 919.4
PengangkutanDaratLand Transport
13.8 12.9 11.6 11.4 11.2
PengangkutanAirWater Transport
170.0 164.8 149.1 169.1 164.3
PengangkutanUdaraAir Transport
64.7 76.1 76.8 76.2 80.0
BNDJuta/Million
Sumber:JabatanPerancangandanKemajuanEkonomi,KementerianKewangandanEkonomiSource : Department of Economic Planning and Development, Ministry of Finance and Economy
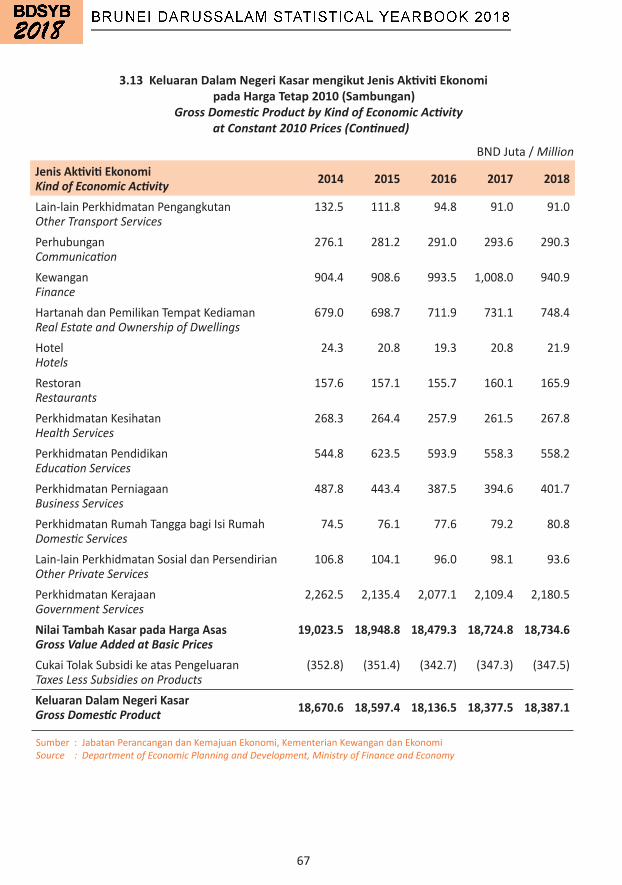
67
3.13 Keluaran Dalam Negeri Kasar mengikut Jenis Aktiviti Ekonomi pada Harga Tetap 2010 (Sambungan)
Gross Domestic Product by Kind of Economic Activity at Constant 2010 Prices (Continued)
Jenis Aktiviti EkonomiKind of Economic Activity 2014 2015 2016 2017 2018
Lain-lainPerkhidmatanPengangkutanOther Transport Services
132.5 111.8 94.8 91.0 91.0
PerhubunganCommunication
276.1 281.2 291.0 293.6 290.3
KewanganFinance
904.4 908.6 993.5 1,008.0 940.9
HartanahdanPemilikanTempatKediamanReal Estate and Ownership of Dwellings
679.0 698.7 711.9 731.1 748.4
HotelHotels
24.3 20.8 19.3 20.8 21.9
RestoranRestaurants
157.6 157.1 155.7 160.1 165.9
PerkhidmatanKesihatanHealth Services
268.3 264.4 257.9 261.5 267.8
PerkhidmatanPendidikanEducation Services
544.8 623.5 593.9 558.3 558.2
PerkhidmatanPerniagaanBusiness Services
487.8 443.4 387.5 394.6 401.7
PerkhidmatanRumahTanggabagiIsiRumahDomestic Services
74.5 76.1 77.6 79.2 80.8
Lain-lainPerkhidmatanSosialdanPersendirianOther Private Services
106.8 104.1 96.0 98.1 93.6
PerkhidmatanKerajaanGovernment Services
2,262.5 2,135.4 2,077.1 2,109.4 2,180.5
Nilai Tambah Kasar pada Harga AsasGross Value Added at Basic Prices
19,023.5 18,948.8 18,479.3 18,724.8 18,734.6
CukaiTolakSubsidikeatasPengeluaranTaxes Less Subsidies on Products
(352.8) (351.4) (342.7) (347.3) (347.5)
Keluaran Dalam Negeri KasarGross Domestic Product 18,670.6 18,597.4 18,136.5 18,377.5 18,387.1
BNDJuta/Million
Sumber:JabatanPerancangandanKemajuanEkonomi,KementerianKewangandanEkonomiSource : Department of Economic Planning and Development, Ministry of Finance and Economy
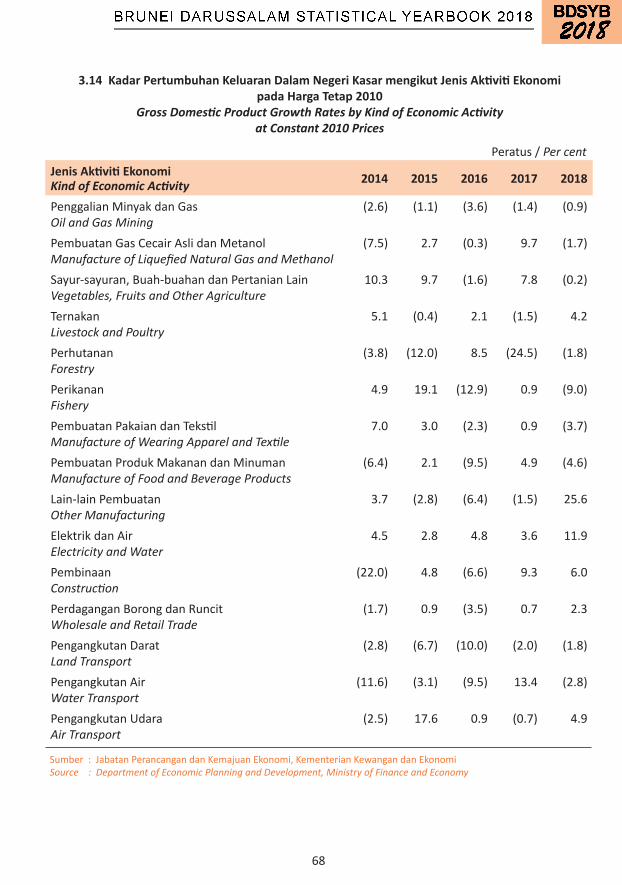
68
3.14 Kadar Pertumbuhan Keluaran Dalam Negeri Kasar mengikut Jenis Aktiviti Ekonomi pada Harga Tetap 2010
Gross Domestic Product Growth Rates by Kind of Economic Activity at Constant 2010 Prices
Peratus/Per cent Jenis Aktiviti EkonomiKind of Economic Activity 2014 2015 2016 2017 2018
PenggalianMinyakdanGasOil and Gas Mining
(2.6) (1.1) (3.6) (1.4) (0.9)
PembuatanGasCecairAslidanMetanolManufacture of Liquefied Natural Gas and Methanol
(7.5) 2.7 (0.3) 9.7 (1.7)
Sayur-sayuran,Buah-buahandanPertanianLainVegetables, Fruits and Other Agriculture
10.3 9.7 (1.6) 7.8 (0.2)
TernakanLivestock and Poultry
5.1 (0.4) 2.1 (1.5) 4.2
PerhutananForestry
(3.8) (12.0) 8.5 (24.5) (1.8)
PerikananFishery
4.9 19.1 (12.9) 0.9 (9.0)
PembuatanPakaiandanTekstilManufacture of Wearing Apparel and Textile
7.0 3.0 (2.3) 0.9 (3.7)
PembuatanProdukMakanandanMinumanManufacture of Food and Beverage Products
(6.4) 2.1 (9.5) 4.9 (4.6)
Lain-lainPembuatanOther Manufacturing
3.7 (2.8) (6.4) (1.5) 25.6
ElektrikdanAirElectricity and Water
4.5 2.8 4.8 3.6 11.9
PembinaanConstruction
(22.0) 4.8 (6.6) 9.3 6.0
PerdaganganBorongdanRuncitWholesale and Retail Trade
(1.7) 0.9 (3.5) 0.7 2.3
PengangkutanDaratLand Transport
(2.8) (6.7) (10.0) (2.0) (1.8)
PengangkutanAirWater Transport
(11.6) (3.1) (9.5) 13.4 (2.8)
PengangkutanUdaraAir Transport
(2.5) 17.6 0.9 (0.7) 4.9
Sumber:JabatanPerancangandanKemajuanEkonomi,KementerianKewangandanEkonomiSource : Department of Economic Planning and Development, Ministry of Finance and Economy

69
Peratus/Per cent Jenis Aktiviti EkonomiKind of Economic Activity 2014 2015 2016 2017 2018
Lain-lainPerkhidmatanPengangkutanOther Transport Services
5.5 (15.6) (15.2) (4.1) 0.0
PerhubunganCommunication
(3.4) 1.9 3.5 0.9 (1.1)
KewanganFinance
(0.8) 0.5 9.4 1.5 (6.7)
HartanahdanPemilikanTempatKediamanReal Estate and Ownership of Dwellings
2.2 2.9 1.9 2.7 2.4
HotelHotels
(16.0) (14.4) (6.9) 7.4 5.3
RestoranRestaurants
1.8 (0.3) (0.9) 2.8 3.6
PerkhidmatanKesihatanHealth Services
6.3 (1.5) (2.4) 1.4 2.4
PerkhidmatanPendidikanEducation Services
(0.9) 14.4 (4.7) (6.0) (0.0)
PerkhidmatanPerniagaanBusiness Services
(7.3) (9.1) (12.6) 1.8 1.8
PerkhidmatanRumahTanggabagiIsiRumahDomestic Services
2.0 2.0 2.0 2.0 2.0
Lain-lainPerkhidmatanSosialdanPersendirianOther Private Services
3.8 (2.5) (7.8) 2.2 (4.6)
PerkhidmatanKerajaanGovernment Services
4.7 (5.6) (2.7) 1.6 3.4
Nilai Tambah Kasar pada Harga AsasGross Value Added at Basic Prices
(2.5) (0.4) (2.5) 1.3 0.1
CukaiTolakSubsidikeatasPengeluaranTaxes Less Subsidies on Products
(2.5) (0.4) (2.5) 1.3 0.1
Keluaran Dalam Negeri KasarGross Domestic Product (2.5) (0.4) (2.5) 1.3 0.1
Sumber:JabatanPerancangandanKemajuanEkonomi,KementerianKewangandanEkonomiSource : Department of Economic Planning and Development, Ministry of Finance and Economy
3.14 Kadar Pertumbuhan Keluaran Dalam Negeri Kasar mengikut Jenis Aktiviti Ekonomi pada Harga Tetap 2010 (Sambungan)
Gross Domestic Product Growth Rates by Kind of Economic Activity at Constant 2010 Prices (Continued)
70
4 HARGA PRICES

71
Nota Keterangan
4 INDEKS HARGA PENGGUNA (IHP)
IndeksHargaPengguna(IHP)dikumpulkansecarabulananolehJabatanPerangkaan, JabatanPerancangandanKemajuanEkonomi,KementerianKewangandanEkonomi.
IHPmengukur perubahanharga pada sebakul tetap barangandanperkhidmatan yangdibeli oleh sebahagianbesarisirumahdiNegaraBruneiDarussalam.Ianyamengukurperubahanhargadarisatutempohrujukandikenalisebagaitempohtahunasas.Indekspadatempohtahunasasditetapkandengannilaiindeks100danperubahanhargapadatempohmasaberikutnyadikiradengandihubungkandengannilaiindeksini.TempohtahunasasbagiIHPmasainiialahtahun2015(Jan2015=100).
IHP digunakan secara meluas bagi mengukur kadar inflasi sesebuah negara. Kadar inflasi adalah perubahanperatus dalam IHP dari satu tempoh ke tempoh yang lain. Kadar inflasi boleh dikira secara bulan-ke-bulan,tahun-ke-tahundantempoh-ke-tempoh.Kadarinflasitahun-ke-tahun,misalnya,adalahperatusperubahanIHPpadabulandibawahkajiandenganIHPpadabulansebelumnya.
Bakul IHPmengandungi barangan dan perkhidmatan yang biasa dibayar sebahagian besar isi rumah. Jumlahbarangandanperkhidmatandalambakulmasainiadalah411.KewajaranditetapkanbagikesemuabarangandanperkhidmatanIHPpadasemuaperingkatyangmenunjukkankepentingansesuatubarangandanperkhidmatan.Barangan dan perkhidmatan yang penting biasanyamempunyai kewajaran yangtinggi danmempunyai kesanyangbesarpadakeseluruhannilaiIHPberbandingdenganyangkurangpenting.BakulIHPmasainidanpengiraankewajarannyaadalahberasaskankepadaKajianPerbelanjaanKeluarga(KPK)tahun2015.KlasifikasibarangandanperkhidmatanIHPdankewajaranadalahsepertiberikut:
Kumpulan Utama Kewajaran
•MakanandanMinumanRingan 1,883 •PakaiandanKasut 403 •Perumahan,Air,Elektrik,GasdanBahanApiLain 1,170 •Perhiasan,PerkakasanIsiRumahdanPenyelenggaraanRutinIsiRumah 702 •Kesihatan 91 •Pengangkutan 1,961 •Perhubungan 594 •RekreasidanKebudayaan 664 •Pendidikan 696 •RestorandanHotel 1,069 •PelbagaiBarangandanPerkhidmatan 767
Jumlah 10,000
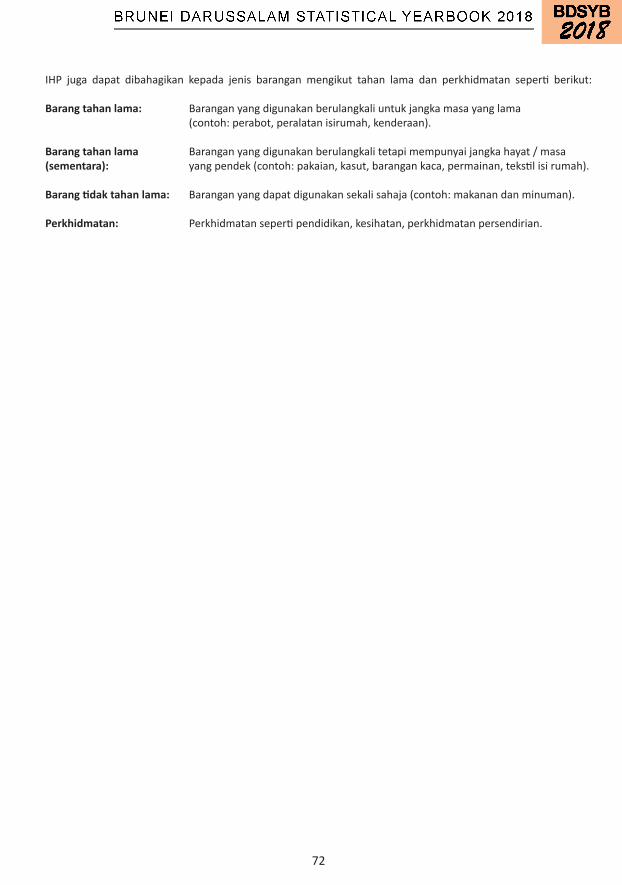
72
IHP juga dapat dibahagikan kepada jenis barangan mengikut tahan lama dan perkhidmatan seperti berikut:
Barang tahan lama: Baranganyangdigunakanberulangkaliuntukjangkamasayanglama (contoh:perabot,peralatanisirumah,kenderaan).
Barang tahan lama Baranganyangdigunakanberulangkalitetapimempunyaijangkahayat/masa(sementara): yangpendek(contoh:pakaian,kasut,barangankaca,permainan,tekstilisirumah).
Barang tidak tahan lama: Baranganyangdapatdigunakansekalisahaja(contoh:makanandanminuman).
Perkhidmatan: Perkhidmatansepertipendidikan,kesihatan,perkhidmatanpersendirian.
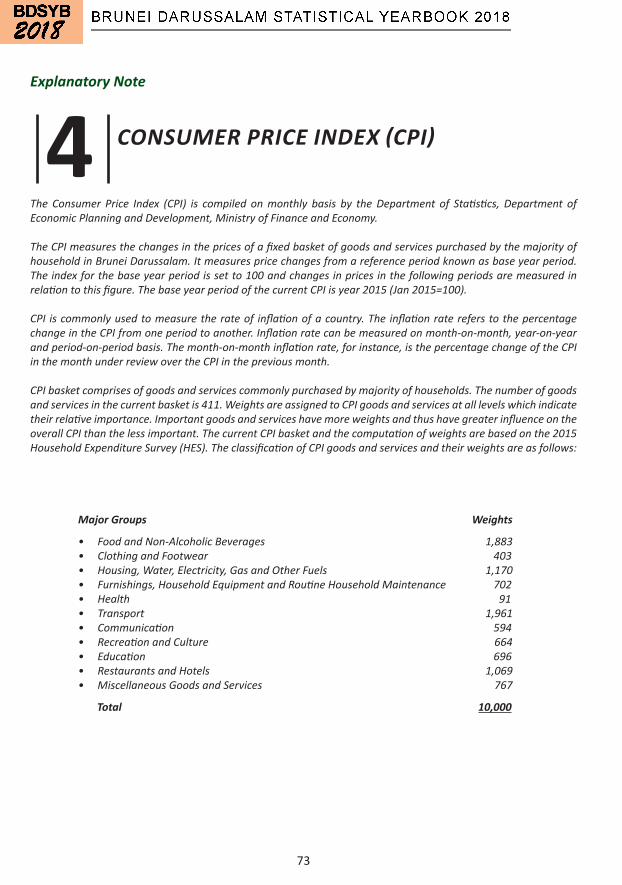
73
Explanatory Note
4 CONSUMER PRICE INDEX (CPI)
The Consumer Price Index (CPI) is compiled on monthly basis by the Department of Statistics, Department of Economic Planning and Development, Ministry of Finance and Economy.
The CPI measures the changes in the prices of a fixed basket of goods and services purchased by the majority of household in Brunei Darussalam. It measures price changes from a reference period known as base year period. The index for the base year period is set to 100 and changes in prices in the following periods are measured in relation to this figure. The base year period of the current CPI is year 2015 (Jan 2015=100).
CPI is commonly used to measure the rate of inflation of a country. The inflation rate refers to the percentage change in the CPI from one period to another. Inflation rate can be measured on month-on-month, year-on-year and period-on-period basis. The month-on-month inflation rate, for instance, is the percentage change of the CPI in the month under review over the CPI in the previous month.
CPI basket comprises of goods and services commonly purchased by majority of households. The number of goods and services in the current basket is 411. Weights are assigned to CPI goods and services at all levels which indicate their relative importance. Important goods and services have more weights and thus have greater influence on the overall CPI than the less important. The current CPI basket and the computation of weights are based on the 2015 Household Expenditure Survey (HES). The classification of CPI goods and services and their weights are as follows:
Major Groups Weights
• Food and Non-Alcoholic Beverages 1,883 • Clothing and Footwear 403 • Housing, Water, Electricity, Gas and Other Fuels 1,170 • Furnishings, Household Equipment and Routine Household Maintenance 702 • Health 91 • Transport 1,961 • Communication 594 • Recreation and Culture 664 • Education 696 • Restaurants and Hotels 1,069 • Miscellaneous Goods and Services 767
Total 10,000
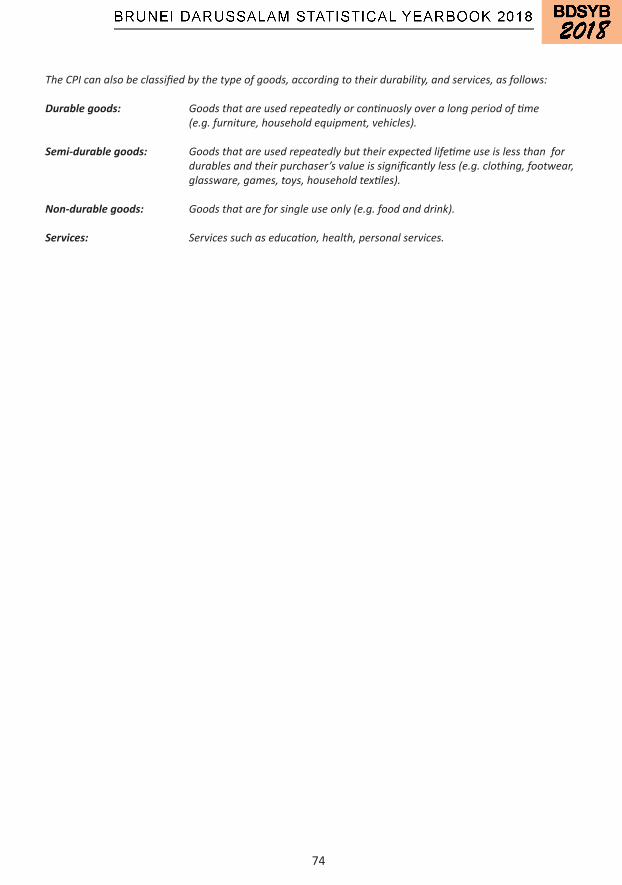
74
The CPI can also be classified by the type of goods, according to their durability, and services, as follows:
Durable goods: Goods that are used repeatedly or continuosly over a long period of time (e.g. furniture, household equipment, vehicles).
Semi-durable goods: Goods that are used repeatedly but their expected lifetime use is less than for durables and their purchaser’s value is significantly less (e.g. clothing, footwear, glassware, games, toys, household textiles).
Non-durable goods: Goods that are for single use only (e.g. food and drink).
Services: Services such as education, health, personal services.

75
4.1 Indeks Harga Pengguna Consumer Price Index
Sumber:JabatanPerancangandanKemajuanEkonomi,KementerianKewangandanEkonomiSource : Department of Economic Planning and Development, Ministry of Finance and Economy
Nota: TahunAsas(Jan2015=100)Note : Base Year (Jan 2015 = 100)
Keseluruhan Barangan dan PerkhidmatanAll Goods and Services
KewajaranWeight
TahunYear
2015 2016 2017 2018
IHP KeseluruhanOverall CPI
10,000 99.9 99.6 98.4 99.4
1 MakanandanMinumanRinganFood and Non-Alcoholic Beverages
1,883 100.8 100.3 100.5 101.8
2 PakaiandanKasutClothing and Footwear
403 104.4 103.7 102.1 102.5
3 Perumahan,Air,Elektrik,GasdanBahanApiLainHousing, Water, Electricity, Gas and Other Fuels
1,170 99.7 95.4 95.3 99.3
4 Perhiasan,PerkakasanIsiRumahdanPenyelenggaraanRutinIsiRumahFurnishing, Household Equipment and Routine Household Maintenance
702 101.5 101.8 101.3 100.4
5 KesihatanHealth
91 101.7 98.4 100.0 100.5
6 PengangkutanTransport
1,961 97.1 98.5 97.2 96.5
7 PerhubunganCommunication
594 100.0 99.7 99.5 99.4
8 RekreasidanKebudayaanRecreation and Culture
664 100.3 100.1 100.4 101.3
9 PendidikanEducation
696 100.5 102.4 102.4 102.9
10 RestorandanHotelRestaurants and Hotels
1,069 100.0 99.8 99.7 99.6
11 PelbagaiBarangandanPerkhidmatanMiscellaneous Goods and Services
767 100.2 100.1 87.6 99.5

76
4.2 Peratusan Perubahan Tahunan pada Indeks Harga Pengguna Annual Percentage Change in Consumer Price Index
Keseluruhan Barangan dan PerkhidmatanAll Goods and Services
KewajaranWeight
Perubahan Peratus (%) Percentage Change (%)
2015 2016 2017 2018
IHP KeseluruhanOverall CPI
10,000 - (0.3) (1.3) 1.0
1 MakanandanMinumanRinganFood and Non-Alcoholic Beverages
1,883 - (0.5) 0.3 1.9
2 PakaiandanKasutClothing and Footwear
403 - (0.7) (1.5) (2.8)
3 Perumahan,Air,Elektrik,GasdanBahanApiLainHousing, Water, Electricity, Gas and Other Fuels
1,170 - (4.2) (0.1) (0.3)
4 Perhiasan,PerkakasanIsiRumahdanPenyelenggaraanRutinIsiRumahFurnishing, Household Equipment and Routine Household Maintenance
702 - 0.3 (0.5) (0.9)
5 KesihatanHealth
91 - (3.2) 1.6 0.5
6 PengangkutanTransport
1,961 - 1.5 (1.3) (0.7)
7 PerhubunganCommunication
594 - (0.3) (0.1) (0.1)
8 RekreasidanKebudayaanRecreation and Culture
664 - (0.2) 0.3 0.9
9 PendidikanEducation
696 - 1.9 (0.002) 0.5
10 RestorandanHotelRestaurants and Hotels
1,069 - (0.3) (0.03) (0.1)
11 PelbagaiBarangandanPerkhidmatanMiscellaneous Goods and Services
767 - (0.03) (12.6) 13.6
Sumber:JabatanPerancangandanKemajuanEkonomi,KementerianKewangandanEkonomiSource : Department of Economic Planning and Development, Ministry of Finance and Economy
Nota: TahunAsas(Jan2015=100)Note : Base Year (Jan 2015 = 100)
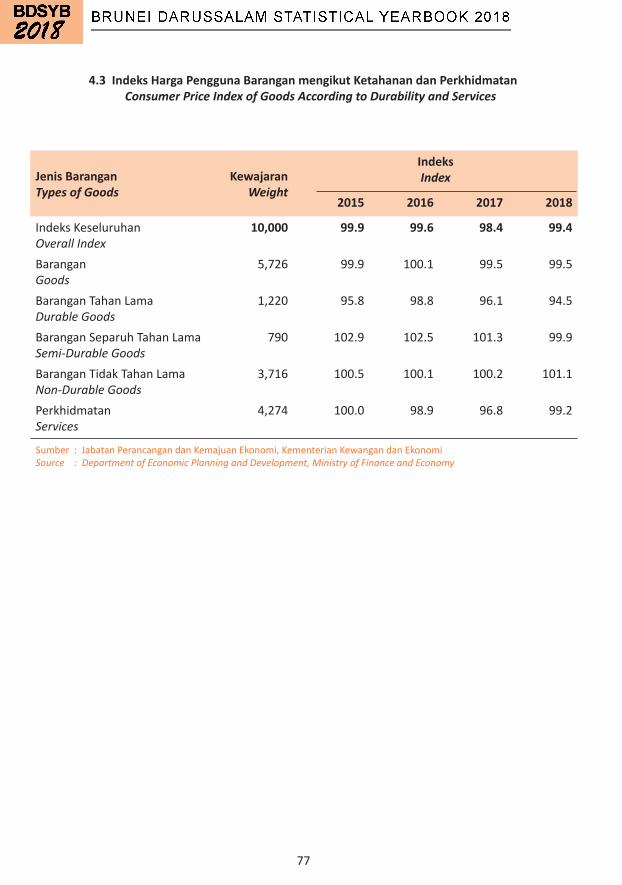
77
Sumber:JabatanPerancangandanKemajuanEkonomi,KementerianKewangandanEkonomiSource : Department of Economic Planning and Development, Ministry of Finance and Economy
Jenis BaranganTypes of Goods
KewajaranWeight
IndeksIndex
2015 2016 2017 2018
IndeksKeseluruhanOverall Index
10,000 99.9 99.6 98.4 99.4
BaranganGoods
5,726 99.9 100.1 99.5 99.5
BaranganTahanLamaDurable Goods
1,220 95.8 98.8 96.1 94.5
BaranganSeparuhTahanLamaSemi-Durable Goods
790 102.9 102.5 101.3 99.9
BaranganTidakTahanLamaNon-Durable Goods
3,716 100.5 100.1 100.2 101.1
PerkhidmatanServices
4,274 100.0 98.9 96.8 99.2
4.3 Indeks Harga Pengguna Barangan mengikut Ketahanan dan Perkhidmatan Consumer Price Index of Goods According to Durability and Services

78
4.4 Peratusan Perubahan Tahunan Indeks Harga Pengguna Barangan mengikut Ketahanan dan Perkhidmatan
Annual Percentage Change in Consumer Price Index of Goods According to Durability and Services
Sumber:JabatanPerancangandanKemajuanEkonomi,KementerianKewangandanEkonomiSource : Department of Economic Planning and Development, Ministry of Finance and Economy
Jenis BaranganTypes of Goods
KewajaranWeight
Perubahan Peratus (%) Percentage Change (%)
2015 2016 2017 2018
IndeksKeseluruhanOverall Index
10,000 - (0.3) (1.3) 1.0
BaranganGoods
5,726 - 0.3 (0.7) 0.02
BaranganTahanLamaDurable Goods
1,220 - 3.1 (2.7) (1.6)
BaranganSeparuhTahanLamaSemi-Durable Goods
790 - 0.4 (1.2) (1.3)
BaranganTidakTahanLamaNon-Durable Goods
3,716 - (0.4) 0.1 0.8
PerkhidmatanServices
4,274 - (1.0) (2.1) 2.4
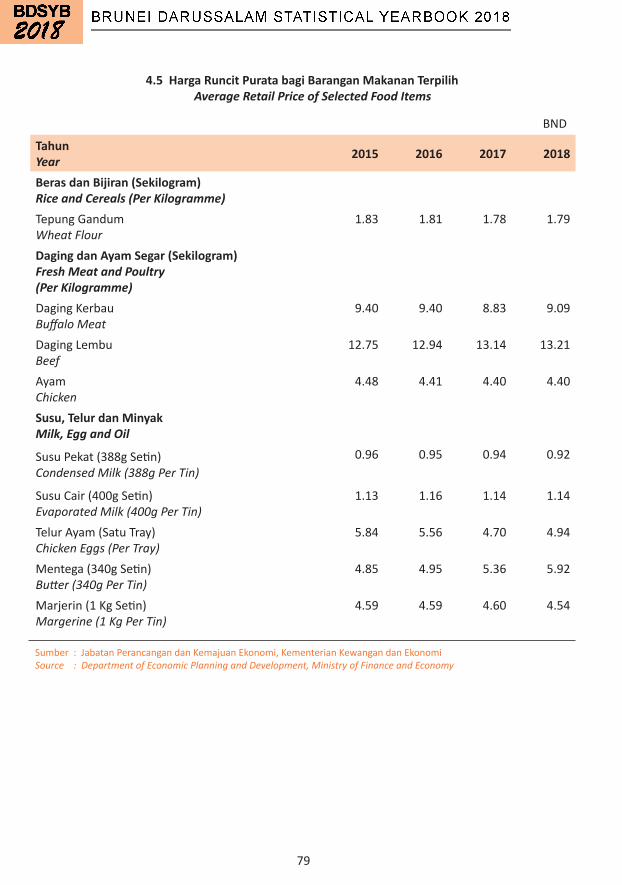
79
4.5 Harga Runcit Purata bagi Barangan Makanan Terpilih Average Retail Price of Selected Food Items
Sumber:JabatanPerancangandanKemajuanEkonomi,KementerianKewangandanEkonomiSource : Department of Economic Planning and Development, Ministry of Finance and Economy
BND
Tahun Year 2015 2016 2017 2018
Beras dan Bijiran (Sekilogram)Rice and Cereals (Per Kilogramme)TepungGandumWheat Flour
1.83 1.81 1.78 1.79
Daging dan Ayam Segar (Sekilogram)Fresh Meat and Poultry (Per Kilogramme)DagingKerbauBuffalo Meat
9.40 9.40 8.83 9.09
DagingLembuBeef
12.75 12.94 13.14 13.21
AyamChicken
4.48 4.41 4.40 4.40
Susu, Telur dan MinyakMilk, Egg and Oil
SusuPekat(388gSetin)Condensed Milk (388g Per Tin)
0.96 0.95 0.94 0.92
SusuCair(400gSetin)Evaporated Milk (400g Per Tin)
1.13 1.16 1.14 1.14
TelurAyam(SatuTray)Chicken Eggs (Per Tray)
5.84 5.56 4.70 4.94
Mentega(340gSetin)Butter (340g Per Tin)
4.85 4.95 5.36 5.92
Marjerin(1KgSetin)Margerine (1 Kg Per Tin)
4.59 4.59 4.60 4.54

80
4.5 Harga Runcit Purata bagi Barangan Makanan Terpilih (Sambungan) Average Retail Price of Selected Food Items (Continued)
Sumber:JabatanPerancangandanKemajuanEkonomi,KementerianKewangandanEkonomiSource : Department of Economic Planning and Development, Ministry of Finance and Economy
BND
Tahun Year 2015 2016 2017 2018
Ikan dan Udang (Sekilogram)Fish and Prawns (Per Kilogramme)IkanTenggiriSpanish Mackerel
9.65 9.62 9.73 10.46
IkanRumahanIndian Mackerel
4.96 4.88 5.03 5.21
IkanBilisPonyfish
3.06 2.97 3.06 3.23
PusuMasinSalted Anchovies
13.13 13.64 13.98 14.02
UdangSegar-BesarFresh Prawns - Large
13.43 13.03 13.17 14.64
UdangKeringDried Prawn
25.89 25.11 26.15 26.99
Sayur-Sayuran dan Buah-Buahan (Sekilogram)Vegetables and Fruits (Per Kilogramme)SawiPutihPak Choy
2.57 2.64 2.69 2.74
KacangPanjangLong Bean
2.88 2.88 2.84 2.94
TimunCucumber
1.47 1.45 1.39 1.47
BawangMerahShallot
2.82 2.75 2.45 3.42
BawangPutihGarlic
2.69 3.65 3.80 2.61
LadaSegarFresh Chillies
7.32 7.28 7.49 7.95
PisangBanana
1.86 1.90 1.85 1.86
BetikPapaya
1.35 1.40 1.29 1.27
TembikaiWatermelon
1.29 1.40 1.34 1.43

81
4.6 Harga Runcit Purata bagi Barangan Terpilih bagi Barangan Bukan MakananAverage Retail Price of Selected Non-Food Items
BND
Sumber:JabatanPerancangandanKemajuanEkonomi,KementerianKewangandanEkonomiSource : Department of Economic Planning and Development, Ministry of Finance and Economy
Tahun Year 2015 2016 2017 2018
Perumahan, Air, Elektrik, Gas dan Bahan Api LainHousing, Water, Electricity, Gas and Other FuelsSimen(10KilogramBeg)Cement (10 Kilogramme Bag)
9.50 9.67 9.95 9.71
BekalanAir(0-54.53Unit)Water Supply (0 - 54.53 Unit)
0.11 0.11 0.11 0.11
BekalanAir(54.54UnitdanKeAtas)Water Supply (54.54 Unit and Above)
0.44 0.44 0.44 0.44
ElektrikPrabayar(1-600KWj)Prepaid Electricity (1 - 600 KWh)
0.01 0.01 0.01 0.01
ElektrikPrabayar(601-2,000KWj)Prepaid Electricity (601 - 2,000 KWh)
0.08 0.08 0.08 0.08
ElektrikPrabayar(2,001-4,000KWj)Prepaid Electricity (2,001 - 4,000 KWh)
0.10 0.10 0.10 0.10
ElektrikPrabayar(4,001KWjdanKeAtas)Prepaid Electricity (4,001 KWh and Above)
0.12 0.12 0.12 0.12
GasPaipPiped Gas
5.00 5.00 5.00 5.00
GasTong(LPG)Cylinder Gas (LPG)
10.00 10.00 10.00 10.00
Pelbagai Barangan dan PerkhidmatanMiscellaneous Goods and ServicesPasportBiometrikAntarabangsaInternational Biometric Passport
60.00 60.00 60.00 60.00
PasportBiometrikBorneoBorneo Biometric Passport
35.00 35.00 35.00 35.00
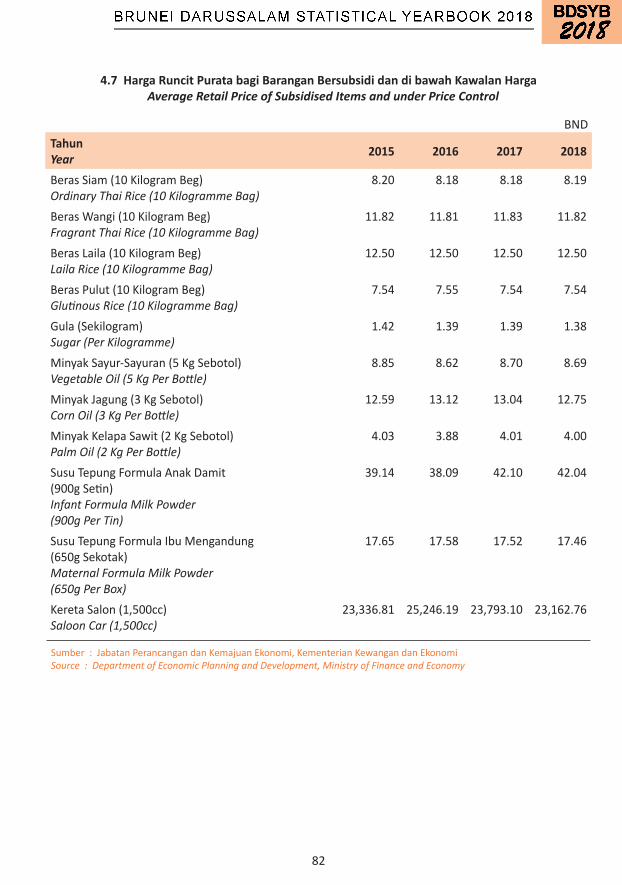
82
4.7 Harga Runcit Purata bagi Barangan Bersubsidi dan di bawah Kawalan Harga Average Retail Price of Subsidised Items and under Price Control
BND
Sumber:JabatanPerancangandanKemajuanEkonomi,KementerianKewangandanEkonomiSource : Department of Economic Planning and Development, Ministry of Finance and Economy
Tahun Year 2015 2016 2017 2018
BerasSiam(10KilogramBeg)Ordinary Thai Rice (10 Kilogramme Bag)
8.20 8.18 8.18 8.19
BerasWangi(10KilogramBeg)Fragrant Thai Rice (10 Kilogramme Bag)
11.82 11.81 11.83 11.82
BerasLaila(10KilogramBeg)Laila Rice (10 Kilogramme Bag)
12.50 12.50 12.50 12.50
BerasPulut(10KilogramBeg)Glutinous Rice (10 Kilogramme Bag)
7.54 7.55 7.54 7.54
Gula(Sekilogram)Sugar (Per Kilogramme)
1.42 1.39 1.39 1.38
MinyakSayur-Sayuran(5KgSebotol)Vegetable Oil (5 Kg Per Bottle)
8.85 8.62 8.70 8.69
MinyakJagung(3KgSebotol)Corn Oil (3 Kg Per Bottle)
12.59 13.12 13.04 12.75
MinyakKelapaSawit(2KgSebotol)Palm Oil (2 Kg Per Bottle)
4.03 3.88 4.01 4.00
SusuTepungFormulaAnakDamit(900gSetin)Infant Formula Milk Powder (900g Per Tin)
39.14 38.09 42.10 42.04
SusuTepungFormulaIbuMengandung(650gSekotak)Maternal Formula Milk Powder(650g Per Box)
17.65 17.58 17.52 17.46
KeretaSalon(1,500cc)Saloon Car (1,500cc)
23,336.81 25,246.19 23,793.10 23,162.76

5 IMBANGAN PEMBAYARANBALANCE OF PAYMENTS
84
Nota Keterangan
5 IMBANGAN PEMBAYARAN
Jabatan Perancangan dan Kemajuan Ekonomimelalui Jabatan Perangkaanmengumpul perangkaan ImbanganPembayaran(BOP)yangmanaianyameringkaskantransaksiekonomiantararesidenNegaraBruneiDarussalamdanbukanresiden.PerangkaanBOPmenyediakansaturangkakerjabersepaduuntukpenganalisaanekonomibagihubunganekonomiantarabangsa,initermasukprestasiekonomiantarabangsaNegaraBruneiDarussalam,polisikadarpertukaran,pengurusanrizabdanpendedahanluaran.
BOPNegaraBruneiDarussalamdikumpulmengikutpiawaianantarabangsayangditetapkandalamgarispanduImbangan Pembayaran, Edisi Keenam yang diterbitkan oleh Tabung Kewangan Antarabangsa (IMF). Transaksiekonomitermasuk:
•transaksieksportdanimportbarangandanperkhidmatan •transaksipendapatanutamakepadajumlahyangdibayardanditerimadalampulangan untukmenyediakanpenggunaansementarakepadaentitipekerjalain,sumber kewanganataubukanpengeluarbukankewanganaset •transaksipendapatanmenengahyangmenunjukkanpengagihansemulapendapatan •perolehandanpelupusanasetdanliabilitikewangan
BOPterdiridaripadaakaunbarangandanperkhidmatan,akaunpendapatanutama,akaunpendapatanmenengah,akaunmodaldanakaunkewangan.Transaksiantarabangsadirekodkandalamimbanganpembayaranadalahatasdasarprinsipcatatanbergandadigunakandalamperakaunanperniagaan,dimanasetiaptransaksimenimbulkandua penyertaan pengimbangan dengan nilai yang sama supaya dalam prinsip kredit dan debit yang terhasilpenyertaansentiasaseimbang.
85
Explanatory Note
5 BALANCE OF PAYMENTS
The Department of Economic Planning and Development through the Department of Statistics compiles Balance of Payments (BOP) statistics which summarises the economic transactions between residents of Brunei Darussalam and non-residents. The BOP statistics provide an integrated framework for the analysis of an economy’s international economic relationship, including Brunei Darussalam’s international economic performance, exchange rate policy, reserve management and external vulnerability.
The Brunei Darussalam’s BOP has been compiled in accordance with international standards set out in the Balance of Payments Manual, Sixth Edition published by the International Monetary Fund. The economic transactions include:
• transactions of exports and imports of goods and services • transactions of primary income on the amount of payable and receivable in return for providing temporary use to another entity of labour, financial resources or non-produced nonfinancial assets • transactions of secondary income which shows the redistribution of income • acquisition and disposal of financial assets and liabilities
The BOP consists of goods and services account, the primary income account, the secondary income account, the capital account and the financial account. International transactions are recorded in the balance of payments on the basis of the double-entry principle used in business accounting, in which each transaction gives rise to two offsetting entries of equal value so that in principle the resulting credit and debit entries always balance.
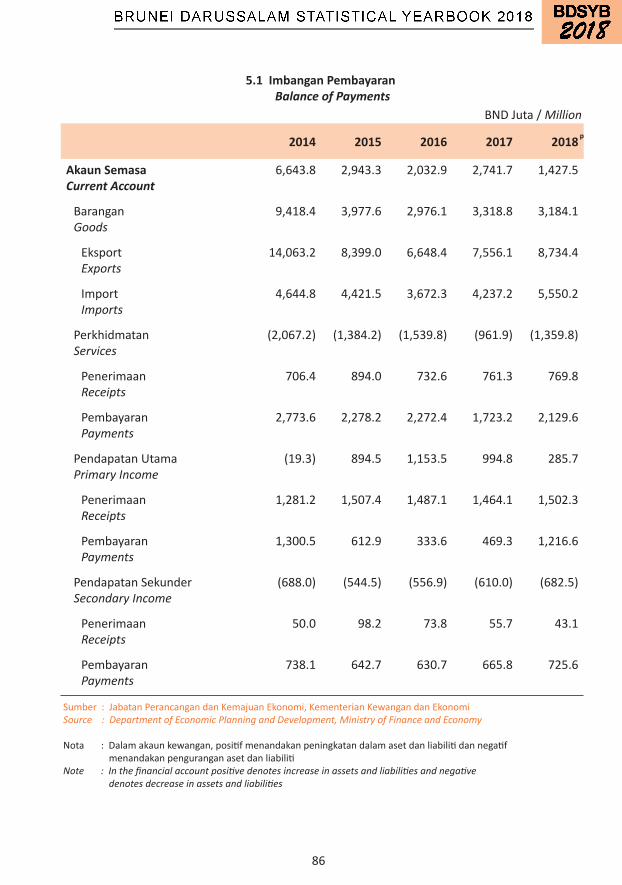
86
5.1 Imbangan Pembayaran Balance of Payments
BNDJuta/Million
2014 2015 2016 2017 2018
Akaun SemasaCurrent Account
6,643.8 2,943.3 2,032.9 2,741.7 1,427.5
BaranganGoods
9,418.4 3,977.6 2,976.1 3,318.8 3,184.1
EksportExports
14,063.2 8,399.0 6,648.4 7,556.1 8,734.4
ImportImports
4,644.8 4,421.5 3,672.3 4,237.2 5,550.2
PerkhidmatanServices
(2,067.2) (1,384.2) (1,539.8) (961.9) (1,359.8)
PenerimaanReceipts
706.4 894.0 732.6 761.3 769.8
PembayaranPayments
2,773.6 2,278.2 2,272.4 1,723.2 2,129.6
PendapatanUtamaPrimary Income
(19.3) 894.5 1,153.5 994.8 285.7
PenerimaanReceipts
1,281.2 1,507.4 1,487.1 1,464.1 1,502.3
PembayaranPayments
1,300.5 612.9 333.6 469.3 1,216.6
PendapatanSekunderSecondary Income
(688.0) (544.5) (556.9) (610.0) (682.5)
PenerimaanReceipts
50.0 98.2 73.8 55.7 43.1
PembayaranPayments
738.1 642.7 630.7 665.8 725.6
Sumber:JabatanPerancangandanKemajuanEkonomi,KementerianKewangandanEkonomiSource : Department of Economic Planning and Development, Ministry of Finance and Economy
Nota:Dalamakaunkewangan,positifmenandakanpeningkatandalamasetdanliabilitidannegatifmenandakanpenguranganasetdanliabilitiNote : In the financial account positive denotes increase in assets and liabilities and negative denotes decrease in assets and liabilities
p
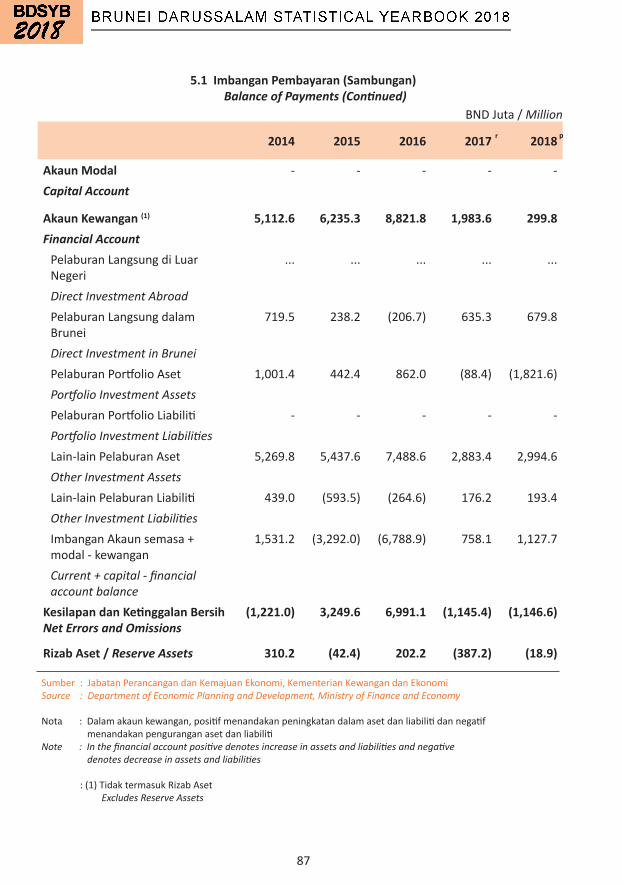
87
5.1 Imbangan Pembayaran (Sambungan) Balance of Payments (Continued)
BNDJuta/Million
Sumber:JabatanPerancangandanKemajuanEkonomi,KementerianKewangandanEkonomiSource : Department of Economic Planning and Development, Ministry of Finance and Economy
Nota:Dalamakaunkewangan,positifmenandakanpeningkatandalamasetdanliabilitidannegatifmenandakanpenguranganasetdanliabilitiNote : In the financial account positive denotes increase in assets and liabilities and negative denotes decrease in assets and liabilities
:(1)TidaktermasukRizabAset Excludes Reserve Assets
2014 2015 2016 2017 2018
Akaun Modal - - - - -Capital Account
Akaun Kewangan (1) 5,112.6 6,235.3 8,821.8 1,983.6 299.8 Financial Account PelaburanLangsungdiLuarNegeri
... ... ... ... ...
Direct Investment AbroadPelaburanLangsungdalamBrunei
719.5 238.2 (206.7) 635.3 679.8
Direct Investment in BruneiPelaburanPortfolioAset 1,001.4 442.4 862.0 (88.4) (1,821.6)Portfolio Investment Assets PelaburanPortfolioLiabiliti - - - - -Portfolio Investment LiabilitiesLain-lainPelaburanAset 5,269.8 5,437.6 7,488.6 2,883.4 2,994.6Other Investment AssetsLain-lainPelaburanLiabiliti 439.0 (593.5) (264.6) 176.2 193.4Other Investment LiabilitiesImbanganAkaunsemasa+modal-kewangan
1,531.2 (3,292.0) (6,788.9) 758.1 1,127.7
Current + capital - financial account balance
Kesilapan dan Ketinggalan BersihNet Errors and Omissions
(1,221.0) 3,249.6 6,991.1 (1,145.4) (1,146.6)
Rizab Aset / Reserve Assets 310.2 (42.4) 202.2 (387.2) (18.9)
r p
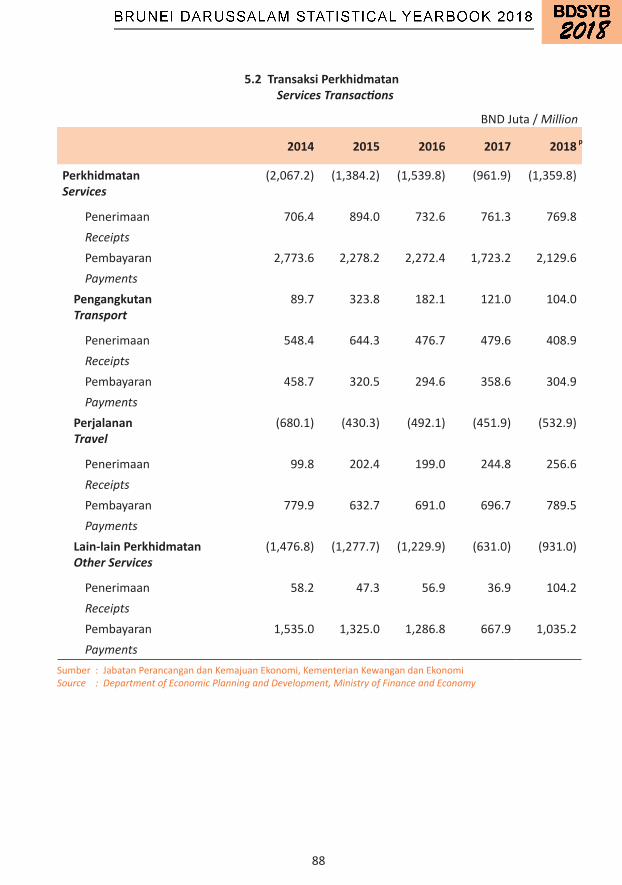
88
5.2 Transaksi Perkhidmatan Services Transactions
2014 2015 2016 2017 2018
PerkhidmatanServices
(2,067.2) (1,384.2) (1,539.8) (961.9) (1,359.8)
Penerimaan 706.4 894.0 732.6 761.3 769.8ReceiptsPembayaran 2,773.6 2,278.2 2,272.4 1,723.2 2,129.6Payments
PengangkutanTransport
89.7 323.8 182.1 121.0 104.0
Penerimaan 548.4 644.3 476.7 479.6 408.9ReceiptsPembayaran 458.7 320.5 294.6 358.6 304.9Payments
PerjalananTravel
(680.1) (430.3) (492.1) (451.9) (532.9)
Penerimaan 99.8 202.4 199.0 244.8 256.6ReceiptsPembayaran 779.9 632.7 691.0 696.7 789.5Payments
Lain-lain PerkhidmatanOther Services
(1,476.8) (1,277.7) (1,229.9) (631.0) (931.0)
Penerimaan 58.2 47.3 56.9 36.9 104.2ReceiptsPembayaran 1,535.0 1,325.0 1,286.8 667.9 1,035.2Payments
BNDJuta/ Million
Sumber:JabatanPerancangandanKemajuanEkonomi,KementerianKewangandanEkonomiSource : Department of Economic Planning and Development, Ministry of Finance and Economy
p
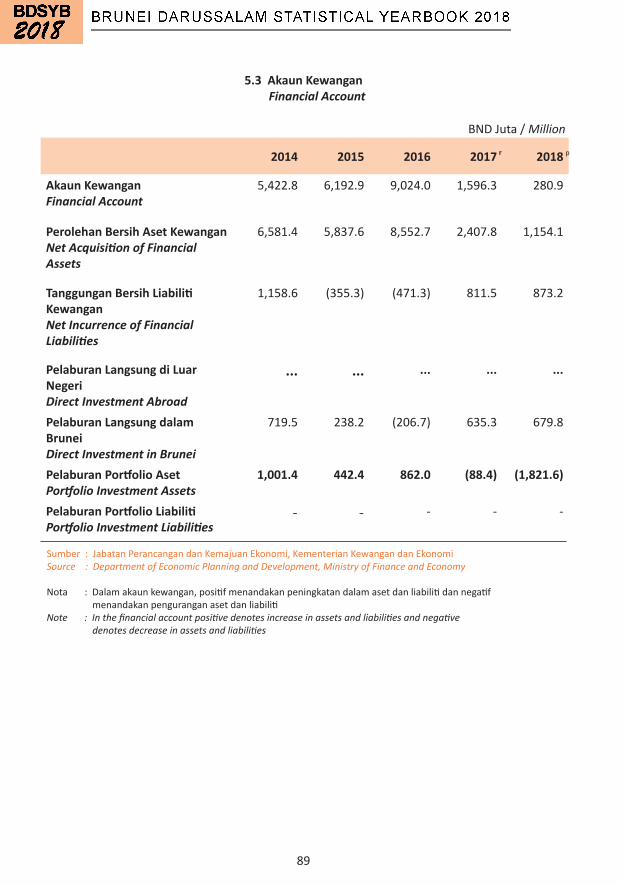
89
5.3 Akaun Kewangan Financial Account
BNDJuta/ Million
2014 2015 2016 2017 2018
Akaun KewanganFinancial Account
5,422.8 6,192.9 9,024.0 1,596.3 280.9
Perolehan Bersih Aset KewanganNet Acquisition of Financial Assets
6,581.4 5,837.6 8,552.7 2,407.8 1,154.1
Tanggungan Bersih Liabiliti KewanganNet Incurrence of FinancialLiabilities
1,158.6 (355.3) (471.3) 811.5 873.2
Pelaburan Langsung di Luar NegeriDirect Investment Abroad
... ... ... ... ...
Pelaburan Langsung dalam Brunei Direct Investment in Brunei
719.5 238.2 (206.7) 635.3 679.8
Pelaburan Portfolio AsetPortfolio Investment Assets
1,001.4 442.4 862.0 (88.4) (1,821.6)
Pelaburan Portfolio LiabilitiPortfolio Investment Liabilities
- - - - -
p
Sumber:JabatanPerancangandanKemajuanEkonomi,KementerianKewangandanEkonomiSource : Department of Economic Planning and Development, Ministry of Finance and Economy
Nota:Dalamakaunkewangan,positifmenandakanpeningkatandalamasetdanliabilitidannegatifmenandakanpenguranganasetdanliabilitiNote : In the financial account positive denotes increase in assets and liabilities and negative denotes decrease in assets and liabilities
r
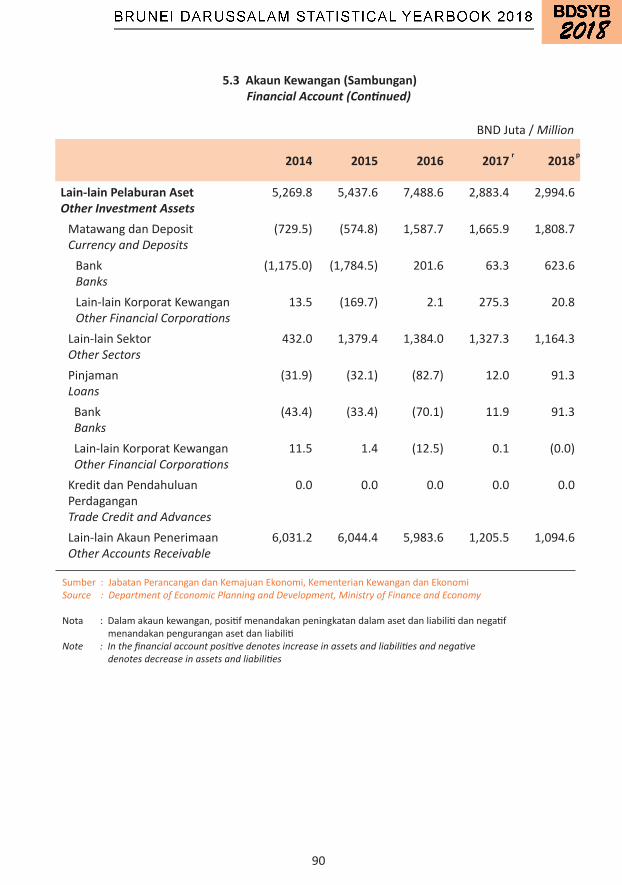
90
5.3 Akaun Kewangan (Sambungan) Financial Account (Continued)
BNDJuta/ Million
2014 2015 2016 2017 2018
Lain-lain Pelaburan AsetOther Investment Assets
5,269.8 5,437.6 7,488.6 2,883.4 2,994.6
MatawangdanDepositCurrency and Deposits
(729.5) (574.8) 1,587.7 1,665.9 1,808.7
BankBanks
(1,175.0) (1,784.5) 201.6 63.3 623.6
Lain-lainKorporatKewanganOther Financial Corporations
13.5 (169.7) 2.1 275.3 20.8
Lain-lainSektorOther Sectors
432.0 1,379.4 1,384.0 1,327.3 1,164.3
PinjamanLoans
(31.9) (32.1) (82.7) 12.0 91.3
Bank Banks
(43.4) (33.4) (70.1) 11.9 91.3
Lain-lainKorporatKewangan Other Financial Corporations
11.5 1.4 (12.5) 0.1 (0.0)
KreditdanPendahuluanPerdaganganTrade Credit and Advances
0.0 0.0 0.0 0.0 0.0
Lain-lainAkaunPenerimaanOther Accounts Receivable
6,031.2 6,044.4 5,983.6 1,205.5 1,094.6
Sumber:JabatanPerancangandanKemajuanEkonomi,KementerianKewangandanEkonomiSource : Department of Economic Planning and Development, Ministry of Finance and Economy
Nota:Dalamakaunkewangan,positifmenandakanpeningkatandalamasetdanliabilitidannegatifmenandakanpenguranganasetdanliabilitiNote : In the financial account positive denotes increase in assets and liabilities and negative denotes decrease in assets and liabilities
r p
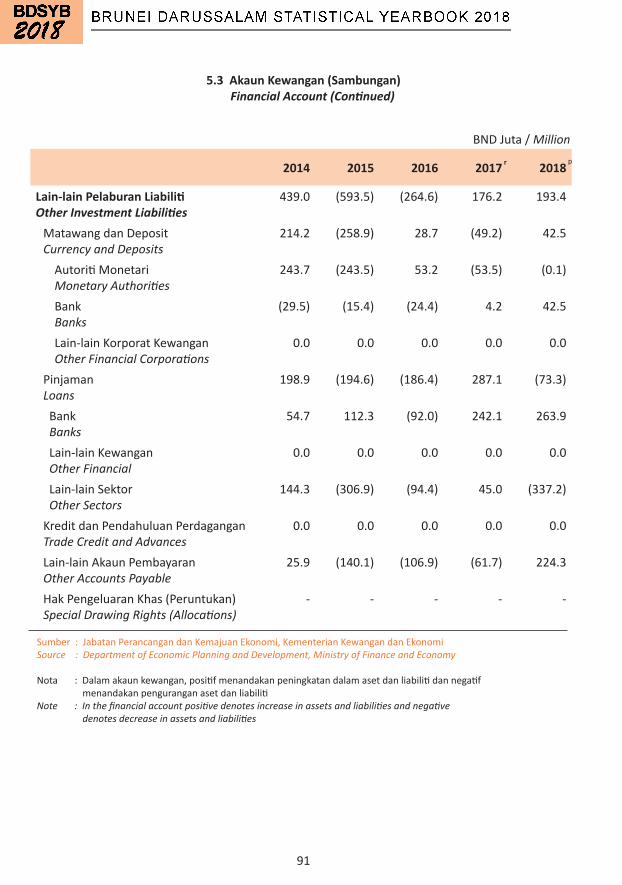
91
5.3 Akaun Kewangan (Sambungan) Financial Account (Continued)
2014 2015 2016 2017 2018
Lain-lain Pelaburan LiabilitiOther Investment Liabilities
439.0 (593.5) (264.6) 176.2 193.4
MatawangdanDepositCurrency and Deposits
214.2 (258.9) 28.7 (49.2) 42.5
AutoritiMonetariMonetary Authorities
243.7 (243.5) 53.2 (53.5) (0.1)
BankBanks
(29.5) (15.4) (24.4) 4.2 42.5
Lain-lainKorporatKewanganOther Financial Corporations
0.0 0.0 0.0 0.0 0.0
PinjamanLoans
198.9 (194.6) (186.4) 287.1 (73.3)
Bank Banks
54.7 112.3 (92.0) 242.1 263.9
Lain-lainKewangan Other Financial
0.0 0.0 0.0 0.0 0.0
Lain-lainSektor Other Sectors
144.3 (306.9) (94.4) 45.0 (337.2)
KreditdanPendahuluanPerdaganganTrade Credit and Advances
0.0 0.0 0.0 0.0 0.0
Lain-lainAkaunPembayaranOther Accounts Payable
25.9 (140.1) (106.9) (61.7) 224.3
HakPengeluaranKhas(Peruntukan)Special Drawing Rights (Allocations)
- - - - -
p
BNDJuta/ Million
Sumber:JabatanPerancangandanKemajuanEkonomi,KementerianKewangandanEkonomiSource : Department of Economic Planning and Development, Ministry of Finance and Economy
Nota:Dalamakaunkewangan,positifmenandakanpeningkatandalamasetdanliabilitidannegatifmenandakanpenguranganasetdanliabilitiNote : In the financial account positive denotes increase in assets and liabilities and negative denotes decrease in assets and liabilities
r

92
5.3 Akaun Kewangan (Sambungan) Financial Account (Continued)
BNDJuta/ Million
2014 2015 2016 2017 2018
Rizab AsetReserve Assets
310.2 (42.4) 202.2 (387.2) (18.9)
EmasMonetariMonetary Gold
- - - - -
HakPengeluaranKhasSpecial Drawing Rights
0.0 0.0 0.0 0.3 0.7
KedudukanRizabIMFReserve Position in the IMF
- - - - -
Lain-lainAsetRizabOther Reserve Assets
310.2 (42.4) 202.2 (387.6) (19.6)
MataWangdanDeposit Currency and Deposits
(64.2) 739.5 27.2 (286.0) 152.4
SekuritiHutang Debts Securities
402.9 (778.4) 173.5 (107.0) (278.7)
Lain-lainTuntutan Other Claims
0.0 0.0 0.0 0.0 0.0
Saham Shares
(28.5) (3.4) 1.5 5.4 106.7
DerivatifKewangan Financial Derivatives
- - - - -
p
Sumber:JabatanPerancangandanKemajuanEkonomi,KementerianKewangandanEkonomiSource : Department of Economic Planning and Development, Ministry of Finance and Economy
Nota:Dalamakaunkewangan,positifmenandakanpeningkatandalamasetdanliabilitidannegatifmenandakanpenguranganasetdanliabilitiNote : In the financial account positive denotes increase in assets and liabilities and negative denotes decrease in assets and liabilities
93
6 PERANGKAAN BARANGAN PERDAGANGAN ANTARABANGSA INTERNATIONAL MERCHANDISE TRADE STATISTICS

94
Nota Keterangan
PerangkaanBaranganPerdaganganAntarabangsa terdiridaripada importdaneksport.Perangkaan importdaneksportberasaskanmaklumatyangdiperolehidaripadaJabatanKastamdanEksaisDiraja,KementerianKewangandanEkonomimelaluideklarasikastamdanKementerianTenaga(TenagadanTenagaManusia)danPerindustrian.
Pengimport dan pengeksport barang-barang adalah dikehendaki untuk membekalkan maklumat ke dalamdeklarasi kastambagi setiapkonsainanbarangniaga import ataueksport.Deklarasi ini disahkanoleh JabatanKastamdanEksaisDirajadandihadapkankeJabatanPerancangandanKemajuanEkonomiuntukpemerosesandatadanpenyebaranmaklumat.
NegaraBruneiDarussalammempraktikkanGeneral SystemdalammerekodPerangkaanBaranganPerdaganganAntarabangsayanghanyameliputiimport,eksportdomestikdaneksportsemulayangdiluluskanmelaluikastam.Initidaktermasuk:
a)matawangkertasdansyilingdalamperedaran; b)barang-barangpersendiriandanrumahyangtidakdikenakandutikastamdiNegaraBruneiDarussalamdandigunakanolehpenumpanguntukkegunaansendiri; c)stordanbahanbakardibekalkankepadakapallautdankapaludaraBrunei; d)artikelmengenaipinjamanatausewacontohperalatan-peralatanuntukkajianminyakdanujianpenggerudidll.; e)barang-barangpersinggahan; f)ikandanlain-lainproduklautyangmendaratterusdarikapalmenangkapikandikawasanperikananNegaraBruneiDarussalam; g)barang-barangyangdiimportdandieksportolehataubagipihakperkhidmatandiplomatik;dan h)barang-barangyangdiimportolehangkatanbersenjata.
Klasifikasi Piawaian Perdagangan Antarabangsa Semakan 4 (SITC Rev.4), digunakan bagi penjenisan barangankomoditiuntukkedua-duaimportdaneksport.
Importmerujukkepadabaranganyangdibawamasukkedalamnegara, samaadasecara terusataudisimpandalamgudangsehinggacukainyadibayar,tanpamengirasamaadabarangtersebutuntukpenggunaan,diproses,digunakandalamperkilanganataudieksportsemulakenegaralain.Importdinilaikanmengikutc.i.f (cost, insurance and freight-kos,insuransdantambang).
Eksportmerujukkepadabarangan(keluaranataubuatantempatanataubarangdiimportuntukdieksportsemula)yangdibawakeluardarinegara.Eksportdinilaikanmengikutf.o.b(freeonboard).Eksportterdiridaripadaeksportdomestikdaneksportsemula.
•Eksport DomestikterdiridaripadabaranganyangdikeluarkandidalamNegaraBruneiDarussalam.
•Eksport Semulamerujukkepadabaranganyangdibawakeluardarinegaradalamkeadaansepertimanaianyadiimporttanpamengalamisebarangperubahanbentuk.Prosesmembungkussemula,menyisihataumenggredtidakdikirasebagaisatuprosesperubahanbentuk.
6 PERANGKAAN BARANGAN PERDAGANGAN ANTARABANGSA
95
Jumlah Perdaganganialahjumlahnilaieksport(termasukeksportdomestikdaneksportsemula)danimport.
Imbangan Perdagangan ialahperbezaanantaranilaieksport (termasukeksportdomestikdaneksportsemula)dan import. Apabila eksport melebihi import, lebihan direkodkan dan defisit pula dicatatkan apabila importmelebihieksport.
Kategori Ekonomi Umum (Broad Economic Category-BEC)diklasifikasikanmengikutKlasifikasiKategoriEkonomiUmum yang diperkenalkan oleh Pertubuhan Bangsa-Bangsa Bersatu dan sebagai cara untuk menukar dataStandardInternationalTradeClassification(SITC)kepadakategoripenggunaanakhir.BECmenyediakankategoriselarasdengan3kelasbaranganutamadalamSistemAkaunNegara(SystemofNationalAccounts-SNA):
•BaranganModaldigunakanuntukmenghasilkanbaranganatauperkhidmatanlain. •BaranganPerantaraanadalahseparuhdiproses,separapembuatandanpembekalan-perindustrian;dandiubahataudigunakandalampengeluaranbarangandanperkhidmatan. •BaranganPenggunaanadalahprodukakhiryangdigunakanterutamanyaolehisirumahuntukkegunaanakhir
Barangan perdagangan mengikut mod pengangkutan dikumpulmengikut carapengangkutanyangdigunakanuntukbaranganmasukataukeluardaripadasesebuahekonomi.Klasifikasiberikutadalahkategoriutamamodpengangkutan:
1.Udara; 2.Laut; 3.Darat;dan 4.Lain-lain,termasukpenghantaranpos,melataukurierdanbaranganyangmelintasisempadandantidakmengaitkanurusniagakepadasebarangkategoripengangkutanjenistertentu.
96
Explanatory Note
6 INTERNATIONAL MERCHANDISE TRADE STATISTICS
International Merchandise Trade Statistics comprises of imports and exports. The import and export statistics is based on the information captured by the Royal Customs and Excise Department, Ministry of Finance and Economy through the customs declarations and Ministry of Energy (Energy and Manpower) and Industry.
Importers and exporters of goods are required to furnish information in the customs declaration forms in respect of every consignment of merchandise imported or exported. These declarations are verified by the Department of Royal Customs and Excise which are then forwarded to Department of Economic Planning and Development for data processing and disseminations.
The General System of recording International Merchandise Trade Statistics practised by Brunei Darussalam only cover imports, domestic exports and re-exports that have been cleared through customs excluding:
a) currency notes and coins in circulation; b) personal and household effects which do not incur any Brunei Darussalam customs duty and which are taken by passengers for their own use; c) stores and fuel supplied to Brunei ships and aircrafts; d) articles on loan or rent e.g. equipments for oil surveys and experimental drilling etc.; e) goods in transit; f) fish and other marine products landed from Brunei Darussalam fishing vessels direct from fishing grounds; g) goods imported and exported by or on behalf of diplomatic services; and h) goods imported by the armed forces.
The Standard International Trade Classification, Revision 4 (SITC Rev.4) is used to classify commodity items for both imports and exports.
Imports refer to goods brought into the country, either directly or into bonded warehouses, irrespective of whether such goods are for consumption, to be processed used in manufacturing or subsequent exports to other countries. Imports are valued on c.i.f (cost, insurance and freight) basis.
Exports refer to goods (locally produced or manufactured or imports for subsequent exports), which are taken out of the country. Exports are value on f.o.b (free on board) basis. Exports comprise of domestic export and re-export. • Domestic Exports comprise of goods which are grown or produced in Brunei Darussalam.
• Re-Exports refer to goods taken out of the country in the same form as they were imported without any transformation. Re-packing, sorting or grading processes are not considered part of the transformation processes.
97
Total Trade is total of value of exports (including domestic exports and re-exports) and imports.
Balance of Trade is the difference between the value of exports (including domestic exports and re-exports) and imports. When exports exceed imports it is recorded as surplus while a deficit is registered when imports exceed exports.
Broad Economic Category (BEC) is classified in accordance to Broad Economic Category introduced by the United Nations and as a means for converting data compiled in terms of Standard International Trade Classification (SITC) into end-use categories. The BEC provides categories which can be aligned into 3 large classes of goods in the System of National Accounts (SNA):
• Capital Goods are used as means of producing other goods or services. • Intermediate Goods are semi-processed, semi-manufactured and industrial-supplies; and transformed or used up in the production of goods and services. • Consumption Goods are final product mainly used by households for final consumption
Merchandise trade in goods by mode of transport are compiled according to the means of transport used when goods enter or leave the economic territory of a country. The following classifications are the main categories of the mode of transport:
1. Air; 2. Sea; 3. Land; and 4. Others, include postal consignments, mail or courier shipments and goods crossing the border not to attribute a transaction to any specific mode of transport categories.
98
Penjenisan Barang Dagangan Classification of Trade Commodities
Nota:BarangPerdagangandalamSeksyeninidiklaskanmengikutBrunei Darussalam Standard International Trade Classification (BDSITC), 2012 berdasarkanPiawaianKlasifikasiPerdaganganAntarabangsa,PindaanKeempat(S.I.T.CRev.4)daripadaBangsa-BangsaBersatuNote : Trade Commodities in this Section are classified according to Brunei Darussalam Standard International Trade Classification (BDSITC), 2012 based on the United Nation’s Standard International Trade Classification (SITC), Revision 4 (0)Makanan Food
(1)MinumandanTembakau Beverages and Tobacco
(2)Bahan-BahanMentahTidakBolehDimakan Crude Materials, Inedible
(3)BahanApiGalian Mineral Fuels
(4)MinyakdanLemakBinatangdanSayur-Sayuran Animal and Vegetable Oils and Fats
(5)BahanKimia Chemicals
(6)Barang-BarangKeluaranKilang Manufactured Goods
(7)JenteradanKelengkapanPengangkutan Machinery and Transport Equipment
(8)PelbagaiBarangKeluaranKilang Miscellaneous Manufactured Articles
(9)PelbagaiUrusniaga Miscellaneous Transaction

99
6.1 Eksport, Import, Jumlah Perdagangan dan Imbangan Perdagangan Exports, Imports, Total Trade and Trade Balance
BNDJuta/ Million
TahunYear 2014 2015 2016 2017 2018
EksportExports
13,438.0 8,714.8 6,790.0 7,711.6 8,871.8
EksportDomestikDomestic Exports
12,716.3 8,283.0 6,161.2 7,128.8 8,446.8
EksportSemulaRe-Exports
721.7 431.7 628.8 582.7 425.1
ImportImports
4,556.2 4,447.5 3,689.0 4,256.8 5,622.3
Jumlah Perdagangan Total Trade
17,994.2 13,162.3 10,479.0 11,968.4 14,494.1
Imbangan PerdaganganTrade Balance
8,881.8 4,267.3 3,101.0 3,454.8 3,249.5
Sumber:JabatanPerancangandanKemajuanEkonomi,KementerianKewangandanEkonomiSource : Department of Economic Planning and Development, Ministry of Finance and Economy

100
TahunYear 2014 2015 2016 2017 2018
EksportExports
(6.1) (35.1) (22.1) 13.6 15.0
EksportDomestikDomestic Exports
(8.7) (34.9) (25.6) 15.7 18.5
EksportSemulaRe-Exports
91.5 (40.2) 45.6 (7.3) (27.1)
ImportImports
0.8 (2.4) (17.1) 15.4 32.1
Jumlah PerdaganganTotal Trade
(4.4) (26.9) (20.4) 14.2 21.1
Imbangan PerdaganganTrade Balance
(9.3) (52.0) (27.3) 11.4 (5.9)
6.2 Kadar Pertumbuhan Eksport, Import, Jumlah Perdagangan dan Imbangan Perdagangan Growth Rates of Exports, Imports, Total Trade and Trade Balance
Peratus/ Per cent
Sumber:JabatanPerancangandanKemajuanEkonomi,KementerianKewangandanEkonomiSource : Department of Economic Planning and Development, Ministry of Finance and Economy

101
6.3 Import mengikut Seksyen Barangan Imports by Commodity Section
BNDJuta/ Million
Sumber:JabatanPerancangandanKemajuanEkonomi,KementerianKewangandanEkonomiSource : Department of Economic Planning and Development, Ministry of Finance and Economy
Seksyen BaranganCommodity Section 2014 2015 2016 2017 2018
Jumlah ImportTotal Imports
4,556.2 4,447.5 3,689.0 4,256.8 5,622.3
MakananFood
616.2 610.3 599.5 565.1 612.0
MinumandanTembakauBeverages and Tobacco
64.6 68.7 68.9 49.6 49.9
Bahan-BahanMentahTidakBolehDimakanCrude Materials, Inedible
44.1 55.5 47.0 63.0 52.4
BahanApiGalianMineral Fuels
462.5 269.8 314.4 366.4 370.3
MinyakdanLemakBinatangdanSayur-SayuranAnimal and Vegetable Oils and Fats
18.8 17.4 16.2 22.2 18.8
BahanKimiaChemicals
384.5 323.2 335.5 339.3 358.6
Barang-BarangKeluaranKilangManufactured Goods
684.8 953.8 736.3 1,028.1 1,600.2
JenteradanKelengkapanPengangkutanMachinery and Transport Equipment
1,755.0 1,752.5 1,214.7 1,452.0 2,154.0
PelbagaiBarangKeluaranKilangMiscellaneous Manufactured Articles
500.8 381.3 343.3 351.4 396.0
PelbagaiUrusniagaMiscellaneous Transaction
24.7 15.1 13.1 19.7 10.1
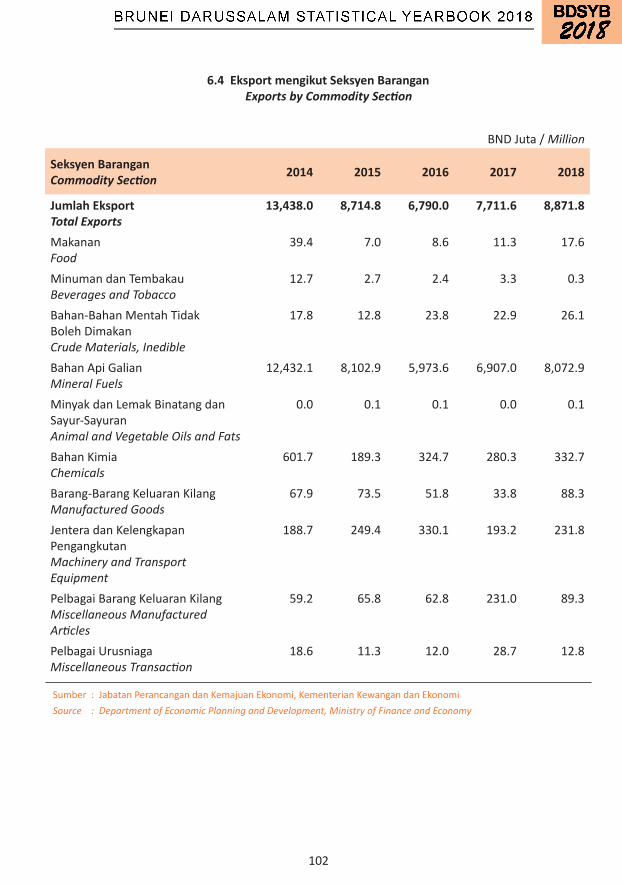
102
6.4 Eksport mengikut Seksyen Barangan Exports by Commodity Section
BNDJuta/ Million
Sumber:JabatanPerancangandanKemajuanEkonomi,KementerianKewangandanEkonomiSource : Department of Economic Planning and Development, Ministry of Finance and Economy
Seksyen BaranganCommodity Section 2014 2015 2016 2017 2018
Jumlah EksportTotal Exports
13,438.0 8,714.8 6,790.0 7,711.6 8,871.8
MakananFood
39.4 7.0 8.6 11.3 17.6
MinumandanTembakauBeverages and Tobacco
12.7 2.7 2.4 3.3 0.3
Bahan-BahanMentahTidakBolehDimakanCrude Materials, Inedible
17.8 12.8 23.8 22.9 26.1
BahanApiGalianMineral Fuels
12,432.1 8,102.9 5,973.6 6,907.0 8,072.9
MinyakdanLemakBinatangdanSayur-SayuranAnimal and Vegetable Oils and Fats
0.0 0.1 0.1 0.0 0.1
BahanKimiaChemicals
601.7 189.3 324.7 280.3 332.7
Barang-BarangKeluaranKilangManufactured Goods
67.9 73.5 51.8 33.8 88.3
JenteradanKelengkapanPengangkutanMachinery and Transport Equipment
188.7 249.4 330.1 193.2 231.8
PelbagaiBarangKeluaranKilangMiscellaneous Manufactured Articles
59.2 65.8 62.8 231.0 89.3
PelbagaiUrusniagaMiscellaneous Transaction
18.6 11.3 12.0 28.7 12.8
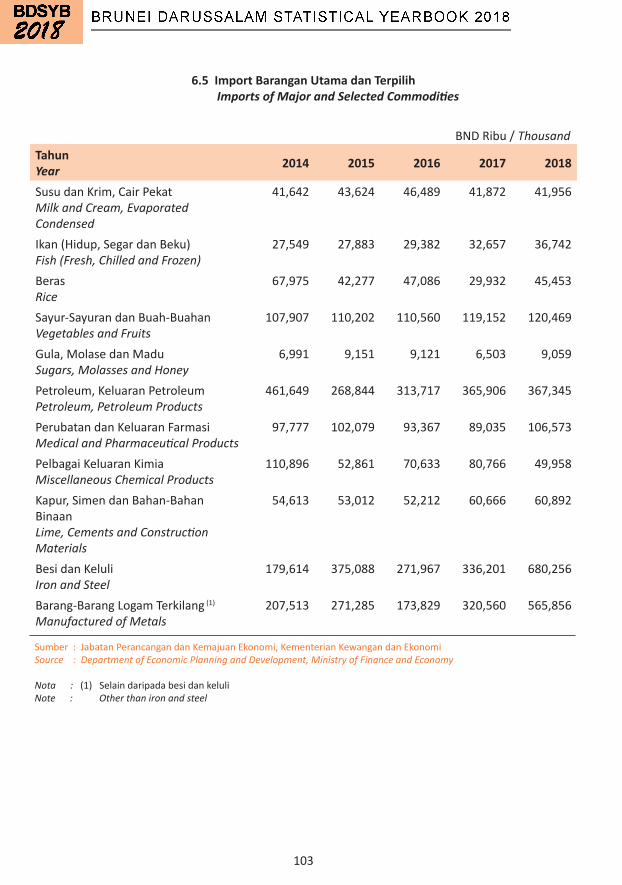
103
TahunYear 2014 2015 2016 2017 2018
SusudanKrim,CairPekatMilk and Cream, Evaporated Condensed
41,642 43,624 46,489 41,872 41,956
Ikan(Hidup,SegardanBeku)Fish (Fresh, Chilled and Frozen)
27,549 27,883 29,382 32,657 36,742
BerasRice
67,975 42,277 47,086 29,932 45,453
Sayur-SayurandanBuah-BuahanVegetables and Fruits
107,907 110,202 110,560 119,152 120,469
Gula,MolasedanMaduSugars, Molasses and Honey
6,991 9,151 9,121 6,503 9,059
Petroleum,KeluaranPetroleumPetroleum, Petroleum Products
461,649 268,844 313,717 365,906 367,345
PerubatandanKeluaranFarmasiMedical and Pharmaceutical Products
97,777 102,079 93,367 89,035 106,573
PelbagaiKeluaranKimiaMiscellaneous Chemical Products
110,896 52,861 70,633 80,766 49,958
Kapur,SimendanBahan-BahanBinaanLime, Cements and Construction Materials
54,613 53,012 52,212 60,666 60,892
BesidanKeluliIron and Steel
179,614 375,088 271,967 336,201 680,256
Barang-BarangLogamTerkilang(1)Manufactured of Metals
207,513 271,285 173,829 320,560 565,856
6.5 Import Barangan Utama dan Terpilih Imports of Major and Selected Commodities
BNDRibu/Thousand
Sumber:JabatanPerancangandanKemajuanEkonomi,KementerianKewangandanEkonomiSource : Department of Economic Planning and Development, Ministry of Finance and Economy
Nota : (1) SelaindaripadabesidankeluliNote : Other than iron and steel
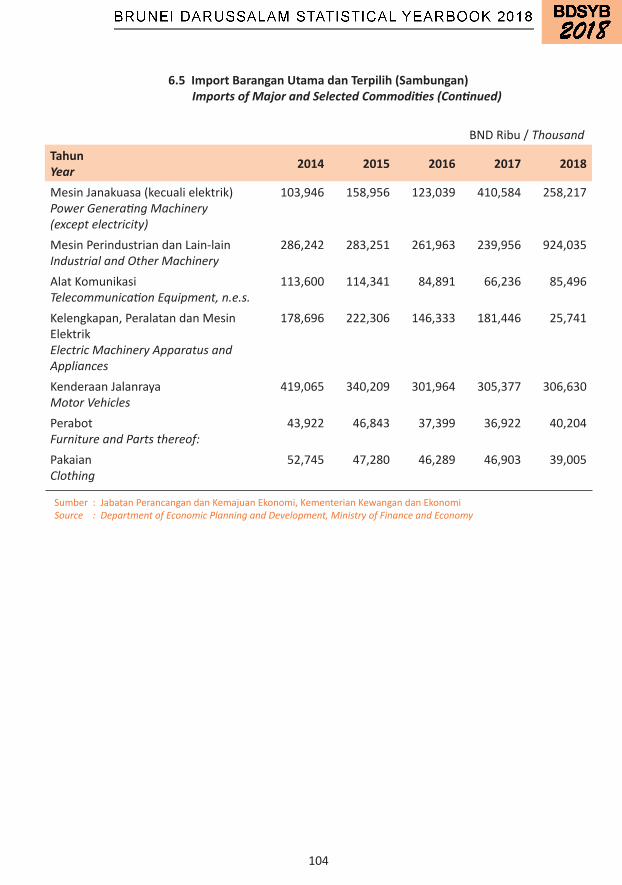
104
TahunYear 2014 2015 2016 2017 2018
MesinJanakuasa(kecualielektrik)Power Generating Machinery (except electricity)
103,946 158,956 123,039 410,584 258,217
MesinPerindustriandanLain-lainIndustrial and Other Machinery
286,242 283,251 261,963 239,956 924,035
AlatKomunikasiTelecommunication Equipment, n.e.s.
113,600 114,341 84,891 66,236 85,496
Kelengkapan,PeralatandanMesinElektrikElectric Machinery Apparatus and Appliances
178,696 222,306 146,333 181,446 25,741
KenderaanJalanrayaMotor Vehicles
419,065 340,209 301,964 305,377 306,630
PerabotFurniture and Parts thereof:
43,922 46,843 37,399 36,922 40,204
PakaianClothing
52,745 47,280 46,289 46,903 39,005
6.5 Import Barangan Utama dan Terpilih (Sambungan) Imports of Major and Selected Commodities (Continued)
BNDRibu/Thousand
Sumber:JabatanPerancangandanKemajuanEkonomi,KementerianKewangandanEkonomiSource : Department of Economic Planning and Development, Ministry of Finance and Economy
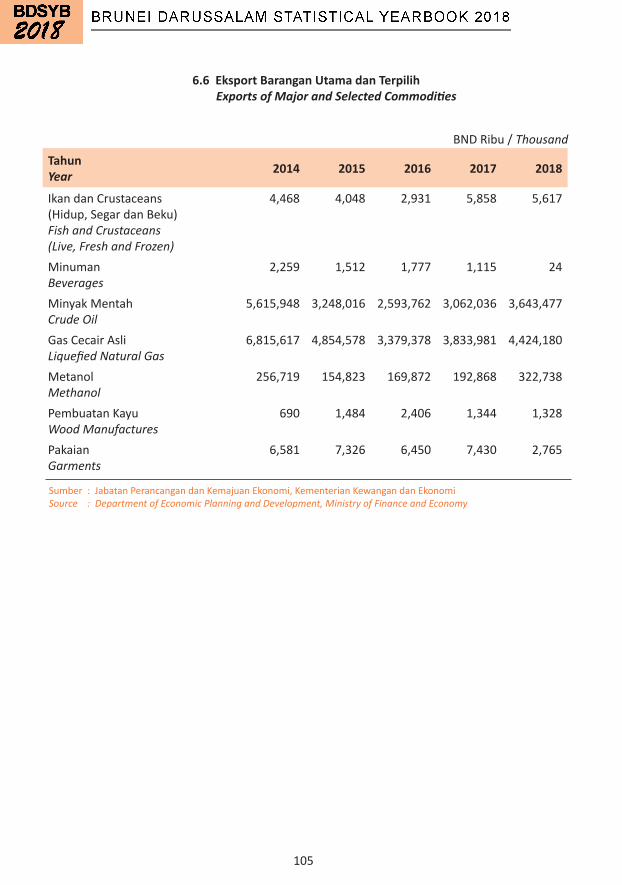
105
6.6 Eksport Barangan Utama dan Terpilih Exports of Major and Selected Commodities
BNDRibu/Thousand
Sumber:JabatanPerancangandanKemajuanEkonomi,KementerianKewangandanEkonomiSource : Department of Economic Planning and Development, Ministry of Finance and Economy
TahunYear 2014 2015 2016 2017 2018
IkandanCrustaceans(Hidup,SegardanBeku)Fish and Crustaceans (Live, Fresh and Frozen)
4,468 4,048 2,931 5,858 5,617
MinumanBeverages
2,259 1,512 1,777 1,115 24
MinyakMentahCrude Oil
5,615,948 3,248,016 2,593,762 3,062,036 3,643,477
GasCecairAsliLiquefied Natural Gas
6,815,617 4,854,578 3,379,378 3,833,981 4,424,180
MetanolMethanol
256,719 154,823 169,872 192,868 322,738
PembuatanKayuWood Manufactures
690 1,484 2,406 1,344 1,328
PakaianGarments
6,581 7,326 6,450 7,430 2,765
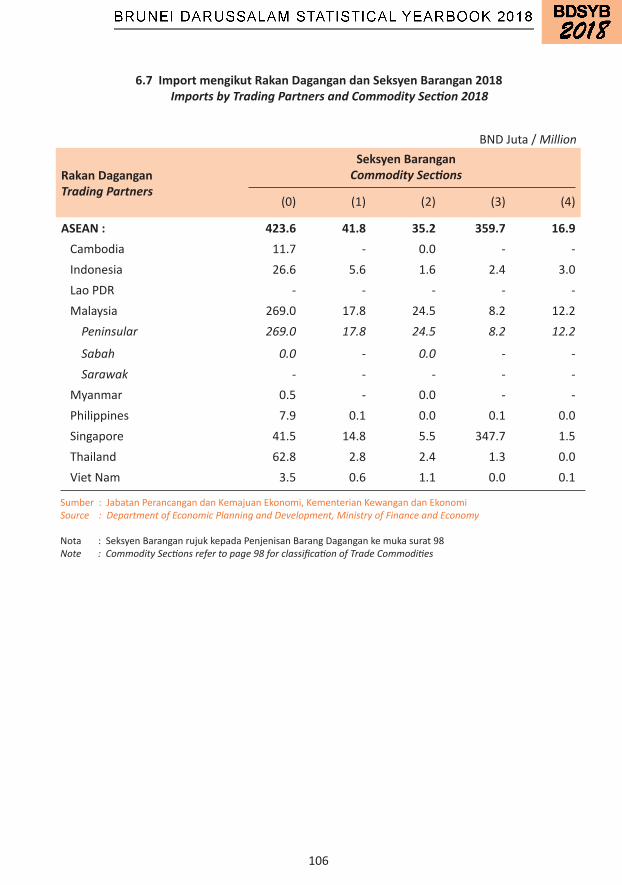
106
Rakan DaganganTrading Partners
Seksyen BaranganCommodity Sections
(0) (1) (2) (3) (4)
ASEAN : 423.6 41.8 35.2 359.7 16.9Cambodia 11.7 - 0.0 - -Indonesia 26.6 5.6 1.6 2.4 3.0LaoPDR - - - - -Malaysia 269.0 17.8 24.5 8.2 12.2 Peninsular 269.0 17.8 24.5 8.2 12.2
Sabah 0.0 - 0.0 - - Sarawak - - - - -Myanmar 0.5 - 0.0 - -Philippines 7.9 0.1 0.0 0.1 0.0Singapore 41.5 14.8 5.5 347.7 1.5Thailand 62.8 2.8 2.4 1.3 0.0VietNam 3.5 0.6 1.1 0.0 0.1
6.7 Import mengikut Rakan Dagangan dan Seksyen Barangan 2018 Imports by Trading Partners and Commodity Section 2018
BNDJuta/ Million
Sumber:JabatanPerancangandanKemajuanEkonomi,KementerianKewangandanEkonomiSource : Department of Economic Planning and Development, Ministry of Finance and Economy
Nota:SeksyenBaranganrujukkepadaPenjenisanBarangDagangankemukasurat98Note : Commodity Sections refer to page 98 for classification of Trade Commodities

107
6.7 Import mengikut Rakan Dagangan dan Seksyen Barangan 2018 (Sambungan) Imports by Trading Partners and Commodity Section 2018 (Continued)
Rakan DaganganTrading Partners
Seksyen BaranganCommodity Sections Jumlah
Total(5) (6) (7) (8) (9)
ASEAN : 216.2 243.3 331.8 149.4 0.7 1,818.6Cambodia - 0.0 0.0 0.0 0.0 11.7Indonesia 5.6 9.7 37.0 4.8 0.2 96.7LaoPDR - - 0.0 - - 0.0Malaysia 128.1 129.3 86.4 68.8 0.2 744.6 Peninsular 128.1 126.7 86.4 67.9 0.2 741.1
Sabah - 0.0 - 0.9 - 0.9 Sarawak - 2.5 - 0.0 - 2.6Myanmar - 0.1 - 0.0 - 0.6Philippines 0.4 8.5 1.1 1.4 0.0 19.6Singapore 73.7 70.3 155.5 64.9 0.2 775.6Thailand 5.7 17.2 47.9 6.5 0.0 146.6VietNam 2.7 8.4 3.9 2.9 0.0 23.3
BNDJuta/ Million
Sumber:JabatanPerancangandanKemajuanEkonomi,KementerianKewangandanEkonomiSource : Department of Economic Planning and Development, Ministry of Finance and Economy
Nota:SeksyenBaranganrujukkepadaPenjenisanBarangDagangankemukasurat98Note : Commodity Sections refer to page 98 for classification of Trade Commodities

108
Rakan DaganganTrading Partners
Seksyen BaranganCommodity Sections
(0) (1) (2) (3) (4)
PERSEKUTUAN EROPAH :EUROPEAN UNION :
18.2 1.7 1.4 1.6 0.9
Austria 0.1 0.0 0.1 - -Belgium 1.4 0.2 0.1 0.0 -Denmark 0.5 0.1 - 0.0 -Finland 0.0 0.0 0.0 - -France 0.6 0.5 0.0 0.0 -Germany 1.6 0.0 0.1 1.4 0.0Greece 0.1 - - - -Ireland 0.6 0.0 - - -Italy 1.5 0.0 0.0 0.0 0.5Luxembourg - - - - -
Netherlands 6.3 0.0 0.7 0.0 0.0Portugal 0.0 - 0.0 - -Spain 0.1 0.0 0.0 - 0.3Sweden 0.0 0.0 0.0 0.0 -UnitedKingdom 5.3 0.8 0.3 0.1 0.2Lain-lain/Others - - - - -
6.7 Import mengikut Rakan Dagangan dan Seksyen Barangan 2018 (Sambungan) Imports by Trading Partners and Commodity Section 2018 (Continued)
BNDJuta/ Million
Sumber:JabatanPerancangandanKemajuanEkonomi,KementerianKewangandanEkonomiSource : Department of Economic Planning and Development, Ministry of Finance and Economy
Nota:SeksyenBaranganrujukkepadaPenjenisanBarangDagangankemukasurat98Note : Commodity Sections refer to page 98 for classification of Trade Commodities

109
6.7 Import mengikut Rakan Dagangan dan Seksyen Barangan 2018 (Sambungan) Imports by Trading Partners and Commodity Section 2018 (Continued)
BNDJuta/ Million
Rakan DaganganTrading Partners
Seksyen BaranganCommodity Sections Jumlah
Total(5) (6) (7) (8) (9)
PERSEKUTUAN EROPAH :EUROPEAN UNION :
25.9 35.6 248.3 43.4 1.1 378.0
Austria 0.0 0.3 0.8 0.2 - 1.5Belgium 1.5 0.9 1.1 0.1 0.0 5.5Denmark 0.4 0.2 0.9 0.7 - 2.8Finland 0.1 1.8 0.4 0.4 - 2.7France 2.8 1.3 20.9 1.4 0.0 27.7Germany 6.1 3.9 74.6 15.0 0.0 102.8Greece 0.2 0.1 0.0 0.0 - 0.4Ireland 0.1 0.0 0.1 2.5 - 3.4Italy 1.7 7.4 20.1 3.8 0.0 35.2Luxembourg 0.1 0.0 0.0 0.0 - 0.1Netherlands 1.1 1.9 8.8 1.4 0.5 20.7Portugal 0.0 0.1 0.1 0.1 - 0.3Spain 0.1 3.9 1.5 0.2 0.0 6.2Sweden 0.2 0.5 1.6 0.3 - 2.5UnitedKingdom 11.4 13.3 117.3 17.2 0.5 166.1Lain-lain/Others - 0.0 0.0 0.0 - 0.0
Sumber:JabatanPerancangandanKemajuanEkonomi,KementerianKewangandanEkonomiSource : Department of Economic Planning and Development, Ministry of Finance and Economy
Nota:SeksyenBaranganrujukkepadaPenjenisanBarangDagangankemukasurat98Note : Commodity Sections refer to page 98 for classification of Trade Commodities
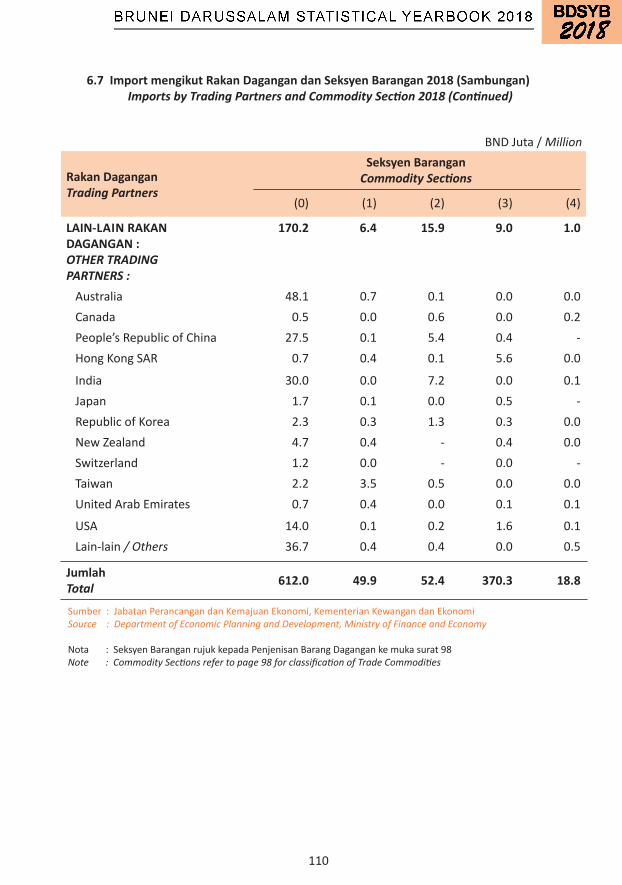
110
Rakan DaganganTrading Partners
Seksyen BaranganCommodity Sections
(0) (1) (2) (3) (4)
LAIN-LAIN RAKAN DAGANGAN :OTHER TRADING PARTNERS :
170.2 6.4 15.9 9.0 1.0
Australia 48.1 0.7 0.1 0.0 0.0Canada 0.5 0.0 0.6 0.0 0.2People’sRepublicofChina 27.5 0.1 5.4 0.4 -HongKongSAR 0.7 0.4 0.1 5.6 0.0
India 30.0 0.0 7.2 0.0 0.1Japan 1.7 0.1 0.0 0.5 -RepublicofKorea 2.3 0.3 1.3 0.3 0.0NewZealand 4.7 0.4 - 0.4 0.0Switzerland 1.2 0.0 - 0.0 -Taiwan 2.2 3.5 0.5 0.0 0.0UnitedArabEmirates 0.7 0.4 0.0 0.1 0.1
USA 14.0 0.1 0.2 1.6 0.1Lain-lain/ Others 36.7 0.4 0.4 0.0 0.5
JumlahTotal 612.0 49.9 52.4 370.3 18.8
6.7 Import mengikut Rakan Dagangan dan Seksyen Barangan 2018 (Sambungan) Imports by Trading Partners and Commodity Section 2018 (Continued)
BNDJuta/ Million
Sumber:JabatanPerancangandanKemajuanEkonomi,KementerianKewangandanEkonomiSource : Department of Economic Planning and Development, Ministry of Finance and Economy
Nota:SeksyenBaranganrujukkepadaPenjenisanBarangDagangankemukasurat98Note : Commodity Sections refer to page 98 for classification of Trade Commodities

111
Rakan DaganganTrading Partners
Seksyen BaranganCommodity Sections Jumlah
Total(5) (6) (7) (8) (9)
LAIN-LAIN RAKAN DAGANGAN :OTHER TRADING PARTNERS :
116.5 1,321.2 1,573.9 203.2 8.3 3,425.7
Australia 2.6 1.4 9.2 1.7 0.2 64.0
Canada 0.8 2.3 4.5 0.9 0.2 9.9People’sRepublicofChina 61.3 1,110.6 890.1 120.6 0.2 2,216.1HongKongSAR 3.2 19.4 25.5 15.9 0.0 71.0
India 4.9 3.8 43.9 3.8 0.4 94.2Japan 7.8 62.6 140.8 3.5 0.0 216.9RepublicofKorea 7.7 60.2 56.3 2.6 0.3 131.4NewZealand 0.1 0.1 0.7 0.1 0.0 6.5Switzerland 1.0 1.2 1.0 5.9 0.0 10.3Taiwan 1.8 7.3 5.2 2.7 0.0 23.3UnitedArabEmirates 0.7 3.9 2.2 0.9 0.3 9.2USA 18.9 36.6 378.1 37.4 0.4 487.3Lain-lain/Others 5.8 12.1 16.4 7.1 6.3 85.7
JumlahTotal 358.6 1,600.2 2,154.0 396.0 10.1 5,622.3
6.7 Import mengikut Rakan Dagangan dan Seksyen Barangan 2018 (Sambungan) Imports by Trading Partners and Commodity Section 2018 (Continued)
BNDJuta/ Million
Sumber:JabatanPerancangandanKemajuanEkonomi,KementerianKewangandanEkonomiSource : Department of Economic Planning and Development, Ministry of Finance and Economy
Nota:SeksyenBaranganrujukkepadaPenjenisanBarangDagangankemukasurat98Note : Commodity Sections refer to page 98 for classification of Trade Commodities

112
Rakan DaganganTrading Partners
Seksyen BaranganCommodity Sections
(0) (1) (2) (3) (4)
ASEAN : 8.4 0.1 25.0 2,065.7 0.0Cambodia - - - - -Indonesia 0.0 - 0.1 40.8 -LaoPDR - - - - -Malaysia 5.4 0.1 6.8 520.1 0.0 Peninsular 0.7 0.0 5.8 519.7 0.0 Sabah 0.1 0.0 0.0 0.0 - Sarawak 4.6 0.1 1.0 0.5 0.0Myanmar - - - - -Philippines 0.0 - - 29.6 -Singapore 2.7 0.0 18.1 587.1 0.0Thailand 0.0 0.0 0.0 888.0 -VietNam 0.1 - 0.0 - -
PERSEKUTUAN EROPAH :EUROPEAN UNION :
0.0 0.0 0.0 0.0 -
Austria - - - - -Denmark - - 0.0 - -Finland - - - - -France 0.0 0.0 - 0.0 -Germany - - - 0.0 -Italy 0.0 - 0.0 0.0 -Netherlands - - - - -Spain 0.0 - 0.0 - -Sweden - - - - -UnitedKingdom 0.0 - 0.0 0.0 -Lain-lain/Others - - - 0.0 -
6.8 Eksport mengikut Rakan Dagangan dan Seksyen Barangan 2018 Exports by Trading Partners and Commodity Section 2018
BNDJuta/ Million
Sumber:JabatanPerancangandanKemajuanEkonomi,KementerianKewangandanEkonomiSource : Department of Economic Planning and Development, Ministry of Finance and Economy
Nota:SeksyenBaranganrujukkepadaPenjenisanBarangDagangankemukasurat98Note : Commodity Sections refer to page 98 for classification of Trade Commodities
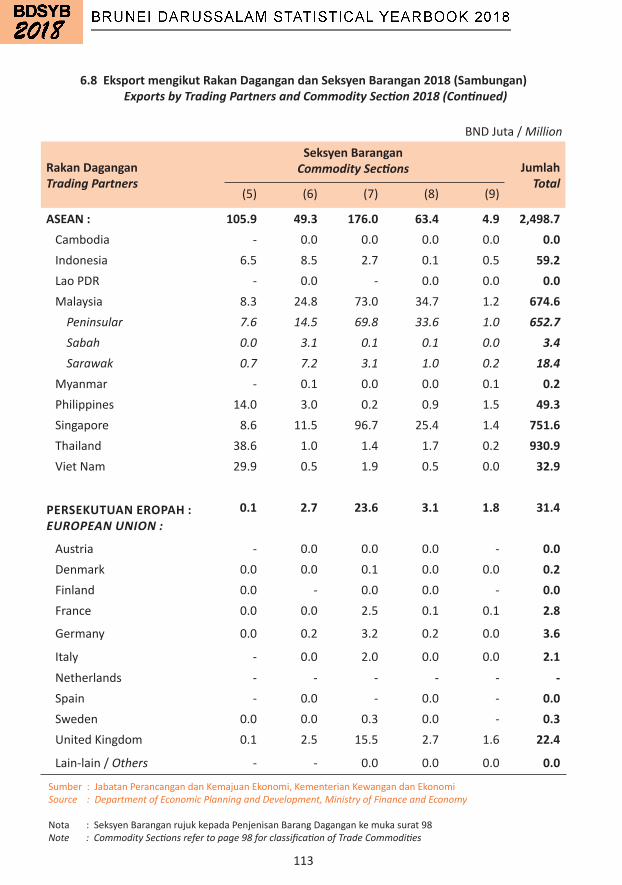
113
Rakan DaganganTrading Partners
Seksyen BaranganCommodity Sections Jumlah
Total(5) (6) (7) (8) (9)
ASEAN : 105.9 49.3 176.0 63.4 4.9 2,498.7Cambodia - 0.0 0.0 0.0 0.0 0.0Indonesia 6.5 8.5 2.7 0.1 0.5 59.2LaoPDR - 0.0 - 0.0 0.0 0.0Malaysia 8.3 24.8 73.0 34.7 1.2 674.6 Peninsular 7.6 14.5 69.8 33.6 1.0 652.7 Sabah 0.0 3.1 0.1 0.1 0.0 3.4 Sarawak 0.7 7.2 3.1 1.0 0.2 18.4Myanmar - 0.1 0.0 0.0 0.1 0.2Philippines 14.0 3.0 0.2 0.9 1.5 49.3Singapore 8.6 11.5 96.7 25.4 1.4 751.6Thailand 38.6 1.0 1.4 1.7 0.2 930.9VietNam 29.9 0.5 1.9 0.5 0.0 32.9
PERSEKUTUAN EROPAH :EUROPEAN UNION :
0.1 2.7 23.6 3.1 1.8 31.4
Austria - 0.0 0.0 0.0 - 0.0Denmark 0.0 0.0 0.1 0.0 0.0 0.2Finland 0.0 - 0.0 0.0 - 0.0France 0.0 0.0 2.5 0.1 0.1 2.8
Germany 0.0 0.2 3.2 0.2 0.0 3.6
Italy - 0.0 2.0 0.0 0.0 2.1Netherlands - - - - - -Spain - 0.0 - 0.0 - 0.0Sweden 0.0 0.0 0.3 0.0 - 0.3UnitedKingdom 0.1 2.5 15.5 2.7 1.6 22.4
Lain-lain/Others - - 0.0 0.0 0.0 0.0
6.8 Eksport mengikut Rakan Dagangan dan Seksyen Barangan 2018 (Sambungan) Exports by Trading Partners and Commodity Section 2018 (Continued)
BNDJuta/ Million
Sumber:JabatanPerancangandanKemajuanEkonomi,KementerianKewangandanEkonomiSource : Department of Economic Planning and Development, Ministry of Finance and Economy
Nota:SeksyenBaranganrujukkepadaPenjenisanBarangDagangankemukasurat98Note : Commodity Sections refer to page 98 for classification of Trade Commodities
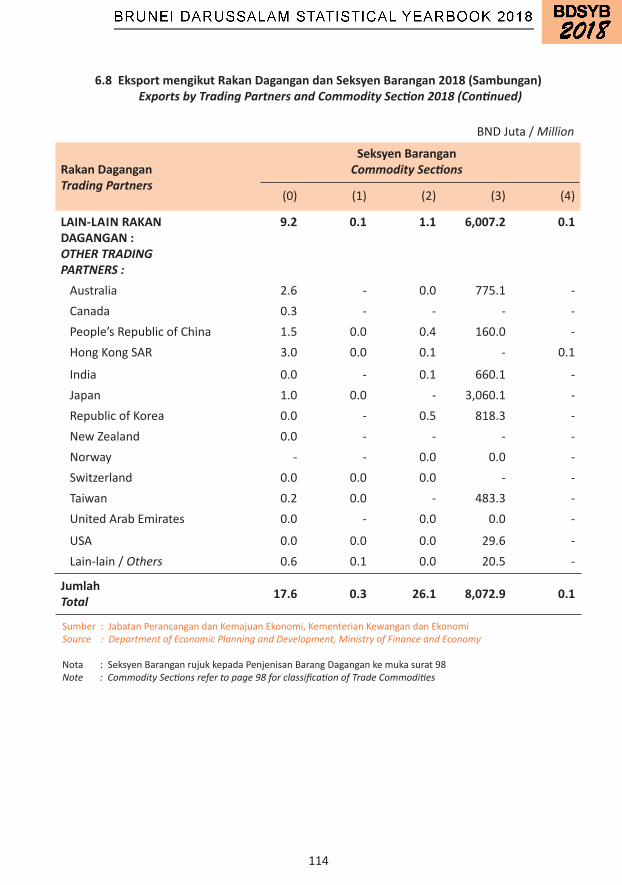
114
Rakan DaganganTrading Partners
Seksyen BaranganCommodity Sections
(0) (1) (2) (3) (4)
LAIN-LAIN RAKAN DAGANGAN :OTHER TRADING PARTNERS :
9.2 0.1 1.1 6,007.2 0.1
Australia 2.6 - 0.0 775.1 -Canada 0.3 - - - -People’sRepublicofChina 1.5 0.0 0.4 160.0 -HongKongSAR 3.0 0.0 0.1 - 0.1
India 0.0 - 0.1 660.1 -Japan 1.0 0.0 - 3,060.1 -RepublicofKorea 0.0 - 0.5 818.3 -NewZealand 0.0 - - - -Norway - - 0.0 0.0 -Switzerland 0.0 0.0 0.0 - -Taiwan 0.2 0.0 - 483.3 -UnitedArabEmirates 0.0 - 0.0 0.0 -
USA 0.0 0.0 0.0 29.6 -Lain-lain/Others 0.6 0.1 0.0 20.5 -
JumlahTotal 17.6 0.3 26.1 8,072.9 0.1
6.8 Eksport mengikut Rakan Dagangan dan Seksyen Barangan 2018 (Sambungan) Exports by Trading Partners and Commodity Section 2018 (Continued)
BNDJuta/ Million
Sumber:JabatanPerancangandanKemajuanEkonomi,KementerianKewangandanEkonomiSource : Department of Economic Planning and Development, Ministry of Finance and Economy
Nota:SeksyenBaranganrujukkepadaPenjenisanBarangDagangankemukasurat98Note : Commodity Sections refer to page 98 for classification of Trade Commodities

115
Rakan DaganganTrading Partners
Seksyen BaranganCommodity Sections Jumlah
Total(5) (6) (7) (8) (9)
LAIN-LAIN RAKAN DAGANGAN :OTHER TRADING PARTNERS :
226.7 36.3 32.2 22.9 6.1 6,341.7
Australia 0.2 0.2 1.6 0.4 0.5 780.6Canada 0.1 1.5 0.0 0.0 0.2 2.0People’sRepublicofChina 147.3 1.1 9.5 0.4 0.1 320.2HongKongSAR 0.0 2.1 0.9 6.6 0.6 13.5
India 2.2 0.3 0.5 0.0 0.7 663.9
Japan 18.2 0.0 0.6 0.0 0.2 3,080.2RepublicofKorea 8.4 0.0 2.1 0.3 0.4 830.1NewZealand 0.0 0.0 0.0 2.3 0.1 2.5Norway - 0.0 0.0 0.0 0.1 0.2Switzerland - 0.0 0.0 1.6 0.1 1.7Taiwan 49.6 0.0 0.0 0.0 0.0 533.3UnitedArabEmirates 0.0 0.1 0.7 5.1 0.1 6.1
USA 0.2 30.3 12.4 5.7 0.4 78.6Lain-lain/Others 0.6 0.5 3.7 0.4 2.6 29.0
JumlahTotal 332.7 88.3 231.8 89.3 12.8 8,871.8
6.8 Eksport mengikut Rakan Dagangan dan Seksyen Barangan 2018 (Sambungan) Exports by Trading Partners and Commodity Section 2018 (Continued)
BNDJuta/ Million
Sumber:JabatanPerancangandanKemajuanEkonomi,KementerianKewangandanEkonomiSource : Department of Economic Planning and Development, Ministry of Finance and Economy
Nota:SeksyenBaranganrujukkepadaPenjenisanBarangDagangankemukasurat98Note : Commodity Sections refer to page 98 for classification of Trade Commodities
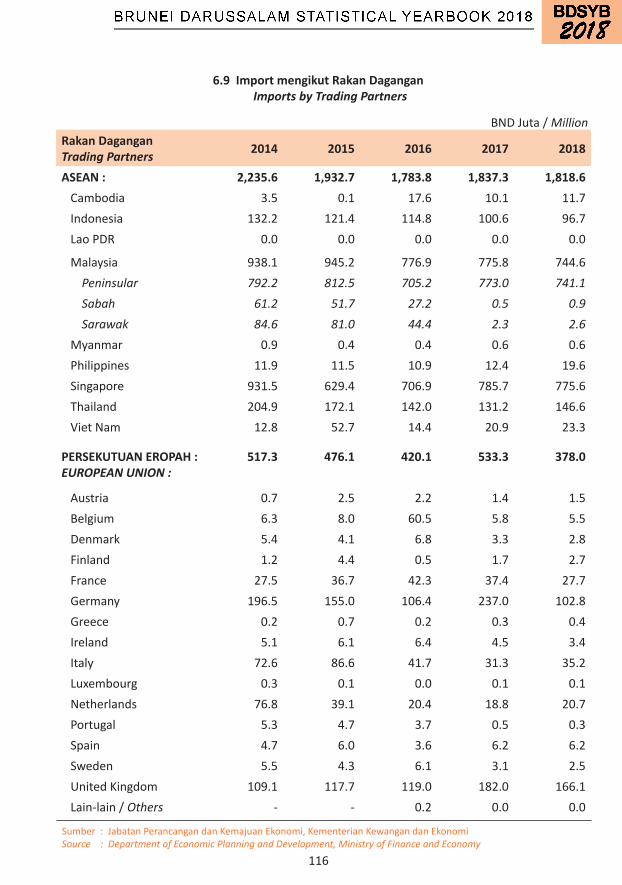
116
Rakan DaganganTrading Partners 2014 2015 2016 2017 2018
ASEAN : 2,235.6 1,932.7 1,783.8 1,837.3 1,818.6Cambodia 3.5 0.1 17.6 10.1 11.7Indonesia 132.2 121.4 114.8 100.6 96.7LaoPDR 0.0 0.0 0.0 0.0 0.0
Malaysia 938.1 945.2 776.9 775.8 744.6 Peninsular 792.2 812.5 705.2 773.0 741.1 Sabah 61.2 51.7 27.2 0.5 0.9 Sarawak 84.6 81.0 44.4 2.3 2.6Myanmar 0.9 0.4 0.4 0.6 0.6Philippines 11.9 11.5 10.9 12.4 19.6Singapore 931.5 629.4 706.9 785.7 775.6Thailand 204.9 172.1 142.0 131.2 146.6VietNam 12.8 52.7 14.4 20.9 23.3
PERSEKUTUAN EROPAH :EUROPEAN UNION :
517.3 476.1 420.1 533.3 378.0
Austria 0.7 2.5 2.2 1.4 1.5Belgium 6.3 8.0 60.5 5.8 5.5Denmark 5.4 4.1 6.8 3.3 2.8Finland 1.2 4.4 0.5 1.7 2.7France 27.5 36.7 42.3 37.4 27.7Germany 196.5 155.0 106.4 237.0 102.8Greece 0.2 0.7 0.2 0.3 0.4Ireland 5.1 6.1 6.4 4.5 3.4Italy 72.6 86.6 41.7 31.3 35.2Luxembourg 0.3 0.1 0.0 0.1 0.1Netherlands 76.8 39.1 20.4 18.8 20.7Portugal 5.3 4.7 3.7 0.5 0.3Spain 4.7 6.0 3.6 6.2 6.2Sweden 5.5 4.3 6.1 3.1 2.5UnitedKingdom 109.1 117.7 119.0 182.0 166.1Lain-lain/Others - - 0.2 0.0 0.0
6.9 Import mengikut Rakan Dagangan Imports by Trading Partners
BNDJuta/ Million
Sumber:JabatanPerancangandanKemajuanEkonomi,KementerianKewangandanEkonomiSource : Department of Economic Planning and Development, Ministry of Finance and Economy

117
Rakan DaganganTrading Partners 2014 2015 2016 2017 2018
LAIN-LAIN RAKAN DAGANGAN :OTHER TRADING PARTNERS :
1,803.2 2,038.7 1,485.0 1,886.2 3,425.7
Australia 62.5 66.2 59.7 60.1 64.0Brazil 1.3 1.1 1.1 0.9 1.9
Canada 42.9 7.3 15.1 7.2 9.9
People’sRepublicofChina 453.0 516.9 480.9 885.3 2,216.1HongKongSAR 36.1 38.5 30.4 33.6 71.0India 59.1 51.4 54.7 69.6 94.2Japan 183.5 335.8 158.1 166.3 216.9RepublicofKorea 396.1 413.6 133.0 116.5 131.4NewZealand 14.9 8.3 5.9 7.4 6.5Switzerland 18.1 17.2 18.2 15.5 10.3Taiwan 45.1 36.2 24.8 20.5 23.3UnitedArabEmirates 8.7 8.9 6.2 7.4 9.2USA 411.1 472.2 426.5 402.6 487.3Lain-lain/Others 70.8 65.0 70.3 93.4 83.9
JumlahTotal 4,556.2 4,447.5 3,689.0 4,256.8 5,622.3
6.9 Import mengikut Rakan Dagangan (Sambungan) Imports by Trading Partners (Continued)
BNDJuta/ Million
Sumber:JabatanPerancangandanKemajuanEkonomi,KementerianKewangandanEkonomiSource : Department of Economic Planning and Development, Ministry of Finance and Economy
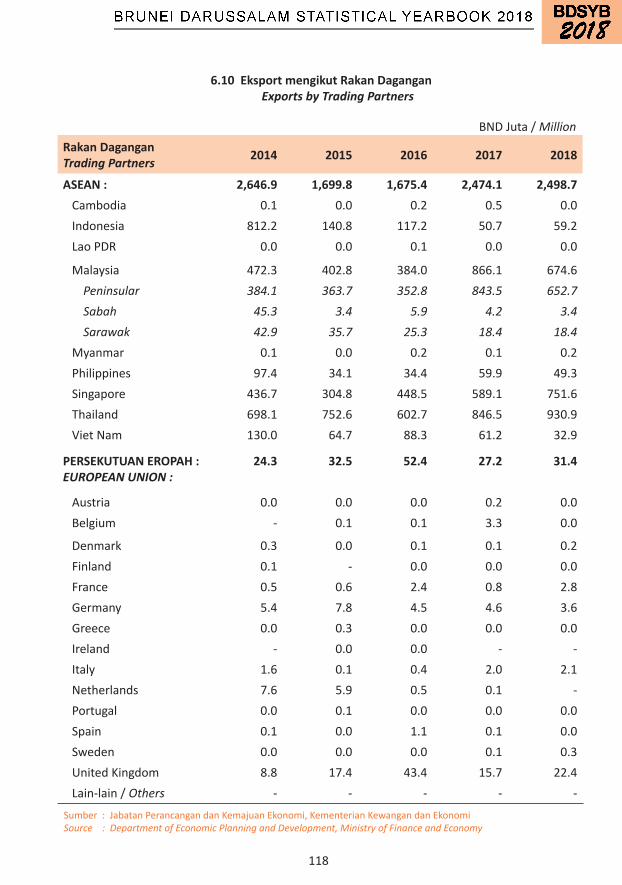
118
Rakan DaganganTrading Partners 2014 2015 2016 2017 2018
ASEAN : 2,646.9 1,699.8 1,675.4 2,474.1 2,498.7Cambodia 0.1 0.0 0.2 0.5 0.0Indonesia 812.2 140.8 117.2 50.7 59.2LaoPDR 0.0 0.0 0.1 0.0 0.0
Malaysia 472.3 402.8 384.0 866.1 674.6 Peninsular 384.1 363.7 352.8 843.5 652.7 Sabah 45.3 3.4 5.9 4.2 3.4 Sarawak 42.9 35.7 25.3 18.4 18.4Myanmar 0.1 0.0 0.2 0.1 0.2Philippines 97.4 34.1 34.4 59.9 49.3Singapore 436.7 304.8 448.5 589.1 751.6Thailand 698.1 752.6 602.7 846.5 930.9VietNam 130.0 64.7 88.3 61.2 32.9
PERSEKUTUAN EROPAH :EUROPEAN UNION :
24.3 32.5 52.4 27.2 31.4
Austria 0.0 0.0 0.0 0.2 0.0Belgium - 0.1 0.1 3.3 0.0
Denmark 0.3 0.0 0.1 0.1 0.2Finland 0.1 - 0.0 0.0 0.0France 0.5 0.6 2.4 0.8 2.8Germany 5.4 7.8 4.5 4.6 3.6Greece 0.0 0.3 0.0 0.0 0.0Ireland - 0.0 0.0 - -Italy 1.6 0.1 0.4 2.0 2.1Netherlands 7.6 5.9 0.5 0.1 -Portugal 0.0 0.1 0.0 0.0 0.0Spain 0.1 0.0 1.1 0.1 0.0Sweden 0.0 0.0 0.0 0.1 0.3UnitedKingdom 8.8 17.4 43.4 15.7 22.4Lain-lain/Others - - - - -
6.10 Eksport mengikut Rakan Dagangan Exports by Trading Partners
Sumber:JabatanPerancangandanKemajuanEkonomi,KementerianKewangandanEkonomiSource : Department of Economic Planning and Development, Ministry of Finance and Economy
BNDJuta/ Million
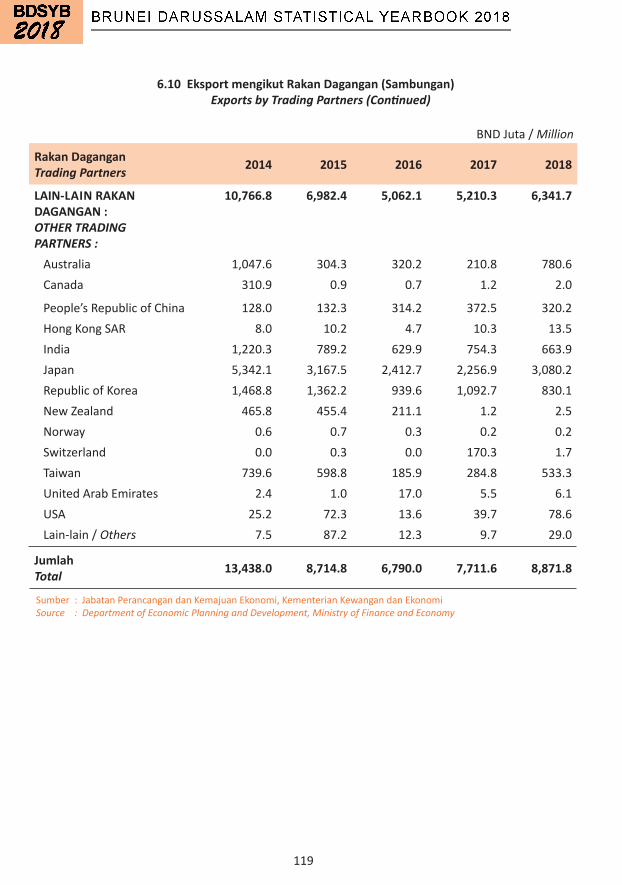
119
Rakan DaganganTrading Partners 2014 2015 2016 2017 2018
LAIN-LAIN RAKAN DAGANGAN :OTHER TRADING PARTNERS :
10,766.8 6,982.4 5,062.1 5,210.3 6,341.7
Australia 1,047.6 304.3 320.2 210.8 780.6Canada 310.9 0.9 0.7 1.2 2.0
People’sRepublicofChina 128.0 132.3 314.2 372.5 320.2HongKongSAR 8.0 10.2 4.7 10.3 13.5India 1,220.3 789.2 629.9 754.3 663.9Japan 5,342.1 3,167.5 2,412.7 2,256.9 3,080.2RepublicofKorea 1,468.8 1,362.2 939.6 1,092.7 830.1NewZealand 465.8 455.4 211.1 1.2 2.5Norway 0.6 0.7 0.3 0.2 0.2Switzerland 0.0 0.3 0.0 170.3 1.7Taiwan 739.6 598.8 185.9 284.8 533.3UnitedArabEmirates 2.4 1.0 17.0 5.5 6.1USA 25.2 72.3 13.6 39.7 78.6Lain-lain/Others 7.5 87.2 12.3 9.7 29.0
JumlahTotal 13,438.0 8,714.8 6,790.0 7,711.6 8,871.8
6.10 Eksport mengikut Rakan Dagangan (Sambungan) Exports by Trading Partners (Continued)
Sumber:JabatanPerancangandanKemajuanEkonomi,KementerianKewangandanEkonomiSource : Department of Economic Planning and Development, Ministry of Finance and Economy
BNDJuta/ Million

120
Rakan DaganganTrading Partners
Minyak MentahCrude Oil
Gas Cecair AsliLiquefied
Natural Gas
MetanolMethanol
JumlahTotal
ASEAN : 1,743.3 317.2 99.8 2,160.3Indonesia 40.8 - 6.4 47.2Malaysia 246.0 269.0 4.2 519.2
Peninsular 246.0 269.0 4.2 519.2 Sabah - - - -
Sarawak - - - -Philippines 29.6 - 14.0 43.6Singapore 587.0 - 7.1 594.1Thailand 839.9 48.2 38.5 926.5VietNam - - 29.6 29.6
LAIN-LAIN RAKAN DAGANGAN :OTHER TRADING PARTNERS :
1,900.2 4,107.0 223.0 6,230.1
Australia 775.1 - - 775.1People’sRepublicofChina - 160.0 147.2 307.2HongKongSAR - - - -India 660.1 - - 660.1Japan 83.6 2,976.6 18.2 3,078.3RepublicofKorea 331.2 487.1 8.3 826.6NewZealand - - - -Taiwan - 483.3 49.3 532.6USA 29.6 - - 29.6OtherCountriesinOtherAfrica 20.5 - - 20.5
JumlahTotal 3,643.5 4,424.2 322.7 8,390.4
6.11 Nilai Eksport Utama mengikut Rakan Dagangan, 2018 Value of Major Exports by Trading Partners, 2018
BNDJuta/ Million
Sumber:JabatanPerancangandanKemajuanEkonomi,KementerianKewangandanEkonomiSource : Department of Economic Planning and Development, Ministry of Finance and Economy
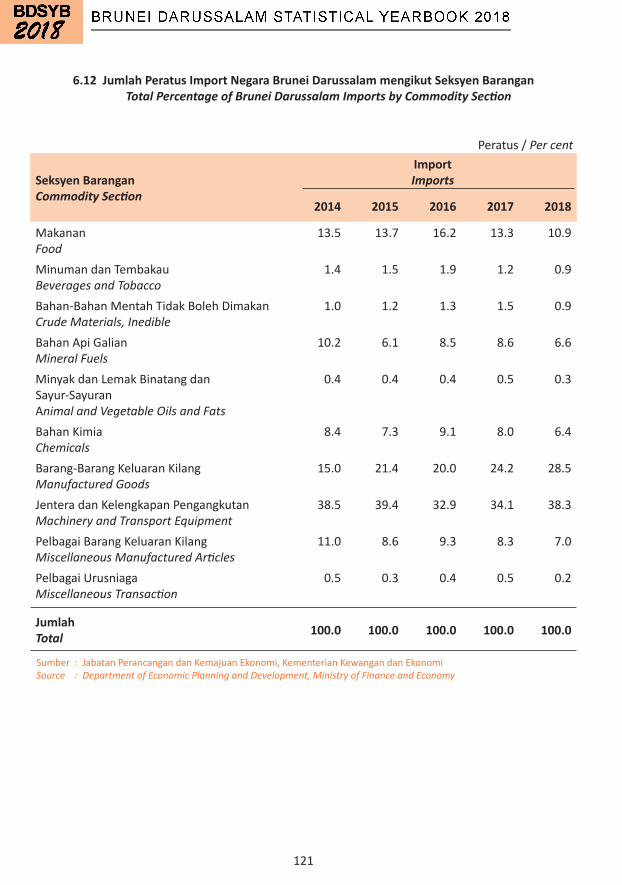
121
Seksyen BaranganCommodity Section
ImportImports
2014 2015 2016 2017 2018
MakananFood
13.5 13.7 16.2 13.3 10.9
MinumandanTembakauBeverages and Tobacco
1.4 1.5 1.9 1.2 0.9
Bahan-BahanMentahTidakBolehDimakanCrude Materials, Inedible
1.0 1.2 1.3 1.5 0.9
BahanApiGalianMineral Fuels
10.2 6.1 8.5 8.6 6.6
MinyakdanLemakBinatangdanSayur-SayuranAnimal and Vegetable Oils and Fats
0.4 0.4 0.4 0.5 0.3
BahanKimiaChemicals
8.4 7.3 9.1 8.0 6.4
Barang-BarangKeluaranKilangManufactured Goods
15.0 21.4 20.0 24.2 28.5
JenteradanKelengkapanPengangkutanMachinery and Transport Equipment
38.5 39.4 32.9 34.1 38.3
PelbagaiBarangKeluaranKilangMiscellaneous Manufactured Articles
11.0 8.6 9.3 8.3 7.0
PelbagaiUrusniagaMiscellaneous Transaction
0.5 0.3 0.4 0.5 0.2
JumlahTotal 100.0 100.0 100.0 100.0 100.0
6.12 Jumlah Peratus Import Negara Brunei Darussalam mengikut Seksyen Barangan Total Percentage of Brunei Darussalam Imports by Commodity Section
Peratus/Per cent
Sumber:JabatanPerancangandanKemajuanEkonomi,KementerianKewangandanEkonomiSource : Department of Economic Planning and Development, Ministry of Finance and Economy
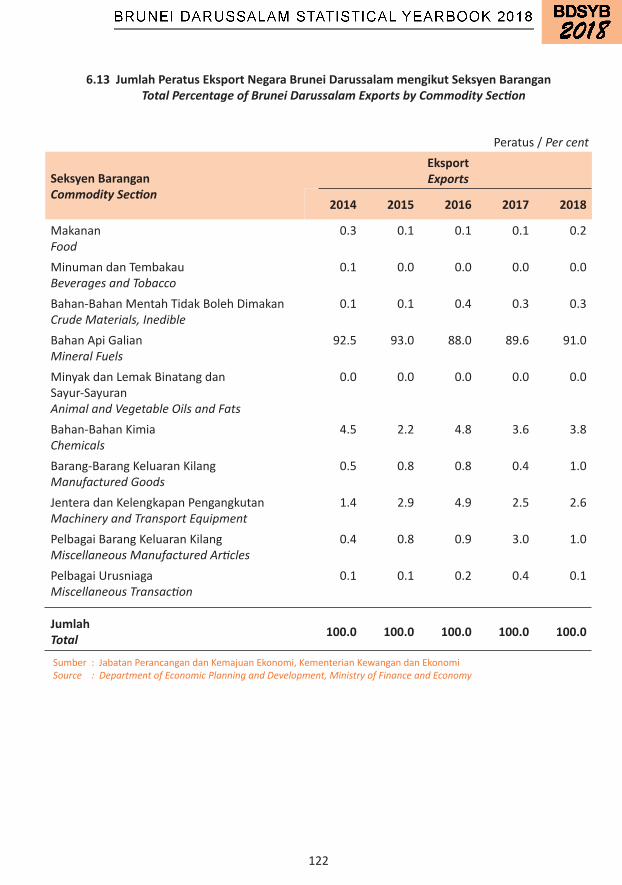
122
Seksyen BaranganCommodity Section
EksportExports
2014 2015 2016 2017 2018
MakananFood
0.3 0.1 0.1 0.1 0.2
MinumandanTembakauBeverages and Tobacco
0.1 0.0 0.0 0.0 0.0
Bahan-BahanMentahTidakBolehDimakanCrude Materials, Inedible
0.1 0.1 0.4 0.3 0.3
BahanApiGalianMineral Fuels
92.5 93.0 88.0 89.6 91.0
MinyakdanLemakBinatangdanSayur-SayuranAnimal and Vegetable Oils and Fats
0.0 0.0 0.0 0.0 0.0
Bahan-BahanKimiaChemicals
4.5 2.2 4.8 3.6 3.8
Barang-BarangKeluaranKilangManufactured Goods
0.5 0.8 0.8 0.4 1.0
JenteradanKelengkapanPengangkutanMachinery and Transport Equipment
1.4 2.9 4.9 2.5 2.6
PelbagaiBarangKeluaranKilangMiscellaneous Manufactured Articles
0.4 0.8 0.9 3.0 1.0
PelbagaiUrusniagaMiscellaneous Transaction
0.1 0.1 0.2 0.4 0.1
JumlahTotal 100.0 100.0 100.0 100.0 100.0
6.13 Jumlah Peratus Eksport Negara Brunei Darussalam mengikut Seksyen Barangan Total Percentage of Brunei Darussalam Exports by Commodity Section
Peratus/Per cent
Sumber:JabatanPerancangandanKemajuanEkonomi,KementerianKewangandanEkonomiSource : Department of Economic Planning and Development, Ministry of Finance and Economy
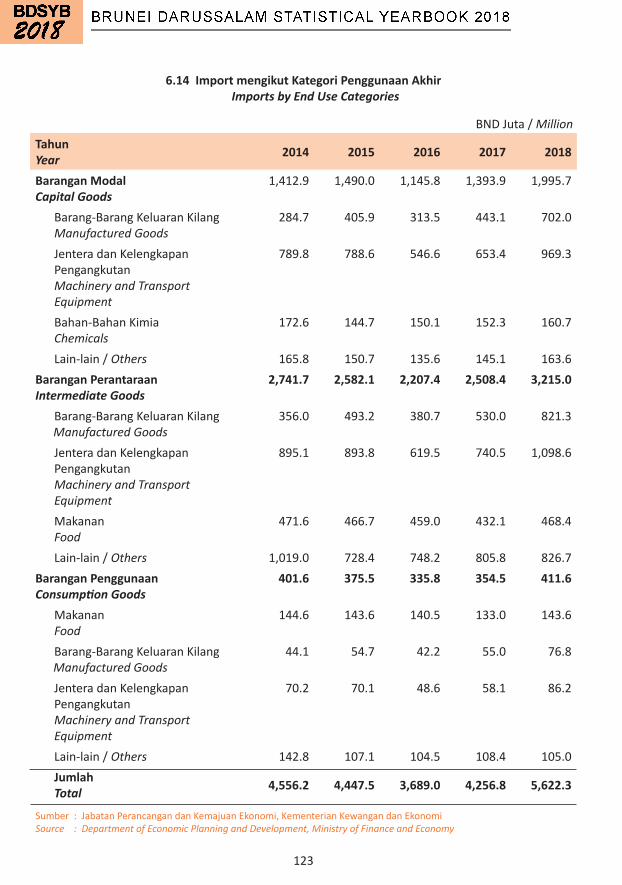
123
TahunYear 2014 2015 2016 2017 2018
Barangan ModalCapital Goods
1,412.9 1,490.0 1,145.8 1,393.9 1,995.7
Barang-BarangKeluaranKilangManufactured Goods
284.7 405.9 313.5 443.1 702.0
JenteradanKelengkapanPengangkutanMachinery and Transport Equipment
789.8 788.6 546.6 653.4 969.3
Bahan-BahanKimiaChemicals
172.6 144.7 150.1 152.3 160.7
Lain-lain/Others 165.8 150.7 135.6 145.1 163.6Barangan PerantaraanIntermediate Goods
2,741.7 2,582.1 2,207.4 2,508.4 3,215.0
Barang-BarangKeluaranKilang Manufactured Goods
356.0 493.2 380.7 530.0 821.3
JenteradanKelengkapanPengangkutanMachinery and Transport Equipment
895.1 893.8 619.5 740.5 1,098.6
MakananFood
471.6 466.7 459.0 432.1 468.4
Lain-lain/Others 1,019.0 728.4 748.2 805.8 826.7Barangan Penggunaan
Consumption Goods401.6 375.5 335.8 354.5 411.6
MakananFood
144.6 143.6 140.5 133.0 143.6
Barang-BarangKeluaranKilang Manufactured Goods
44.1 54.7 42.2 55.0 76.8
JenteradanKelengkapanPengangkutanMachinery and Transport Equipment
70.2 70.1 48.6 58.1 86.2
Lain-lain/Others 142.8 107.1 104.5 108.4 105.0JumlahTotal 4,556.2 4,447.5 3,689.0 4,256.8 5,622.3
6.14 Import mengikut Kategori Penggunaan Akhir Imports by End Use Categories
BNDJuta/Million
Sumber:JabatanPerancangandanKemajuanEkonomi,KementerianKewangandanEkonomiSource : Department of Economic Planning and Development, Ministry of Finance and Economy
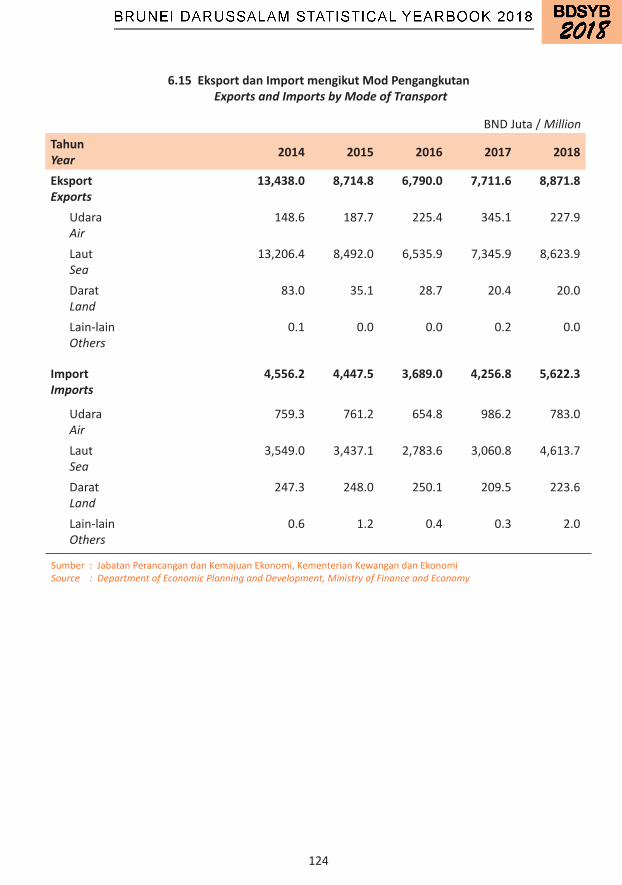
124
TahunYear 2014 2015 2016 2017 2018
EksportExports
13,438.0 8,714.8 6,790.0 7,711.6 8,871.8
UdaraAir
148.6 187.7 225.4 345.1 227.9
LautSea
13,206.4 8,492.0 6,535.9 7,345.9 8,623.9
DaratLand
83.0 35.1 28.7 20.4 20.0
Lain-lainOthers
0.1 0.0 0.0 0.2 0.0
ImportImports
4,556.2 4,447.5 3,689.0 4,256.8 5,622.3
UdaraAir
759.3 761.2 654.8 986.2 783.0
LautSea
3,549.0 3,437.1 2,783.6 3,060.8 4,613.7
DaratLand
247.3 248.0 250.1 209.5 223.6
Lain-lainOthers
0.6 1.2 0.4 0.3 2.0
6.15 Eksport dan Import mengikut Mod Pengangkutan Exports and Imports by Mode of Transport
BNDJuta/Million
Sumber:JabatanPerancangandanKemajuanEkonomi,KementerianKewangandanEkonomiSource : Department of Economic Planning and Development, Ministry of Finance and Economy
7 PELABURAN LANGSUNG ASING FOREIGN DIRECT INVESTMENT
126
Explanatory Note
Foreign Direct Investment (FDI) statistics compiled according to the Directional principle. FDI implies that a resident equity is one economy exercises a significant degree of influence over the management of a business enterprise resident in another economy. Ownership of 10 percent or more of the ordinary shares or rating power (for incorporated enterprise) or the equivalent (for unincorporated enterprises) is taken as evidence of a significant degree of influence over management.
FDI components comprise of equity investment (including reinvested earnings) and debt instrument transactions.
• Equity investment consists of all instruments and records that acknowledge claims on the residual value of a corporation or quasi-corporation, after the claims of all creditors have been met. This includes reinvested earnings which is the direct investor’s share (in proportion to equity participation) of earnings not distributed as dividends.
• Debts instrument refers to direct investment debt positions between affiliated enterprises. This includes loans and trade credits.
7 FOREIGN DIRECT INVESTMENT
Nota Keterangan
Perangkaan Pelaburan Langsung Asing (FDI) disusun mengikut prinsip Arah Aliran. FDI merujuk kepadaentiti residendalamsebuahekonomiyangmenjalankanpengaruhyangkuatkeataspengurusansesuatuperniagaandalamekonomilain.Pemilikan10peratusataulebihkeatassyerbiasaataukuasaundian(untukperusahaandiperbadankan)atausetaraf (bagiyang tidakdiperbadankan)adalahsebagaibuktipengaruhyangkuatkeataspengurusan.
Komponen FDImeliputi ekuiti pelaburan (termasuk pendapatan dilabur semula) dan transaksi-transaksiinstrumenhutang.
• Ekuitipelaburan terdiridaripadasemua instrumendanrekodyangmengakui tuntutankeatasnilaibakisesuatuperbadananataukuasi-perbadanan,selepastuntutansemuapemiutangtelahdipenuhi.Ianyatermasukpendapatandilabursemulayangterdiridaripadasahampelaburlangsung(berkadarandenganpenyertaanekuiti)pendapatanyangtidakdiagihkansebagaidividen. •Instrumenhutangmerujukkepadakedudukanhutangpelaburanlangsungdiantarasyarikat-syarikatbersekutu.Ianyatermasukpinjamandankreditperdagangan.
7 PELABURAN LANGSUNG ASING

127
Pelaburan Investment 2014 2015 2016 2017 2018
Jumlah Penyertaan PelaburanTotal Investment Participation
1,341.8 181.5 (148.8) 773.9 1,245.2
PenyertaanPelaburanTempatanDomestic Investment Participation
622.3 (56.7) 58.0 138.6 565.4
Kerajaan Government
553.9 (141.7) (418.4) (365.2) 360.8
Lain-lain(1)Others
68.4 85.0 476.3 503.8 204.6
PelaburanLangsungAsingForeign Direct Investment
719.5 238.2 (206.7) 635.3 679.8
7.1 Penyertaan Pelaburan di Negara Brunei Darussalam Investment Participation in Brunei Darussalam
Sumber:JabatanPerancangandanKemajuanEkonomi,KementerianKewangandanEkonomiSource : Department of Economic Planning and Development, Ministry of Finance and Economy
Nota:(1)Lain-laintermasuksyarikatswasta,isirumahdanlain-lainNote : Others include private company, household and others
: Datahanyameliputisyarikat-syarikatdibawahKajianPelaburanAntarabangsadanPerkhidmatanAntarabangsaJabatanPerancangandanKemajuanEkonomi : Data only covered companies reported under Department of Economic Planning and Development Survey of International Investment and International Services
BNDJuta/ Million
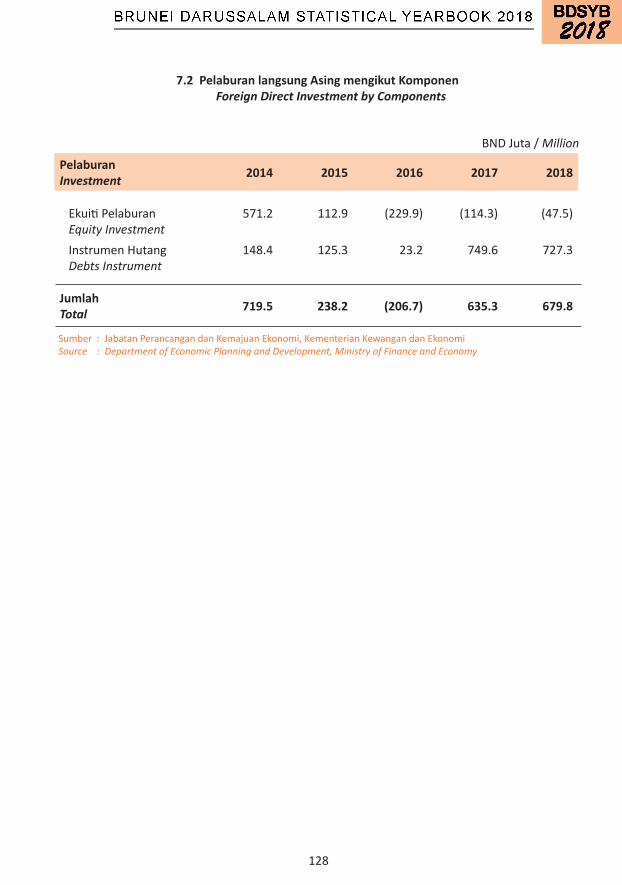
128
PelaburanInvestment 2014 2015 2016 2017 2018
EkuitiPelaburan Equity Investment
571.2 112.9 (229.9) (114.3) (47.5)
InstrumenHutang Debts Instrument
148.4 125.3 23.2 749.6 727.3
JumlahTotal 719.5 238.2 (206.7) 635.3 679.8
7.2 Pelaburan langsung Asing mengikut Komponen Foreign Direct Investment by Components
BNDJuta/ Million
Sumber:JabatanPerancangandanKemajuanEkonomi,KementerianKewangandanEkonomiSource : Department of Economic Planning and Development, Ministry of Finance and Economy
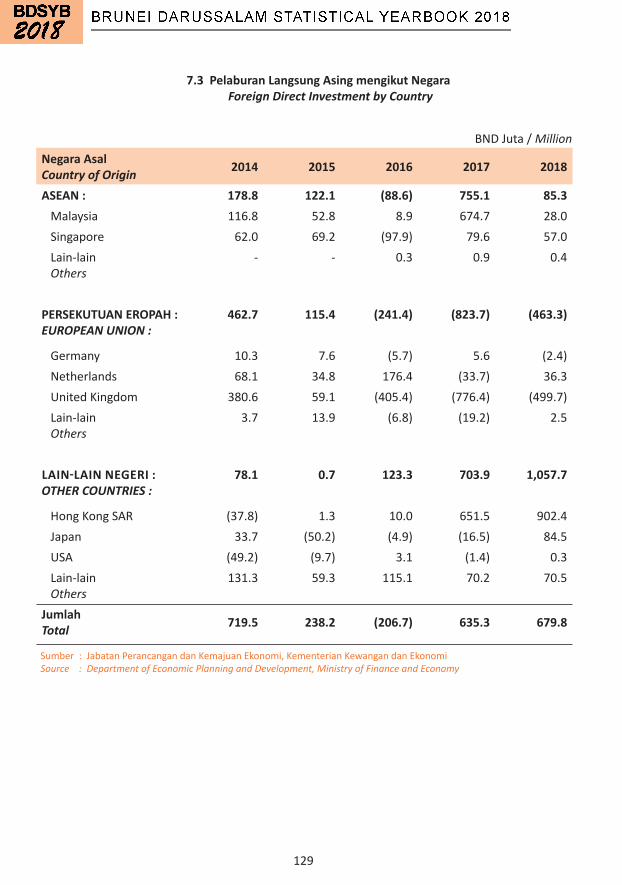
129
Negara AsalCountry of Origin 2014 2015 2016 2017 2018
ASEAN : 178.8 122.1 (88.6) 755.1 85.3Malaysia 116.8 52.8 8.9 674.7 28.0Singapore 62.0 69.2 (97.9) 79.6 57.0Lain-lain Others
- - 0.3 0.9 0.4
PERSEKUTUAN EROPAH :EUROPEAN UNION :
462.7 115.4 (241.4) (823.7) (463.3)
Germany 10.3 7.6 (5.7) 5.6 (2.4)Netherlands 68.1 34.8 176.4 (33.7) 36.3UnitedKingdom 380.6 59.1 (405.4) (776.4) (499.7)Lain-lain Others
3.7 13.9 (6.8) (19.2) 2.5
LAIN-LAIN NEGERI :OTHER COUNTRIES :
78.1 0.7 123.3 703.9 1,057.7
HongKongSAR (37.8) 1.3 10.0 651.5 902.4Japan 33.7 (50.2) (4.9) (16.5) 84.5USA (49.2) (9.7) 3.1 (1.4) 0.3Lain-lain Others
131.3 59.3 115.1 70.2 70.5
JumlahTotal 719.5 238.2 (206.7) 635.3 679.8
7.3 Pelaburan Langsung Asing mengikut Negara Foreign Direct Investment by Country
BNDJuta/ Million
Sumber:JabatanPerancangandanKemajuanEkonomi,KementerianKewangandanEkonomiSource : Department of Economic Planning and Development, Ministry of Finance and Economy
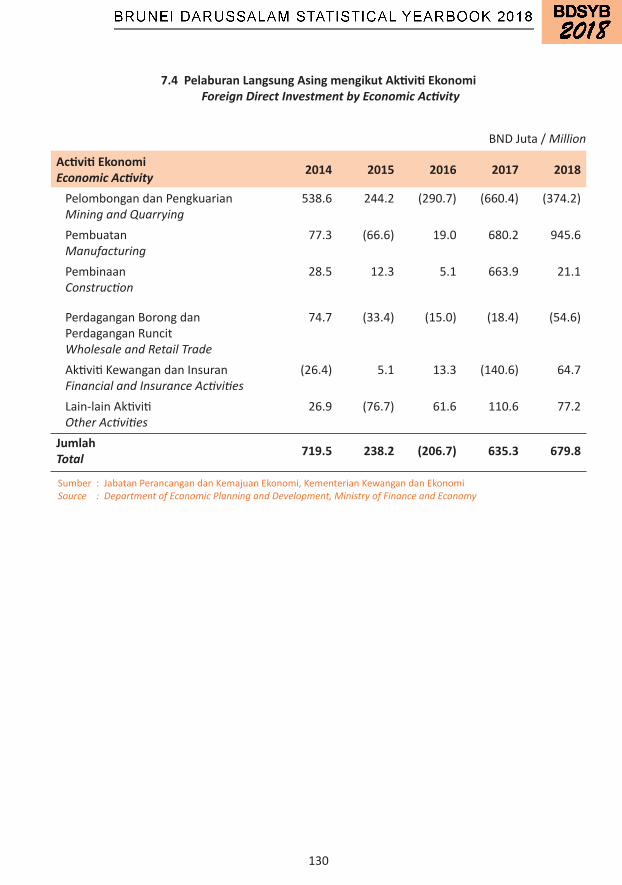
130
Activiti EkonomiEconomic Activity 2014 2015 2016 2017 2018
PelombongandanPengkuarian Mining and Quarrying
538.6 244.2 (290.7) (660.4) (374.2)
Pembuatan Manufacturing
77.3 (66.6) 19.0 680.2 945.6
Pembinaan Construction
28.5 12.3 5.1 663.9 21.1
PerdaganganBorongdanPerdaganganRuncit Wholesale and Retail Trade
74.7 (33.4) (15.0) (18.4) (54.6)
AktivitiKewangandanInsuran Financial and Insurance Activities
(26.4) 5.1 13.3 (140.6) 64.7
Lain-lainAktiviti Other Activities
26.9 (76.7) 61.6 110.6 77.2
Jumlah Total 719.5 238.2 (206.7) 635.3 679.8
7.4 Pelaburan Langsung Asing mengikut Aktiviti Ekonomi Foreign Direct Investment by Economic Activity
BNDJuta/ Million
Sumber:JabatanPerancangandanKemajuanEkonomi,KementerianKewangandanEkonomiSource : Department of Economic Planning and Development, Ministry of Finance and Economy
8 KEWANGAN KERAJAANGOVERNMENT FINANCE
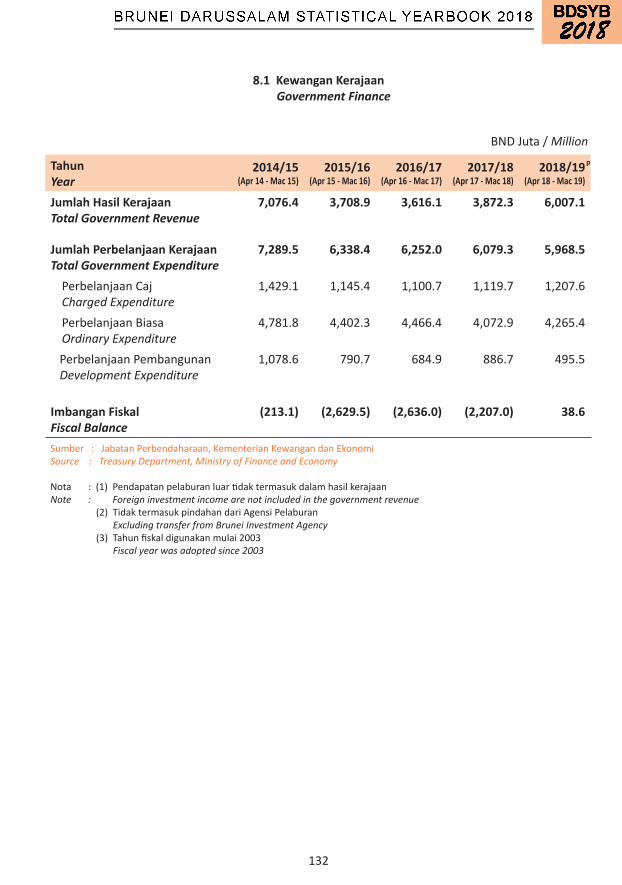
132
TahunYear
2014/15(Apr 14 - Mac 15)
2015/16(Apr 15 - Mac 16)
2016/17 (Apr 16 - Mac 17)
2017/18 (Apr 17 - Mac 18)
2018/19 (Apr 18 - Mac 19)
Jumlah Hasil KerajaanTotal Government Revenue
7,076.4 3,708.9 3,616.1 3,872.3 6,007.1
Jumlah Perbelanjaan KerajaanTotal Government Expenditure
7,289.5 6,338.4 6,252.0 6,079.3 5,968.5
PerbelanjaanCaj Charged Expenditure
1,429.1 1,145.4 1,100.7 1,119.7 1,207.6
PerbelanjaanBiasa Ordinary Expenditure
4,781.8 4,402.3 4,466.4 4,072.9 4,265.4
PerbelanjaanPembangunan Development Expenditure
1,078.6 790.7 684.9 886.7 495.5
Imbangan FiskalFiscal Balance
(213.1) (2,629.5) (2,636.0) (2,207.0) 38.6
8.1 Kewangan Kerajaan Government Finance
BNDJuta/ Million
Sumber:JabatanPerbendaharaan,KementerianKewangandanEkonomiSource : Treasury Department, Ministry of Finance and Economy
Nota:(1)PendapatanpelaburanluartidaktermasukdalamhasilkerajaanNote : Foreign investment income are not included in the government revenue(2)TidaktermasukpindahandariAgensiPelaburan Excluding transfer from Brunei Investment Agency (3)Tahunfiskaldigunakanmulai2003 Fiscal year was adopted since 2003
p
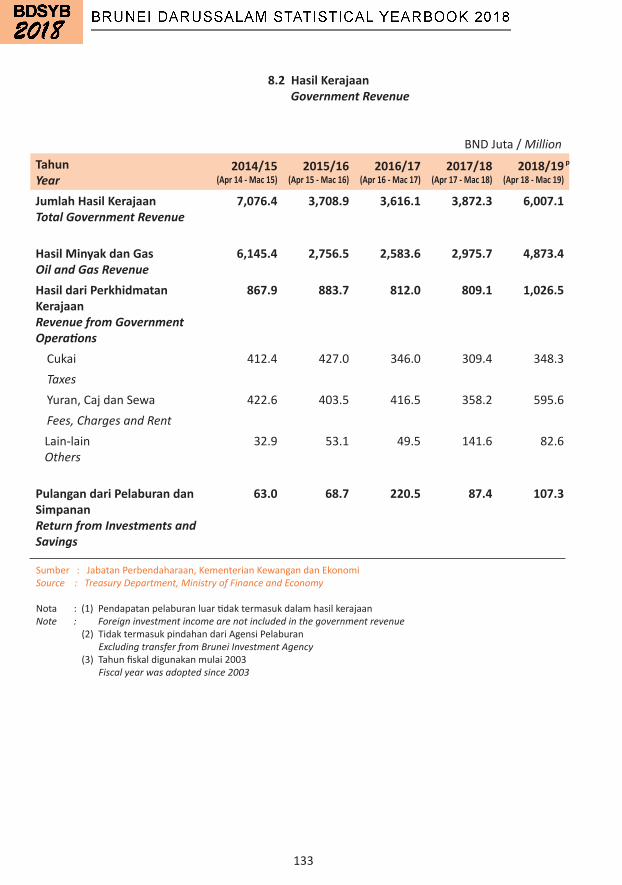
133
TahunYear
2014/15(Apr 14 - Mac 15)
2015/16(Apr 15 - Mac 16)
2016/17(Apr 16 - Mac 17)
2017/18(Apr 17 - Mac 18)
2018/19(Apr 18 - Mac 19)
Jumlah Hasil KerajaanTotal Government Revenue
7,076.4 3,708.9 3,616.1 3,872.3 6,007.1
Hasil Minyak dan GasOil and Gas Revenue
6,145.4 2,756.5 2,583.6 2,975.7 4,873.4
Hasil dari Perkhidmatan KerajaanRevenue from Government Operations
867.9 883.7 812.0 809.1 1,026.5
Cukai 412.4 427.0 346.0 309.4 348.3 TaxesYuran,CajdanSewa 422.6 403.5 416.5 358.2 595.6 Fees, Charges and RentLain-lain Others
32.9 53.1 49.5 141.6 82.6
Pulangan dari Pelaburan dan SimpananReturn from Investments andSavings
63.0 68.7 220.5 87.4 107.3
8.2 Hasil Kerajaan Government Revenue
BNDJuta/ Million
Sumber:JabatanPerbendaharaan,KementerianKewangandanEkonomiSource : Treasury Department, Ministry of Finance and Economy
Nota:(1)PendapatanpelaburanluartidaktermasukdalamhasilkerajaanNote : Foreign investment income are not included in the government revenue(2)TidaktermasukpindahandariAgensiPelaburan Excluding transfer from Brunei Investment Agency (3)Tahunfiskaldigunakanmulai2003 Fiscal year was adopted since 2003
p
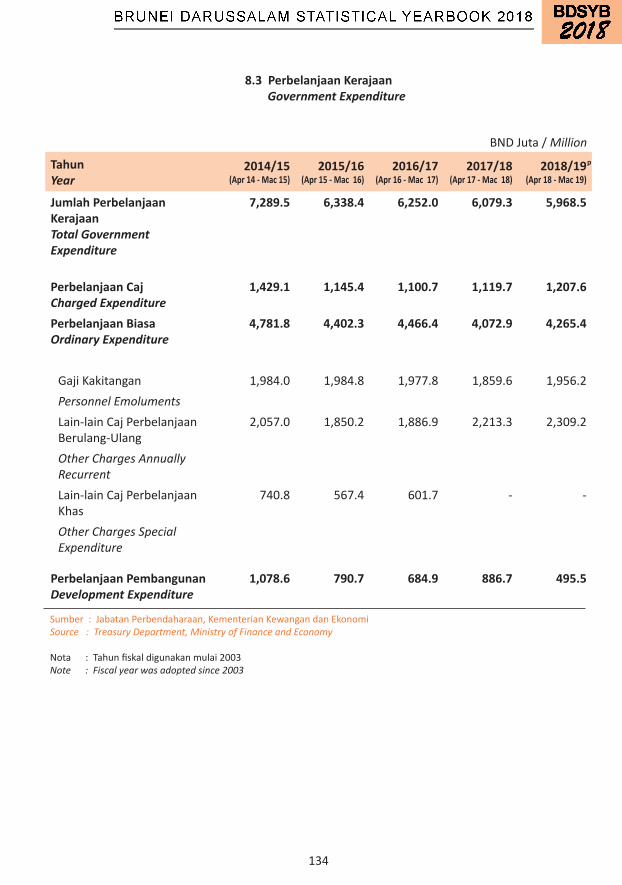
134
TahunYear
2014/15(Apr 14 - Mac 15)
2015/16(Apr 15 - Mac 16)
2016/17(Apr 16 - Mac 17)
2017/18(Apr 17 - Mac 18)
2018/19(Apr 18 - Mac 19)
Jumlah Perbelanjaan KerajaanTotal Government Expenditure
7,289.5 6,338.4 6,252.0 6,079.3 5,968.5
Perbelanjaan CajCharged Expenditure
1,429.1 1,145.4 1,100.7 1,119.7 1,207.6
Perbelanjaan BiasaOrdinary Expenditure
4,781.8 4,402.3 4,466.4 4,072.9 4,265.4
GajiKakitangan 1,984.0 1,984.8 1,977.8 1,859.6 1,956.2Personnel EmolumentsLain-lainCajPerbelanjaanBerulang-Ulang
2,057.0 1,850.2 1,886.9 2,213.3 2,309.2
Other Charges Annually RecurrentLain-lainCajPerbelanjaanKhas
740.8 567.4 601.7 - -
Other Charges Special Expenditure
Perbelanjaan PembangunanDevelopment Expenditure
1,078.6 790.7 684.9 886.7 495.5
8.3 Perbelanjaan Kerajaan Government Expenditure
BNDJuta/ Million
Sumber:JabatanPerbendaharaan,KementerianKewangandanEkonomiSource : Treasury Department, Ministry of Finance and Economy
Nota:Tahunfiskaldigunakanmulai2003Note : Fiscal year was adopted since 2003
p
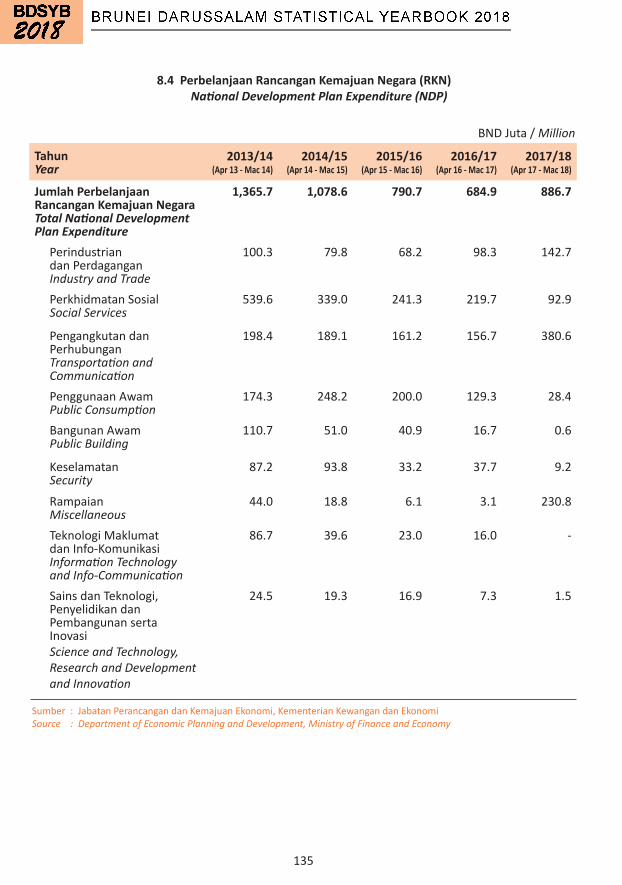
135
8.4 Perbelanjaan Rancangan Kemajuan Negara (RKN) National Development Plan Expenditure (NDP)
BNDJuta/ Million
TahunYear
2013/14(Apr 13 - Mac 14)
2014/15(Apr 14 - Mac 15)
2015/16(Apr 15 - Mac 16)
2016/17(Apr 16 - Mac 17)
2017/18(Apr 17 - Mac 18)
Jumlah Perbelanjaan Rancangan Kemajuan NegaraTotal National Development Plan Expenditure
1,365.7 1,078.6 790.7 684.9 886.7
PerindustriandanPerdagangan Industry and Trade
100.3 79.8 68.2 98.3 142.7
PerkhidmatanSosial Social Services
539.6 339.0 241.3 219.7 92.9
PengangkutandanPerhubungan Transportation and Communication
198.4 189.1 161.2 156.7 380.6
PenggunaanAwam Public Consumption
174.3 248.2 200.0 129.3 28.4
BangunanAwam Public Building
110.7 51.0 40.9 16.7 0.6
Keselamatan Security
87.2 93.8 33.2 37.7 9.2
Rampaian Miscellaneous
44.0 18.8 6.1 3.1 230.8
TeknologiMaklumatdanInfo-Komunikasi Information Technology and Info-Communication
86.7 39.6 23.0 16.0 -
SainsdanTeknologi,PenyelidikandanPembangunansertaInovasi Science and Technology, Research and Development and Innovation
24.5 19.3 16.9 7.3 1.5
Sumber:JabatanPerancangandanKemajuanEkonomi,KementerianKewangandanEkonomiSource : Department of Economic Planning and Development, Ministry of Finance and Economy
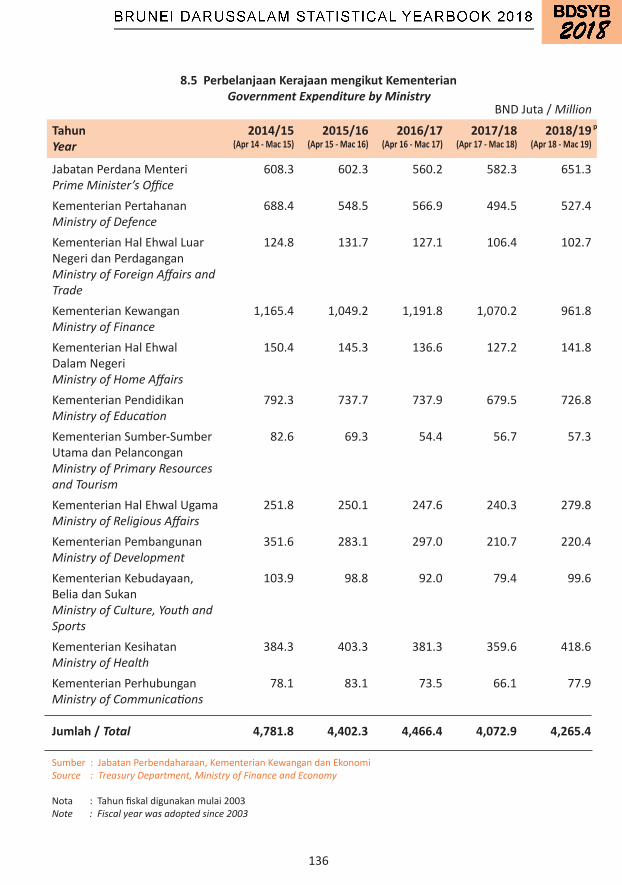
136
8.5 Perbelanjaan Kerajaan mengikut Kementerian Government Expenditure by Ministry
Sumber:JabatanPerbendaharaan,KementerianKewangandanEkonomiSource : Treasury Department, Ministry of Finance and Economy
Nota:Tahunfiskaldigunakanmulai2003Note : Fiscal year was adopted since 2003
BNDJuta/ Million
TahunYear
2014/15(Apr 14 - Mac 15)
2015/16(Apr 15 - Mac 16)
2016/17(Apr 16 - Mac 17)
2017/18(Apr 17 - Mac 18)
2018/19(Apr 18 - Mac 19)
JabatanPerdanaMenteriPrime Minister’s Office
608.3 602.3 560.2 582.3 651.3
KementerianPertahananMinistry of Defence
688.4 548.5 566.9 494.5 527.4
KementerianHalEhwalLuarNegeridanPerdaganganMinistry of Foreign Affairs and Trade
124.8 131.7 127.1 106.4 102.7
KementerianKewanganMinistry of Finance
1,165.4 1,049.2 1,191.8 1,070.2 961.8
KementerianHalEhwalDalamNegeriMinistry of Home Affairs
150.4 145.3 136.6 127.2 141.8
KementerianPendidikanMinistry of Education
792.3 737.7 737.9 679.5 726.8
KementerianSumber-SumberUtamadanPelanconganMinistry of Primary Resources and Tourism
82.6 69.3 54.4 56.7 57.3
KementerianHalEhwalUgamaMinistry of Religious Affairs
251.8 250.1 247.6 240.3 279.8
KementerianPembangunanMinistry of Development
351.6 283.1 297.0 210.7 220.4
KementerianKebudayaan,BeliadanSukanMinistry of Culture, Youth and Sports
103.9 98.8 92.0 79.4 99.6
KementerianKesihatanMinistry of Health
384.3 403.3 381.3 359.6 418.6
KementerianPerhubunganMinistry of Communications
78.1 83.1 73.5 66.1 77.9
Jumlah / Total 4,781.8 4,402.3 4,466.4 4,072.9 4,265.4
p

137
JabatanDepartment
2014/15(Apr 14 - Mac 15)
2015/16(Apr 15 - Mac 16)
2016/17(Apr 16 - Mac 17)
2017/18(Apr 17- Mac 18)
2018/19(Apr 18 - Mac 19)
Jumlah Perbelanjaan BiasaTotal Ordinary Expenditure
4,781.8 4,402.3 4,466.4 4,072.9 4,265.4
Jabatan Perdana MenteriPrime Minister’s Office
608.3 602.3 560.2 582.3 651.3
JabatanPerdanaMenteriPrime Minister’s Office
72.8 43.4 29.6 23.5 24.7
AdatIstiadatAdat Istiadat
3.2 3.2 3.2 2.7 2.9
AuditAudit
6.3 6.1 5.8 5.9 5.8
BiroKawalanNarkotikNarcotic Control Bureau
14.4 14.0 13.8 12.7 13.3
BiroMencegahRasuahAnti-Corruption Bureau
5.9 5.5 5.5 4.9 4.7
KeselamatanDalamNegeriInternal Security
30.0 29.9 28.4 26.0 27.7
Majlis-MajlisMesyuaratNegara
Councils of State
2.8 2.4 3.1 2.6 5.0
RadioTelevisyenBruneiRadio Television Brunei
49.0 53.0 54.9 41.5 48.9
PeneranganInformation
7.1 6.7 6.5 6.3 6.3
8.6 Perbelanjaan Kerajaan mengikut Jabatan Government Expenditure by Department
BNDJuta/ Million
Sumber:JabatanPerbendaharaan,KementerianKewangandanEkonomiSource : Treasury Department, Ministry of Finance and Economy
Nota:Tahunfiskaldigunakanmulai2003Note : Fiscal year was adopted since 2003
p

138
8.6 Perbelanjaan Kerajaan mengikut Jabatan (Sambungan) Government Expenditure by Department (Continued)
BNDJuta/ Million
Sumber:JabatanPerbendaharaan,KementerianKewangandanEkonomiSource : Treasury Department, Ministry of Finance and Economy
Nota:Tahunfiskaldigunakanmulai2003Note : Fiscal year was adopted since 2003
JabatanDepartment
2014/15(Apr 14 - Mac 15)
2015/16(Apr 15 - Mac 16)
2016/17(Apr 16 - Mac 17)
2017/18(Apr 17 - Mac 18)
2018/19(Apr 18 - Mac 19)
JabatanPerkhidmatanAwamPublic Service Department
29.7 29.1 25.1 25.0 21.2
PerkhidmatanPengurusanManagement Services
2.3 2.2 2.3 2.3 2.3
PolisDirajaBruneiRoyal Brunei Police Force
130.2 127.4 125.3 122.8 133.1
SuruhanjayaPerkhidmatanAwamPublic Service Commission
4.8 4.9 5.2 4.5 5.6
JabatanTenagadanPerindustrianEnergy and Industry Department
4.9 5.0 13.3 12.4 12.2
JabatanMuftiKerajaanState Mufti’s Office
5.5 5.6 5.6 5.5 6.0
PerancangandanKemajuanEkonomiEconomic Planning and Development
8.4 8.1 8.0 9.8 7.6
JabatanUndang-UndangLegal Department
0.8 0.7 0.8 0.6 1.2
PercetakanKerajaanGovernment Printing
10.5 9.6 9.2 8.3 7.9
PeguamNegaraAttorney General
9.8 9.6 10.2 10.1 11.7
JabatanKehakimanNegaraJudiciary General
8.6 8.9 8.8 8.7 11.7
PusatKebangsaanE-KerajaanE-Government Centre
39.7 38.8 33.8 34.4 35.1
PerkhidmatanElektrikElectrical Services
133.1 160.9 137.8 189.9 234.7
JabatanPenyelidikanBruneiBrunei Research Department
28.4 27.4 23.9 21.9 21.8
p
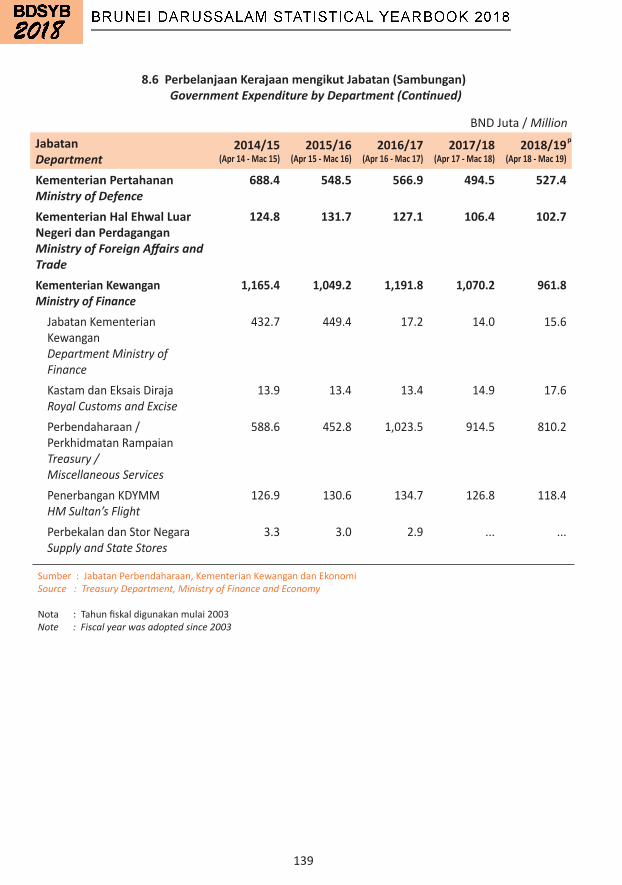
139
8.6 Perbelanjaan Kerajaan mengikut Jabatan (Sambungan) Government Expenditure by Department (Continued)
Sumber:JabatanPerbendaharaan,KementerianKewangandanEkonomiSource : Treasury Department, Ministry of Finance and Economy
Nota:Tahunfiskaldigunakanmulai2003Note : Fiscal year was adopted since 2003
BNDJuta/ MillionJabatanDepartment
2014/15(Apr 14 - Mac 15)
2015/16(Apr 15 - Mac 16)
2016/17(Apr 16 - Mac 17)
2017/18(Apr 17 - Mac 18)
2018/19(Apr 18 - Mac 19)
Kementerian Pertahanan Ministry of Defence
688.4 548.5 566.9 494.5 527.4
Kementerian Hal Ehwal Luar Negeri dan PerdaganganMinistry of Foreign Affairs and Trade
124.8 131.7 127.1 106.4 102.7
Kementerian Kewangan Ministry of Finance
1,165.4 1,049.2 1,191.8 1,070.2 961.8
JabatanKementerianKewanganDepartment Ministry of Finance
432.7 449.4 17.2 14.0 15.6
KastamdanEksaisDirajaRoyal Customs and Excise
13.9 13.4 13.4 14.9 17.6
Perbendaharaan/PerkhidmatanRampaianTreasury / Miscellaneous Services
588.6 452.8 1,023.5 914.5 810.2
PenerbanganKDYMMHM Sultan’s Flight
126.9 130.6 134.7 126.8 118.4
PerbekalandanStorNegaraSupply and State Stores
3.3 3.0 2.9 ... ...
p

140
8.6 Perbelanjaan Kerajaan mengikut Jabatan (Sambungan) Government Expenditure by Department (Continued)
Sumber:JabatanPerbendaharaan,KementerianKewangandanEkonomiSource : Treasury Department, Ministry of Finance and Economy
Nota:Tahunfiskaldigunakanmulai2003Note : Fiscal year was adopted since 2003
BNDJuta/ MillionJabatanDepartment
2014/15(Apr 14 - Mac 15)
2015/16(Apr 15 - Mac 16)
2016/17(Apr 16 - Mac 17)
2017/18(Apr 17 - Mac 18)
2018/19(Apr 18 - Mac 19)
Kementerian Hal Ehwal Dalam NegeriMinistry of Home Affairs
150.4 145.3 136.6 127.2 141.8
JabatanKementerianHalEhwalDalamNegeriDepartment Ministry of Home Affairs
20.4 16.6 11.7 8.5 8.6
LembagaBandaranBandarSeriBegawanMunicipal Board - Bandar Seri Begawan
21.1 20.3 18.7 17.8 21.8
LembagaBandaranKualaBelaitdanSeriaMunicipal Board - Kuala Belait and Seria
8.4 8.3 7.6 7.3 8.5
LembagaBandaranTutongMunicipal Board - Tutong
2.3 2.2 2.1 2.0 2.1
BuruhLabour
5.8 5.9 5.9 5.7 5.8
PejabatDaerahBruneidanMuaraDistrict Office - Brunei and Muara
12.3 12.1 11.3 11.1 12.4
PejabatDaerahBelaitDistrict Office - Belait
4.4 4.3 4.1 4.0 6.8
PejabatDaerahTutongDistrict Office - Tutong
5.4 5.4 4.8 4.8 6.3
PejabatDaerahTemburongDistrict Office - Temburong
4.9 4.7 4.6 4.3 4.5
ImigresendanPendaftaranKebangsaanImmigration and National Registration
19.2 19.1 20.1 19.1 20.7
PenjaraPrison
11.7 11.5 11.2 10.4 11.9
JabatanBombadanPenyelamatFire and Rescue Department
34.3 34.9 34.7 32.3 32.3
p
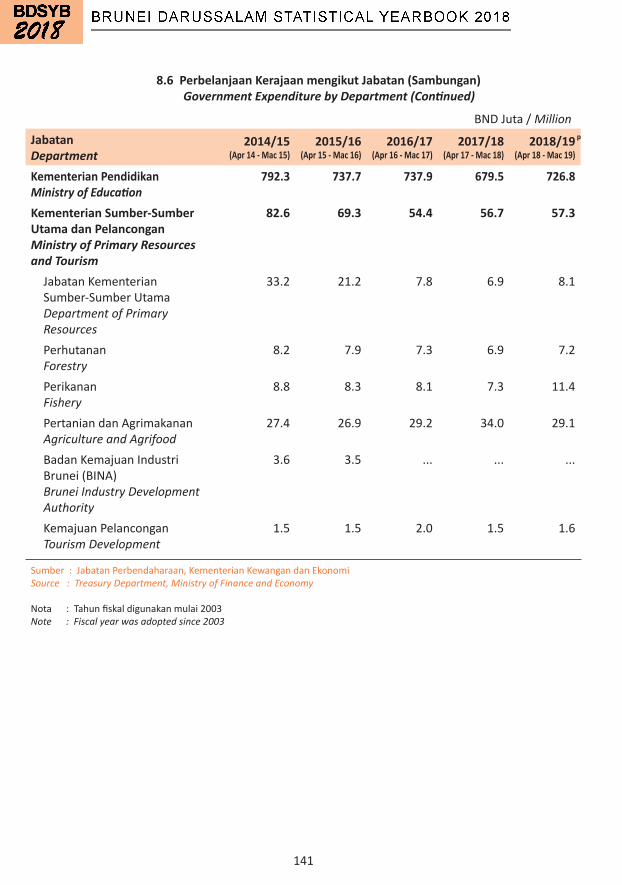
141
JabatanDepartment
2014/15(Apr 14 - Mac 15)
2015/16(Apr 15 - Mac 16)
2016/17(Apr 16 - Mac 17)
2017/18(Apr 17 - Mac 18)
2018/19(Apr 18 - Mac 19)
Kementerian PendidikanMinistry of Education
792.3 737.7 737.9 679.5 726.8
Kementerian Sumber-Sumber Utama dan PelanconganMinistry of Primary Resourcesand Tourism
82.6 69.3 54.4 56.7 57.3
JabatanKementerianSumber-SumberUtamaDepartment of Primary Resources
33.2 21.2 7.8 6.9 8.1
PerhutananForestry
8.2 7.9 7.3 6.9 7.2
PerikananFishery
8.8 8.3 8.1 7.3 11.4
PertaniandanAgrimakananAgriculture and Agrifood
27.4 26.9 29.2 34.0 29.1
BadanKemajuanIndustriBrunei(BINA)Brunei Industry Development Authority
3.6 3.5 ... ... ...
KemajuanPelanconganTourism Development
1.5 1.5 2.0 1.5 1.6
8.6 Perbelanjaan Kerajaan mengikut Jabatan (Sambungan) Government Expenditure by Department (Continued)
Sumber:JabatanPerbendaharaan,KementerianKewangandanEkonomiSource : Treasury Department, Ministry of Finance and Economy
Nota:Tahunfiskaldigunakanmulai2003Note : Fiscal year was adopted since 2003
BNDJuta/ Millionp
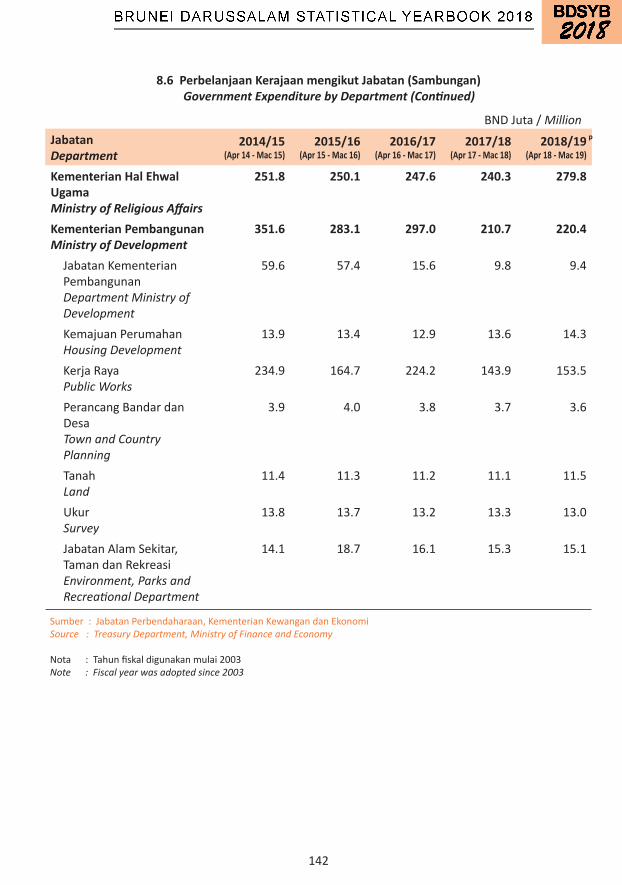
142
JabatanDepartment
2014/15(Apr 14 - Mac 15)
2015/16(Apr 15 - Mac 16)
2016/17(Apr 16 - Mac 17)
2017/18(Apr 17 - Mac 18)
2018/19(Apr 18 - Mac 19)
Kementerian Hal Ehwal UgamaMinistry of Religious Affairs
251.8 250.1 247.6 240.3 279.8
Kementerian PembangunanMinistry of Development
351.6 283.1 297.0 210.7 220.4
JabatanKementerianPembangunanDepartment Ministry of Development
59.6 57.4 15.6 9.8 9.4
KemajuanPerumahanHousing Development
13.9 13.4 12.9 13.6 14.3
KerjaRayaPublic Works
234.9 164.7 224.2 143.9 153.5
PerancangBandardanDesa Town and Country Planning
3.9 4.0 3.8 3.7 3.6
Tanah Land
11.4 11.3 11.2 11.1 11.5
Ukur Survey
13.8 13.7 13.2 13.3 13.0
JabatanAlamSekitar,TamandanRekreasi Environment, Parks and Recreational Department
14.1 18.7 16.1 15.3 15.1
8.6 Perbelanjaan Kerajaan mengikut Jabatan (Sambungan) Government Expenditure by Department (Continued)
Sumber:JabatanPerbendaharaan,KementerianKewangandanEkonomiSource : Treasury Department, Ministry of Finance and Economy
Nota:Tahunfiskaldigunakanmulai2003Note : Fiscal year was adopted since 2003
BNDJuta/ Millionp

143
JabatanDepartment
2014/15(Apr 14 - Mac 15)
2015/16(Apr 15 - Mac 16)
2016/17(Apr 16 - Mac 17)
2017/18(Apr 17 - Mac 18)
2018/19(Apr 18 - Mac 19)
Kementerian Kebudayaan Belia dan SukanMinistry of Culture, Youth and Sports
103.9 98.8 92.0 79.4 99.6
JabatanKementerianKebudayaan,BeliadanSukanDepartment Ministry of Culture, Youth and Sports
29.9 24.3 18.0 15.3 14.9
DewanBahasadanPustakaLanguage and Literature Bureau
12.2 12.0 13.7 11.0 11.2
BeliadanSukanYouth and Sports
22.7 21.6 20.3 17.6 31.4
Muzium-MuziumMuseums
9.3 8.9 9.5 8.6 14.8
PusatSejarahHistory Centre
4.5 4.3 4.2 3.9 4.3
PembangunanMasyarakatCommunity Development
25.3 27.8 26.4 23.0 23.1
Kementerian KesihatanMinistry of Health
384.3 403.3 381.3 359.6 418.6
8.6 Perbelanjaan Kerajaan mengikut Jabatan (Sambungan) Government Expenditure by Department (Continued)
Sumber:JabatanPerbendaharaan,KementerianKewangandanEkonomiSource : Treasury Department, Ministry of Finance and Economy
Nota:Tahunfiskaldigunakanmulai2003Note : Fiscal year was adopted since 2003
BNDJuta/ Millionp
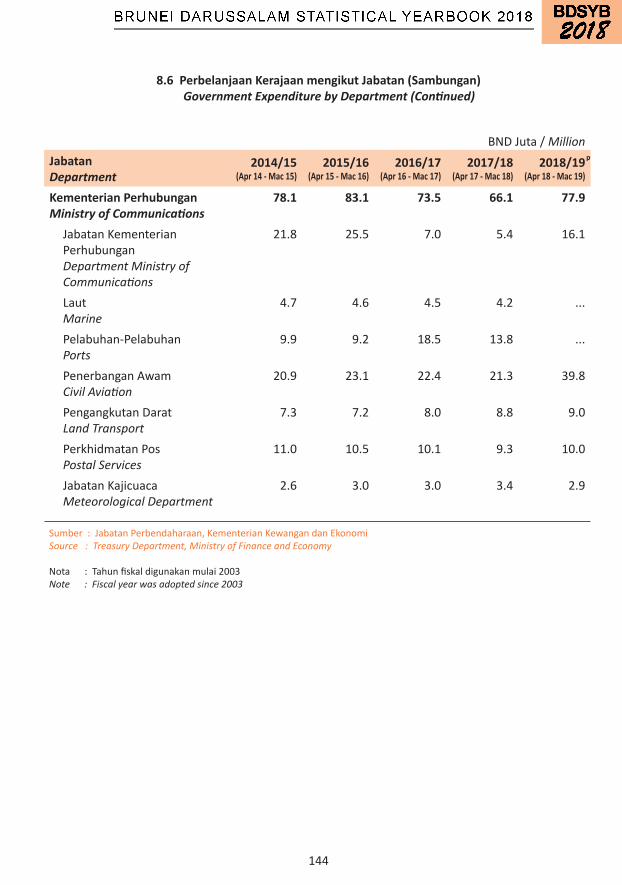
144
JabatanDepartment
2014/15(Apr 14 - Mac 15)
2015/16(Apr 15 - Mac 16)
2016/17(Apr 16 - Mac 17)
2017/18(Apr 17 - Mac 18)
2018/19(Apr 18 - Mac 19)
Kementerian PerhubunganMinistry of Communications
78.1 83.1 73.5 66.1 77.9
JabatanKementerianPerhubunganDepartment Ministry of Communications
21.8 25.5 7.0 5.4 16.1
LautMarine
4.7 4.6 4.5 4.2 ...
Pelabuhan-PelabuhanPorts
9.9 9.2 18.5 13.8 ...
PenerbanganAwamCivil Aviation
20.9 23.1 22.4 21.3 39.8
PengangkutanDaratLand Transport
7.3 7.2 8.0 8.8 9.0
PerkhidmatanPosPostal Services
11.0 10.5 10.1 9.3 10.0
JabatanKajicuacaMeteorological Department
2.6 3.0 3.0 3.4 2.9
8.6 Perbelanjaan Kerajaan mengikut Jabatan (Sambungan) Government Expenditure by Department (Continued)
Sumber:JabatanPerbendaharaan,KementerianKewangandanEkonomiSource : Treasury Department, Ministry of Finance and Economy
Nota:Tahunfiskaldigunakanmulai2003Note : Fiscal year was adopted since 2003
BNDJuta/ Millionp

145
Tahun Year
2014/15(Apr 14 - Mac 15)
2015/16(Apr 15 - Mac 16)
2016/17(Apr 16 - Mac 17)
2017/18(Apr 17 - Mac 18)
2018/19(Apr 18 - Mac 19)
CukaiPendapatanSyarikat-Syarikat Income Tax of Companies
232.9 250.8 197.0 150.8 163.8
CukaiMasukMesinPenggerakTanah Earth Moving Machinery Tax
0.3 7.9 0.1 0.0 0.0
BayaranTaksiranRumah Home Assessment Fee
14.7 17.7 15.9 17.5 14.0
CukaiTanah Land Tax
5.6 7.9 4.3 6.1 4.1
Lain-lainCukaiPerkhidmatan Other Tax Services
22.2 24.0 21.6 17.1 14.5
DutiSetem Stamp Duty
5.0 5.8 6.0 5.3 13.5
DutiEksaisKereta Car Excise Duty
76.2 56.7 47.2 25.3 0.1
DutiEksaisLain-lainKenderaan Other Vehicles Excise Duty
4.2 2.6 2.0 1.0 0.0
DutiEksaisRokok Cigarette Excise Duty
0.3 0.2 0.2 0.2 0.2
8.7 Jenis Cukai dan Duti Dikutip Type of Taxes and Duties Collected
BNDJuta/ Million
Sumber:JabatanPerbendaharaan,KementerianKewangandanEkonomi Source : Treasury Department, Ministry of Finance and Economy Nota:(1)CukaipendapatandikenakanhanyakeataskeuntunganSyarikat-syarikatBerhadNote : Income tax is levied only on the profits of Limited Companies (2)Tahunfiskaldigunakanmulai2003 Fiscal year was adopted since 2003
p
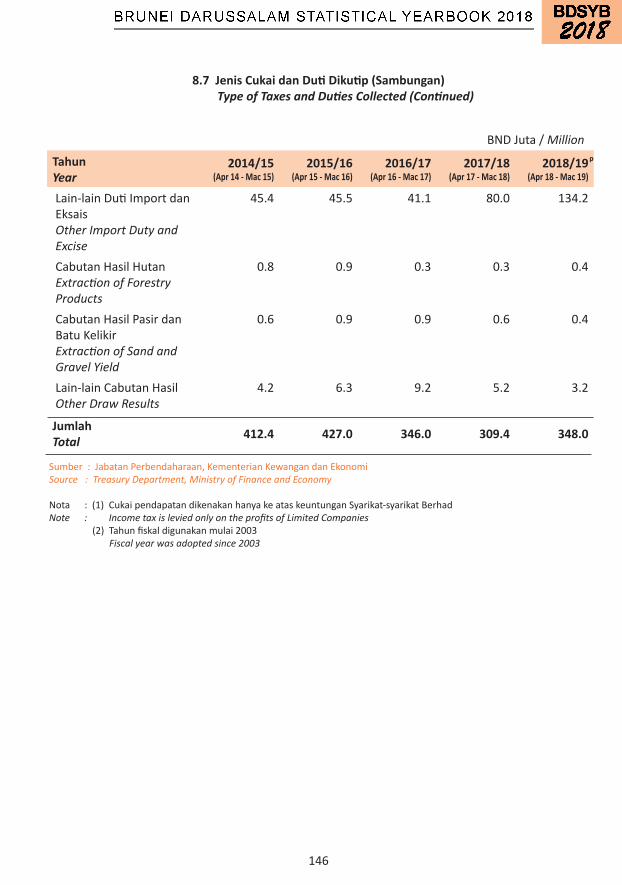
146
8.7 Jenis Cukai dan Duti Dikutip (Sambungan) Type of Taxes and Duties Collected (Continued)
BNDJuta/ Million
Sumber:JabatanPerbendaharaan,KementerianKewangandanEkonomi Source : Treasury Department, Ministry of Finance and Economy Nota:(1)CukaipendapatandikenakanhanyakeataskeuntunganSyarikat-syarikatBerhadNote : Income tax is levied only on the profits of Limited Companies (2)Tahunfiskaldigunakanmulai2003 Fiscal year was adopted since 2003
Tahun Year
2014/15(Apr 14 - Mac 15)
2015/16(Apr 15 - Mac 16)
2016/17(Apr 16 - Mac 17)
2017/18(Apr 17 - Mac 18)
2018/19(Apr 18 - Mac 19)
Lain-lainDutiImportdanEksais Other Import Duty and Excise
45.4 45.5 41.1 80.0 134.2
CabutanHasilHutan Extraction of Forestry Products
0.8 0.9 0.3 0.3 0.4
CabutanHasilPasirdanBatuKelikir Extraction of Sand and Gravel Yield
0.6 0.9 0.9 0.6 0.4
Lain-lainCabutanHasil Other Draw Results
4.2 6.3 9.2 5.2 3.2
JumlahTotal 412.4 427.0 346.0 309.4 348.0
p
9 PERKHIDMATAN KEWANGAN FINANCIAL SERVICES
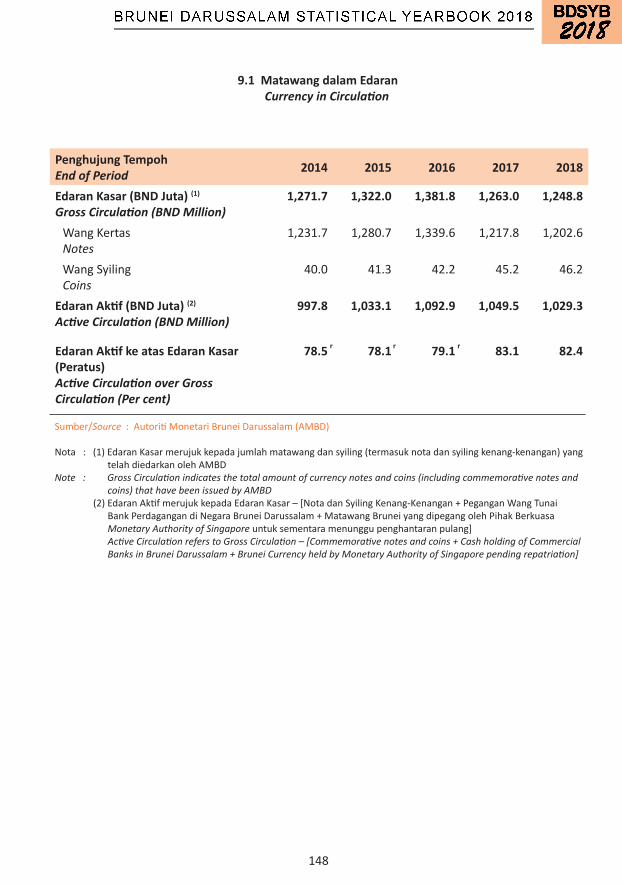
148
Sumber/Source:AutoritiMonetariBruneiDarussalam(AMBD)
Nota:(1)EdaranKasarmerujukkepadajumlahmatawangdansyiling(termasuknotadansyilingkenang-kenangan)yangtelahdiedarkanolehAMBD Note : Gross Circulation indicates the total amount of currency notes and coins (including commemorative notes and coins) that have been issued by AMBD(2)EdaranAktifmerujukkepadaEdaranKasar–[NotadanSyilingKenang-Kenangan+PeganganWangTunaiBankPerdagangandiNegaraBruneiDarussalam+MatawangBruneiyangdipegangolehPihakBerkuasa Monetary Authority of Singaporeuntuksementaramenunggupenghantaranpulang] Active Circulation refers to Gross Circulation – [Commemorative notes and coins + Cash holding of Commercial Banks in Brunei Darussalam + Brunei Currency held by Monetary Authority of Singapore pending repatriation]
Penghujung TempohEnd of Period 2014 2015 2016 2017 2018
Edaran Kasar (BND Juta) (1) Gross Circulation (BND Million)
1,271.7 1,322.0 1,381.8 1,263.0 1,248.8
WangKertasNotes
1,231.7 1,280.7 1,339.6 1,217.8 1,202.6
WangSyilingCoins
40.0 41.3 42.2 45.2 46.2
Edaran Aktif (BND Juta) (2)
Active Circulation (BND Million)997.8 1,033.1 1,092.9 1,049.5 1,029.3
Edaran Aktif ke atas Edaran Kasar (Peratus)Active Circulation over Gross Circulation (Per cent)
78.5 78.1 79.1 83.1 82.4
9.1 Matawang dalam Edaran Currency in Circulation
rrr

149
Penghujung TempohEnd of Period 2014 2015 2016 2017 2018
Wang Kertas dan Syiling yang DipegangNotes and Coins Held
274.6 282.2 250.8 175.5 171.1
Baki Tunai Minimum dengan AMBDMinimum Cash Balance with AMBD
1,488.7 1,688.5 1,803.9 1,504.4 1,455.0
Jumlah yang akan Diterima dari Bank dan Institusi Kewangan :Amount due from Banks and Financial Institutions :DiNegaraBruneiDarussalam In Brunei Darussalam
1,349.6 1,057.8 745.8 607.2 569.6
LuarNegaraBruneiDarussalam Outside Brunei Darussalam
7,258.1 5,462.8 7,447.1 7,569.8 8,188.5
Pinjaman dan Pendahuluan / Pembiayaan (Bersih)Loan and Advances / Financing (Net)
5,497.7 5,899.7 5,195.1 4,932.1 5,257.3
PelaburanInvestments
2,502.5 2,310.8 2,210.9 2,392.2 2,389.6
Lain-lain AsetOther Assets
306.1 339.3 298.9 302.9 294.0
JumlahTotal 18,677.3 17,040.9 17,952.5 17,484.1 18,325.3
9.2 Sistem Perbankan : Aset Banking System : Assets
BNDJuta/ Million
Sumber/Source:AutoritiMonetariBruneiDarussalam(AMBD)
Nota:TermasukPerbadananTabungAmanahIslamBrunei(TAIB)Note : Including Tabung Amanah Islam Brunei (TAIB) Trust Fund
r r r r
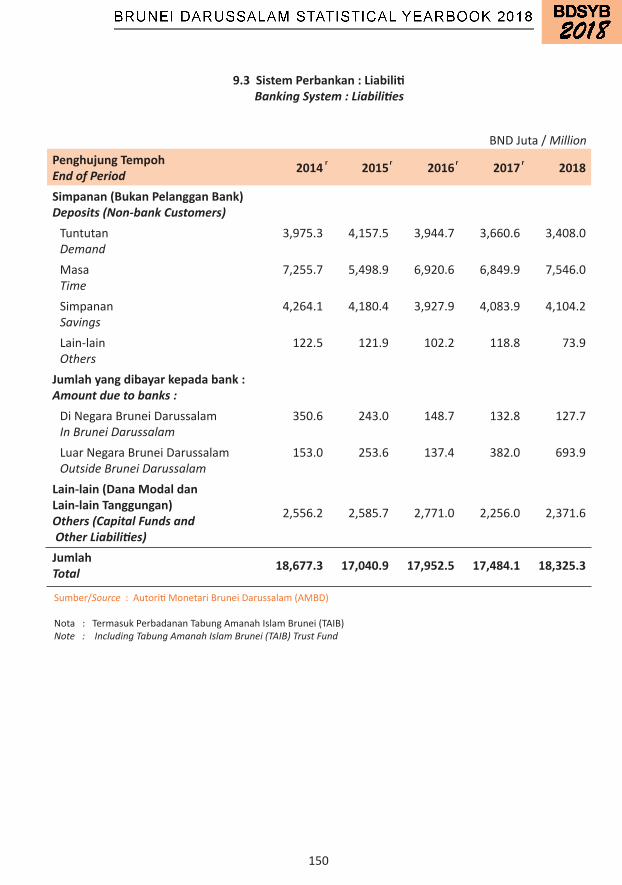
150
BNDJuta/ MillionPenghujung TempohEnd of Period 2014 2015 2016 2017 2018
Simpanan (Bukan Pelanggan Bank)Deposits (Non-bank Customers)TuntutanDemand
3,975.3 4,157.5 3,944.7 3,660.6 3,408.0
MasaTime
7,255.7 5,498.9 6,920.6 6,849.9 7,546.0
SimpananSavings
4,264.1 4,180.4 3,927.9 4,083.9 4,104.2
Lain-lainOthers
122.5 121.9 102.2 118.8 73.9
Jumlah yang dibayar kepada bank :Amount due to banks :DiNegaraBruneiDarussalamIn Brunei Darussalam
350.6 243.0 148.7 132.8 127.7
LuarNegaraBruneiDarussalamOutside Brunei Darussalam
153.0 253.6 137.4 382.0 693.9
Lain-lain (Dana Modal danLain-lain Tanggungan)Others (Capital Funds and Other Liabilities)
2,556.2 2,585.7 2,771.0 2,256.0 2,371.6
JumlahTotal 18,677.3 17,040.9 17,952.5 17,484.1 18,325.3
9.3 Sistem Perbankan : Liabiliti Banking System : Liabilities
Sumber/Source:AutoritiMonetariBruneiDarussalam(AMBD)
Nota:TermasukPerbadananTabungAmanahIslamBrunei(TAIB)Note : Including Tabung Amanah Islam Brunei (TAIB) Trust Fund
r r r r
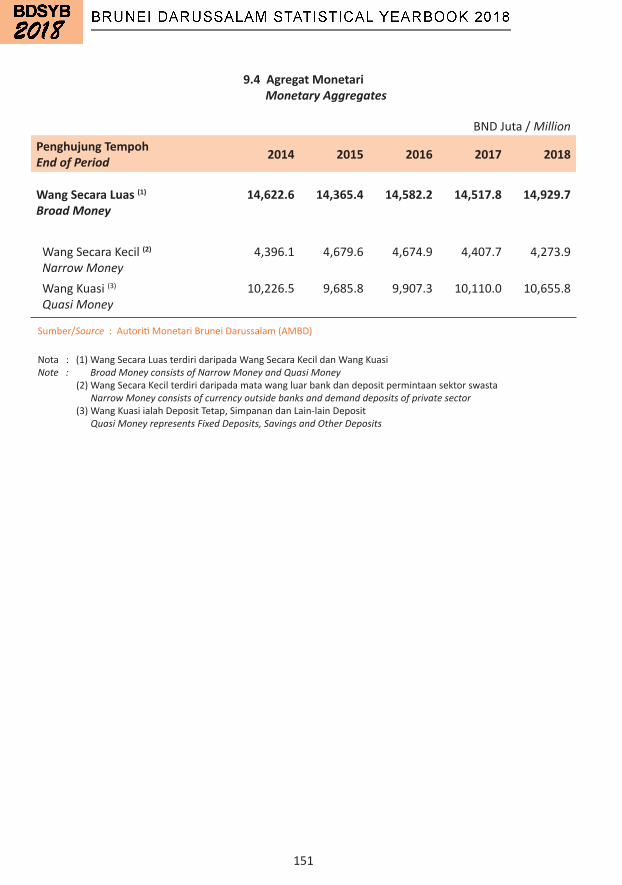
151
BNDJuta/ Million
9.4 Agregat Monetari Monetary Aggregates
Penghujung TempohEnd of Period 2014 2015 2016 2017 2018
Wang Secara Luas (1)
Broad Money 14,622.6 14,365.4 14,582.2 14,517.8 14,929.7
WangSecaraKecil(2)
Narrow Money 4,396.1 4,679.6 4,674.9 4,407.7 4,273.9
WangKuasi(3) Quasi Money
10,226.5 9,685.8 9,907.3 10,110.0 10,655.8
Sumber/Source:AutoritiMonetariBruneiDarussalam(AMBD)
Nota:(1)WangSecaraLuasterdiridaripadaWangSecaraKecildanWangKuasi Note : Broad Money consists of Narrow Money and Quasi Money (2)WangSecaraKecilterdiridaripadamatawangluarbankdandepositpermintaansektorswasta Narrow Money consists of currency outside banks and demand deposits of private sector (3)WangKuasiialahDepositTetap,SimpanandanLain-lainDeposit Quasi Money represents Fixed Deposits, Savings and Other Deposits

152
Sumber/Source:AutoritiMonetariBruneiDarussalam(AMBD)
TahunYear 2014 2015 2016 2017 2018
Ringgit Brunei untuk 1 unit :Brunei Dollar to 1 unit :DolarUS/ US Dollar
PurataTempohPeriod Aveage
1.27 1.37 1.38 1.38 1.35
PenghujungTempohEnd of Period
1.33 1.42 1.45 1.34 1.36
PaunSterling / Sterling PoundPurataTempoh Period Average
2.09 2.10 1.87 1.78 1.80
PenghujungTempoh End of Period
2.06 2.09 1.79 1.80 1.74
DolarAustralia/ Australian DollarPurataTempoh Period Average
1.14 1.03 1.03 1.06 1.01
PenghujungTempoh End of Period
1.08 1.03 1.04 1.04 0.96
Euro / EuroPurataTempoh Period Average
1.68 1.53 1.53 1.56 1.59
PenghujungTempoh End of Period
1.60 1.54 1.52 1.61 1.56
Ringgit Brunei untuk 100 unit :Brunei Dollar to 100 unit :FrancsSwiss/ Swiss Franc
PurataTempoh Period Average
138.54 142.78 140.14 140.24 137.91
PenghujungTempoh End of Period
133.28 141.55 141.84 137.21 138.40
DolarHongkong/ Hongkong DollarPurataTempoh Period Average
16.34 17.73 17.79 17.72 17.22
PenghujungTempoh End of Period
17.08 18.30 18.66 17.11 17.40
9.5 Kadar Pertukaran Exchange Rates
r
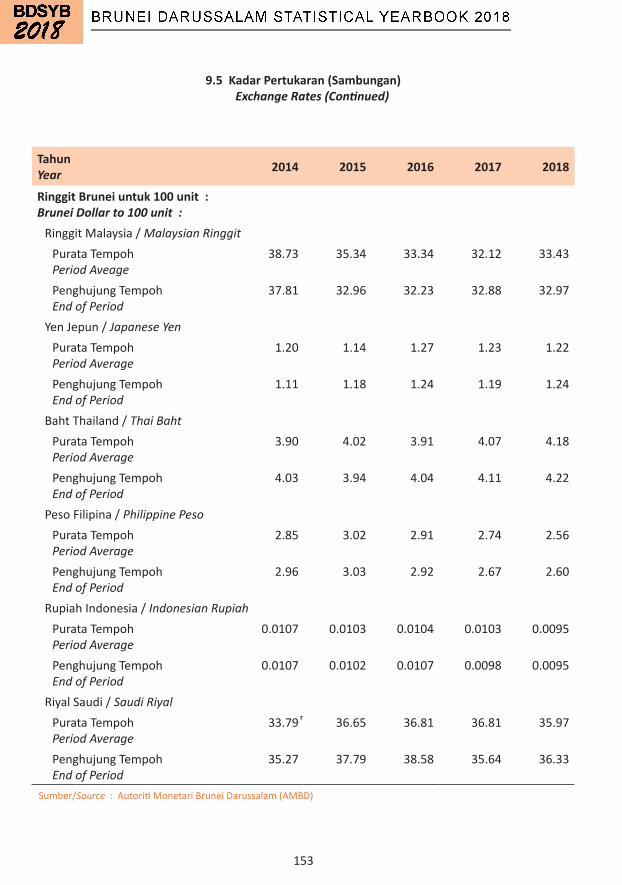
153
9.5 Kadar Pertukaran (Sambungan) Exchange Rates (Continued)
TahunYear 2014 2015 2016 2017 2018
Ringgit Brunei untuk 100 unit :Brunei Dollar to 100 unit :RinggitMalaysia/Malaysian Ringgit PurataTempohPeriod Aveage
38.73 35.34 33.34 32.12 33.43
PenghujungTempohEnd of Period
37.81 32.96 32.23 32.88 32.97
YenJepun/Japanese YenPurataTempohPeriod Average
1.20 1.14 1.27 1.23 1.22
PenghujungTempohEnd of Period
1.11 1.18 1.24 1.19 1.24
BahtThailand/Thai BahtPurataTempohPeriod Average
3.90 4.02 3.91 4.07 4.18
PenghujungTempohEnd of Period
4.03 3.94 4.04 4.11 4.22
PesoFilipina/Philippine PesoPurataTempohPeriod Average
2.85 3.02 2.91 2.74 2.56
PenghujungTempohEnd of Period
2.96 3.03 2.92 2.67 2.60
RupiahIndonesia/Indonesian RupiahPurataTempohPeriod Average
0.0107 0.0103 0.0104 0.0103 0.0095
PenghujungTempohEnd of Period
0.0107 0.0102 0.0107 0.0098 0.0095
RiyalSaudi/Saudi RiyalPurataTempohPeriod Average
33.79 36.65 36.81 36.81 35.97
PenghujungTempohEnd of Period
35.27 37.79 38.58 35.64 36.33
Sumber/Source:AutoritiMonetariBruneiDarussalam(AMBD)
r
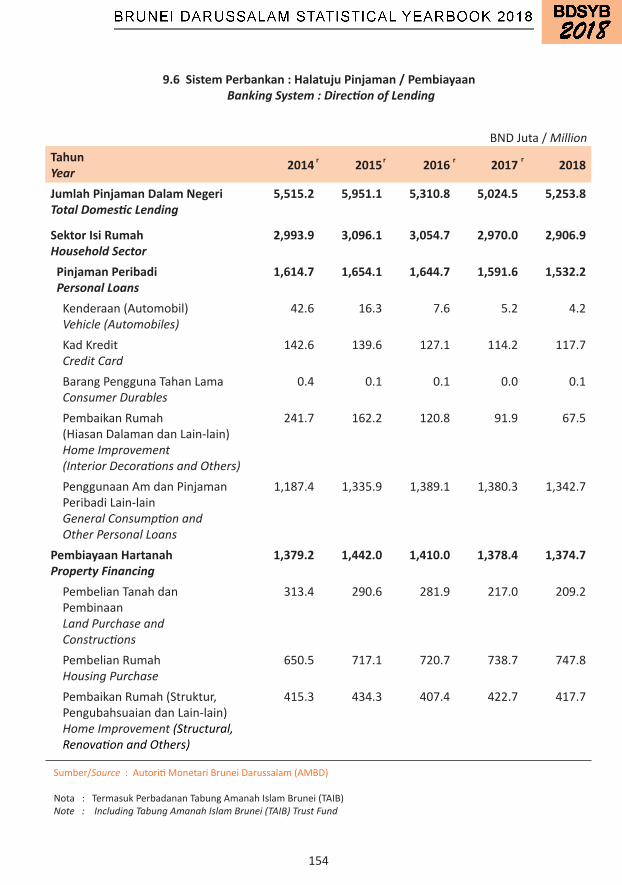
154
BNDJuta/ MillionTahunYear 2014 2015 2016 2017 2018
Jumlah Pinjaman Dalam NegeriTotal Domestic Lending
5,515.2 5,951.1 5,310.8 5,024.5 5,253.8
Sektor Isi RumahHousehold Sector
2,993.9 3,096.1 3,054.7 2,970.0 2,906.9
Pinjaman Peribadi Personal Loans
1,614.7 1,654.1 1,644.7 1,591.6 1,532.2
Kenderaan(Automobil) Vehicle (Automobiles)
42.6 16.3 7.6 5.2 4.2
KadKredit Credit Card
142.6 139.6 127.1 114.2 117.7
BarangPenggunaTahanLama Consumer Durables
0.4 0.1 0.1 0.0 0.1
PembaikanRumah(HiasanDalamandanLain-lain) Home Improvement (Interior Decorations and Others)
241.7 162.2 120.8 91.9 67.5
PenggunaanAmdanPinjamanPeribadiLain-lain General Consumption and Other Personal Loans
1,187.4 1,335.9 1,389.1 1,380.3 1,342.7
Pembiayaan HartanahProperty Financing
1,379.2 1,442.0 1,410.0 1,378.4 1,374.7
PembelianTanahdanPembinaan Land Purchase and Constructions
313.4 290.6 281.9 217.0 209.2
PembelianRumah Housing Purchase
650.5 717.1 720.7 738.7 747.8
PembaikanRumah(Struktur, PengubahsuaiandanLain-lain) Home Improvement (Structural, Renovation and Others)
415.3 434.3 407.4 422.7 417.7
9.6 Sistem Perbankan : Halatuju Pinjaman / Pembiayaan Banking System : Direction of Lending
Sumber/Source:AutoritiMonetariBruneiDarussalam(AMBD)
Nota:TermasukPerbadananTabungAmanahIslamBrunei(TAIB)Note : Including Tabung Amanah Islam Brunei (TAIB) Trust Fund
r r r r

155
BNDJuta/ MillionTahunYear 2014 2015 2016 2017 2018
Sektor KorporatCorporate Sector
2,521.3 2,855.0 2,256.1 2,054.5 2,346.9
Komersial(PembangunanHartanah)danPembinaanLain-lain Commercial (Property Development) and Other Construction
412.0 427.5 425.9 411.4 263.9
Pembuatan Manufacturing
294.2 535.2 218.1 220.4 250.4
Pengangkutan Transportation
652.8 329.6 297.9 208.7 572.9
Infrastruktur Infrastructure
137.4 128.4 75.7 60.1 38.7
Pedagang Traders
460.0 471.4 406.7 395.5 393.1
Perkhidmatan Services
302.6 796.4 687.3 671.1 693.6
Kewangan Financial
129.0 69.4 65.7 20.4 58.4
Pelancongan Tourism
44.7 44.7 39.4 23.4 38.8
TeknologiMaklumatdanKomunikasi Telecommunication and Information Technology
51.3 40.5 21.7 11.8 13.3
Pertanian Agricultural
37.3 11.9 17.7 31.7 23.8
Pinjaman Luar NegeriForeign Lending
197.0 163.7 93.6 105.4 196.6
9.6 Sistem Perbankan : Halatuju Pinjaman / Pembiayaan (Sambungan) Banking System : Direction of Lending (Continued)
Sumber/Source:AutoritiMonetariBruneiDarussalam(AMBD)
Nota:TermasukPerbadananTabungAmanahIslamBrunei(TAIB)Note : Including Tabung Amanah Islam Brunei (TAIB) Trust Fund
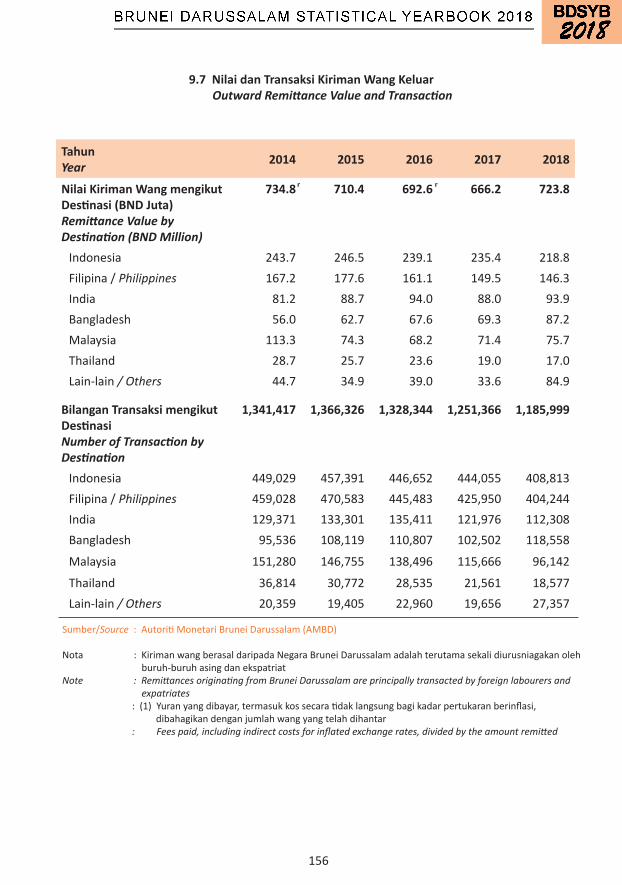
156
TahunYear 2014 2015 2016 2017 2018
Nilai Kiriman Wang mengikut Destinasi (BND Juta)Remittance Value by Destination (BND Million)
734.8 710.4 692.6 666.2 723.8
Indonesia 243.7 246.5 239.1 235.4 218.8Filipina/Philippines 167.2 177.6 161.1 149.5 146.3India 81.2 88.7 94.0 88.0 93.9Bangladesh 56.0 62.7 67.6 69.3 87.2Malaysia 113.3 74.3 68.2 71.4 75.7Thailand 28.7 25.7 23.6 19.0 17.0Lain-lain / Others 44.7 34.9 39.0 33.6 84.9
Bilangan Transaksi mengikut DestinasiNumber of Transaction by Destination
1,341,417 1,366,326 1,328,344 1,251,366 1,185,999
Indonesia 449,029 457,391 446,652 444,055 408,813Filipina/Philippines 459,028 470,583 445,483 425,950 404,244India 129,371 133,301 135,411 121,976 112,308Bangladesh 95,536 108,119 110,807 102,502 118,558
Malaysia 151,280 146,755 138,496 115,666 96,142
Thailand 36,814 30,772 28,535 21,561 18,577Lain-lain / Others 20,359 19,405 22,960 19,656 27,357
9.7 Nilai dan Transaksi Kiriman Wang Keluar Outward Remittance Value and Transaction
Sumber/Source:AutoritiMonetariBruneiDarussalam(AMBD)
Nota:KirimanwangberasaldaripadaNegaraBruneiDarussalamadalahterutamasekalidiurusniagakanolehburuh-buruhasingdanekspatriatNote : Remittances originating from Brunei Darussalam are principally transacted by foreign labourers and expatriates :(1)Yuranyangdibayar,termasukkossecaratidaklangsungbagikadarpertukaranberinflasi,dibahagikandenganjumlahwangyangtelahdihantar : Fees paid, including indirect costs for inflated exchange rates, divided by the amount remitted
r r
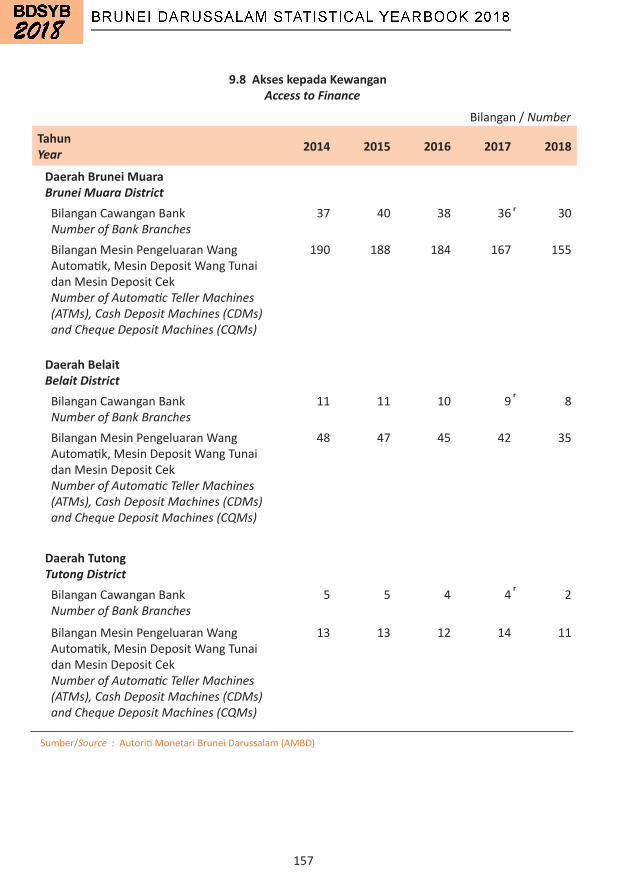
157
Bilangan/ Number
TahunYear 2014 2015 2016 2017 2018
Daerah Brunei MuaraBrunei Muara DistrictBilanganCawanganBank Number of Bank Branches
37 40 38 36 30
BilanganMesinPengeluaranWangAutomatik,MesinDepositWangTunaidanMesinDepositCek Number of Automatic Teller Machines (ATMs), Cash Deposit Machines (CDMs) and Cheque Deposit Machines (CQMs)
190 188 184 167 155
Daerah Belait Belait DistrictBilanganCawanganBank Number of Bank Branches
11 11 10 9 8
BilanganMesinPengeluaranWangAutomatik,MesinDepositWangTunaidanMesinDepositCek Number of Automatic Teller Machines (ATMs), Cash Deposit Machines (CDMs) and Cheque Deposit Machines (CQMs)
48 47 45 42 35
Daerah TutongTutong DistrictBilanganCawanganBank Number of Bank Branches
5 5 4 4 2
BilanganMesinPengeluaranWangAutomatik,MesinDepositWangTunaidanMesinDepositCek Number of Automatic Teller Machines (ATMs), Cash Deposit Machines (CDMs) and Cheque Deposit Machines (CQMs)
13 13 12 14 11
9.8 Akses kepada Kewangan Access to Finance
Sumber/Source:AutoritiMonetariBruneiDarussalam(AMBD)
r
r
r
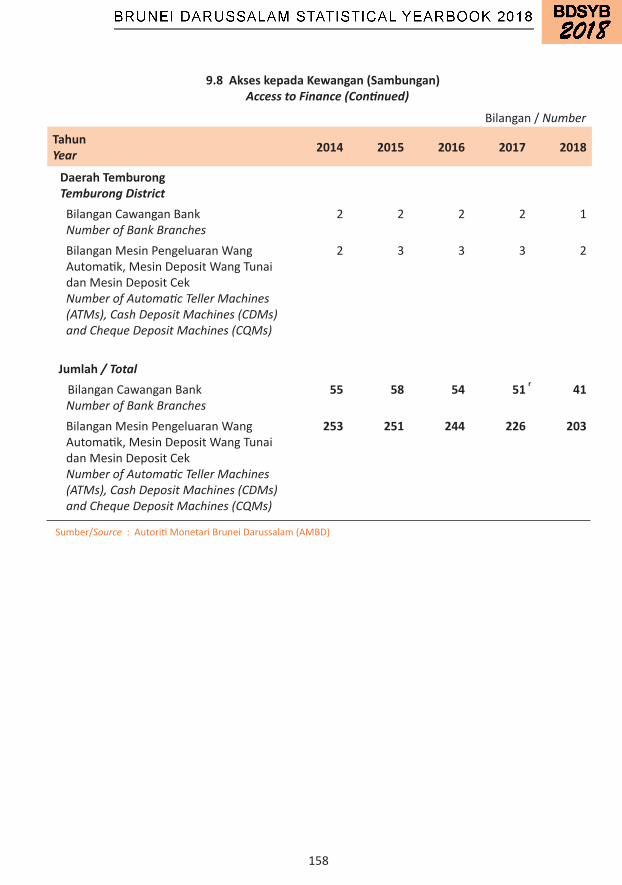
158
Bilangan/ Number
TahunYear 2014 2015 2016 2017 2018
Daerah TemburongTemburong DistrictBilanganCawanganBank Number of Bank Branches
2 2 2 2 1
BilanganMesinPengeluaranWangAutomatik,MesinDepositWangTunaidanMesinDepositCek Number of Automatic Teller Machines (ATMs), Cash Deposit Machines (CDMs) and Cheque Deposit Machines (CQMs)
2 3 3 3 2
Jumlah / Total BilanganCawanganBank
Number of Bank Branches55 58 54 51 41
BilanganMesinPengeluaranWangAutomatik,MesinDepositWangTunaidanMesinDepositCek Number of Automatic Teller Machines (ATMs), Cash Deposit Machines (CDMs) and Cheque Deposit Machines (CQMs)
253 251 244 226 203
9.8 Akses kepada Kewangan (Sambungan) Access to Finance (Continued)
Sumber/Source:AutoritiMonetariBruneiDarussalam(AMBD)
r

159
9.9 Aset Kelas Utama Institusi Kewangan Assets of the Major Classes of Financial Institution
Institusi Kewangan yang Dikawal oleh AMBDFinancial Institutions Regulated by AMBD
2015 2016Bilangan Institusi
KewanganNumber of
Financial Institutions
BND Billion
Pembahagian Jumlah Aset
(Peratus)Share of
Total Assets (Per cent)
Bilangan Institusi
KewanganNumber of
Financial Institutions
BND Billion
Pembahagian Jumlah Aset
(Peratus)Share of
Total Assets (Per cent)
Institusi Pengambilan DepositDeposit Taking Institutions
13 19.5 93.2 13 20.0 92.9
Bank-bankIslam(1) Islamic Banks
2 8.9 42.8 2 10.9 50.6
Bank-bankKonvensional Conventional Banks
6 8.1 38.8 7 7.0 32.5
SyarikatKewangan Finance Companies
3 2.3 10.8 3 2.1 9.7
Bank-bankLuarPersisir Offshore Banks
2 0.2 0.7 1 0.0 0.1
Lain-lain Institusi Kewangan BerlesenOther Licensed Financial Institutions
14 1.4 6.8 15 1.5 7.1
SyarikatInsuransKonvensional Conventional Insurance Companies
9 1.0 4.6 9 1.0 4.7
PengendaliTakaful Takaful Operators
4 0.4 2.0 4 0.5 2.1
Syarikat-syarikatInsuransLuarPersisir Offshore Insurance Companies
1 0.0 0.2 2 0.1 0.3
Jumlah AsetTotal Assets 27 20.9 100.0 28 21.6 100.0
Sumber/Source:AutoritiMonetariBruneiDarussalam(AMBD)
Nota:(1)TermasukPerbadananTabungAmanahIslamBrunei(TAIB)Note : Including Tabung Amanah Islam Brunei (TAIB) Trust Fund
r r
r
r
rr

160
9.9 Aset Kelas Utama Institusi Kewangan (Sambungan) Assets of the Major Classes of Financial Institution (Continued)
Institusi Kewangan yang Dikawal oleh AMBDFinancial Institutions Regulated by AMBD
2017 2018Bilangan Institusi
KewanganNumber of
Financial Institutions
BND Billion
Pembahagian Jumlah Aset
(Peratus)Share of
Total Assets (Per cent)
Bilangan Institusi
KewanganNumber of
Financial Institutions
BND Billion
Pembahagian Jumlah Aset
(Peratus)Share of
Total Assets (Per cent)
Institusi Pengambilan DepositDeposit Taking Institutions
12 19.6 92.4 10 20.3 92.6
Bank-bankIslam(1) Islamic Banks
2 11.2 52.8 2 11.6 53.0
Bank-bankKonvensional Conventional Banks
7 6.3 29.7 6 6.7 30.5
SyarikatKewangan Finance Companies
3 2.1 9.9 2 2.0 9.1
Bank-bankLuarPersisir Offshore Banks
- - - - - -
Lain-lain Institusi Kewangan BerlesenOther Licensed Financial Institutions
11 1.6 7.6 11 1.6 7.4
SyarikatInsuransKonvensional Conventional Insurance Companies
7 1.1 5.2 7 1.1 4.9
PengendaliTakaful Takaful Operators
4 0.5 2.4 4 0.5 2.5
Syarikat-syarikatInsuransLuarPersisir Offshore Insurance Companies
- - - - - -
Jumlah AsetTotal Assets 23 21.2 100.0 21 21.9 100.0
Sumber/Source:AutoritiMonetariBruneiDarussalam(AMBD)
Nota:(1)TermasukPerbadananTabungAmanahIslamBrunei(TAIB)Note : Including Tabung Amanah Islam Brunei (TAIB) Trust Fund
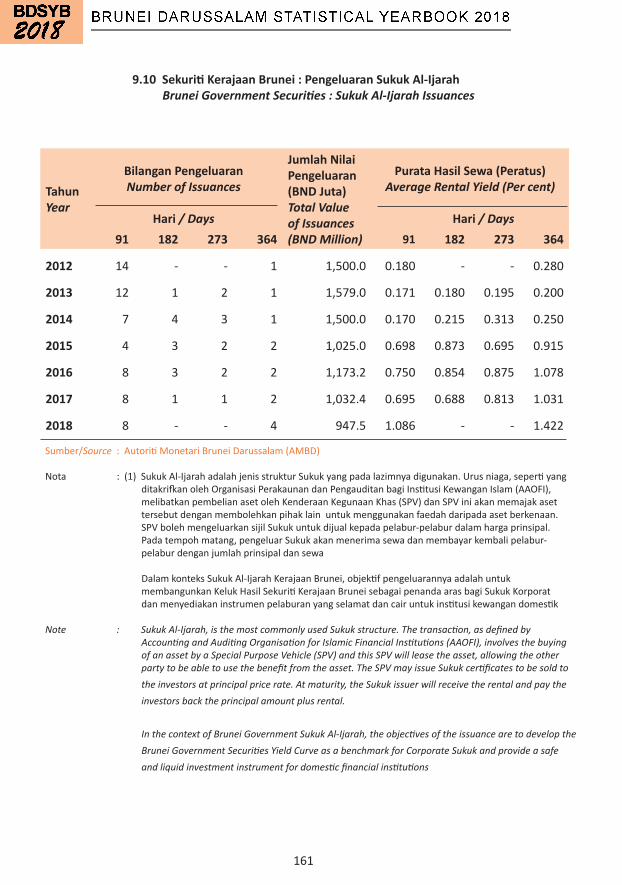
161
9.10 Sekuriti Kerajaan Brunei : Pengeluaran Sukuk Al-Ijarah Brunei Government Securities : Sukuk Al-Ijarah Issuances
TahunYear
Bilangan PengeluaranNumber of Issuances
Jumlah Nilai Pengeluaran(BND Juta)Total Value of Issuances (BND Million)
Purata Hasil Sewa (Peratus)Average Rental Yield (Per cent)
Hari / Days Hari / Days91 182 273 364 91 182 273 364
2012 14 - - 1 1,500.0 0.180 - - 0.280
2013 12 1 2 1 1,579.0 0.171 0.180 0.195 0.200
2014 7 4 3 1 1,500.0 0.170 0.215 0.313 0.250
2015 4 3 2 2 1,025.0 0.698 0.873 0.695 0.915
2016 8 3 2 2 1,173.2 0.750 0.854 0.875 1.078
2017 8 1 1 2 1,032.4 0.695 0.688 0.813 1.031
2018 8 - - 4 947.5 1.086 - - 1.422
Sumber/Source:AutoritiMonetariBruneiDarussalam(AMBD)
Nota:(1)SukukAl-IjarahadalahjenisstrukturSukukyangpadalazimnyadigunakan.Urusniaga,sepertiyangditakrifkanolehOrganisasiPerakaunandanPengauditanbagiInstitusiKewanganIslam(AAOFI),melibatkanpembelianasetolehKenderaanKegunaanKhas(SPV)danSPViniakanmemajakasettersebutdenganmembolehkanpihaklainuntukmenggunakanfaedahdaripadaasetberkenaan.SPVbolehmengeluarkansijilSukukuntukdijualkepadapelabur-pelaburdalamhargaprinsipal.Padatempohmatang,pengeluarSukukakanmenerimasewadanmembayarkembalipelabur-pelaburdenganjumlahprinsipaldansewa
DalamkonteksSukukAl-IjarahKerajaanBrunei,objektifpengeluarannyaadalahuntukmembangunkanKelukHasilSekuritiKerajaanBruneisebagaipenandaarasbagiSukukKorporatdanmenyediakaninstrumenpelaburanyangselamatdancairuntukinstitusikewangandomestik
Note : Sukuk Al-Ijarah, is the most commonly used Sukuk structure. The transaction, as defined by Accounting and Auditing Organisation for Islamic Financial Institutions (AAOFI), involves the buying of an asset by a Special Purpose Vehicle (SPV) and this SPV will lease the asset, allowing the other party to be able to use the benefit from the asset. The SPV may issue Sukuk certificates to be sold to the investors at principal price rate. At maturity, the Sukuk issuer will receive the rental and pay the investors back the principal amount plus rental.
In the context of Brunei Government Sukuk Al-Ijarah, the objectives of the issuance are to develop the Brunei Government Securities Yield Curve as a benchmark for Corporate Sukuk and provide a safe and liquid investment instrument for domestic financial institutions
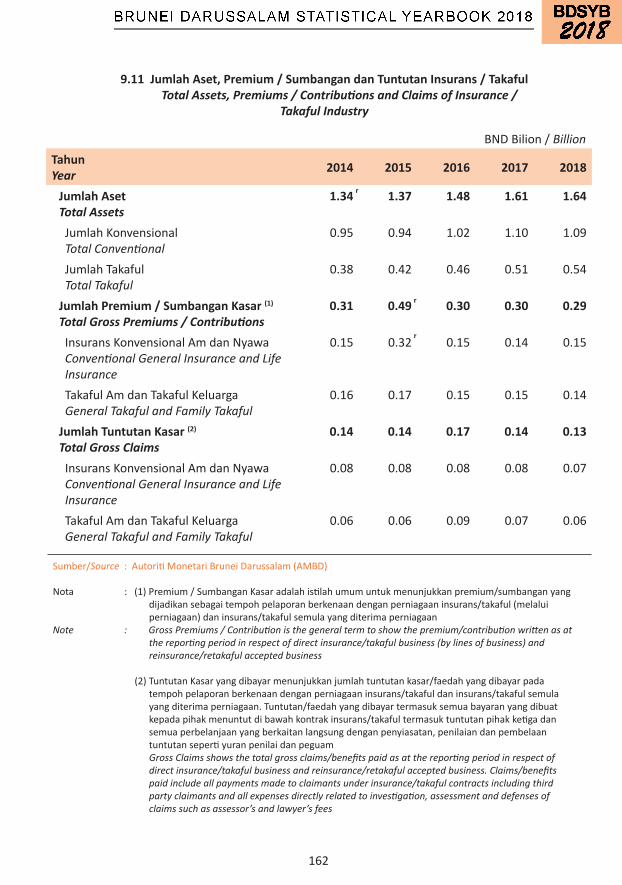
162
BNDBilion/BillionTahunYear 2014 2015 2016 2017 2018
Jumlah Aset Total Assets
1.34 1.37 1.48 1.61 1.64
JumlahKonvensional Total Conventional
0.95 0.94 1.02 1.10 1.09
JumlahTakaful Total Takaful
0.38 0.42 0.46 0.51 0.54
Jumlah Premium / Sumbangan Kasar (1)
Total Gross Premiums / Contributions0.31 0.49 0.30 0.30 0.29
InsuransKonvensionalAmdanNyawa Conventional General Insurance and Life Insurance
0.15 0.32 0.15 0.14 0.15
TakafulAmdanTakafulKeluarga General Takaful and Family Takaful
0.16 0.17 0.15 0.15 0.14
Jumlah Tuntutan Kasar (2)
Total Gross Claims0.14 0.14 0.17 0.14 0.13
InsuransKonvensionalAmdanNyawa Conventional General Insurance and Life Insurance
0.08 0.08 0.08 0.08 0.07
TakafulAmdanTakafulKeluarga General Takaful and Family Takaful
0.06 0.06 0.09 0.07 0.06
9.11 Jumlah Aset, Premium / Sumbangan dan Tuntutan Insurans / Takaful Total Assets, Premiums / Contributions and Claims of Insurance /
Takaful Industry
Sumber/Source:AutoritiMonetariBruneiDarussalam(AMBD)
Nota:(1)Premium/SumbanganKasaradalahistilahumumuntukmenunjukkanpremium/sumbanganyangdijadikansebagaitempohpelaporanberkenaandenganperniagaaninsurans/takaful(melaluiperniagaan)daninsurans/takafulsemulayangditerimaperniagaanNote : Gross Premiums / Contribution is the general term to show the premium/contribution written as at the reporting period in respect of direct insurance/takaful business (by lines of business) and reinsurance/retakaful accepted business (2)TuntutanKasaryangdibayarmenunjukkanjumlahtuntutankasar/faedahyangdibayarpadatempohpelaporanberkenaandenganperniagaaninsurans/takafuldaninsurans/takafulsemulayangditerimaperniagaan.Tuntutan/faedahyangdibayartermasuksemuabayaranyangdibuatkepadapihakmenuntutdibawahkontrakinsurans/takafultermasuktuntutanpihakketigadansemuaperbelanjaanyangberkaitanlangsungdenganpenyiasatan,penilaiandanpembelaantuntutansepertiyuranpenilaidanpeguam Gross Claims shows the total gross claims/benefits paid as at the reporting period in respect of direct insurance/takaful business and reinsurance/retakaful accepted business. Claims/benefits paid include all payments made to claimants under insurance/takaful contracts including third party claimants and all expenses directly related to investigation, assessment and defenses of claims such as assessor’s and lawyer’s fees
r
r
r
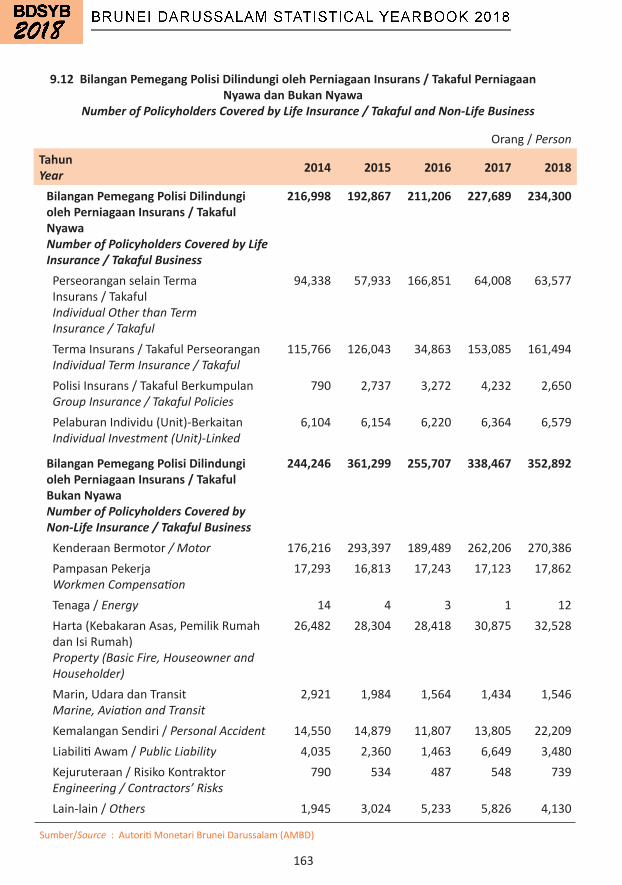
163
Orang/ PersonTahunYear 2014 2015 2016 2017 2018
Bilangan Pemegang Polisi Dilindungi oleh Perniagaan Insurans / Takaful Nyawa Number of Policyholders Covered by Life Insurance / Takaful Business
216,998 192,867 211,206 227,689 234,300
PerseoranganselainTermaInsurans/Takaful Individual Other than Term Insurance / Takaful
94,338 57,933 166,851 64,008 63,577
TermaInsurans/TakafulPerseorangan Individual Term Insurance / Takaful
115,766 126,043 34,863 153,085 161,494
PolisiInsurans/TakafulBerkumpulan Group Insurance / Takaful Policies
790 2,737 3,272 4,232 2,650
PelaburanIndividu(Unit)-Berkaitan Individual Investment (Unit)-Linked
6,104 6,154 6,220 6,364 6,579
Bilangan Pemegang Polisi Dilindungi oleh Perniagaan Insurans / Takaful Bukan Nyawa Number of Policyholders Covered by Non-Life Insurance / Takaful Business
244,246 361,299 255,707 338,467 352,892
KenderaanBermotor / Motor 176,216 293,397 189,489 262,206 270,386PampasanPekerja Workmen Compensation
17,293 16,813 17,243 17,123 17,862
Tenaga/Energy 14 4 3 1 12Harta(KebakaranAsas,PemilikRumahdanIsiRumah) Property (Basic Fire, Houseowner and Householder)
26,482 28,304 28,418 30,875 32,528
Marin,UdaradanTransit Marine, Aviation and Transit
2,921 1,984 1,564 1,434 1,546
KemalanganSendiri/Personal Accident 14,550 14,879 11,807 13,805 22,209 LiabilitiAwam/Public Liability 4,035 2,360 1,463 6,649 3,480 Kejuruteraan/RisikoKontraktor Engineering / Contractors’ Risks
790 534 487 548 739
Lain-lain/Others 1,945 3,024 5,233 5,826 4,130
9.12 Bilangan Pemegang Polisi Dilindungi oleh Perniagaan Insurans / Takaful Perniagaan Nyawa dan Bukan Nyawa
Number of Policyholders Covered by Life Insurance / Takaful and Non-Life Business
Sumber/Source:AutoritiMonetariBruneiDarussalam(AMBD)

164
BNDJuta/ Million Tahun Year 2014 2015 2016 2017 2018
Premium / Sumbangan Kasar bagi Perniagaan Insurans / Takaful Bukan Nyawa Gross Premiums / Contributions for Non-Life Insurance / Takaful Business
193.80 192.10 182.30 185.20 188.50
KenderaanBermotor / Motor 90.70 97.80 98.90 95.00 91.50 PampasanPekerja / Workmen Compensation 14.50 17.00 15.00 13.90 12.70 Tenaga/Energy 22.10 17.70 17.40 16.10 22.90Harta(KebakaranAsas,PemilikRumahdanIsiRumah) Property (Basic Fire, Houseowner and Householder)
16.00 14.50 23.00 21.60 23.30
Marin,UdaradanTransit Marine, Aviation and Transit
13.50 12.80 7.50 12.20 10.80
KemalanganSendiri/ Personal Accident 5.00 5.60 5.20 8.60 8.50 LiabilitiAwam/Public Liability 7.30 3.60 5.70 3.50 5.50 Kejuruteraan/RisikoKontraktor Engineering / Contractors’ Risks
3.00 5.30 1.70 9.00 7.00
Lain-lain/Others 21.70 17.80 7.90 5.30 6.30Tuntutan Kasar bagi Perniagaan Insurans / Takaful Bukan Nyawa Gross Claims for Non-Life Insurance / Takaful Business
50.98 49.34 79.99 69.21 63.60
KenderaanBermotor / Motor 34.90 34.80 47.00 45.50 41.20PampasanPekerja / Workmen Compensation 3.40 2.90 6.30 9.70 7.30Tenaga/Energy - (1.60) 10.50 1.30 5.90Harta(KebakaranAsas,PemilikRumahdanIsiRumah) Property (Basic Fire, Houseowner and Householder)
4.90 3.50 5.10 3.10 2.90
Marin,UdaradanTransit Marine, Aviation and Transit
0.06 0.07 10.70 6.40 3.20
KemalanganSendiri/ Personal Accident 0.03 0.03 0.05 0.95 1.20 LiabilitiAwam/Public Liability 0.06 0.02 1.90 0.16 0.70 Kejuruteraan/RisikoKontraktor Engineering / Contractors’ Risks
0.03 0.02 (0.06) 1.60 1.00
Lain-lain/Others 7.60 9.60 (1.50) 0.50 0.20
9.13 Premium / Sumbangan Kasar dan Tuntutan Kasar bagi Perniagaan Insurans / Takaful Bukan Nyawa
Gross Premiums / Contributions and Gross Claims for Non-Life Insurance / Takaful Business
Sumber/Source:AutoritiMonetariBruneiDarussalam(AMBD)

165
10 UGAMA RELIGION

166
10.1 Penduduk mengikut Agama, Jantina dan Tahun Banci Population by Religion, Sex and Census Year
UgamaReligion 1991 2001 2011 2016
Islam / MuslimLelaki/Male 87,907 125,116 159,417 173,445Perempuan/Female 87,066 124,706 150,545 163,946Jumlah/Total 174,973 249,822 309,962 337,391
Kristian / ChristianityLelaki/Male 13,740 14,878 16,738 14,037
Perempuan/Female 12,254 16,413 17,438 15,473Jumlah/Total 25,994 31,291 34,176 29,510
Buddha / Buddhism Lelaki/Male 20,915 15,894 16,716 15,025Perempuan/Female 12,472 12,586 14,098 14,470Jumlah/Total 33,387 28,480 30,814 29,495
Lain-lain / OthersLelaki/Male 15,054 13,086 10,273 11,597Perempuan/Female 11,074 10,165 8,147 9,263Jumlah/Total 26,128 23,251 18,420 20,860
Jumlah Total 260,482 332,844 393,372 417,256
Sumber:JabatanPerancangandanKemajuanEkonomi,KementerianKewangandanEkonomiSource : Department of Economic Planning and Development, Ministry of Finance and Economy
Nota:(1)Lain-laintermasuklain-lainagamadankepercayaanNote : Others include other religions and faiths (2)Tahun2016adalahhasildariKemaskiniBanciPendudukdanPerumahan Year 2016 is the result from the Population and Housing Census Update
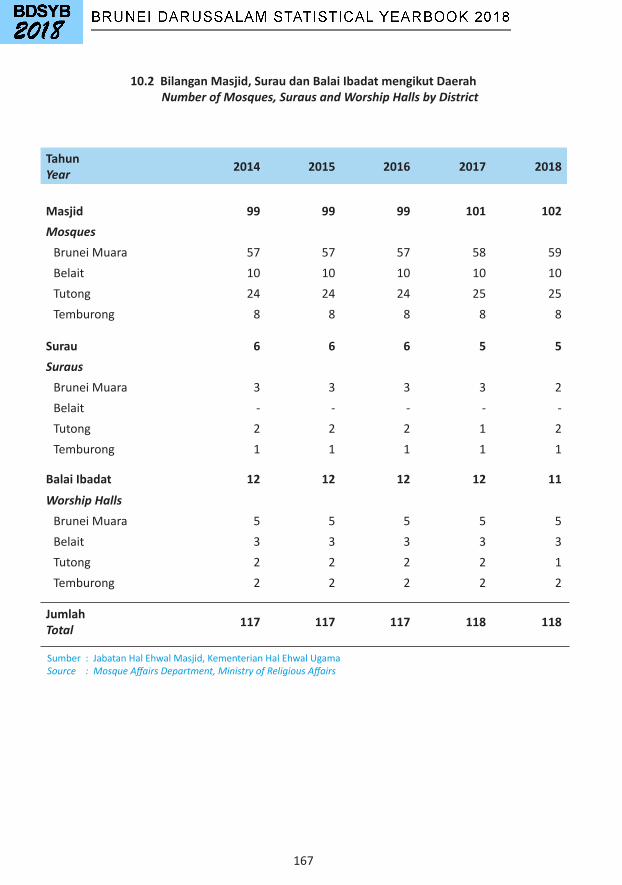
167
10.2 Bilangan Masjid, Surau dan Balai Ibadat mengikut Daerah Number of Mosques, Suraus and Worship Halls by District
Sumber:JabatanHalEhwalMasjid,KementerianHalEhwalUgama Source : Mosque Affairs Department, Ministry of Religious Affairs
TahunYear 2014 2015 2016 2017 2018
Masjid 99 99 99 101 102MosquesBruneiMuara 57 57 57 58 59Belait 10 10 10 10 10Tutong 24 24 24 25 25Temburong 8 8 8 8 8
Surau 6 6 6 5 5SurausBruneiMuara 3 3 3 3 2Belait - - - - -Tutong 2 2 2 1 2Temburong 1 1 1 1 1
Balai Ibadat 12 12 12 12 11
Worship HallsBruneiMuara 5 5 5 5 5Belait 3 3 3 3 3Tutong 2 2 2 2 1Temburong 2 2 2 2 2
JumlahTotal 117 117 117 118 118
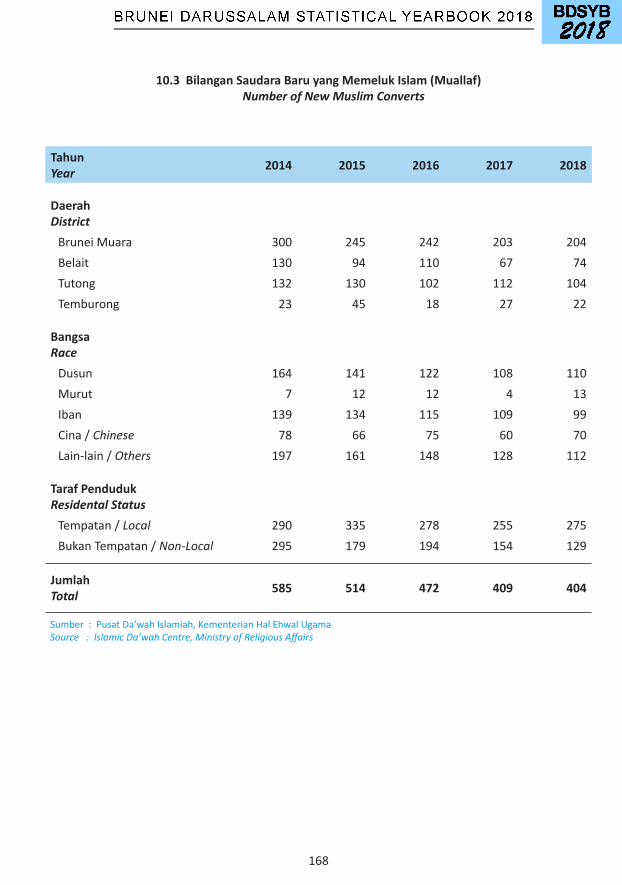
168
10.3 Bilangan Saudara Baru yang Memeluk Islam (Muallaf) Number of New Muslim Converts
Sumber:PusatDa’wahIslamiah,KementerianHalEhwalUgama Source : Islamic Da’wah Centre, Ministry of Religious Affairs
TahunYear 2014 2015 2016 2017 2018
DaerahDistrictBruneiMuara 300 245 242 203 204Belait 130 94 110 67 74Tutong 132 130 102 112 104Temburong 23 45 18 27 22
BangsaRaceDusun 164 141 122 108 110Murut 7 12 12 4 13Iban 139 134 115 109 99Cina/Chinese 78 66 75 60 70Lain-lain/Others 197 161 148 128 112
Taraf PendudukResidental StatusTempatan/Local 290 335 278 255 275BukanTempatan/Non-Local 295 179 194 154 129
JumlahTotal 585 514 472 409 404
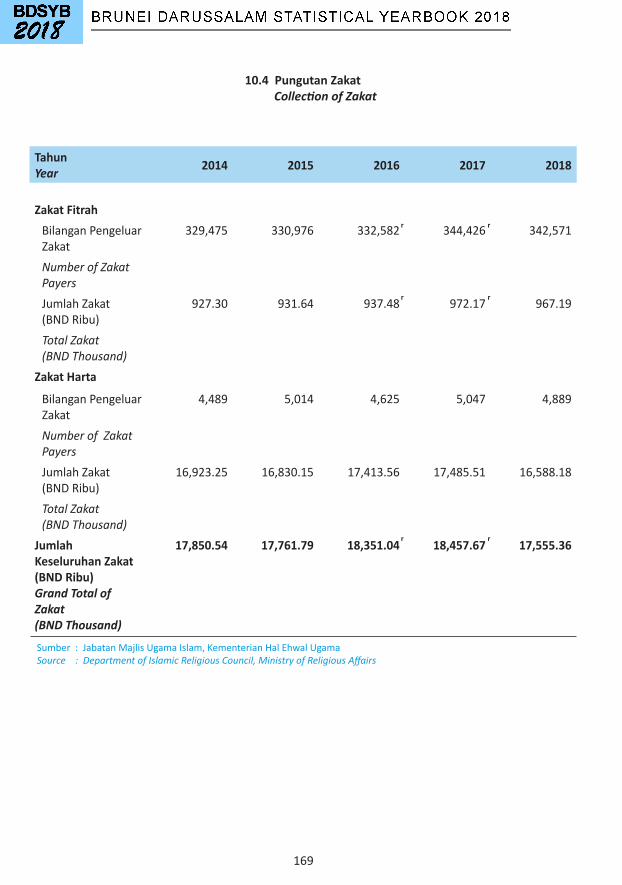
169
10.4 Pungutan Zakat Collection of Zakat
Sumber:JabatanMajlisUgamaIslam,KementerianHalEhwalUgamaSource : Department of Islamic Religious Council, Ministry of Religious Affairs
TahunYear 2014 2015 2016 2017 2018
Zakat FitrahBilanganPengeluarZakat
329,475 330,976 332,582 344,426 342,571
Number of Zakat PayersJumlahZakat(BNDRibu)
927.30 931.64 937.48 972.17 967.19
Total Zakat (BND Thousand)
Zakat Harta
BilanganPengeluarZakat
4,489 5,014 4,625 5,047 4,889
Number of Zakat PayersJumlahZakat(BNDRibu)
16,923.25 16,830.15 17,413.56 17,485.51 16,588.18
Total Zakat (BND Thousand)
Jumlah Keseluruhan Zakat (BND Ribu)Grand Total of Zakat (BND Thousand)
17,850.54 17,761.79 18,351.04 18,457.67 17,555.36
r
r
r
r
r
r
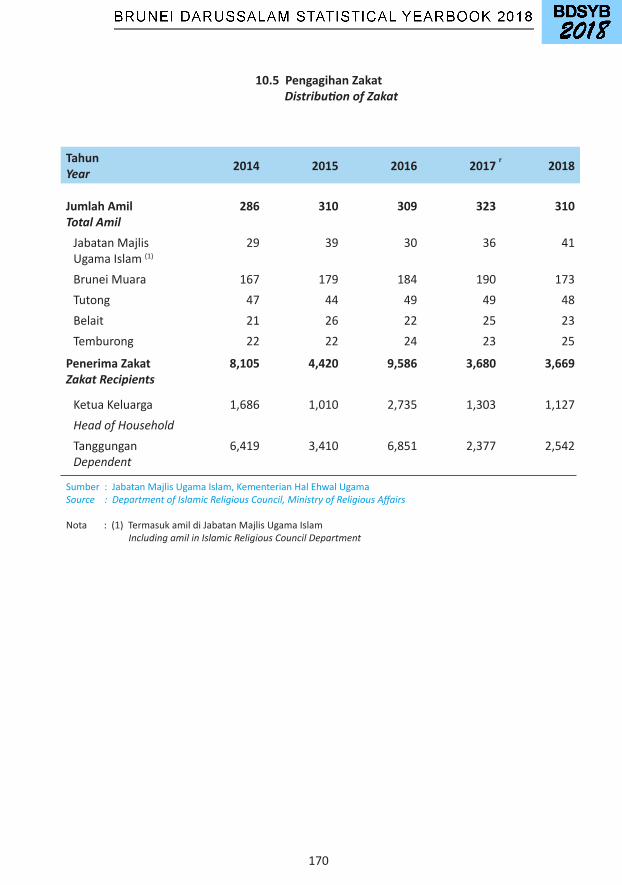
170
TahunYear 2014 2015 2016 2017 2018
Jumlah AmilTotal Amil
286 310 309 323 310
JabatanMajlisUgamaIslam(1)
29 39 30 36 41
BruneiMuara 167 179 184 190 173Tutong 47 44 49 49 48Belait 21 26 22 25 23Temburong 22 22 24 23 25
Penerima ZakatZakat Recipients
8,105 4,420 9,586 3,680 3,669
KetuaKeluarga 1,686 1,010 2,735 1,303 1,127Head of HouseholdTanggunganDependent
6,419 3,410 6,851 2,377 2,542
10.5 Pengagihan Zakat Distribution of Zakat
Sumber:JabatanMajlisUgamaIslam,KementerianHalEhwalUgamaSource : Department of Islamic Religious Council, Ministry of Religious Affairs
Nota:(1)TermasukamildiJabatanMajlisUgamaIslam Including amil in Islamic Religious Council Department
r
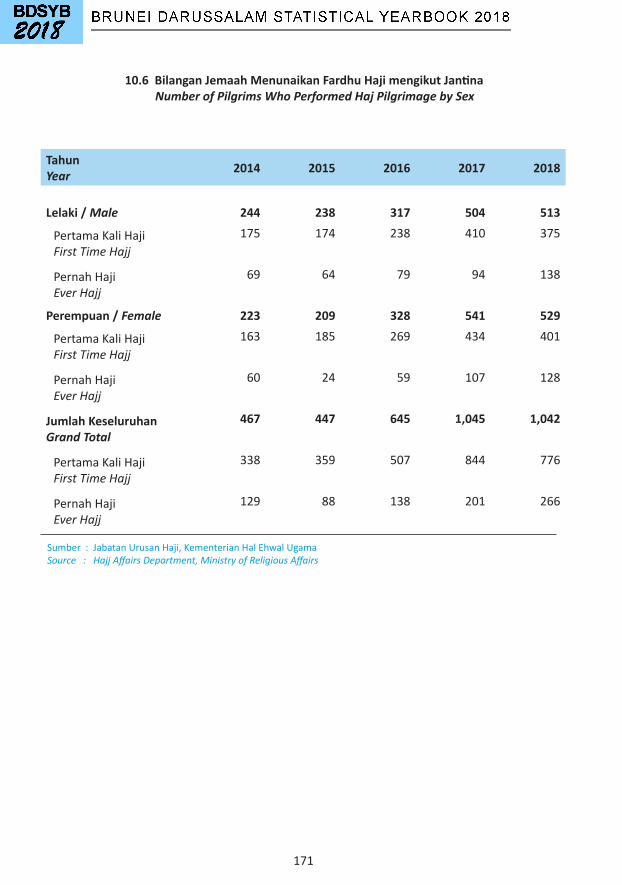
171
TahunYear 2014 2015 2016 2017 2018
Lelaki / Male 244 238 317 504 513
PertamaKaliHajiFirst Time Hajj
175 174 238 410 375
PernahHajiEver Hajj
69 64 79 94 138
Perempuan / Female 223 209 328 541 529
PertamaKaliHajiFirst Time Hajj
163 185 269 434 401
PernahHajiEver Hajj
60 24 59 107 128
Jumlah KeseluruhanGrand Total
467 447 645 1,045 1,042
PertamaKaliHajiFirst Time Hajj
338 359 507 844 776
PernahHajiEver Hajj
129 88 138 201 266
10.6 Bilangan Jemaah Menunaikan Fardhu Haji mengikut Jantina Number of Pilgrims Who Performed Haj Pilgrimage by Sex
Sumber:JabatanUrusanHaji,KementerianHalEhwalUgamaSource : Hajj Affairs Department, Ministry of Religious Affairs

172
11 PENDIDIKAN EDUCATION

173
Sektor dan DaerahSector and District 2014 2015 2016 2017 2018
SEKOLAH / SCHOOLS 259 254 252 251 252BruneiMuara 161 158 158 157 159Belait 38 38 38 38 37Tutong 44 43 42 42 42Temburong 16 15 14 14 14
Kerajaan / Government 178 176 175 174 175BruneiMuara 103 103 103 102 103
Belait 24 24 24 24 24Tutong 37 36 36 36 36Temburong 14 13 12 12 12
Swasta / Private 81 78 77 77 77BruneiMuara 58 55 55 55 56Belait 14 14 14 14 13Tutong 7 7 6 6 6Temburong 2 2 2 2 2
GURU / TEACHERS 10,896 10,979 10,985 10,686 10,940BruneiMuara 7,914 7,988 8,188 7,901 8,167Belait 1,481 1,498 1,436 1,365 1,345Tutong 1,219 1,219 1,109 1,146 1,180Temburong 282 274 252 274 248
Kerajaan / Government 8,572 8,580 8,470 8,232 8,456BruneiMuara 6,173 6,211 6,280 5,999 6,214Belait 1,040 1,008 945 919 924Tutong 1,101 1,111 1,013 1,059 1,090Temburong 258 250 232 255 228
11.1 Bilangan Sekolah, Guru dan Penuntut mengikut Sektor dan Daerah Number of Schools, Teachers and Students by Sector and District
Sumber:KementerianPendidikanSource : Ministry of Education

174
Sektor dan DaerahSector and District 2014 2015 2016 2017 2018
Swasta / Private 2,324 2,399 2,515 2,454 2,484BruneiMuara 1,741 1,777 1,908 1,902 1,953
Belait 441 490 491 446 421Tutong 118 108 96 87 90Temburong 24 24 20 19 20
PENUNTUT / STUDENTS 116,168 113,987 111,698 110,097 108,881BruneiMuara 88,966 88,258 85,846 84,976 80,912Belait 15,328 14,182 14,407 14,072 16,261Tutong 9,776 9,519 9,483 9,122 9,815Temburong 2,098 2,028 1,962 1,927 1,893
Kerajaan / Government 79,075 77,420 75,812 74,653 73,341BruneiMuara 59,652 58,690 57,517 57,025 52,797Belait 9,126 8,696 8,327 8,086 10,355Tutong 8,362 8,138 8,132 7,768 8,468Temburong 1,935 1,896 1,836 1,774 1,721
Swasta / Private 37,093 36,567 35,886 35,444 35,540BruneiMuara 29,314 29,568 28,329 27,951 28,115Belait 6,202 5,486 6,080 5,986 5,906Tutong 1,414 1,381 1,351 1,354 1,347Temburong 163 132 126 153 172
11.1 Bilangan Sekolah, Guru dan Penuntut mengikut Sektor dan Daerah (Sambungan) Number of Schools, Teachers and Students by Sector and District (Continued)
Sumber:KementerianPendidikanSource : Ministry of Education
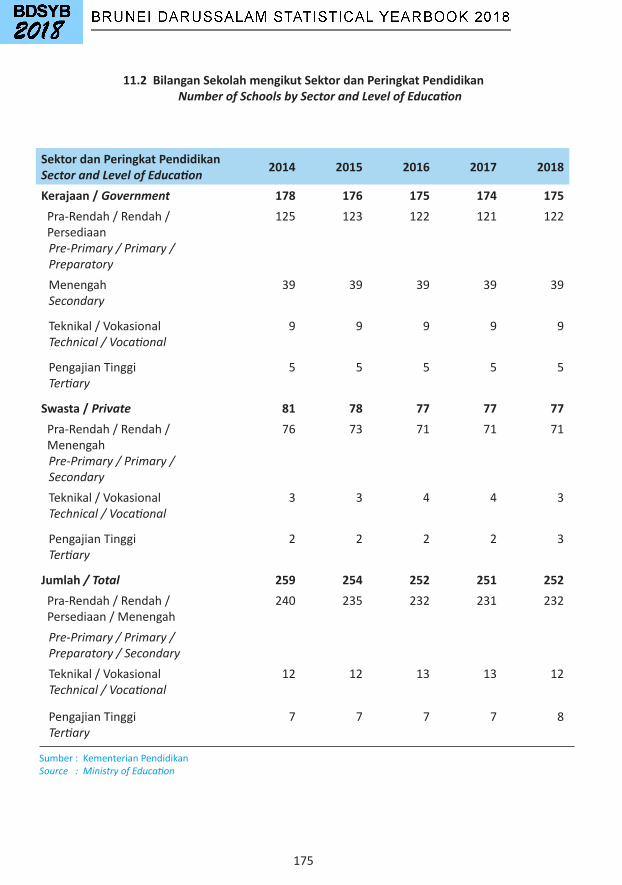
175
11.2 Bilangan Sekolah mengikut Sektor dan Peringkat Pendidikan Number of Schools by Sector and Level of Education
Sektor dan Peringkat PendidikanSector and Level of Education 2014 2015 2016 2017 2018
Kerajaan / Government 178 176 175 174 175Pra-Rendah/Rendah/Persediaan
Pre-Primary / Primary / Preparatory
125 123 122 121 122
MenengahSecondary
39 39 39 39 39
Teknikal/VokasionalTechnical / Vocational
9 9 9 9 9
PengajianTinggiTertiary
5 5 5 5 5
Swasta / Private 81 78 77 77 77Pra-Rendah/Rendah/Menengah
Pre-Primary / Primary / Secondary
76 73 71 71 71
Teknikal/VokasionalTechnical / Vocational
3 3 4 4 3
PengajianTinggiTertiary
2 2 2 2 3
Jumlah / Total 259 254 252 251 252Pra-Rendah/Rendah/Persediaan/Menengah
240 235 232 231 232
Pre-Primary / Primary / Preparatory / SecondaryTeknikal/VokasionalTechnical / Vocational
12 12 13 13 12
PengajianTinggiTertiary
7 7 7 7 8
Sumber:KementerianPendidikanSource : Ministry of Education

176
11.3 Jumlah Guru mengikut Peringkat Pendidikan Total Number of Teachers by Level of Education
Peringkat Pendidikan dan JantinaLevel of Education and Sex 2014 2015 2016 2017 2018
Pra-RendahPre-Primary
786 779 885 856 899
Lelaki/Male 32 32 39 34 41Perempuan/Female 754 747 846 822 858
Rendah / Persediaan Primary / Preparatory
4,004 4,033 3,969 3,890 3,989
Lelaki/Male 933 915 891 876 886Perempuan/Female 3,071 3,118 3,078 3,014 3,103
Menengah / Tingkatan Enam (Pra-Universiti)Secondary / Sixth Form (Pre-University)
4,702 4,704 4,728 4,556 4,671
Lelaki/Male 1,464 1,427 1,452 1,366 1,384Perempuan/Female 3,238 3,277 3,276 3,190 3,287
Teknikal / VokasionalTechnical / Vocational
657 643 595 545 543
Lelaki/Male 316 290 267 235 246Perempuan/Female 341 353 328 310 297
Pengajian TinggiTertiary
747 820 808 839 838
Lelaki/Male 393 456 430 450 446Perempuan/Female 354 364 378 389 392
Jumlah KeseluruhanGrand Total
10,896 10,979 10,985 10,686 10,940
Lelaki/Male 3,138 3,120 3,079 2,961 3,003Perempuan/Female 7,758 7,859 7,906 7,725 7,937
Sumber:KementerianPendidikanSource : Ministry of Education
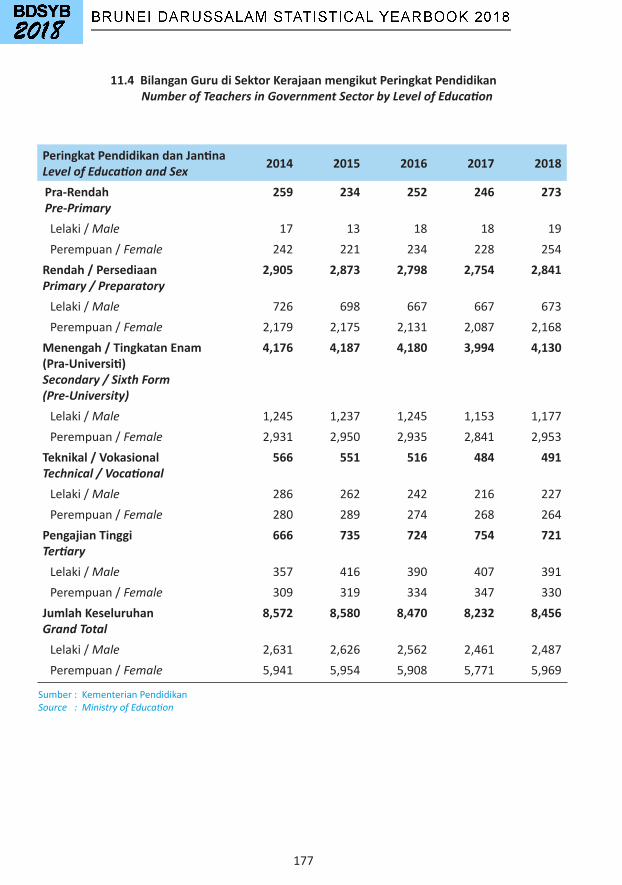
177
11.4 Bilangan Guru di Sektor Kerajaan mengikut Peringkat Pendidikan Number of Teachers in Government Sector by Level of Education
Peringkat Pendidikan dan JantinaLevel of Education and Sex 2014 2015 2016 2017 2018
Pra-RendahPre-Primary
259 234 252 246 273
Lelaki/Male 17 13 18 18 19Perempuan/Female 242 221 234 228 254
Rendah / Persediaan Primary / Preparatory
2,905 2,873 2,798 2,754 2,841
Lelaki/Male 726 698 667 667 673Perempuan/Female 2,179 2,175 2,131 2,087 2,168
Menengah / Tingkatan Enam (Pra-Universiti)Secondary / Sixth Form (Pre-University)
4,176 4,187 4,180 3,994 4,130
Lelaki/Male 1,245 1,237 1,245 1,153 1,177Perempuan/Female 2,931 2,950 2,935 2,841 2,953
Teknikal / VokasionalTechnical / Vocational
566 551 516 484 491
Lelaki/Male 286 262 242 216 227Perempuan/Female 280 289 274 268 264
Pengajian TinggiTertiary
666 735 724 754 721
Lelaki/Male 357 416 390 407 391Perempuan/Female 309 319 334 347 330
Jumlah KeseluruhanGrand Total
8,572 8,580 8,470 8,232 8,456
Lelaki/Male 2,631 2,626 2,562 2,461 2,487Perempuan/Female 5,941 5,954 5,908 5,771 5,969
Sumber:KementerianPendidikanSource : Ministry of Education

178
Peringkat Pendidikan dan JantinaLevel of Education and Sex 2014 2015 2016 2017 2018
Pra-RendahPre-Primary
527 545 633 610 626
Lelaki/Male 15 19 21 16 22Perempuan/Female 512 526 612 594 604
Rendah / Persediaan Primary / Preparatory
1,099 1,160 1,171 1,136 1,148
Lelaki/Male 207 217 224 209 213Perempuan/Female 892 943 947 927 935
Menengah / Tingkatan Enam (Pra-Universiti)Secondary / Sixth Form (Pre-University)
526 517 548 562 541
Lelaki/Male 219 190 207 213 207Perempuan/Female 307 327 341 349 334
Teknikal / VokasionalTechnical / Vocational
91 92 79 61 52
Lelaki/Male 30 28 25 19 19Perempuan/Female 61 64 54 42 33
Pengajian TinggiTertiary
81 85 84 85 117
Lelaki/Male 36 40 40 43 55Perempuan/Female 45 45 44 42 62
Jumlah KeseluruhanGrand Total
2,324 2,399 2,515 2,454 2,484
Lelaki/Male 507 494 517 500 516Perempuan/Female 1,817 1,905 1,998 1,954 1,968
11.5 Bilangan Guru di Sektor Swasta mengikut Peringkat Pendidikan Number of Teachers in Private Sector by Level of Education
Sumber:KementerianPendidikanSource : Ministry of Education

179
Sektor dan Taraf PendudukSector and Residential Status 2014 2015 2016 2017 2018
Kerajaan / Government 8,572 8,580 8,470 8,232 8,456RakyatBruneidanPendudukTetapBrunei Citizens and Permanent Residents
7,896 7,862 7,784 7,621 7,923
Lelaki/Male 2,205 2,163 2,120 2,064 2,132Perempuan/Female 5,691 5,699 5,664 5,557 5,791
PendudukSementaraTemporary Residents
676 718 686 611 533
Lelaki/Male 426 463 441 397 355Perempuan/Female 250 255 245 214 178
Swasta / Private 2,324 2,399 2,515 2,454 2,484RakyatBruneidanPendudukTetapBrunei Citizens and Permanent Residents
1,147 1,214 1,241 1,182 1,348
Lelaki/Male 148 138 136 127 166Perempuan/Female 999 1,076 1,105 1,055 1,182
PendudukSementaraTemporary Residents
1,177 1,185 1,274 1,272 1,136
Lelaki/Male 359 356 382 373 350Perempuan/Female 818 829 892 899 786
Jumlah / Total 10,896 10,979 10,985 10,686 10,940RakyatBruneidanPendudukTetapBrunei Citizens and Permanent Residents
9,043 9,076 9,025 8,803 9,271
Lelaki/Male 2,353 2,301 2,256 2,191 2,298Perempuan/Female 6,690 6,775 6,769 6,612 6,973
PendudukSementaraTemporary Residents
1,853 1,903 1,960 1,883 1,669
Lelaki/Male 785 819 823 770 705Perempuan/Female 1,068 1,084 1,137 1,113 964
11.6 Bilangan Guru mengikut Sektor dan Taraf Penduduk Number of Teachers by Sector and Residential Status
Sumber:KementerianPendidikanSource : Ministry of Education

180
11.7 Jumlah Penuntut mengikut Peringkat Pendidikan Total Number of Students by Level of Education
Sumber:KementerianPendidikanSource : Ministry of Education
Peringkat Pendidikan dan JantinaLevel of Education and Sex 2014 2015 2016 2017 2018
Pra-RendahPre-Primary
13,376 13,301 13,611 13,888 13,869
Lelaki/Male 6,871 6,805 6,935 7,039 7,127Perempuan/Female 6,505 6,496 6,676 6,849 6,742
Rendah / Persediaan Primary / Preparatory
41,078 40,397 40,471 39,610 39,472
Lelaki/Male 21,093 20,808 20,867 20,438 20,301Perempuan/Female 19,985 19,589 19,604 19,172 19,171
MenengahSecondary
37,769 36,677 35,922 35,118 34,247
Lelaki/Male 19,922 19,112 18,702 18,193 17,764Perempuan/Female 17,847 17,565 17,220 16,925 16,483
Tingkatan Enam (Pra-Universiti)Sixth Form (Pre-University)
5,618 5,058 4,809 4,874 4,575
Lelaki/Male 2,358 2,180 2,048 2,076 1,952Perempuan/Female 3,260 2,878 2,761 2,798 2,623
Teknikal / VokasionalTechnical / Vocational
5,622 5,514 4,858 4,472 5,082
Lelaki/Male 3,141 3,114 2,645 2,443 2,795Perempuan/Female 2,481 2,400 2,213 2,029 2,287
Pengajian TinggiTertiary
12,705 13,040 12,027 12,135 11,636
Lelaki/Male 5,040 5,253 4,853 4,896 4,773Perempuan/Female 7,665 7,787 7,174 7,239 6,863
Jumlah KeseluruhanGrand Total
116,168 113,987 111,698 110,097 108,881
Lelaki/Male 58,425 57,272 56,050 55,085 54,712Perempuan/Female 57,743 56,715 55,648 55,012 54,169
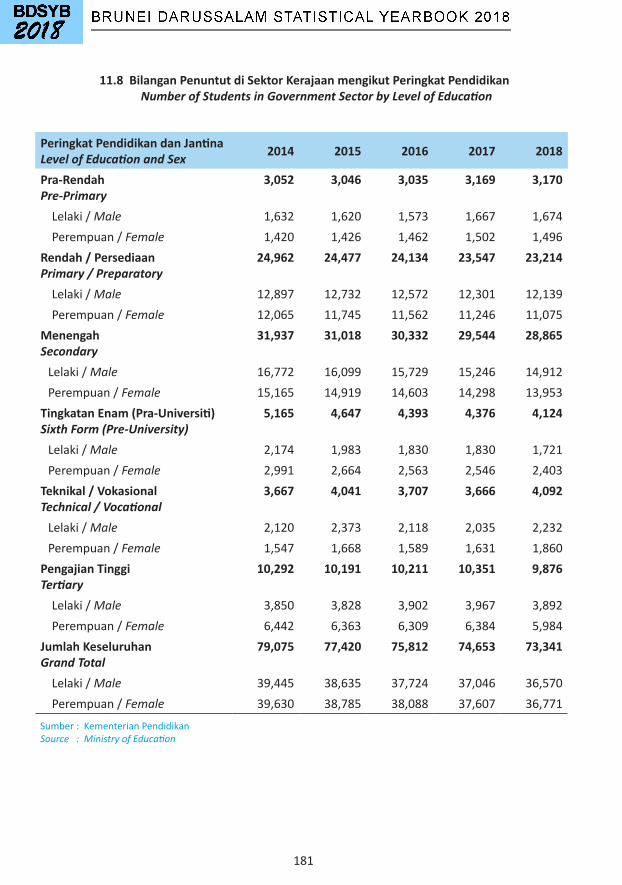
181
11.8 Bilangan Penuntut di Sektor Kerajaan mengikut Peringkat Pendidikan Number of Students in Government Sector by Level of Education
Sumber:KementerianPendidikanSource : Ministry of Education
Peringkat Pendidikan dan JantinaLevel of Education and Sex 2014 2015 2016 2017 2018
Pra-RendahPre-Primary
3,052 3,046 3,035 3,169 3,170
Lelaki/Male 1,632 1,620 1,573 1,667 1,674Perempuan/Female 1,420 1,426 1,462 1,502 1,496
Rendah / Persediaan Primary / Preparatory
24,962 24,477 24,134 23,547 23,214
Lelaki/Male 12,897 12,732 12,572 12,301 12,139Perempuan/Female 12,065 11,745 11,562 11,246 11,075
MenengahSecondary
31,937 31,018 30,332 29,544 28,865
Lelaki/Male 16,772 16,099 15,729 15,246 14,912Perempuan/Female 15,165 14,919 14,603 14,298 13,953
Tingkatan Enam (Pra-Universiti)Sixth Form (Pre-University)
5,165 4,647 4,393 4,376 4,124
Lelaki/Male 2,174 1,983 1,830 1,830 1,721Perempuan/Female 2,991 2,664 2,563 2,546 2,403
Teknikal / VokasionalTechnical / Vocational
3,667 4,041 3,707 3,666 4,092
Lelaki/Male 2,120 2,373 2,118 2,035 2,232Perempuan/Female 1,547 1,668 1,589 1,631 1,860
Pengajian TinggiTertiary
10,292 10,191 10,211 10,351 9,876
Lelaki/Male 3,850 3,828 3,902 3,967 3,892Perempuan/Female 6,442 6,363 6,309 6,384 5,984
Jumlah KeseluruhanGrand Total
79,075 77,420 75,812 74,653 73,341
Lelaki/Male 39,445 38,635 37,724 37,046 36,570Perempuan/Female 39,630 38,785 38,088 37,607 36,771
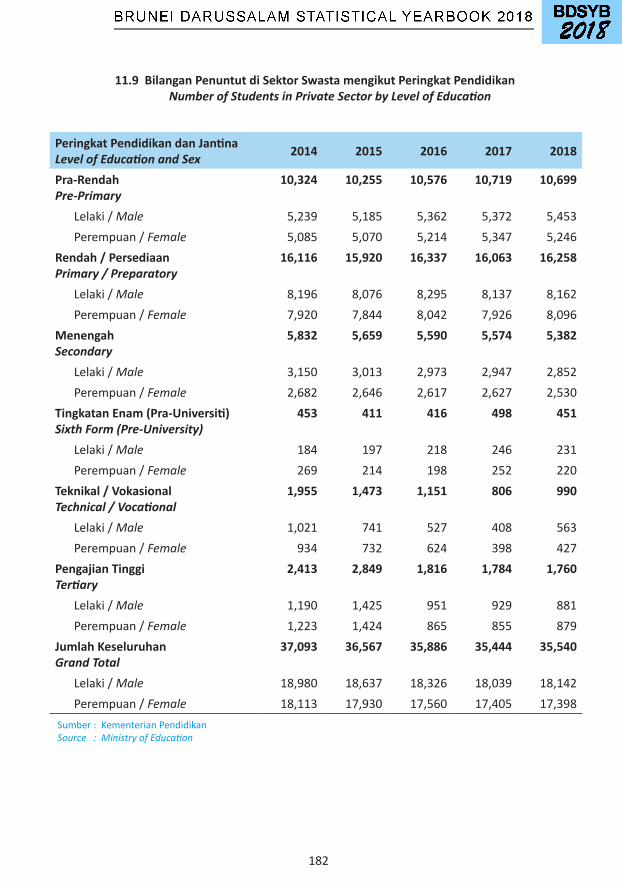
182
Peringkat Pendidikan dan JantinaLevel of Education and Sex 2014 2015 2016 2017 2018
Pra-RendahPre-Primary
10,324 10,255 10,576 10,719 10,699
Lelaki/Male 5,239 5,185 5,362 5,372 5,453Perempuan/Female 5,085 5,070 5,214 5,347 5,246
Rendah / Persediaan Primary / Preparatory
16,116 15,920 16,337 16,063 16,258
Lelaki/Male 8,196 8,076 8,295 8,137 8,162Perempuan/Female 7,920 7,844 8,042 7,926 8,096
MenengahSecondary
5,832 5,659 5,590 5,574 5,382
Lelaki/Male 3,150 3,013 2,973 2,947 2,852Perempuan/Female 2,682 2,646 2,617 2,627 2,530
Tingkatan Enam (Pra-Universiti)Sixth Form (Pre-University)
453 411 416 498 451
Lelaki/Male 184 197 218 246 231Perempuan/Female 269 214 198 252 220
Teknikal / VokasionalTechnical / Vocational
1,955 1,473 1,151 806 990
Lelaki/Male 1,021 741 527 408 563Perempuan/Female 934 732 624 398 427
Pengajian TinggiTertiary
2,413 2,849 1,816 1,784 1,760
Lelaki/Male 1,190 1,425 951 929 881Perempuan/Female 1,223 1,424 865 855 879
Jumlah KeseluruhanGrand Total
37,093 36,567 35,886 35,444 35,540
Lelaki/Male 18,980 18,637 18,326 18,039 18,142Perempuan/Female 18,113 17,930 17,560 17,405 17,398
11.9 Bilangan Penuntut di Sektor Swasta mengikut Peringkat Pendidikan Number of Students in Private Sector by Level of Education
Sumber:KementerianPendidikanSource : Ministry of Education
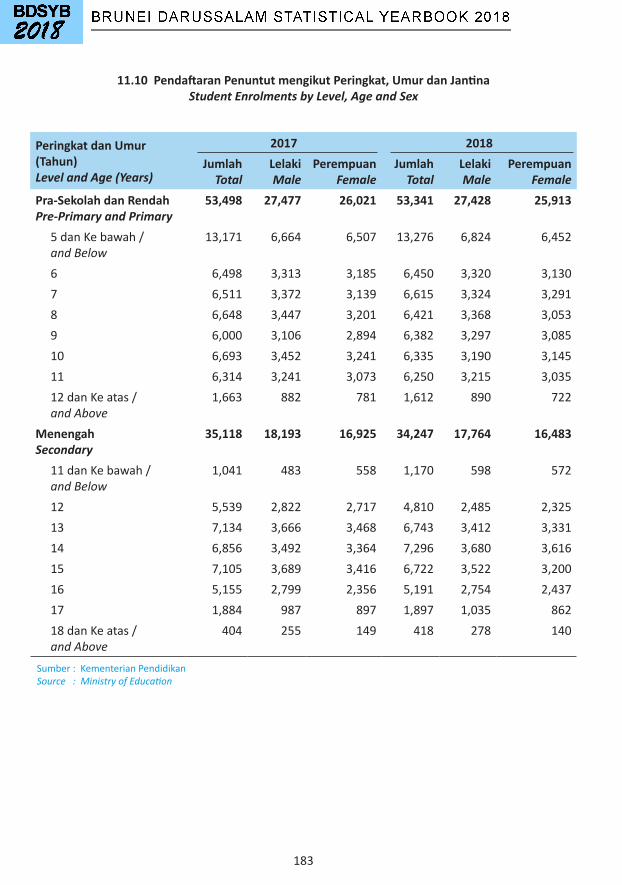
183
11.10 Pendaftaran Penuntut mengikut Peringkat, Umur dan Jantina Student Enrolments by Level, Age and Sex
Peringkat dan Umur (Tahun)Level and Age (Years)
2017 2018Jumlah
TotalLelakiMale
PerempuanFemale
JumlahTotal
LelakiMale
PerempuanFemale
Pra-Sekolah dan RendahPre-Primary and Primary
53,498 27,477 26,021 53,341 27,428 25,913
5danKebawah/and Below
13,171 6,664 6,507 13,276 6,824 6,452
6 6,498 3,313 3,185 6,450 3,320 3,1307 6,511 3,372 3,139 6,615 3,324 3,2918 6,648 3,447 3,201 6,421 3,368 3,0539 6,000 3,106 2,894 6,382 3,297 3,08510 6,693 3,452 3,241 6,335 3,190 3,14511 6,314 3,241 3,073 6,250 3,215 3,03512danKeatas/and Above
1,663 882 781 1,612 890 722
MenengahSecondary
35,118 18,193 16,925 34,247 17,764 16,483
11danKebawah/and Below
1,041 483 558 1,170 598 572
12 5,539 2,822 2,717 4,810 2,485 2,32513 7,134 3,666 3,468 6,743 3,412 3,33114 6,856 3,492 3,364 7,296 3,680 3,61615 7,105 3,689 3,416 6,722 3,522 3,20016 5,155 2,799 2,356 5,191 2,754 2,43717 1,884 987 897 1,897 1,035 86218danKeatas/and Above
404 255 149 418 278 140
Sumber:KementerianPendidikanSource : Ministry of Education
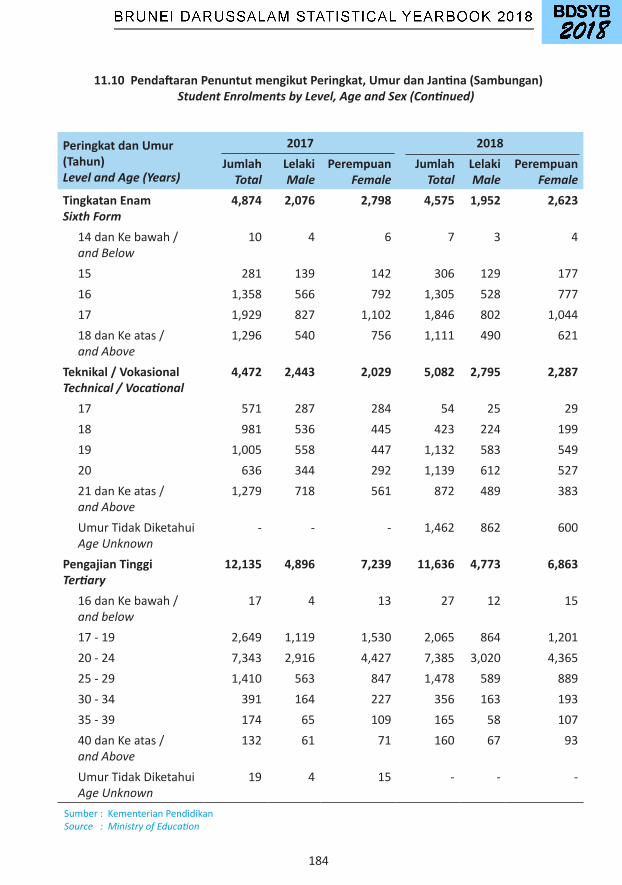
184
Peringkat dan Umur (Tahun)Level and Age (Years)
2017 2018Jumlah
TotalLelakiMale
PerempuanFemale
JumlahTotal
LelakiMale
PerempuanFemale
Tingkatan EnamSixth Form
4,874 2,076 2,798 4,575 1,952 2,623
14danKebawah/and Below
10 4 6 7 3 4
15 281 139 142 306 129 17716 1,358 566 792 1,305 528 77717 1,929 827 1,102 1,846 802 1,04418danKeatas/and Above
1,296 540 756 1,111 490 621
Teknikal / VokasionalTechnical / Vocational
4,472 2,443 2,029 5,082 2,795 2,287
17 571 287 284 54 25 2918 981 536 445 423 224 19919 1,005 558 447 1,132 583 54920 636 344 292 1,139 612 52721danKeatas/and Above
1,279 718 561 872 489 383
UmurTidakDiketahuiAge Unknown
- - - 1,462 862 600
Pengajian TinggiTertiary
12,135 4,896 7,239 11,636 4,773 6,863
16danKebawah/and below
17 4 13 27 12 15
17-19 2,649 1,119 1,530 2,065 864 1,20120-24 7,343 2,916 4,427 7,385 3,020 4,36525-29 1,410 563 847 1,478 589 88930-34 391 164 227 356 163 19335-39 174 65 109 165 58 10740danKeatas/and Above
132 61 71 160 67 93
UmurTidakDiketahuiAge Unknown
19 4 15 - - -
11.10 Pendaftaran Penuntut mengikut Peringkat, Umur dan Jantina (Sambungan) Student Enrolments by Level, Age and Sex (Continued)
Sumber:KementerianPendidikanSource : Ministry of Education
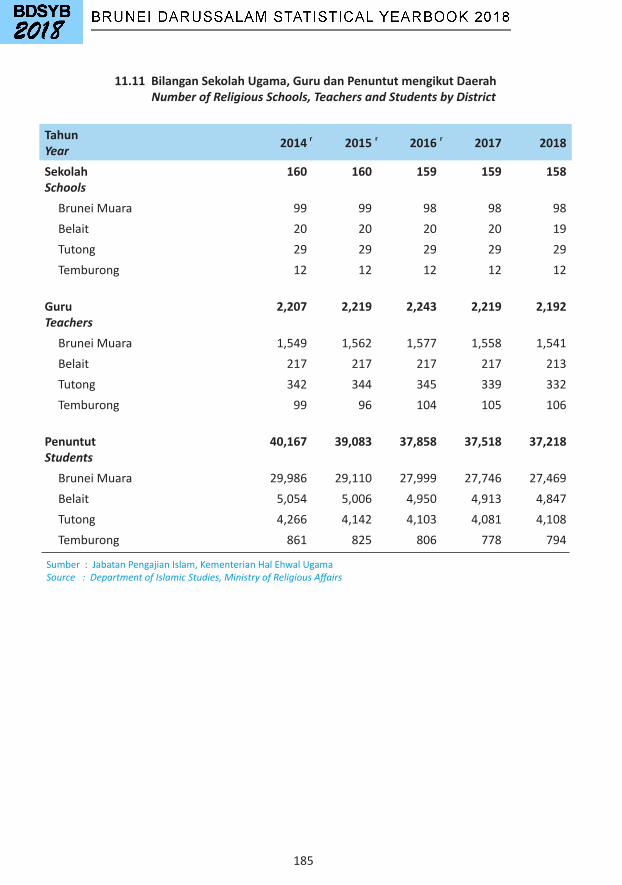
185
11.11 Bilangan Sekolah Ugama, Guru dan Penuntut mengikut Daerah Number of Religious Schools, Teachers and Students by District
Sumber:JabatanPengajianIslam,KementerianHalEhwalUgamaSource : Department of Islamic Studies, Ministry of Religious Affairs
TahunYear 2014 2015 2016 2017 2018
SekolahSchools
160 160 159 159 158
BruneiMuara 99 99 98 98 98Belait 20 20 20 20 19Tutong 29 29 29 29 29Temburong 12 12 12 12 12
GuruTeachers
2,207 2,219 2,243 2,219 2,192
BruneiMuara 1,549 1,562 1,577 1,558 1,541Belait 217 217 217 217 213Tutong 342 344 345 339 332Temburong 99 96 104 105 106
PenuntutStudents
40,167 39,083 37,858 37,518 37,218
BruneiMuara 29,986 29,110 27,999 27,746 27,469Belait 5,054 5,006 4,950 4,913 4,847Tutong 4,266 4,142 4,103 4,081 4,108Temburong 861 825 806 778 794
rrr
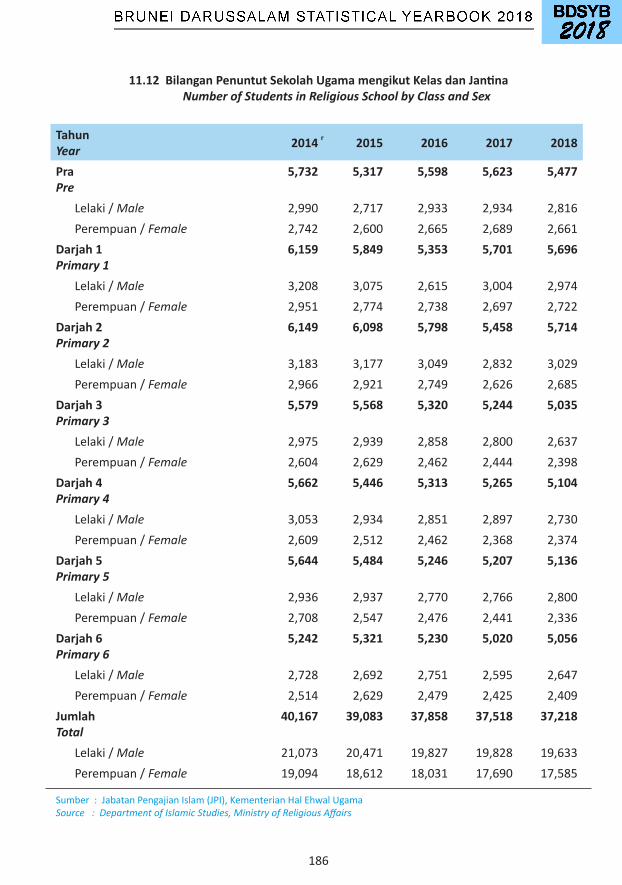
186
11.12 Bilangan Penuntut Sekolah Ugama mengikut Kelas dan Jantina Number of Students in Religious School by Class and Sex
Sumber:JabatanPengajianIslam(JPI),KementerianHalEhwalUgamaSource : Department of Islamic Studies, Ministry of Religious Affairs
TahunYear 2014 2015 2016 2017 2018
PraPre
5,732 5,317 5,598 5,623 5,477
Lelaki/Male 2,990 2,717 2,933 2,934 2,816Perempuan/Female 2,742 2,600 2,665 2,689 2,661
Darjah 1Primary 1
6,159 5,849 5,353 5,701 5,696
Lelaki/Male 3,208 3,075 2,615 3,004 2,974Perempuan/Female 2,951 2,774 2,738 2,697 2,722
Darjah 2Primary 2
6,149 6,098 5,798 5,458 5,714
Lelaki/Male 3,183 3,177 3,049 2,832 3,029Perempuan/Female 2,966 2,921 2,749 2,626 2,685
Darjah 3Primary 3
5,579 5,568 5,320 5,244 5,035
Lelaki/Male 2,975 2,939 2,858 2,800 2,637Perempuan/Female 2,604 2,629 2,462 2,444 2,398
Darjah 4Primary 4
5,662 5,446 5,313 5,265 5,104
Lelaki/Male 3,053 2,934 2,851 2,897 2,730Perempuan/Female 2,609 2,512 2,462 2,368 2,374
Darjah 5Primary 5
5,644 5,484 5,246 5,207 5,136
Lelaki/Male 2,936 2,937 2,770 2,766 2,800Perempuan/Female 2,708 2,547 2,476 2,441 2,336
Darjah 6Primary 6
5,242 5,321 5,230 5,020 5,056
Lelaki/Male 2,728 2,692 2,751 2,595 2,647Perempuan/Female 2,514 2,629 2,479 2,425 2,409
Jumlah Total
40,167 39,083 37,858 37,518 37,218
Lelaki/Male 21,073 20,471 19,827 19,828 19,633Perempuan/Female 19,094 18,612 18,031 17,690 17,585
r

187
11.13 Bilangan Penuntut mengikut Peringkat, Pengambilan Baru, Pendaftaran, Graduan dan Jantina Number of Students by Level, New Intake, Enrolment, Graduates and Sex
Peringkat dan JantinaLevel and Sex
2017 2018Pengambilan
IntakePendaftaran
EnrolmentGraduan
GraduatesPengambilan
IntakePendaftaran
EnrolmentGraduan
Graduates
TEKNIKAL / VOKASIONALTECHNICAL / VOCATIONAL
2,885 4,472 2,848 3,042 5,082 2,243
Lelaki /Male 1,598 2,443 1,540 1,643 2,795 1,136
Perempuan/Female 1,287 2,029 1,308 1,399 2,287 1,107Diploma Kebangsaan Tertinggi Higher National Diploma (HND)
139 237 75 227 425 55
Lelaki/ Male 71 134 33 139 248 21Perempuan/Female 68 103 42 88 177 34
Sijil Tertinggi Kebangsaan Higher National Certificate (HNC)
86 86 - - - 12
Lelaki/ Male 28 28 - - - 7 Perempuan/Female 58 58 - - - 5Sijil Tertinggi Kebangsaan Pendidikan TeknikalHigher National Technical Education (HNTec)
1,323 2,350 1,363 1,299 2,588 845
Lelaki/ Male 697 1,236 724 652 1,350 428
Perempuan/Female 626 1,114 639 647 1,238 417Sijil Kebangsaan Pendidikan Teknikal National Technical Education Certificates
823 1,113 612 950 1,383 616
Lelaki / Male 448 617 312 468 745 297Perempuan/Female 375 496 300 482 638 319
Kelulusan Kemahiran Industri Industrial Skill Qualification (ISQ)
227 249 316 258 281 16
Lelaki / Male 196 215 242 227 246 15Perempuan/Female 31 34 74 31 35 1
Sijil Kemahiran dan Lain-lain Sijil Skill Certificate and Other Certificates
287 437 482 308 405 699
Lelaki / Male 158 213 229 157 206 368Perempuan/Female 129 224 253 151 199 331
Sumber:KementerianPendidikanSource : Ministry of Education
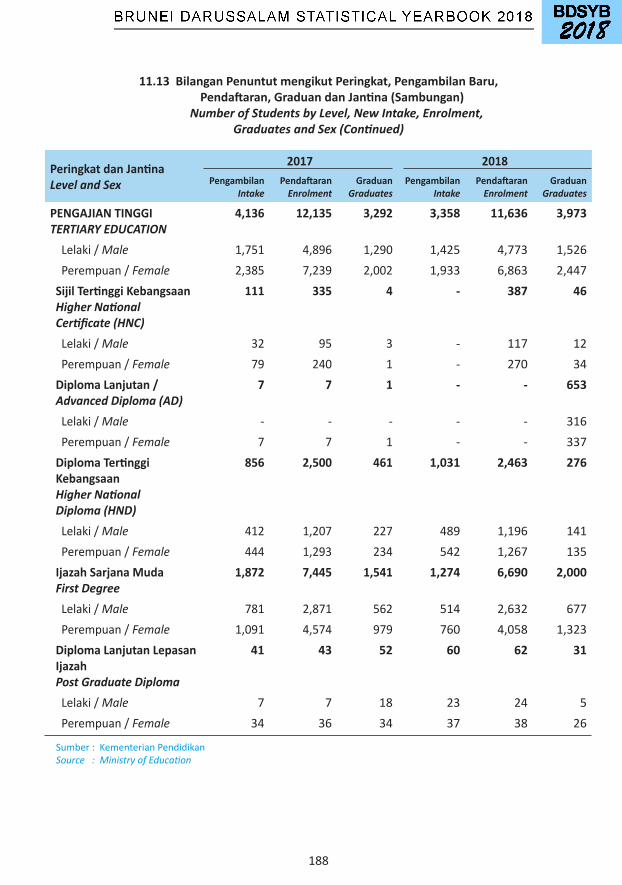
188
Peringkat dan JantinaLevel and Sex
2017 2018Pengambilan
IntakePendaftaran
EnrolmentGraduan
GraduatesPengambilan
IntakePendaftaran
EnrolmentGraduan
Graduates
PENGAJIAN TINGGITERTIARY EDUCATION
4,136 12,135 3,292 3,358 11,636 3,973
Lelaki / Male 1,751 4,896 1,290 1,425 4,773 1,526Perempuan/Female 2,385 7,239 2,002 1,933 6,863 2,447
Sijil Tertinggi Kebangsaan Higher National Certificate (HNC)
111 335 4 - 387 46
Lelaki / Male 32 95 3 - 117 12Perempuan/Female 79 240 1 - 270 34
Diploma Lanjutan /Advanced Diploma (AD)
7 7 1 - - 653
Lelaki / Male - - - - - 316Perempuan/Female 7 7 1 - - 337
Diploma Tertinggi Kebangsaan Higher National Diploma (HND)
856 2,500 461 1,031 2,463 276
Lelaki / Male 412 1,207 227 489 1,196 141Perempuan/Female 444 1,293 234 542 1,267 135
Ijazah Sarjana Muda First Degree
1,872 7,445 1,541 1,274 6,690 2,000
Lelaki / Male 781 2,871 562 514 2,632 677Perempuan/Female 1,091 4,574 979 760 4,058 1,323
Diploma Lanjutan Lepasan Ijazah Post Graduate Diploma
41 43 52 60 62 31
Lelaki / Male 7 7 18 23 24 5Perempuan/Female 34 36 34 37 38 26
11.13 Bilangan Penuntut mengikut Peringkat, Pengambilan Baru, Pendaftaran, Graduan dan Jantina (Sambungan)
Number of Students by Level, New Intake, Enrolment, Graduates and Sex (Continued)
Sumber:KementerianPendidikanSource : Ministry of Education
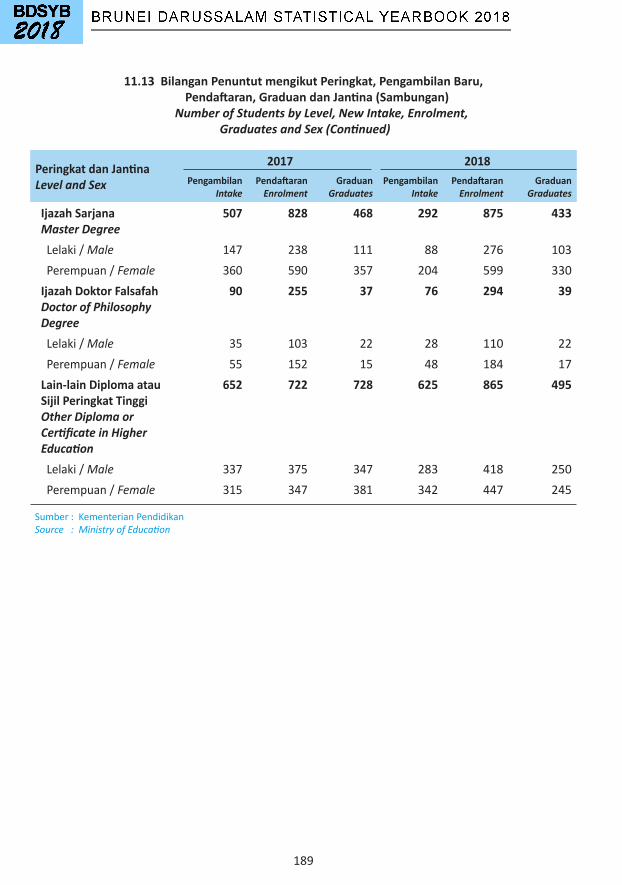
189
Peringkat dan JantinaLevel and Sex
2017 2018Pengambilan
IntakePendaftaran
EnrolmentGraduan
GraduatesPengambilan
IntakePendaftaran
EnrolmentGraduan
Graduates
Ijazah SarjanaMaster Degree
507 828 468 292 875 433
Lelaki / Male 147 238 111 88 276 103Perempuan/Female 360 590 357 204 599 330
Ijazah Doktor FalsafahDoctor of Philosophy Degree
90 255 37 76 294 39
Lelaki / Male 35 103 22 28 110 22Perempuan/Female 55 152 15 48 184 17
Lain-lain Diploma atau Sijil Peringkat Tinggi Other Diploma or Certificate in Higher Education
652 722 728 625 865 495
Lelaki / Male 337 375 347 283 418 250Perempuan/Female 315 347 381 342 447 245
11.13 Bilangan Penuntut mengikut Peringkat, Pengambilan Baru, Pendaftaran, Graduan dan Jantina (Sambungan)
Number of Students by Level, New Intake, Enrolment, Graduates and Sex (Continued)
Sumber:KementerianPendidikanSource : Ministry of Education
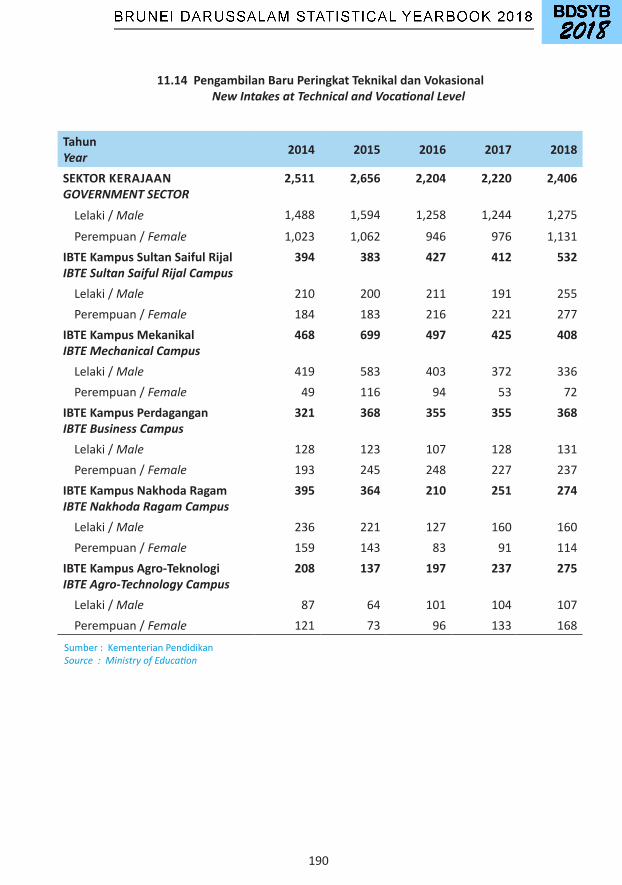
190
TahunYear 2014 2015 2016 2017 2018
SEKTOR KERAJAANGOVERNMENT SECTOR
2,511 2,656 2,204 2,220 2,406
Lelaki/ Male 1,488 1,594 1,258 1,244 1,275
Perempuan/ Female 1,023 1,062 946 976 1,131IBTE Kampus Sultan Saiful Rijal IBTE Sultan Saiful Rijal Campus
394 383 427 412 532
Lelaki/ Male 210 200 211 191 255Perempuan/ Female 184 183 216 221 277
IBTE Kampus Mekanikal IBTE Mechanical Campus
468 699 497 425 408
Lelaki/ Male 419 583 403 372 336Perempuan/ Female 49 116 94 53 72
IBTE Kampus Perdagangan IBTE Business Campus
321 368 355 355 368
Lelaki/ Male 128 123 107 128 131Perempuan/ Female 193 245 248 227 237
IBTE Kampus Nakhoda Ragam IBTE Nakhoda Ragam Campus
395 364 210 251 274
Lelaki/ Male 236 221 127 160 160Perempuan/ Female 159 143 83 91 114
IBTE Kampus Agro-Teknologi IBTE Agro-Technology Campus
208 137 197 237 275
Lelaki/ Male 87 64 101 104 107Perempuan/ Female 121 73 96 133 168
11.14 Pengambilan Baru Peringkat Teknikal dan Vokasional New Intakes at Technical and Vocational Level
Sumber:KementerianPendidikanSource : Ministry of Education

191
TahunYear 2014 2015 2016 2017 2018
IBTE Kampus Sultan Bolkiah IBTE Sultan Bolkiah Campus
331 348 255 301 248
Lelaki/ Male 175 196 136 157 108Perempuan/ Female 156 152 119 144 140
IBTE Kampus Jefri Bolkiah IBTE Jefri Bolkiah Campus
268 182 155 127 183
Lelaki/ Male 168 124 117 77 129Perempuan/ Female 100 58 38 50 54
Pusat Pembangunan BeliaYouth Development Centre
126 148 87 112 93
Lelaki/ Male 65 70 49 55 43Perempuan/ Female 61 78 38 57 50
Pusat Latihan Kesenian dan Pertukangan Tangan BruneiBrunei Arts and Handicrafts Training Centre
- 27 21 - 25
Lelaki/ Male - 13 7 - 6Perempuan/ Female - 14 14 - 19
SEKTOR SWASTAPRIVATE SECTOR
1,496 1,197 745 665 636
Lelaki/ Male 800 597 371 354 368Perempuan/ Female 696 600 374 311 268
JUMLAH KESELURUHANOVERALL TOTAL
4,007 3,853 2,949 2,885 3,042
Lelaki/ Male 2,288 2,191 1,629 1,598 1,643
Perempuan/ Female 1,719 1,662 1,320 1,267 1,399
11.14 Pengambilan Baru Peringkat Teknikal dan Vokasional (Sambungan) New Intakes at Technical and Vocational Level (Continued)
Sumber:KementerianPendidikanSource : Ministry of Education

192
11.15 Pendaftaran Penuntut Peringkat Teknikal dan Vokasional Student Enrolments at Technical and Vocational Level
TahunYear 2014 2015 2016 2017 2018
SEKTOR KERAJAANGOVERNMENT SECTOR
3,667 4,041 3,707 3,666 4,092
Lelaki/ Male 2,120 2,373 2,118 2,035 2,232
Perempuan/ Female 1,547 1,668 1,589 1,631 1,860IBTE Kampus Sultan Saiful Rijal IBTE Sultan Saiful Rijal Campus
637 690 766 812 945
Lelaki/ Male 341 362 399 398 465Perempuan/ Female 296 328 367 414 480
IBTE Kampus Mekanikal IBTE Mechanical Campus
524 796 715 570 578
Lelaki/ Male 470 671 578 489 486Perempuan/ Female 54 125 137 81 92
IBTE Kampus Perdagangan IBTE Business Campus
433 532 531 560 560
Lelaki/ Male 163 193 164 191 195Perempuan/ Female 270 339 367 369 365
IBTE Kampus Nakhoda Ragam IBTE Nakhoda Ragam Campus
570 605 380 422 565
Lelaki/ Male 346 376 242 259 357Perempuan/ Female 224 229 138 163 208
IBTE Kampus Agro-Teknologi IBTE Agro-Technology Campus
253 259 273 356 443
Lelaki/ Male 97 116 127 162 177Perempuan/ Female 156 143 146 194 266
Sumber:KementerianPendidikanSource : Ministry of Education
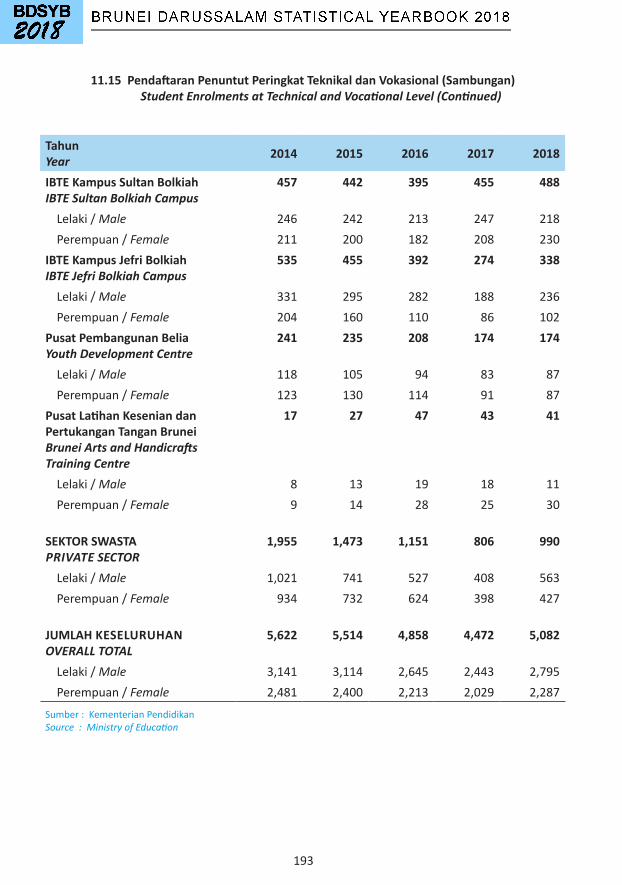
193
TahunYear 2014 2015 2016 2017 2018
IBTE Kampus Sultan Bolkiah IBTE Sultan Bolkiah Campus
457 442 395 455 488
Lelaki/ Male 246 242 213 247 218Perempuan/ Female 211 200 182 208 230
IBTE Kampus Jefri Bolkiah IBTE Jefri Bolkiah Campus
535 455 392 274 338
Lelaki/ Male 331 295 282 188 236Perempuan/ Female 204 160 110 86 102
Pusat Pembangunan Belia Youth Development Centre
241 235 208 174 174
Lelaki/ Male 118 105 94 83 87Perempuan/ Female 123 130 114 91 87
Pusat Latihan Kesenian dan Pertukangan Tangan BruneiBrunei Arts and Handicrafts Training Centre
17 27 47 43 41
Lelaki/ Male 8 13 19 18 11Perempuan/ Female 9 14 28 25 30
SEKTOR SWASTAPRIVATE SECTOR
1,955 1,473 1,151 806 990
Lelaki/ Male 1,021 741 527 408 563Perempuan/ Female 934 732 624 398 427
JUMLAH KESELURUHANOVERALL TOTAL
5,622 5,514 4,858 4,472 5,082
Lelaki/ Male 3,141 3,114 2,645 2,443 2,795Perempuan/ Female 2,481 2,400 2,213 2,029 2,287
11.15 Pendaftaran Penuntut Peringkat Teknikal dan Vokasional (Sambungan) Student Enrolments at Technical and Vocational Level (Continued)
Sumber:KementerianPendidikanSource : Ministry of Education
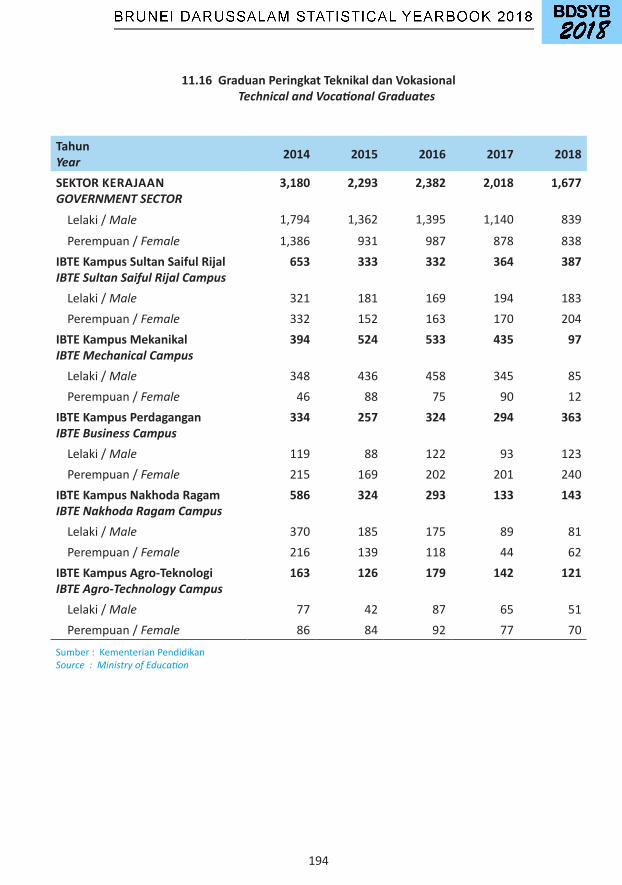
194
11.16 Graduan Peringkat Teknikal dan Vokasional Technical and Vocational Graduates
TahunYear 2014 2015 2016 2017 2018
SEKTOR KERAJAANGOVERNMENT SECTOR
3,180 2,293 2,382 2,018 1,677
Lelaki/ Male 1,794 1,362 1,395 1,140 839
Perempuan/ Female 1,386 931 987 878 838IBTE Kampus Sultan Saiful Rijal IBTE Sultan Saiful Rijal Campus
653 333 332 364 387
Lelaki/ Male 321 181 169 194 183Perempuan/ Female 332 152 163 170 204
IBTE Kampus Mekanikal IBTE Mechanical Campus
394 524 533 435 97
Lelaki/ Male 348 436 458 345 85Perempuan/ Female 46 88 75 90 12
IBTE Kampus Perdagangan IBTE Business Campus
334 257 324 294 363
Lelaki/ Male 119 88 122 93 123Perempuan/ Female 215 169 202 201 240
IBTE Kampus Nakhoda Ragam IBTE Nakhoda Ragam Campus
586 324 293 133 143
Lelaki/ Male 370 185 175 89 81Perempuan/ Female 216 139 118 44 62
IBTE Kampus Agro-Teknologi IBTE Agro-Technology Campus
163 126 179 142 121
Lelaki/ Male 77 42 87 65 51Perempuan/ Female 86 84 92 77 70
Sumber:KementerianPendidikanSource : Ministry of Education
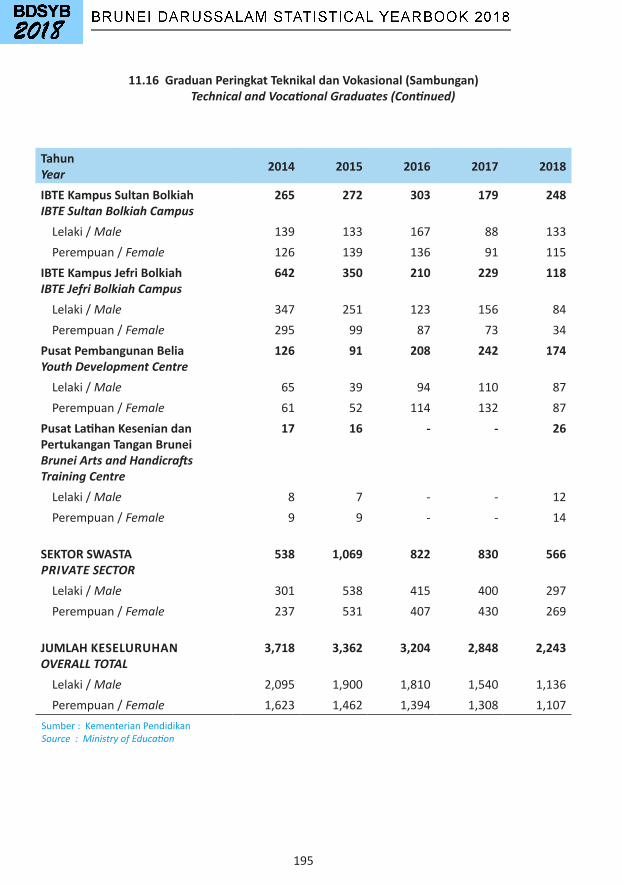
195
TahunYear 2014 2015 2016 2017 2018
IBTE Kampus Sultan Bolkiah IBTE Sultan Bolkiah Campus
265 272 303 179 248
Lelaki/ Male 139 133 167 88 133Perempuan/ Female 126 139 136 91 115
IBTE Kampus Jefri Bolkiah IBTE Jefri Bolkiah Campus
642 350 210 229 118
Lelaki/ Male 347 251 123 156 84Perempuan/ Female 295 99 87 73 34
Pusat Pembangunan Belia Youth Development Centre
126 91 208 242 174
Lelaki/ Male 65 39 94 110 87Perempuan/ Female 61 52 114 132 87
Pusat Latihan Kesenian dan Pertukangan Tangan BruneiBrunei Arts and Handicrafts Training Centre
17 16 - - 26
Lelaki/ Male 8 7 - - 12Perempuan/ Female 9 9 - - 14
SEKTOR SWASTAPRIVATE SECTOR
538 1,069 822 830 566
Lelaki/ Male 301 538 415 400 297Perempuan/ Female 237 531 407 430 269
JUMLAH KESELURUHANOVERALL TOTAL
3,718 3,362 3,204 2,848 2,243
Lelaki/ Male 2,095 1,900 1,810 1,540 1,136Perempuan/ Female 1,623 1,462 1,394 1,308 1,107
11.16 Graduan Peringkat Teknikal dan Vokasional (Sambungan) Technical and Vocational Graduates (Continued)
Sumber:KementerianPendidikanSource : Ministry of Education
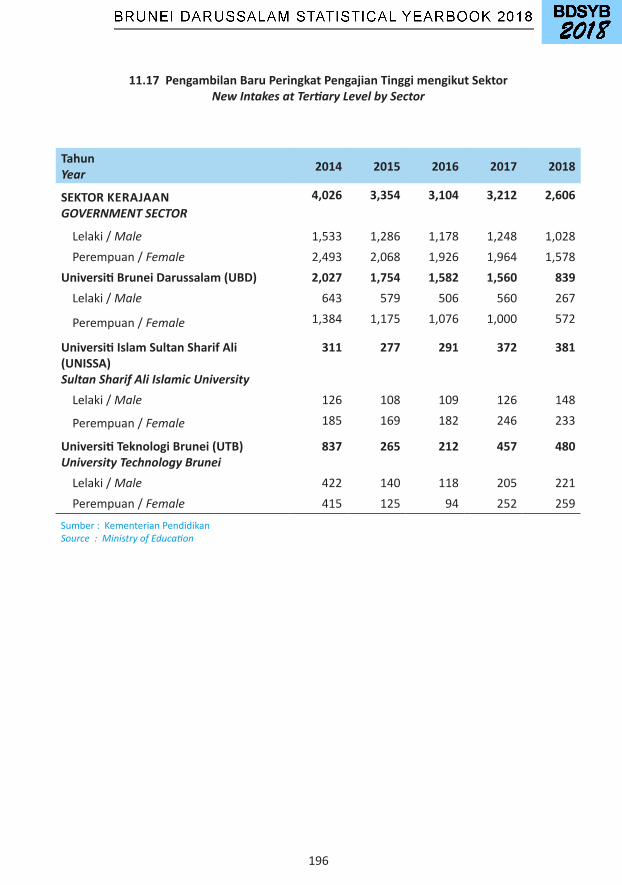
196
TahunYear 2014 2015 2016 2017 2018
SEKTOR KERAJAANGOVERNMENT SECTOR
4,026 3,354 3,104 3,212 2,606
Lelaki/ Male 1,533 1,286 1,178 1,248 1,028Perempuan/ Female 2,493 2,068 1,926 1,964 1,578
Universiti Brunei Darussalam (UBD) 2,027 1,754 1,582 1,560 839Lelaki/ Male 643 579 506 560 267
Perempuan/ Female 1,384 1,175 1,076 1,000 572
Universiti Islam Sultan Sharif Ali (UNISSA)Sultan Sharif Ali Islamic University
311 277 291 372 381
Lelaki/ Male 126 108 109 126 148
Perempuan/ Female 185 169 182 246 233
Universiti Teknologi Brunei (UTB)University Technology Brunei
837 265 212 457 480
Lelaki/ Male 422 140 118 205 221Perempuan/ Female 415 125 94 252 259
11.17 Pengambilan Baru Peringkat Pengajian Tinggi mengikut SektorNew Intakes at Tertiary Level by Sector
Sumber:KementerianPendidikanSource : Ministry of Education
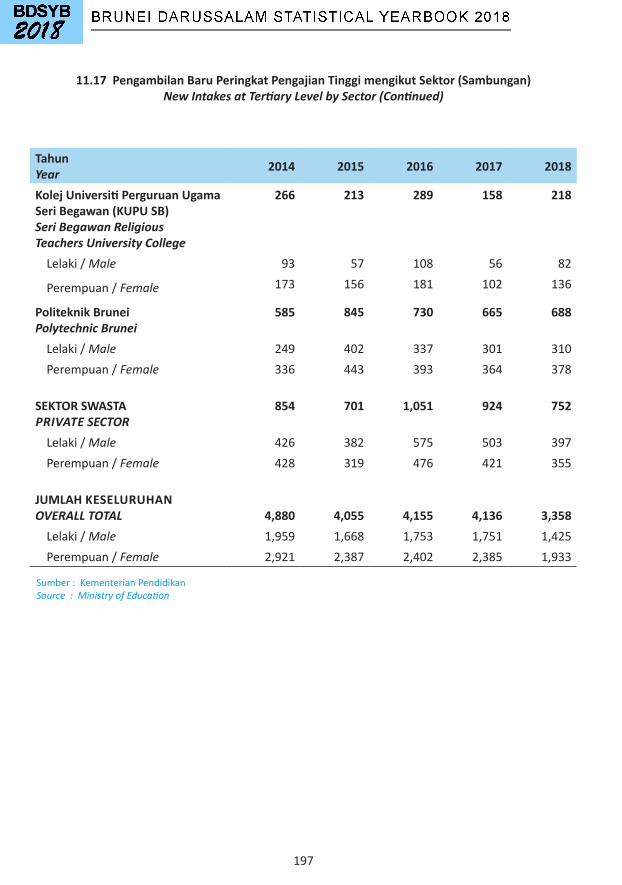
197
TahunYear 2014 2015 2016 2017 2018
Kolej Universiti Perguruan UgamaSeri Begawan (KUPU SB)Seri Begawan Religious Teachers University College
266 213 289 158 218
Lelaki/ Male 93 57 108 56 82
Perempuan/ Female 173 156 181 102 136
Politeknik BruneiPolytechnic Brunei
585 845 730 665 688
Lelaki/ Male 249 402 337 301 310Perempuan/ Female 336 443 393 364 378
SEKTOR SWASTAPRIVATE SECTOR
854 701 1,051 924 752
Lelaki/ Male 426 382 575 503 397Perempuan/ Female 428 319 476 421 355
JUMLAH KESELURUHANOVERALL TOTAL 4,880 4,055 4,155 4,136 3,358Lelaki/ Male 1,959 1,668 1,753 1,751 1,425Perempuan/ Female 2,921 2,387 2,402 2,385 1,933
11.17 Pengambilan Baru Peringkat Pengajian Tinggi mengikut Sektor (Sambungan)New Intakes at Tertiary Level by Sector (Continued)
Sumber:KementerianPendidikanSource : Ministry of Education

198
TahunYear 2014 2015 2016 2017 2018
SEKTOR KERAJAANGOVERNMENT SECTOR
10,292 10,191 10,211 10,351 9,876
Lelaki/ Male 3,850 3,828 3,902 3,967 3,892
Perempuan/ Female 6,442 6,363 6,309 6,384 5,984
Universiti Brunei Darussalam (UBD) 5,148 5,292 5,045 4,984 4,368Lelaki/ Male 1,615 1,693 1,617 1,675 1,503
Perempuan/ Female 3,533 3,599 3,428 3,309 2,865
Universiti Islam Sultan Sharif Ali (UNISSA)Sultan Sharif Ali Islamic University
765 787 876 1,074 1,269
Lelaki/ Male 298 295 310 384 460
Perempuan/ Female 467 492 566 690 809
Universiti Teknologi Brunei (UTB)University Technology Brunei
2,179 2,046 1,855 1,425 1,389
Lelaki/ Male 1,073 989 921 673 681Perempuan/ Female 1,106 1,057 934 752 708
11.18 Pendaftaran Penuntut Peringkat Pengajian Tinggi mengikut SektorStudent Enrolments at Tertiary Level by Sector
Sumber:KementerianPendidikanSource : Ministry of Education

199
TahunYear 2014 2015 2016 2017 2018
Kolej Universiti Perguruan Ugama Seri Begawan (KUPU SB)Seri Begawan ReligiousTeachers University College
820 774 815 749 773
Lelaki/ Male 284 271 292 262 276Perempuan/ Female 536 503 523 487 497
Politeknik BruneiPolytechnic Brunei
1,380 1,292 1,620 2,119 2,077
Lelaki/ Male 580 580 762 973 972Perempuan/ Female 800 712 858 1,146 1,105
SEKTOR SWASTAPRIVATE SECTOR
2,413 2,849 1,816 1,784 1,760
Lelaki/ Male 1,190 1,425 951 929 881Perempuan/ Female 1,223 1,424 865 855 879
JUMLAH KESELURUHANOVERALL TOTAL
12,705 13,040 12,027 12,135 11,636
Lelaki/ Male 5,040 5,253 4,853 4,896 4,773Perempuan/ Female 7,665 7,787 7,174 7,239 6,863
11.18 Pendaftaran Penuntut Peringkat Pengajian Tinggi mengikut Sektor (Sambungan)Student Enrolments at Tertiary Level by Sector (Continued)
Sumber:KementerianPendidikanSource : Ministry of Education
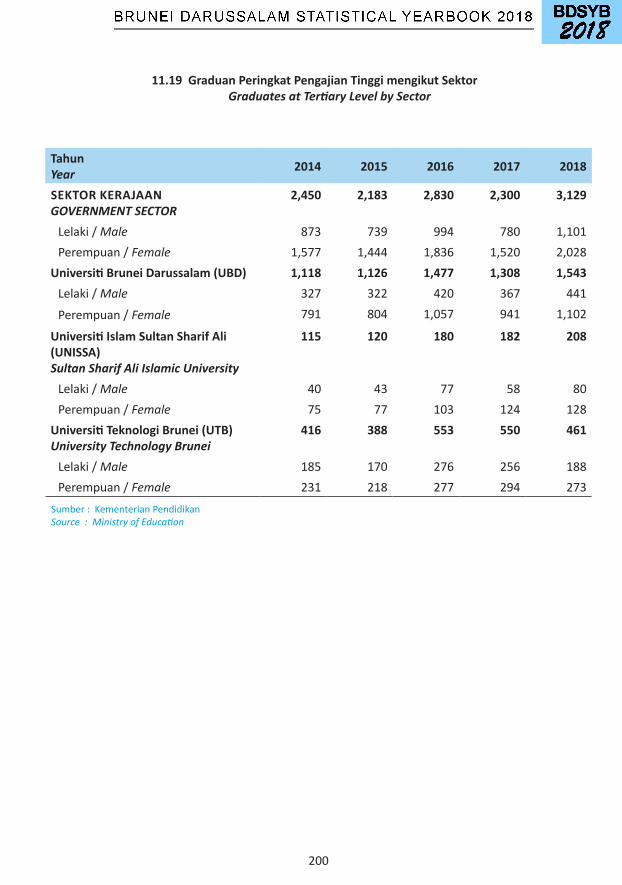
200
11.19 Graduan Peringkat Pengajian Tinggi mengikut Sektor Graduates at Tertiary Level by Sector
TahunYear 2014 2015 2016 2017 2018
SEKTOR KERAJAANGOVERNMENT SECTOR
2,450 2,183 2,830 2,300 3,129
Lelaki/Male 873 739 994 780 1,101Perempuan/Female 1,577 1,444 1,836 1,520 2,028
Universiti Brunei Darussalam (UBD) 1,118 1,126 1,477 1,308 1,543Lelaki/Male 327 322 420 367 441
Perempuan/Female 791 804 1,057 941 1,102
Universiti Islam Sultan Sharif Ali (UNISSA)Sultan Sharif Ali Islamic University
115 120 180 182 208
Lelaki/Male 40 43 77 58 80Perempuan/Female 75 77 103 124 128
Universiti Teknologi Brunei (UTB)University Technology Brunei
416 388 553 550 461
Lelaki/Male 185 170 276 256 188Perempuan/Female 231 218 277 294 273
Sumber:KementerianPendidikanSource : Ministry of Education
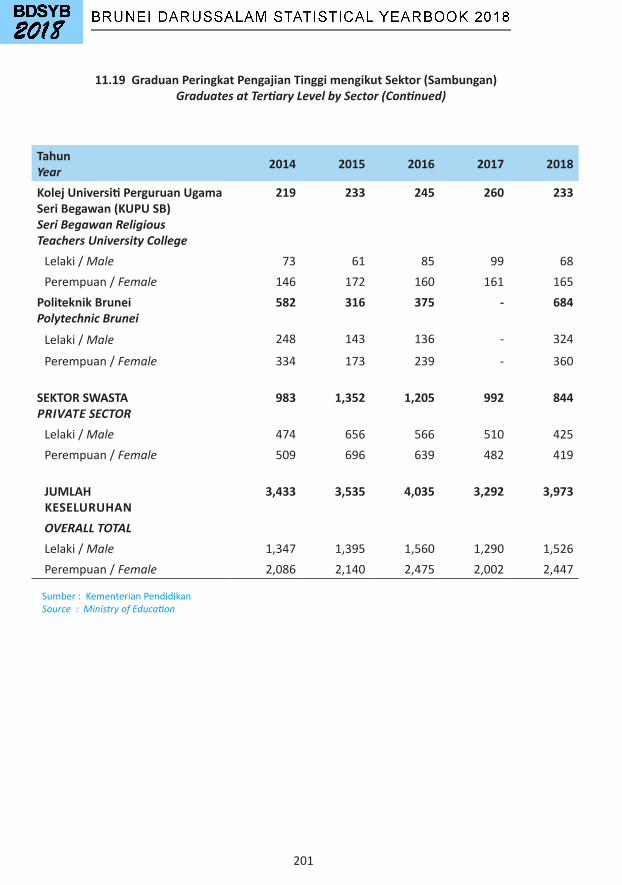
201
11.19 Graduan Peringkat Pengajian Tinggi mengikut Sektor (Sambungan) Graduates at Tertiary Level by Sector (Continued)
TahunYear 2014 2015 2016 2017 2018
Kolej Universiti Perguruan Ugama Seri Begawan (KUPU SB)Seri Begawan Religious Teachers University College
219 233 245 260 233
Lelaki/Male 73 61 85 99 68Perempuan/Female 146 172 160 161 165
Politeknik BruneiPolytechnic Brunei
582 316 375 - 684
Lelaki/Male 248 143 136 - 324
Perempuan/Female 334 173 239 - 360
SEKTOR SWASTAPRIVATE SECTOR
983 1,352 1,205 992 844
Lelaki/Male 474 656 566 510 425Perempuan/Female 509 696 639 482 419
JUMLAH KESELURUHAN
3,433 3,535 4,035 3,292 3,973
OVERALL TOTALLelaki/Male 1,347 1,395 1,560 1,290 1,526Perempuan/Female 2,086 2,140 2,475 2,002 2,447
Sumber:KementerianPendidikanSource : Ministry of Education
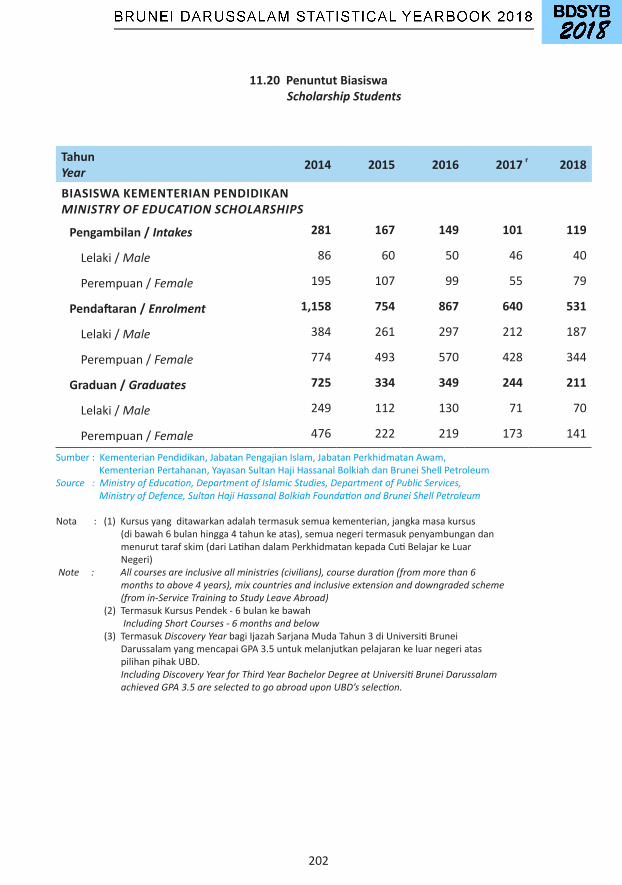
202
11.20 Penuntut Biasiswa Scholarship Students
TahunYear 2014 2015 2016 2017 2018
BIASISWA KEMENTERIAN PENDIDIKANMINISTRY OF EDUCATION SCHOLARSHIPS
Pengambilan / Intakes 281 167 149 101 119
Lelaki/Male 86 60 50 46 40
Perempuan/Female 195 107 99 55 79
Pendaftaran / Enrolment 1,158 754 867 640 531
Lelaki/Male 384 261 297 212 187
Perempuan/Female 774 493 570 428 344
Graduan / Graduates 725 334 349 244 211
Lelaki/Male 249 112 130 71 70
Perempuan/Female 476 222 219 173 141
Sumber:KementerianPendidikan,JabatanPengajianIslam,JabatanPerkhidmatanAwam,KementerianPertahanan,YayasanSultanHajiHassanalBolkiahdanBruneiShellPetroleumSource : Ministry of Education, Department of Islamic Studies, Department of Public Services, Ministry of Defence, Sultan Haji Hassanal Bolkiah Foundation and Brunei Shell Petroleum
Nota: (1)Kursusyangditawarkanadalahtermasuksemuakementerian,jangkamasakursus(dibawah6bulanhingga4tahunkeatas),semuanegeritermasukpenyambungandanmenuruttarafskim(dariLatihandalamPerkhidmatankepadaCutiBelajarkeLuarNegeri) Note : All courses are inclusive all ministries (civilians), course duration (from more than 6 months to above 4 years), mix countries and inclusive extension and downgraded scheme (from in-Service Training to Study Leave Abroad)(2)TermasukKursusPendek-6bulankebawah Including Short Courses - 6 months and below(3)TermasukDiscovery YearbagiIjazahSarjanaMudaTahun3diUniversitiBruneiDarussalamyangmencapaiGPA3.5untukmelanjutkanpelajarankeluarnegeriataspilihanpihakUBD. Including Discovery Year for Third Year Bachelor Degree at Universiti Brunei Darussalam achieved GPA 3.5 are selected to go abroad upon UBD’s selection.
r
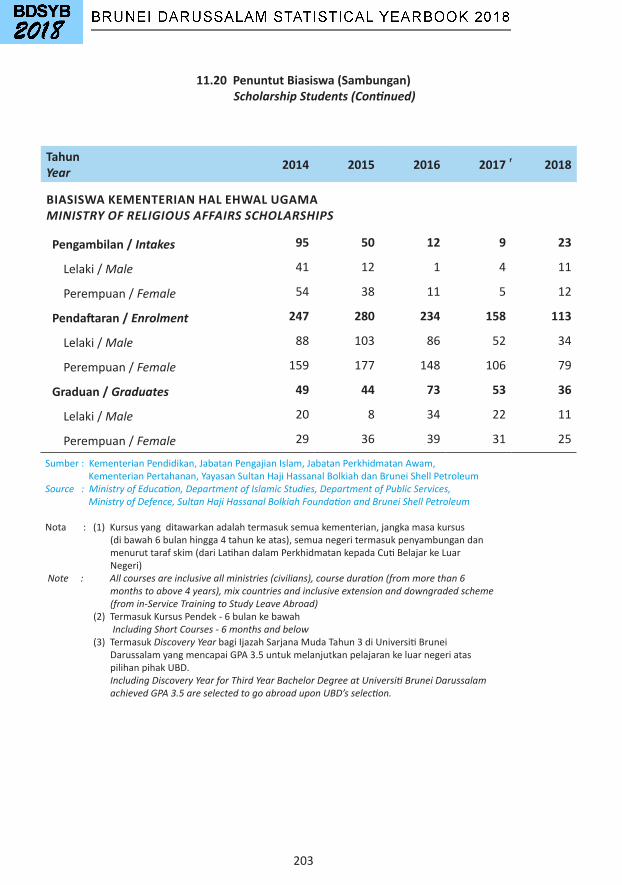
203
11.20 Penuntut Biasiswa (Sambungan) Scholarship Students (Continued)
TahunYear 2014 2015 2016 2017 2018
BIASISWA KEMENTERIAN HAL EHWAL UGAMAMINISTRY OF RELIGIOUS AFFAIRS SCHOLARSHIPS
Pengambilan / Intakes 95 50 12 9 23
Lelaki/Male 41 12 1 4 11
Perempuan/Female 54 38 11 5 12
Pendaftaran / Enrolment 247 280 234 158 113
Lelaki/Male 88 103 86 52 34
Perempuan/Female 159 177 148 106 79
Graduan / Graduates 49 44 73 53 36
Lelaki/Male 20 8 34 22 11
Perempuan/Female 29 36 39 31 25
Sumber:KementerianPendidikan,JabatanPengajianIslam,JabatanPerkhidmatanAwam,KementerianPertahanan,YayasanSultanHajiHassanalBolkiahdanBruneiShellPetroleumSource : Ministry of Education, Department of Islamic Studies, Department of Public Services, Ministry of Defence, Sultan Haji Hassanal Bolkiah Foundation and Brunei Shell Petroleum
Nota: (1)Kursusyangditawarkanadalahtermasuksemuakementerian,jangkamasakursus(dibawah6bulanhingga4tahunkeatas),semuanegeritermasukpenyambungandanmenuruttarafskim(dariLatihandalamPerkhidmatankepadaCutiBelajarkeLuarNegeri) Note : All courses are inclusive all ministries (civilians), course duration (from more than 6 months to above 4 years), mix countries and inclusive extension and downgraded scheme (from in-Service Training to Study Leave Abroad)(2)TermasukKursusPendek-6bulankebawah Including Short Courses - 6 months and below(3)TermasukDiscovery YearbagiIjazahSarjanaMudaTahun3diUniversitiBruneiDarussalamyangmencapaiGPA3.5untukmelanjutkanpelajarankeluarnegeriataspilihanpihakUBD. Including Discovery Year for Third Year Bachelor Degree at Universiti Brunei Darussalam achieved GPA 3.5 are selected to go abroad upon UBD’s selection.
r

204
11.20 Penuntut Biasiswa (Sambungan) Scholarship Students (Continued)
TahunYear 2014 2015 2016 2017 2018
BIASISWA LATIHAN DALAM PERKHIDMATAN, JABATAN PERKHIDMATAN AWAMIN-SERVICE TRAINING SCHOLARSHIPS, DEPARTMENT OF PUBLIC SERVICES Pengambilan / Intakes 98 147 55 34 27Lelaki/Male 55 66 18 19 13Perempuan/Female 43 81 37 15 14
Pendaftaran / Enrolment 97 146 162 60 49
Lelaki/Male 54 66 45 17 26
Perempuan/Female 43 80 117 43 23 Graduan / Graduates 23 51 44 43 46Lelaki/Male 16 27 10 9 26Perempuan/Female 7 24 34 34 20
Sumber:KementerianPendidikan,JabatanPengajianIslam,JabatanPerkhidmatanAwam,KementerianPertahanan,YayasanSultanHajiHassanalBolkiahdanBruneiShellPetroleumSource : Ministry of Education, Department of Islamic Studies, Department of Public Services, Ministry of Defence, Sultan Haji Hassanal Bolkiah Foundation and Brunei Shell Petroleum
Nota: (1)Kursusyangditawarkanadalahtermasuksemuakementerian,jangkamasakursus(dibawah6bulanhingga4tahunkeatas),semuanegeritermasukpenyambungandanmenuruttarafskim(dariLatihandalamPerkhidmatankepadaCutiBelajarkeLuarNegeri) Note : All courses are inclusive all ministries (civilians), course duration (from more than 6 months to above 4 years), mix countries and inclusive extension and downgraded scheme (from in-Service Training to Study Leave Abroad)(2)TermasukKursusPendek-6bulankebawah Including Short Courses - 6 months and below(3)TermasukDiscovery YearbagiIjazahSarjanaMudaTahun3diUniversitiBruneiDarussalamyangmencapaiGPA3.5untukmelanjutkanpelajarankeluarnegeriataspilihanpihakUBD. Including Discovery Year for Third Year Bachelor Degree at Universiti Brunei Darussalam achieved GPA 3.5 are selected to go abroad upon UBD’s selection.
r
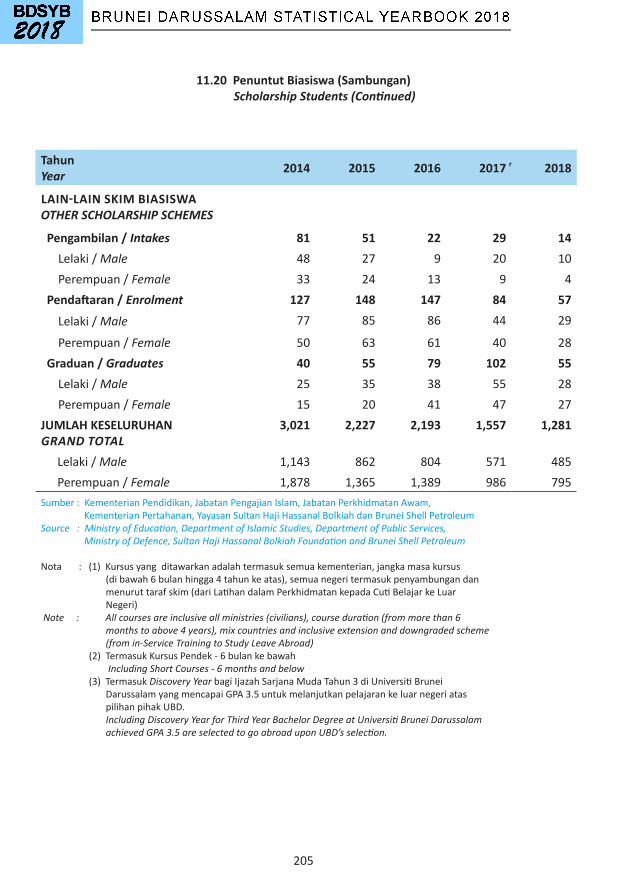
205
11.20 Penuntut Biasiswa (Sambungan) Scholarship Students (Continued)
TahunYear 2014 2015 2016 2017 2018
LAIN-LAIN SKIM BIASISWAOTHER SCHOLARSHIP SCHEMES
Pengambilan / Intakes 81 51 22 29 14Lelaki/Male 48 27 9 20 10Perempuan/Female 33 24 13 9 4
Pendaftaran / Enrolment 127 148 147 84 57
Lelaki/Male 77 85 86 44 29
Perempuan/Female 50 63 61 40 28 Graduan / Graduates 40 55 79 102 55Lelaki/Male 25 35 38 55 28Perempuan/Female 15 20 41 47 27
JUMLAH KESELURUHANGRAND TOTAL
3,021 2,227 2,193 1,557 1,281
Lelaki/Male 1,143 862 804 571 485Perempuan/Female 1,878 1,365 1,389 986 795
Sumber:KementerianPendidikan,JabatanPengajianIslam,JabatanPerkhidmatanAwam,KementerianPertahanan,YayasanSultanHajiHassanalBolkiahdanBruneiShellPetroleumSource : Ministry of Education, Department of Islamic Studies, Department of Public Services, Ministry of Defence, Sultan Haji Hassanal Bolkiah Foundation and Brunei Shell Petroleum
Nota: (1)Kursusyangditawarkanadalahtermasuksemuakementerian,jangkamasakursus(dibawah6bulanhingga4tahunkeatas),semuanegeritermasukpenyambungandanmenuruttarafskim(dariLatihandalamPerkhidmatankepadaCutiBelajarkeLuarNegeri) Note : All courses are inclusive all ministries (civilians), course duration (from more than 6 months to above 4 years), mix countries and inclusive extension and downgraded scheme (from in-Service Training to Study Leave Abroad)(2)TermasukKursusPendek-6bulankebawah Including Short Courses - 6 months and below(3)TermasukDiscovery YearbagiIjazahSarjanaMudaTahun3diUniversitiBruneiDarussalamyangmencapaiGPA3.5untukmelanjutkanpelajarankeluarnegeriataspilihanpihakUBD. Including Discovery Year for Third Year Bachelor Degree at Universiti Brunei Darussalam achieved GPA 3.5 are selected to go abroad upon UBD’s selection.
r
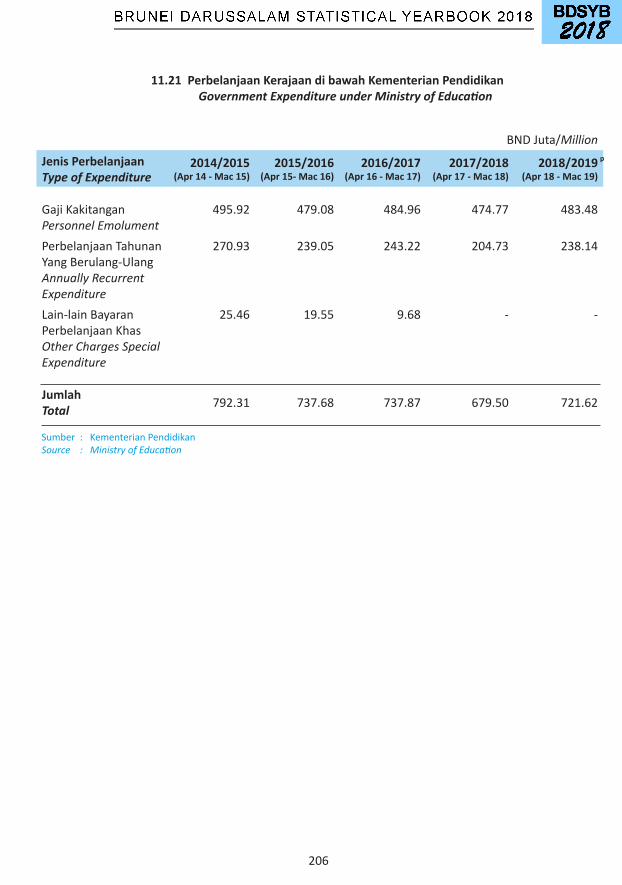
206
11.21 Perbelanjaan Kerajaan di bawah Kementerian Pendidikan Government Expenditure under Ministry of Education
BNDJuta/Million
Sumber:KementerianPendidikanSource : Ministry of Education
Jenis PerbelanjaanType of Expenditure
2014/2015(Apr 14 - Mac 15)
2015/2016(Apr 15- Mac 16)
2016/2017(Apr 16 - Mac 17)
2017/2018(Apr 17 - Mac 18)
2018/2019(Apr 18 - Mac 19)
GajiKakitanganPersonnel Emolument
495.92 479.08 484.96 474.77 483.48
PerbelanjaanTahunanYangBerulang-UlangAnnually Recurrent Expenditure
270.93 239.05 243.22 204.73 238.14
Lain-lainBayaranPerbelanjaanKhasOther Charges Special Expenditure
25.46 19.55 9.68 - -
Jumlah Total 792.31 737.68 737.87 679.50 721.62
p

207
11.22 Bilangan Calon Menduduki dan Lulus Peperiksaan-Peperiksaan Awam Number of Candidates Sitting and Passing Public Examinations
Sumber:JabatanPeperiksaan,KementerianPendidikanSource : Examination Department, Ministry of Education
PeperiksaanExamination
2015 2016
Calon
Candidates
Lulus
Passes
Peratus Lulus
Per cent of Passes
Calon
Candidates
Lulus
Passes
Peratus Lulus
Per cent of Passes
Penilaian Sekolah Rendah (PSR)
6,453 5,576 86.41 6,541 5,607 85.72
Primary Certificate of EducationLelaki/Male 3,263 2,710 42.00 3,352 2,731 41.75Perempuan/Female 3,190 2,866 44.41 3,189 2,876 43.97
Brunei - Cambridge G.C.E. Peringkat 'O' (Lulus sekurang-kurangnya 3 ‘O’)
7,672 3,708 48.33 8,030 3,826 47.65
Brunei - Cambridge G.C.E. ‘O’ Level(Passing at least 3’O’)Lelaki/Male 3,875 1,560 20.33 4,130 1,640 20.42Perempuan/Female 3,797 2,148 28.00 3,900 2,186 27.22
Brunei - Cambridge G.C.E. Peringkat 'A' (Lulus sekurang-kurangnya 1 ‘A’)
2,421 2,131 88.02 2,049 1,857 90.63
Brunei - Cambridge G.C.E. ‘A’ Level (Passing at least 1 ‘A’)Lelaki/Male 997 868 35.85 855 776 37.87Perempuan/Female 1,424 1,263 52.17 1,194 1,081 52.76
r
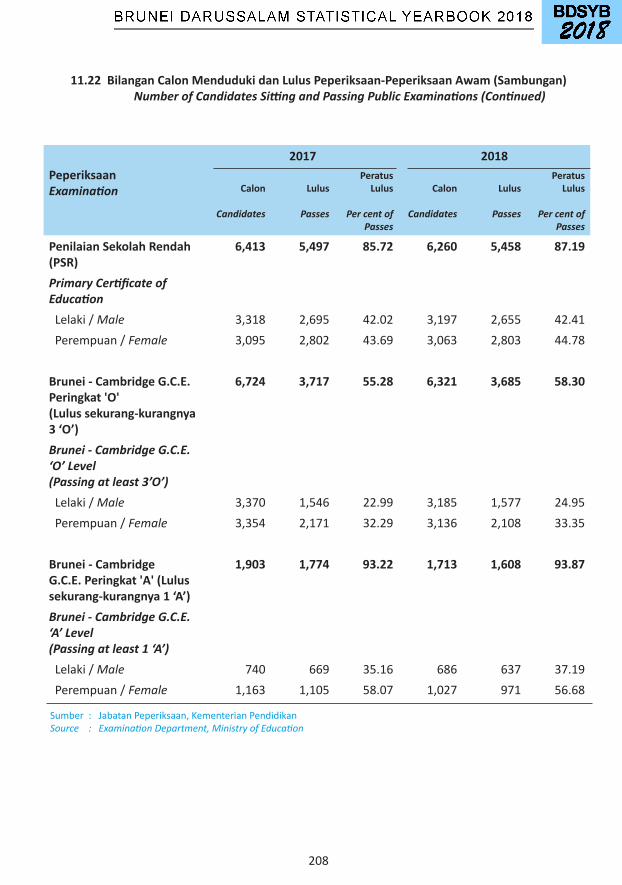
208
11.22 Bilangan Calon Menduduki dan Lulus Peperiksaan-Peperiksaan Awam (Sambungan) Number of Candidates Sitting and Passing Public Examinations (Continued)
PeperiksaanExamination
2017 2018
Calon
Candidates
Lulus
Passes
Peratus Lulus
Per cent of Passes
Calon
Candidates
Lulus
Passes
Peratus Lulus
Per cent of Passes
Penilaian Sekolah Rendah (PSR)
6,413 5,497 85.72 6,260 5,458 87.19
Primary Certificate of EducationLelaki/Male 3,318 2,695 42.02 3,197 2,655 42.41Perempuan/Female 3,095 2,802 43.69 3,063 2,803 44.78
Brunei - Cambridge G.C.E. Peringkat 'O' (Lulus sekurang-kurangnya 3 ‘O’)
6,724 3,717 55.28 6,321 3,685 58.30
Brunei - Cambridge G.C.E. ‘O’ Level(Passing at least 3’O’)Lelaki/Male 3,370 1,546 22.99 3,185 1,577 24.95Perempuan/Female 3,354 2,171 32.29 3,136 2,108 33.35
Brunei - Cambridge G.C.E. Peringkat 'A' (Lulus sekurang-kurangnya 1 ‘A’)
1,903 1,774 93.22 1,713 1,608 93.87
Brunei - Cambridge G.C.E. ‘A’ Level (Passing at least 1 ‘A’)Lelaki/Male 740 669 35.16 686 637 37.19Perempuan/Female 1,163 1,105 58.07 1,027 971 56.68
Sumber:JabatanPeperiksaan,KementerianPendidikanSource : Examination Department, Ministry of Education

209
11.22 Bilangan Calon Menduduki dan Lulus Peperiksaan-Peperiksaan Awam (Sambungan) Number of Candidates Sitting and Passing Public Examinations (Continued)
Sumber:JabatanPengajianIslam(JPI),KementerianHalEhwalUgamaSource : Department of Islamic Studies, Ministry of Religious Affairs
PeperiksaanExamination
2015 2016
Calon
Candidates
Lulus
Passes
Peratus Lulus
Per cent of Passes
Calon
Candidates
Lulus
Passes
Peratus Lulus
Per cent of Passes
Sijil Sekolah-Sekolah Rendah Ugama(SSSRU Darjah VI)
5,225 4,862 93.05 5,108 4,812 94.21
Lelaki/Male 2,621 2,345 44.88 2,667 2,460 48.16Perempuan/Female 2,604 2,517 48.17 2,441 2,352 46.05
Sijil Pelajaran Ugama Brunei (SPUB)
378 363 96.03 422 403 95.50
Lelaki/Male 163 156 41.27 188 177 41.94Perempuan/Female 215 207 54.76 234 226 53.55
Sijil Tinggi Pelajaran Ugama Brunei (STPUB)
190 177 93.16 161 156 96.89
Lelaki/Male 88 79 41.58 50 47 29.19Perempuan/Female 102 98 51.58 111 109 67.70
r
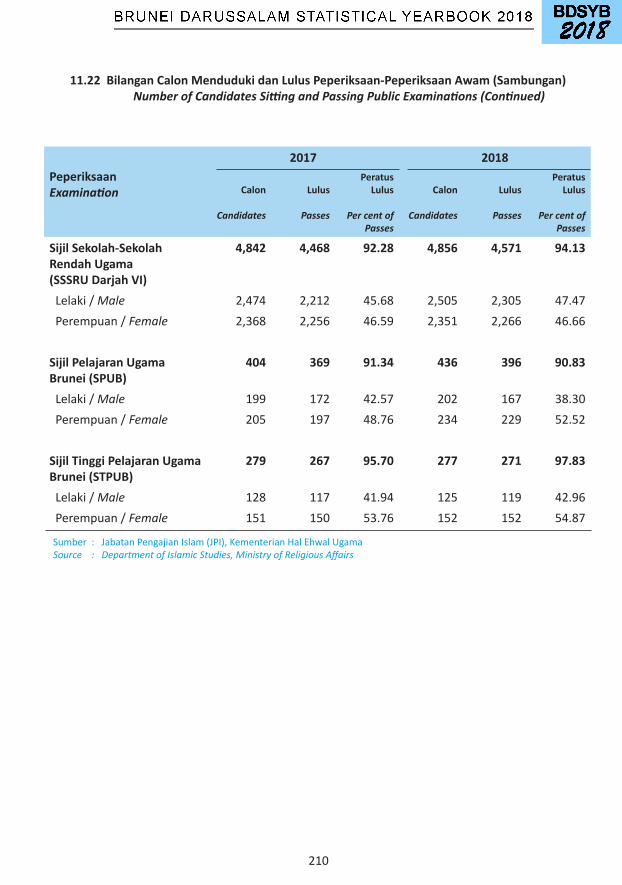
210
11.22 Bilangan Calon Menduduki dan Lulus Peperiksaan-Peperiksaan Awam (Sambungan) Number of Candidates Sitting and Passing Public Examinations (Continued)
Sumber:JabatanPengajianIslam(JPI),KementerianHalEhwalUgamaSource : Department of Islamic Studies, Ministry of Religious Affairs
PeperiksaanExamination
2017 2018
Calon
Candidates
Lulus
Passes
Peratus Lulus
Per cent of Passes
Calon
Candidates
Lulus
Passes
Peratus Lulus
Per cent of Passes
Sijil Sekolah-Sekolah Rendah Ugama(SSSRU Darjah VI)
4,842 4,468 92.28 4,856 4,571 94.13
Lelaki/Male 2,474 2,212 45.68 2,505 2,305 47.47Perempuan/Female 2,368 2,256 46.59 2,351 2,266 46.66
Sijil Pelajaran Ugama Brunei (SPUB)
404 369 91.34 436 396 90.83
Lelaki/Male 199 172 42.57 202 167 38.30Perempuan/Female 205 197 48.76 234 229 52.52
Sijil Tinggi Pelajaran Ugama Brunei (STPUB)
279 267 95.70 277 271 97.83
Lelaki/Male 128 117 41.94 125 119 42.96Perempuan/Female 151 150 53.76 152 152 54.87
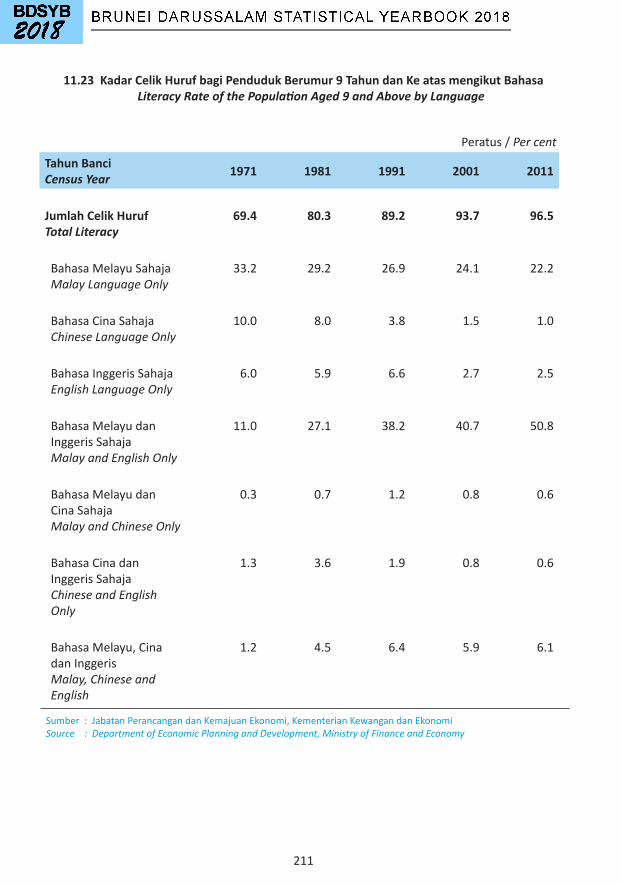
211
11.23 Kadar Celik Huruf bagi Penduduk Berumur 9 Tahun dan Ke atas mengikut Bahasa Literacy Rate of the Population Aged 9 and Above by Language
Sumber:JabatanPerancangandanKemajuanEkonomi,KementerianKewangandanEkonomiSource : Department of Economic Planning and Development, Ministry of Finance and Economy
Peratus/Per cent
Tahun BanciCensus Year 1971 1981 1991 2001 2011
Jumlah Celik HurufTotal Literacy
69.4 80.3 89.2 93.7 96.5
BahasaMelayuSahaja Malay Language Only
33.2 29.2 26.9 24.1 22.2
BahasaCinaSahaja Chinese Language Only
10.0 8.0 3.8 1.5 1.0
BahasaInggerisSahaja English Language Only
6.0 5.9 6.6 2.7 2.5
BahasaMelayudanInggerisSahaja Malay and English Only
11.0 27.1 38.2 40.7 50.8
BahasaMelayudanCinaSahaja Malay and Chinese Only
0.3 0.7 1.2 0.8 0.6
BahasaCinadanInggerisSahaja Chinese and English Only
1.3 3.6 1.9 0.8 0.6
BahasaMelayu,CinadanInggeris Malay, Chinese and English
1.2 4.5 6.4 5.9 6.1
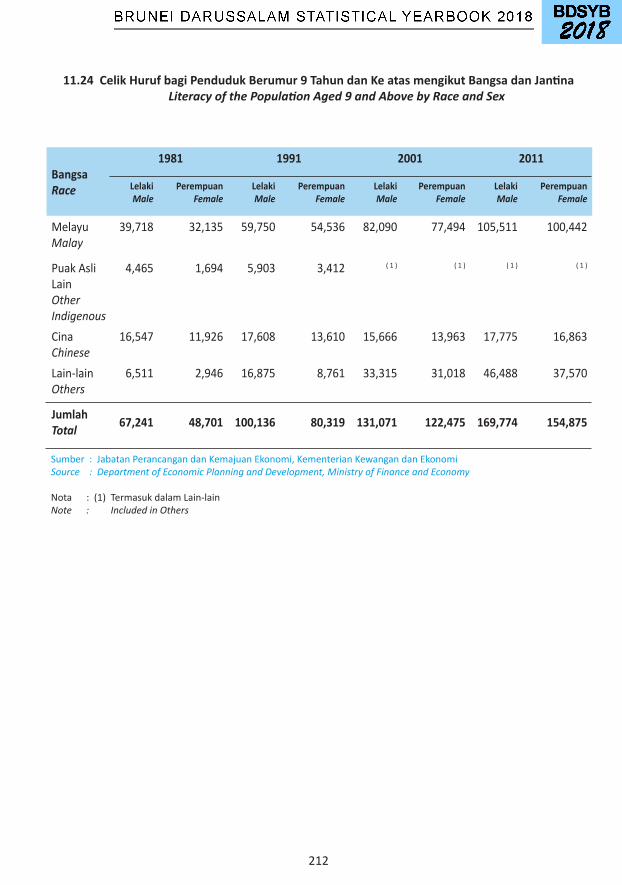
212
BangsaRace
1981 1991 2001 2011
LelakiMale
PerempuanFemale
LelakiMale
PerempuanFemale
LelakiMale
PerempuanFemale
LelakiMale
PerempuanFemale
MelayuMalay
39,718 32,135 59,750 54,536 82,090 77,494 105,511 100,442
PuakAsliLainOther Indigenous
4,465 1,694 5,903 3,412 (1) (1) (1) (1)
CinaChinese
16,547 11,926 17,608 13,610 15,666 13,963 17,775 16,863
Lain-lainOthers
6,511 2,946 16,875 8,761 33,315 31,018 46,488 37,570
JumlahTotal 67,241 48,701 100,136 80,319 131,071 122,475 169,774 154,875
11.24 Celik Huruf bagi Penduduk Berumur 9 Tahun dan Ke atas mengikut Bangsa dan Jantina Literacy of the Population Aged 9 and Above by Race and Sex
Sumber:JabatanPerancangandanKemajuanEkonomi,KementerianKewangandanEkonomiSource : Department of Economic Planning and Development, Ministry of Finance and Economy
Nota:(1)TermasukdalamLain-lainNote : Included in Others
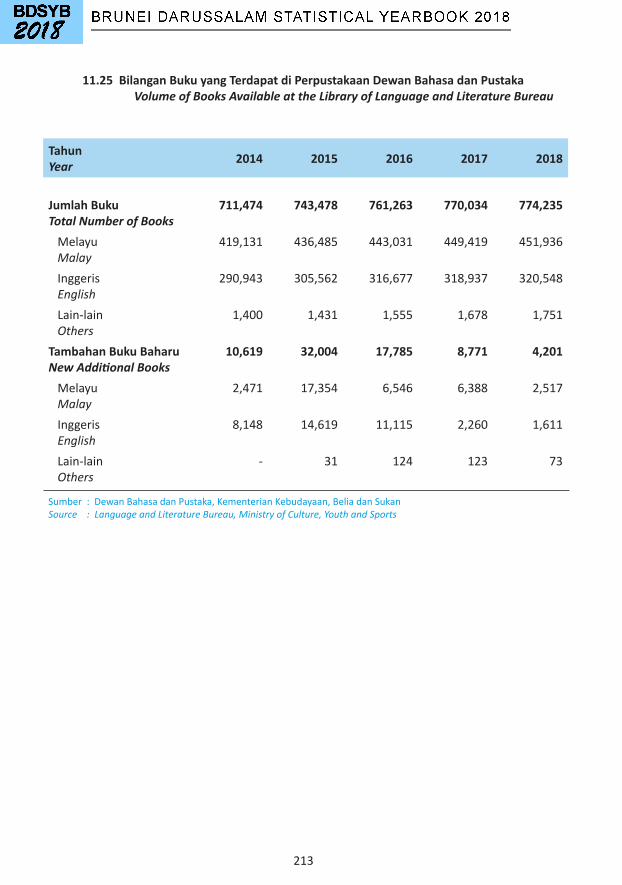
213
TahunYear 2014 2015 2016 2017 2018
Jumlah BukuTotal Number of Books
711,474 743,478 761,263 770,034 774,235
Melayu Malay
419,131 436,485 443,031 449,419 451,936
Inggeris English
290,943 305,562 316,677 318,937 320,548
Lain-lain Others
1,400 1,431 1,555 1,678 1,751
Tambahan Buku BaharuNew Additional Books
10,619 32,004 17,785 8,771 4,201
Melayu Malay
2,471 17,354 6,546 6,388 2,517
Inggeris English
8,148 14,619 11,115 2,260 1,611
Lain-lain Others
- 31 124 123 73
11.25 Bilangan Buku yang Terdapat di Perpustakaan Dewan Bahasa dan Pustaka Volume of Books Available at the Library of Language and Literature Bureau
Sumber:DewanBahasadanPustaka,KementerianKebudayaan,BeliadanSukanSource : Language and Literature Bureau, Ministry of Culture, Youth and Sports
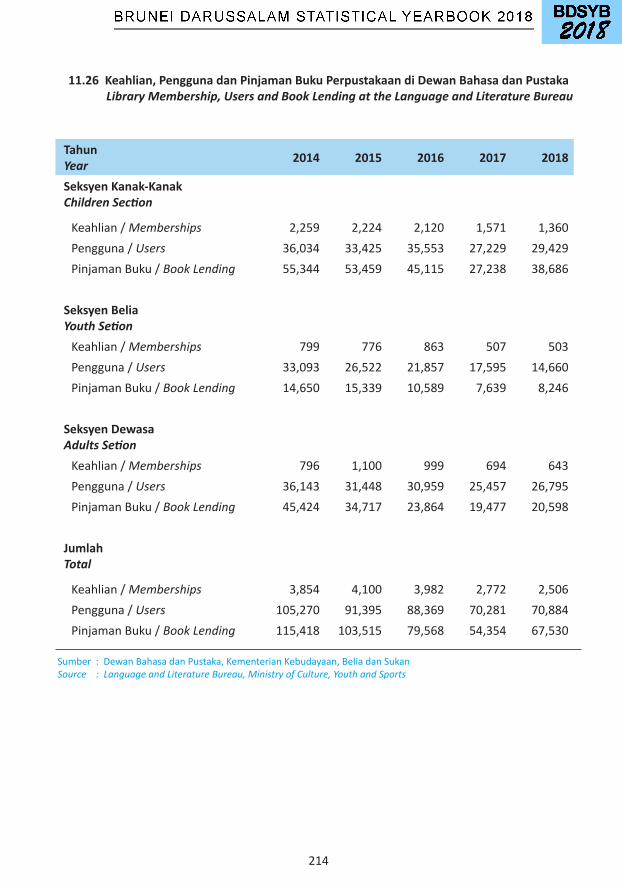
214
Tahun Year 2014 2015 2016 2017 2018
Seksyen Kanak-Kanak Children Section
Keahlian/Memberships 2,259 2,224 2,120 1,571 1,360Pengguna/Users 36,034 33,425 35,553 27,229 29,429PinjamanBuku/Book Lending 55,344 53,459 45,115 27,238 38,686
Seksyen Belia Youth SetionKeahlian/Memberships 799 776 863 507 503Pengguna/Users 33,093 26,522 21,857 17,595 14,660PinjamanBuku/Book Lending 14,650 15,339 10,589 7,639 8,246
Seksyen Dewasa Adults SetionKeahlian/Memberships 796 1,100 999 694 643Pengguna/Users 36,143 31,448 30,959 25,457 26,795PinjamanBuku/Book Lending 45,424 34,717 23,864 19,477 20,598
Jumlah Total
Keahlian/Memberships 3,854 4,100 3,982 2,772 2,506Pengguna/Users 105,270 91,395 88,369 70,281 70,884PinjamanBuku/Book Lending 115,418 103,515 79,568 54,354 67,530
11.26 Keahlian, Pengguna dan Pinjaman Buku Perpustakaan di Dewan Bahasa dan Pustaka Library Membership, Users and Book Lending at the Language and Literature Bureau
Sumber:DewanBahasadanPustaka,KementerianKebudayaan,BeliadanSukanSource : Language and Literature Bureau, Ministry of Culture, Youth and Sports

215
12 KESIHATAN HEALTH
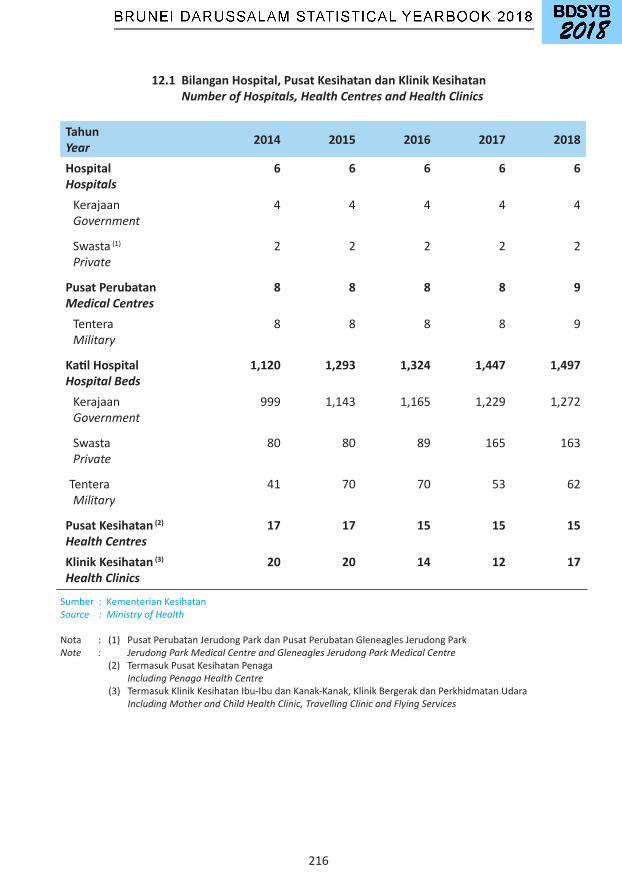
216
12.1 Bilangan Hospital, Pusat Kesihatan dan Klinik Kesihatan Number of Hospitals, Health Centres and Health Clinics
TahunYear 2014 2015 2016 2017 2018
HospitalHospitals
6 6 6 6 6
KerajaanGovernment
4 4 4 4 4
Swasta(1)
Private2 2 2 2 2
Pusat PerubatanMedical Centres
8 8 8 8 9
TenteraMilitary
8 8 8 8 9
Katil HospitalHospital Beds
1,120 1,293 1,324 1,447 1,497
KerajaanGovernment
999 1,143 1,165 1,229 1,272
SwastaPrivate
80 80 89 165 163
TenteraMilitary
41 70 70 53 62
Pusat Kesihatan (2)
Health Centres17 17 15 15 15
Klinik Kesihatan (3)
Health Clinics20 20 14 12 17
Sumber:KementerianKesihatanSource : Ministry of Health
Nota:(1)PusatPerubatanJerudongParkdanPusatPerubatanGleneaglesJerudongParkNote : Jerudong Park Medical Centre and Gleneagles Jerudong Park Medical Centre (2)TermasukPusatKesihatanPenaga Including Penaga Health Centre (3)TermasukKlinikKesihatanIbu-IbudanKanak-Kanak,KlinikBergerakdanPerkhidmatanUdara Including Mother and Child Health Clinic, Travelling Clinic and Flying Services
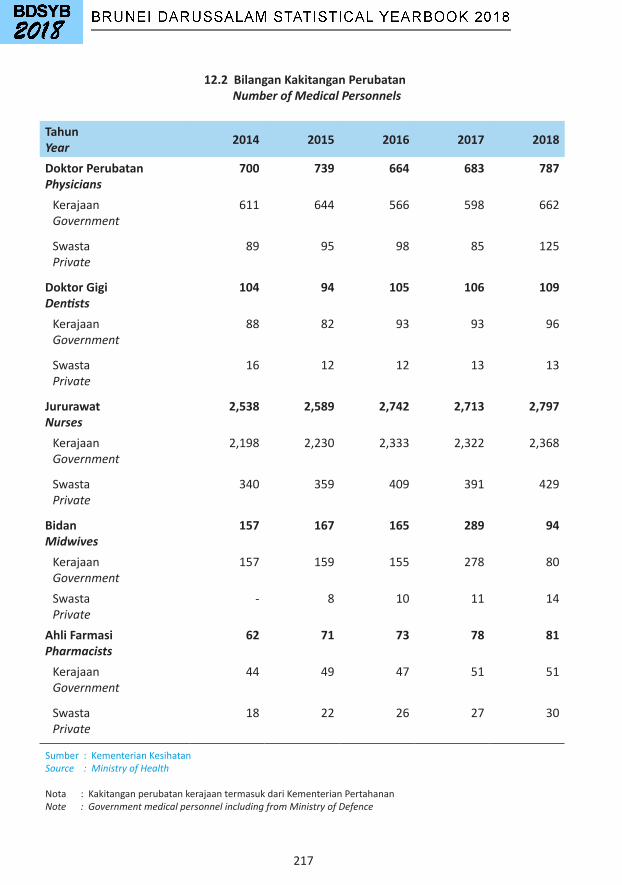
217
12.2 Bilangan Kakitangan Perubatan Number of Medical Personnels
TahunYear 2014 2015 2016 2017 2018
Doktor Perubatan
Physicians700 739 664 683 787
KerajaanGovernment
611 644 566 598 662
SwastaPrivate
89 95 98 85 125
Doktor GigiDentists
104 94 105 106 109
KerajaanGovernment
88 82 93 93 96
SwastaPrivate
16 12 12 13 13
JururawatNurses
2,538 2,589 2,742 2,713 2,797
KerajaanGovernment
2,198 2,230 2,333 2,322 2,368
SwastaPrivate
340 359 409 391 429
BidanMidwives
157 167 165 289 94
Kerajaan
Government157 159 155 278 80
SwastaPrivate
- 8 10 11 14
Ahli FarmasiPharmacists
62 71 73 78 81
Kerajaan
Government44 49 47 51 51
SwastaPrivate
18 22 26 27 30
Sumber:KementerianKesihatanSource : Ministry of Health
Nota:KakitanganperubatankerajaantermasukdariKementerianPertahananNote : Government medical personnel including from Ministry of Defence
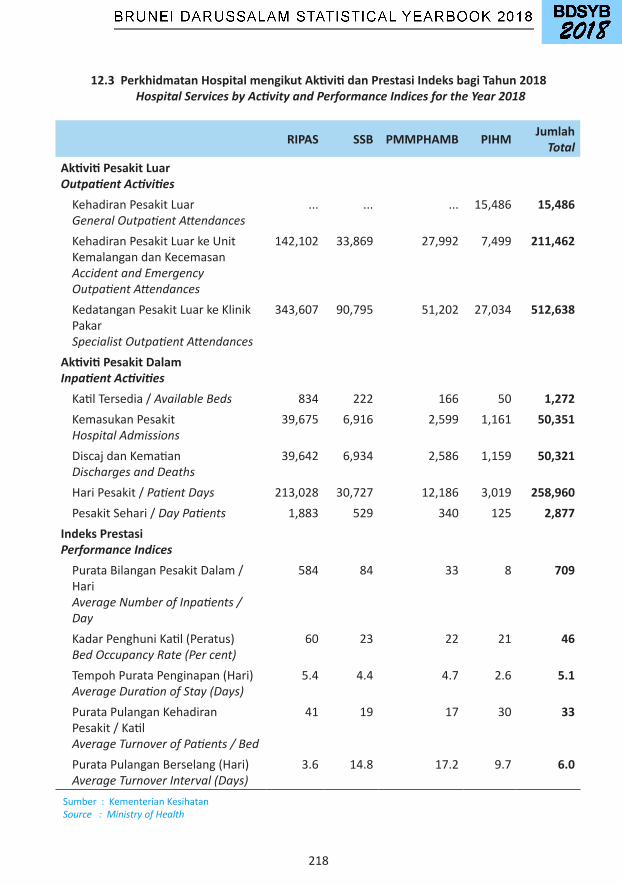
218
12.3 Perkhidmatan Hospital mengikut Aktiviti dan Prestasi Indeks bagi Tahun 2018 Hospital Services by Activity and Performance Indices for the Year 2018
RIPAS SSB PMMPHAMB PIHM JumlahTotal
Aktiviti Pesakit LuarOutpatient ActivitiesKehadiranPesakitLuarGeneral Outpatient Attendances
... ... ... 15,486 15,486
KehadiranPesakitLuarkeUnitKemalangandanKecemasanAccident and Emergency Outpatient Attendances
142,102 33,869 27,992 7,499 211,462
KedatanganPesakitLuarkeKlinikPakarSpecialist Outpatient Attendances
343,607 90,795 51,202 27,034 512,638
Aktiviti Pesakit DalamInpatient ActivitiesKatilTersedia/Available Beds 834 222 166 50 1,272KemasukanPesakitHospital Admissions
39,675 6,916 2,599 1,161 50,351
DiscajdanKematianDischarges and Deaths
39,642 6,934 2,586 1,159 50,321
HariPesakit/Patient Days 213,028 30,727 12,186 3,019 258,960PesakitSehari/Day Patients 1,883 529 340 125 2,877
Indeks PrestasiPerformance IndicesPurataBilanganPesakitDalam/HariAverage Number of Inpatients / Day
584 84 33 8 709
KadarPenghuniKatil(Peratus)Bed Occupancy Rate (Per cent)
60 23 22 21 46
TempohPurataPenginapan(Hari)Average Duration of Stay (Days)
5.4 4.4 4.7 2.6 5.1
PurataPulanganKehadiranPesakit/KatilAverage Turnover of Patients / Bed
41 19 17 30 33
PurataPulanganBerselang(Hari)Average Turnover Interval (Days)
3.6 14.8 17.2 9.7 6.0
Sumber:KementerianKesihatanSource : Ministry of Health
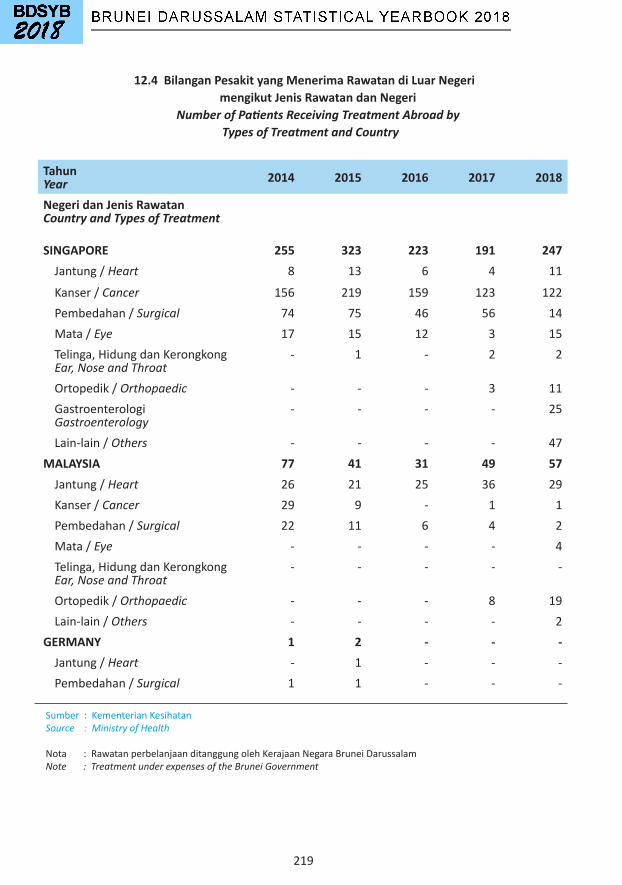
219
TahunYear 2014 2015 2016 2017 2018
Negeri dan Jenis RawatanCountry and Types of Treatment
SINGAPORE 255 323 223 191 247Jantung/Heart 8 13 6 4 11
Kanser/Cancer 156 219 159 123 122Pembedahan/Surgical 74 75 46 56 14Mata/Eye 17 15 12 3 15Telinga,HidungdanKerongkongEar, Nose and Throat
- 1 - 2 2
Ortopedik/Orthopaedic - - - 3 11Gastroenterologi Gastroenterology
- - - - 25
Lain-lain/ Others - - - - 47MALAYSIA 77 41 31 49 57Jantung/Heart 26 21 25 36 29Kanser/Cancer 29 9 - 1 1Pembedahan/Surgical 22 11 6 4 2Mata/Eye - - - - 4Telinga,HidungdanKerongkongEar, Nose and Throat
- - - - -
Ortopedik/Orthopaedic - - - 8 19Lain-lain/ Others - - - - 2
GERMANY 1 2 - - -Jantung/Heart - 1 - - -Pembedahan/Surgical 1 1 - - -
Sumber:KementerianKesihatanSource : Ministry of Health
Nota:RawatanperbelanjaanditanggungolehKerajaanNegaraBruneiDarussalamNote : Treatment under expenses of the Brunei Government
12.4 Bilangan Pesakit yang Menerima Rawatan di Luar Negeri mengikut Jenis Rawatan dan Negeri
Number of Patients Receiving Treatment Abroad by Types of Treatment and Country
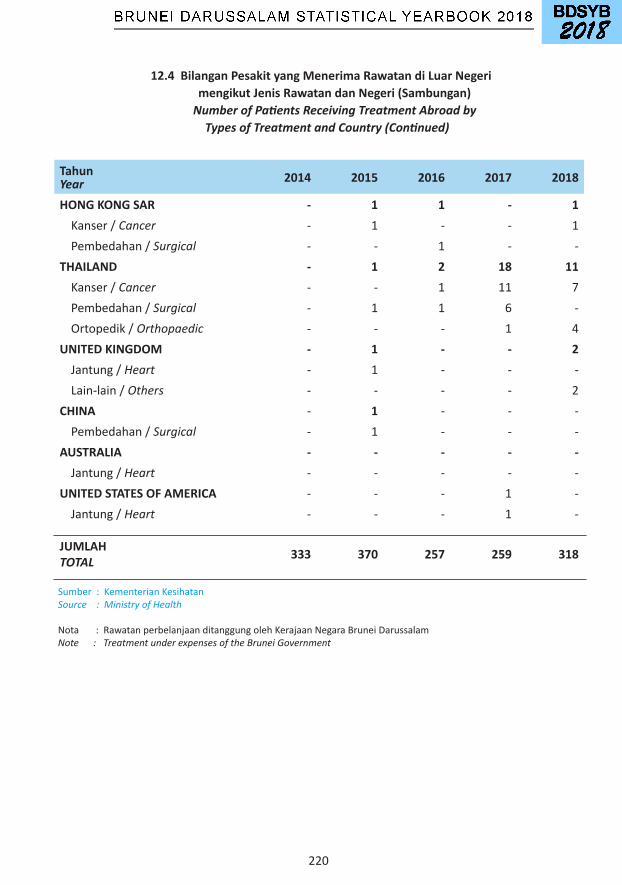
220
12.4 Bilangan Pesakit yang Menerima Rawatan di Luar Negeri mengikut Jenis Rawatan dan Negeri (Sambungan)
Number of Patients Receiving Treatment Abroad by Types of Treatment and Country (Continued)
TahunYear 2014 2015 2016 2017 2018
HONG KONG SAR - 1 1 - 1Kanser/Cancer - 1 - - 1Pembedahan/Surgical - - 1 - -
THAILAND - 1 2 18 11Kanser/Cancer - - 1 11 7Pembedahan/Surgical - 1 1 6 -Ortopedik/Orthopaedic - - - 1 4
UNITED KINGDOM - 1 - - 2Jantung/Heart - 1 - - -Lain-lain/ Others - - - - 2
CHINA - 1 - - -Pembedahan/Surgical - 1 - - -
AUSTRALIA - - - - -Jantung/Heart - - - - -
UNITED STATES OF AMERICA - - - 1 -Jantung/Heart - - - 1 -
JUMLAH TOTAL 333 370 257 259 318
Sumber:KementerianKesihatanSource : Ministry of Health
Nota:RawatanperbelanjaanditanggungolehKerajaanNegaraBruneiDarussalamNote : Treatment under expenses of the Brunei Government
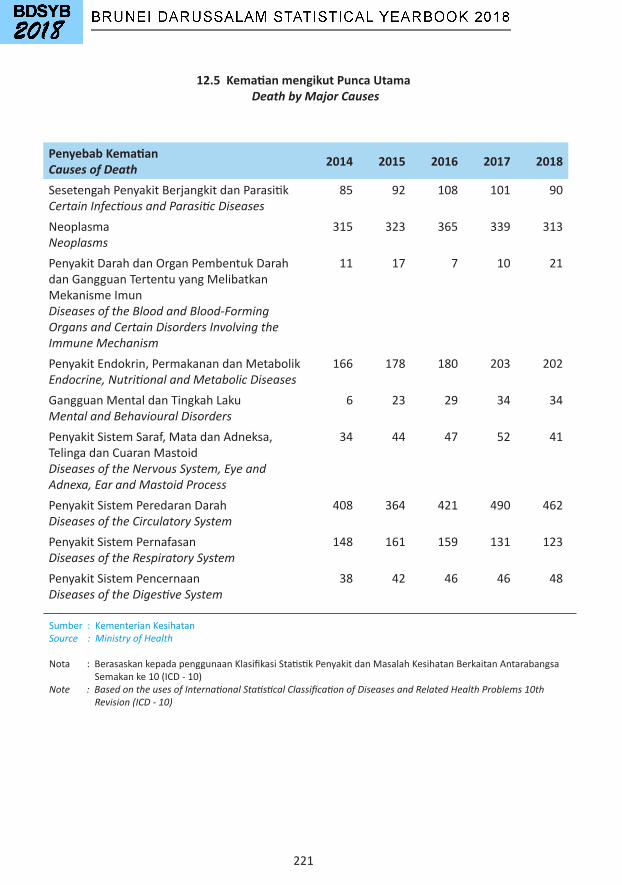
221
12.5 Kematian mengikut Punca Utama Death by Major Causes
Penyebab KematianCauses of Death 2014 2015 2016 2017 2018
SesetengahPenyakitBerjangkitdanParasitikCertain Infectious and Parasitic Diseases
85 92 108 101 90
NeoplasmaNeoplasms
315 323 365 339 313
PenyakitDarahdanOrganPembentukDarahdanGangguanTertentuyangMelibatkanMekanismeImunDiseases of the Blood and Blood-Forming Organs and Certain Disorders Involving the Immune Mechanism
11 17 7 10 21
PenyakitEndokrin,PermakanandanMetabolikEndocrine, Nutritional and Metabolic Diseases
166 178 180 203 202
GangguanMentaldanTingkahLakuMental and Behavioural Disorders
6 23 29 34 34
PenyakitSistemSaraf,MatadanAdneksa,TelingadanCuaranMastoidDiseases of the Nervous System, Eye and Adnexa, Ear and Mastoid Process
34 44 47 52 41
PenyakitSistemPeredaranDarahDiseases of the Circulatory System
408 364 421 490 462
PenyakitSistemPernafasanDiseases of the Respiratory System
148 161 159 131 123
PenyakitSistemPencernaanDiseases of the Digestive System
38 42 46 46 48
Sumber:KementerianKesihatanSource : Ministry of Health
Nota:BerasaskankepadapenggunaanKlasifikasiStatistikPenyakitdanMasalahKesihatanBerkaitanAntarabangsaSemakanke10(ICD-10)Note : Based on the uses of International Statistical Classification of Diseases and Related Health Problems 10th Revision (ICD - 10)
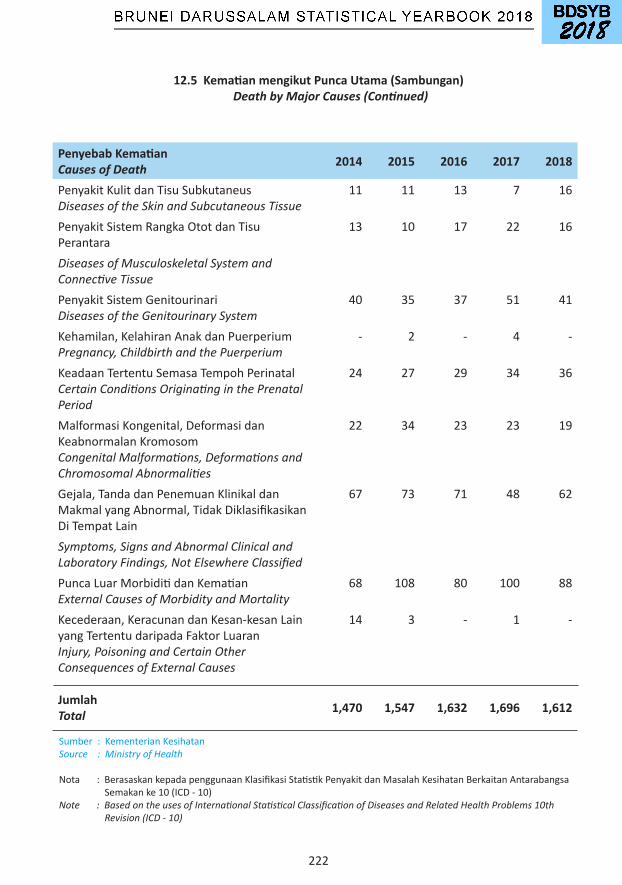
222
Penyebab KematianCauses of Death 2014 2015 2016 2017 2018
PenyakitKulitdanTisuSubkutaneusDiseases of the Skin and Subcutaneous Tissue
11 11 13 7 16
PenyakitSistemRangkaOtotdanTisuPerantara
13 10 17 22 16
Diseases of Musculoskeletal System and Connective TissuePenyakitSistemGenitourinariDiseases of the Genitourinary System
40 35 37 51 41
Kehamilan,KelahiranAnakdanPuerperiumPregnancy, Childbirth and the Puerperium
- 2 - 4 -
KeadaanTertentuSemasaTempohPerinatalCertain Conditions Originating in the Prenatal Period
24 27 29 34 36
MalformasiKongenital,DeformasidanKeabnormalanKromosomCongenital Malformations, Deformations and Chromosomal Abnormalities
22 34 23 23 19
Gejala,TandadanPenemuanKlinikaldanMakmalyangAbnormal,TidakDiklasifikasikanDiTempatLain
67 73 71 48 62
Symptoms, Signs and Abnormal Clinical and Laboratory Findings, Not Elsewhere Classified PuncaLuarMorbiditidanKematianExternal Causes of Morbidity and Mortality
68 108 80 100 88
Kecederaan,KeracunandanKesan-kesanLainyangTertentudaripadaFaktorLuaranInjury, Poisoning and Certain OtherConsequences of External Causes
14 3 - 1 -
JumlahTotal 1,470 1,547 1,632 1,696 1,612
12.5 Kematian mengikut Punca Utama (Sambungan) Death by Major Causes (Continued)
Sumber:KementerianKesihatanSource : Ministry of Health
Nota:BerasaskankepadapenggunaanKlasifikasiStatistikPenyakitdanMasalahKesihatanBerkaitanAntarabangsaSemakanke10(ICD-10)Note : Based on the uses of International Statistical Classification of Diseases and Related Health Problems 10th Revision (ICD - 10)

223
12.6 Jadual Jangka Hayat mengikut Jantina Abridged Life Table by Sex
Tahun Year 2001 2011 2016
Kumpulan Umur
Age GroupLelakiMale
PerempuanFemale
LelakiMale
PerempuanFemale
LelakiMale
PerempuanFemale
0 74.0 77.1 75.6 78.5 76.9 78.71-4 73.5 77.0 75.4 78.2 76.9 78.95-9 69.8 73.2 71.6 74.2 73.1 75.010-14 64.9 68.3 66.7 69.4 68.3 70.015-19 60.0 63.3 61.8 64.4 63.4 65.120-24 55.3 58.4 56.9 59.6 58.5 60.225-29 50.6 53.5 52.2 54.7 53.7 55.230-34 45.8 48.7 47.4 49.9 48.9 50.435-39 41.0 43.8 42.7 45.1 44.2 45.640-44 36.2 39.0 38.0 40.2 39.6 40.945-49 31.5 34.2 33.4 35.5 35.1 36.250-54 27.0 29.5 29.0 30.8 30.9 31.755-59 22.7 25.2 24.7 26.3 26.9 27.260-64 18.9 21.1 20.4 21.9 23.0 23.065-69 15.1 17.0 16.4 17.8 19.0 19.070-74 12.2 13.7 12.9 14.1 15.5 15.175-79 9.7 10.5 10.5 10.5 12.7 12.180-84 7.2 8.0 8.0 8.0 10.1 9.285-89 5.8 5.7 - - 9.5 7.490-94 5.9 5.5 - - 10.2 5.995-99 5.0 5.1 - - 12.1 3.8100danKeatas100 and Above
2.7 2.7 - - 11.7 2.6
Sumber:JabatanPerancangandanKemajuanEkonomi,KementerianKewangandanEkonomiSource : Department of Economic Planning and Development, Ministry of Finance and Economy
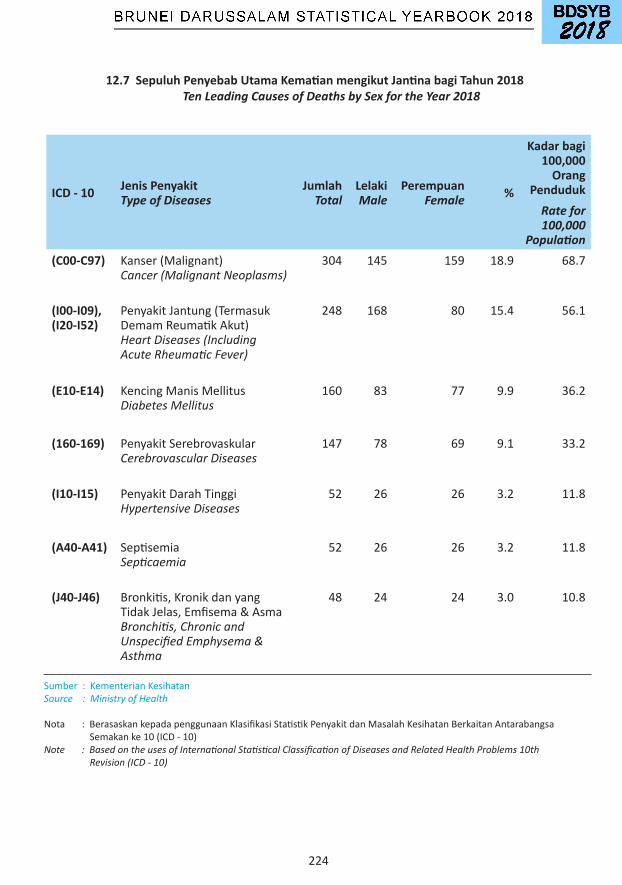
224
12.7 Sepuluh Penyebab Utama Kematian mengikut Jantina bagi Tahun 2018 Ten Leading Causes of Deaths by Sex for the Year 2018
ICD - 10 Jenis PenyakitType of Diseases
JumlahTotal
LelakiMale
PerempuanFemale %
Kadar bagi 100,000
Orang Penduduk
Rate for 100,000
Population(C00-C97) Kanser(Malignant)
Cancer (Malignant Neoplasms)304 145 159 18.9 68.7
(I00-I09),(I20-I52)
PenyakitJantung(TermasukDemamReumatikAkut)Heart Diseases (Including Acute Rheumatic Fever)
248 168 80 15.4 56.1
(E10-E14) KencingManisMellitusDiabetes Mellitus
160 83 77 9.9 36.2
(160-169) PenyakitSerebrovaskularCerebrovascular Diseases
147 78 69 9.1 33.2
(I10-I15) PenyakitDarahTinggiHypertensive Diseases
52 26 26 3.2 11.8
(A40-A41) SeptisemiaSepticaemia
52 26 26 3.2 11.8
(J40-J46) Bronkitis,KronikdanyangTidakJelas,Emfisema&AsmaBronchitis, Chronic and Unspecified Emphysema & Asthma
48 24 24 3.0 10.8
Sumber:KementerianKesihatanSource : Ministry of Health
Nota:BerasaskankepadapenggunaanKlasifikasiStatistikPenyakitdanMasalahKesihatanBerkaitanAntarabangsaSemakanke10(ICD-10)Note : Based on the uses of International Statistical Classification of Diseases and Related Health Problems 10th Revision (ICD - 10)
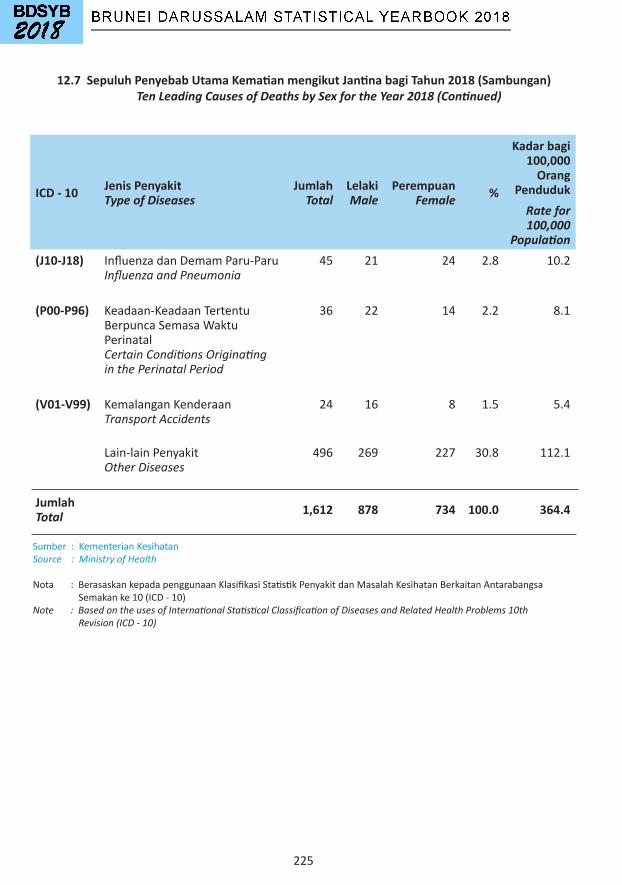
225
12.7 Sepuluh Penyebab Utama Kematian mengikut Jantina bagi Tahun 2018 (Sambungan) Ten Leading Causes of Deaths by Sex for the Year 2018 (Continued)
Sumber:KementerianKesihatanSource : Ministry of Health
Nota:BerasaskankepadapenggunaanKlasifikasiStatistikPenyakitdanMasalahKesihatanBerkaitanAntarabangsaSemakanke10(ICD-10)Note : Based on the uses of International Statistical Classification of Diseases and Related Health Problems 10th Revision (ICD - 10)
ICD - 10 Jenis PenyakitType of Diseases
JumlahTotal
LelakiMale
PerempuanFemale %
Kadar bagi 100,000
Orang Penduduk
Rate for 100,000
Population(J10-J18) InfluenzadanDemamParu-Paru
Influenza and Pneumonia45 21 24 2.8 10.2
(P00-P96) Keadaan-KeadaanTertentuBerpuncaSemasaWaktuPerinatalCertain Conditions Originating in the Perinatal Period
36 22 14 2.2 8.1
(V01-V99) KemalanganKenderaanTransport Accidents
24 16 8 1.5 5.4
Lain-lainPenyakitOther Diseases
496 269 227 30.8 112.1
JumlahTotal 1,612 878 734 100.0 364.4
226
13 PERUMAHAN HOUSING
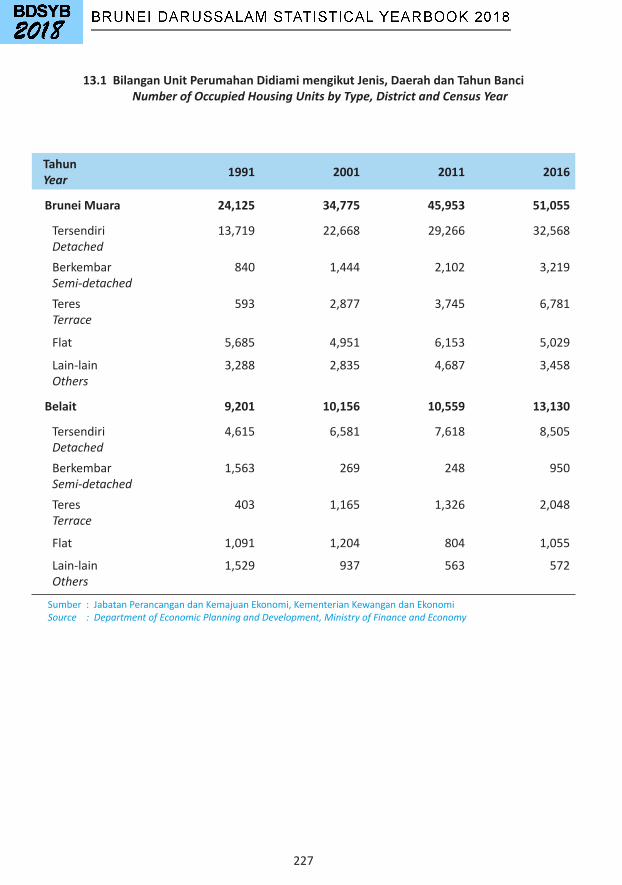
227
13.1 Bilangan Unit Perumahan Didiami mengikut Jenis, Daerah dan Tahun Banci Number of Occupied Housing Units by Type, District and Census Year
Tahun Year 1991 2001 2011 2016
Brunei Muara 24,125 34,775 45,953 51,055
TersendiriDetached
13,719 22,668 29,266 32,568
BerkembarSemi-detached
840 1,444 2,102 3,219
TeresTerrace
593 2,877 3,745 6,781
Flat 5,685 4,951 6,153 5,029
Lain-lainOthers
3,288 2,835 4,687 3,458
Belait 9,201 10,156 10,559 13,130
TersendiriDetached
4,615 6,581 7,618 8,505
BerkembarSemi-detached
1,563 269 248 950
TeresTerrace
403 1,165 1,326 2,048
Flat 1,091 1,204 804 1,055
Lain-lainOthers
1,529 937 563 572
Sumber:JabatanPerancangandanKemajuanEkonomi,KementerianKewangandanEkonomiSource : Department of Economic Planning and Development, Ministry of Finance and Economy

228
Tahun Year 1991 2001 2011 2016
Tutong 4,661 6,120 7,241 8,491
TersendiriDetached
3,165 4,418 5,491 6,157
BerkembarSemi-detached
307 203 240 380
TeresTerrace
124 195 338 446
Flat 723 856 718 575Lain-lainOthers
342 448 454 933
Temburong 1,135 1,489 1,640 1,894
TersendiriDetached
854 1,101 1,211 1,470
BerkembarSemi-detached
73 51 61 47
TeresTerrace
1 90 97 149
Flat 114 93 124 107Lain-lainOthers
93 154 147 121
JumlahTotal 39,122 52,540 65,393 74,570
Sumber:JabatanPerancangandanKemajuanEkonomi,KementerianKewangandanEkonomiSource : Department of Economic Planning and Development, Ministry of Finance and Economy
13.1 Bilangan Unit Perumahan Didiami mengikut Jenis, Daerah dan Tahun Banci (Sambungan) Number of Occupied Housing Units by Type, District and Census Year (Continued)
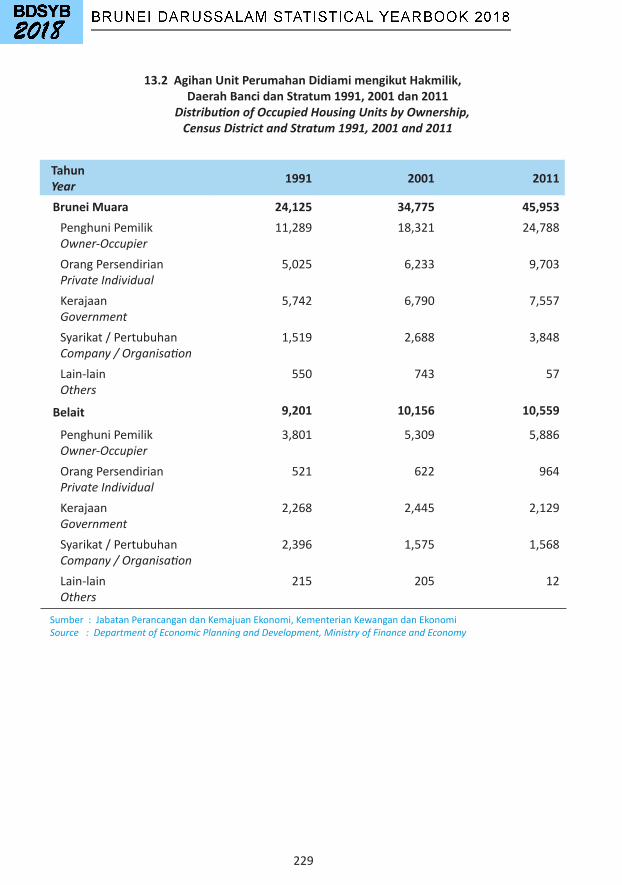
229
13.2 Agihan Unit Perumahan Didiami mengikut Hakmilik, Daerah Banci dan Stratum 1991, 2001 dan 2011
Distribution of Occupied Housing Units by Ownership, Census District and Stratum 1991, 2001 and 2011
Tahun Year 1991 2001 2011
Brunei Muara 24,125 34,775 45,953PenghuniPemilikOwner-Occupier
11,289 18,321 24,788
OrangPersendirianPrivate Individual
5,025 6,233 9,703
KerajaanGovernment
5,742 6,790 7,557
Syarikat/PertubuhanCompany / Organisation
1,519 2,688 3,848
Lain-lainOthers
550 743 57
Belait 9,201 10,156 10,559
PenghuniPemilikOwner-Occupier
3,801 5,309 5,886
OrangPersendirianPrivate Individual
521 622 964
KerajaanGovernment
2,268 2,445 2,129
Syarikat/PertubuhanCompany / Organisation
2,396 1,575 1,568
Lain-lainOthers
215 205 12
Sumber:JabatanPerancangandanKemajuanEkonomi,KementerianKewangandanEkonomiSource : Department of Economic Planning and Development, Ministry of Finance and Economy
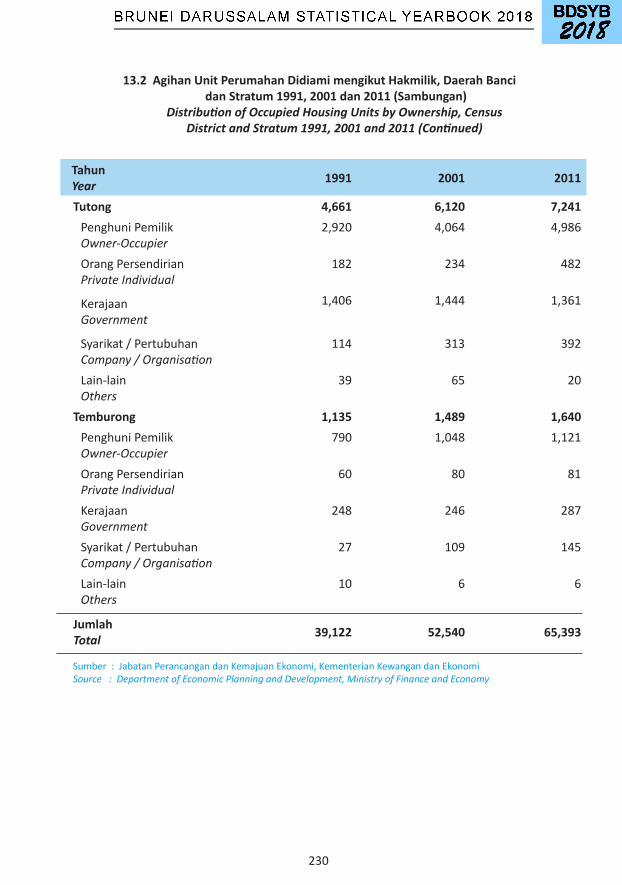
230
13.2 Agihan Unit Perumahan Didiami mengikut Hakmilik, Daerah Banci dan Stratum 1991, 2001 dan 2011 (Sambungan)
Distribution of Occupied Housing Units by Ownership, Census District and Stratum 1991, 2001 and 2011 (Continued)
Sumber:JabatanPerancangandanKemajuanEkonomi,KementerianKewangandanEkonomiSource : Department of Economic Planning and Development, Ministry of Finance and Economy
Tahun Year 1991 2001 2011
Tutong 4,661 6,120 7,241PenghuniPemilikOwner-Occupier
2,920 4,064 4,986
OrangPersendirianPrivate Individual
182 234 482
KerajaanGovernment
1,406 1,444 1,361
Syarikat/PertubuhanCompany / Organisation
114 313 392
Lain-lainOthers
39 65 20
Temburong 1,135 1,489 1,640PenghuniPemilikOwner-Occupier
790 1,048 1,121
OrangPersendirianPrivate Individual
60 80 81
KerajaanGovernment
248 246 287
Syarikat/PertubuhanCompany / Organisation
27 109 145
Lain-lainOthers
10 6 6
JumlahTotal 39,122 52,540 65,393

231
14 KESELAMATAN AWAM PUBLIC SAFETY

232
14.1 Kemalangan Jalan Raya mengikut Daerah Road Accidents by District
TahunYear 2013 2014 2015 2016 2017
Bilangan Kemalangan Jalan RayaNumber of Road Accidents
3,338 3,366 3,345 3,375 3,515
BruneiMuara 2,158 2,201 2,197 2,341 2,422Belait 693 689 673 643 663Tutong 447 442 443 350 400Temburong 40 34 32 41 30
Kematian (Orang)Deaths (Person)
32 24 36 17 29
BruneiMuara 15 13 25 9 15Belait 9 7 1 6 5Tutong 8 4 9 2 7Temburong - - 1 - 2
Bilangan Kecederaan (Orang)Injuries (Person)
510 433 460 473 529
Sumber:MajlisKebangsaanKeselamatanJalanRaya(MKKJR)PasukanPolisDirajaBrunei,JabatanPerdanaMenteriSource : Brunei National Road Safety Council (BNRSC) Royal Brunei Police Force, Prime Minister’s Office
Bilangan/ Number
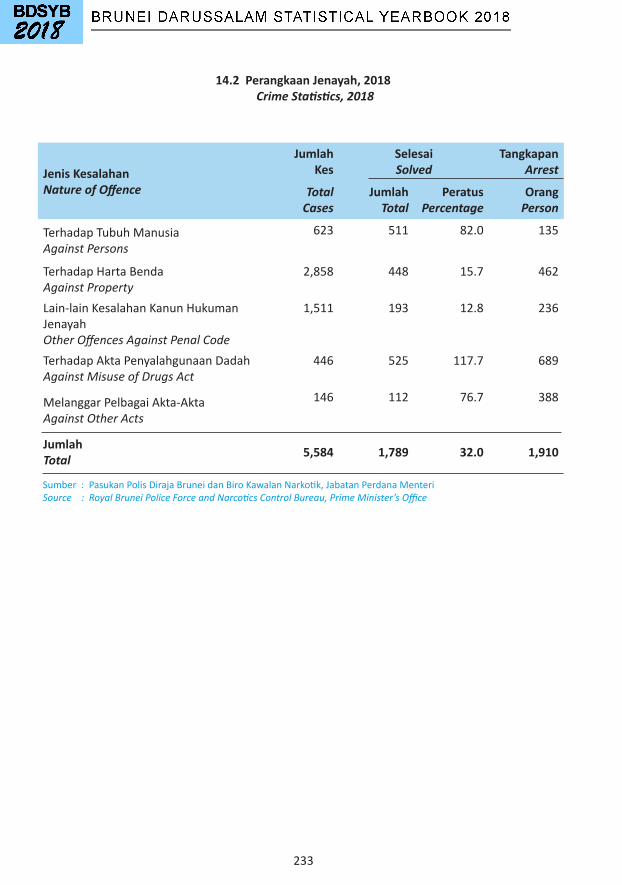
233
14.2 Perangkaan Jenayah, 2018 Crime Statistics, 2018
Jenis KesalahanNature of Offence
JumlahKes
SelesaiSolved
TangkapanArrest
Total Cases
JumlahTotal
PeratusPercentage
OrangPerson
TerhadapTubuhManusiaAgainst Persons
623 511 82.0 135
TerhadapHartaBendaAgainst Property
2,858 448 15.7 462
Lain-lainKesalahanKanunHukumanJenayahOther Offences Against Penal Code
1,511 193 12.8 236
TerhadapAktaPenyalahgunaanDadahAgainst Misuse of Drugs Act
446 525 117.7 689
MelanggarPelbagaiAkta-AktaAgainst Other Acts
146 112 76.7 388
JumlahTotal 5,584 1,789 32.0 1,910
Sumber:PasukanPolisDirajaBruneidanBiroKawalanNarkotik,JabatanPerdanaMenteriSource : Royal Brunei Police Force and Narcotics Control Bureau, Prime Minister’s Office

234
14.3 Kebakaran Fire Breakouts
Tahun Year 2014 2015 2016 2017 2018
Bilangan Kebakaranmengikut DaerahNumber of Fire Breakoutsby District
1,002 1,503 1,852 805 1,249
BruneiMuara 415 775 975 427 613Belait 315 382 438 230 402Tutong 249 328 402 134 228Temburong 23 18 37 14 6
Jenis KebakaranTypes of Fire Breakout
1,002 1,503 1,852 805 1,249
RumahKediaman/Pangsa Housing Unit / Flat
46 62 54 51 62
Kenderaan Vehicle
76 83 84 95 73
BangunandanIsinya Building and Its Contents
66 63 54 57 40
Elektrik Electric
65 75 72 92 66
Kebun/Hutan/Belukar/Lalang Garden / Forest / Thicket / Thatch
725 1,154 1,512 446 947
Lain-lain Others
24 66 76 64 61
Bilangan KecederaanNumber of Injuries
12 5 5 8 1
Bilangan KematianNumber of Deaths
7 4 3 4 2
Anggaran Kerugian (BND Juta)Estimated Loss (BND Million)
2.3 25.1 4.9 11.1 7.8
Sumber:JabatanBombadanPenyelamat,KementerianHalEhwalDalamNegeriSource : Fire and Rescue Department, Ministry of Home Affairs
235
15 ALAM SEKITAR ENVIRONMENT

236
15.1 Alam Sekitar Environment
TahunYear 2014 2015 2016 2017 2018
Bilangan Hari bagi Kualiti Udara (1)
Number of Air Quality DaysBaikGood
359 330 360 364 363
SederhanaModerate
6 35 6 1 2
Penggunaan Bahan Penghakis Ozon (Tan Metrik) Consumption of Ozone-Depleting Substances(Metric Tonnes)
72.8 64.9 68.1 62.7 65.8
Pelupusan Sisa Buangan(‘000 Tan Metrik)
200 210 198 194 223
Waste Disposal (‘000 Metric Tonnes)
Sumber:JabatanAlamSekitar,TamandanRekreasi,KementerianPembangunan Source : Department of Environment, Park and Recreation, Ministry of Development Nota:(1)IndeksPencemaranUdara(IPU)dibawahparas50(baik),51-99(sederhana),100-200(tidaksihat),201keatas(sangattidaksihatdanberbahaya) Note : Pollutants Standard Index (PSI) for under 50 (good), 51 - 99 (moderate), 100 - 200 (unhealthy), 201 above (very unhealthy and hazardous)
r
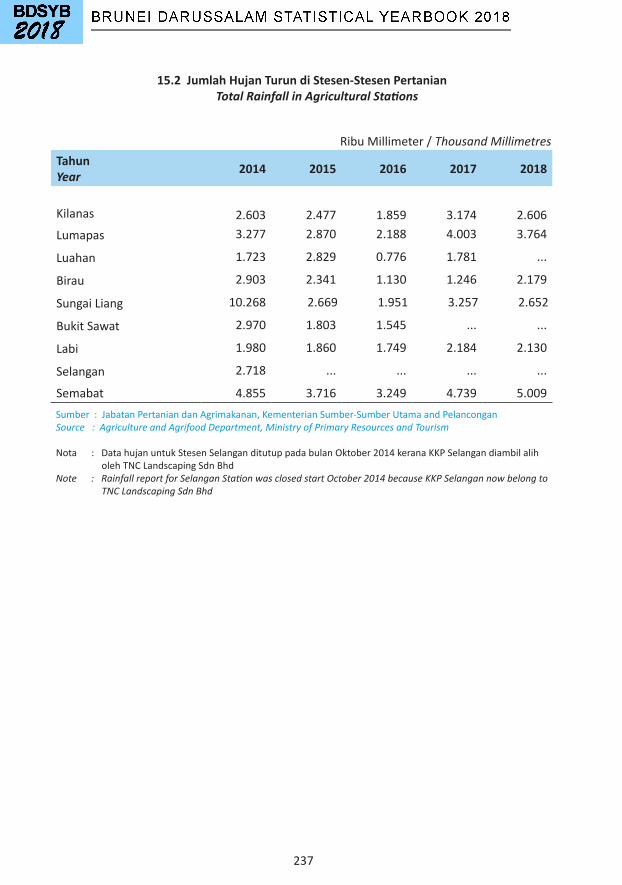
237
15.2 Jumlah Hujan Turun di Stesen-Stesen Pertanian Total Rainfall in Agricultural Stations
TahunYear 2014 2015 2016 2017 2018
Kilanas 2.603 2.477 1.859 3.174 2.606Lumapas 3.277 2.870 2.188 4.003 3.764
Luahan 1.723 2.829 0.776 1.781 ...
Birau 2.903 2.341 1.130 1.246 2.179
SungaiLiang 10.268 2.669 1.951 3.257 2.652
BukitSawat 2.970 1.803 1.545 ... ...
Labi 1.980 1.860 1.749 2.184 2.130
Selangan 2.718 ... ... ... ...
Semabat 4.855 3.716 3.249 4.739 5.009Sumber:JabatanPertaniandanAgrimakanan,KementerianSumber-SumberUtamaandPelanconganSource : Agriculture and Agrifood Department, Ministry of Primary Resources and Tourism
Nota:DatahujanuntukStesenSelanganditutuppadabulanOktober2014keranaKKPSelangandiambilaliholehTNCLandscapingSdnBhd Note : Rainfall report for Selangan Station was closed start October 2014 because KKP Selangan now belong to TNC Landscaping Sdn Bhd
RibuMillimeter/Thousand Millimetres

238
15.3 Purata Suhu, Kelembapan Relatif, Sinaran Matahari Cerah dan Jumlah Turunan Hujan Dicatatkan di Lapangan Terbang Antarabangsa Brunei
Mean Temperatures, Relative Humidity, Bright Sunshine and Total Rainfall Recorded at the Brunei International Airport
TahunYear 2014 2015 2016 2017 2018
Purata Suhu (Darjah Celsius)Mean Temperature (Degree Celsius)PurataMaksimumMean Maximum
31.5 32.0 32.5 31.9 32.3
PurataMinimumMean Minimum
24.2 24.5 25.0 24.0 23.8
Purata Kelembapan Relatif (Peratus)
84.6 84.2 83.2 84.8 83.4
Mean Relative Humidity (Percentage)Turunan HujanRainfallMaksimumdalamSehari(mm)Maximum in a Day (mm)
189.8 107.1 128.2 148.0 84.7
BilanganHariHujan(1)
Number of Rain Days211 205 181 239 228
Jumlah(mm)Total (mm)
3,173.5 3,015.8 2,182.2 3,797.4 3,366.1
Sinaran Matahari Cerah (Harian min / jam)
6.9 7.3 7.1 6.7 7.2
Bright Sunshine (Daily Mean / hours)
Sumber:JabatanKajicuacaBruneiDarussalam,KementerianPengangkutandanInfokomunikasi Source : Brunei Darussalam Meteorological Department, Ministry of Transport and Infocommunications Nota:(1)Bilanganharihujanbersertadengankadarhujanturun=0.1mm Note : Number of rain days with rainfall at least = 0.1 mm
r
r
r
r
r
r
r
r
r
rr
239
16 KESELAMATAN SOSIAL SOCIAL SECURITY

240
16.1 Tabung Amanah Pekerja Employees Trust Fund
TahunYear 2014 2015 2016 2017 2018
Bilangan Ahli yang Aktif 88,642 90,465 86,138 90,849 90,499
Number of Active Members KerajaanGovernment
42,277 44,325 41,526 38,419 40,410
SwastaPrivate
46,365 46,140 44,612 52,430 50,089
Bilangan Ahli yang Baru BerdaftarNumber of Newly Registered Members
7,321 6,711 5,923 6,133 6,573
KerajaanGovernment
699 592 657 434 392
Lelaki/MalePerempuan/Female
310 237 321 207 164389 355 336 227 228
SwastaPrivate
6,622 6,119 5,266 5,699 6,181
Lelaki/MalePerempuan/Female
3,474 3,191 2,789 3,029 3,2573,148 2,928 2,477 2,670 2,924
Sumber:TabungAmanahPekerja,KementerianKewangandanEkonomiSource : Employee Trust Fund, Ministry of Finance and Economy

241
16.2 Permohonan Pengeluaran Tabung Amanah Pekerja mengikut Jenis Skim Pengeluaran Withdrawals Application of Employee Trust Fund by Type of Withdrawal Scheme
Sumber:TabungAmanahPekerja,KementerianKewangandanEkonomiSource : Employee Trust Fund, Ministry of Finance and Economy
TahunYear 2014 2015 2016 2017 2018
Umur50 Age 50
1,982 1,895 2,201 3,162 2,453
Umur55 Age 55
1,741 1,918 3,853 3,048 4,190
Perumahan Housing
328 372 459 780 775
HakWaris Next of Kin
312 299 414 767 504
HilangUpaya Incapacitation
41 29 43 187 161
Penghijrahan Emigration
3 1 4 10 13
JumlahTotal 4,407 4,514 6,974 7,954 8,096
Orang/ Person
r
r
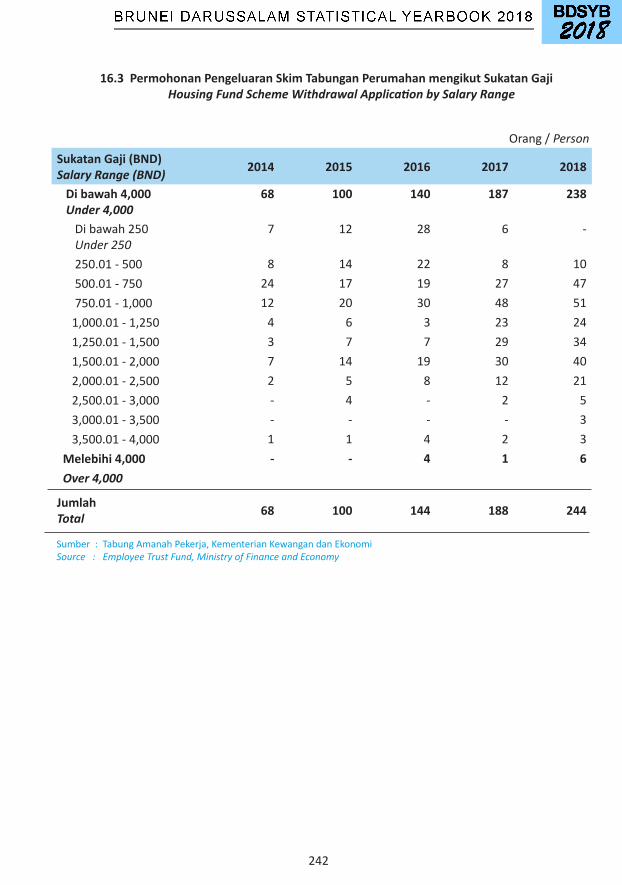
242
16.3 Permohonan Pengeluaran Skim Tabungan Perumahan mengikut Sukatan Gaji Housing Fund Scheme Withdrawal Application by Salary Range
Sumber:TabungAmanahPekerja,KementerianKewangandanEkonomiSource : Employee Trust Fund, Ministry of Finance and Economy
Sukatan Gaji (BND)Salary Range (BND) 2014 2015 2016 2017 2018
Di bawah 4,000 Under 4,000
68 100 140 187 238
Dibawah250 Under 250
7 12 28 6 -
250.01-500 8 14 22 8 10500.01-750 24 17 19 27 47750.01-1,000 12 20 30 48 511,000.01-1,250 4 6 3 23 241,250.01-1,500 3 7 7 29 341,500.01-2,000 7 14 19 30 402,000.01-2,500 2 5 8 12 212,500.01-3,000 - 4 - 2 53,000.01-3,500 - - - - 33,500.01-4,000 1 1 4 2 3 Melebihi 4,000 - - 4 1 6 Over 4,000
JumlahTotal 68 100 144 188 244
Orang/ Person
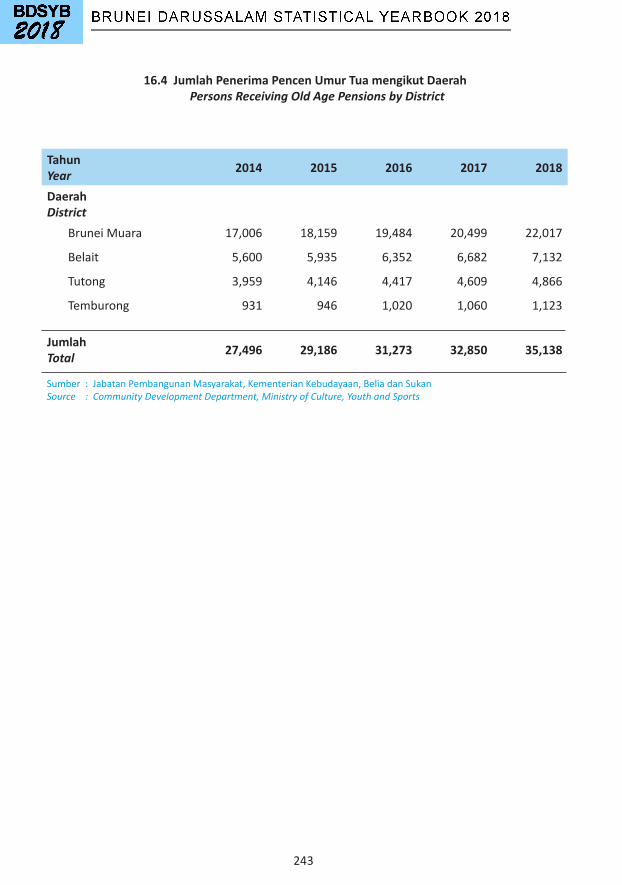
243
Sumber:JabatanPembangunanMasyarakat,KementerianKebudayaan,BeliadanSukanSource : Community Development Department, Ministry of Culture, Youth and Sports
Tahun Year 2014 2015 2016 2017 2018
DaerahDistrictBruneiMuara 17,006 18,159 19,484 20,499 22,017
Belait 5,600 5,935 6,352 6,682 7,132
Tutong 3,959 4,146 4,417 4,609 4,866
Temburong 931 946 1,020 1,060 1,123
JumlahTotal 27,496 29,186 31,273 32,850 35,138
16.4 Jumlah Penerima Pencen Umur Tua mengikut Daerah Persons Receiving Old Age Pensions by District

244
17 PERNIAGAAN SEKTOR SWASTA PRIVATE SECTOR BUSINESSES

245
Sumber:BahagianPendaftaranSyarikat-SyarikatdanNama-NamaPerniagaan,KementerianKewangandanEkonomiSource : Registry of Companies and Business Names, Ministry of Finance and Economy
TahunYear 2014 2015 2016 2017 2018
Jumlah Pendaftaran BaruTotal of Newly Registration
4,498 4,227 3,952 4,702 4,387
SyarikatTempatanLocal Companies
443 577 749 798 756
SyarikatLuarNegaraForeign Companies
14 12 12 12 7
PersendiriandanPerkongsianProprietorships and Partnership
4,041 3,638 3,191 3,892 3,624
Jumlah DibubarkanTotal Number of Dissolved
171 567 299 91 407
SyarikatTempatanLocal Companies
171 514 270 91 384
SyarikatLuarNegaraForeign Companies
- 53 29 - 23
17.1 Syarikat / Perusahaan yang Baru Berdaftar dan Dibubarkan Newly Registered and Dissolve Companies / Enterprises
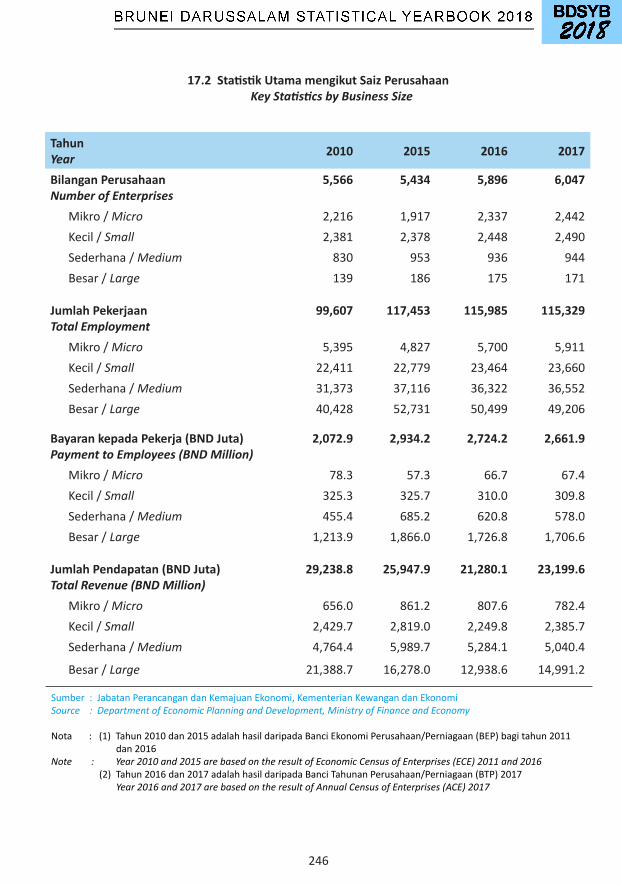
246
17.2 Statistik Utama mengikut Saiz Perusahaan Key Statistics by Business Size
Sumber:JabatanPerancangandanKemajuanEkonomi,KementerianKewangandanEkonomiSource : Department of Economic Planning and Development, Ministry of Finance and Economy
Nota:(1)Tahun2010dan2015adalahhasildaripadaBanciEkonomiPerusahaan/Perniagaan(BEP)bagitahun2011dan2016Note : Year 2010 and 2015 are based on the result of Economic Census of Enterprises (ECE) 2011 and 2016 (2)Tahun2016dan2017adalahhasildaripadaBanciTahunanPerusahaan/Perniagaan(BTP)2017 Year 2016 and 2017 are based on the result of Annual Census of Enterprises (ACE) 2017
TahunYear 2010 2015 2016 2017
Bilangan Perusahaan Number of Enterprises
5,566 5,434 5,896 6,047
Mikro / Micro 2,216 1,917 2,337 2,442Kecil / Small 2,381 2,378 2,448 2,490Sederhana / Medium 830 953 936 944Besar / Large 139 186 175 171
Jumlah PekerjaanTotal Employment
99,607 117,453 115,985 115,329
Mikro /Micro 5,395 4,827 5,700 5,911Kecil / Small 22,411 22,779 23,464 23,660Sederhana / Medium 31,373 37,116 36,322 36,552Besar / Large 40,428 52,731 50,499 49,206
Bayaran kepada Pekerja (BND Juta) Payment to Employees (BND Million)
2,072.9 2,934.2 2,724.2 2,661.9
Mikro / Micro 78.3 57.3 66.7 67.4Kecil / Small 325.3 325.7 310.0 309.8Sederhana / Medium 455.4 685.2 620.8 578.0Besar / Large 1,213.9 1,866.0 1,726.8 1,706.6
Jumlah Pendapatan (BND Juta) Total Revenue (BND Million)
29,238.8 25,947.9 21,280.1 23,199.6
Mikro / Micro 656.0 861.2 807.6 782.4Kecil / Small 2,429.7 2,819.0 2,249.8 2,385.7Sederhana / Medium 4,764.4 5,989.7 5,284.1 5,040.4
Besar / Large 21,388.7 16,278.0 12,938.6 14,991.2

247
17.3 Bilangan Pekerja di Sektor Swasta mengikut Saiz Perusahaan Number of Employees in Private Sector by Business Size
TahunYear 2010 2015 2016 2017
Jumlah Pekerjaan Total Employment
99,607 117,453 115,985 115,329
Mikro / Micro 5,395 4,827 5,700 5,911Kecil / Small 22,411 22,779 23,464 23,660Sederhana / Medium 31,373 37,116 36,322 36,552Besar / Large 40,428 52,731 50,499 49,206
Pekerja Tempatan Local Employment
42,518 54,166 53,336 54,489
Mikro / Micro 2,409 2,584 2,945 3,058Kecil / Small 7,760 8,795 8,281 8,617Sederhana / Medium 10,891 14,086 13,361 13,386Besar / Large 21,458 28,698 28,749 29,428
Pekerja Bukan Tempatan Non-Local Employment
57,089 63,287 62,649 60,840
Mikro / Micro 2,986 2,243 2,755 2,853Kecil / Small 14,651 13,981 15,183 15,043Sederhana / Medium 20,482 23,030 22,961 23,166Besar / Large 18,970 24,033 21,750 19,778
Sumber:JabatanPerancangandanKemajuanEkonomi,KementerianKewangandanEkonomiSource : Department of Economic Planning and Development, Ministry of Finance and Economy
Nota:(1)Tahun2010dan2015adalahhasildaripadaBanciEkonomiPerusahaan/Perniagaan(BEP)bagitahun2011dan2016Note : Year 2010 and 2015 are based on the result of Economic Census of Enterprises (ECE) 2011 and 2016 (2)Tahun2016dan2017adalahhasildaripadaBanciTahunanPerusahaan/Perniagaan(BTP)2017 Year 2016 and 2017 are based on the result of Annual Census of Enterprises (ACE) 2017
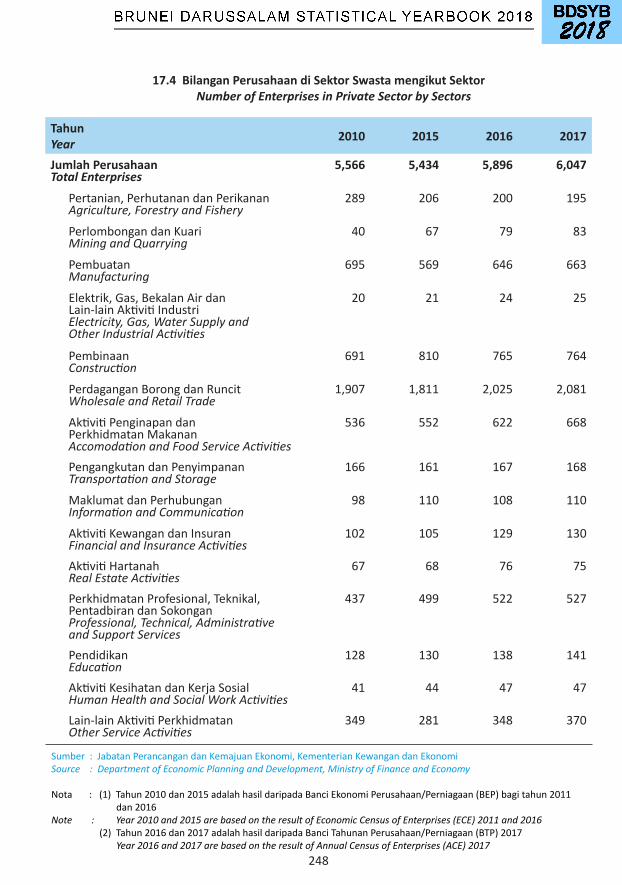
248
17.4 Bilangan Perusahaan di Sektor Swasta mengikut Sektor Number of Enterprises in Private Sector by Sectors
TahunYear 2010 2015 2016 2017
Jumlah PerusahaanTotal Enterprises
5,566 5,434 5,896 6,047
Pertanian,PerhutanandanPerikanan Agriculture, Forestry and Fishery
289 206 200 195
PerlombongandanKuari Mining and Quarrying
40 67 79 83
Pembuatan Manufacturing
695 569 646 663
Elektrik,Gas,BekalanAirdanLain-lainAktivitiIndustri Electricity, Gas, Water Supply and Other Industrial Activities
20 21 24 25
Pembinaan Construction
691 810 765 764
PerdaganganBorongdanRuncit Wholesale and Retail Trade
1,907 1,811 2,025 2,081
AktivitiPenginapandanPerkhidmatanMakanan Accomodation and Food Service Activities
536 552 622 668
PengangkutandanPenyimpanan Transportation and Storage
166 161 167 168
MaklumatdanPerhubungan Information and Communication
98 110 108 110
AktivitiKewangandanInsuran Financial and Insurance Activities
102 105 129 130
AktivitiHartanah Real Estate Activities
67 68 76 75
PerkhidmatanProfesional,Teknikal,PentadbirandanSokongan Professional, Technical, Administrative and Support Services
437 499 522 527
Pendidikan Education
128 130 138 141
AktivitiKesihatandanKerjaSosial Human Health and Social Work Activities
41 44 47 47
Lain-lainAktivitiPerkhidmatan Other Service Activities
349 281 348 370
Sumber:JabatanPerancangandanKemajuanEkonomi,KementerianKewangandanEkonomiSource : Department of Economic Planning and Development, Ministry of Finance and Economy
Nota:(1)Tahun2010dan2015adalahhasildaripadaBanciEkonomiPerusahaan/Perniagaan(BEP)bagitahun2011dan2016Note : Year 2010 and 2015 are based on the result of Economic Census of Enterprises (ECE) 2011 and 2016 (2)Tahun2016dan2017adalahhasildaripadaBanciTahunanPerusahaan/Perniagaan(BTP)2017 Year 2016 and 2017 are based on the result of Annual Census of Enterprises (ACE) 2017

249
17.5 Bilangan Pekerjaan di Sektor Swasta mengikut Sektor Number of Employees in Private Sector by Sectors
TahunYear 2010 2015 2016 2017
Jumlah PekerjaanTotal Employment
99,607 117,453 115,985 115,329
Pertanian,PerhutanandanPerikanan Agriculture, Forestry and Fishery
1,754 1,659 1,624 1,636
PerlombongandanKuari Mining and Quarrying
5,277 9,802 10,141 10,004
Pembuatan Manufacturing
8,187 8,574 9,018 9,544
Elektrik,Gas,BekalanAirdanLain-lainAktivitiIndustri Electricity, Gas, Water Supply and Other Industrial Activities
283 540 419 442
Pembinaan Construction
22,719 24,604 22,482 20,979
PerdaganganBorongdanRuncit Wholesale and Retail Trade
22,750 25,241 25,157 25,533
AktivitiPenginapandanPerkhidmatanMakanan Accomodation and Food Service Activities
9,563 11,325 11,076 11,400
PengangkutandanPenyimpanan Transportation and Storage
4,972 6,019 6,060 5,811
MaklumatdanPerhubungan Information and Communication
2,345 3,701 3,702 3,461
AktivitiKewangandanInsuran Financial and Insurance Activities
3,368 3,628 3,697 3,733
AktivitiHartanah Real Estate Activities
675 997 965 951
PerkhidmatanProfesional,Teknikal,PentadbirandanSokongan Professional, Technical, Administrative and Support Services
11,234 14,315 14,420 14,533
Pendidikan Education
3,126 4,063 3,844 3,856
AktivitiKesihatandanKerjaSosial Human Health and Social Work Activities
664 1,012 1,042 1,003
Lain-lainAktivitiPerkhidmatan Other Service Activities
2,690 1,973 2,338 2,443
Sumber:JabatanPerancangandanKemajuanEkonomi,KementerianKewangandanEkonomiSource : Department of Economic Planning and Development, Ministry of Finance and Economy
Nota:(1)Tahun2010dan2015adalahhasildaripadaBanciEkonomiPerusahaan/Perniagaan(BEP)bagitahun2011dan2016Note : Year 2010 and 2015 are based on the result of Economic Census of Enterprises (ECE) 2011 and 2016 (2)Tahun2016dan2017adalahhasildaripadaBanciTahunanPerusahaan/Perniagaan(BTP)2017 Year 2016 and 2017 are based on the result of Annual Census of Enterprises (ACE) 2017
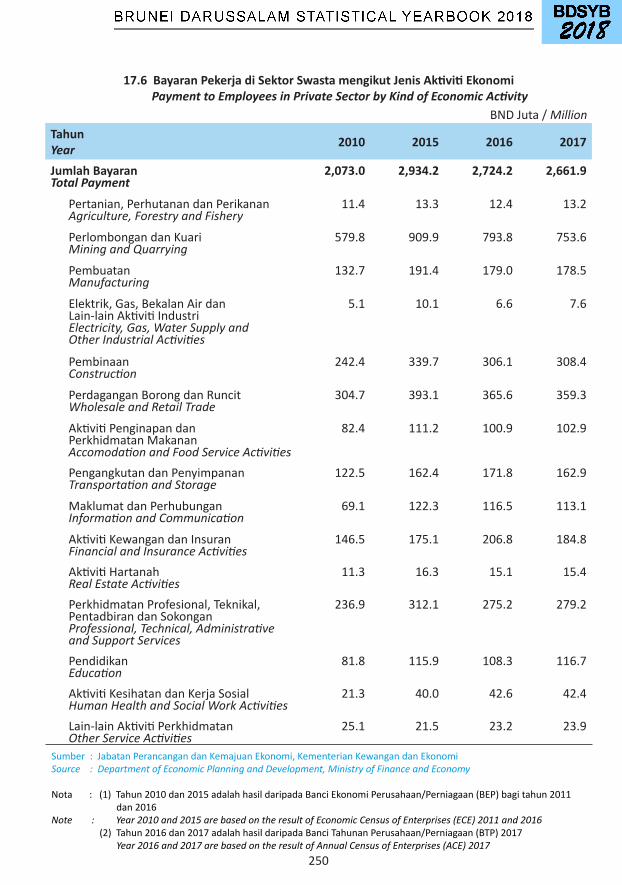
250
17.6 Bayaran Pekerja di Sektor Swasta mengikut Jenis Aktiviti Ekonomi Payment to Employees in Private Sector by Kind of Economic Activity
TahunYear 2010 2015 2016 2017
Jumlah BayaranTotal Payment
2,073.0 2,934.2 2,724.2 2,661.9
Pertanian,PerhutanandanPerikanan Agriculture, Forestry and Fishery
11.4 13.3 12.4 13.2
PerlombongandanKuari Mining and Quarrying
579.8 909.9 793.8 753.6
Pembuatan Manufacturing
132.7 191.4 179.0 178.5
Elektrik,Gas,BekalanAirdanLain-lainAktivitiIndustri Electricity, Gas, Water Supply and Other Industrial Activities
5.1 10.1 6.6 7.6
Pembinaan Construction
242.4 339.7 306.1 308.4
PerdaganganBorongdanRuncit Wholesale and Retail Trade
304.7 393.1 365.6 359.3
AktivitiPenginapandanPerkhidmatanMakanan Accomodation and Food Service Activities
82.4 111.2 100.9 102.9
PengangkutandanPenyimpanan Transportation and Storage
122.5 162.4 171.8 162.9
MaklumatdanPerhubungan Information and Communication
69.1 122.3 116.5 113.1
AktivitiKewangandanInsuran Financial and Insurance Activities
146.5 175.1 206.8 184.8
AktivitiHartanah Real Estate Activities
11.3 16.3 15.1 15.4
PerkhidmatanProfesional,Teknikal,PentadbirandanSokongan Professional, Technical, Administrative and Support Services
236.9 312.1 275.2 279.2
Pendidikan Education
81.8 115.9 108.3 116.7
AktivitiKesihatandanKerjaSosial Human Health and Social Work Activities
21.3 40.0 42.6 42.4
Lain-lainAktivitiPerkhidmatan Other Service Activities
25.1 21.5 23.2 23.9
BNDJuta/Million
Sumber:JabatanPerancangandanKemajuanEkonomi,KementerianKewangandanEkonomiSource : Department of Economic Planning and Development, Ministry of Finance and Economy
Nota:(1)Tahun2010dan2015adalahhasildaripadaBanciEkonomiPerusahaan/Perniagaan(BEP)bagitahun2011dan2016Note : Year 2010 and 2015 are based on the result of Economic Census of Enterprises (ECE) 2011 and 2016 (2)Tahun2016dan2017adalahhasildaripadaBanciTahunanPerusahaan/Perniagaan(BTP)2017 Year 2016 and 2017 are based on the result of Annual Census of Enterprises (ACE) 2017
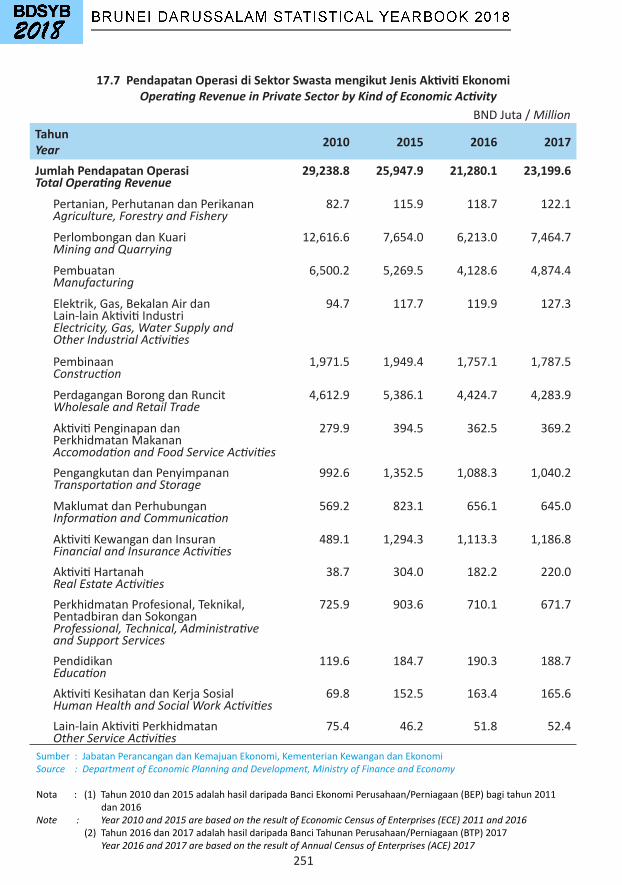
251
17.7 Pendapatan Operasi di Sektor Swasta mengikut Jenis Aktiviti Ekonomi Operating Revenue in Private Sector by Kind of Economic Activity
TahunYear 2010 2015 2016 2017
Jumlah Pendapatan OperasiTotal Operating Revenue
29,238.8 25,947.9 21,280.1 23,199.6
Pertanian,PerhutanandanPerikanan Agriculture, Forestry and Fishery
82.7 115.9 118.7 122.1
PerlombongandanKuari Mining and Quarrying
12,616.6 7,654.0 6,213.0 7,464.7
Pembuatan Manufacturing
6,500.2 5,269.5 4,128.6 4,874.4
Elektrik,Gas,BekalanAirdanLain-lainAktivitiIndustri Electricity, Gas, Water Supply and Other Industrial Activities
94.7 117.7 119.9 127.3
Pembinaan Construction
1,971.5 1,949.4 1,757.1 1,787.5
PerdaganganBorongdanRuncit Wholesale and Retail Trade
4,612.9 5,386.1 4,424.7 4,283.9
AktivitiPenginapandanPerkhidmatanMakanan Accomodation and Food Service Activities
279.9 394.5 362.5 369.2
PengangkutandanPenyimpanan Transportation and Storage
992.6 1,352.5 1,088.3 1,040.2
MaklumatdanPerhubungan Information and Communication
569.2 823.1 656.1 645.0
AktivitiKewangandanInsuran Financial and Insurance Activities
489.1 1,294.3 1,113.3 1,186.8
AktivitiHartanah Real Estate Activities
38.7 304.0 182.2 220.0
PerkhidmatanProfesional,Teknikal,PentadbirandanSokongan Professional, Technical, Administrative and Support Services
725.9 903.6 710.1 671.7
Pendidikan Education
119.6 184.7 190.3 188.7
AktivitiKesihatandanKerjaSosial Human Health and Social Work Activities
69.8 152.5 163.4 165.6
Lain-lainAktivitiPerkhidmatan Other Service Activities
75.4 46.2 51.8 52.4
BNDJuta/Million
Sumber:JabatanPerancangandanKemajuanEkonomi,KementerianKewangandanEkonomiSource : Department of Economic Planning and Development, Ministry of Finance and Economy
Nota:(1)Tahun2010dan2015adalahhasildaripadaBanciEkonomiPerusahaan/Perniagaan(BEP)bagitahun2011dan2016Note : Year 2010 and 2015 are based on the result of Economic Census of Enterprises (ECE) 2011 and 2016 (2)Tahun2016dan2017adalahhasildaripadaBanciTahunanPerusahaan/Perniagaan(BTP)2017 Year 2016 and 2017 are based on the result of Annual Census of Enterprises (ACE) 2017
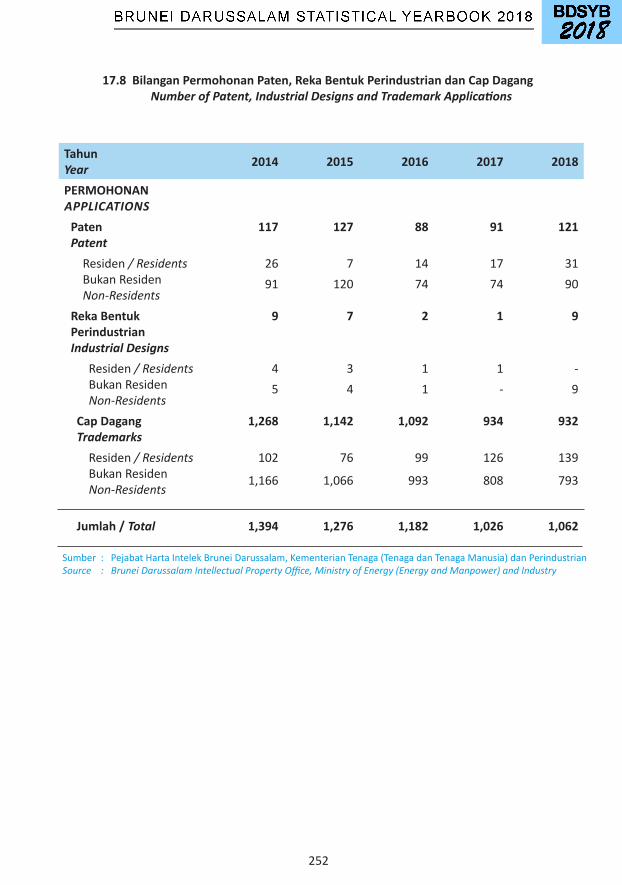
252
17.8 Bilangan Permohonan Paten, Reka Bentuk Perindustrian dan Cap Dagang Number of Patent, Industrial Designs and Trademark Applications
TahunYear 2014 2015 2016 2017 2018
PERMOHONANAPPLICATIONS
PatenPatent
117 127 88 91 121
Residen / ResidentsBukanResidenNon-Residents
26 7 14 17 3191 120 74 74 90
Reka Bentuk PerindustrianIndustrial Designs
9 7 2 1 9
Residen / ResidentsBukanResidenNon-Residents
4 3 1 1 -5 4 1 - 9
Cap DagangTrademarks
1,268 1,142 1,092 934 932
Residen / ResidentsBukanResidenNon-Residents
102 76 99 126 139
1,166 1,066 993 808 793
Jumlah / Total 1,394 1,276 1,182 1,026 1,062
Sumber:PejabatHartaIntelekBruneiDarussalam,KementerianTenaga(TenagadanTenagaManusia)danPerindustrianSource : Brunei Darussalam Intellectual Property Office, Ministry of Energy (Energy and Manpower) and Industry
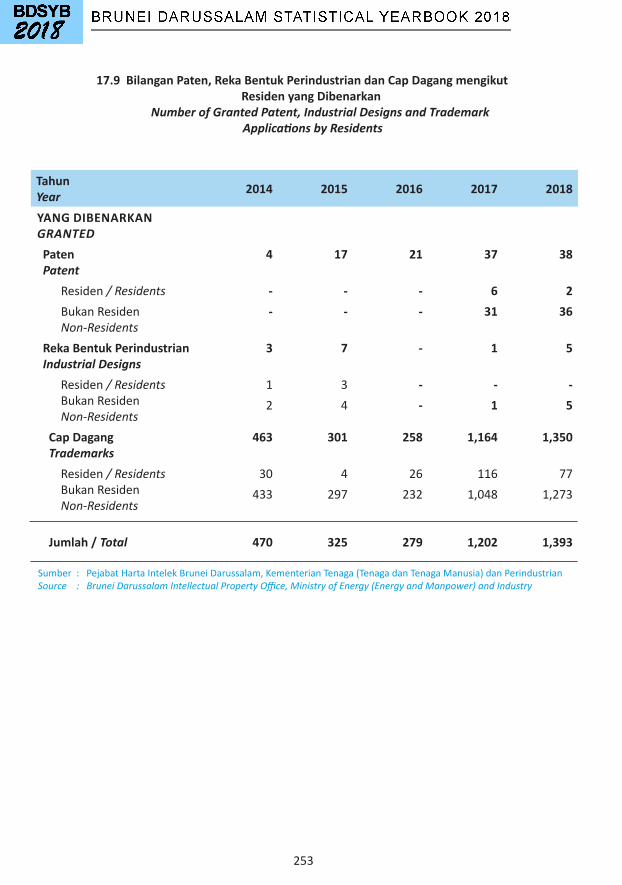
253
17.9 Bilangan Paten, Reka Bentuk Perindustrian dan Cap Dagang mengikut Residen yang Dibenarkan
Number of Granted Patent, Industrial Designs and Trademark Applications by Residents
TahunYear 2014 2015 2016 2017 2018
YANG DIBENARKANGRANTEDPatenPatent
4 17 21 37 38
Residen / Residents - - - 6 2 BukanResiden Non-Residents
- - - 31 36
Reka Bentuk PerindustrianIndustrial Designs
3 7 - 1 5
Residen / ResidentsBukanResidenNon-Residents
1 3 - - -2 4 - 1 5
Cap DagangTrademarks
463 301 258 1,164 1,350
Residen / ResidentsBukanResidenNon-Residents
30 4 26 116 77433 297 232 1,048 1,273
Jumlah / Total 470 325 279 1,202 1,393
Sumber:PejabatHartaIntelekBruneiDarussalam,KementerianTenaga(TenagadanTenagaManusia)danPerindustrianSource : Brunei Darussalam Intellectual Property Office, Ministry of Energy (Energy and Manpower) and Industry
254
PERTANIAN, PERHUTANAN DAN PERIKANAN AGRICULTURE, FORESTRY AND FISHERY
18
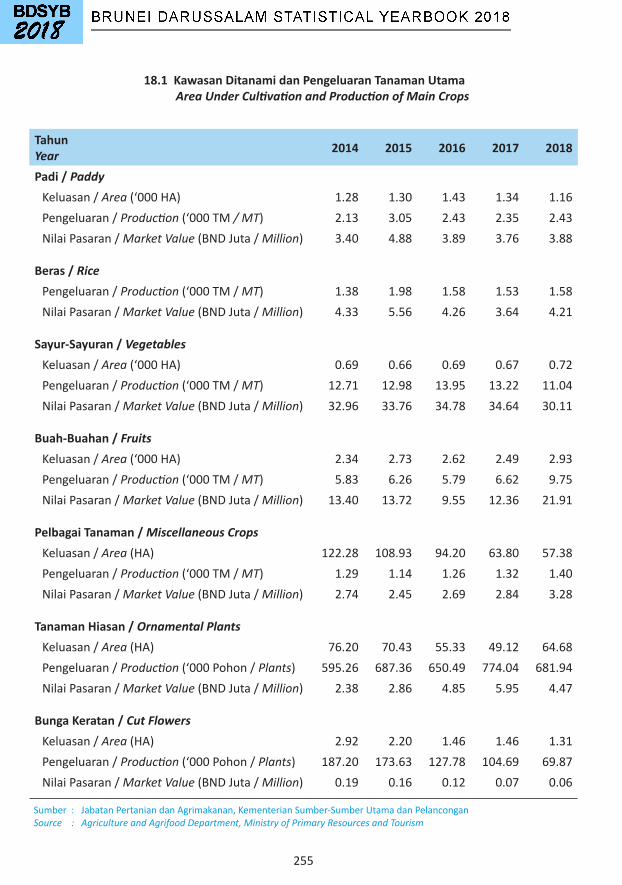
255
18.1 Kawasan Ditanami dan Pengeluaran Tanaman Utama Area Under Cultivation and Production of Main Crops
TahunYear 2014 2015 2016 2017 2018
Padi / PaddyKeluasan/Area(‘000HA) 1.28 1.30 1.43 1.34 1.16Pengeluaran/Production (‘000TM / MT) 2.13 3.05 2.43 2.35 2.43NilaiPasaran/Market Value(BNDJuta/Million) 3.40 4.88 3.89 3.76 3.88
Beras / RicePengeluaran/Production (‘000TM/MT) 1.38 1.98 1.58 1.53 1.58NilaiPasaran/Market Value(BNDJuta/Million) 4.33 5.56 4.26 3.64 4.21
Sayur-Sayuran / VegetablesKeluasan/Area(‘000HA) 0.69 0.66 0.69 0.67 0.72Pengeluaran/Production (‘000TM/MT) 12.71 12.98 13.95 13.22 11.04NilaiPasaran/Market Value(BNDJuta/Million) 32.96 33.76 34.78 34.64 30.11
Buah-Buahan / FruitsKeluasan/Area(‘000HA) 2.34 2.73 2.62 2.49 2.93Pengeluaran/Production (‘000TM/MT) 5.83 6.26 5.79 6.62 9.75NilaiPasaran/Market Value(BNDJuta/Million) 13.40 13.72 9.55 12.36 21.91
Pelbagai Tanaman / Miscellaneous CropsKeluasan/Area(HA) 122.28 108.93 94.20 63.80 57.38Pengeluaran/Production (‘000TM/MT) 1.29 1.14 1.26 1.32 1.40NilaiPasaran/Market Value(BNDJuta/Million) 2.74 2.45 2.69 2.84 3.28
Tanaman Hiasan / Ornamental PlantsKeluasan/Area(HA) 76.20 70.43 55.33 49.12 64.68Pengeluaran/Production(‘000Pohon/Plants) 595.26 687.36 650.49 774.04 681.94NilaiPasaran/Market Value(BNDJuta/Million) 2.38 2.86 4.85 5.95 4.47
Bunga Keratan / Cut FlowersKeluasan/Area(HA) 2.92 2.20 1.46 1.46 1.31Pengeluaran/Production(‘000Pohon/Plants) 187.20 173.63 127.78 104.69 69.87NilaiPasaran/Market Value(BNDJuta/Million) 0.19 0.16 0.12 0.07 0.06
Sumber:JabatanPertaniandanAgrimakanan,KementerianSumber-SumberUtamadanPelanconganSource : Agriculture and Agrifood Department, Ministry of Primary Resources and Tourism
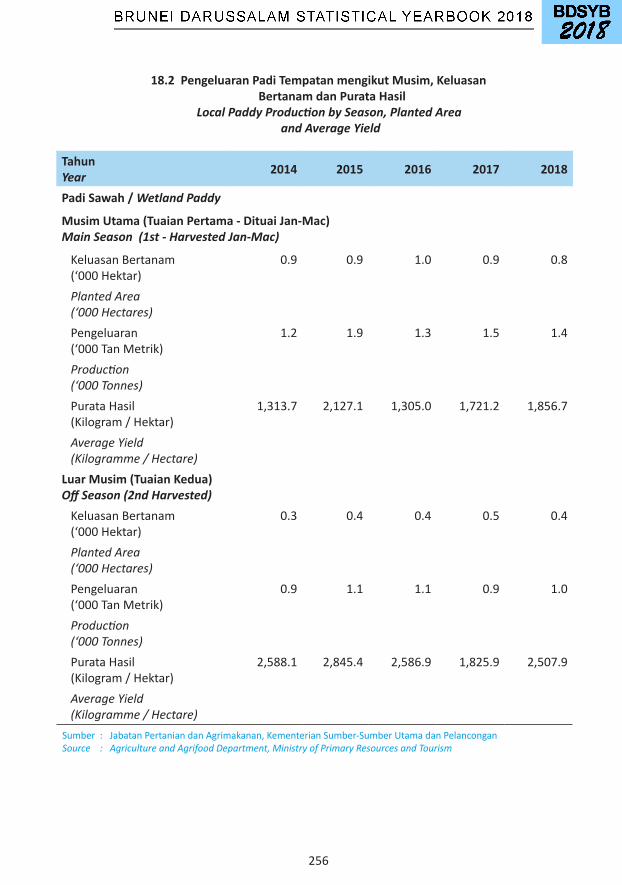
256
TahunYear 2014 2015 2016 2017 2018
Padi Sawah / Wetland Paddy
Musim Utama (Tuaian Pertama - Dituai Jan-Mac)Main Season (1st - Harvested Jan-Mac)
KeluasanBertanam(‘000Hektar)
0.9 0.9 1.0 0.9 0.8
Planted Area (‘000 Hectares)Pengeluaran(‘000TanMetrik)
1.2 1.9 1.3 1.5 1.4
Production (‘000 Tonnes)PurataHasil(Kilogram/Hektar)
1,313.7 2,127.1 1,305.0 1,721.2 1,856.7
Average Yield (Kilogramme / Hectare)Luar Musim (Tuaian Kedua) Off Season (2nd Harvested)KeluasanBertanam(‘000Hektar)
0.3 0.4 0.4 0.5 0.4
Planted Area (‘000 Hectares)Pengeluaran(‘000TanMetrik)
0.9 1.1 1.1 0.9 1.0
Production (‘000 Tonnes)PurataHasil(Kilogram/Hektar)
2,588.1 2,845.4 2,586.9 1,825.9 2,507.9
Average Yield (Kilogramme / Hectare)
18.2 Pengeluaran Padi Tempatan mengikut Musim, Keluasan Bertanam dan Purata Hasil
Local Paddy Production by Season, Planted Area and Average Yield
Sumber:JabatanPertaniandanAgrimakanan,KementerianSumber-SumberUtamadanPelanconganSource : Agriculture and Agrifood Department, Ministry of Primary Resources and Tourism
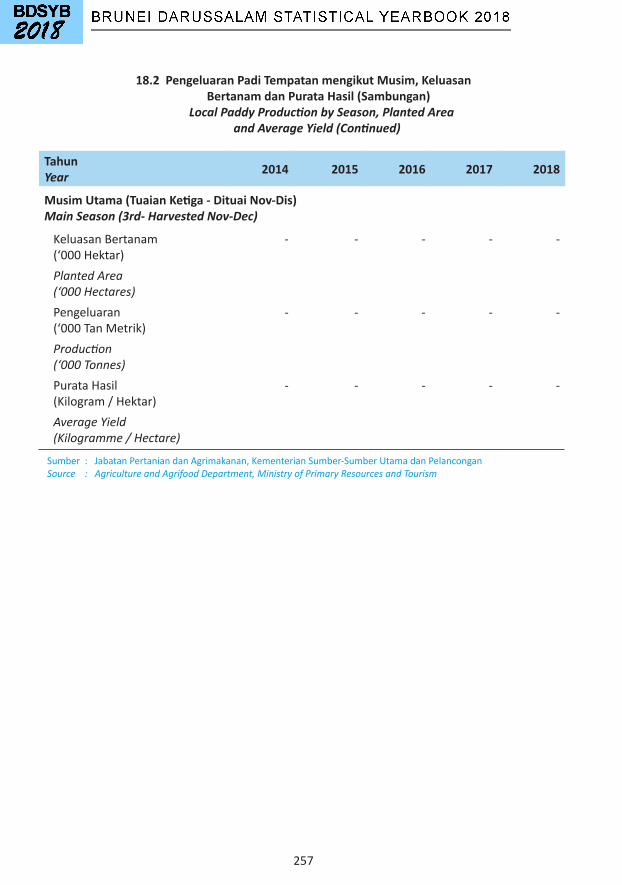
257
TahunYear 2014 2015 2016 2017 2018
Musim Utama (Tuaian Ketiga - Dituai Nov-Dis) Main Season (3rd- Harvested Nov-Dec)
KeluasanBertanam(‘000Hektar)
- - - - -
Planted Area (‘000 Hectares)Pengeluaran(‘000TanMetrik)
- - - - -
Production (‘000 Tonnes)PurataHasil(Kilogram/Hektar)
- - - - -
Average Yield (Kilogramme / Hectare)
18.2 Pengeluaran Padi Tempatan mengikut Musim, Keluasan Bertanam dan Purata Hasil (Sambungan)
Local Paddy Production by Season, Planted Area and Average Yield (Continued)
Sumber:JabatanPertaniandanAgrimakanan,KementerianSumber-SumberUtamadanPelanconganSource : Agriculture and Agrifood Department, Ministry of Primary Resources and Tourism
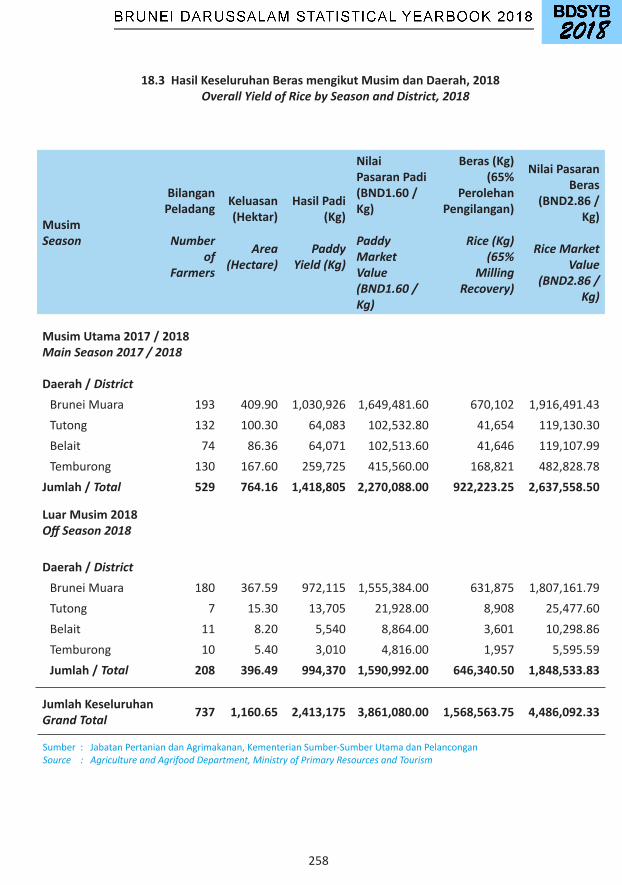
258
MusimSeason
Bilangan Peladang
Number of
Farmers
Keluasan (Hektar)
Area (Hectare)
Hasil Padi (Kg)
Paddy Yield (Kg)
Nilai Pasaran Padi (BND1.60 / Kg)
Paddy Market Value (BND1.60 / Kg)
Beras (Kg) (65%
Perolehan Pengilangan)
Rice (Kg)(65%
MillingRecovery)
Nilai Pasaran Beras
(BND2.86 / Kg)
Rice Market Value
(BND2.86 / Kg)
Musim Utama 2017 / 2018Main Season 2017 / 2018
Daerah / DistrictBruneiMuara 193 409.90 1,030,926 1,649,481.60 670,102 1,916,491.43Tutong 132 100.30 64,083 102,532.80 41,654 119,130.30Belait 74 86.36 64,071 102,513.60 41,646 119,107.99Temburong 130 167.60 259,725 415,560.00 168,821 482,828.78
Jumlah / Total 529 764.16 1,418,805 2,270,088.00 922,223.25 2,637,558.50
Luar Musim 2018Off Season 2018
Daerah / DistrictBruneiMuara 180 367.59 972,115 1,555,384.00 631,875 1,807,161.79Tutong 7 15.30 13,705 21,928.00 8,908 25,477.60Belait 11 8.20 5,540 8,864.00 3,601 10,298.86Temburong 10 5.40 3,010 4,816.00 1,957 5,595.59Jumlah / Total 208 396.49 994,370 1,590,992.00 646,340.50 1,848,533.83
Jumlah KeseluruhanGrand Total 737 1,160.65 2,413,175 3,861,080.00 1,568,563.75 4,486,092.33
18.3 Hasil Keseluruhan Beras mengikut Musim dan Daerah, 2018 Overall Yield of Rice by Season and District, 2018
Sumber:JabatanPertaniandanAgrimakanan,KementerianSumber-SumberUtamadanPelanconganSource : Agriculture and Agrifood Department, Ministry of Primary Resources and Tourism
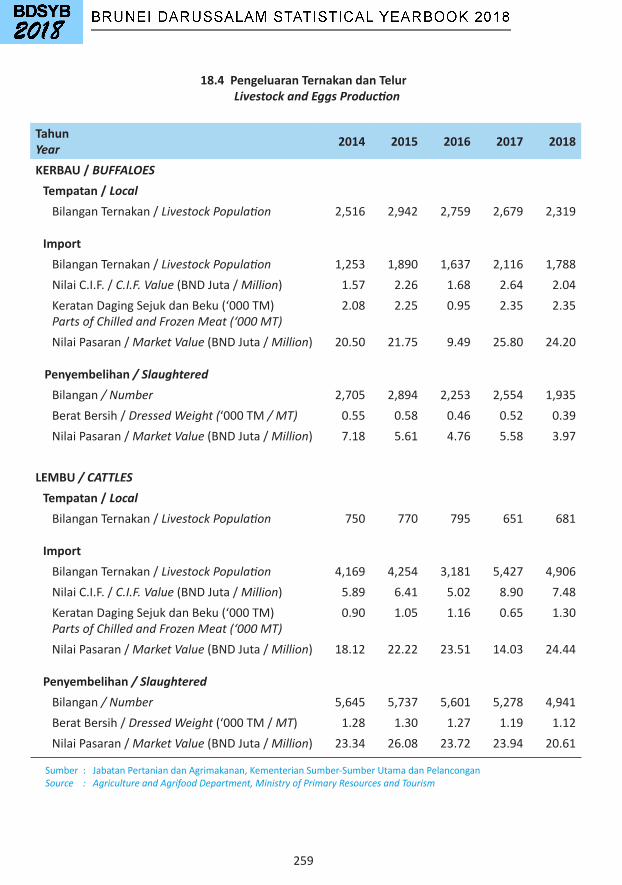
259
18.4 Pengeluaran Ternakan dan Telur Livestock and Eggs Production
TahunYear 2014 2015 2016 2017 2018
KERBAU / BUFFALOESTempatan / LocalBilanganTernakan/Livestock Population 2,516 2,942 2,759 2,679 2,319
Import BilanganTernakan/Livestock Population 1,253 1,890 1,637 2,116 1,788 NilaiC.I.F./C.I.F. Value(BNDJuta/Million) 1.57 2.26 1.68 2.64 2.04KeratanDagingSejukdanBeku(‘000TM) Parts of Chilled and Frozen Meat (‘000 MT)
2.08 2.25 0.95 2.35 2.35
NilaiPasaran/ Market Value (BNDJuta/Million) 20.50 21.75 9.49 25.80 24.20
Penyembelihan / SlaughteredBilangan/ Number 2,705 2,894 2,253 2,554 1,935BeratBersih/Dressed Weight (‘000 TM/ MT) 0.55 0.58 0.46 0.52 0.39NilaiPasaran/ Market Value (BNDJuta/Million) 7.18 5.61 4.76 5.58 3.97
LEMBU / CATTLESTempatan / LocalBilanganTernakan/ Livestock Population 750 770 795 651 681
ImportBilanganTernakan/ Livestock Population 4,169 4,254 3,181 5,427 4,906 NilaiC.I.F./C.I.F. Value(BNDJuta/Million) 5.89 6.41 5.02 8.90 7.48KeratanDagingSejukdanBeku(‘000TM) Parts of Chilled and Frozen Meat (‘000 MT)
0.90 1.05 1.16 0.65 1.30
NilaiPasaran/ Market Value (BNDJuta/Million) 18.12 22.22 23.51 14.03 24.44
Penyembelihan / Slaughtered Bilangan/ Number 5,645 5,737 5,601 5,278 4,941BeratBersih/Dressed Weight(‘000TM/MT) 1.28 1.30 1.27 1.19 1.12NilaiPasaran/ Market Value (BNDJuta/Million) 23.34 26.08 23.72 23.94 20.61
Sumber:JabatanPertaniandanAgrimakanan,KementerianSumber-SumberUtamadanPelanconganSource : Agriculture and Agrifood Department, Ministry of Primary Resources and Tourism

260
TahunYear 2014 2015 2016 2017 2018
KAMBING / GOATSTempatan / LocalBilanganTernakan/Livestock Population 6,769 7,283 8,770 8,689 6,102
Import BilanganTernakan/Livestock Population 343 2,884 338 306 60 NilaiC.I.F./C.I.F. Value(BNDJuta/Million) 0.12 1.02 0.09 0.03 0.02
Penyembelihan / SlaughteredBilangan/ Number 821 732 628 862 1,608BeratHidup/ Live Weight (TM/MT) 28.74 25.62 21.98 30.17 56.28NilaiPasaran/ Market Value (BNDJuta/Million) 0.43 0.38 0.33 0.45 0.84
AYAM PEDAGING / BROILER CHICKENSTempatan / LocalBilanganAnakAyamPedaging(Juta) Number of Day Old Chicks (Million)
16.84 16.66 16.68 15.72 16.11
NilaiPasaran/ Market Value (BNDJuta/Million) 18.52 19.99 20.01 18.86 19.34 DagingAyam/Chicken Meat (‘000TM/ MT) 23.93 23.26 24.45 23.28 25.39NilaiPasaran/ Market Value (BNDJuta/Million) 110.30 106.79 111.65 106.53 115.92
ImportBilanganAnakAyamPedaging(Juta) Number of Day Old Chicks (Million)
0.19 0.38 0.82 1.33 2.28
NilaiPasaran/ Market Value (BNDJuta/Million) 0.22 0.46 0.98 1.60 2.74
KeratanDagingSejukdanBeku(‘000TM) Parts of Chilled and Frozen Meat (‘000 MT)
0.29 1.40 1.07 1.61 2.99
NilaiPasaran/ Market Value (BNDJuta/Million) 1.43 6.12 4.56 4.58 14.79
Penyembelihan / Slaughtered Bilangan(Juta)/ Number (Million) 15.95 15.51 16.30 15.52 16.92
Sumber:JabatanPertaniandanAgrimakanan,KementerianSumber-SumberUtamadanPelanconganSource : Agriculture and Agrifood Department, Ministry of Primary Resources and Tourism
r r r r
r
r
r
r
r
r
r
r
18.4 Pengeluaran Ternakan dan Telur (Sambungan) Livestock and Eggs Production (Continued)
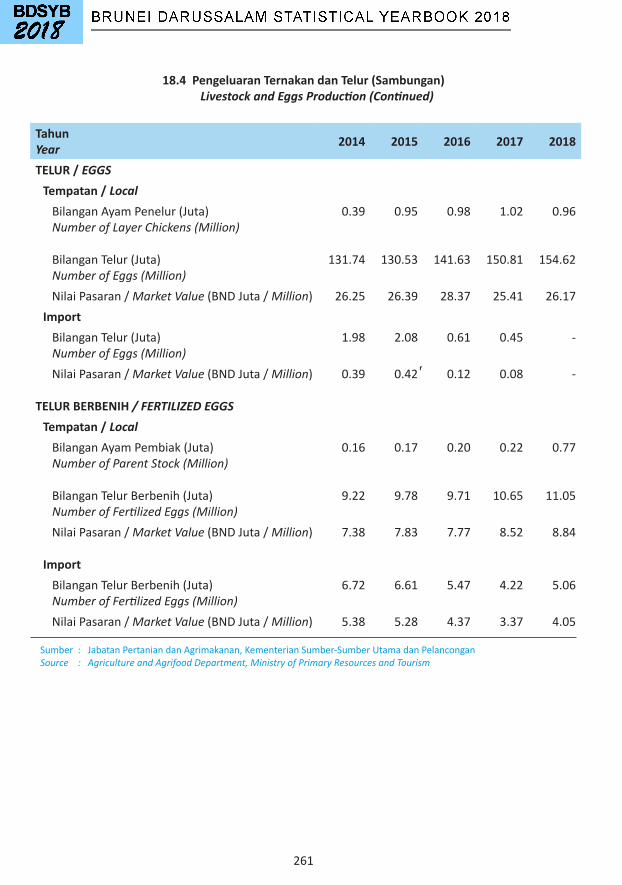
261
TahunYear 2014 2015 2016 2017 2018
TELUR / EGGSTempatan / LocalBilanganAyamPenelur(Juta) Number of Layer Chickens (Million)
0.39 0.95 0.98 1.02 0.96
BilanganTelur(Juta) Number of Eggs (Million)
131.74 130.53 141.63 150.81 154.62
NilaiPasaran/Market Value(BNDJuta/Million) 26.25 26.39 28.37 25.41 26.17Import BilanganTelur(Juta) Number of Eggs (Million)
1.98 2.08 0.61 0.45 -
NilaiPasaran/Market Value(BNDJuta/Million) 0.39 0.42 0.12 0.08 -
TELUR BERBENIH / FERTILIZED EGGSTempatan / LocalBilanganAyamPembiak(Juta) Number of Parent Stock (Million)
0.16 0.17 0.20 0.22 0.77
BilanganTelurBerbenih(Juta) Number of Fertilized Eggs (Million)
9.22 9.78 9.71 10.65 11.05
NilaiPasaran/Market Value(BNDJuta/Million) 7.38 7.83 7.77 8.52 8.84
ImportBilanganTelurBerbenih(Juta) Number of Fertilized Eggs (Million)
6.72 6.61 5.47 4.22 5.06
NilaiPasaran/Market Value(BNDJuta/Million) 5.38 5.28 4.37 3.37 4.05
Sumber:JabatanPertaniandanAgrimakanan,KementerianSumber-SumberUtamadanPelanconganSource : Agriculture and Agrifood Department, Ministry of Primary Resources and Tourism
18.4 Pengeluaran Ternakan dan Telur (Sambungan) Livestock and Eggs Production (Continued)
r
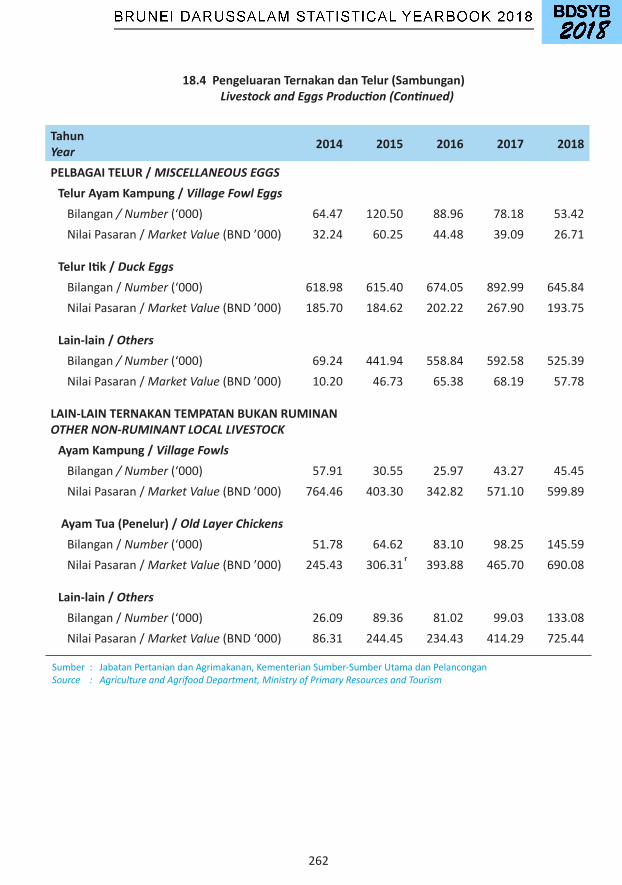
262
TahunYear 2014 2015 2016 2017 2018
PELBAGAI TELUR / MISCELLANEOUS EGGSTelur Ayam Kampung / Village Fowl EggsBilangan/ Number (‘000) 64.47 120.50 88.96 78.18 53.42NilaiPasaran/Market Value (BND’000) 32.24 60.25 44.48 39.09 26.71
Telur Itik / Duck EggsBilangan/Number (‘000) 618.98 615.40 674.05 892.99 645.84NilaiPasaran/Market Value(BND’000) 185.70 184.62 202.22 267.90 193.75
Lain-lain / Others Bilangan/ Number (‘000) 69.24 441.94 558.84 592.58 525.39NilaiPasaran/Market Value (BND’000) 10.20 46.73 65.38 68.19 57.78
LAIN-LAIN TERNAKAN TEMPATAN BUKAN RUMINANOTHER NON-RUMINANT LOCAL LIVESTOCK
Ayam Kampung / Village Fowls Bilangan/ Number (‘000) 57.91 30.55 25.97 43.27 45.45 NilaiPasaran/Market Value(BND’000) 764.46 403.30 342.82 571.10 599.89
Ayam Tua (Penelur) / Old Layer ChickensBilangan/Number (‘000) 51.78 64.62 83.10 98.25 145.59NilaiPasaran/Market Value(BND’000) 245.43 306.31 393.88 465.70 690.08
Lain-lain / Others Bilangan/Number (‘000) 26.09 89.36 81.02 99.03 133.08NilaiPasaran/Market Value(BND‘000) 86.31 244.45 234.43 414.29 725.44
Sumber:JabatanPertaniandanAgrimakanan,KementerianSumber-SumberUtamadanPelanconganSource : Agriculture and Agrifood Department, Ministry of Primary Resources and Tourism
18.4 Pengeluaran Ternakan dan Telur (Sambungan) Livestock and Eggs Production (Continued)
r

263
18.5 Pengeluaran Balak dan Keluaran-Keluaran Hutan Lain Production of Timber and Other Forestry Products
TahunYear 2014 2015 2016 2017 2018
KayuGergaji(Ribum3)Sawn Timber (Thousand m3)
44.1 37.8 42.2 30.6 30.8
Nilai/Value (BNDJuta/Million)
31.7 27.2 29.6 22.0 23.1
KayuBalakBulat(Ribum3)Round Timber (Thousand m3)
104.6 73.7 69.2 54.5 68.4
Nilai/Value (BNDJuta/Million)
17.8 12.5 11.8 9.3 11.6
BriketArang(TM)Charcoal Briquettes (MT)
5.5 162.0 494.3 648.6 379.1
Nilai/Value (BND‘000) 10.9 178.3 370.7 489.3 288.1ArangTradisional(TM)Traditional Charcoal (MT)
5.5 - - - -
Nilai/Value (BND‘000) 8.2 - - - -
ProdukHiliranBerasaskanKayu(m3)Wood Based Downstream Products (m3)
9.0 7.9 8.0 9.5 7.0
Nilai/Value (BNDJuta/Million)
4.4 4.2 3.8 5.6 6.7
KayuBakau(‘000Batang)Mangrove Poles (‘000 Pieces)
126.4 125.8 102.5 62.5 37.1
Nilai/Value (BNDJuta/Million)
1.0 1.0 0.8 0.5 0.3
KayuJaras(‘000Batang)Poles (‘000 Pieces)
34.2 31.6 38.9 38.3 9.3
Sumber:JabatanPerhutanan,KementerianSumber-SumberUtamadanPelanconganSource : Forestry Department, Ministry of Primary Resources and Tourism
r
r
r
r
r
r
r
r
r
r
r
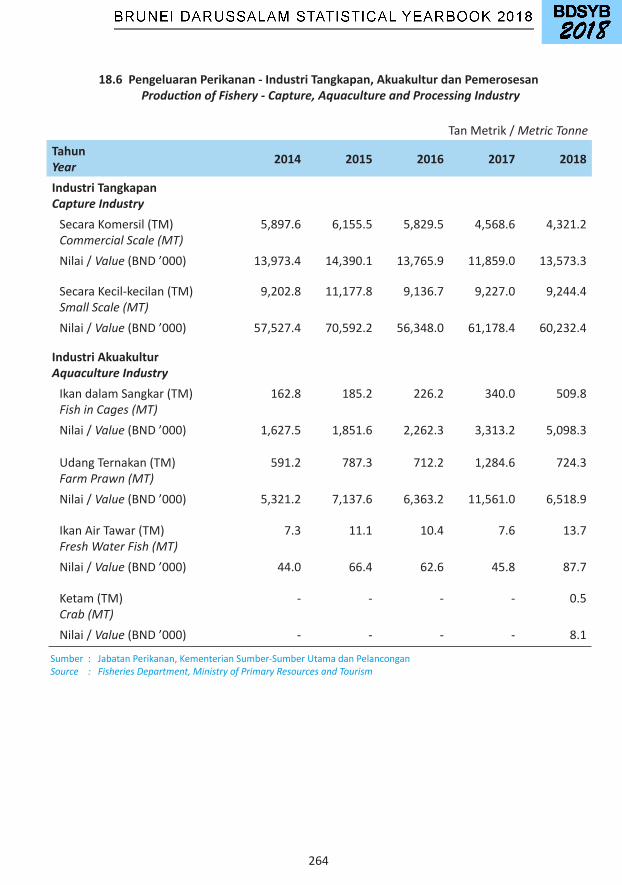
264
18.6 Pengeluaran Perikanan - Industri Tangkapan, Akuakultur dan Pemerosesan Production of Fishery - Capture, Aquaculture and Processing Industry
TahunYear 2014 2015 2016 2017 2018
Industri TangkapanCapture IndustrySecaraKomersil(TM)Commercial Scale (MT)
5,897.6 6,155.5 5,829.5 4,568.6 4,321.2
Nilai/ Value(BND’000) 13,973.4 14,390.1 13,765.9 11,859.0 13,573.3
SecaraKecil-kecilan(TM)Small Scale (MT)
9,202.8 11,177.8 9,136.7 9,227.0 9,244.4
Nilai/ Value(BND’000) 57,527.4 70,592.2 56,348.0 61,178.4 60,232.4
Industri AkuakulturAquaculture IndustryIkandalamSangkar(TM)Fish in Cages (MT)
162.8 185.2 226.2 340.0 509.8
Nilai/ Value(BND’000) 1,627.5 1,851.6 2,262.3 3,313.2 5,098.3
UdangTernakan(TM)Farm Prawn (MT)
591.2 787.3 712.2 1,284.6 724.3
Nilai/ Value(BND’000) 5,321.2 7,137.6 6,363.2 11,561.0 6,518.9
IkanAirTawar(TM)Fresh Water Fish (MT)
7.3 11.1 10.4 7.6 13.7
Nilai/ Value(BND’000) 44.0 66.4 62.6 45.8 87.7
Ketam(TM)Crab (MT)
- - - - 0.5
Nilai/ Value(BND’000) - - - - 8.1
TanMetrik/Metric Tonne
Sumber:JabatanPerikanan,KementerianSumber-SumberUtamadanPelanconganSource : Fisheries Department, Ministry of Primary Resources and Tourism

265
18.6 Pengeluaran Perikanan - Industri Tangkapan, Akuakultur dan Pemerosesan (Sambungan) Production of Fishery - Capture, Aquaculture and Processing Industry (Continued)
TahunYear 2014 2015 2016 2017 2018
Industri PemerosesanProcessing IndustryProdukBekuMakananLaut(TM) Frozen Seafood Product (MT)
903.1 1,176.7 909.6 2,329.7 2,319.6
Nilai/ Value(BND’000) 5,311.0 7,550.0 9,775.0 19,030.0 18,520.0
ProdukKeropokMakananLaut(TM) Seafood Crackers Product (MT)
51.6 62.0 61.0 55.3 48.3
Nilai/ Value(BND’000) 923.0 1,121.0 1,169.0 1,050.0 900.0
ProdukTambahNilaiKomersial(TM) Value Added Commercial Product (MT)
128.0 153.0 122.2 117.4 121.1
Nilai/ Value(BND’000) 876.0 1,015.0 961.0 920.0 1,030.0
ProdukKecil-kecilan(TM) Small Scale Product (MT)
87.8 98.6 18.5 19.2 29.4
Nilai/ Value(BND’000) 731.0 780.0 255.0 300.0 460.0
Lain-lainProduk(MT)Other Products (TM)
2,898.2 2,493.5 1,534.6 441.9 1,334.2
Nilai/ Value(BND’000) 6,361.0 5,360.0 3,169.0 890.0 1,030.0
Jumlah (TM) / Total (MT) 19,930.5 22,300.6 18,560.9 18,391.3 18,666.5Nilai / Value (BND ‘000) 92,695.4 109,863.9 94,130.9 110,147.2 107,458.7
TanMetrik/Metric Tonne
Sumber:JabatanPerikanan,KementerianSumber-SumberUtamadanPelanconganSource : Fisheries Department, Ministry of Primary Resources and Tourism
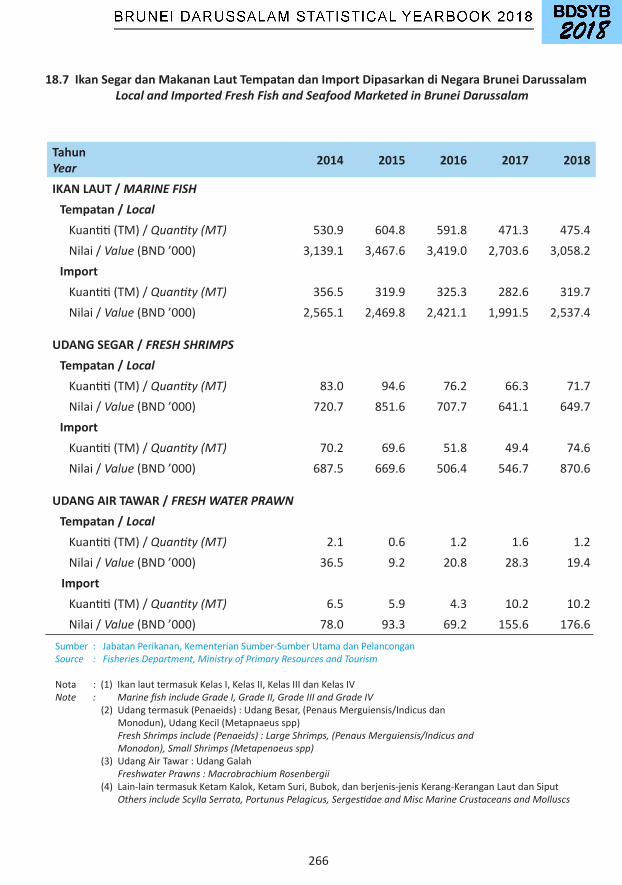
266
18.7 Ikan Segar dan Makanan Laut Tempatan dan Import Dipasarkan di Negara Brunei Darussalam Local and Imported Fresh Fish and Seafood Marketed in Brunei Darussalam
TahunYear 2014 2015 2016 2017 2018
IKAN LAUT / MARINE FISHTempatan / LocalKuantiti(TM)/Quantity (MT) 530.9 604.8 591.8 471.3 475.4Nilai/Value (BND’000) 3,139.1 3,467.6 3,419.0 2,703.6 3,058.2ImportKuantiti(TM)/Quantity (MT) 356.5 319.9 325.3 282.6 319.7Nilai/Value (BND’000) 2,565.1 2,469.8 2,421.1 1,991.5 2,537.4
UDANG SEGAR / FRESH SHRIMPSTempatan / LocalKuantiti(TM)/Quantity (MT) 83.0 94.6 76.2 66.3 71.7Nilai/Value (BND’000) 720.7 851.6 707.7 641.1 649.7ImportKuantiti(TM)/Quantity (MT) 70.2 69.6 51.8 49.4 74.6Nilai/Value (BND’000) 687.5 669.6 506.4 546.7 870.6
UDANG AIR TAWAR / FRESH WATER PRAWNTempatan / LocalKuantiti(TM)/Quantity (MT) 2.1 0.6 1.2 1.6 1.2Nilai/Value (BND’000) 36.5 9.2 20.8 28.3 19.4
Import Kuantiti(TM)/Quantity (MT) 6.5 5.9 4.3 10.2 10.2Nilai/Value (BND’000) 78.0 93.3 69.2 155.6 176.6Sumber:JabatanPerikanan,KementerianSumber-SumberUtamadanPelanconganSource : Fisheries Department, Ministry of Primary Resources and Tourism
Nota:(1)IkanlauttermasukKelasI,KelasII,KelasIIIdanKelasIVNote : Marine fish include Grade I, Grade II, Grade III and Grade IV (2)Udangtermasuk(Penaeids):UdangBesar,(PenausMerguiensis/IndicusdanMonodun),UdangKecil(Metapnaeusspp) Fresh Shrimps include (Penaeids) : Large Shrimps, (Penaus Merguiensis/Indicus and Monodon), Small Shrimps (Metapenaeus spp) (3)UdangAirTawar:UdangGalah Freshwater Prawns : Macrobrachium Rosenbergii (4)Lain-laintermasukKetamKalok,KetamSuri,Bubok,danberjenis-jenisKerang-KeranganLautdanSiput Others include Scylla Serrata, Portunus Pelagicus, Sergestidae and Misc Marine Crustaceans and Molluscs
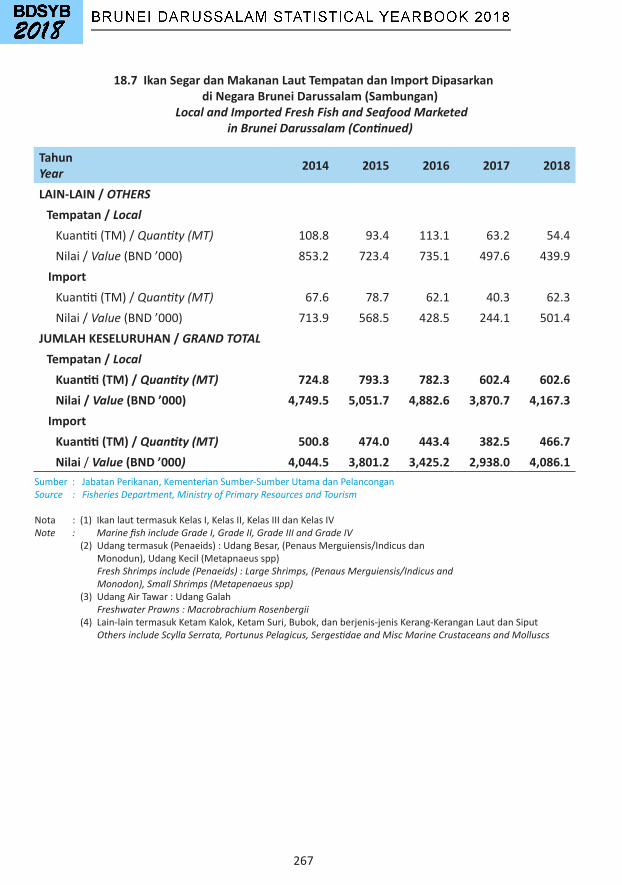
267
TahunYear 2014 2015 2016 2017 2018
LAIN-LAIN / OTHERSTempatan / LocalKuantiti(TM)/Quantity (MT) 108.8 93.4 113.1 63.2 54.4Nilai/Value (BND’000) 853.2 723.4 735.1 497.6 439.9
ImportKuantiti(TM)/Quantity (MT) 67.6 78.7 62.1 40.3 62.3Nilai/Value (BND’000) 713.9 568.5 428.5 244.1 501.4
JUMLAH KESELURUHAN / GRAND TOTALTempatan / Local Kuantiti (TM) / Quantity (MT) 724.8 793.3 782.3 602.4 602.6 Nilai / Value (BND ’000) 4,749.5 5,051.7 4,882.6 3,870.7 4,167.3
Import Kuantiti (TM) / Quantity (MT) 500.8 474.0 443.4 382.5 466.7 Nilai /Value (BND ’000) 4,044.5 3,801.2 3,425.2 2,938.0 4,086.1
Sumber:JabatanPerikanan,KementerianSumber-SumberUtamadanPelanconganSource : Fisheries Department, Ministry of Primary Resources and Tourism
Nota:(1)IkanlauttermasukKelasI,KelasII,KelasIIIdanKelasIVNote : Marine fish include Grade I, Grade II, Grade III and Grade IV (2)Udangtermasuk(Penaeids):UdangBesar,(PenausMerguiensis/IndicusdanMonodun),UdangKecil(Metapnaeusspp) Fresh Shrimps include (Penaeids) : Large Shrimps, (Penaus Merguiensis/Indicus and Monodon), Small Shrimps (Metapenaeus spp) (3)UdangAirTawar:UdangGalah Freshwater Prawns : Macrobrachium Rosenbergii (4)Lain-laintermasukKetamKalok,KetamSuri,Bubok,danberjenis-jenisKerang-KeranganLautdanSiput Others include Scylla Serrata, Portunus Pelagicus, Sergestidae and Misc Marine Crustaceans and Molluscs
18.7 Ikan Segar dan Makanan Laut Tempatan dan Import Dipasarkan di Negara Brunei Darussalam (Sambungan)
Local and Imported Fresh Fish and Seafood Marketed in Brunei Darussalam (Continued)
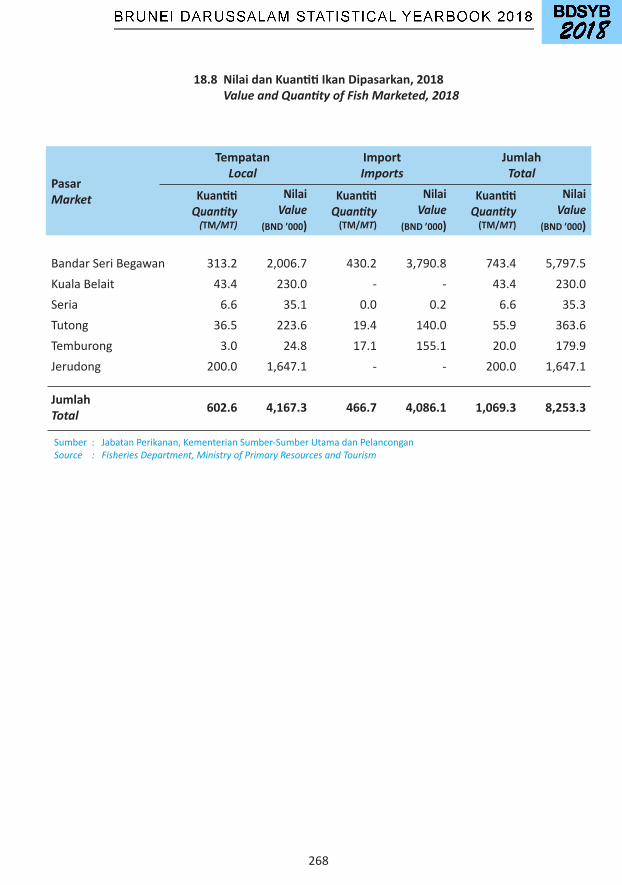
268
18.8 Nilai dan Kuantiti Ikan Dipasarkan, 2018 Value and Quantity of Fish Marketed, 2018
Sumber:JabatanPerikanan,KementerianSumber-SumberUtamadanPelanconganSource : Fisheries Department, Ministry of Primary Resources and Tourism
PasarMarket
TempatanLocal
ImportImports
JumlahTotal
KuantitiQuantity
(TM/MT)
Nilai Value
(BND ’000)
KuantitiQuantity
(TM/MT)
Nilai Value
(BND ’000)
KuantitiQuantity
(TM/MT)
Nilai Value
(BND ’000)
BandarSeriBegawan 313.2 2,006.7 430.2 3,790.8 743.4 5,797.5KualaBelait 43.4 230.0 - - 43.4 230.0Seria 6.6 35.1 0.0 0.2 6.6 35.3Tutong 36.5 223.6 19.4 140.0 55.9 363.6Temburong 3.0 24.8 17.1 155.1 20.0 179.9Jerudong 200.0 1,647.1 - - 200.0 1,647.1
Jumlah Total 602.6 4,167.3 466.7 4,086.1 1,069.3 8,253.3
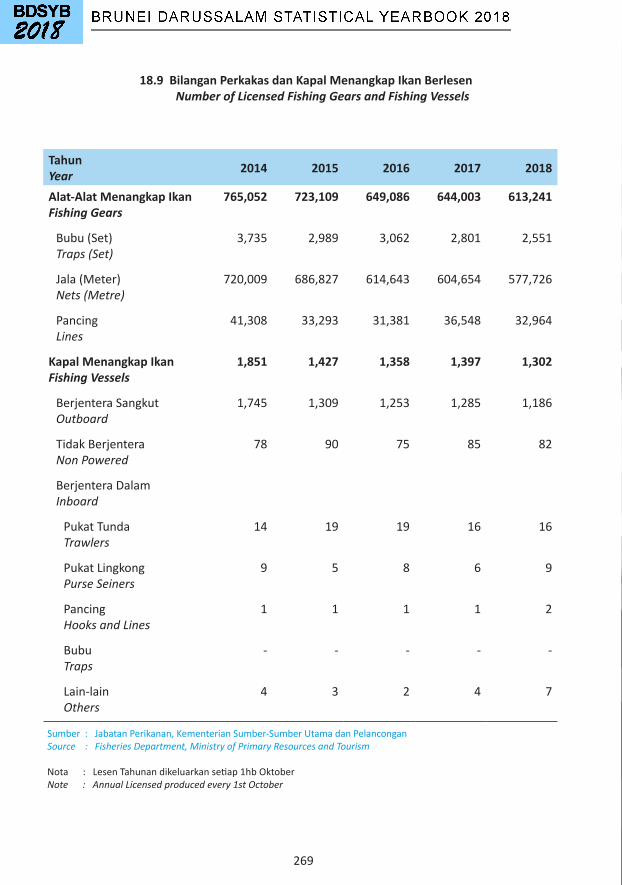
269
TahunYear 2014 2015 2016 2017 2018
Alat-Alat Menangkap IkanFishing Gears
765,052 723,109 649,086 644,003 613,241
Bubu(Set)Traps (Set)
3,735 2,989 3,062 2,801 2,551
Jala(Meter)Nets (Metre)
720,009 686,827 614,643 604,654 577,726
PancingLines
41,308 33,293 31,381 36,548 32,964
Kapal Menangkap IkanFishing Vessels
1,851 1,427 1,358 1,397 1,302
BerjenteraSangkutOutboard
1,745 1,309 1,253 1,285 1,186
TidakBerjenteraNon Powered
78 90 75 85 82
BerjenteraDalamInboard
PukatTundaTrawlers
14 19 19 16 16
PukatLingkongPurse Seiners
9 5 8 6 9
PancingHooks and Lines
1 1 1 1 2
BubuTraps
- - - - -
Lain-lainOthers
4 3 2 4 7
Sumber:JabatanPerikanan,KementerianSumber-SumberUtamadanPelanconganSource : Fisheries Department, Ministry of Primary Resources and Tourism
Nota:LesenTahunandikeluarkansetiap1hbOktoberNote : Annual Licensed produced every 1st October
18.9 Bilangan Perkakas dan Kapal Menangkap Ikan Berlesen Number of Licensed Fishing Gears and Fishing Vessels
270
19 PERLOMBONGANMINING

271
19.1 Pengeluaran Minyak, Eksport dan Kewajaran Harga Purata Oil Production, Export and Weighted Average Price
TahunYear 2014 2015 2016 2017 2018
Purata Pengeluaran Minyak (Kbbl/Hari)Average Oil Production(Kbbl / Day)
126.4 126.8 120.9 113.2 111.5
Purata Eksport Minyak (Kbbl/Hari)Average Oil Exports(Kbbl / Day)
117.6 120.5 114.9 108.8 100.9
Purata Harga Eksport Minyak (USD/Tong)Weighted Average Price of Oil Exports(USD / Barrel)
104.44 53.89 44.63 55.93 73.17
Sumber:KementerianTenaga(TenagadanTenagaManusia)danPerindustrianSource : Ministry of Energy (Energy and Manpower) and Industry
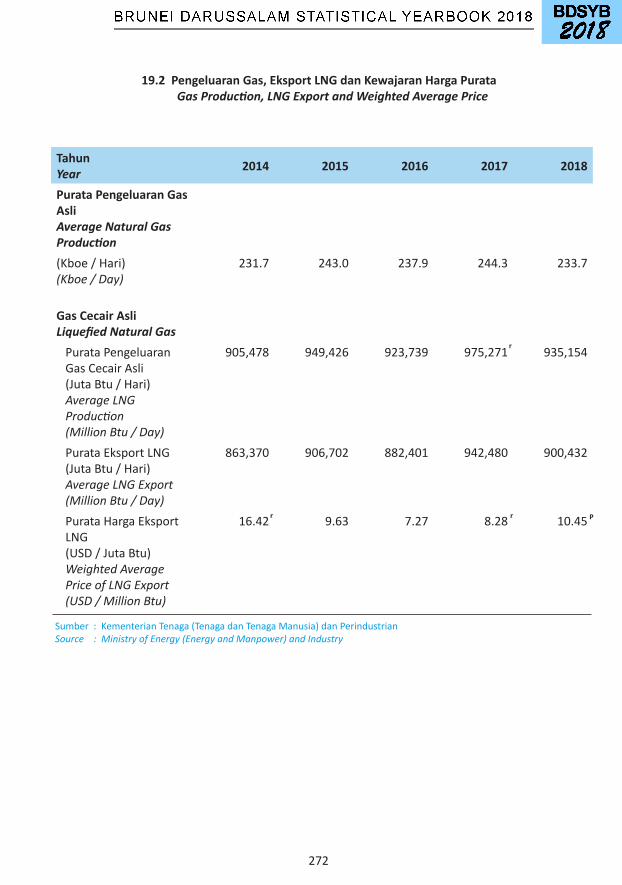
272
19.2 Pengeluaran Gas, Eksport LNG dan Kewajaran Harga Purata Gas Production, LNG Export and Weighted Average Price
TahunYear 2014 2015 2016 2017 2018
Purata Pengeluaran Gas AsliAverage Natural Gas Production(Kboe/Hari)(Kboe / Day)
231.7 243.0 237.9 244.3 233.7
Gas Cecair AsliLiquefied Natural GasPurataPengeluaranGasCecairAsli(JutaBtu/Hari) Average LNG Production (Million Btu / Day)
905,478 949,426 923,739 975,271 935,154
PurataEksportLNG(JutaBtu/Hari) Average LNG Export (Million Btu / Day)
863,370 906,702 882,401 942,480 900,432
PurataHargaEksportLNG(USD/JutaBtu) Weighted Average Price of LNG Export (USD / Million Btu)
16.42 9.63 7.27 8.28 10.45
Sumber:KementerianTenaga(TenagadanTenagaManusia)danPerindustrianSource : Ministry of Energy (Energy and Manpower) and Industry
r
r
r P
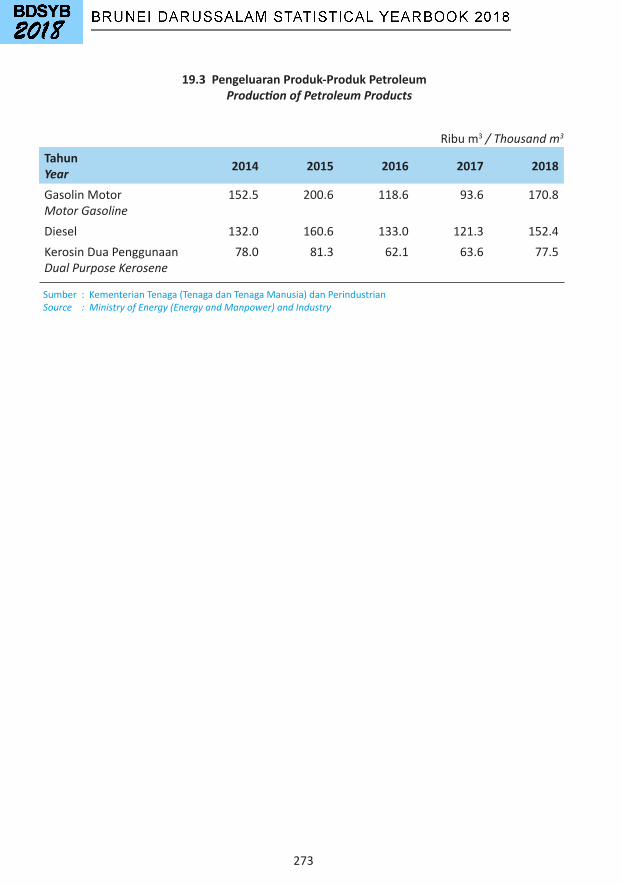
273
19.3 Pengeluaran Produk-Produk Petroleum Production of Petroleum Products
TahunYear 2014 2015 2016 2017 2018
GasolinMotorMotor Gasoline
152.5 200.6 118.6 93.6 170.8
Diesel 132.0 160.6 133.0 121.3 152.4KerosinDuaPenggunaanDual Purpose Kerosene
78.0 81.3 62.1 63.6 77.5
Ribum3 / Thousand m3
Sumber:KementerianTenaga(TenagadanTenagaManusia)danPerindustrianSource : Ministry of Energy (Energy and Manpower) and Industry
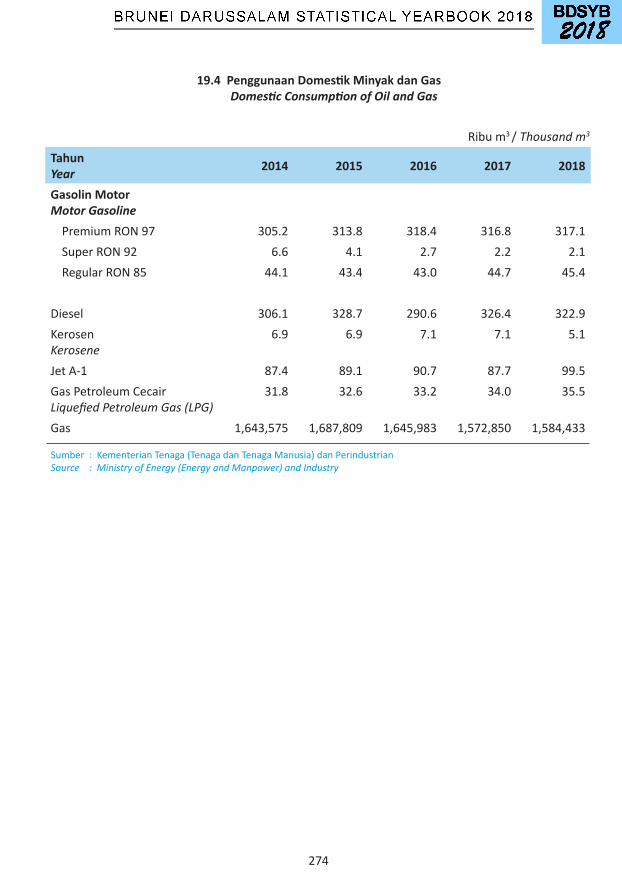
274
TahunYear 2014 2015 2016 2017 2018
Gasolin MotorMotor Gasoline PremiumRON97 305.2 313.8 318.4 316.8 317.1SuperRON92 6.6 4.1 2.7 2.2 2.1RegularRON85 44.1 43.4 43.0 44.7 45.4
Diesel 306.1 328.7 290.6 326.4 322.9KerosenKerosene
6.9 6.9 7.1 7.1 5.1
JetA-1 87.4 89.1 90.7 87.7 99.5GasPetroleumCecairLiquefied Petroleum Gas (LPG)
31.8 32.6 33.2 34.0 35.5
Gas 1,643,575 1,687,809 1,645,983 1,572,850 1,584,433
19.4 Penggunaan Domestik Minyak dan Gas Domestic Consumption of Oil and Gas
Ribum3 /Thousand m3
Sumber:KementerianTenaga(TenagadanTenagaManusia)danPerindustrianSource : Ministry of Energy (Energy and Manpower) and Industry
275
LOGISTIKLOGISTICS20
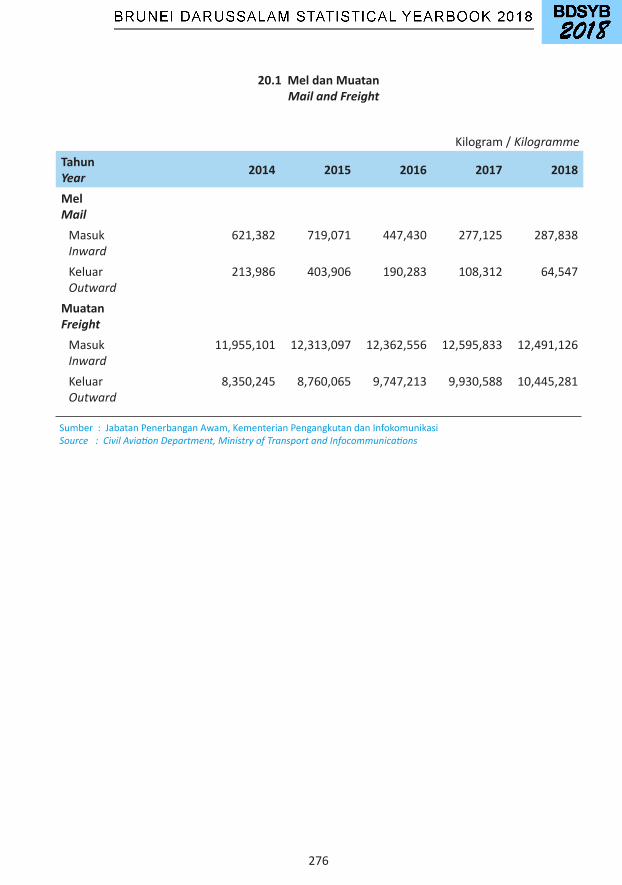
276
20.1 Mel dan Muatan Mail and Freight
TahunYear 2014 2015 2016 2017 2018
MelMailMasukInward
621,382 719,071 447,430 277,125 287,838
KeluarOutward
213,986 403,906 190,283 108,312 64,547
MuatanFreightMasukInward
11,955,101 12,313,097 12,362,556 12,595,833 12,491,126
KeluarOutward
8,350,245 8,760,065 9,747,213 9,930,588 10,445,281
Kilogram/ Kilogramme
Sumber:JabatanPenerbanganAwam,KementerianPengangkutandanInfokomunikasiSource : Civil Aviation Department, Ministry of Transport and Infocommunications

277
20.2 Pemunggahan dan Pengisian Kargo Pengangkutan Laut mengikut Negara Asal atau Destinasi
Seaborne Cargo Discharged and Loaded by Country of Origin or Destination
MuatanTan/Freight Tonne
Negeri Asal atau DestinasiCountry of Origin or Destination
2017 2018Punggah
DischargedMuat
LoadedPunggah
DischargedMuat
LoadedAustralia 12,172 652 6,913 970China 600,892 868 482,641 782HongKongSAR 32,185 137 76,363 3,588Indonesia 103,076 1,785 112,301 5,243Japan 67,791 42 43,046 62Rep.ofKorea 65,655 3,584 34,334 955Malaysia 383,533 6,431 341,866 15,239Philippines 9,321 1,284 20,488 1,023Singapore 178,361 20,009 303,848 27,656Taiwan 13,192 10 7,958 122Thailand 158,179 1,766 109,704 278VietNam 15,973 251 50,751 297Lain-lainNegeriOther Countries
186,929 8,416 152,698 17,343
JumlahTotal 1,827,259 45,235 1,742,911 73,558
Sumber:PihakBerkuasaMaritimdanPelabuhanBruneiDarussalam,KementerianPengangkutandanInfokomunikasiSource : Maritime and Port Authority of Brunei Darussalam, Ministry of Transport and Infocommunications
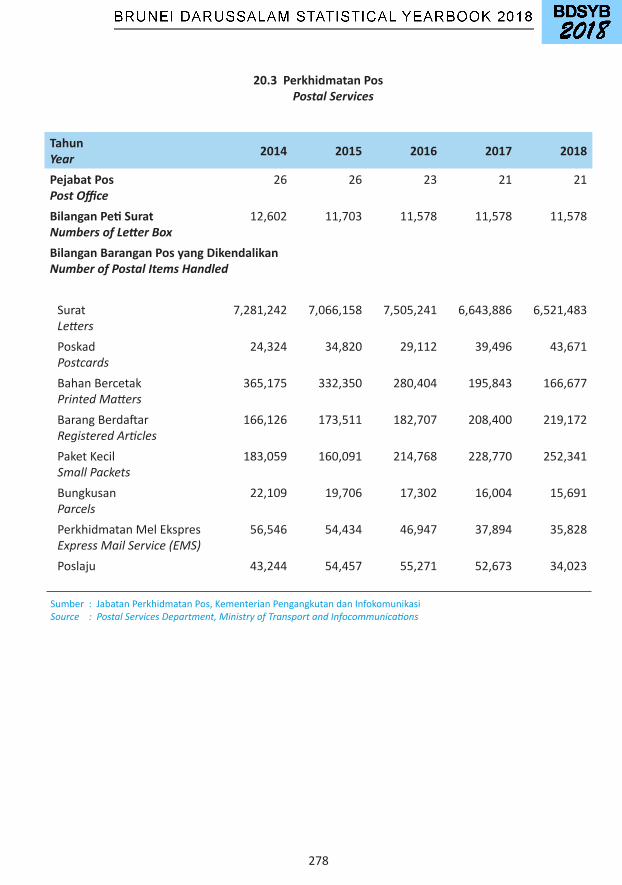
278
20.3 Perkhidmatan Pos Postal Services
TahunYear 2014 2015 2016 2017 2018
Pejabat PosPost Office
26 26 23 21 21
Bilangan Peti SuratNumbers of Letter Box
12,602 11,703 11,578 11,578 11,578
Bilangan Barangan Pos yang DikendalikanNumber of Postal Items Handled
SuratLetters
7,281,242 7,066,158 7,505,241 6,643,886 6,521,483
PoskadPostcards
24,324 34,820 29,112 39,496 43,671
BahanBercetakPrinted Matters
365,175 332,350 280,404 195,843 166,677
BarangBerdaftarRegistered Articles
166,126 173,511 182,707 208,400 219,172
PaketKecilSmall Packets
183,059 160,091 214,768 228,770 252,341
BungkusanParcels
22,109 19,706 17,302 16,004 15,691
PerkhidmatanMelEkspresExpress Mail Service (EMS)
56,546 54,434 46,947 37,894 35,828
Poslaju 43,244 54,457 55,271 52,673 34,023
Sumber:JabatanPerkhidmatanPos,KementerianPengangkutandanInfokomunikasiSource : Postal Services Department, Ministry of Transport and Infocommunications
279
21 ELEKTRIK DAN AIRELECTRICITY AND WATER
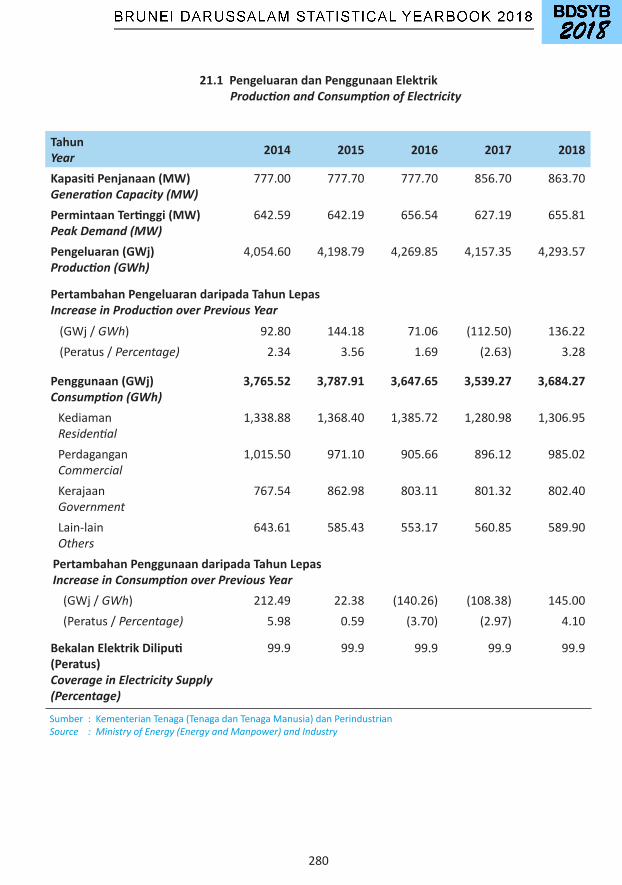
280
21.1 Pengeluaran dan Penggunaan Elektrik Production and Consumption of Electricity
TahunYear 2014 2015 2016 2017 2018
Kapasiti Penjanaan (MW)Generation Capacity (MW)
777.00 777.70 777.70 856.70 863.70
Permintaan Tertinggi (MW)Peak Demand (MW)
642.59 642.19 656.54 627.19 655.81
Pengeluaran (GWj)Production (GWh)
4,054.60 4,198.79 4,269.85 4,157.35 4,293.57
Pertambahan Pengeluaran daripada Tahun LepasIncrease in Production over Previous Year
(GWj/GWh) 92.80 144.18 71.06 (112.50) 136.22 (Peratus/Percentage) 2.34 3.56 1.69 (2.63) 3.28
Penggunaan (GWj)Consumption (GWh)
3,765.52 3,787.91 3,647.65 3,539.27 3,684.27
Kediaman Residential
1,338.88 1,368.40 1,385.72 1,280.98 1,306.95
PerdaganganCommercial
1,015.50 971.10 905.66 896.12 985.02
KerajaanGovernment
767.54 862.98 803.11 801.32 802.40
Lain-lainOthers
643.61 585.43 553.17 560.85 589.90
Pertambahan Penggunaan daripada Tahun LepasIncrease in Consumption over Previous Year(GWj/GWh) 212.49 22.38 (140.26) (108.38) 145.00(Peratus/Percentage) 5.98 0.59 (3.70) (2.97) 4.10
Bekalan Elektrik Diliputi(Peratus) Coverage in Electricity Supply (Percentage)
99.9 99.9 99.9 99.9 99.9
Sumber:KementerianTenaga(TenagadanTenagaManusia)danPerindustrianSource : Ministry of Energy (Energy and Manpower) and Industry

281
Sumber:JabatanPerkhidmatanAir,JabatanKerjaRayaSource : Department of Water Services, Public Works Department
21.2 Pengeluaran dan Penggunaan Air Production and Consumption of Water
TahunYear 2014 2015 2016 2017 2018
Pengeluaran Air (Ribu m3)Water Production (Thousand m3)
166,129.25 152,471.33 156,225.09 160,181.00 162,396.55
Penggunaan Air(Ribu m3)Water Consumption(Thousand m3)
90,342.62 87,718.74 85,061.02 80,142.02 79,899.26
DomestikDomestic
81,125.13 78,863.43 76,897.58 72,441.97 72,371.22
PerdaganganCommercial
9,217.49 8,855.31 8,163.44 7,700.05 7,528.04
Bilangan Meter AirNumber of Water Meters
95,902 100,633 104,173 107,329 109,062
Domestik Domestic
87,266 91,598 94,690 97,542 98,842
Perdagangan Commercial
8,636 9,035 9,483 9,787 10,220
Bilangan Penyambungan Air BaharuNumber of New Water Connection
4,122 4,731 3,540 3,156 1,733
TempatKediaman Residential
3,739 4,332 3,092 2,852 1,300
Perdagangan Commercial
383 399 448 304 433
Liputan Bekalan Air (Peratus)Coverage in Water Supply (Percentage)
99.9 99.9 99.9 99.9 99.9
282
22 PENGANGKUTAN DAN PERHUBUNGANTRANSPORT AND COMMUNICATION
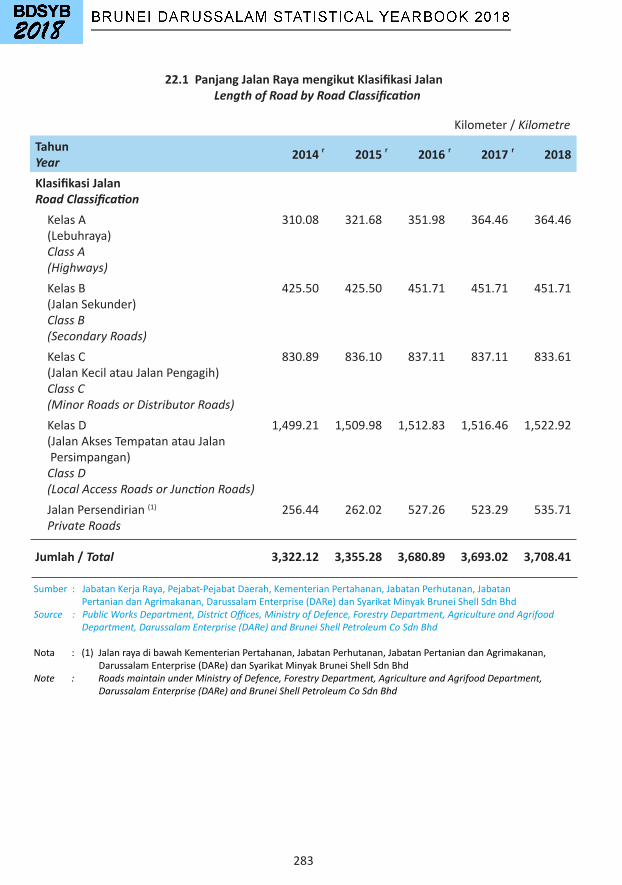
283
TahunYear 2014 2015 2016 2017 2018
Klasifikasi Jalan
Road ClassificationKelasA(Lebuhraya) Class A (Highways)
310.08 321.68 351.98 364.46 364.46
KelasB(JalanSekunder) Class B (Secondary Roads)
425.50 425.50 451.71 451.71 451.71
KelasC(JalanKecilatauJalanPengagih) Class C (Minor Roads or Distributor Roads)
830.89 836.10 837.11 837.11 833.61
KelasD(JalanAksesTempatanatauJalanPersimpangan) Class D (Local Access Roads or Junction Roads)
1,499.21 1,509.98 1,512.83 1,516.46 1,522.92
JalanPersendirian(1) Private Roads
256.44 262.02 527.26 523.29 535.71
Jumlah / Total 3,322.12 3,355.28 3,680.89 3,693.02 3,708.41
Kilometer/ Kilometre
22.1 Panjang Jalan Raya mengikut Klasifikasi Jalan Length of Road by Road Classification
Sumber:JabatanKerjaRaya,Pejabat-PejabatDaerah,KementerianPertahanan,JabatanPerhutanan,JabatanPertaniandanAgrimakanan,DarussalamEnterprise(DARe)danSyarikatMinyakBruneiShellSdnBhdSource : Public Works Department, District Offices, Ministry of Defence, Forestry Department, Agriculture and Agrifood Department, Darussalam Enterprise (DARe) and Brunei Shell Petroleum Co Sdn Bhd
Nota: (1)JalanrayadibawahKementerianPertahanan,JabatanPerhutanan,JabatanPertaniandanAgrimakanan,DarussalamEnterprise(DARe)danSyarikatMinyakBruneiShellSdnBhdNote : Roads maintain under Ministry of Defence, Forestry Department, Agriculture and Agrifood Department, Darussalam Enterprise (DARe) and Brunei Shell Petroleum Co Sdn Bhd
r r r r

284
TahunYear 2014 2015 2016 2017 2018
Jalan Berturap (1)
Paved Roads 3,016.52 3,043.65 3,196.88 3,212.79 3,220.16
BruneiMuara 1,667.83 1,691.64 1,673.33 1,688.95 1,695.81Belait 776.42 776.42 838.80 838.64 838.34Tutong 442.60 445.93 552.64 553.09 553.89Temburong 129.67 129.67 132.12 132.12 132.12
Jalan Tidak Berturap (2) 305.60 311.63 484.01 480.23 488.25Unpaved RoadsBruneiMuara 139.47 144.88 216.40 212.03 220.55Belait 59.33 59.84 87.66 88.70 84.70Tutong 71.90 71.90 117.04 116.59 120.09Temburong 34.90 35.01 62.91 62.91 62.91
Jumlah / Total 3,322.12 3,355.28 3,680.89 3,693.02 3,708.41
Kilometer/ Kilometre
Sumber:JabatanKerjaRaya,Pejabat-PejabatDaerah,KementerianPertahanan,JabatanPerhutanan,JabatanPertaniandanAgrimakanan,DarussalamEnterprise(DARe)danSyarikatMinyakBruneiShellSdnBhdSource : Public Works Department, District Offices, Ministry of Defence, Forestry Department, Agriculture and Agrifood Department, Darussalam Enterprise (DARe) and Brunei Shell Petroleum Co Sdn Bhd
Nota:Tidaktermasuklaluanberbasikal,berjalankakidanjalan-jalanyangditutupNote : Exclude cycling paths, walking paths and closed roads (1)Termasukjalanyangdiliputidenganaspal,konkrit,batu,bataataujubinbagipermukaanjalanyangkerasdanlancaruntukdipandu Include roads that has been covered with asphalt, concrete, stones, bricks or tiles to create hard smooth and flat surface to drive on(2)Termasukjalanyangdiliputidenganjalanbatukerikil,jalanbatuyangdihancurkandanjalantanahpadakebiasaannyatidaklancaruntukdipandu Include gravel roads, crushed stone roads and laterite road that usually not a smooth or flat surface to drive on
22.2 Panjang Jalan Raya mengikut Jenis Permukaan Length of Road by Surface Type
rrrr
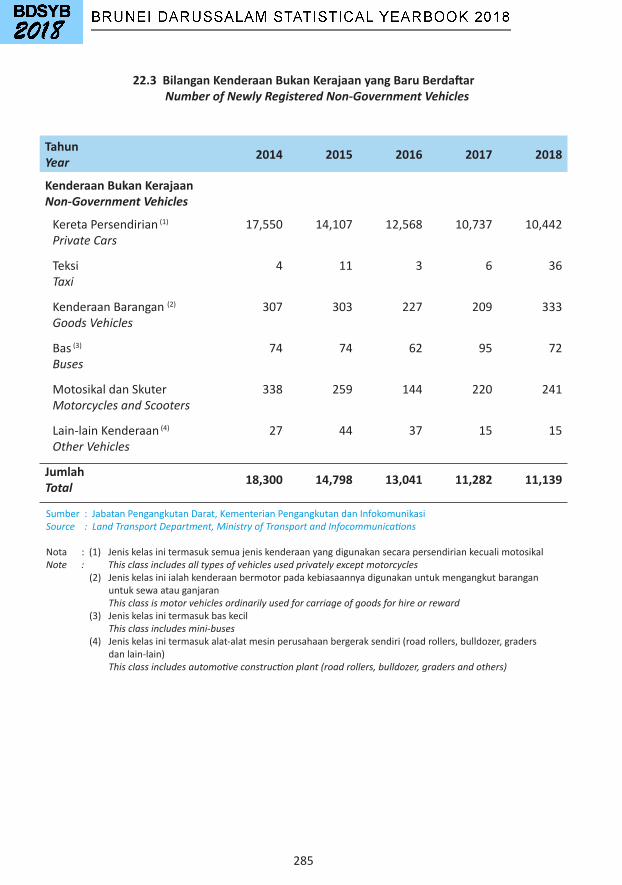
285
22.3 Bilangan Kenderaan Bukan Kerajaan yang Baru Berdaftar Number of Newly Registered Non-Government Vehicles
Sumber:JabatanPengangkutanDarat,KementerianPengangkutandanInfokomunikasiSource : Land Transport Department, Ministry of Transport and Infocommunications
Nota:(1)JeniskelasinitermasuksemuajeniskenderaanyangdigunakansecarapersendiriankecualimotosikalNote : This class includes all types of vehicles used privately except motorcycles (2)Jeniskelasiniialahkenderaanbermotorpadakebiasaannyadigunakanuntukmengangkutbaranganuntuksewaatauganjaran This class is motor vehicles ordinarily used for carriage of goods for hire or reward (3)Jeniskelasinitermasukbaskecil This class includes mini-buses(4)Jeniskelasinitermasukalat-alatmesinperusahaanbergeraksendiri(roadrollers,bulldozer,gradersdanlain-lain) This class includes automotive construction plant (road rollers, bulldozer, graders and others)
TahunYear 2014 2015 2016 2017 2018
Kenderaan Bukan KerajaanNon-Government Vehicles
KeretaPersendirian(1)
Private Cars17,550 14,107 12,568 10,737 10,442
TeksiTaxi
4 11 3 6 36
KenderaanBarangan(2)Goods Vehicles
307 303 227 209 333
Bas(3)Buses
74 74 62 95 72
MotosikaldanSkuterMotorcycles and Scooters
338 259 144 220 241
Lain-lainKenderaan(4)
Other Vehicles27 44 37 15 15
JumlahTotal 18,300 14,798 13,041 11,282 11,139

286
rr
22.4 Bilangan Kenderaan Kerajaan yang Baru Berdaftar Number of Newly Registered Government Vehicles
TahunYear 2014 2015 2016 2017 2018
Kenderaan KerajaanGovernment Vehicles
KeretaPersendirian(1)
Private Cars61 73 3 6 -
KenderaanBarangan(2)Goods Vehicles
17 13 1 2 1
Bas(3)Buses
6 3 - 1 -
MotosikaldanSkuterMotorcycles and Scooters
1 3 - 99 -
Lain-lainKenderaan(4)
Other Vehicles2 7 1 - -
JumlahTotal 87 99 5 108 1
Sumber:JabatanPengangkutanDarat,KementerianPengangkutandanInfokomunikasiSource : Land Transport Department, Ministry of Transport and Infocommunications
Nota:(1)JeniskelasinitermasuksemuajeniskenderaanyangdigunakansecarapersendiriankecualimotosikalNote : This class includes all types of vehicles used privately except motorcycles (2)Jeniskelasiniialahkenderaanbermotorpadakebiasaannyadigunakanuntukmengangkutbaranganuntuksewaatauganjaran This class is motor vehicles ordinarily used for carriage of goods for hire or reward (3)Jeniskelasinitermasukbaskecil This class includes mini-buses(4)Jeniskelasinitermasukalat-alatmesinperusahaanbergeraksendiri(roadrollers,bulldozer,gradersdanlain-lain) This class includes automotive construction plant (road rollers, bulldozer, graders and others)
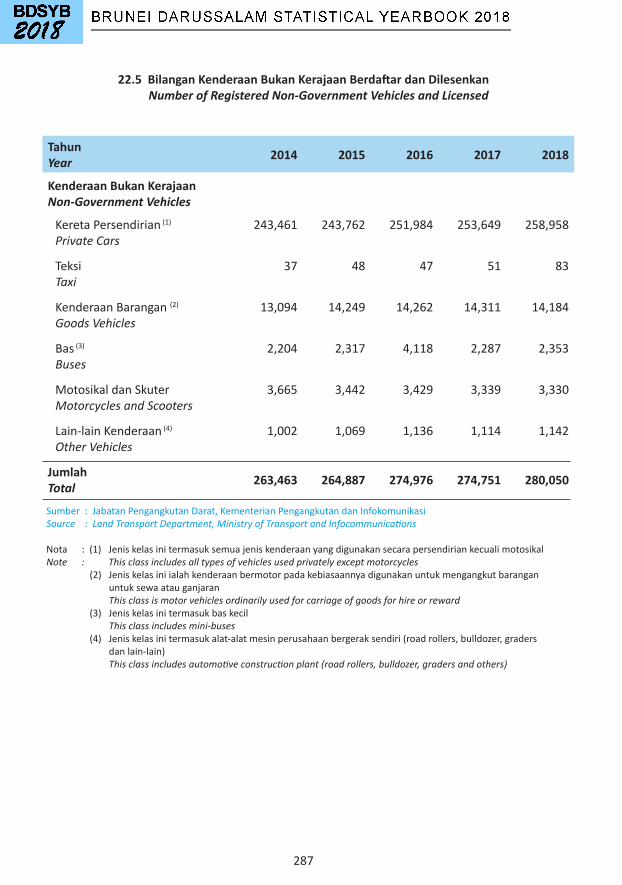
287
22.5 Bilangan Kenderaan Bukan Kerajaan Berdaftar dan Dilesenkan Number of Registered Non-Government Vehicles and Licensed
TahunYear 2014 2015 2016 2017 2018
Kenderaan Bukan KerajaanNon-Government Vehicles
KeretaPersendirian(1)
Private Cars243,461 243,762 251,984 253,649 258,958
TeksiTaxi
37 48 47 51 83
KenderaanBarangan(2)Goods Vehicles
13,094 14,249 14,262 14,311 14,184
Bas(3)Buses
2,204 2,317 4,118 2,287 2,353
MotosikaldanSkuterMotorcycles and Scooters
3,665 3,442 3,429 3,339 3,330
Lain-lainKenderaan(4)
Other Vehicles1,002 1,069 1,136 1,114 1,142
JumlahTotal 263,463 264,887 274,976 274,751 280,050
Sumber:JabatanPengangkutanDarat,KementerianPengangkutandanInfokomunikasiSource : Land Transport Department, Ministry of Transport and Infocommunications
Nota:(1)JeniskelasinitermasuksemuajeniskenderaanyangdigunakansecarapersendiriankecualimotosikalNote : This class includes all types of vehicles used privately except motorcycles (2)Jeniskelasiniialahkenderaanbermotorpadakebiasaannyadigunakanuntukmengangkutbaranganuntuksewaatauganjaran This class is motor vehicles ordinarily used for carriage of goods for hire or reward (3)Jeniskelasinitermasukbaskecil This class includes mini-buses(4)Jeniskelasinitermasukalat-alatmesinperusahaanbergeraksendiri(roadrollers,bulldozer,gradersdanlain-lain) This class includes automotive construction plant (road rollers, bulldozer, graders and others)
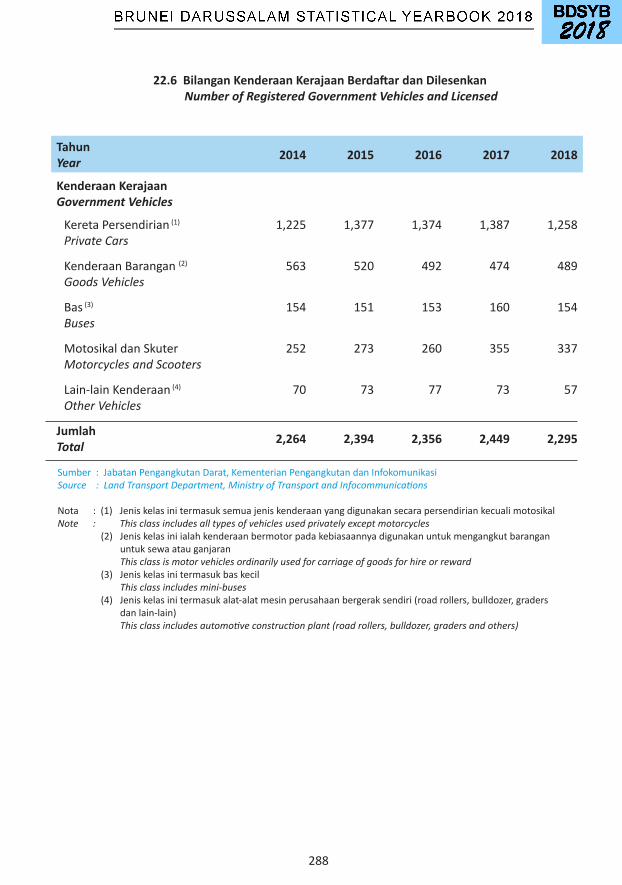
288
22.6 Bilangan Kenderaan Kerajaan Berdaftar dan Dilesenkan Number of Registered Government Vehicles and Licensed
TahunYear 2014 2015 2016 2017 2018
Kenderaan KerajaanGovernment Vehicles
KeretaPersendirian(1)
Private Cars1,225 1,377 1,374 1,387 1,258
KenderaanBarangan(2)Goods Vehicles
563 520 492 474 489
Bas(3)Buses
154 151 153 160 154
MotosikaldanSkuterMotorcycles and Scooters
252 273 260 355 337
Lain-lainKenderaan(4)
Other Vehicles70 73 77 73 57
JumlahTotal 2,264 2,394 2,356 2,449 2,295
Sumber:JabatanPengangkutanDarat,KementerianPengangkutandanInfokomunikasiSource : Land Transport Department, Ministry of Transport and Infocommunications
Nota:(1)JeniskelasinitermasuksemuajeniskenderaanyangdigunakansecarapersendiriankecualimotosikalNote : This class includes all types of vehicles used privately except motorcycles (2)Jeniskelasiniialahkenderaanbermotorpadakebiasaannyadigunakanuntukmengangkutbaranganuntuksewaatauganjaran This class is motor vehicles ordinarily used for carriage of goods for hire or reward (3)Jeniskelasinitermasukbaskecil This class includes mini-buses(4)Jeniskelasinitermasukalat-alatmesinperusahaanbergeraksendiri(roadrollers,bulldozer,gradersdanlain-lain) This class includes automotive construction plant (road rollers, bulldozer, graders and others)
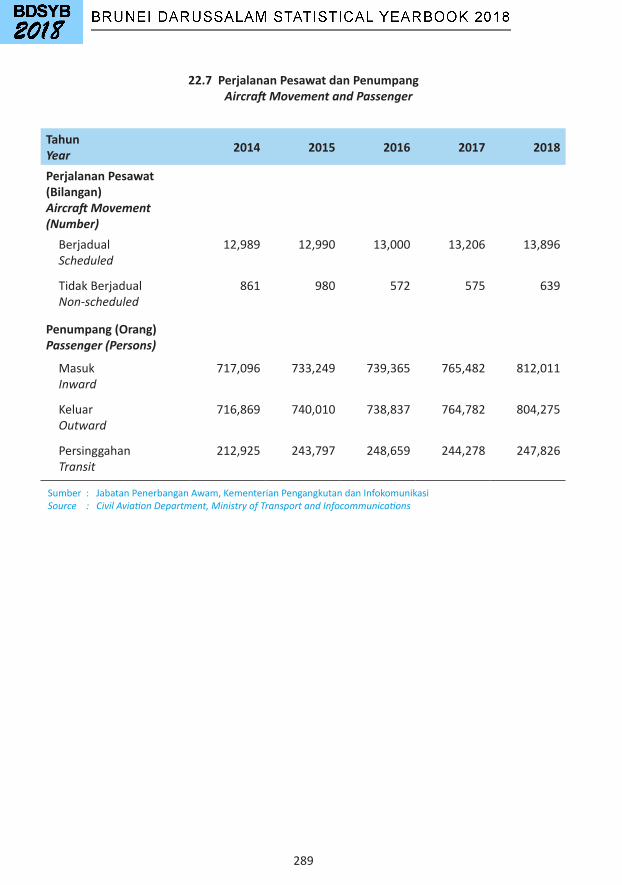
289
22.7 Perjalanan Pesawat dan Penumpang Aircraft Movement and Passenger
TahunYear 2014 2015 2016 2017 2018
Perjalanan Pesawat (Bilangan)Aircraft Movement (Number)BerjadualScheduled
12,989 12,990 13,000 13,206 13,896
TidakBerjadualNon-scheduled
861 980 572 575 639
Penumpang (Orang)Passenger (Persons)
MasukInward
717,096 733,249 739,365 765,482 812,011
KeluarOutward
716,869 740,010 738,837 764,782 804,275
PersinggahanTransit
212,925 243,797 248,659 244,278 247,826
Sumber:JabatanPenerbanganAwam,KementerianPengangkutandanInfokomunikasiSource : Civil Aviation Department, Ministry of Transport and Infocommunications
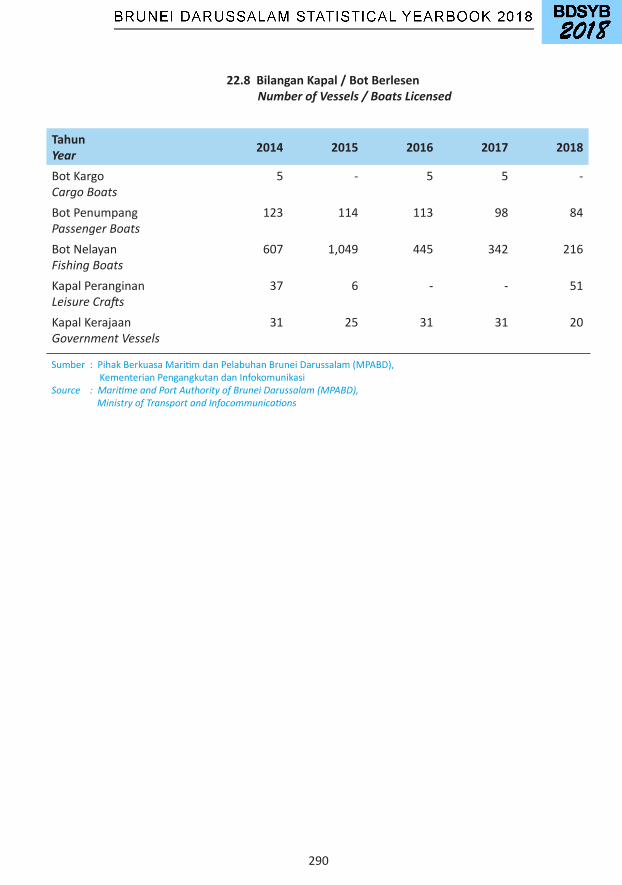
290
22.8 Bilangan Kapal / Bot Berlesen Number of Vessels / Boats Licensed
Sumber:PihakBerkuasaMaritimdanPelabuhanBruneiDarussalam(MPABD),KementerianPengangkutandanInfokomunikasiSource : Maritime and Port Authority of Brunei Darussalam (MPABD), Ministry of Transport and Infocommunications
TahunYear 2014 2015 2016 2017 2018
BotKargoCargo Boats
5 - 5 5 -
BotPenumpangPassenger Boats
123 114 113 98 84
BotNelayanFishing Boats
607 1,049 445 342 216
KapalPeranginanLeisure Crafts
37 6 - - 51
KapalKerajaanGovernment Vessels
31 25 31 31 20

291
22.9 Telekomunikasi Telecommunication
TahunYear 2014 2015 2016 2017 2018
Bilangan Talian Tetap ('000)Number of Fixed Lines ('000)
71.6 76.0 74.2 75.3 79.6
KepadatanTelefon(setiap100Penduduk)Teledensity (per 100 Population)
17.6 18.4 17.8 17.5 18.0
Trafik Tel. Antarabangsa (Juta Minit)International Tel. Traffic (Million Minutes)
4.9 3.5 2.7 1.8 1.4
Pelanggan Telefon BimbitMobile Subscribers
452,054 463,384 523,453 544,732 565,949
PosBerbayarPostpaid
75,658 78,161 96,599 111,287 137,328
PrabayarPrepaid
376,396 385,223 426,854 433,445 428,621
KadarPenembusanTelefonBimbit Mobile Penetration Rate
110.9 112.4 125.5 126.8 127.9
Sumber:PihakBerkuasaIndustriTeknologiInfo-KomunikasiNegaraBruneiDarussalam(AITI),KementerianPengangkutandanInfokomunikasidanTelekomBruneiBerhad(telbru)Source : Authority for Info-Communications Technology Industry of Brunei Darussalam (AITI), Ministry of Transport and Infocommunications and Telekom Brunei Berhad (telbru)
r
r
r
r
r
r
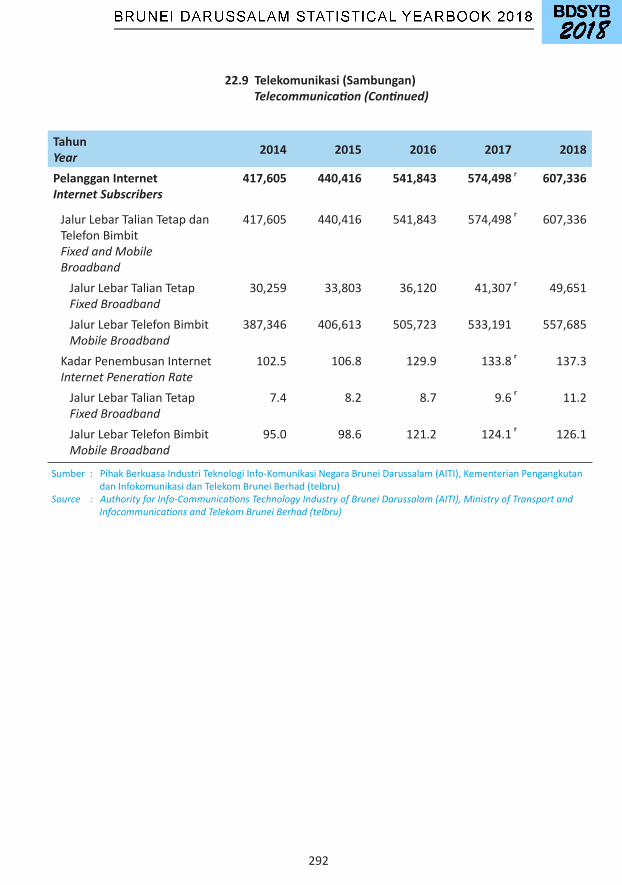
292
22.9 Telekomunikasi (Sambungan) Telecommunication (Continued)
TahunYear 2014 2015 2016 2017 2018
Pelanggan InternetInternet Subscribers
417,605 440,416 541,843 574,498 607,336
JalurLebarTalianTetapdanTelefonBimbitFixed and Mobile Broadband
417,605 440,416 541,843 574,498 607,336
JalurLebarTalianTetap Fixed Broadband
30,259 33,803 36,120 41,307 49,651
JalurLebarTelefonBimbit Mobile Broadband
387,346 406,613 505,723 533,191 557,685
KadarPenembusanInternetInternet Peneration Rate
102.5 106.8 129.9 133.8 137.3
JalurLebarTalianTetap Fixed Broadband
7.4 8.2 8.7 9.6 11.2
JalurLebarTelefonBimbit Mobile Broadband
95.0 98.6 121.2 124.1 126.1
Sumber:PihakBerkuasaIndustriTeknologiInfo-KomunikasiNegaraBruneiDarussalam(AITI),KementerianPengangkutandanInfokomunikasidanTelekomBruneiBerhad(telbru)Source : Authority for Info-Communications Technology Industry of Brunei Darussalam (AITI), Ministry of Transport and Infocommunications and Telekom Brunei Berhad (telbru)
r
r
r
r
r
r

293
22.10 Orang Keluar dan Masuk Negara Brunei Darussalam Persons Entering and Leaving Brunei Darussalam
BulanMonth
2017 2018Jumlah Masuk Keluar Jumlah Masuk Keluar
Total Inward Outward Total Inward OutwardJanuariJanuary
1,434,592 728,476 706,116 1,349,121 680,835 668,286
FebruariFebruary
1,077,984 540,461 537,523 1,236,294 616,334 619,960
MacMarch
1,418,034 699,809 718,225 1,490,857 738,404 752,453
AprilApril
1,194,142 597,490 596,652 1,201,601 609,746 591,855
MeiMay
1,233,478 618,607 614,871 1,242,445 613,078 629,367
JunJune
1,381,518 692,748 688,770 1,652,703 823,475 829,228
JulaiJuly
1,225,205 616,387 608,818 1,226,626 612,472 614,154
OgosAugust
1,182,509 591,079 591,430 1,350,334 676,677 673,657
SeptemberSeptember
1,283,432 643,812 639,620 1,473,327 739,537 733,790
OktoberOctober
1,099,374 552,439 546,935 1,185,077 592,810 592,267
NovemberNovember
1,172,095 583,991 588,104 1,356,809 674,041 682,768
DisemberDecember
1,899,377 934,567 964,810 2,114,164 1,051,096 1,063,068
JumlahTotal 15,601,740 7,799,866 7,801,874 16,879,358 8,428,505 8,450,853
Sumber:JabatanImigresendanPendaftaranKebangsaan,KementerianHalEhwalDalamNegeriSource : Immigration and National Registration Department, Ministry of Home Affairs
Orang/ Person
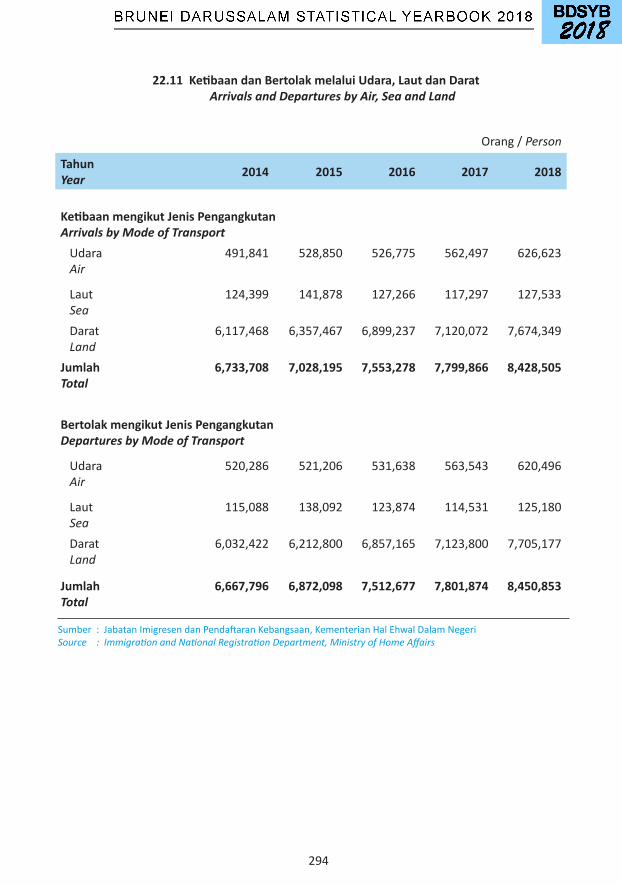
294
TahunYear 2014 2015 2016 2017 2018
Ketibaan mengikut Jenis PengangkutanArrivals by Mode of TransportUdara Air
491,841 528,850 526,775 562,497 626,623
Laut Sea
124,399 141,878 127,266 117,297 127,533
Darat Land
6,117,468 6,357,467 6,899,237 7,120,072 7,674,349
JumlahTotal
6,733,708 7,028,195 7,553,278 7,799,866 8,428,505
Bertolak mengikut Jenis PengangkutanDepartures by Mode of Transport
Udara Air
520,286 521,206 531,638 563,543 620,496
Laut Sea
115,088 138,092 123,874 114,531 125,180
Darat Land
6,032,422 6,212,800 6,857,165 7,123,800 7,705,177
JumlahTotal
6,667,796 6,872,098 7,512,677 7,801,874 8,450,853
Sumber:JabatanImigresendanPendaftaranKebangsaan,KementerianHalEhwalDalamNegeriSource : Immigration and National Registration Department, Ministry of Home Affairs
22.11 Ketibaan dan Bertolak melalui Udara, Laut dan Darat Arrivals and Departures by Air, Sea and Land
Orang/ Person
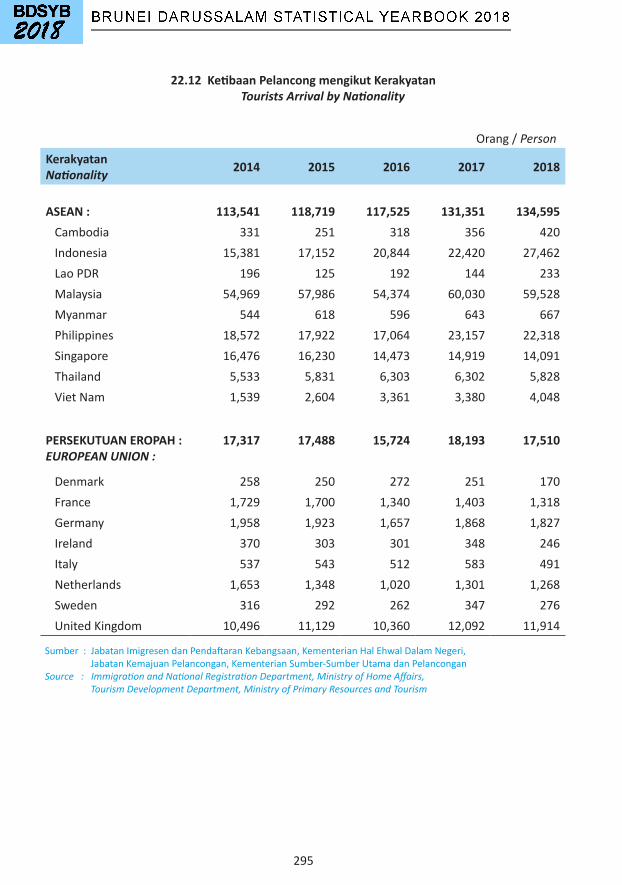
295
22.12 Ketibaan Pelancong mengikut Kerakyatan Tourists Arrival by Nationality
KerakyatanNationality 2014 2015 2016 2017 2018
ASEAN : 113,541 118,719 117,525 131,351 134,595Cambodia 331 251 318 356 420Indonesia 15,381 17,152 20,844 22,420 27,462LaoPDR 196 125 192 144 233Malaysia 54,969 57,986 54,374 60,030 59,528Myanmar 544 618 596 643 667Philippines 18,572 17,922 17,064 23,157 22,318Singapore 16,476 16,230 14,473 14,919 14,091Thailand 5,533 5,831 6,303 6,302 5,828VietNam 1,539 2,604 3,361 3,380 4,048
PERSEKUTUAN EROPAH :EUROPEAN UNION :
17,317 17,488 15,724 18,193 17,510
Denmark 258 250 272 251 170France 1,729 1,700 1,340 1,403 1,318Germany 1,958 1,923 1,657 1,868 1,827Ireland 370 303 301 348 246Italy 537 543 512 583 491Netherlands 1,653 1,348 1,020 1,301 1,268Sweden 316 292 262 347 276UnitedKingdom 10,496 11,129 10,360 12,092 11,914
Orang/ Person
Sumber:JabatanImigresendanPendaftaranKebangsaan,KementerianHalEhwalDalamNegeri, JabatanKemajuanPelancongan,KementerianSumber-SumberUtamadanPelanconganSource : Immigration and National Registration Department, Ministry of Home Affairs, Tourism Development Department, Ministry of Primary Resources and Tourism
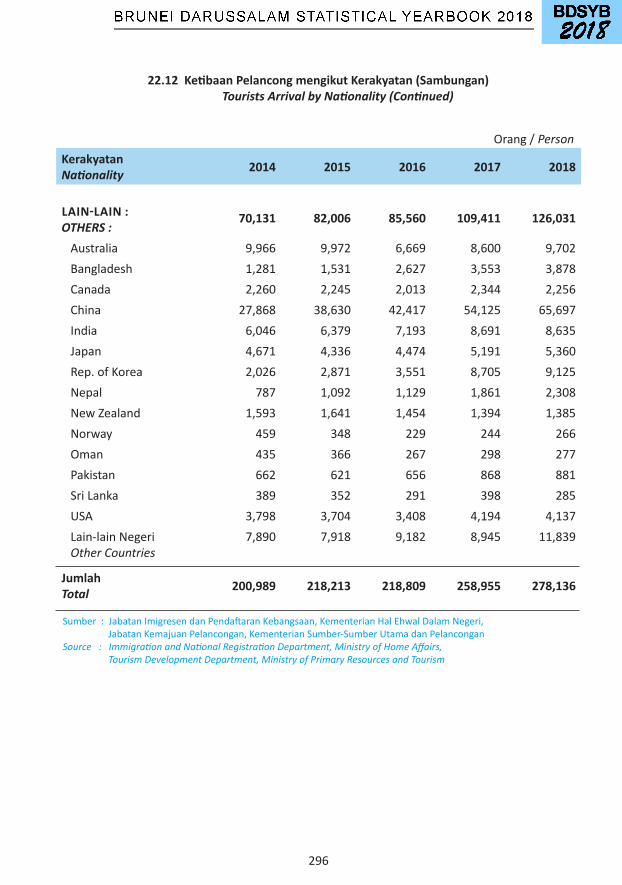
296
22.12 Ketibaan Pelancong mengikut Kerakyatan (Sambungan) Tourists Arrival by Nationality (Continued)
KerakyatanNationality 2014 2015 2016 2017 2018
LAIN-LAIN :OTHERS :
70,131 82,006 85,560 109,411 126,031
Australia 9,966 9,972 6,669 8,600 9,702Bangladesh 1,281 1,531 2,627 3,553 3,878Canada 2,260 2,245 2,013 2,344 2,256China 27,868 38,630 42,417 54,125 65,697India 6,046 6,379 7,193 8,691 8,635Japan 4,671 4,336 4,474 5,191 5,360Rep.ofKorea 2,026 2,871 3,551 8,705 9,125Nepal 787 1,092 1,129 1,861 2,308NewZealand 1,593 1,641 1,454 1,394 1,385Norway 459 348 229 244 266Oman 435 366 267 298 277Pakistan 662 621 656 868 881SriLanka 389 352 291 398 285USA 3,798 3,704 3,408 4,194 4,137Lain-lainNegeri Other Countries
7,890 7,918 9,182 8,945 11,839
JumlahTotal 200,989 218,213 218,809 258,955 278,136
Orang/ Person
Sumber:JabatanImigresendanPendaftaranKebangsaan,KementerianHalEhwalDalamNegeri, JabatanKemajuanPelancongan,KementerianSumber-SumberUtamadanPelanconganSource : Immigration and National Registration Department, Ministry of Home Affairs, Tourism Development Department, Ministry of Primary Resources and Tourism
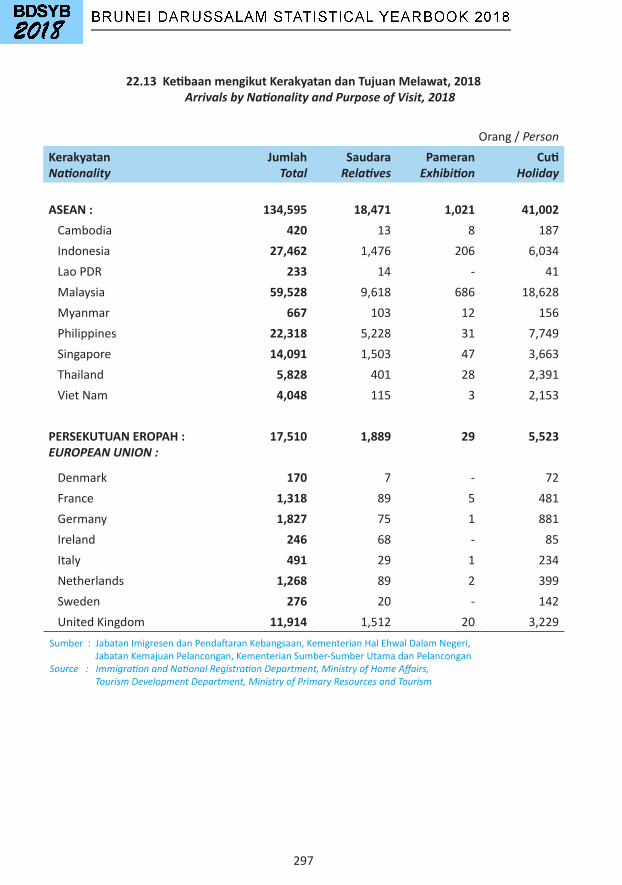
297
22.13 Ketibaan mengikut Kerakyatan dan Tujuan Melawat, 2018 Arrivals by Nationality and Purpose of Visit, 2018
Orang/PersonKerakyatanNationality
JumlahTotal
SaudaraRelatives
PameranExhibition
CutiHoliday
ASEAN : 134,595 18,471 1,021 41,002 Cambodia 420 13 8 187Indonesia 27,462 1,476 206 6,034LaoPDR 233 14 - 41Malaysia 59,528 9,618 686 18,628Myanmar 667 103 12 156Philippines 22,318 5,228 31 7,749Singapore 14,091 1,503 47 3,663Thailand 5,828 401 28 2,391VietNam 4,048 115 3 2,153
PERSEKUTUAN EROPAH :EUROPEAN UNION :
17,510 1,889 29 5,523
Denmark 170 7 - 72France 1,318 89 5 481Germany 1,827 75 1 881Ireland 246 68 - 85Italy 491 29 1 234Netherlands 1,268 89 2 399Sweden 276 20 - 142UnitedKingdom 11,914 1,512 20 3,229Sumber:JabatanImigresendanPendaftaranKebangsaan,KementerianHalEhwalDalamNegeri, JabatanKemajuanPelancongan,KementerianSumber-SumberUtamadanPelanconganSource : Immigration and National Registration Department, Ministry of Home Affairs, Tourism Development Department, Ministry of Primary Resources and Tourism
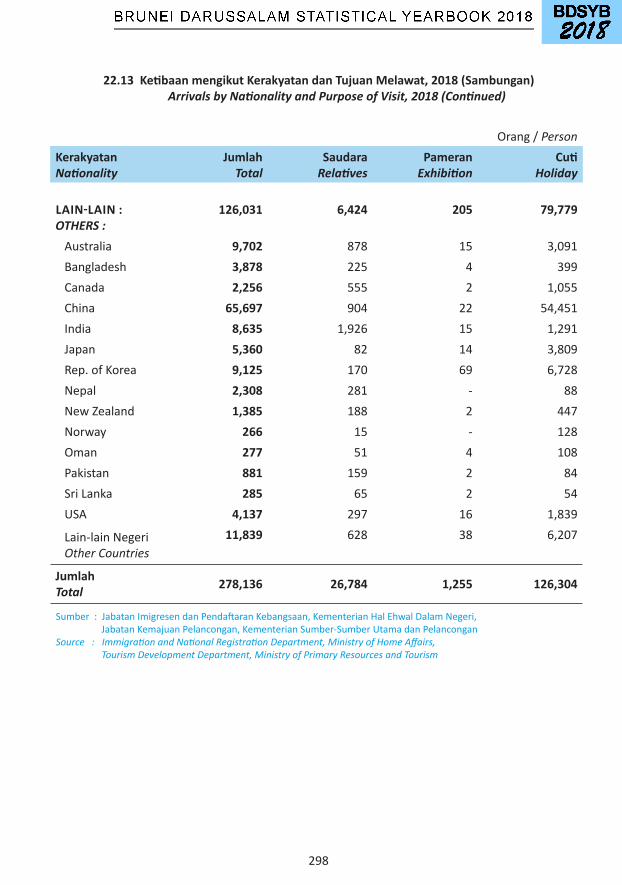
298
22.13 Ketibaan mengikut Kerakyatan dan Tujuan Melawat, 2018 (Sambungan) Arrivals by Nationality and Purpose of Visit, 2018 (Continued)
Orang/ PersonKerakyatanNationality
JumlahTotal
SaudaraRelatives
PameranExhibition
CutiHoliday
LAIN-LAIN :OTHERS :
126,031 6,424 205 79,779
Australia 9,702 878 15 3,091Bangladesh 3,878 225 4 399Canada 2,256 555 2 1,055China 65,697 904 22 54,451India 8,635 1,926 15 1,291Japan 5,360 82 14 3,809Rep.ofKorea 9,125 170 69 6,728Nepal 2,308 281 - 88NewZealand 1,385 188 2 447Norway 266 15 - 128Oman 277 51 4 108Pakistan 881 159 2 84SriLanka 285 65 2 54USA 4,137 297 16 1,839
Lain-lainNegeri Other Countries
11,839 628 38 6,207
JumlahTotal 278,136 26,784 1,255 126,304
Sumber:JabatanImigresendanPendaftaranKebangsaan,KementerianHalEhwalDalamNegeri, JabatanKemajuanPelancongan,KementerianSumber-SumberUtamadanPelanconganSource : Immigration and National Registration Department, Ministry of Home Affairs, Tourism Development Department, Ministry of Primary Resources and Tourism
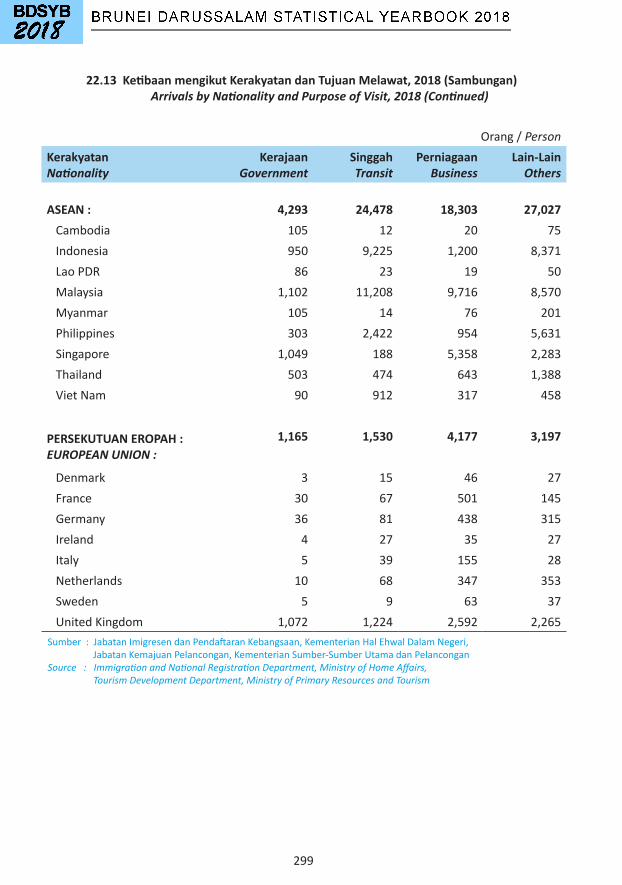
299
22.13 Ketibaan mengikut Kerakyatan dan Tujuan Melawat, 2018 (Sambungan) Arrivals by Nationality and Purpose of Visit, 2018 (Continued)
Orang/ PersonKerakyatanNationality
KerajaanGovernment
SinggahTransit
PerniagaanBusiness
Lain-LainOthers
ASEAN : 4,293 24,478 18,303 27,027 Cambodia 105 12 20 75Indonesia 950 9,225 1,200 8,371LaoPDR 86 23 19 50Malaysia 1,102 11,208 9,716 8,570Myanmar 105 14 76 201Philippines 303 2,422 954 5,631Singapore 1,049 188 5,358 2,283Thailand 503 474 643 1,388VietNam 90 912 317 458
PERSEKUTUAN EROPAH :EUROPEAN UNION :
1,165 1,530 4,177 3,197
Denmark 3 15 46 27France 30 67 501 145Germany 36 81 438 315Ireland 4 27 35 27Italy 5 39 155 28Netherlands 10 68 347 353Sweden 5 9 63 37UnitedKingdom 1,072 1,224 2,592 2,265Sumber:JabatanImigresendanPendaftaranKebangsaan,KementerianHalEhwalDalamNegeri, JabatanKemajuanPelancongan,KementerianSumber-SumberUtamadanPelanconganSource : Immigration and National Registration Department, Ministry of Home Affairs, Tourism Development Department, Ministry of Primary Resources and Tourism
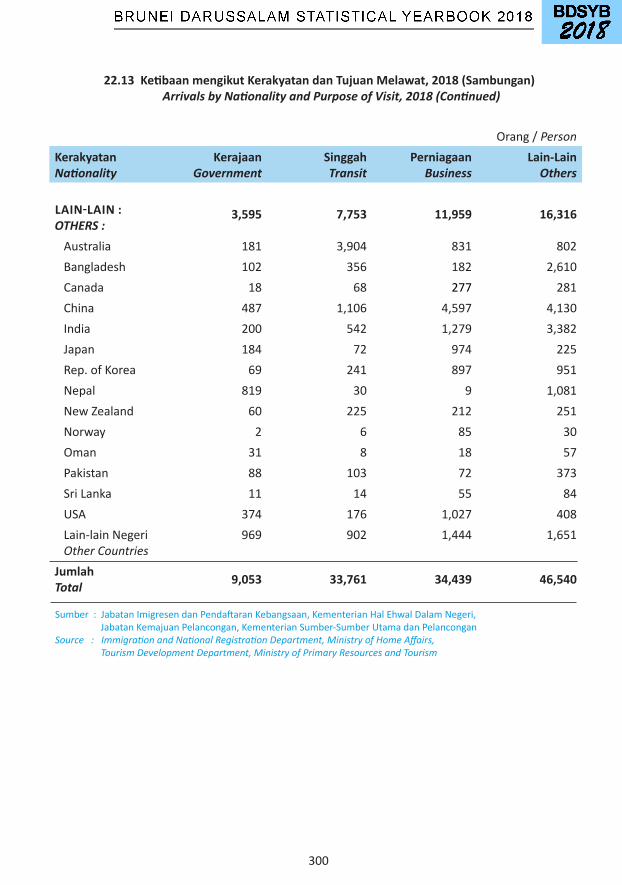
300
22.13 Ketibaan mengikut Kerakyatan dan Tujuan Melawat, 2018 (Sambungan) Arrivals by Nationality and Purpose of Visit, 2018 (Continued)
Orang/ PersonKerakyatanNationality
KerajaanGovernment
SinggahTransit
PerniagaanBusiness
Lain-LainOthers
LAIN-LAIN :OTHERS :
3,595 7,753 11,959 16,316
Australia 181 3,904 831 802Bangladesh 102 356 182 2,610Canada 18 68 277 281China 487 1,106 4,597 4,130India 200 542 1,279 3,382Japan 184 72 974 225Rep.ofKorea 69 241 897 951Nepal 819 30 9 1,081NewZealand 60 225 212 251Norway 2 6 85 30Oman 31 8 18 57Pakistan 88 103 72 373SriLanka 11 14 55 84USA 374 176 1,027 408Lain-lainNegeri Other Countries
969 902 1,444 1,651
JumlahTotal 9,053 33,761 34,439 46,540
Sumber:JabatanImigresendanPendaftaranKebangsaan,KementerianHalEhwalDalamNegeri, JabatanKemajuanPelancongan,KementerianSumber-SumberUtamadanPelanconganSource : Immigration and National Registration Department, Ministry of Home Affairs, Tourism Development Department, Ministry of Primary Resources and Tourism