final time series 010408- final - cloud object...
TRANSCRIPT

PERANGKAAN EKONOMI
MALAYSIA – SIRI MASA
MALAYSIA ECONOMIC
STATISTICS – TIME SERIES
2007
JABATAN PERANGKAAN MALAYSIA
DEPARTMENT OF STATISTICS, MALAYSIA
DISEMBER 2007
DECEMBER 2007
ISSN 0127-9181

KATA PENGANTAR
Maklumat yang komprehensif tentang sektor utama ekonomi Malaysia adalah
sangat penting, terutama dalam meneliti perkembangan sektor tersebut. Maklumat
tentang data siri masa mengikut sektor diperlukan bagi pemerhatian dan
perancangan ekonomi serta pengunjuran senario masa hadapan.
Penerbitan Perangkaan Ekonomi Malaysia - Siri Masa yang pertama telah
dikeluarkan pada tahun 1986 dan diikuti dengan beberapa keluaran bagi tahun
terpilih. Perangkaan Ekonomi Malaysia – Siri Masa 2007, memuatkan maklumat
berkenaan akaun negara, imbangan pembayaran, perdagangan luar negeri di
samping maklumat tentang pertanian, perikanan, pembuatan, pembinaan,
perlombongan, guna tenaga dan kependudukan. Laporan ini juga mengandungi
semua data retrospektif seawal yang ada bagi setiap bidang subjek di samping
mengambil pertimbangan perbandingan antara tempoh bagi siri data.
Penerbitan ini diharapkan menjadi satu rujukan yang bermanfaat dan
penambahbaikan akan dibuat secara berterusan dengan pertambahan maklumat
dan data terkini yang diperoleh. Keterangan lanjut atau maklumat terperinci boleh
dirujuk daripada penerbitan khusus yang berkaitan.
Akhir kata, saya ingin merakamkan penghargaan kepada semua pihak di atas
kerjasama dalam menjayakan penerbitan ini.
HAJAH WAN RAMLAH BINTI WAN ABD. RAOF
Ketua Perangkawan,
Malaysia.
Disember 2007
i
PREFACE
Comprehensive information on main sectors of Malaysian economy is vital
especially in tracing the progress of the sectors over a period of time. Information
on time series by sectors is required in observing and planning the economy as well
as in projecting the future scenario.
The first publication of Malaysia Economic Statistics – Time Series was for 1986
and followed by issues for the selected years. Malaysia Economic Statistic - Time
Series 2007, contains information on national accounts, balance of payments,
external trades, besides information on agriculture, fishing, manufacturing,
construction, mining, employments and population. This report includes all the
retrospective data from the earliest time on each subject area while taking into
consideration the inter-temporal comparability of the data series.
It is hoped that this publication serves as a useful reference and continuous
improvement will be addressed with additional information and latest data available.
Further explanation or detailed information can be referred to the related specific
publication.
Finally, I would like to express my appreciation to all parties involved in making this
publication a success.
HAJAH WAN RAMLAH BINTI WAN ABD. RAOF
Chief Statistician,
Malaysia.
December 2007
ii
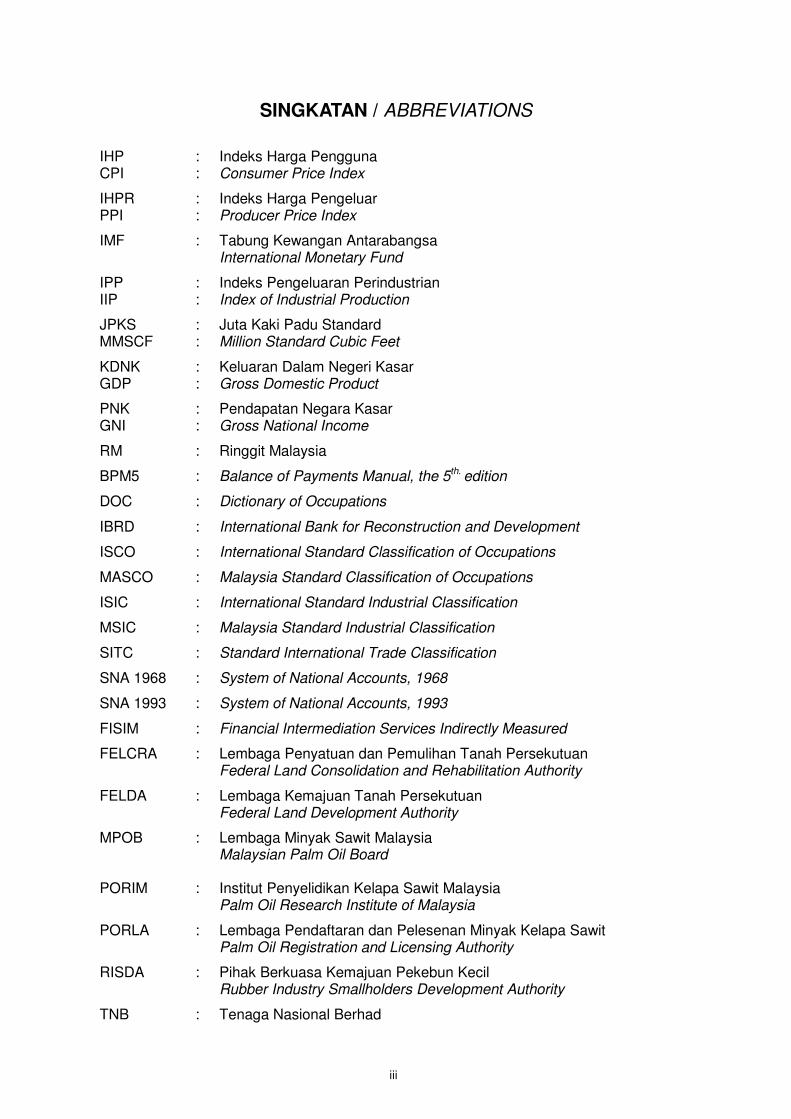
SINGKATAN / ABBREVIATIONS
IHP : Indeks Harga Pengguna CPI : Consumer Price Index
IHPR : Indeks Harga Pengeluar PPI : Producer Price Index
IMF : Tabung Kewangan Antarabangsa International Monetary Fund
IPP : Indeks Pengeluaran Perindustrian IIP : Index of Industrial Production
JPKS : Juta Kaki Padu Standard MMSCF : Million Standard Cubic Feet
KDNK : Keluaran Dalam Negeri Kasar GDP : Gross Domestic Product
PNK : Pendapatan Negara Kasar GNI : Gross National Income
RM : Ringgit Malaysia
BPM5 : Balance of Payments Manual, the 5th. edition
DOC : Dictionary of Occupations
IBRD : International Bank for Reconstruction and Development
ISCO : International Standard Classification of Occupations
MASCO : Malaysia Standard Classification of Occupations
ISIC : International Standard Industrial Classification
MSIC : Malaysia Standard Industrial Classification
SITC : Standard International Trade Classification
SNA 1968 : System of National Accounts, 1968
SNA 1993 : System of National Accounts, 1993
FISIM : Financial Intermediation Services Indirectly Measured
FELCRA : Lembaga Penyatuan dan Pemulihan Tanah Persekutuan Federal Land Consolidation and Rehabilitation Authority
FELDA : Lembaga Kemajuan Tanah Persekutuan Federal Land Development Authority
MPOB : Lembaga Minyak Sawit Malaysia Malaysian Palm Oil Board PORIM : Institut Penyelidikan Kelapa Sawit Malaysia Palm Oil Research Institute of Malaysia
PORLA : Lembaga Pendaftaran dan Pelesenan Minyak Kelapa Sawit Palm Oil Registration and Licensing Authority
RISDA : Pihak Berkuasa Kemajuan Pekebun Kecil Rubber Industry Smallholders Development Authority
TNB : Tenaga Nasional Berhad
iii
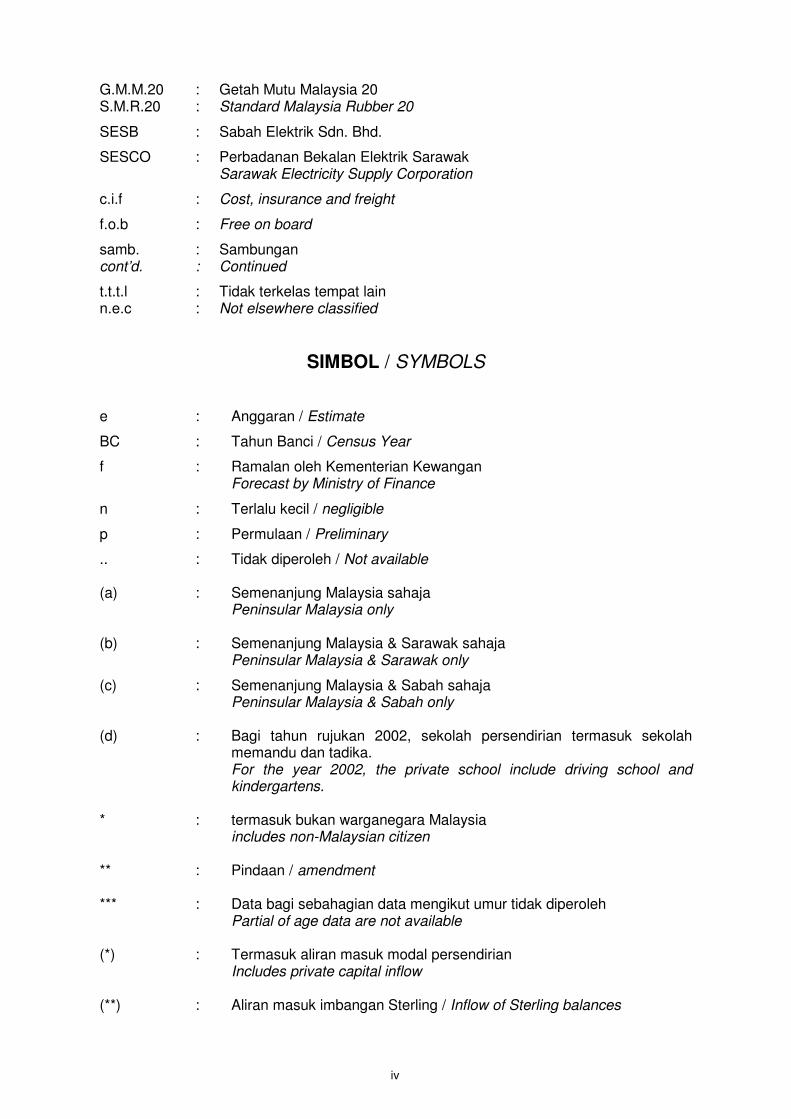
G.M.M.20 : Getah Mutu Malaysia 20 S.M.R.20 : Standard Malaysia Rubber 20
SESB : Sabah Elektrik Sdn. Bhd.
SESCO : Perbadanan Bekalan Elektrik Sarawak Sarawak Electricity Supply Corporation
c.i.f : Cost, insurance and freight
f.o.b : Free on board
samb. : Sambungan cont’d. : Continued
t.t.t.l : Tidak terkelas tempat lain n.e.c : Not elsewhere classified
SIMBOL / SYMBOLS
e : Anggaran / Estimate
BC : Tahun Banci / Census Year
f : Ramalan oleh Kementerian Kewangan Forecast by Ministry of Finance
n : Terlalu kecil / negligible
p : Permulaan / Preliminary
.. : Tidak diperoleh / Not available (a) : Semenanjung Malaysia sahaja Peninsular Malaysia only (b) : Semenanjung Malaysia & Sarawak sahaja Peninsular Malaysia & Sarawak only
(c) : Semenanjung Malaysia & Sabah sahaja Peninsular Malaysia & Sabah only (d) : Bagi tahun rujukan 2002, sekolah persendirian termasuk sekolah
memandu dan tadika. For the year 2002, the private school include driving school and
kindergartens. * : termasuk bukan warganegara Malaysia includes non-Malaysian citizen ** : Pindaan / amendment *** : Data bagi sebahagian data mengikut umur tidak diperoleh Partial of age data are not available (*) : Termasuk aliran masuk modal persendirian Includes private capital inflow (**) : Aliran masuk imbangan Sterling / Inflow of Sterling balances
iv
v
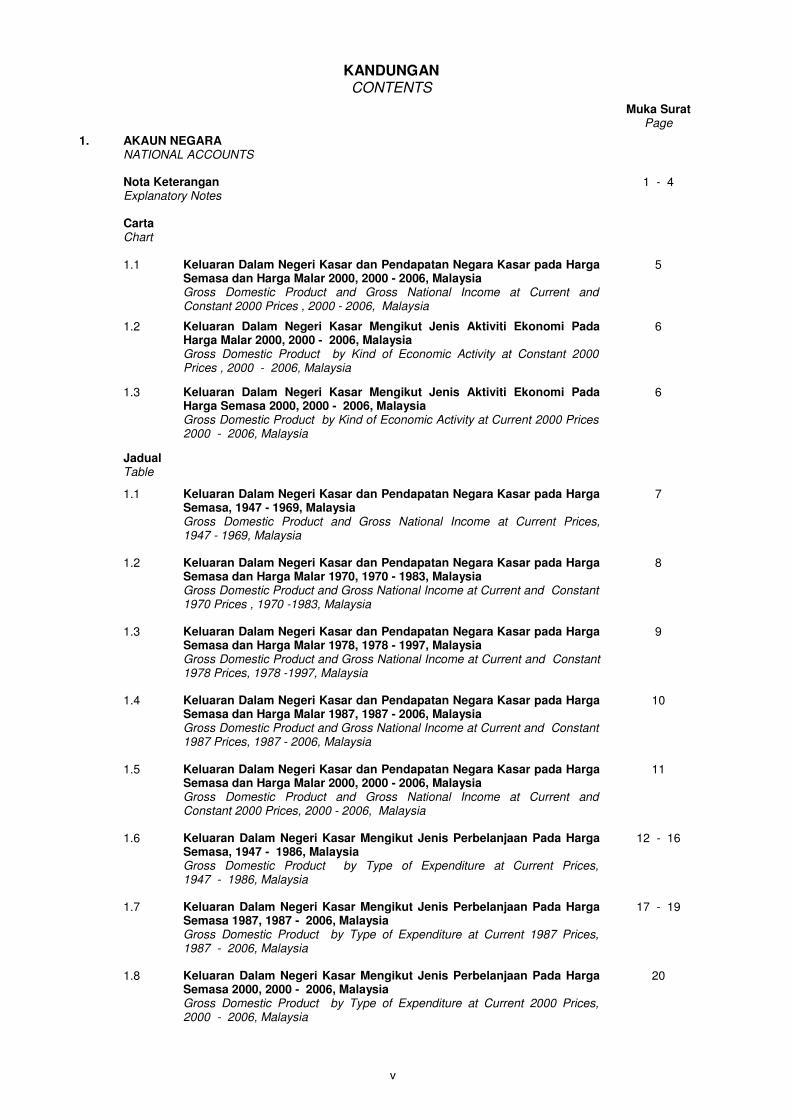
KANDUNGAN
CONTENTS
Muka Surat Page
1. AKAUN NEGARA
NATIONAL ACCOUNTS
Nota Keterangan
Explanatory Notes
1 - 4
Carta Chart
1.1 Keluaran Dalam Negeri Kasar dan Pendapatan Negara Kasar pada Harga Semasa dan Harga Malar 2000, 2000 - 2006, Malaysia
Gross Domestic Product and Gross National Income at Current and Constant 2000 Prices , 2000 - 2006, Malaysia
5
1.2 Keluaran Dalam Negeri Kasar Mengikut Jenis Aktiviti Ekonomi Pada Harga Malar 2000, 2000 - 2006, Malaysia
Gross Domestic Product by Kind of Economic Activity at Constant 2000 Prices , 2000 - 2006, Malaysia
6
1.3 Keluaran Dalam Negeri Kasar Mengikut Jenis Aktiviti Ekonomi Pada Harga Semasa 2000, 2000 - 2006, Malaysia
Gross Domestic Product by Kind of Economic Activity at Current 2000 Prices 2000 - 2006, Malaysia
6
Jadual Table
1.1 Keluaran Dalam Negeri Kasar dan Pendapatan Negara Kasar pada Harga Semasa, 1947 - 1969, Malaysia
Gross Domestic Product and Gross National Income at Current Prices, 1947 - 1969, Malaysia
7
1.2 Keluaran Dalam Negeri Kasar dan Pendapatan Negara Kasar pada Harga Semasa dan Harga Malar 1970, 1970 - 1983, Malaysia
Gross Domestic Product and Gross National Income at Current and Constant 1970 Prices , 1970 -1983, Malaysia
8
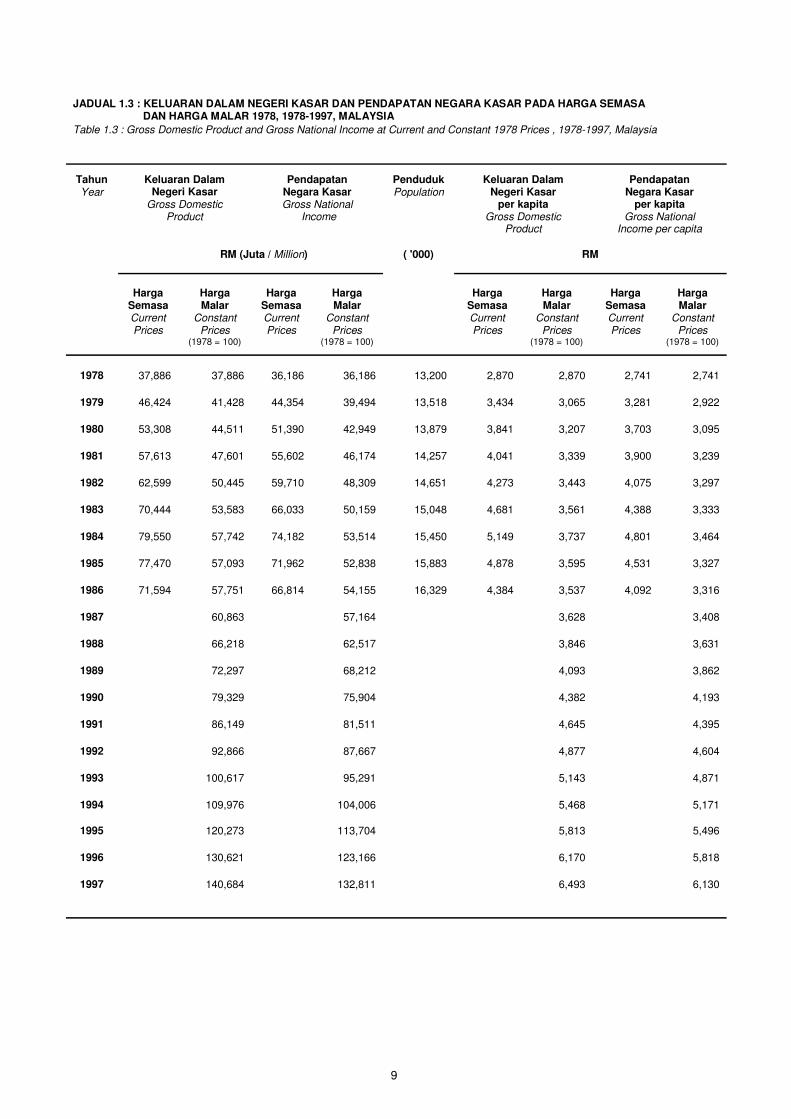
1.3 Keluaran Dalam Negeri Kasar dan Pendapatan Negara Kasar pada Harga Semasa dan Harga Malar 1978, 1978 - 1997, Malaysia
Gross Domestic Product and Gross National Income at Current and Constant 1978 Prices, 1978 -1997, Malaysia
9
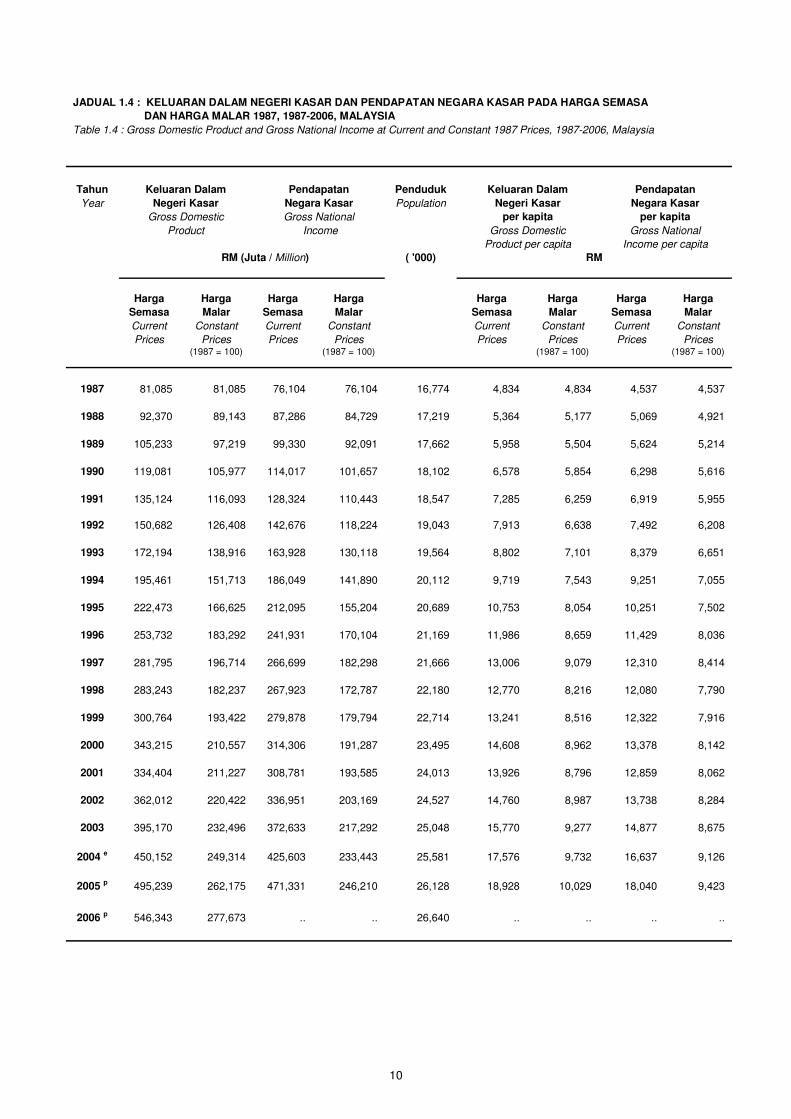
1.4 Keluaran Dalam Negeri Kasar dan Pendapatan Negara Kasar pada Harga Semasa dan Harga Malar 1987, 1987 - 2006, Malaysia
Gross Domestic Product and Gross National Income at Current and Constant 1987 Prices, 1987 - 2006, Malaysia
10
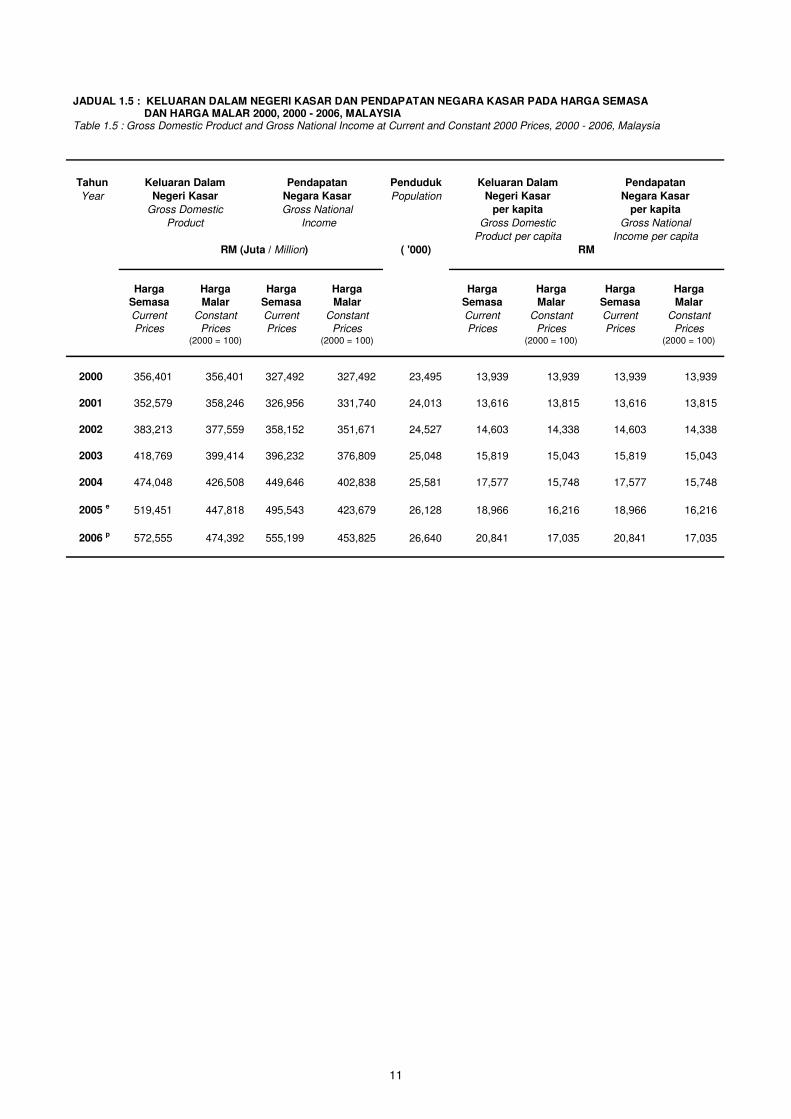
1.5 Keluaran Dalam Negeri Kasar dan Pendapatan Negara Kasar pada Harga Semasa dan Harga Malar 2000, 2000 - 2006, Malaysia
Gross Domestic Product and Gross National Income at Current and Constant 2000 Prices, 2000 - 2006, Malaysia
11
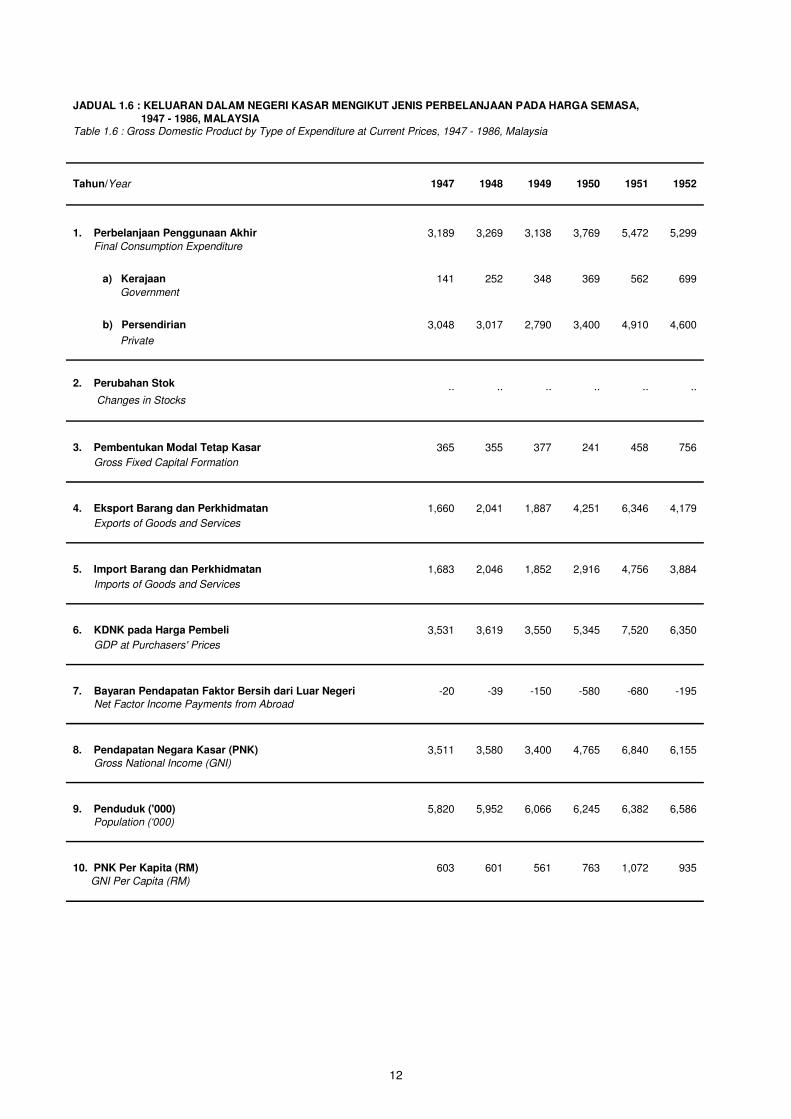
1.6 Keluaran Dalam Negeri Kasar Mengikut Jenis Perbelanjaan Pada Harga Semasa, 1947 - 1986, Malaysia
Gross Domestic Product by Type of Expenditure at Current Prices, 1947 - 1986, Malaysia
12 - 16
1.7 Keluaran Dalam Negeri Kasar Mengikut Jenis Perbelanjaan Pada Harga Semasa 1987, 1987 - 2006, Malaysia
Gross Domestic Product by Type of Expenditure at Current 1987 Prices, 1987 - 2006, Malaysia
17 - 19
1.8 Keluaran Dalam Negeri Kasar Mengikut Jenis Perbelanjaan Pada Harga Semasa 2000, 2000 - 2006, Malaysia
Gross Domestic Product by Type of Expenditure at Current 2000 Prices, 2000 - 2006, Malaysia
20
vi
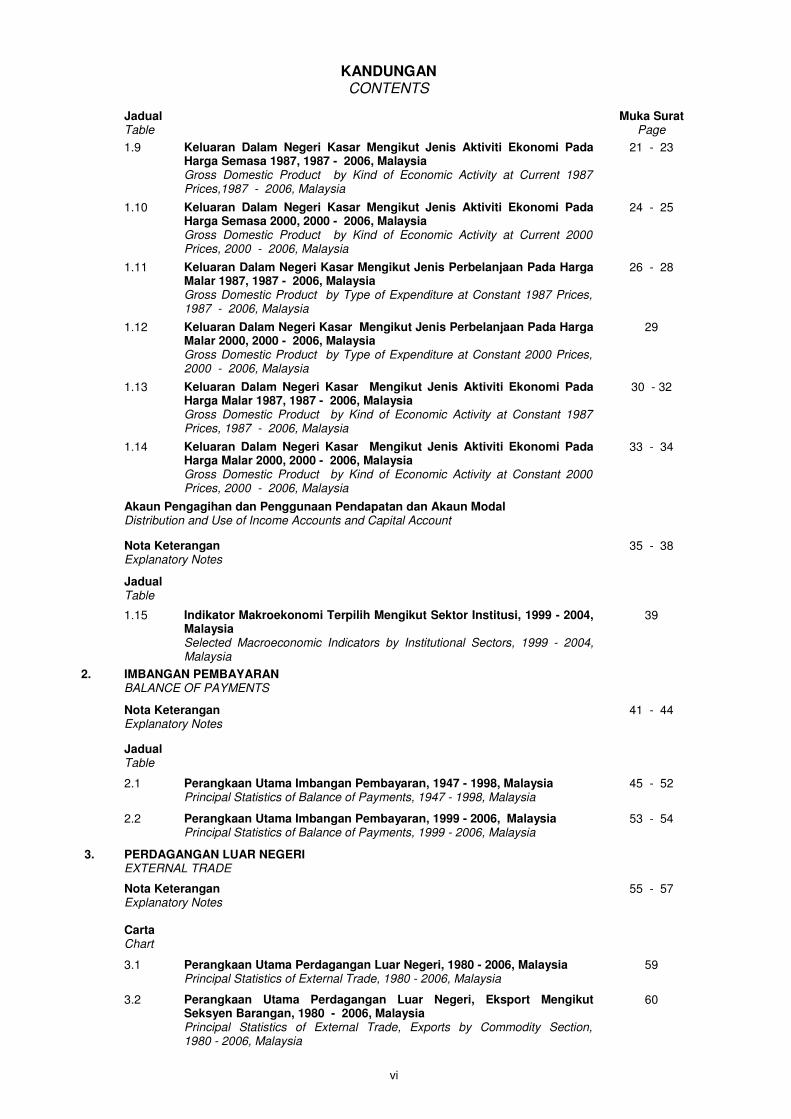
KANDUNGAN
CONTENTS
Jadual Table
Muka Surat Page
1.9 Keluaran Dalam Negeri Kasar Mengikut Jenis Aktiviti Ekonomi Pada Harga Semasa 1987, 1987 - 2006, Malaysia
Gross Domestic Product by Kind of Economic Activity at Current 1987 Prices,1987 - 2006, Malaysia
21 - 23
1.10 Keluaran Dalam Negeri Kasar Mengikut Jenis Aktiviti Ekonomi Pada Harga Semasa 2000, 2000 - 2006, Malaysia
Gross Domestic Product by Kind of Economic Activity at Current 2000 Prices, 2000 - 2006, Malaysia
24 - 25
1.11 Keluaran Dalam Negeri Kasar Mengikut Jenis Perbelanjaan Pada Harga Malar 1987, 1987 - 2006, Malaysia
Gross Domestic Product by Type of Expenditure at Constant 1987 Prices, 1987 - 2006, Malaysia
26 - 28
1.12 Keluaran Dalam Negeri Kasar Mengikut Jenis Perbelanjaan Pada Harga Malar 2000, 2000 - 2006, Malaysia
Gross Domestic Product by Type of Expenditure at Constant 2000 Prices, 2000 - 2006, Malaysia
29
1.13 Keluaran Dalam Negeri Kasar Mengikut Jenis Aktiviti Ekonomi Pada Harga Malar 1987, 1987 - 2006, Malaysia
Gross Domestic Product by Kind of Economic Activity at Constant 1987 Prices, 1987 - 2006, Malaysia
30 - 32
1.14 Keluaran Dalam Negeri Kasar Mengikut Jenis Aktiviti Ekonomi Pada Harga Malar 2000, 2000 - 2006, Malaysia
Gross Domestic Product by Kind of Economic Activity at Constant 2000 Prices, 2000 - 2006, Malaysia
33 - 34
Akaun Pengagihan dan Penggunaan Pendapatan dan Akaun Modal Distribution and Use of Income Accounts and Capital Account
Nota Keterangan Explanatory Notes
35 - 38
Jadual Table
1.15 Indikator Makroekonomi Terpilih Mengikut Sektor Institusi, 1999 - 2004, Malaysia
Selected Macroeconomic Indicators by Institutional Sectors, 1999 - 2004, Malaysia
39
2. IMBANGAN PEMBAYARAN
BALANCE OF PAYMENTS
Nota Keterangan
Explanatory Notes
41 - 44
Jadual Table
2.1 Perangkaan Utama Imbangan Pembayaran, 1947 - 1998, Malaysia
Principal Statistics of Balance of Payments, 1947 - 1998, Malaysia
45 - 52
2.2 Perangkaan Utama Imbangan Pembayaran, 1999 - 2006, Malaysia
Principal Statistics of Balance of Payments, 1999 - 2006, Malaysia
53 - 54
3. PERDAGANGAN LUAR NEGERI EXTERNAL TRADE
Nota Keterangan
Explanatory Notes
55 - 57
Carta
Chart
3.1 Perangkaan Utama Perdagangan Luar Negeri, 1980 - 2006, Malaysia
Principal Statistics of External Trade, 1980 - 2006, Malaysia
59
3.2 Perangkaan Utama Perdagangan Luar Negeri, Eksport Mengikut Seksyen Barangan, 1980 - 2006, Malaysia
Principal Statistics of External Trade, Exports by Commodity Section, 1980 - 2006, Malaysia
60
vii
KANDUNGAN
CONTENTS
Jadual Table
Muka Surat Page
3.1 Perangkaan Utama Perdagangan Luar Negeri, 1947 - 2006, Malaysia
Principal Statistics of External Trade, 1947 - 2006, Malaysia
61 - 63
3.2 Perangkaan Utama Perdagangan Luar Negeri, Eksport Mengikut Seksyen Barangan, 1947 - 2006, Malaysia
Principal Statistics of External Trade, Exports by Commodity Section, 1947 - 2006, Malaysia
64 - 71
3.3 Perangkaan Utama Perdagangan Luar Negeri, Import Mengikut Seksyen Barangan, 1947 - 2006, Malaysia
Principal Statistics of External Trade, Imports by Commodity Section, 1947 - 2006, Malaysia
72 - 79
4. GETAH
RUBBER
Nota Keterangan Explanatory Notes
81 - 82
Carta
Chart
4.1 Perangkaan Utama Estet Getah, 1964 - 2006, Malaysia
Principal Statistics of Rubber Estates, 1964 - 2006, Malaysia
83
Jadual Table
4.1 Perangkaan Utama Estet Getah, 1930 - 2006, Malaysia
Principal Statistics of Rubber Estates, 1930 - 2006, Malaysia
85 - 87
4.2 Jumlah Keluasan Hektar Tanaman Getah dan Pengeluaran Getah, 1930 - 2006, Malaysia
Total Planted Hectareage and Production of Rubber, 1930 - 2006, Malaysia
88 - 90
5. KELAPA SAWIT
OIL PALM
Nota Keterangan Explanatory Notes
91 - 92
Carta
Chart
5.1 Perangkaan Utama Estet Kelapa Sawit, 1980 - 2006, Malaysia
Principal Statistics of Oil Palm Estates, 1980 - 2006, Malaysia
93
5.2 Jumlah Keluasan Hektar Tanaman Kelapa Sawit, 1980 - 2006, Malaysia
Total Planted Hectareage of Oil Palm, 1980 - 2006, Malaysia
93
Jadual Table
5.1 Perangkaan Utama Estet Kelapa Sawit, 1959 - 2006, Malaysia
Principal Statistics of Oil Palm Estates, 1959 - 2006, Malaysia
95 - 96
5.2 Jumlah Keluasan Hektar Tanaman Kelapa Sawit, 1959 - 2006, Malaysia
Total Planted Hectareage of Oil Palm, 1959 - 2006, Malaysia
97 - 98
6. KOKO
COCOA
Nota Keterangan Explanatory Notes
99
Jadual Table
6.1 Perangkaan Utama Estet Koko, 1968 - 2006, Malaysia
Principal Statistics of Cocoa Estates, 1968 - 2006, Malaysia
101 - 102
6.2 Jumlah Keluasan Hektar Tanaman Koko, 1968 - 2006, Malaysia
Total Planted Hectareage of Cocoa, 1968 - 2006, Malaysia
103
viii
KANDUNGAN
CONTENTS
Muka Surat Page
7. PERHUTANAN
FORESTRY
Nota Keterangan
Explanatory Notes
105 - 108
Carta
Chart
7.1 Perangkaan Utama Perhutanan dan Pembalakan, 1987 - 2006, Malaysia
Principal Statistics of Forestry and Logging, 1987 - 2006, Malaysia
109
Jadual Table
7.1 Perangkaan Utama Perhutanan dan Pembalakan, 1987 - 2006, Malaysia
Principal Statistics of Forestry and Logging, 1987 - 2006, Malaysia
111
7.2 Perangkaan Utama Perhutanan dan Pembalakan, 1948 - 2006, Semenanjung Malaysia
Principal Statistics of Forestry and Logging, 1948 - 2006, Peninsular Malaysia
112 - 113
7.3 Perangkaan Utama Perhutanan dan Pembalakan, 1964 - 2006, Sarawak
Principal Statistics of Forestry and Logging, 1964 - 2006, Sarawak
114
7.4 Perangkaan Utama Perhutanan dan Pembalakan, 1947 - 2006, Sabah
Principal Statistics of Forestry and Logging, 1947 - 2006, Sabah
115
8. PERIKANAN FISHING
Nota Keterangan Explanatory Notes
117
Carta
Chart
8.1 Perangkaan Utama Pendaratan Ikan Laut Dan Pengeluaran Akuakultur, 1987 - 2006 Malaysia Principal Statistics of Marine Fish Landings and Aquculture Production, 1987 - 2006, Malaysia
119
Jadual Table
8.1 Perangkaan Utama Pendaratan Ikan Laut Dan Pengeluaran Akuakultur Dan Nilai, 1954 - 2006, Malaysia
Principal Statistics of Marine Fish Landings and Aquaculture Production And Value, 1954 - 2006, Malaysia
121
9. PEMBUATAN MANUFACTURING
Nota Keterangan Explanatory Notes
123 - 124
Jadual Table
9.1 Perangkaan Utama Industri Pembuatan, 1959 - 2005, Malaysia
Principal Statistics of Manufacturing Industries, 1959 - 2005, Malaysia
125 - 126
10. PEMBINAAN
CONSTRUCTION
Nota Keterangan Explanatory Notes
127 - 128
ix
KANDUNGAN
CONTENTS
Jadual Table
Muka Surat Page
10.1 Perangkaan Utama Industri Pembinaan, 1963 - 2005, Malaysia
Principal Statistics of Construction Industries, 1963 - 2005, Malaysia
129 - 130
11. PERLOMBONGAN & PENGKUARIAN BATU MINING & STONE QUARRYING
Nota Keterangan Explanatory Notes
131 - 132
Jadual Table
11.1 Perangkaan Utama Industri Perlombongan, 1963 - 2005, Malaysia
Principal Statistics of Mining Industries, 1963 - 2005, Malaysia
133 - 134
11.2 Pengeluaran, Import dan Eksport Petroleum Mentah dan Pengeluaran Gas Asli, 1963 - 2007, Malaysia
Production, Imports and Exports of Crude Petroleum and Production of Natural Gas, 1963 - 2007, Malaysia
135
11.3 Perangkaan Utama Pengkuarian Batu, 1972 - 2005, Malaysia
Principal Statistics of Stone Quarrying, 1972 - 2005, Malaysia
136
12. ELEKTRIK
ELECTRICITY
Nota Keterangan Explanatory Notes
137
Jadual Table
12.1 Elektrik yang dijanakan, 1955 - 2006, Malaysia
Electricity Generated, 1955 - 2006, Malaysia
139 - 144
13. INDEKS PENGELUARAN PERINDUSTRIAN INDEX OF INDUSTRIAL PRODUCTION
Nota Keterangan Explanatory Notes
145
Jadual Table
13.1 Indeks Pengeluaran Perindustrian, 1968 - 2007, Malaysia
Index of Industrial Production, 1968 - 2007, Malaysia
147 - 149
14. INDEKS HARGA PENGELUAR
PRODUCER PRICE INDEX
Nota Keterangan
Explanatory Notes
151 - 152
Carta
Chart
14.1 Indeks Harga Pengeluar (2000 = 100) Bagi Barangan Dalam Ekonomi Tempatan Mengikut Seksyen Barangan (S.I.T.C), 2000 - 2007, Malaysia
Producer Price Index (2000 = 100) for Goods in the Domestic Economy by Commodity Sections (S.I.T.C), 2000 - 2007, Malaysia
153
Jadual Table
14.1 Indeks Harga Pengeluar (1972 = 100) Bagi Barangan Dalam Ekonomi Tempatan Mengikut Seksyen Barangan (S.I.T.C), 1972 - 1983, Semenanjung Malaysia
Producer Price Index (1972 = 100) for Goods in the Domestic Economy by Commodity Sections (S.I.T.C), 1972 - 1983, Peninsular Malaysia
155
x
KANDUNGAN
CONTENTS
Jadual Table
Muka Surat Page
14.2 Indeks Harga Pengeluar (1978 = 100) Bagi Barangan Dalam Ekonomi Tempatan Mengikut Seksyen Barangan (S.I.T.C), 1978 - 1995, Malaysia
Producer Price Index (1978 = 100) for Goods in the Domestic Economy by Commodity Sections (S.I.T.C), 1978 - 1995, Malaysia
156
14.3
Indeks Harga Pengeluar (1989 = 100) Bagi Barangan Dalam Ekonomi Tempatan Mengikut Seksyen Barangan (S.I.T.C), 1989 - 2005, Malaysia
Producer Price Index (1989 = 100) for Goods in the Domestic Economy by Commodity Sections (S.I.T.C), 1989 - 2005, Malaysia
157
14.4 Indeks Harga Pengeluar (2000 = 100) Bagi Barangan Dalam Ekonomi Tempatan Mengikut Seksyen Barangan (S.I.T.C), 2000 - 2007, Malaysia
Producer Price Index (2000 = 100) for Goods in the Domestic Economy by Commodity Sections (S.I.T.C), 2000 - 2007, Malaysia
158
14.5 Indeks Harga Pengeluar (1972 = 100) Bagi Pengeluaran Tempatan Mengikut Seksyen Barangan (S.I.T.C), 1972 - 1983, Semenanjung Malaysia
Producer Price Index (1972 = 100) for Local Production by Commodity Sections (S.I.T.C), 1972 - 1983, Peninsular Malaysia
159
14.6 Indeks Harga Pengeluar (1978 = 100) Bagi Pengeluaran Tempatan Mengikut Seksyen Barangan (S.I.T.C), 1978 - 1995, Malaysia
Producer Price Index (1978 = 100) for Local Production by Commodity Sections (S.I.T.C), 1978 - 1995, Malaysia
160
14.7 Indeks Harga Pengeluar (1989 = 100) Bagi Pengeluaran Tempatan Mengikut Seksyen Barangan (S.I.T.C), 1989 - 2005, Malaysia
Producer Price Index (1989 = 100) for Local Production by Commodity Sections (S.I.T.C), 1989 - 2005, Malaysia
161
14.8 Indeks Harga Pengeluar (2000 = 100) Bagi Pengeluaran Tempatan Mengikut Seksyen Barangan (S.I.T.C), 2000 - 2007, Malaysia
Producer Price Index (2000 = 100) for Local Production by Commodity Sections S.I.T.C), 2000 - 2007, Malaysia
162
14.9 Indeks Harga Pengeluar (1972 = 100) Bagi Import Mengikut Seksyen Barangan (S.I.T.C), 1972 - 1983, Semenanjung Malaysia
Producer Price Index (1972 = 100) for Imports by Commodity Sections (S.I.T.C), 1972 - 1983, Peninsular Malaysia
163
14.10 Indeks Harga Pengeluar (1978 = 100) Bagi Import Mengikut Seksyen Barangan (S.I.T.C), 1978 - 1995, Malaysia
Producer Price Index (1978 = 100) for Imports by Commodity Sections (S.I.T.C), 1978 - 1995, Malaysia
164
14.11 Indeks Harga Pengeluar (1989 = 100) Bagi Import Mengikut Seksyen Barangan (S.I.T.C), 1989 - 2005, Malaysia
Producer Price Index (1989 = 100) for Imports by Commodity Sections (S.I.T.C), 1989 - 2005, Malaysia
165
14.12 Indeks Harga Pengeluar (2000 = 100) Bagi Import Mengikut Seksyen Barangan (S.I.T.C), 2000 - 2007, Malaysia
Producer Price Index (2000 = 100) for Imports by Commodity Sections (S.I.T.C), 2000 - 2007, Malaysia
166
15. INDEKS HARGA PENGGUNA
CONSUMER PRICE INDEX
Nota Keterangan
Explanatory Notes
167 - 170
xi
KANDUNGAN
CONTENTS
Jadual Table
Muka Surat Page
15.1 Indeks Harga Pengguna (1967 = 100) Mengikut Kumpulan Utama, 1967 - 1981, Semenanjung Malaysia
Consumer Price Index (1967 = 100) by Main Groups, 1967 - 1981, Peninsular Malaysia
171
15.2 Indeks Harga Pengguna (1980 = 100) Mengikut Kumpulan Utama, 1980 - 1998, Malaysia
Consumer Price Index (1980 = 100) by Main Groups, 1980 - 1998, Malaysia
172
15.3 Indeks Harga Pengguna (1990 = 100) Mengikut Kumpulan Utama, 1990 - 1998, Malaysia
Consumer Price Index (1990 = 100) by Main Groups, 1990 - 1998, Malaysia
173
15.4 Indeks Harga Pengguna (1994 = 100) Mengikut Kumpulan Utama, 1994 - 2000, Malaysia
Consumer Price Index (1994 = 100) by Main Groups, 1994 - 2000, Malaysia
174
15.5 Indeks Harga Pengguna (2000 = 100) Mengikut Kumpulan Utama, 1998 - 2005, Malaysia
Consumer Price Index (2000 = 100) by Main Groups, 1998 - 2005, Malaysia
175
15.6 Indeks Harga Pengguna (2005 = 100) Mengikut Kumpulan Utama, 2003 - 2007, Malaysia
Consumer Price Index (2005 = 100) by Main Groups, 2003 - 2007, Malaysia
176
16. PERKHIDMATAN
SERVICES
Nota Keterangan
Explanatory Notes
177 - 182
Jadual Table
16.1 Perangkaan Utama Peguam, 1971 - 2005, Malaysia
Principal Statistics of Lawyers, 1971 - 2005, Malaysia
183
16.2 Perangkaan Utama Akauntan, 1971 - 2005, Malaysia
Principal Statistics of Accountants, 1971 - 2005, Malaysia
184
16.3 Perangkaan Utama Arkitek, 1971 - 2005, Malaysia
Principal Statistics of Architects, 1971 - 2005, Malaysia
185
16.4 Perangkaan Utama Pelukis Pelan Bangunan, 1971 - 2005, Malaysia Principal Statistics of Building Draughtsman, 1971 - 2005, Malaysia
186
16.5 Perangkaan Utama Jurutera, 1971 - 2005, Malaysia
Principal Statistics of Engineers, 1971 - 2005, Malaysia
187
16.6 Perangkaan Utama Juruukur, 1971 - 2005, Malaysia
Principal Statistics of Surveyors, 1971 - 2005, Malaysia
188
16.7 Perangkaan Utama Sekolah Persendirian, 1971 - 2005, Malaysia
Principal Statistics of Private Schools, 1971 - 2005, Malaysia
189
16.8 Perangkaan Utama Sekolah Memandu, 1996 - 2005, Malaysia
Principal Statistics of Driving Schools, 1996 - 2005, Malaysia
190
16.9 Perangkaan Utama Perkhidmatan Perubatan, 1971 - 2005, Malaysia
Principal Statistics of Medical Services, 1971 - 2005, Malaysia
191
16.10 Perangkaan Utama Perkhidmatan Pergigian, 1971 - 2005, Malaysia
Principal Statistics of Dental Services, 1971 - 2005, Malaysia
192
xii
KANDUNGAN
CONTENTS
Jadual Table
Muka Surat Page
16.11 Perangkaan Utama Perkhidmatan Veterinar, 1971 - 2005, Malaysia
Principal Statistics of Veterinary Services, 1971 - 2005, Malaysia
193
16.12 Perangkaan Utama Hospital Dan Rumah Bersalin Persendirian, 1971 - 2005, Malaysia
Principal Statistics of Private Hospitals and Maternity Homes, 1971 - 2005, Malaysia
194
16.13 Perangkaan Utama Penginapan, 1983 - 2005, Malaysia
Principal Statistics of Accommodation, 1983 - 2005, Malaysia
195
16.14 Perangkaan Utama Perkhidmatan Broker Stok, Saham, Komoditi dan Tukaran Wang Asing, 1971 - 2005, Malaysia
Principal Statistics of Stock, Share, Commodity Brokers and Foreign Exchange Services, 1971 - 2005, Malaysia
196
16.15 Perangkaan Utama Ejen Hartanah, 1971 - 2005, Malaysia
Principal Statistics of Real Estate Agents, 1971 - 2005, Malaysia
197
16.16 Perangkaan Utama Agensi Pengiklanan, 1983 - 2005, Malaysia
Principal Statistics of Advertising Agencies, 1983 - 2005, Malaysia
198
16.17 Perangkaan Utama Perkhidmatan Penayangan Wayang Gambar, 1971 - 2005, Malaysia
Principal Statistics of Motion Picture Projection Services, 1971 - 2005, Malaysia
199
16.18 Perangkaan Utama Pengangkutan Bas, 1971 - 2005, Malaysia
Principal Statistics of Bus Transport, 1971 - 2005, Malaysia
200 - 201
16.19 Perangkaan Utama Pengangkutan Muatan, 1971 - 2005, Malaysia
Principal Statistics of Road Haulage, 1971 - 2005, Malaysia
202
16.20 Perangkaan Utama Syarikat Perkapalan, 1971 - 2005, Malaysia
Principal Statistics of Shipping Companies, 1971 - 2005, Malaysia
203
16.21 Perangkaan Utama Pengangkutan Air Pedalaman, 2000 - 2005, Malaysia
Principal Statistics of Inland Water Transport , 2000 - 2005, Malaysia
204
16.22 Perangkaan Utama Pengangkutan Udara, 2000 - 2005, Malaysia
Principal Statistics of Air Transport, 2000 - 2005, Malaysia
204
16.23 Perangkaan Utama Kereta api / Transit Aliran Ringan, 2000 - 2005, Malaysia
Principal Statistics of Train / Light Rail Transit Services, 2000 - 2005, Malaysia
205
16.24 Perangkaan Utama Lain-Lain Perkhidmatan Penghantaran Kargo, 2000 - 2005, Malaysia
Principal Statistics of Other Forwarding Cargo Services, 2000 - 2005, Malaysia
205
16.25 Perangkaan Utama Syarikat Pemunggah Kapal, 1971 - 2005, Malaysia
Principal Statistics of Stevedoring Companies, 1971 - 2005, Malaysia
206
16.26 Perangkaan Utama Perkhidmatan Penyimpanan dan Gudang, 2000 - 2005, Malaysia
Principal Statistics of Storage and Warehousing Services, 2000 - 2005, Malaysia
207
16.27 Perangkaan Utama Perkhidmatan Tempat Letak Kereta, 2002 - 2005, Malaysia
Principal Statistics of Parking Lots Services, 2002 - 2005, Malaysia
207
xiii
KANDUNGAN
CONTENTS
Jadual Table
Muka Surat Page
16.28 Perangkaan Utama Perkhidmatan Pengoperasian Lebuh Raya, 2000 - 2005, Malaysia
Principal Statistics of Highway Operation Services, 2000 - 2005, Malaysia
208
16.29 Perangkaan Utama Perkhidmatan Pengoperasian Pelabuhan, 2000 - 2005, Malaysia
Principal Statistics of Port Operations Services, 2000 - 2005, Malaysia
208
16.30 Perangkaan Utama Perkhidmatan Agensi Pengembaraan dan Operator Pelancongan , 1971 - 2005, Malaysia
Principal Statistics of Travel Agencies and Tour Operators Services, 1971 - 2005, Malaysia
209
16.31 Perangkaan Utama Agensi Perkapalan, 1971 - 2005, Malaysia
Principal Statistics of Shipping Agencies, 1971 - 2005, Malaysia
210
16.32 Perangkaan Utama Perkhidmatan Agensi Penghantaran, 2000 - 2005, Malaysia
Principal Statistics of Forwarding Agencies Services, 2000 - 2005, Malaysia
211
16.33 Perangkaan Utama Perkhidmatan Pos dan Kurier, 2000 - 2005, Malaysia
Principal Statistics of Post and Courier Services, 2000 - 2005, Malaysia
211
16.34 Perangkaan Utama Perkhidmatan Telekomunikasi, 2000 - 2005, Malaysia
Principal Statistics of Telecommunications Services, 2000 - 2005, Malaysia
212
16.35 Perangkaan Utama Perkhidmatan Komputer, 2000 - 2005, Malaysia
Principal Statistics of Computer Services, 2000 - 2005, Malaysia
212
16.36 Perangkaan Utama Perdagangan Borong, 1998 - 2006, Malaysia Principal Statistics of Wholesale Trade, 1998 - 2006, Malaysia
213
16.37 Perangkaan Utama Perdagangan Runcit, 1998 - 2006, Malaysia Principal Statistics of Retail Trade, 1998 - 2006, Malaysia
213
16.38 Perangkaan Utama Perdagangan Kenderaan Bermotor, 1998 - 2006, Malaysia Principal Statistics of Motor Vehicle Trade, 1998 - 2006, Malaysia
214
17. ALAM SEKITAR ENVIRONMENT
Nota Keterangan
Explanatory Notes
215 - 216
Carta
Chart
17.1 Purata Tahunan Indeks Pencemaran Udara Bagi Stesen-stesen Terpilih, 1998 - 2006, Malaysia
Annual Average Air Pollutant Index for Selected Stations , 1998 - 2006, Malaysia
217
17.2 Bilangan Lembangan Sungai Mengikut Kategori, 1998 - 2006, Malaysia
Number of River Basins by Category , 1998 - 2006, Malaysia
217
Jadual Table
17.1 Indeks Pencemaran Udara Bagi Stesen-stesen Terpilih dan Bilangan Lembangan Sungai Mengikut Kategori, 1998 - 2006, Malaysia
Annual Average Air Pollutant Index for Selected Stations and Number of River Basins By Category, 1998 - 2006, Malaysia
219
17.2 Beban Pelepasan Bahan Pencemar Mengikut Punca, 1998 - 2006, Malaysia
Emission Load of Pollutants by Sources , 1998 - 2006, Malaysia
219
KANDUNGAN
CONTENTS
Jadual Table
Muka Surat Page
17.3 Status Kualiti Air Sungai Berdasarkan BOD5, NH3-N dan SS, 1998 - 2006, Malaysia
Status of River Water Quality Based on BOD5, NH3-N and SS, 1998 - 2006, Malaysia
220
18. GUNA TENAGA
EMPLOYMENT
Nota Keterangan
Explanatory Notes
221 - 226
Carta
Chart
18.1 Tenaga Buruh & Kadar Penyertaan Tenaga Buruh, 1995 - 2006, Malaysia
Labour Force & Labour Force Participation Rate , 1995 - 2006, Malaysia
227
18.2 Pengangguran & Kadar Pengangguran, 1995 - 2006, Malaysia
Unemployment & Unemployment Rate, 1995 - 2006, Malaysia
227
Jadual Table
18.1 Tenaga Buruh, Guna Tenaga Mengikut Sektor (MIC 1972) dan Pengangguran, 1982 - 2000, Malaysia
Labour Force, Employment by Sector (MIC 1972) and Unemployment, 1982 - 2000, Malaysia
229 - 231
18.2 Tenaga Buruh, Guna Tenaga Mengikut Sektor (MSIC 2000) dan Pengangguran, 2001 - 2006, Malaysia
Labour Force, Employment by Sector (MSIC 2000) and Unemployment, 2001 - 2006, Malaysia
232
19. PERANGKAAN PENDUDUK
POPULATION STATISTICS
Nota Keterangan
Explanatory Notes
233 - 236
Jadual Table
19.1 Anggaran Penduduk Mengikut Kumpulan Umur, 1891 - 2007, Malaysia
Population Estimates by Age Group, 1891 - 2007, Malaysia
237 - 239
19.2 Kadar Utama Demografi, 1911 - 2007, Malaysia
Main Demographic Rates, 1911 - 2007, Malaysia
240 - 242
19.3 Jangkaan Hayat Mengikut Kumpulan Etnik dan Jantina, 1966 - 2006, Malaysia
Life Expectancy by Ethnic Group and Sex, 1966 - 2006, Malaysia
243 - 244
xiv


AKAUN NEGARA
Nota Keterangan
1. Seksyen ini mempersembahkan akaun makroekonomi dalam bentuk Keluaran
Dalam Negeri Kasar (KDNK) dan Pendapatan Negara Kasar (PNK) mengikut kedua
-dua nilai, iaitu nilai malar dan nilai semasa.
a. KDNK ialah jumlah nilai barang dan perkhidmatan yang dikeluarkan dalam
tempoh tertentu selepas ditolak dengan harga barang dan perkhidmatan yang
digunakan dalam proses pengeluaran tetapi belum ditolak nilai penggunaan
modal tetap. KDNK boleh dinilai pada nilai pembeli dan pada kos faktor.
b. PNK merujuk kepada pengeluaran oleh penduduk negara, sama ada mereka
bermastautin dalam wilayah tempatan atau tidak. KDNK boleh ditukar kepada
PNK dengan menambah pendapatan faktor bersih dari luar negara.
c. Nilai semasa bermula dari tahun 1947 sehingga 2006, manakala nilai malar
mengikut tahun-tahun asas yang berlainan. Tahun-tahun asas tersebut ialah:-
i. KDNK / PNK (Tahun Asas 1970)
ii. KDNK / PNK (Tahun Asas 1978)
iii. KDNK / PNK (Tahun Asas 1987)
iv. KDNK / PNK (Tahun Asas 2000)
2. Perangkaan Akaun Negara bagi tahun 1947 hingga 1949 meliputi Malayan Union /
Persekutuan Tanah Melayu dan Singapura telah disediakan oleh Dr. Frederic
Benham, Penasihat Ekonomi kepada Ketua Pesuruhjaya bagi United Kingdom di
Asia Tenggara. Data ini diperoleh dari “The National Income of Malaya,
1947 – 1949”.
3. Perangkaan Akaun Negara bagi tahun 1949 hingga tahun 1953 telah disediakan
oleh International Bank for Reconstruction and Development. Ia meliputi
Persekutuan Tanah Melayu dan Singapura. Walau bagaimanapun, tiada anggaran
yang disediakan bagi tahun 1954. Data bagi tahun 1955 hingga 1962 merujuk
kepada Persekutuan Tanah Melayu.
1
4. Mulai tahun 1955, Jabatan Perangkaan meneruskan penyusunan perangkaan
akaun negara secara tahunan. Ia diterbitkan dalam Laporan Satu Misi yang
dikelolakan oleh International Bank for Reconstruction and Development
(September, 1955).
5. Sistem akaun negara yang terkini berdasarkan konsep dan metodologi yang
terdapat dalam “A System of National Accounts, 1993” (SNA 1993), Bangsa-bangsa
Bersatu.
2
NATIONAL ACCOUNTS
Explanatory Notes
1. This section presents macroeconomic accounts in terms of Gross Domestic
Product (GDP) and Gross National Income (GNI) in both constant and current
values.
a. GDP is the total value of goods and services produced within a given period
after deducting the cost of goods and services used up in the process of
production but before deducting allowances for the consumption of fixed capital.
GDP can be valued at purchasers’ values and at factor cost.
b. GNI refers to the production of the nationals of the country, whether they are in
residence in the domestic territory or not. GDP can be converted to GNI by
adding net factor incomes from abroad.
c. The current values begin from year 1947 to 2006, while constant values are
based on different base years. The base years are:-
i. GDP /GNI (Base Year 1970)
ii. GDP /GNI (Base Year 1978)
iii. GDP /GNI (Base Year 1987)
iv. GDP /GNI (Base Year 2000)
2. National Accounts Statistics for the years 1947 to 1949 covering Malayan Union /
Federation of Malaya and Singapore, were prepared by Dr. Frederic Benham,
Economic Adviser to the Commissioner-General for the United Kingdom in South
East Asia. The data were obtained from “The National Income of Malaya, 1947
-1949”.
3. National Accounts Statistics for the years 1949 to 1953 were prepared by the
International Bank for Reconstruction and Development. It covers the Federation of
Malaya and Singapore. However, no estimates were available for the year 1954.
Data from 1955 to 1962 refer to the Federation of Malaya.
3
4. From the year 1955 onwards, the Department of Statistics has compiled and
published national accounts statistics on an annual basis. It was published in a
Report of a Mission organised by the International Bank for Reconstruction and
Development (September, 1955).
5. The system of national accounts is currently based on the concepts and
methodology outlined in “A System of National Accounts, 1993” (SNA 1993) of the
United Nations.
4
5
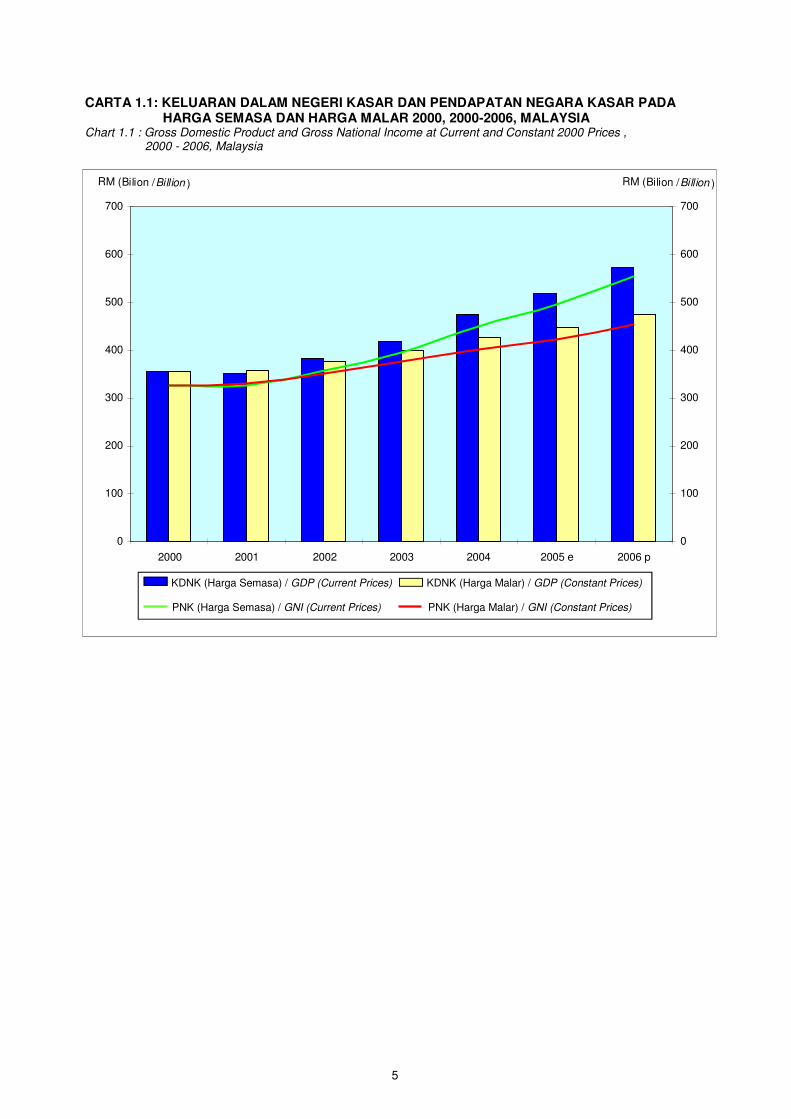
CARTA 1.1: KELUARAN DALAM NEGERI KASAR DAN PENDAPATAN NEGARA KASAR PADA HARGA SEMASA DAN HARGA MALAR 2000, 2000-2006, MALAYSIA
Chart 1.1 : Gross Domestic Product and Gross National Income at Current and Constant 2000 Prices , 2000 - 2006, Malaysia
0
100
200
300
400
500
600
700
2000 2001 2002 2003 2004 2005 e 2006 p
RM (Bilion / Billion )
0
100
200
300
400
500
600
700
RM (Bilion / Billion )
KDNK (Harga Semasa) / GDP (Current Prices) KDNK (Harga Malar) / GDP (Constant Prices) PNK (Harga Semasa) / GNI (Current Prices) PNK (Harga Malar) / GNI (Constant Prices)
0
100,000
200,000
300,000
400,000
500,000
600,000
2000 2001 2002 2003 2004 e 2005 p 2006 p
RM (Juta / Million )
6
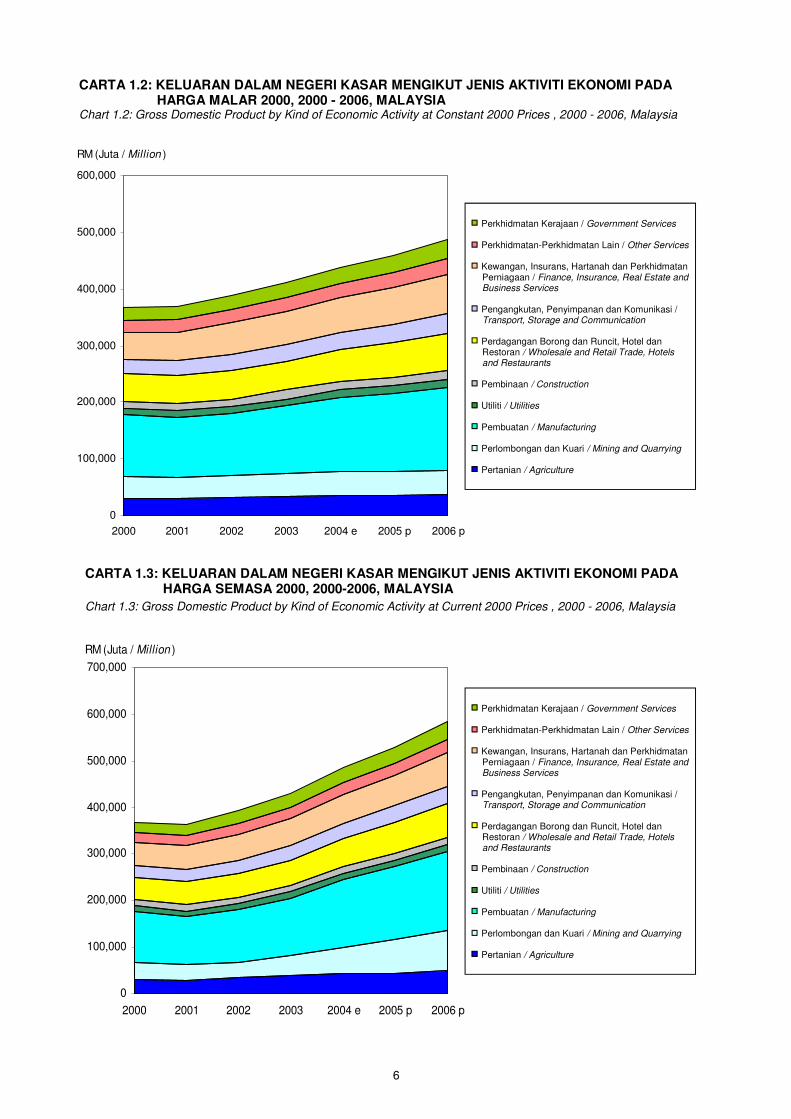
CARTA 1.2: KELUARAN DALAM NEGERI KASAR MENGIKUT JENIS AKTIVITI EKONOMI PADA HARGA MALAR 2000, 2000 - 2006, MALAYSIA
Chart 1.2: Gross Domestic Product by Kind of Economic Activity at Constant 2000 Prices , 2000 - 2006, Malaysia
CARTA 1.3: KELUARAN DALAM NEGERI KASAR MENGIKUT JENIS AKTIVITI EKONOMI PADA HARGA SEMASA 2000, 2000-2006, MALAYSIA
Chart 1.3: Gross Domestic Product by Kind of Economic Activity at Current 2000 Prices , 2000 - 2006, Malaysia
0
100,000
200,000
300,000
400,000
500,000
600,000
700,000
2000 2001 2002 2003 2004 e 2005 p 2006 p
RM (Juta / Million )
Perkhidmatan Kerajaan / Government Services
Perkhidmatan-Perkhidmatan Lain / Other Services
Kewangan, Insurans, Hartanah dan Perkhidmatan
Perniagaan / Finance, Insurance, Real Estate and Business Services
Pengangkutan, Penyimpanan dan Komunikasi / Transport, Storage and Communication
Perdagangan Borong dan Runcit, Hotel dan Restoran / Wholesale and Retail Trade, Hotels and Restaurants
Pembinaan / Construction
Utiliti / Utilities
Pembuatan / Manufacturing
Perlombongan dan Kuari / Mining and Quarrying
Pertanian / Agriculture
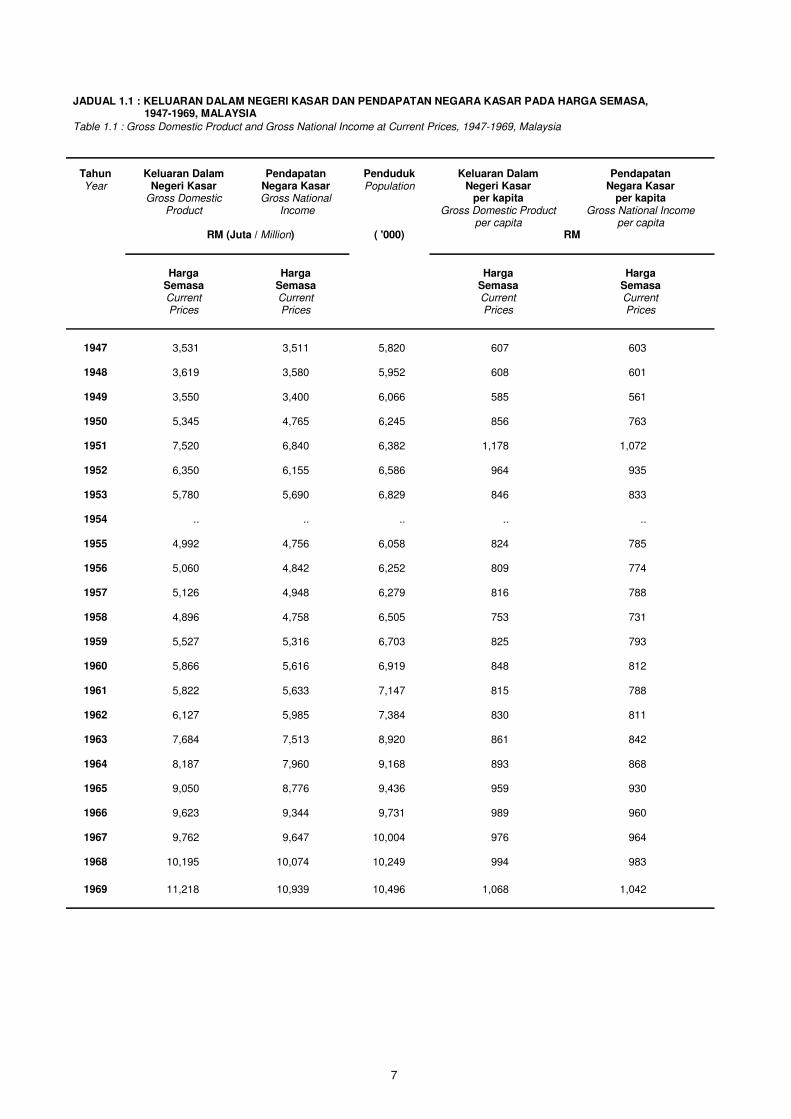
JADUAL 1.1 : KELUARAN DALAM NEGERI KASAR DAN PENDAPATAN NEGARA KASAR PADA HARGA SEMASA, 1947-1969, MALAYSIA
Table 1.1 : Gross Domestic Product and Gross National Income at Current Prices, 1947-1969, Malaysia
Tahun Keluaran Dalam Pendapatan Penduduk Keluaran Dalam Pendapatan
Year Negeri Kasar Negara Kasar Population Negeri Kasar Negara Kasar Gross Domestic Gross National per kapita per kapita
Product Income Gross Domestic Product Gross National Income
per capita per capita
RM (Juta / Million) ( '000) RM
Harga Harga Harga Harga
Semasa Semasa Semasa Semasa
Current Current Current Current Prices Prices Prices Prices
1947 3,531 3,511 5,820 607 603
1948 3,619 3,580 5,952 608 601
1949 3,550 3,400 6,066 585 561
1950 5,345 4,765 6,245 856 763
1951 7,520 6,840 6,382 1,178 1,072
1952 6,350 6,155 6,586 964 935
1953 5,780 5,690 6,829 846 833
1954 .. .. .. .. ..
1955 4,992 4,756 6,058 824 785
1956 5,060 4,842 6,252 809 774
1957 5,126 4,948 6,279 816 788
1958 4,896 4,758 6,505 753 731
1959 5,527 5,316 6,703 825 793
1960 5,866 5,616 6,919 848 812
1961 5,822 5,633 7,147 815 788
1962 6,127 5,985 7,384 830 811
1963 7,684 7,513 8,920 861 842
1964 8,187 7,960 9,168 893 868
1965 9,050 8,776 9,436 959 930
1966 9,623 9,344 9,731 989 960
1967 9,762 9,647 10,004 976 964
1968 10,195 10,074 10,249 994 983
1969 11,218 10,939 10,496 1,068 1,042
7
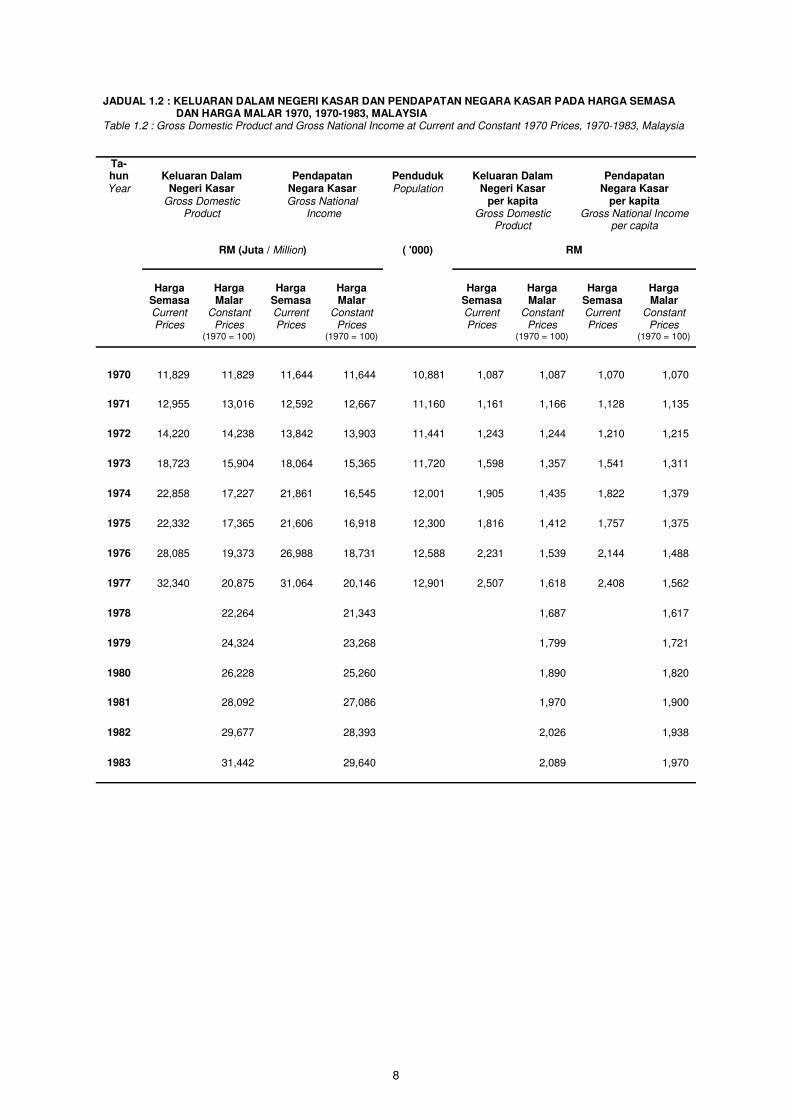
JADUAL 1.2 : KELUARAN DALAM NEGERI KASAR DAN PENDAPATAN NEGARA KASAR PADA HARGA SEMASA DAN HARGA MALAR 1970, 1970-1983, MALAYSIA Table 1.2 : Gross Domestic Product and Gross National Income at Current and Constant 1970 Prices, 1970-1983, Malaysia
Ta-hun Keluaran Dalam Pendapatan Penduduk Keluaran Dalam Pendapatan
Year Negeri Kasar Negara Kasar Population Negeri Kasar Negara Kasar Gross Domestic Gross National per kapita per kapita
Product Income
Gross Domestic
Product Gross National Income
per capita
RM (Juta / Million) ( '000) RM
Harga Harga Harga Harga Harga Harga Harga Harga
Semasa Malar Semasa Malar Semasa Malar Semasa Malar Current Constant Current Constant Current Constant Current Constant Prices Prices Prices Prices Prices Prices Prices Prices
(1970 = 100) (1970 = 100) (1970 = 100) (1970 = 100)
1970 11,829 11,829 11,644 11,644 10,881 1,087 1,087 1,070 1,070
1971 12,955 13,016 12,592 12,667 11,160 1,161 1,166 1,128 1,135
1972 14,220 14,238 13,842 13,903 11,441 1,243 1,244 1,210 1,215
1973 18,723 15,904 18,064 15,365 11,720 1,598 1,357 1,541 1,311
1974 22,858 17,227 21,861 16,545 12,001 1,905 1,435 1,822 1,379
1975 22,332 17,365 21,606 16,918 12,300 1,816 1,412 1,757 1,375
1976 28,085 19,373 26,988 18,731 12,588 2,231 1,539 2,144 1,488
1977 32,340 20,875 31,064 20,146 12,901 2,507 1,618 2,408 1,562
1978 22,264 21,343 1,687 1,617
1979 24,324 23,268 1,799 1,721
1980 26,228 25,260 1,890 1,820
1981 28,092 27,086 1,970 1,900
1982 29,677 28,393 2,026 1,938
1983 31,442 29,640 2,089 1,970
8
JADUAL 1.3 : KELUARAN DALAM NEGERI KASAR DAN PENDAPATAN NEGARA KASAR PADA HARGA SEMASA
DAN HARGA MALAR 1978, 1978-1997, MALAYSIA
Table 1.3 : Gross Domestic Product and Gross National Income at Current and Constant 1978 Prices , 1978-1997, Malaysia
Tahun Keluaran Dalam Pendapatan Penduduk Keluaran Dalam Pendapatan
Year Negeri Kasar Negara Kasar Population Negeri Kasar Negara Kasar Gross Domestic Gross National per kapita per kapita
Product Income Gross Domestic Product
Gross National Income per capita
RM (Juta / Million) ( '000) RM
Harga Harga Harga Harga Harga Harga Harga Harga
Semasa Malar Semasa Malar Semasa Malar Semasa Malar Current Constant Current Constant Current Constant Current Constant Prices Prices Prices Prices Prices Prices Prices Prices
(1978 = 100) (1978 = 100) (1978 = 100) (1978 = 100)
1978 37,886 37,886 36,186 36,186 13,200 2,870 2,870 2,741 2,741
1979 46,424 41,428 44,354 39,494 13,518 3,434 3,065 3,281 2,922
1980 53,308 44,511 51,390 42,949 13,879 3,841 3,207 3,703 3,095
1981 57,613 47,601 55,602 46,174 14,257 4,041 3,339 3,900 3,239
1982 62,599 50,445 59,710 48,309 14,651 4,273 3,443 4,075 3,297
1983 70,444 53,583 66,033 50,159 15,048 4,681 3,561 4,388 3,333
1984 79,550 57,742 74,182 53,514 15,450 5,149 3,737 4,801 3,464
1985 77,470 57,093 71,962 52,838 15,883 4,878 3,595 4,531 3,327
1986 71,594 57,751 66,814 54,155 16,329 4,384 3,537 4,092 3,316
1987 60,863 57,164 3,628 3,408
1988 66,218 62,517 3,846 3,631
1989 72,297 68,212 4,093 3,862
1990 79,329 75,904 4,382 4,193
1991 86,149 81,511 4,645 4,395
1992 92,866 87,667 4,877 4,604
1993 100,617 95,291 5,143 4,871
1994 109,976 104,006 5,468 5,171
1995 120,273 113,704 5,813 5,496
1996 130,621 123,166 6,170 5,818
1997 140,684 132,811 6,493 6,130
9
JADUAL 1.4 : KELUARAN DALAM NEGERI KASAR DAN PENDAPATAN NEGARA KASAR PADA HARGA SEMASA
DAN HARGA MALAR 1987, 1987-2006, MALAYSIA
Table 1.4 : Gross Domestic Product and Gross National Income at Current and Constant 1987 Prices, 1987-2006, Malaysia
Tahun Keluaran Dalam Pendapatan Penduduk Keluaran Dalam Pendapatan
Year Negeri Kasar Negara Kasar Population Negeri Kasar Negara Kasar
Gross Domestic Gross National per kapita per kapita
Product Income Gross Domestic Gross National
Product per capita Income per capita
RM (Juta / Million) ( '000) RM
Harga Harga Harga Harga Harga Harga Harga Harga
Semasa Malar Semasa Malar Semasa Malar Semasa Malar
Current Constant Current Constant Current Constant Current Constant
Prices Prices Prices Prices Prices Prices Prices Prices
(1987 = 100) (1987 = 100) (1987 = 100) (1987 = 100)
1987 81,085 81,085 76,104 76,104 16,774 4,834 4,834 4,537 4,537
1988 92,370 89,143 87,286 84,729 17,219 5,364 5,177 5,069 4,921
1989 105,233 97,219 99,330 92,091 17,662 5,958 5,504 5,624 5,214
1990 119,081 105,977 114,017 101,657 18,102 6,578 5,854 6,298 5,616
1991 135,124 116,093 128,324 110,443 18,547 7,285 6,259 6,919 5,955
1992 150,682 126,408 142,676 118,224 19,043 7,913 6,638 7,492 6,208
1993 172,194 138,916 163,928 130,118 19,564 8,802 7,101 8,379 6,651
1994 195,461 151,713 186,049 141,890 20,112 9,719 7,543 9,251 7,055
1995 222,473 166,625 212,095 155,204 20,689 10,753 8,054 10,251 7,502
1996 253,732 183,292 241,931 170,104 21,169 11,986 8,659 11,429 8,036
1997 281,795 196,714 266,699 182,298 21,666 13,006 9,079 12,310 8,414
1998 283,243 182,237 267,923 172,787 22,180 12,770 8,216 12,080 7,790
1999 300,764 193,422 279,878 179,794 22,714 13,241 8,516 12,322 7,916
2000 343,215 210,557 314,306 191,287 23,495 14,608 8,962 13,378 8,142
2001 334,404 211,227 308,781 193,585 24,013 13,926 8,796 12,859 8,062
2002 362,012 220,422 336,951 203,169 24,527 14,760 8,987 13,738 8,284
2003 395,170 232,496 372,633 217,292 25,048 15,770 9,277 14,877 8,675
2004 e 450,152 249,314 425,603 233,443 25,581 17,576 9,732 16,637 9,126
2005 p 495,239 262,175 471,331 246,210 26,128 18,928 10,029 18,040 9,423
2006 p 546,343 277,673 .. .. 26,640 .. .. .. ..
10
JADUAL 1.5 : KELUARAN DALAM NEGERI KASAR DAN PENDAPATAN NEGARA KASAR PADA HARGA SEMASA
DAN HARGA MALAR 2000, 2000 - 2006, MALAYSIA Table 1.5 : Gross Domestic Product and Gross National Income at Current and Constant 2000 Prices, 2000 - 2006, Malaysia
Tahun Keluaran Dalam Pendapatan Penduduk Keluaran Dalam Pendapatan
Year Negeri Kasar Negara Kasar Population Negeri Kasar Negara Kasar
Gross Domestic Gross National per kapita per kapita
Product Income Gross Domestic Gross National
Product per capita Income per capita
RM (Juta / Million) ( '000) RM
Harga Harga Harga Harga Harga Harga Harga Harga
Semasa Malar Semasa Malar Semasa Malar Semasa Malar
Current Constant Current Constant Current Constant Current Constant
Prices Prices Prices Prices Prices Prices Prices Prices
(2000 = 100) (2000 = 100) (2000 = 100) (2000 = 100)
2000 356,401 356,401 327,492 327,492 23,495 13,939 13,939 13,939 13,939
2001 352,579 358,246 326,956 331,740 24,013 13,616 13,815 13,616 13,815
2002 383,213 377,559 358,152 351,671 24,527 14,603 14,338 14,603 14,338
2003 418,769 399,414 396,232 376,809 25,048 15,819 15,043 15,819 15,043
2004 474,048 426,508 449,646 402,838 25,581 17,577 15,748 17,577 15,748
2005 e 519,451 447,818 495,543 423,679 26,128 18,966 16,216 18,966 16,216
2006 p 572,555 474,392 555,199 453,825 26,640 20,841 17,035 20,841 17,035
11
JADUAL 1.6 : KELUARAN DALAM NEGERI KASAR MENGIKUT JENIS PERBELANJAAN PADA HARGA SEMASA,
1947 - 1986, MALAYSIA Table 1.6 : Gross Domestic Product by Type of Expenditure at Current Prices, 1947 - 1986, Malaysia
Tahun/Year 1947 1948 1949 1950 1951 1952
1. Perbelanjaan Penggunaan Akhir
3,189 3,269 3,138 3,769 5,472 5,299
Final Consumption Expenditure
a) Kerajaan 141 252 348 369 562 699
Government
b) Persendirian 3,048 3,017 2,790 3,400 4,910 4,600
Private
2. Perubahan Stok .. .. .. .. .. ..
Changes in Stocks
3. Pembentukan Modal Tetap Kasar 365 355 377 241 458 756
Gross Fixed Capital Formation
4. Eksport Barang dan Perkhidmatan 1,660 2,041 1,887 4,251 6,346 4,179
Exports of Goods and Services
5. Import Barang dan Perkhidmatan 1,683 2,046 1,852 2,916 4,756 3,884
Imports of Goods and Services
6. KDNK pada Harga Pembeli 3,531 3,619 3,550 5,345 7,520 6,350
GDP at Purchasers' Prices
7. Bayaran Pendapatan Faktor Bersih dari Luar Negeri -20 -39 -150 -580 -680 -195
Net Factor Income Payments from Abroad
8. Pendapatan Negara Kasar (PNK) 3,511 3,580 3,400 4,765 6,840 6,155
Gross National Income (GNI)
9. Penduduk ('000) 5,820 5,952 6,066 6,245 6,382 6,586
Population (‘000)
10. PNK Per Kapita (RM) 603 601 561 763 1,072 935
GNI Per Capita (RM)
12
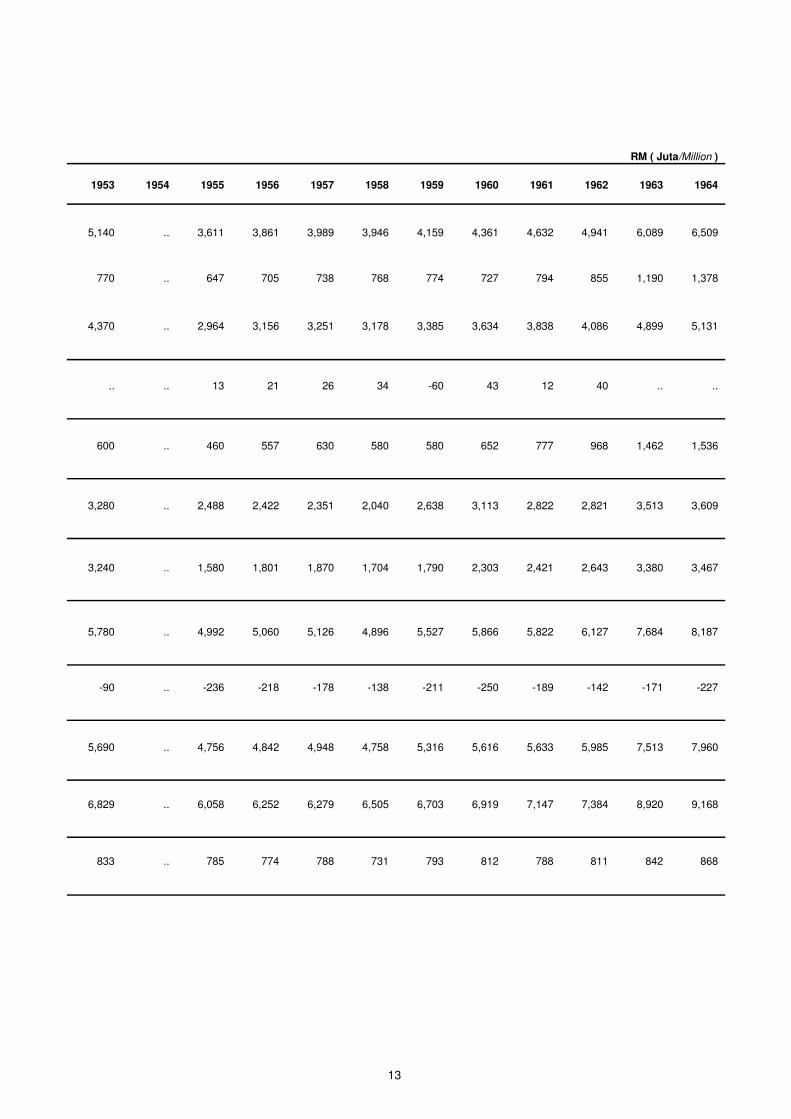
1953 1954 1955 1956 1957 1958 1959 1960 1961 1962 1963 1964
5,140 .. 3,611 3,861 3,989 3,946 4,159 4,361 4,632 4,941 6,089 6,509
770 .. 647 705 738 768 774 727 794 855 1,190 1,378
4,370 .. 2,964 3,156 3,251 3,178 3,385 3,634 3,838 4,086 4,899 5,131
.. .. 13 21 26 34 -60 43 12 40 .. ..
600 .. 460 557 630 580 580 652 777 968 1,462 1,536
3,280 .. 2,488 2,422 2,351 2,040 2,638 3,113 2,822 2,821 3,513 3,609
3,240 .. 1,580 1,801 1,870 1,704 1,790 2,303 2,421 2,643 3,380 3,467
5,780 .. 4,992 5,060 5,126 4,896 5,527 5,866 5,822 6,127
7,684
8,187
-90 .. -236 -218 -178 -138 -211 -250 -189 -142 -171 -227
5,690 .. 4,756 4,842 4,948 4,758 5,316 5,616 5,633 5,985 7,513 7,960
6,829 .. 6,058 6,252 6,279 6,505 6,703 6,919 7,147 7,384 8,920 9,168
833 .. 785 774 788 731 793 812 788 811 842 868
RM ( Juta/Million )
13
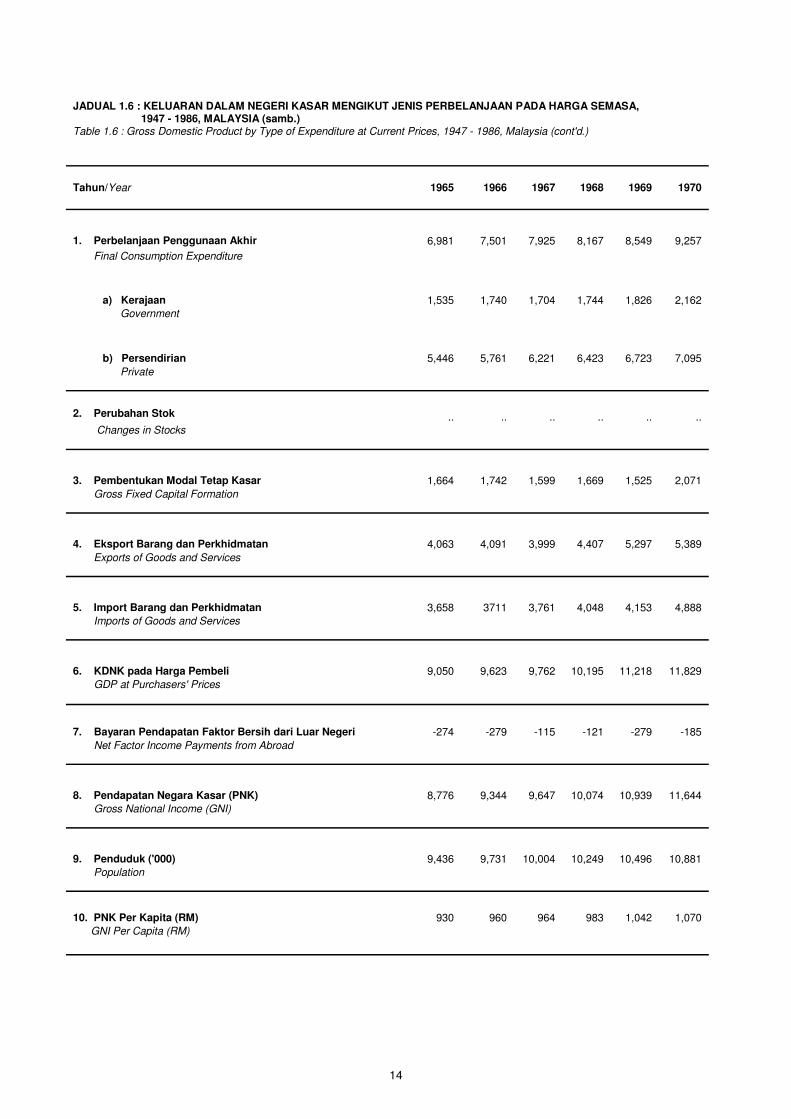
JADUAL 1.6 : KELUARAN DALAM NEGERI KASAR MENGIKUT JENIS PERBELANJAAN PADA HARGA SEMASA, 1947 - 1986, MALAYSIA (samb.) Table 1.6 : Gross Domestic Product by Type of Expenditure at Current Prices, 1947 - 1986, Malaysia (cont'd.)
Tahun/Year 1965 1966 1967 1968 1969 1970
1. Perbelanjaan Penggunaan Akhir
6,981 7,501 7,925 8,167 8,549 9,257
Final Consumption Expenditure
a) Kerajaan
1,535 1,740 1,704 1,744 1,826 2,162
Government
b) Persendirian
5,446 5,761 6,221 6,423 6,723 7,095
Private
2. Perubahan Stok .. .. .. .. .. ..
Changes in Stocks
3. Pembentukan Modal Tetap Kasar
1,664 1,742 1,599 1,669 1,525 2,071
Gross Fixed Capital Formation
4. Eksport Barang dan Perkhidmatan
4,063 4,091 3,999 4,407 5,297 5,389
Exports of Goods and Services
5. Import Barang dan Perkhidmatan
3,658 3711 3,761 4,048 4,153 4,888
Imports of Goods and Services
6. KDNK pada Harga Pembeli
9,050
9,623 9,762 10,195 11,218 11,829
GDP at Purchasers' Prices
7. Bayaran Pendapatan Faktor Bersih dari Luar Negeri -274 -279 -115 -121 -279 -185
Net Factor Income Payments from Abroad
8. Pendapatan Negara Kasar (PNK)
8,776
9,344 9,647 10,074 10,939 11,644
Gross National Income (GNI)
9. Penduduk ('000)
9,436
9,731 10,004 10,249 10,496 10,881
Population
10. PNK Per Kapita (RM) 930 960 964 983 1,042 1,070
GNI Per Capita (RM)
14
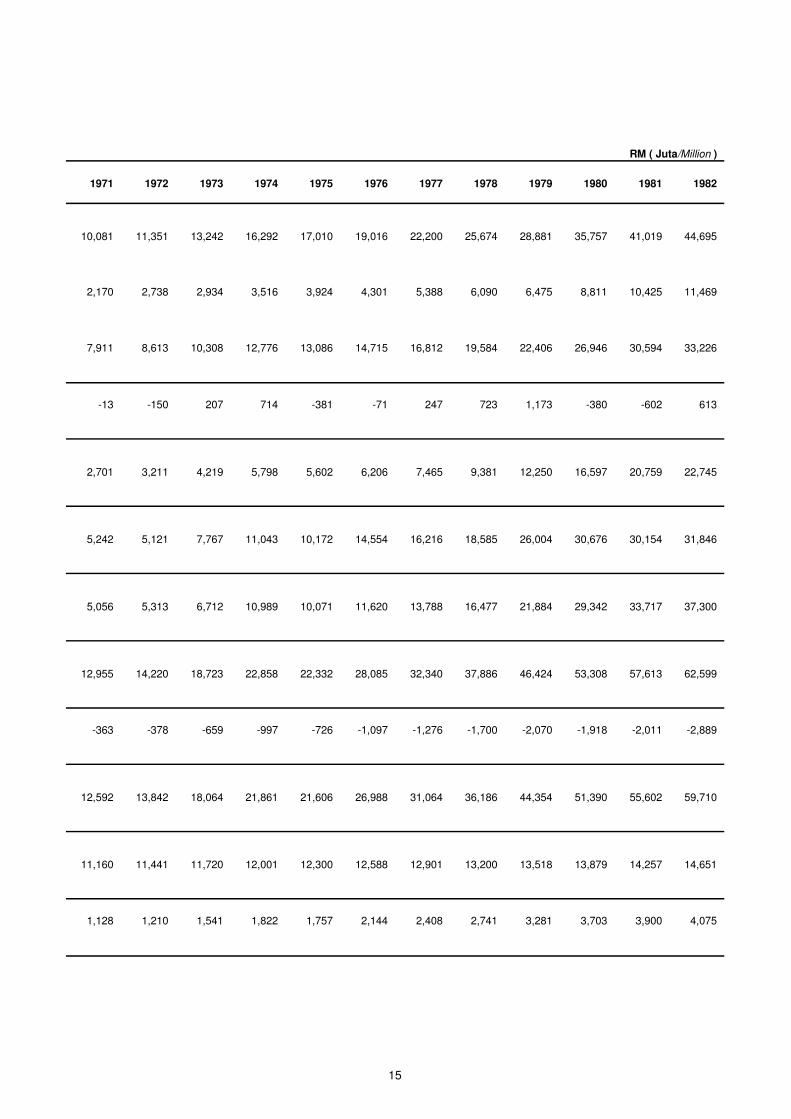
1971 1972 1973 1974 1975 1976 1977 1978 1979 1980 1981 1982
10,081 11,351 13,242 16,292 17,010 19,016 22,200 25,674 28,881 35,757 41,019 44,695
2,170 2,738 2,934 3,516 3,924 4,301 5,388 6,090 6,475 8,811 10,425 11,469
7,911 8,613 10,308 12,776 13,086 14,715 16,812 19,584 22,406 26,946 30,594 33,226
-13 -150 207 714 -381 -71 247 723 1,173 -380 -602 613
2,701 3,211 4,219 5,798 5,602 6,206 7,465 9,381 12,250 16,597 20,759 22,745
5,242 5,121 7,767 11,043 10,172 14,554 16,216 18,585 26,004 30,676 30,154 31,846
5,056 5,313 6,712 10,989 10,071 11,620 13,788 16,477 21,884 29,342 33,717 37,300
12,955 14,220 18,723 22,858 22,332 28,085 32,340 37,886 46,424 53,308 57,613 62,599
-363 -378 -659 -997 -726 -1,097 -1,276 -1,700 -2,070 -1,918 -2,011 -2,889
12,592 13,842 18,064 21,861 21,606 26,988 31,064 36,186 44,354 51,390 55,602 59,710
11,160 11,441 11,720 12,001 12,300 12,588 12,901 13,200 13,518 13,879 14,257 14,651
1,128 1,210 1,541 1,822 1,757 2,144 2,408 2,741 3,281 3,703 3,900 4,075
RM ( Juta/Million )
15
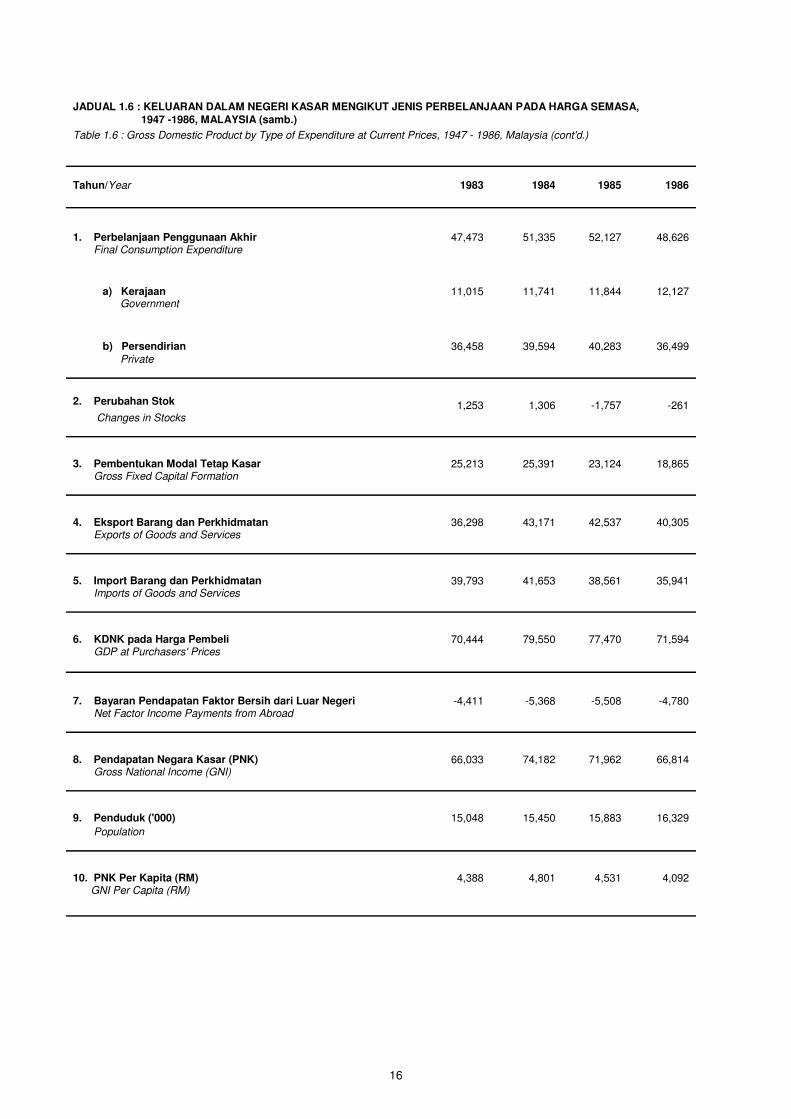
JADUAL 1.6 : KELUARAN DALAM NEGERI KASAR MENGIKUT JENIS PERBELANJAAN PADA HARGA SEMASA, 1947 -1986, MALAYSIA (samb.)
Table 1.6 : Gross Domestic Product by Type of Expenditure at Current Prices, 1947 - 1986, Malaysia (cont'd.)
Tahun/Year 1983 1984 1985 1986
1. Perbelanjaan Penggunaan Akhir
47,473 51,335 52,127 48,626
Final Consumption Expenditure
a) Kerajaan 11,015 11,741 11,844 12,127
Government
b) Persendirian 36,458 39,594 40,283 36,499
Private
2. Perubahan Stok 1,253 1,306 -1,757 -261
Changes in Stocks
3. Pembentukan Modal Tetap Kasar 25,213 25,391 23,124 18,865
Gross Fixed Capital Formation
4. Eksport Barang dan Perkhidmatan 36,298 43,171 42,537 40,305
Exports of Goods and Services
5. Import Barang dan Perkhidmatan 39,793 41,653 38,561 35,941
Imports of Goods and Services
6. KDNK pada Harga Pembeli 70,444 79,550 77,470 71,594
GDP at Purchasers' Prices
7. Bayaran Pendapatan Faktor Bersih dari Luar Negeri -4,411 -5,368 -5,508 -4,780
Net Factor Income Payments from Abroad
8. Pendapatan Negara Kasar (PNK) 66,033 74,182 71,962 66,814
Gross National Income (GNI)
9. Penduduk ('000) 15,048 15,450 15,883 16,329
Population
10. PNK Per Kapita (RM) 4,388 4,801 4,531 4,092
GNI Per Capita (RM)
16
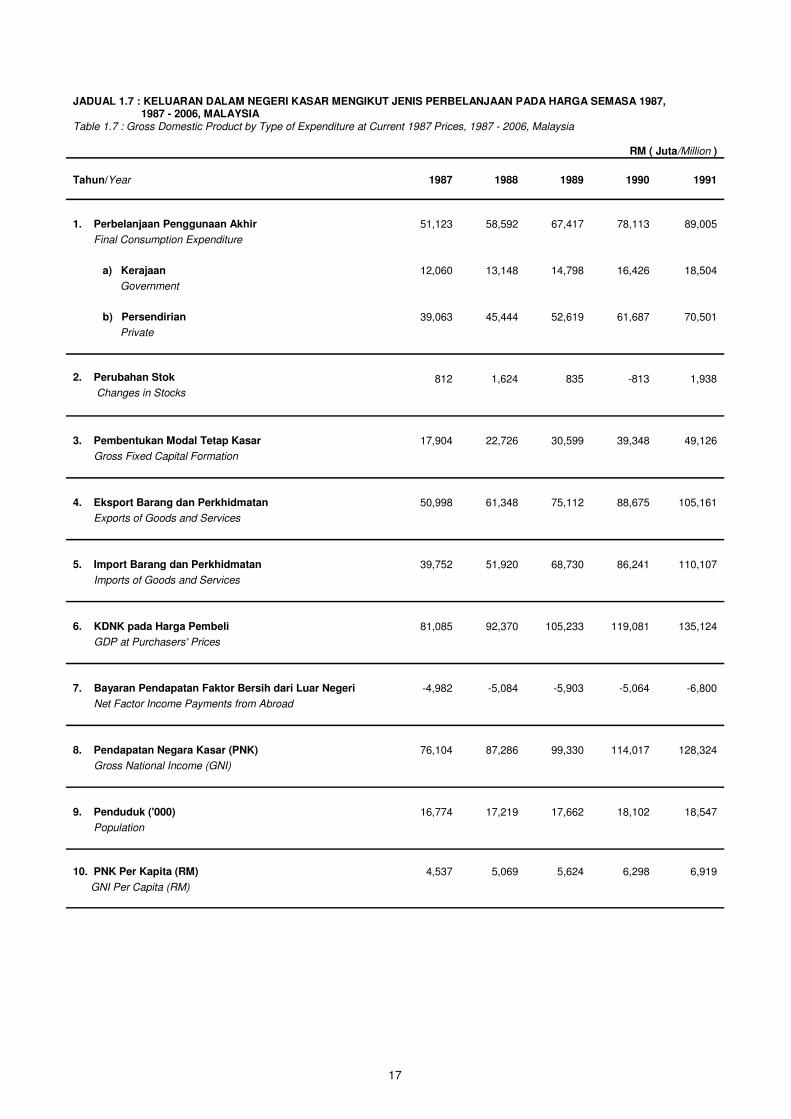
JADUAL 1.7 : KELUARAN DALAM NEGERI KASAR MENGIKUT JENIS PERBELANJAAN PADA HARGA SEMASA 1987, 1987 - 2006, MALAYSIA Table 1.7 : Gross Domestic Product by Type of Expenditure at Current 1987 Prices, 1987 - 2006, Malaysia
Tahun/Year 1987 1988 1989 1990 1991
1. Perbelanjaan Penggunaan Akhir
51,123 58,592 67,417 78,113 89,005
Final Consumption Expenditure
a) Kerajaan 12,060 13,148 14,798 16,426 18,504
Government
b) Persendirian 39,063 45,444 52,619 61,687 70,501
Private
2. Perubahan Stok 812 1,624 835 -813 1,938
Changes in Stocks
3. Pembentukan Modal Tetap Kasar 17,904 22,726 30,599 39,348 49,126
Gross Fixed Capital Formation
4. Eksport Barang dan Perkhidmatan 50,998 61,348 75,112 88,675 105,161
Exports of Goods and Services
5. Import Barang dan Perkhidmatan 39,752 51,920 68,730 86,241 110,107
Imports of Goods and Services
6. KDNK pada Harga Pembeli 81,085 92,370 105,233 119,081 135,124
GDP at Purchasers' Prices
7. Bayaran Pendapatan Faktor Bersih dari Luar Negeri -4,982 -5,084 -5,903 -5,064 -6,800
Net Factor Income Payments from Abroad
8. Pendapatan Negara Kasar (PNK) 76,104 87,286 99,330 114,017 128,324
Gross National Income (GNI)
9. Penduduk ('000) 16,774 17,219 17,662 18,102 18,547
Population
10. PNK Per Kapita (RM) 4,537 5,069 5,624 6,298 6,919
GNI Per Capita (RM)
RM ( Juta/Million )
17
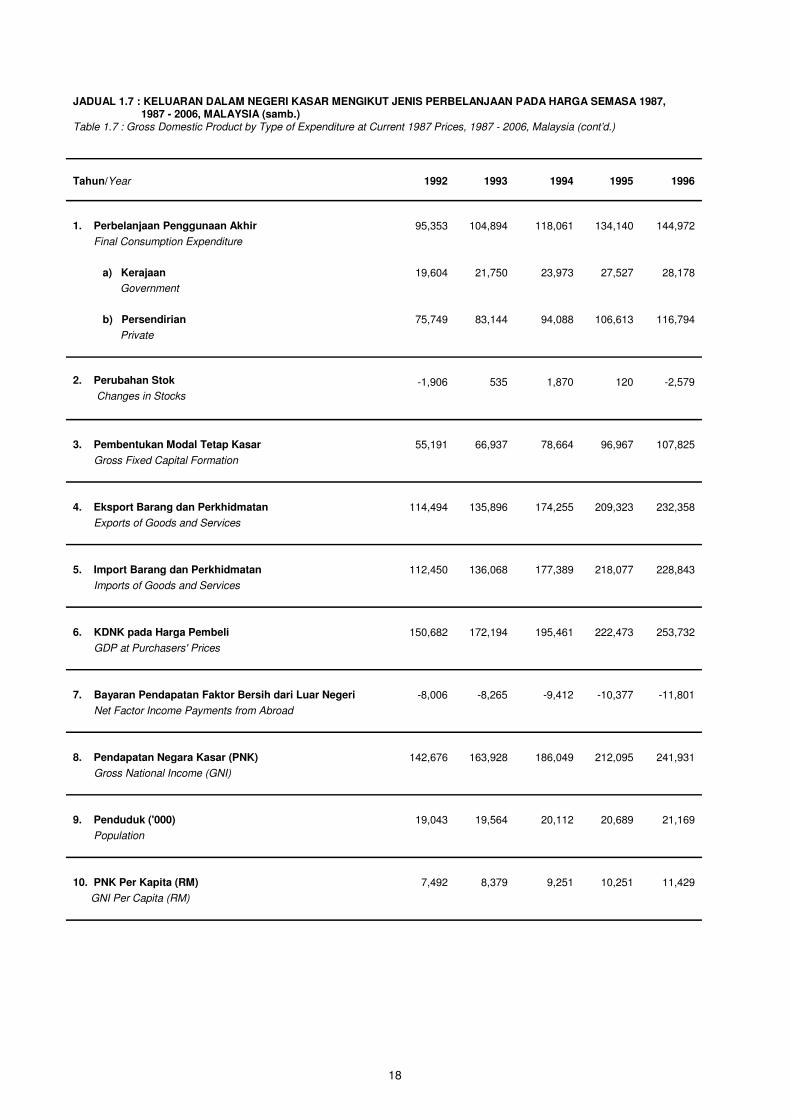
JADUAL 1.7 : KELUARAN DALAM NEGERI KASAR MENGIKUT JENIS PERBELANJAAN PADA HARGA SEMASA 1987, 1987 - 2006, MALAYSIA (samb.) Table 1.7 : Gross Domestic Product by Type of Expenditure at Current 1987 Prices, 1987 - 2006, Malaysia (cont’d.)
Tahun/Year 1992 1993 1994 1995 1996
1. Perbelanjaan Penggunaan Akhir
95,353 104,894 118,061 134,140 144,972
Final Consumption Expenditure
a) Kerajaan 19,604 21,750 23,973 27,527 28,178
Government
b) Persendirian 75,749 83,144 94,088 106,613 116,794
Private
2. Perubahan Stok -1,906 535 1,870 120 -2,579
Changes in Stocks
3. Pembentukan Modal Tetap Kasar 55,191 66,937 78,664 96,967 107,825
Gross Fixed Capital Formation
4. Eksport Barang dan Perkhidmatan 114,494 135,896 174,255 209,323 232,358
Exports of Goods and Services
5. Import Barang dan Perkhidmatan 112,450 136,068 177,389 218,077 228,843
Imports of Goods and Services
6. KDNK pada Harga Pembeli 150,682 172,194 195,461 222,473 253,732
GDP at Purchasers' Prices
7. Bayaran Pendapatan Faktor Bersih dari Luar Negeri -8,006 -8,265 -9,412 -10,377 -11,801
Net Factor Income Payments from Abroad
8. Pendapatan Negara Kasar (PNK) 142,676 163,928 186,049 212,095 241,931
Gross National Income (GNI)
9. Penduduk ('000) 19,043 19,564 20,112 20,689 21,169
Population
10. PNK Per Kapita (RM) 7,492 8,379 9,251 10,251 11,429
GNI Per Capita (RM)
18
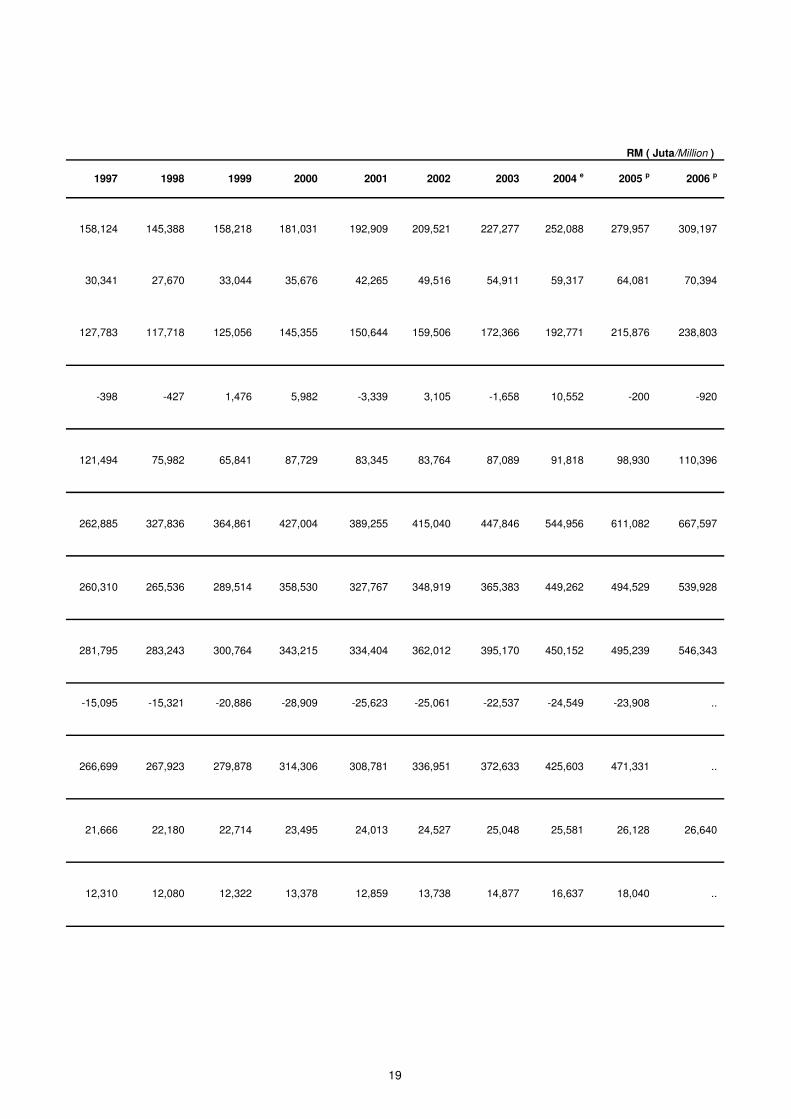
RM ( Juta/Million )
1997 1998 1999 2000 2001 2002 2003 2004 e 2005 p 2006 p
158,124 145,388 158,218 181,031 192,909 209,521
227,277
252,088
279,957
309,197
30,341 27,670 33,044 35,676 42,265 49,516
54,911
59,317
64,081
70,394
127,783 117,718 125,056 145,355 150,644 159,506
172,366
192,771
215,876
238,803
-398 -427 1,476 5,982 -3,339 3,105 -1,658
10,552 -200 -920
121,494 75,982 65,841 87,729 83,345 83,764
87,089
91,818
98,930
110,396
262,885 327,836 364,861 427,004 389,255 415,040
447,846
544,956
611,082
667,597
260,310 265,536 289,514 358,530 327,767 348,919
365,383
449,262
494,529
539,928
281,795 283,243 300,764 343,215 334,404 362,012
395,170
450,152
495,239
546,343
-15,095 -15,321 -20,886 -28,909 -25,623 -25,061 -22,537 -24,549 -23,908 ..
266,699 267,923 279,878 314,306 308,781 336,951
372,633
425,603 471,331 ..
21,666 22,180 22,714 23,495 24,013 24,527
25,048
25,581
26,128
26,640
12,310 12,080 12,322 13,378 12,859 13,738
14,877
16,637 18,040 ..
19
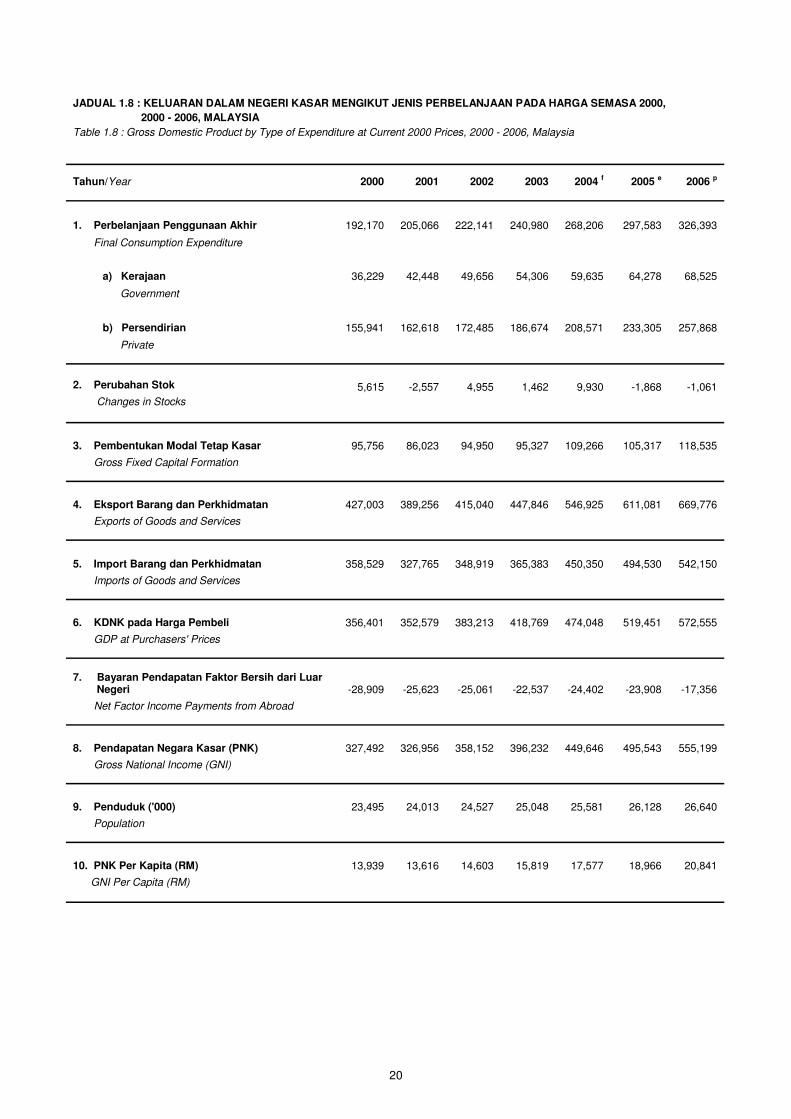
2000 - 2006, MALAYSIA
Table 1.8 : Gross Domestic Product by Type of Expenditure at Current 2000 Prices, 2000 - 2006, Malaysia
Tahun/Year 2000 2001 2002 2003 2004 f 2005 e 2006 p
1. Perbelanjaan Penggunaan Akhir 192,170 205,066 222,141 240,980 268,206 297,583 326,393
Final Consumption Expenditure
a) Kerajaan 36,229 42,448 49,656 54,306 59,635 64,278 68,525
Government
b) Persendirian 155,941 162,618 172,485 186,674 208,571 233,305 257,868
Private
2. Perubahan Stok 5,615 -2,557 4,955 1,462 9,930 -1,868 -1,061
Changes in Stocks
3. Pembentukan Modal Tetap Kasar 95,756 86,023 94,950 95,327 109,266 105,317 118,535
Gross Fixed Capital Formation
4. Eksport Barang dan Perkhidmatan 427,003 389,256 415,040 447,846 546,925 611,081 669,776
Exports of Goods and Services
5. Import Barang dan Perkhidmatan 358,529 327,765 348,919 365,383 450,350 494,530 542,150
Imports of Goods and Services
6. KDNK pada Harga Pembeli 356,401 352,579 383,213 418,769 474,048 519,451 572,555
GDP at Purchasers' Prices
7. Bayaran Pendapatan Faktor Bersih dari Luar Negeri -28,909 -25,623 -25,061 -22,537 -24,402 -23,908 -17,356
Net Factor Income Payments from Abroad
8. Pendapatan Negara Kasar (PNK) 327,492 326,956 358,152 396,232 449,646 495,543 555,199
Gross National Income (GNI)
9. Penduduk ('000) 23,495 24,013 24,527 25,048 25,581 26,128 26,640
Population
10. PNK Per Kapita (RM) 13,939 13,616 14,603 15,819 17,577 18,966 20,841
GNI Per Capita (RM)
JADUAL 1.8 : KELUARAN DALAM NEGERI KASAR MENGIKUT JENIS PERBELANJAAN PADA HARGA SEMASA 2000,
20
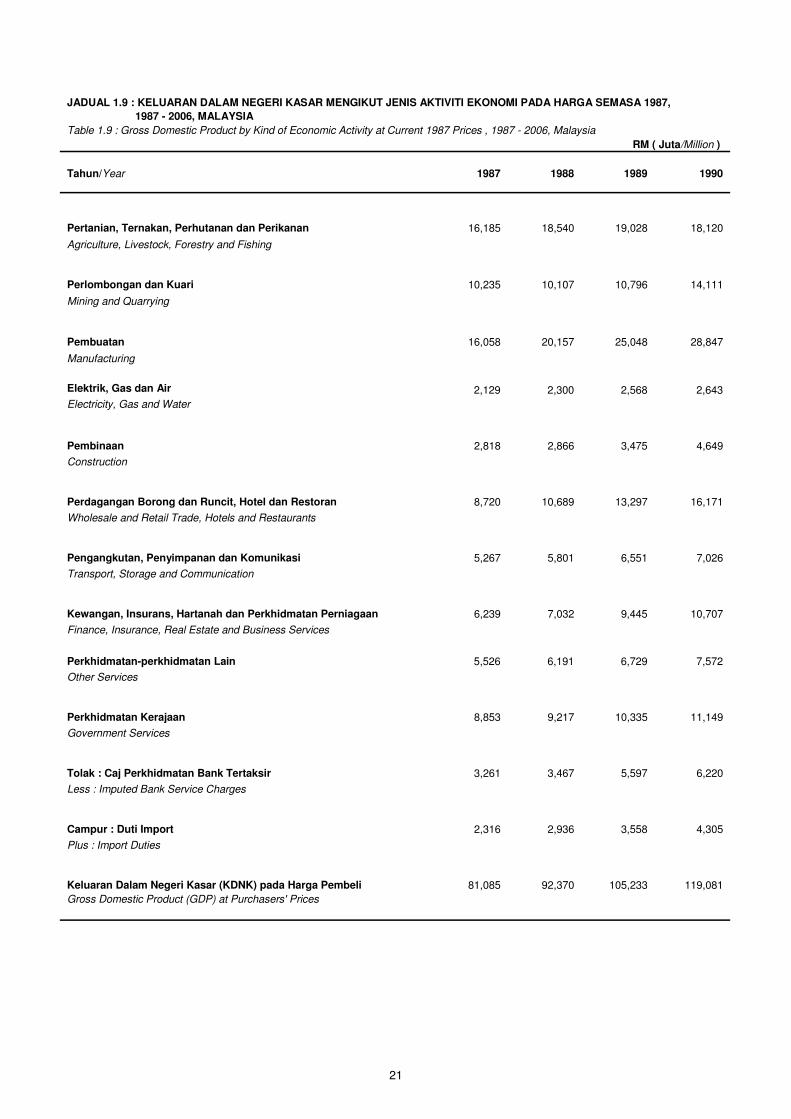
JADUAL 1.9 : KELUARAN DALAM NEGERI KASAR MENGIKUT JENIS AKTIVITI EKONOMI PADA HARGA SEMASA 1987,
1987 - 2006, MALAYSIA
Table 1.9 : Gross Domestic Product by Kind of Economic Activity at Current 1987 Prices , 1987 - 2006, Malaysia
Tahun/Year 1987 1988 1989 1990
Pertanian, Ternakan, Perhutanan dan Perikanan
16,185 18,540 19,028 18,120
Agriculture, Livestock, Forestry and Fishing
Perlombongan dan Kuari 10,235 10,107 10,796 14,111
Mining and Quarrying
Pembuatan 16,058 20,157 25,048 28,847
Manufacturing
Elektrik, Gas dan Air 2,129 2,300 2,568 2,643
Electricity, Gas and Water
Pembinaan 2,818 2,866 3,475 4,649
Construction
Perdagangan Borong dan Runcit, Hotel dan Restoran 8,720 10,689 13,297 16,171
Wholesale and Retail Trade, Hotels and Restaurants
Pengangkutan, Penyimpanan dan Komunikasi 5,267 5,801 6,551 7,026
Transport, Storage and Communication
Kewangan, Insurans, Hartanah dan Perkhidmatan Perniagaan 6,239 7,032 9,445 10,707
Finance, Insurance, Real Estate and Business Services
Perkhidmatan-perkhidmatan Lain 5,526 6,191 6,729 7,572
Other Services
Perkhidmatan Kerajaan 8,853 9,217 10,335 11,149
Government Services
Tolak : Caj Perkhidmatan Bank Tertaksir 3,261 3,467 5,597 6,220
Less : Imputed Bank Service Charges
Campur : Duti Import 2,316 2,936 3,558 4,305
Plus : Import Duties
Keluaran Dalam Negeri Kasar (KDNK) pada Harga Pembeli 81,085 92,370 105,233 119,081
Gross Domestic Product (GDP) at Purchasers' Prices
RM ( Juta/Million )
21
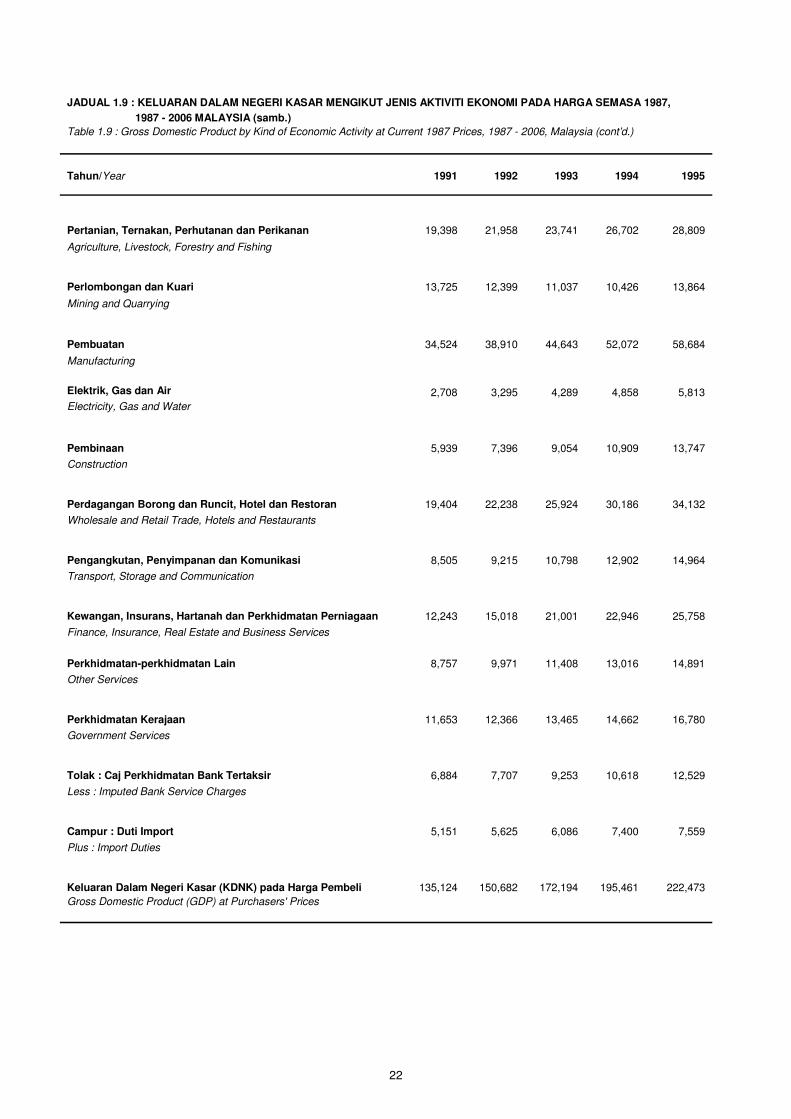
JADUAL 1.9 : KELUARAN DALAM NEGERI KASAR MENGIKUT JENIS AKTIVITI EKONOMI PADA HARGA SEMASA 1987,
1987 - 2006 MALAYSIA (samb.)
Tahun/Year 1991 1992 1993 1994 1995
Pertanian, Ternakan, Perhutanan dan Perikanan
19,398
21,958
23,741
26,702 28,809
Agriculture, Livestock, Forestry and Fishing
Perlombongan dan Kuari 13,725
12,399
11,037
10,426 13,864
Mining and Quarrying
Pembuatan 34,524
38,910
44,643
52,072 58,684
Manufacturing
Elektrik, Gas dan Air 2,708 3,295 4,289 4,858 5,813
Electricity, Gas and Water
Pembinaan 5,939
7,396
9,054
10,909 13,747
Construction
Perdagangan Borong dan Runcit, Hotel dan Restoran 19,404
22,238
25,924
30,186 34,132
Wholesale and Retail Trade, Hotels and Restaurants
Pengangkutan, Penyimpanan dan Komunikasi 8,505
9,215
10,798
12,902 14,964
Transport, Storage and Communication
Kewangan, Insurans, Hartanah dan Perkhidmatan Perniagaan 12,243
15,018
21,001
22,946 25,758
Finance, Insurance, Real Estate and Business Services
Perkhidmatan-perkhidmatan Lain 8,757 9,971 11,408 13,016 14,891
Other Services
Perkhidmatan Kerajaan 11,653
12,366
13,465
14,662 16,780
Government Services
Tolak : Caj Perkhidmatan Bank Tertaksir 6,884
7,707
9,253
10,618 12,529
Less : Imputed Bank Service Charges
Campur : Duti Import 5,151
5,625
6,086
7,400 7,559
Plus : Import Duties
Keluaran Dalam Negeri Kasar (KDNK) pada Harga Pembeli 135,124
150,682
172,194
195,461 222,473
Gross Domestic Product (GDP) at Purchasers' Prices
Table 1.9 : Gross Domestic Product by Kind of Economic Activity at Current 1987 Prices, 1987 - 2006, Malaysia (cont’d.)
22
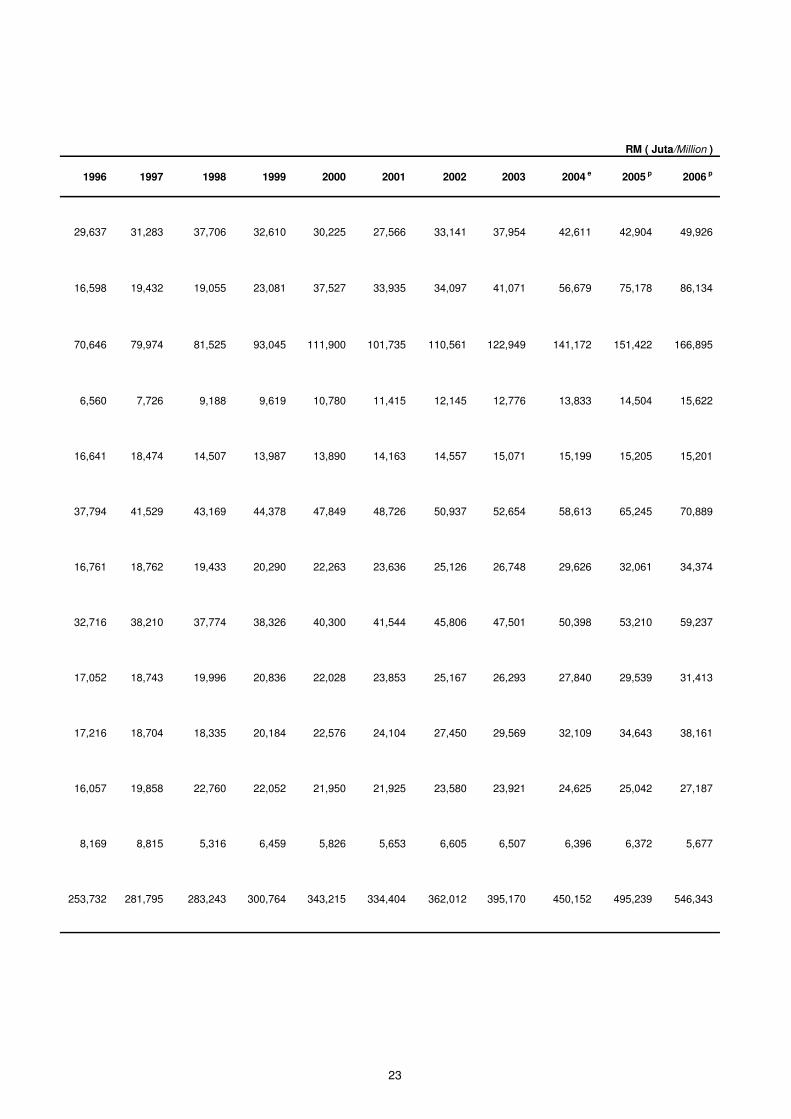
1996 1997 1998 1999 2000 2001 2002 2003 2005 p 2006 p
29,637
31,283 37,706
32,610
30,225 27,566 33,141 37,954 42,904 49,926
16,598
19,432 19,055
23,081
37,527 33,935 34,097 41,071 75,178 86,134
70,646
79,974 81,525
93,045
111,900 101,735 110,561 122,949 151,422 166,895
6,560 7,726 9,188
9,619
10,780 11,415 12,145 12,776 14,504 15,622
16,641
18,474 14,507
13,987
13,890 14,163 14,557 15,071 15,205 15,201
37,794
41,529 43,169
44,378
47,849 48,726 50,937 52,654 65,245 70,889
16,761
18,762 19,433
20,290
22,263 23,636 25,126 26,748 32,061 34,374
32,716
38,210 37,774
38,326
40,300 41,544 45,806 47,501 53,210 59,237
17,052 18,743 19,996
20,836
22,028 23,853 25,167 26,293 29,539 31,413
17,216
18,704 18,335
20,184
22,576 24,104 27,450 29,569 34,643 38,161
16,057
19,858 22,760
22,052
21,950 21,925 23,580 23,921 25,042 27,187
8,169
8,815 5,316
6,459
5,826 5,653 6,605 6,507 6,372 5,677
253,732
281,795 283,243
300,764
343,215 334,404 362,012 395,170 495,239 546,343
RM ( Juta/Million )
2004 e
42,611
56,679
141,172
13,833
15,199
58,613
29,626
50,398
27,840
32,109
24,625
6,396
450,152
23
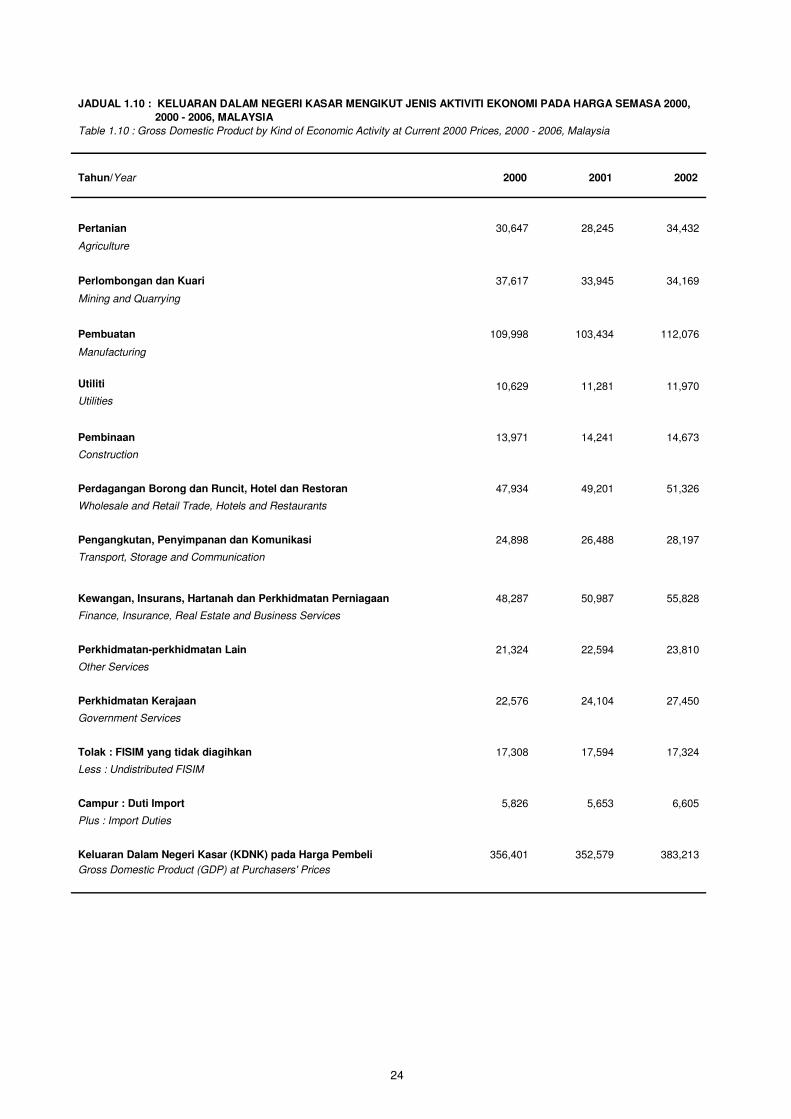
JADUAL 1.10 : KELUARAN DALAM NEGERI KASAR MENGIKUT JENIS AKTIVITI EKONOMI PADA HARGA SEMASA 2000,
2000 - 2006, MALAYSIA
Table 1.10 : Gross Domestic Product by Kind of Economic Activity at Current 2000 Prices, 2000 - 2006, Malaysia
Tahun/Year 2000 2001 2002
Pertanian
30,647 28,245 34,432
Agriculture
Perlombongan dan Kuari 37,617 33,945 34,169
Mining and Quarrying
Pembuatan 109,998 103,434 112,076
Manufacturing
Utiliti 10,629 11,281 11,970
Utilities
Pembinaan 13,971 14,241 14,673
Construction
Perdagangan Borong dan Runcit, Hotel dan Restoran 47,934 49,201 51,326
Wholesale and Retail Trade, Hotels and Restaurants
Pengangkutan, Penyimpanan dan Komunikasi 24,898 26,488 28,197
Transport, Storage and Communication
Kewangan, Insurans, Hartanah dan Perkhidmatan Perniagaan 48,287 50,987 55,828
Finance, Insurance, Real Estate and Business Services
Perkhidmatan-perkhidmatan Lain 21,324 22,594 23,810
Other Services
Perkhidmatan Kerajaan 22,576 24,104 27,450
Government Services
Tolak : FISIM yang tidak diagihkan 17,308 17,594 17,324
Less : Undistributed FISIM
Campur : Duti Import 5,826 5,653 6,605
Plus : Import Duties
Keluaran Dalam Negeri Kasar (KDNK) pada Harga Pembeli 356,401 352,579 383,213
Gross Domestic Product (GDP) at Purchasers' Prices
24
25
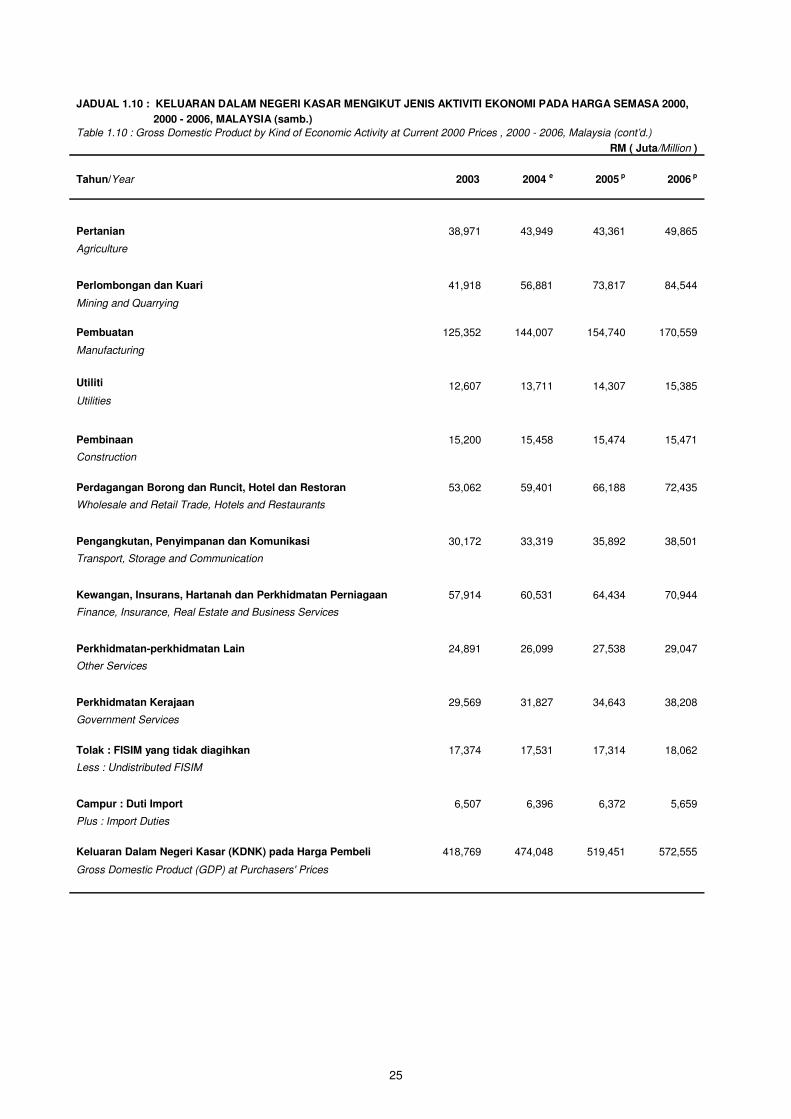
JADUAL 1.10 : KELUARAN DALAM NEGERI KASAR MENGIKUT JENIS AKTIVITI EKONOMI PADA HARGA SEMASA 2000,
2000 - 2006, MALAYSIA (samb.)
Table 1.10 : Gross Domestic Product by Kind of Economic Activity at Current 2000 Prices , 2000 - 2006, Malaysia (cont’d.)
Tahun/Year 2003 2004 e 2005 p 2006 p
Pertanian
38,971
43,949 43,361 49,865
Agriculture
Perlombongan dan Kuari
41,918
56,881
73,817
84,544
Mining and Quarrying
Pembuatan 125,352 144,007 154,740 170,559
Manufacturing
Utiliti 12,607 13,711 14,307 15,385
Utilities
Pembinaan 15,200 15,458 15,474 15,471
Construction
Perdagangan Borong dan Runcit, Hotel dan Restoran 53,062 59,401 66,188 72,435
Wholesale and Retail Trade, Hotels and Restaurants
Pengangkutan, Penyimpanan dan Komunikasi 30,172 33,319 35,892 38,501
Transport, Storage and Communication
Kewangan, Insurans, Hartanah dan Perkhidmatan Perniagaan 57,914 60,531 64,434 70,944
Finance, Insurance, Real Estate and Business Services
Perkhidmatan-perkhidmatan Lain 24,891 26,099 27,538 29,047
Other Services
Perkhidmatan Kerajaan 29,569 31,827 34,643 38,208
Government Services
Tolak : FISIM yang tidak diagihkan 17,374 17,531 17,314 18,062
Less : Undistributed FISIM
Campur : Duti Import 6,507 6,396 6,372 5,659
Plus : Import Duties
Keluaran Dalam Negeri Kasar (KDNK) pada Harga Pembeli 418,769 474,048 519,451 572,555
Gross Domestic Product (GDP) at Purchasers' Prices
RM ( Juta/Million )
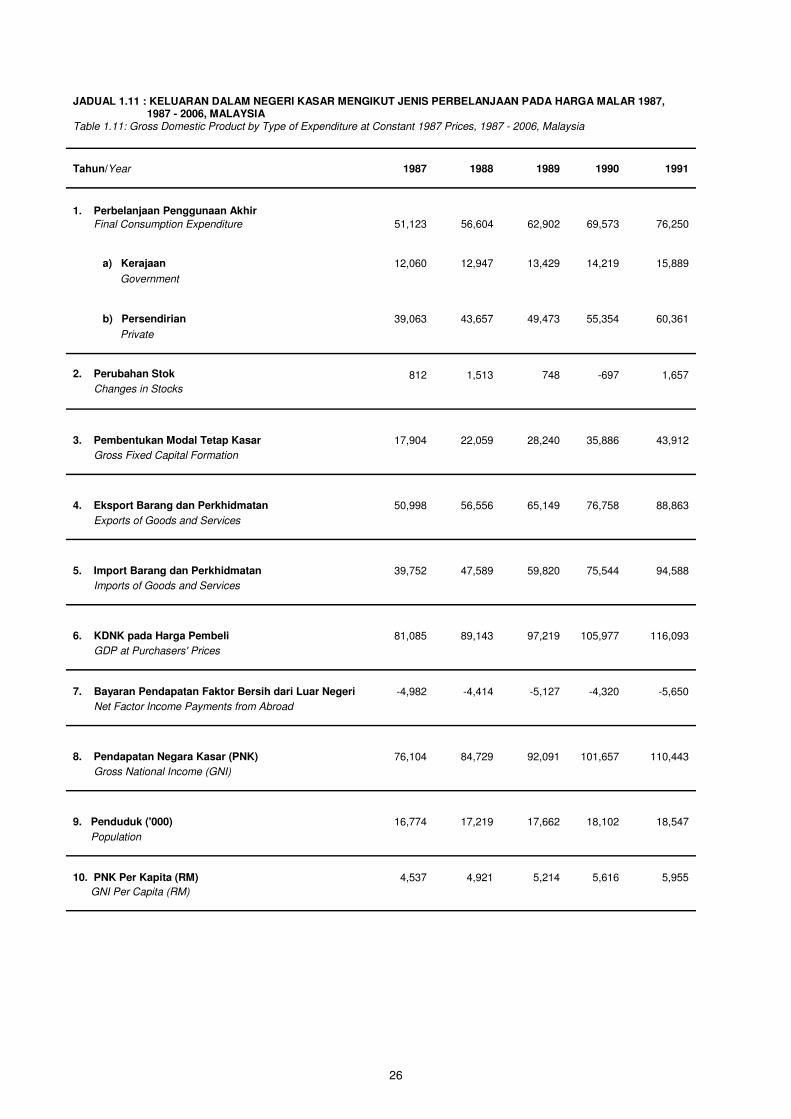
JADUAL 1.11 : KELUARAN DALAM NEGERI KASAR MENGIKUT JENIS PERBELANJAAN PADA HARGA MALAR 1987, 1987 - 2006, MALAYSIA Table 1.11: Gross Domestic Product by Type of Expenditure at Constant 1987 Prices, 1987 - 2006, Malaysia
Tahun/Year 1987 1988 1989 1990 1991
1. Perbelanjaan Penggunaan Akhir
Final Consumption Expenditure 51,123 56,604 62,902 69,573 76,250
a) Kerajaan
12,060
12,947
13,429
14,219 15,889
Government
b) Persendirian
39,063
43,657
49,473
55,354 60,361
Private
2. Perubahan Stok 812 1,513 748 -697 1,657
Changes in Stocks
3. Pembentukan Modal Tetap Kasar
17,904
22,059
28,240
35,886 43,912
Gross Fixed Capital Formation
4. Eksport Barang dan Perkhidmatan
50,998
56,556
65,149
76,758 88,863
Exports of Goods and Services
5. Import Barang dan Perkhidmatan
39,752
47,589
59,820
75,544 94,588
Imports of Goods and Services
6. KDNK pada Harga Pembeli
81,085
89,143
97,219
105,977 116,093
GDP at Purchasers' Prices
7. Bayaran Pendapatan Faktor Bersih dari Luar Negeri -4,982 -4,414 -5,127 -4,320 -5,650
Net Factor Income Payments from Abroad
8. Pendapatan Negara Kasar (PNK)
76,104
84,729
92,091
101,657 110,443
Gross National Income (GNI)
9. Penduduk ('000)
16,774
17,219
17,662
18,102 18,547
Population
10. PNK Per Kapita (RM) 4,537 4,921 5,214 5,616 5,955
GNI Per Capita (RM)
26
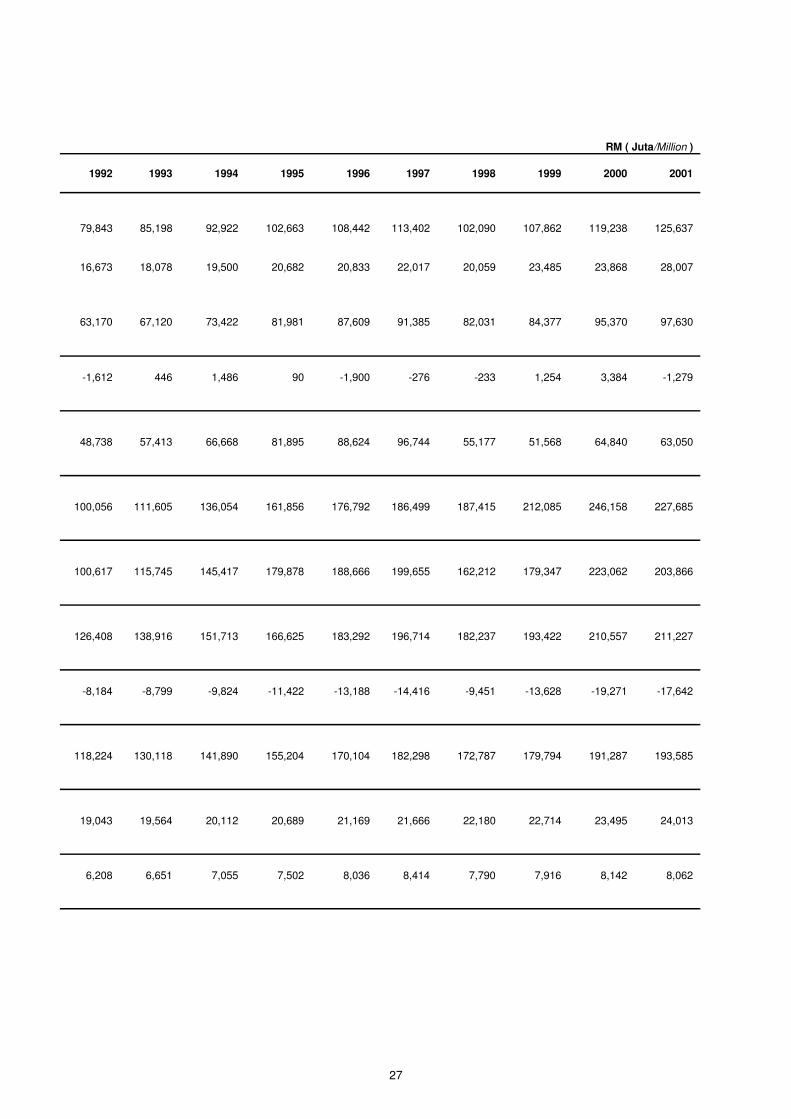
RM ( Juta/Million )
1992 1993 1994 1995 1996 1997 1998 1999 2000 2001
79,843 85,198 92,922 102,663 108,442 113,402 102,090 107,862 119,238 125,637
16,673
18,078 19,500 20,682 20,833 22,017 20,059 23,485 23,868 28,007
63,170
67,120 73,422 81,981 87,609 91,385 82,031 84,377 95,370 97,630
-1,612 446 1,486 90 -1,900 -276 -233 1,254 3,384 -1,279
48,738
57,413 66,668 81,895 88,624 96,744 55,177 51,568 64,840 63,050
100,056
111,605 136,054 161,856 176,792 186,499 187,415 212,085 246,158 227,685
100,617
115,745 145,417 179,878 188,666 199,655 162,212 179,347 223,062 203,866
126,408
138,916 151,713 166,625 183,292 196,714 182,237 193,422 210,557 211,227
-8,184 -8,799 -9,824 -11,422 -13,188 -14,416 -9,451 -13,628 -19,271 -17,642
118,224
130,118 141,890 155,204 170,104 182,298 172,787 179,794 191,287 193,585
19,043
19,564 20,112 20,689 21,169 21,666 22,180 22,714 23,495 24,013
6,208 6,651 7,055 7,502 8,036 8,414 7,790 7,916 8,142 8,062
27
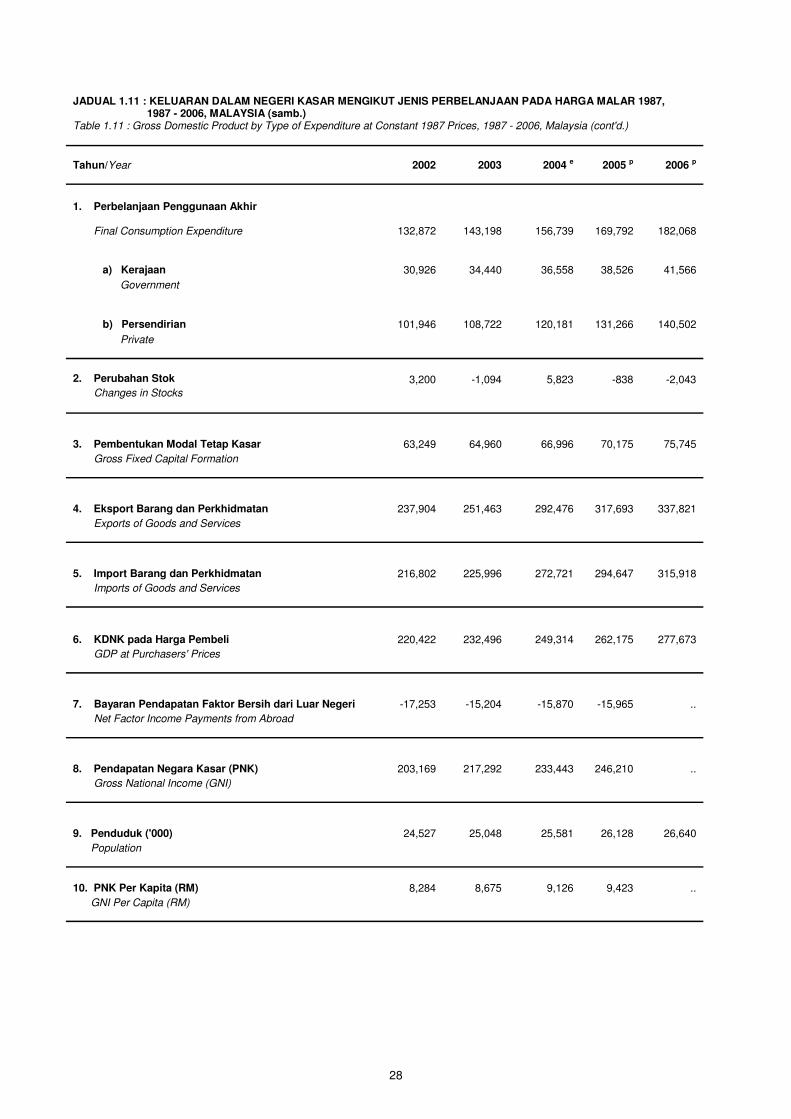
JADUAL 1.11 : KELUARAN DALAM NEGERI KASAR MENGIKUT JENIS PERBELANJAAN PADA HARGA MALAR 1987, 1987 - 2006, MALAYSIA (samb.) Table 1.11 : Gross Domestic Product by Type of Expenditure at Constant 1987 Prices, 1987 - 2006, Malaysia (cont'd.)
Tahun/Year 2002 2003 2004 e 2005 p 2006 p
1. Perbelanjaan Penggunaan Akhir
Final Consumption Expenditure 132,872 143,198 156,739 169,792 182,068
a) Kerajaan 30,926 34,440 36,558 38,526 41,566
Government
b) Persendirian 101,946 108,722 120,181 131,266 140,502
Private
2. Perubahan Stok 3,200 -1,094 5,823 -838 -2,043
Changes in Stocks
3. Pembentukan Modal Tetap Kasar 63,249 64,960 66,996 70,175 75,745
Gross Fixed Capital Formation
4. Eksport Barang dan Perkhidmatan 237,904 251,463 292,476 317,693 337,821
Exports of Goods and Services
5. Import Barang dan Perkhidmatan 216,802 225,996 272,721 294,647 315,918
Imports of Goods and Services
6. KDNK pada Harga Pembeli 220,422 232,496 249,314 262,175 277,673
GDP at Purchasers' Prices
7. Bayaran Pendapatan Faktor Bersih dari Luar Negeri -17,253 -15,204 -15,870 -15,965 ..
Net Factor Income Payments from Abroad
8. Pendapatan Negara Kasar (PNK) 203,169 217,292 233,443 246,210 ..
Gross National Income (GNI)
9. Penduduk ('000) 24,527 25,048 25,581 26,128 26,640
Population
10. PNK Per Kapita (RM) 8,284 8,675 9,126 9,423 ..
GNI Per Capita (RM)
28
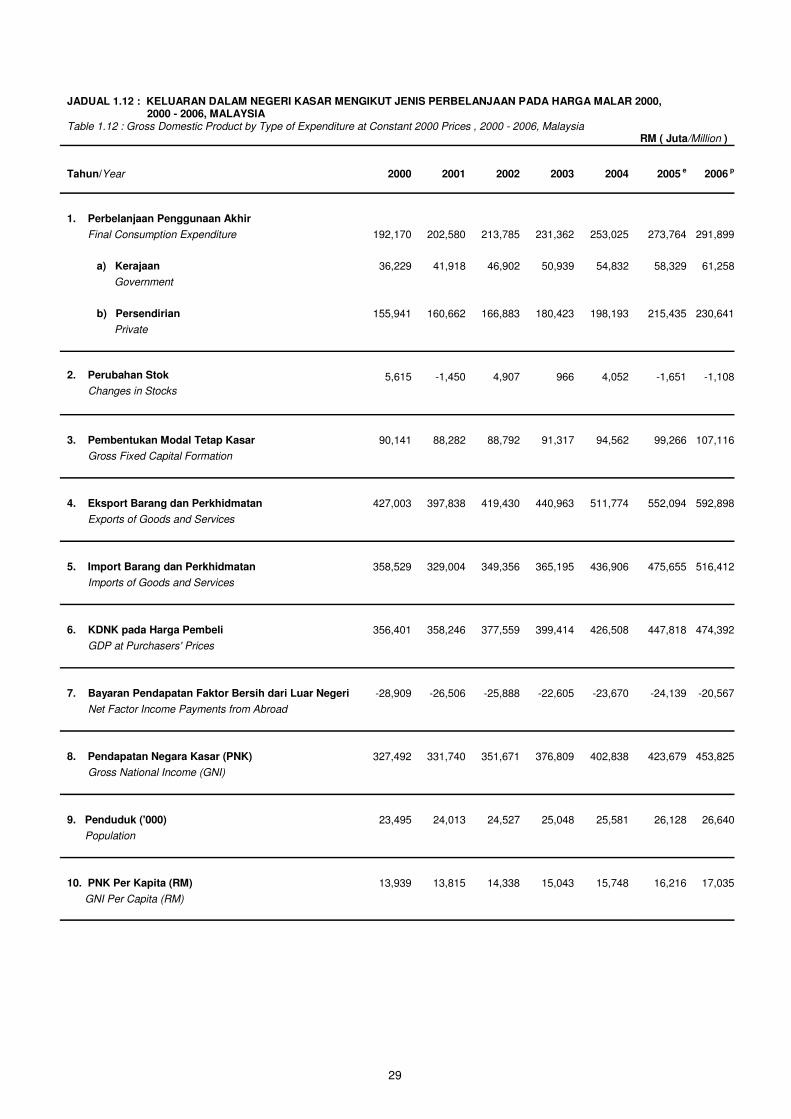
JADUAL 1.12 : KELUARAN DALAM NEGERI KASAR MENGIKUT JENIS PERBELANJAAN PADA HARGA MALAR 2000, 2000 - 2006, MALAYSIA Table 1.12 : Gross Domestic Product by Type of Expenditure at Constant 2000 Prices , 2000 - 2006, Malaysia
Tahun/Year 2000 2001 2002 2003 2004 2005 e 2006 p
1. Perbelanjaan Penggunaan Akhir
Final Consumption Expenditure 192,170 202,580 213,785 231,362 253,025 273,764 291,899
a) Kerajaan 36,229 41,918 46,902 50,939 54,832 58,329 61,258
Government
b) Persendirian 155,941 160,662 166,883 180,423 198,193 215,435 230,641
Private
2. Perubahan Stok 5,615 -1,450 4,907 966 4,052 -1,651 -1,108
Changes in Stocks
3. Pembentukan Modal Tetap Kasar 90,141 88,282 88,792 91,317 94,562 99,266 107,116
Gross Fixed Capital Formation
4. Eksport Barang dan Perkhidmatan 427,003 397,838 419,430 440,963 511,774 552,094 592,898
Exports of Goods and Services
5. Import Barang dan Perkhidmatan 358,529 329,004 349,356 365,195 436,906 475,655 516,412
Imports of Goods and Services
6. KDNK pada Harga Pembeli 356,401 358,246 377,559 399,414 426,508 447,818 474,392
GDP at Purchasers' Prices
7. Bayaran Pendapatan Faktor Bersih dari Luar Negeri -28,909 -26,506 -25,888 -22,605 -23,670 -24,139 -20,567
Net Factor Income Payments from Abroad
8. Pendapatan Negara Kasar (PNK) 327,492 331,740 351,671 376,809 402,838 423,679 453,825
Gross National Income (GNI)
9. Penduduk ('000) 23,495 24,013 24,527 25,048 25,581 26,128 26,640
Population
10. PNK Per Kapita (RM) 13,939 13,815 14,338 15,043 15,748 16,216 17,035
GNI Per Capita (RM)
RM ( Juta/Million )
29
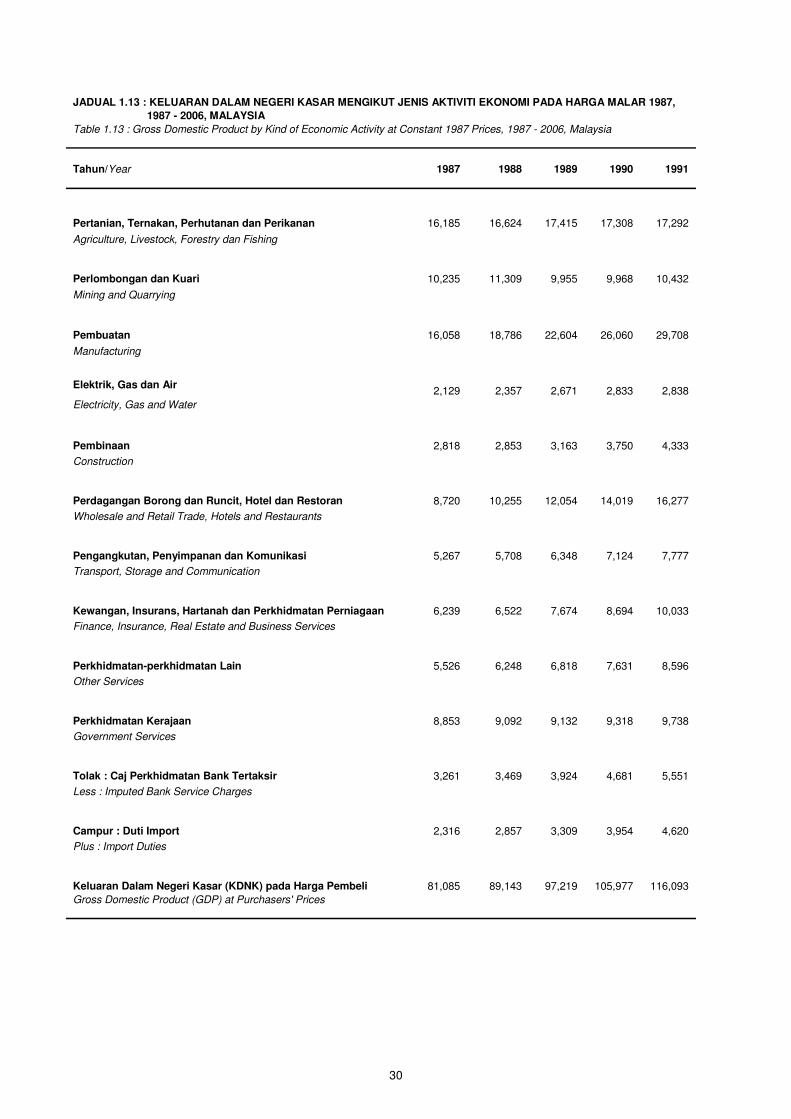
JADUAL 1.13 : KELUARAN DALAM NEGERI KASAR MENGIKUT JENIS AKTIVITI EKONOMI PADA HARGA MALAR 1987,
1987 - 2006, MALAYSIA
Table 1.13 : Gross Domestic Product by Kind of Economic Activity at Constant 1987 Prices, 1987 - 2006, Malaysia
Tahun/Year 1987 1988 1989 1990 1991
Pertanian, Ternakan, Perhutanan dan Perikanan
16,185
16,624
17,415
17,308
17,292
Agriculture, Livestock, Forestry dan Fishing
Perlombongan dan Kuari
10,235
11,309
9,955
9,968
10,432
Mining and Quarrying
Pembuatan
16,058
18,786
22,604
26,060
29,708
Manufacturing
Elektrik, Gas dan Air
2,129
2,357
2,671
2,833
2,838
Electricity, Gas and Water
Pembinaan
2,818
2,853
3,163
3,750
4,333
Construction
Perdagangan Borong dan Runcit, Hotel dan Restoran
8,720
10,255
12,054
14,019
16,277
Wholesale and Retail Trade, Hotels and Restaurants
Pengangkutan, Penyimpanan dan Komunikasi
5,267
5,708
6,348
7,124
7,777
Transport, Storage and Communication
Kewangan, Insurans, Hartanah dan Perkhidmatan Perniagaan
6,239
6,522
7,674
8,694
10,033
Finance, Insurance, Real Estate and Business Services
Perkhidmatan-perkhidmatan Lain
5,526
6,248
6,818
7,631
8,596
Other Services
Perkhidmatan Kerajaan
8,853
9,092
9,132
9,318
9,738
Government Services
Tolak : Caj Perkhidmatan Bank Tertaksir
3,261
3,469
3,924
4,681
5,551
Less : Imputed Bank Service Charges
Campur : Duti Import
2,316
2,857
3,309
3,954
4,620
Plus : Import Duties
Keluaran Dalam Negeri Kasar (KDNK) pada Harga Pembeli
81,085
89,143
97,219
105,977
116,093
Gross Domestic Product (GDP) at Purchasers' Prices
30
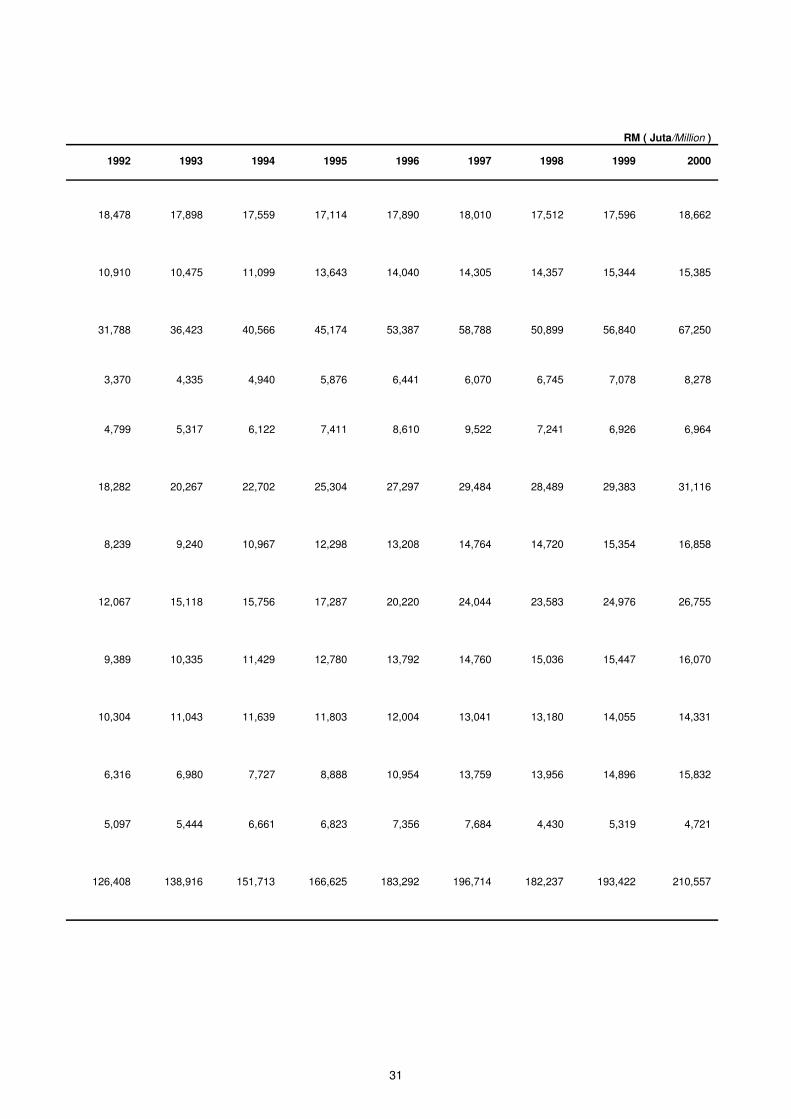
1992 1993 1994 1995 1996 1997 1998 1999 2000
18,478
17,898
17,559
17,114
17,890
18,010
17,512
17,596 18,662
10,910
10,475
11,099
13,643
14,040
14,305
14,357
15,344 15,385
31,788
36,423
40,566
45,174
53,387
58,788
50,899
56,840 67,250
3,370 4,335 4,940 5,876 6,441 6,070 6,745 7,078 8,278
4,799 5,317 6,122 7,411 8,610 9,522 7,241 6,926 6,964
18,282
20,267
22,702
25,304
27,297
29,484
28,489
29,383 31,116
8,239 9,240
10,967
12,298
13,208
14,764
14,720
15,354 16,858
12,067
15,118
15,756
17,287
20,220
24,044
23,583
24,976 26,755
9,389
10,335 11,429 12,780 13,792 14,760 15,036
15,447 16,070
10,304
11,043
11,639
11,803
12,004
13,041
13,180
14,055 14,331
6,316 6,980 7,727 8,888
10,954
13,759
13,956
14,896 15,832
5,097 5,444 6,661 6,823 7,356 7,684 4,430 5,319 4,721
126,408
138,916
151,713
166,625
183,292
196,714
182,237
193,422 210,557
RM ( Juta/Million )
31

1987 - 2006, MALAYSIA (samb.) Table 1.13 : Gross Domestic Product by Kind of Economic Activity at Constant 1987 Prices, 1987 - 2006, Malaysia (cont'd.)
Tahun/Year 2001 2002 2003 2004 e 2005 p 2006 p
Pertanian, Ternakan, Perhutanan dan Perikanan
18,551
19,064
20,109
21,107
21,626
23,009
Agriculture, Livestock, Forestry dan Fishing
Perlombongan dan Kuari
15,160
15,810
16,720
17,372
17,504
17,465
Mining and Quarrying
Pembuatan
63,299
66,019
71,691
78,742
82,724
88,542
Manufacturing
Elektrik, Gas dan Air
8,568 9,075 9,594
10,297
10,873
11,402
Electricity, Gas and Water
Pembinaan
7,108 7,251 7,359 7,248 7,133 7,097
Construction
Perdagangan Borong dan Runcit, Hotel dan Restoran
31,907
32,732
33,235
35,626
38,459
40,726
Wholesale and Retail Trade, Hotels and Restaurants
Pengangkutan, Penyimpanan dan Komunikasi
18,249
18,996
20,011
21,701
23,045
24,491
Transport, Storage and Communication
Kewangan, Insurans, Hartanah dan Perkhidmatan Perniagaan
29,288
33,461
35,563
38,064
40,245
43,105
Finance, Insurance, Real Estate and Business Services
Perkhidmatan-perkhidmatan Lain
17,185
17,917
18,500
19,399
20,346
21,259
Other Services
Perkhidmatan Kerajaan
14,997
15,786
17,053
18,223
19,604
21,486
Government Services
Tolak : Caj Perkhidmatan Bank Tertaksir
17,678
21,073
22,622
23,461
24,296
25,215
Less : Imputed Bank Service Charges
Campur : Duti Import
4,594 5,384 5,282 4,995 4,912 4,306
Plus : Import Duties
Keluaran Dalam Negeri Kasar (KDNK) pada Harga Pembeli
211,227
220,422
232,496
249,314
262,175
277,673
Gross Domestic Product (GDP) at Purchasers' Prices
JADUAL 1.13 : KELUARAN DALAM NEGERI KASAR MENGIKUT JENIS AKTIVITI EKONOMI PADA HARGA MALAR 1987,
32
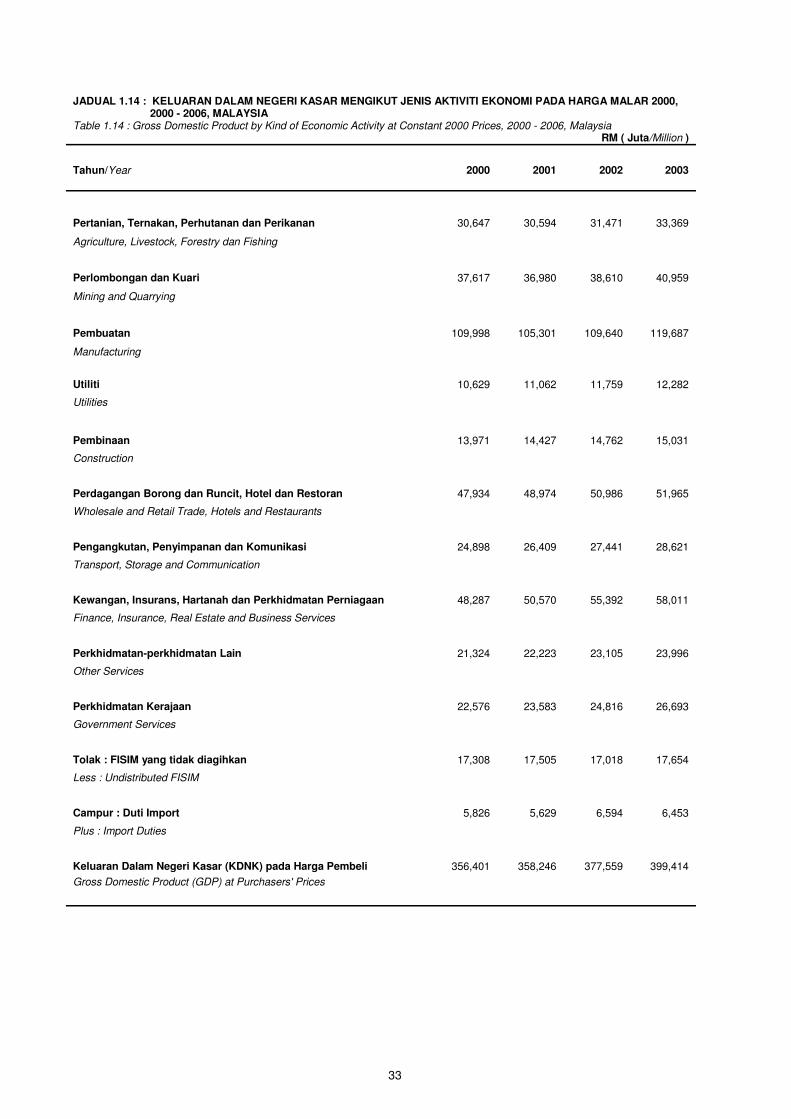
JADUAL 1.14 : KELUARAN DALAM NEGERI KASAR MENGIKUT JENIS AKTIVITI EKONOMI PADA HARGA MALAR 2000, 2000 - 2006, MALAYSIA Table 1.14 : Gross Domestic Product by Kind of Economic Activity at Constant 2000 Prices, 2000 - 2006, Malaysia
Tahun/Year 2000 2001 2002 2003
Pertanian, Ternakan, Perhutanan dan Perikanan
30,647 30,594 31,471 33,369
Agriculture, Livestock, Forestry dan Fishing
Perlombongan dan Kuari 37,617 36,980 38,610 40,959
Mining and Quarrying
Pembuatan 109,998 105,301 109,640 119,687
Manufacturing
Utiliti 10,629 11,062 11,759 12,282
Utilities
Pembinaan 13,971 14,427 14,762 15,031
Construction
Perdagangan Borong dan Runcit, Hotel dan Restoran 47,934 48,974 50,986 51,965
Wholesale and Retail Trade, Hotels and Restaurants
Pengangkutan, Penyimpanan dan Komunikasi 24,898 26,409 27,441 28,621
Transport, Storage and Communication
Kewangan, Insurans, Hartanah dan Perkhidmatan Perniagaan 48,287 50,570 55,392 58,011
Finance, Insurance, Real Estate and Business Services
Perkhidmatan-perkhidmatan Lain 21,324 22,223 23,105 23,996
Other Services
Perkhidmatan Kerajaan 22,576 23,583 24,816 26,693
Government Services
Tolak : FISIM yang tidak diagihkan 17,308 17,505 17,018 17,654
Less : Undistributed FISIM
Campur : Duti Import 5,826 5,629 6,594 6,453
Plus : Import Duties
Keluaran Dalam Negeri Kasar (KDNK) pada Harga Pembeli 356,401 358,246 377,559 399,414
Gross Domestic Product (GDP) at Purchasers' Prices
RM ( Juta/Million )
33
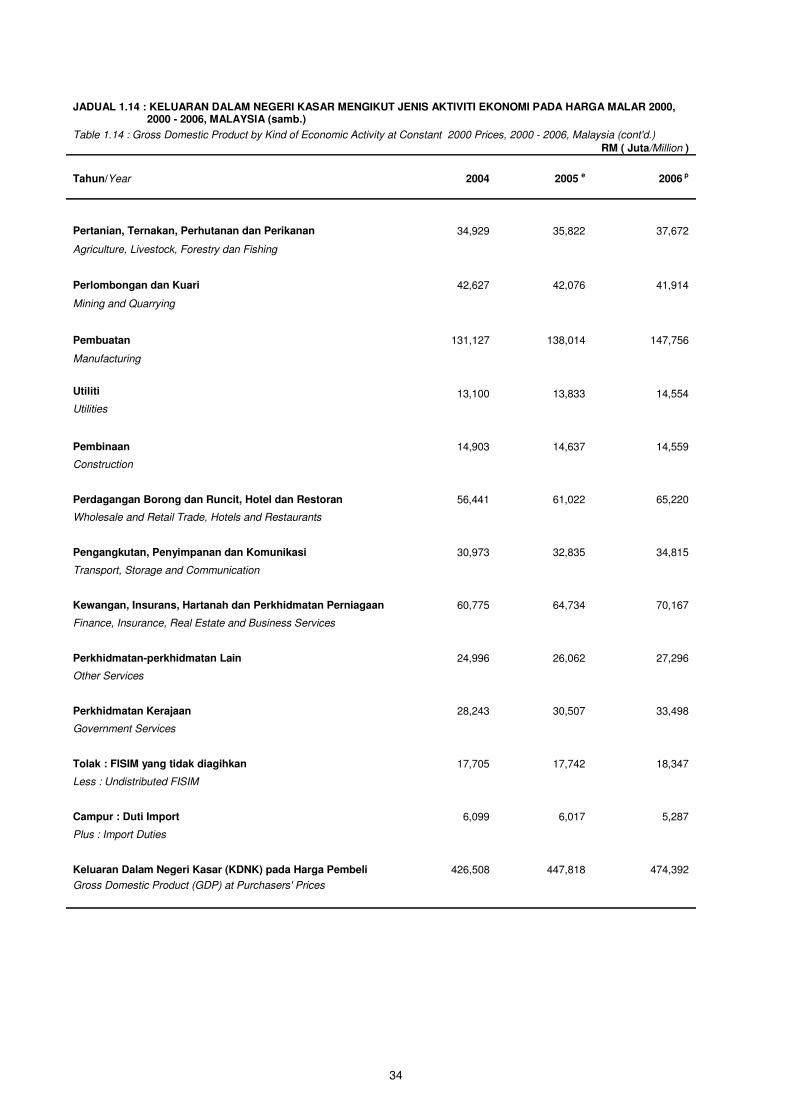
JADUAL 1.14 : KELUARAN DALAM NEGERI KASAR MENGIKUT JENIS AKTIVITI EKONOMI PADA HARGA MALAR 2000,
Table 1.14 : Gross Domestic Product by Kind of Economic Activity at Constant 2000 Prices, 2000 - 2006, Malaysia (cont'd.)
RM ( Juta/Million )
Tahun/Year 2004 2005 e 2006 p
Pertanian, Ternakan, Perhutanan dan Perikanan
34,929 35,822 37,672
Agriculture, Livestock, Forestry dan Fishing
Perlombongan dan Kuari 42,627 42,076 41,914
Mining and Quarrying
Pembuatan 131,127 138,014 147,756
Manufacturing
Utiliti 13,100 13,833 14,554
Utilities
Pembinaan 14,903 14,637 14,559
Construction
Perdagangan Borong dan Runcit, Hotel dan Restoran 56,441 61,022 65,220
Wholesale and Retail Trade, Hotels and Restaurants
Pengangkutan, Penyimpanan dan Komunikasi 30,973 32,835 34,815
Transport, Storage and Communication
Kewangan, Insurans, Hartanah dan Perkhidmatan Perniagaan 60,775 64,734 70,167
Finance, Insurance, Real Estate and Business Services
Perkhidmatan-perkhidmatan Lain 24,996 26,062 27,296
Other Services
Perkhidmatan Kerajaan 28,243 30,507 33,498
Government Services
Tolak : FISIM yang tidak diagihkan 17,705 17,742 18,347
Less : Undistributed FISIM
Campur : Duti Import 6,099 6,017 5,287
Plus : Import Duties
Keluaran Dalam Negeri Kasar (KDNK) pada Harga Pembeli 426,508 447,818 474,392
Gross Domestic Product (GDP) at Purchasers' Prices
2000 - 2006, MALAYSIA (samb.)
34

AKAUN PENGAGIHAN DAN PENGGUNAAN PENDAPATAN DAN AKAUN MODAL
Nota Keterangan
1. Penyusunan akaun ini adalah bertujuan untuk menyediakan satu rangka kerja
untuk persembahan data ekonomi dengan mengambil kira interaksi pelbagai jenis
unit institusi, rangka kerja penganalisisan komponen ekonomi serta hubung kait di
antara komponen tersebut.
2. Anggaran penyusunan adalah berasaskan kepada konsep dan metodologi yang
digariskan di dalam penerbitan Pertubuhan Bangsa-Bangsa Bersatu bertajuk “A
System of National Accounts 1993”. Semua statistik akaun pengagihan dan
penggunaan pendapatan dan akaun modal yang diterbitkan adalah pada harga
semasa.
3. Beberapa indikator makroekonomi seperti pampasan pekerja, lebihan kendalian,
pendapatan campuran, pendapatan boleh guna dan tabungan telah dipilih daripada
akaun bagi tujuan penerbitan ini.
4. Pampasan pekerja adalah segala ganjaran, berbentuk tunai atau bukan berbentuk
wang, yang mesti dibayar oleh sesebuah enterpris kepada pekerja atas kerja yang
telah dijalankan di dalam tempoh perakaunan.
5. Lebihan kendalian adalah bersamaan nilai ditambah tolak pampasan pekerja yang
mesti dibayar dan cukai ke atas pengeluaran yang mesti dibayar campur subsidi
yang akan diterima. Ia mengukur lebihan atau defisit akibat daripada pengeluaran
sebelum mengambil kira faedah, sewa atau caj yang serupa yang mesti dibayar bagi
aset kewangan atau aset ketara bukan pengeluaran yang dipinjam atau disewa
oleh enterpris, atau faedah, sewa atau terimaan yang serupa yang akan diterima
terhadap aset kewangan atau aset ketara bukan pengeluaran yang dimiliki oleh
enterpris.
35
6. Pendapatan campuran ialah satu konsep baru yang diperkenalkan di dalam SNA
1993. Pendapatan campuran mengandungi elemen ganjaran yang tidak diketahui
bagi kerja yang dijalankan oleh pemilik enterpris atau ahli isi rumah lain, serta
lebihan kendalian hasil daripada pengeluaran.
7. Pendapatan boleh guna adalah bersamaan dengan imbangan pendapatan primer
campur semua pindahan semasa, kecuali pindahan sosial bukan berbentuk wang
yang akan diterima tolak semua pindahan semasa, kecuali pindahan sosial bukan
berbentuk wang yang mesti dibayar. Ini adalah pendapatan yang boleh digunakan
untuk perbelanjaan penggunaan akhir dan tabungan.
8. Tabungan ialah pendapatan boleh guna tolak perbelanjaan penggunaan akhir
(atau pendapatan boleh guna terlaras tolak penggunaan akhir sebenar), dalam
kedua-dua keadaan, setelah mengambil kira kesan pelarasan bagi dana pencen;
tabungan merupakan agregat penting yang dapat dikira bagi setiap sektor institusi
atau kepada ekonomi.
36
DISTRIBUTION AND USE OF INCOME ACCOUNTS AND CAPITAL ACCOUNT
Explanatory Notes
1. The compilation of accounts provides a framework for the presentation of economic
data taking into account the interaction of the various types of institutional units,
framework for the analysis of the components of the economy and the
interrelationships of these components.
2. The estimates of the compilation are based on the concepts and methodology
outlined in the United Nations' publication entitled ”A System of National Accounts
1993”. All published distribution and use of income accounts and capital account
statistics are in current prices.
3. A few macroeconomic indicators such as compensation of employees, operating
surplus, mixed income, disposable income and saving are selected for the purpose
of this publication.
4. Compensation of employees is the remuneration, in cash or in kind, payable by
an enterprise to an employee in return for work done by the latter during the
accounting period.
5. Operating surplus is equal to value added less compensation of employees
payable and taxes on production payable plus subsidies receivable. It measures the
surplus or deficit accruing from production before taking into account any interest,
rent or similar charges payable on financial or tangible non-produced assets
borrowed or rented by the enterprise, or any interest, rent or similar receipts
receivable on financial or tangible non-produced assets owned by the enterprise.
37
6. Mixed income is a new concept introduced in the SNA 1993. Mixed income
contains an unknown element of remuneration for work done by the owner of the
enterprise, or other members of the household, as well as operating surplus
accruing from production.
7. Disposable income is equal to the balance of primary incomes (GNI) plus all
current transfers, except social transfers in kind receivable minus all current
transfers, except social transfers in kind payable. This is the income which can be
used for final consumption expenditure and saving.
8. Saving is disposable income less final consumption expenditure (or adjusted
disposable income less actual final consumption), in both cases after taking account
of an adjustment for pension funds; saving is an important aggregate which can be
calculated for each institutional sector or for the economy.
38
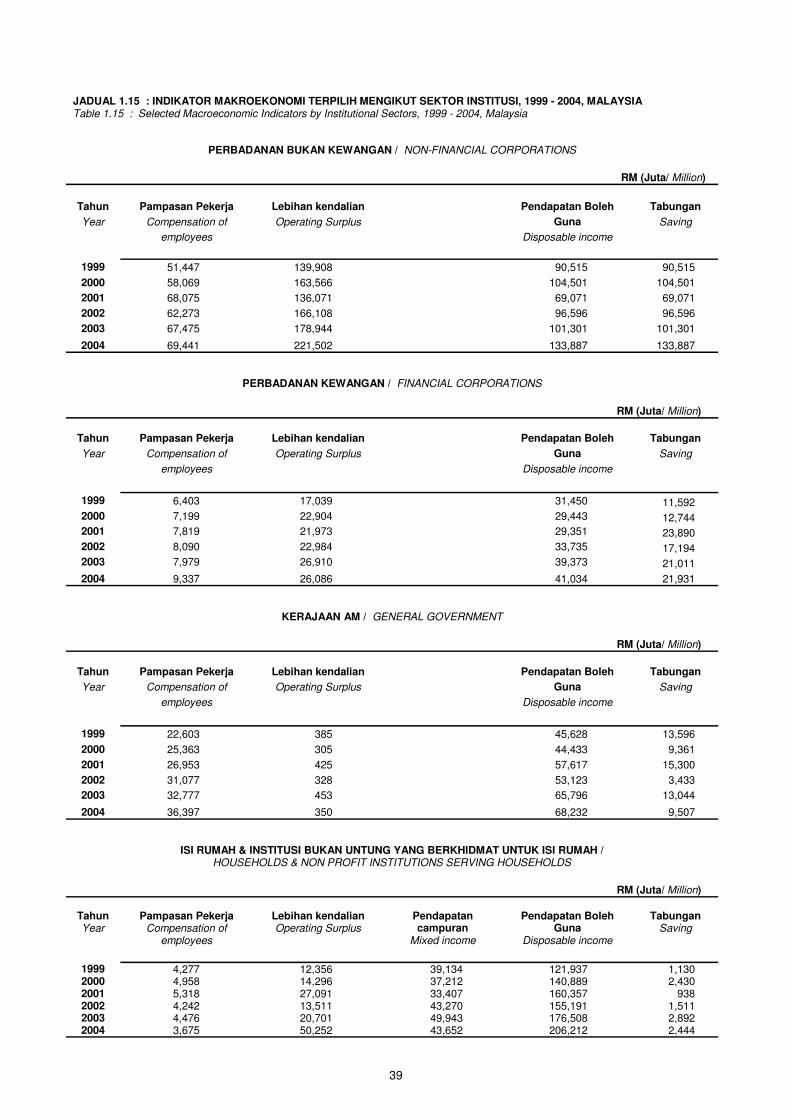
JADUAL 1.15 : INDIKATOR MAKROEKONOMI TERPILIH MENGIKUT SEKTOR INSTITUSI, 1999 - 2004, MALAYSIA
Table 1.15 : Selected Macroeconomic Indicators by Institutional Sectors, 1999 - 2004, Malaysia
PERBADANAN BUKAN KEWANGAN / NON-FINANCIAL CORPORATIONS
RM (Juta/ Million)
Tahun Pampasan Pekerja Lebihan kendalian Pendapatan Boleh Tabungan
Year Compensation of Operating Surplus Guna Saving
employees Disposable income
1999 51,447 139,908
90,515 90,515
2000 58,069 163,566
104,501 104,501
2001 68,075 136,071
69,071 69,071
2002 62,273 166,108
96,596 96,596
2003 67,475 178,944
101,301 101,301
2004 69,441 221,502 133,887 133,887
PERBADANAN KEWANGAN / FINANCIAL CORPORATIONS
RM (Juta/ Million)
Tahun Pampasan Pekerja Lebihan kendalian
Pendapatan Boleh Tabungan
Year Compensation of Operating Surplus
Guna Saving
employees
Disposable income
1999 6,403 17,039
31,450 11,592
2000 7,199 22,904
29,443 12,744
2001 7,819 21,973
29,351 23,890
2002 8,090 22,984
33,735 17,194
2003 7,979 26,910
39,373 21,011
2004 9,337 26,086 41,034 21,931
KERAJAAN AM / GENERAL GOVERNMENT
RM (Juta/ Million)
Tahun Pampasan Pekerja Lebihan kendalian
Pendapatan Boleh Tabungan
Year Compensation of Operating Surplus
Guna Saving
employees
Disposable income
1999 22,603 385
45,628 13,596
2000 25,363 305
44,433 9,361
2001 26,953 425
57,617 15,300
2002 31,077 328
53,123 3,433
2003 32,777 453
65,796 13,044
2004 36,397 350 68,232 9,507
ISI RUMAH & INSTITUSI BUKAN UNTUNG YANG BERKHIDMAT UNTUK ISI RUMAH / HOUSEHOLDS & NON PROFIT INSTITUTIONS SERVING HOUSEHOLDS
Tahun Pampasan Pekerja Lebihan kendalian Pendapatan Pendapatan Boleh Tabungan
Year Compensation of Operating Surplus campuran Guna Saving
employees Mixed income Disposable income
1999 4,277 12,356 39,134 121,937 1,130
2000 4,958 14,296 37,212 140,889 2,430
2001 5,318 27,091 33,407 160,357 938
2002 4,242 13,511 43,270 155,191 1,511
2003 4,476 20,701 49,943 176,508 2,892
2004 3,675 50,252 43,652 206,212 2,444
RM (Juta/ Million)
39


41
IMBANGAN PEMBAYARAN
Nota Keterangan
1. Anggaran imbangan pembayaran Malaysia memaparkan prestasi ekonomi
Malaysia berbanding negara-negara lain dari segi magnitud dan jenis transaksi
dalam Akaun Semasa, Akaun Modal dan Akaun Kewangan. Secara khusus, Akaun
Semasa memaparkan ringkasan perangkaan tentang transaksi yang berlaku pada
komponen barangan, perkhidmatan, pendapatan dan pindahan semasa negara
yang mana ia menggambarkan pendapatan dan perbelanjaan bagi Malaysia dari
segi tukaran asing pada tempoh di bawah kajian.
2. Anggaran tersebut juga menunjukkan sama ada Negara mempunyai peruntukan
bersih dari segi sumber kepada atau daripada Negara lain di dunia, yang mana
mencerminkan tuntutan bersih atau liabiliti kepada negara lain di dunia.
3. Perangkaan bagi tahun 1947 dan 1948 yang merujuk kepada Malayan Union /
Persekutuan Tanah Melayu dan Singapura bersumberkan data daripada “The
National Income of Malaya, 1947 - 1949” oleh Dr. Frederic Benham.
4. Bagi tahun 1949 sehingga 1953, perangkaan yang disusun meliputi Persekutuan
Tanah Melayu dan Singapura, yang mana datanya dipetik daripada laporan, “The
Economic Development of Malaya” yang disusun oleh International Bank for
Reconstruction and Development (IBRD - September, 1955).
5. Anggaran bagi tahun 1954 tidak diperoleh. Bagi tempoh 1955 hingga 1960,
perangkaan yang disusun hanya merujuk kepada Persekutuan Tanah Melayu
sahaja, yang mana sumbernya ialah “National Accounts of the Federation of
Malaya 1955 - 1960 Reports”.
42
6. Jabatan Perangkaan Malaysia mula menyusun perangkaan Imbangan Pembayaran
mulai tahun 1961. Bagi tempoh tersebut hingga 1962, ia merujuk kepada
Persekutuan Tanah Melayu, British North Borneo (Sabah) dan Sarawak. Mulai
tahun 1963, perangkaan yang disusun merujuk kepada Malaysia (tidak termasuk
Singapura bagi tahun 1963 - 1965).
7. Perangkaan yang disusun bagi tempoh 1969 hingga 1973 adalah mengikut garis
panduan pada Manual Imbangan Pembayaran, Edisi Ketiga (BPM3), Tabung
Kewangan Antarabangsa. Manakala bagi siri 1974 hingga 1998, ia disusun
mengikut garis panduan Edisi Keempat manual (BPM4) berkenaan.
8. Mulai tahun 1999, data siri masa telah disusun mengikut garis panduan Manual
Imbangan Pembayaran, Edisi Kelima (BPM5), Tabung Kewangan Antarabangsa
(IMF).
9. Bagi tempoh 1947 - 1953, nilai import dinilai berasaskan cost including freight and
insurance (c.i.f), manakala bagi tahun 1955 dan seterusnya, ia dinilai berasaskan
free on board (f.o.b).
BALANCE OF PAYMENTS
Explanatory Notes
1. Malaysia’s balance of payments estimates provide information on Malaysia’s
economic performance vis-à-vis the rest of the world in terms of the magnitude and
types of transactions in Current Account and also in Capital and Financial Account
flows. In particular, the Current Account position summarises the country’s
transactions in goods, services, income and current transfer which presents an
overall view of Malaysia’s earnings and spending in terms of foreign exchange for
the period under review.
2. The estimates also indicate as to whether the country has net provision of
resources to or from the rest of the world, which in turn is reflected by net claims on
or liabilities to the rest of the world.
3. In the year 1947 and 1948, the data pertain to the Malayan Union / Federation of
Malaya and Singapore which obtained from “The National Income of Malaya, 1947
- 1949” by Dr. Frederic Benham.
4. Data for the period 1949 to 1953 refer to the Federation of Malaya and Singapore
and were extracted from the report “The Economic Development of Malaya”
compiled by the International Bank for Reconstruction and Development, (IBRD -
September, 1955).
5. The estimates for 1954 were not available. For the years 1955 to 1960, the data
refer only to the Federation of Malaya and were extracted from the “National
Accounts of the Federation of Malaya 1955 - 1960 Reports”.
6. The Department of Statistics, Malaysia commenced the compilation for the year
1961. For the years 1961 until 1962, the data refer to the Federation of Malaya,
British North Borneo (Sabah) and Sarawak. From the year 1963 onwards, the data
pertain to Malaysia (excluding Singapore for the years 1963 - 1965).
43
7. Data series from 1969 to 1973 were compiled based on the International Monetary
Fund, Balance of Payments Manual, Third Edition (BPM3) while data series from
1974 to 1998 were compiled based on the Fourth Edition of the manual.
8. Data series from 1999 onwards were compiled based on the Fifth Edition Balance
of Payments Manual (BPM5), International Monetary Fund (IMF).
9. For years 1947 – 1953, the imports were valued at c.i.f., while for year 1955 and
thereafter, the imports were valued at f.o.b.
44

JADUAL 2.1 : PERANGKAAN UTAMA IMBANGAN PEMBAYARAN, 1947 - 1998, MALAYSIA Table 2.1 : Principal Statistics of Balance of Payments, 1947 - 1998, Malaysia RM ( Juta / Million )
Item 1947 1948 1949 1950 1951
1. Barangan f.o.b. (Bersih) -90 -96 -129 1,101 1,321
Goods f.o.b. (Net) a. Eksport 1,295 1,731 1,722 4,016 6,076
Exports b. Import 1,385 1,827 1,851 2,915 4,755
Imports 2. Perkhidmatan (Bersih) 265 181 22 -335 -399
Services (Net) a. Tambang dan Insurans 41 55 .. .. .. Freight and Insurance b. Pengangkutan Lain 32 40 .. .. .. Other Transportation c. Perjalanan dan Pelajaran -50 -57 .. .. .. Travel and Education d. Pendapatan Pelaburan -20 -39 -143 -570 -667
Investment Income e. Urus Niaga Kerajaan Tidak Terkelas di Tempat Lain 171 150 160 220 270
Government Transactions n.i.e f. Perkhidmatan Lain 91 32 5 15 -2
Other Services 3. Pindahan (Bersih) -68 -59 -15 -82 -208
Unrequited Transfers (Net)
4. Imbangan Akaun Semasa [ 1+2+3 ] 107 26 -122 684 714
Balance on Current Account [ 1+2+3 ]
5. Modal (Bersih) .. .. 68 22 48
Capital (Net) a. Modal Jangka Panjang Persendirian .. .. .. .. .. Private Long-term Capital b. Modal Jangka Panjang Rasmi .. .. 68 22 48
Official Long-term Capital
6. Imbangan Asas [ 4+5 ] 107 26 -54 706 762
Basic Balance [ 4+5 ]
7. Modal Jangka Pendek Persendirian .. .. .. .. .. Private Short-term Capital 8. Kesilapan dan Ketinggalan (Bersih) -150 -70 105 (*) -145 (*) -65 (*) Errors and Omissions (Net)
9. Imbangan Keseluruhan [Lebihan +/Defisit -] -43 -44 51 561 697
Overall Balance [Surplus + / Deficit -]
10. Peruntukan Hak Pengeluaran Khas dan Sumber IMF 0 0 0 0 0
Allocation of Special Drawing Rights and IMF Resources 11. Perubahan Bersih Dalam Rizab Luar Negeri Bank Negara Malaysia .. .. -51 (**) -561 (**) -697 (**) Net Change in Bank Negara Malaysia's External Reserves
45

JADUAL 2.1 : PERANGKAAN UTAMA IMBANGAN PEMBAYARAN, 1947 - 1998, MALAYSIA (samb.) Table 2.1 : Principal Statistics of Balance of Payments, 1947 - 1998, Malaysia (cont'd.)
Item 1952 1953 1954 1955 1956
1. Barangan f.o.b. (Bersih) 46 -218 .. 848 519
Goods f.o.b. (Net) a. Eksport 3,919 3,020 .. 2,367 2,258
Exports b. Import 3,873 3,238 .. 1,519 1,739
Imports 2. Perkhidmatan (Bersih) 63 180 .. -176 -116
Services (Net) a. Tambang dan Insurans .. .. .. 15 17
Freight and Insurance b. Pengangkutan Lain .. .. .. .. .. Other Transportation c. Perjalanan dan Pelajaran .. .. .. 79 117
Travel and Education d. Pendapatan Pelaburan -184 -76 .. -248 -230
Investment Income e. Urus Niaga Kerajaan Tidak Terkelas di Tempat Lain 260 260 .. 1 4
Government Transactions n.i.e f. Perkhidmatan Lain -13 -4 .. -23 -24
Other Services 3. Pindahan (Bersih) -214 -206 .. -195 -204
Unrequited Transfers (Net)
4. Imbangan Akaun Semasa [ 1+2+3 ] -105 -244 .. 477 199
Balance on Current Account [ 1+2+3 ]
5. Modal (Bersih) 116 63 .. 49 35
Capital (Net) a. Modal Jangka Panjang Persendirian .. .. .. 4 0
Private Long-term Capital b. Modal Jangka Panjang Rasmi 116 63 .. 45 35
Official Long-term Capital
6. Imbangan Asas [ 4+5 ] 11 -181 .. 526 234
Basic Balance [ 4+5 ]
7. Modal Jangka Pendek Persendirian .. .. .. -176 103
Private Short-term Capital
8. Kesilapan dan Ketinggalan (Bersih) 15 (*) 65 (*) .. -105 -171
Errors and Omissions (Net)
9. Imbangan Keseluruhan [Lebihan +/Defisit -] 26 -116 .. 245 166
Overall Balance [Surplus + / Deficit -]
10. Peruntukan Hak Pengeluaran Khas dan Sumber IMF 0 0 .. 0 0
Allocation of Special Drawing Rights and IMF Resources
11. Perubahan Bersih Dalam Rizab Luar Negeri Bank Negara Malaysia -26 (**) 116 (**) .. -245 -166
Net Change in Bank Negara Malaysia's External Reserves
46
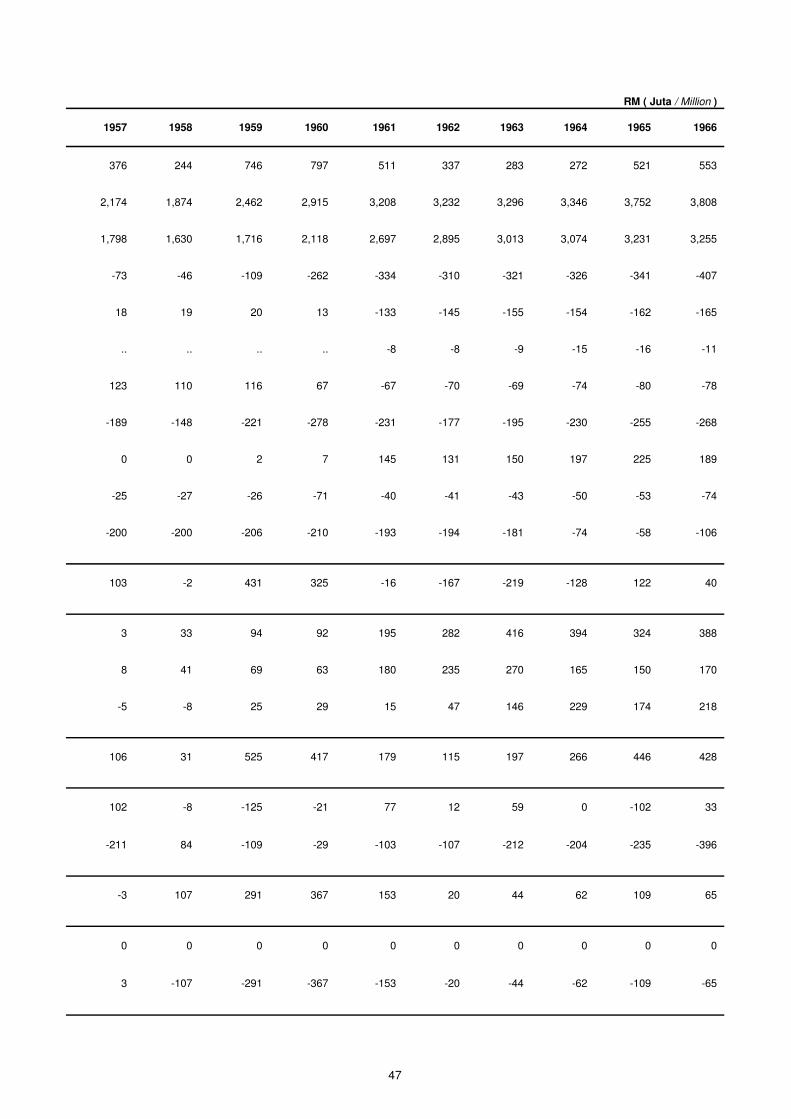
RM ( Juta / Million )
1957 1958 1959 1960 1961 1962 1963 1964 1965 1966
376 244 746 797 511 337 283 272 521 553
2,174 1,874 2,462 2,915 3,208 3,232 3,296 3,346 3,752 3,808
1,798 1,630 1,716 2,118 2,697 2,895 3,013 3,074 3,231 3,255
-73 -46 -109 -262 -334 -310 -321 -326 -341 -407
18 19 20 13 -133 -145 -155 -154 -162 -165
.. .. .. .. -8 -8 -9 -15 -16 -11
123 110 116 67 -67 -70 -69 -74 -80 -78
-189 -148 -221 -278 -231 -177 -195 -230 -255 -268
0 0 2 7 145 131 150 197 225 189
-25 -27 -26 -71 -40 -41 -43 -50 -53 -74
-200 -200 -206 -210 -193 -194 -181 -74 -58 -106
103 -2 431 325 -16 -167 -219 -128 122 40
3 33 94 92 195 282 416 394 324 388
8 41 69 63 180 235 270 165 150 170
-5 -8 25 29 15 47 146 229 174 218
106 31 525 417 179 115 197 266 446 428
102 -8 -125 -21 77 12 59 0 -102 33
-211 84 -109 -29 -103 -107 -212 -204 -235 -396
-3 107 291 367 153 20 44 62 109 65
0 0 0 0 0 0 0 0 0 0
3 -107 -291 -367 -153 -20 -44 -62 -109 -65
47
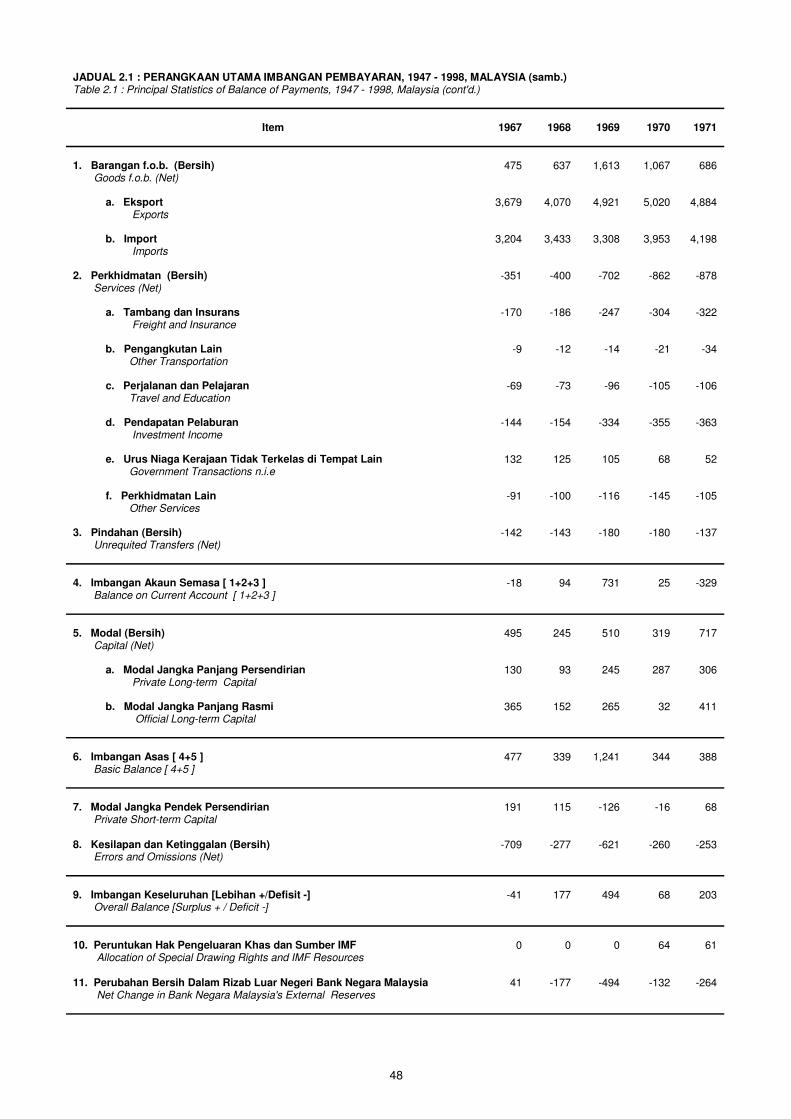
JADUAL 2.1 : PERANGKAAN UTAMA IMBANGAN PEMBAYARAN, 1947 - 1998, MALAYSIA (samb.) Table 2.1 : Principal Statistics of Balance of Payments, 1947 - 1998, Malaysia (cont'd.)
Item 1967 1968 1969 1970 1971
1. Barangan f.o.b. (Bersih) 475 637 1,613 1,067 686
Goods f.o.b. (Net) a. Eksport 3,679 4,070 4,921 5,020 4,884
Exports b. Import 3,204 3,433 3,308 3,953 4,198
Imports 2. Perkhidmatan (Bersih) -351 -400 -702 -862 -878
Services (Net) a. Tambang dan Insurans -170 -186 -247 -304 -322
Freight and Insurance b. Pengangkutan Lain -9 -12 -14 -21 -34
Other Transportation c. Perjalanan dan Pelajaran -69 -73 -96 -105 -106
Travel and Education d. Pendapatan Pelaburan -144 -154 -334 -355 -363
Investment Income e. Urus Niaga Kerajaan Tidak Terkelas di Tempat Lain 132 125 105 68 52
Government Transactions n.i.e f. Perkhidmatan Lain -91 -100 -116 -145 -105
Other Services 3. Pindahan (Bersih) -142 -143 -180 -180 -137
Unrequited Transfers (Net)
4. Imbangan Akaun Semasa [ 1+2+3 ] -18 94 731 25 -329
Balance on Current Account [ 1+2+3 ]
5. Modal (Bersih) 495 245 510 319 717
Capital (Net) a. Modal Jangka Panjang Persendirian 130 93 245 287 306
Private Long-term Capital b. Modal Jangka Panjang Rasmi 365 152 265 32 411
Official Long-term Capital
6. Imbangan Asas [ 4+5 ] 477 339 1,241 344 388
Basic Balance [ 4+5 ]
7. Modal Jangka Pendek Persendirian 191 115 -126 -16 68
Private Short-term Capital
8. Kesilapan dan Ketinggalan (Bersih) -709 -277 -621 -260 -253
Errors and Omissions (Net)
9. Imbangan Keseluruhan [Lebihan +/Defisit -] -41 177 494 68 203
Overall Balance [Surplus + / Deficit -]
10. Peruntukan Hak Pengeluaran Khas dan Sumber IMF 0 0 0 64 61
Allocation of Special Drawing Rights and IMF Resources 11. Perubahan Bersih Dalam Rizab Luar Negeri Bank Negara Malaysia 41 -177 -494 -132 -264
Net Change in Bank Negara Malaysia's External Reserves
48
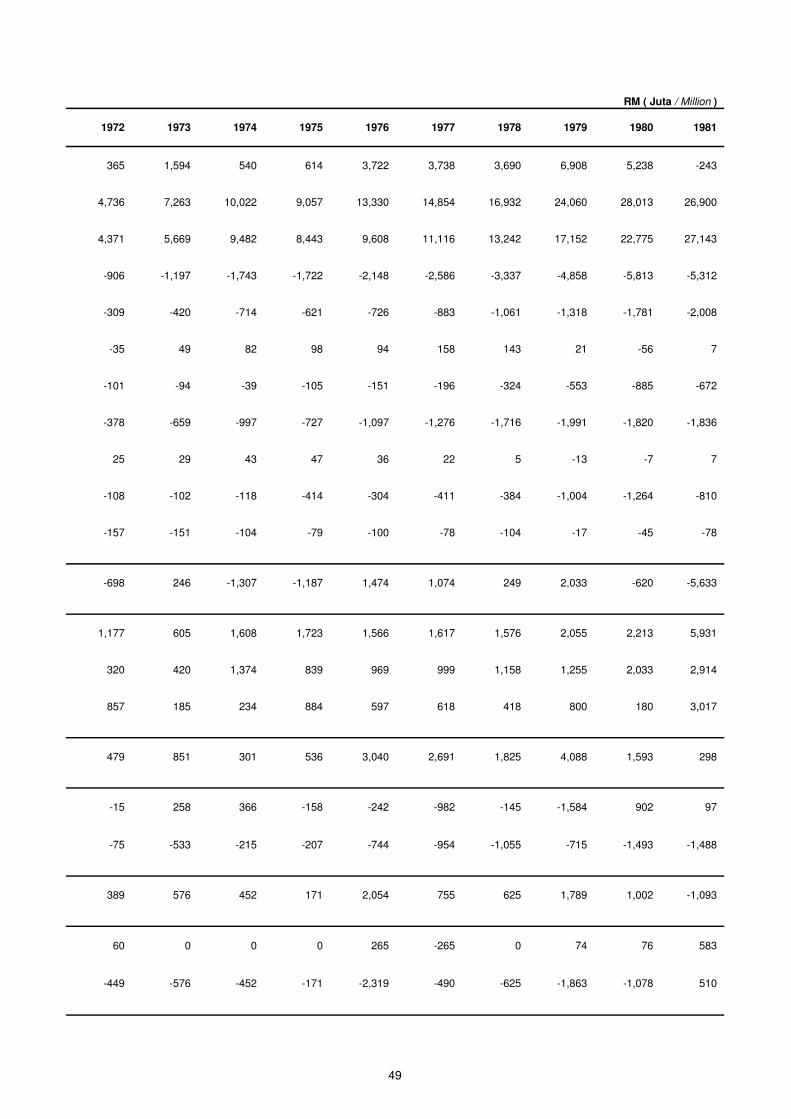
1972 1973 1974 1975 1976 1977 1978 1979 1980 1981
365 1,594 540 614 3,722 3,738 3,690 6,908 5,238 -243
4,736 7,263 10,022 9,057 13,330 14,854 16,932 24,060 28,013 26,900
4,371 5,669 9,482 8,443 9,608 11,116 13,242 17,152 22,775 27,143
-906 -1,197 -1,743 -1,722 -2,148 -2,586 -3,337 -4,858 -5,813 -5,312
-309 -420 -714 -621 -726 -883 -1,061 -1,318 -1,781 -2,008
-35 49 82 98 94 158 143 21 -56 7
-101 -94 -39 -105 -151 -196 -324 -553 -885 -672
-378 -659 -997 -727 -1,097 -1,276 -1,716 -1,991 -1,820 -1,836
25 29 43 47 36 22 5 -13 -7 7
-108 -102 -118 -414 -304 -411 -384 -1,004 -1,264 -810
-157 -151 -104 -79 -100 -78 -104 -17 -45 -78
-698 246 -1,307 -1,187 1,474 1,074 249 2,033 -620 -5,633
1,177 605 1,608 1,723 1,566 1,617 1,576 2,055 2,213 5,931
320 420 1,374 839 969 999 1,158 1,255 2,033 2,914
857 185 234 884 597 618 418 800 180 3,017
479 851 301 536 3,040 2,691 1,825 4,088 1,593 298
-15 258 366 -158 -242 -982 -145 -1,584 902 97
-75 -533 -215 -207 -744 -954 -1,055 -715 -1,493 -1,488
389 576 452 171 2,054 755 625 1,789 1,002 -1,093
60 0 0 0 265 -265 0 74 76 583
-449 -576 -452 -171 -2,319 -490 -625 -1,863 -1,078 510
RM ( Juta / Million )
49

JADUAL 2.1 : PERANGKAAN UTAMA IMBANGAN PEMBAYARAN, 1947 - 1998, MALAYSIA (samb.) Table 2.1 : Principal Statistics of Balance of Payments, 1947 - 1998, Malaysia (cont'd.)
Item 1982 1983 1984 1985 1986
1. Barangan f.o.b. (Bersih) -1,758 1,002 6,986 8,883 8,378
Goods f.o.b. (Net) a. Eksport 27,946 31,762 38,452 37,576 34,970
Exports b. Import 29,704 30,760 31,466 28,693 26,592
Imports 2. Perkhidmatan (Bersih) -6,576 -9,098 -10,813 -10,391 -8,790
Services (Net) a. Tambang dan Insurans -2,154 -2,132 -2,120 -1,852 -1,306
Freight and Insurance b. Pengangkutan Lain 154 53 -99 64 149
Other Transportation c. Perjalanan dan Pelajaran -775 -1,104 -1,249 -1,332 -1,368
Travel and Education d. Pendapatan Pelaburan -2,679 -4,208 -5,255 -5,434 -4,597
Investment Income e. Urus Niaga Kerajaan Tidak Terkelas di Tempat Lain 29 35 23 -31 -190
Government Transactions n.i.e f. Perkhidmatan Lain -1,151 -1,742 -2,113 -1,806 -1,478
Other Services 3. Pindahan (Bersih) -75 -21 -90 -14 96
Unrequited Transfers (Net)
4. Imbangan Akaun Semasa [ 1+2+3 ] -8,409 -8,117 -3,917 -1,522 -316
Balance on Current Account [ 1+2+3 ]
5. Modal (Bersih) 8,432 9,210 6,560 4,229 3,386
Capital (Net) a. Modal Jangka Panjang Persendirian 3,263 2,926 1,869 1,725 1,262
Private Long-term Capital b. Modal Jangka Panjang Rasmi 5,169 6,284 4,691 2,504 2,124
Official Long-term Capital
6. Imbangan Asas [ 4+5 ] 23 1,093 2,643 2,707 3,070
Basic Balance [ 4+5 ]
7. Modal Jangka Pendek Persendirian 326 -263 -288 870 -47
Private Short-term Capital 8. Kesilapan dan Ketinggalan (Bersih) -963 -885 -2,043 -368 1,322
Errors and Omissions (Net)
9. Imbangan Keseluruhan [Lebihan +/Defisit -] -614 -55 312 3,209 4,345
Overall Balance [Surplus + / Deficit -]
10. Peruntukan Hak Pengeluaran Khas dan Sumber IMF 152 166 -125 -382 -263
Allocation of Special Drawing Rights and IMF Resources 11. Perubahan Bersih Dalam Rizab Luar Negeri Bank Negara Malaysia 462 -111 -187 -2,827 -4,082
Net Change in Bank Negara Malaysia's External Reserves
50
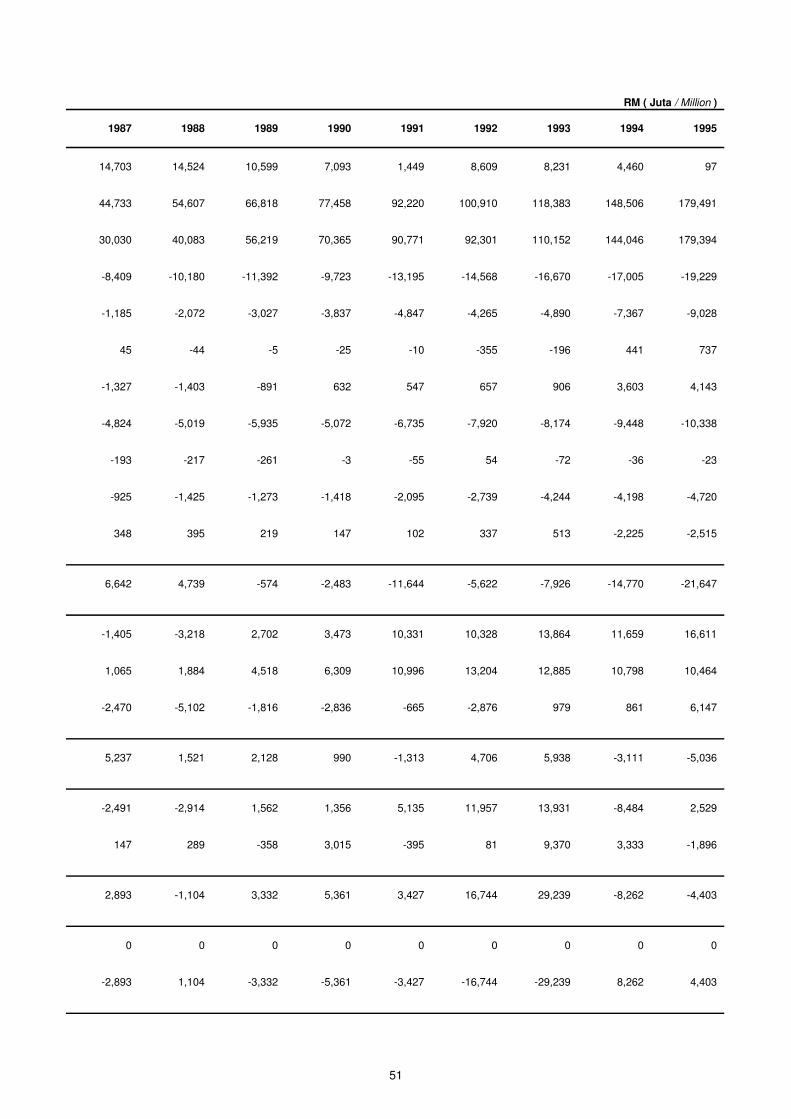
1987 1988 1989 1990 1991 1992 1993 1994 1995
14,703 14,524 10,599 7,093 1,449 8,609 8,231 4,460 97
44,733 54,607 66,818 77,458 92,220 100,910 118,383 148,506 179,491
30,030 40,083 56,219 70,365 90,771 92,301 110,152 144,046 179,394
-8,409 -10,180 -11,392 -9,723 -13,195 -14,568 -16,670 -17,005 -19,229
-1,185 -2,072 -3,027 -3,837 -4,847 -4,265 -4,890 -7,367 -9,028
45 -44 -5 -25 -10 -355 -196 441 737
-1,327 -1,403 -891 632 547 657 906 3,603 4,143
-4,824 -5,019 -5,935 -5,072 -6,735 -7,920 -8,174 -9,448 -10,338
-193 -217 -261 -3 -55 54 -72 -36 -23
-925 -1,425 -1,273 -1,418 -2,095 -2,739 -4,244 -4,198 -4,720
348 395 219 147 102 337 513 -2,225 -2,515
6,642 4,739 -574 -2,483 -11,644 -5,622 -7,926 -14,770 -21,647
-1,405 -3,218 2,702 3,473 10,331 10,328 13,864 11,659 16,611
1,065 1,884 4,518 6,309 10,996 13,204 12,885 10,798 10,464
-2,470 -5,102 -1,816 -2,836 -665 -2,876 979 861 6,147
5,237 1,521 2,128 990 -1,313 4,706 5,938 -3,111 -5,036
-2,491 -2,914 1,562 1,356 5,135 11,957 13,931 -8,484 2,529
147 289 -358 3,015 -395 81 9,370 3,333 -1,896
2,893 -1,104 3,332 5,361 3,427 16,744 29,239 -8,262 -4,403
0 0 0 0 0 0 0 0 0
-2,893 1,104 -3,332 -5,361 -3,427 -16,744 -29,239 8,262 4,403
RM ( Juta / Million )
51
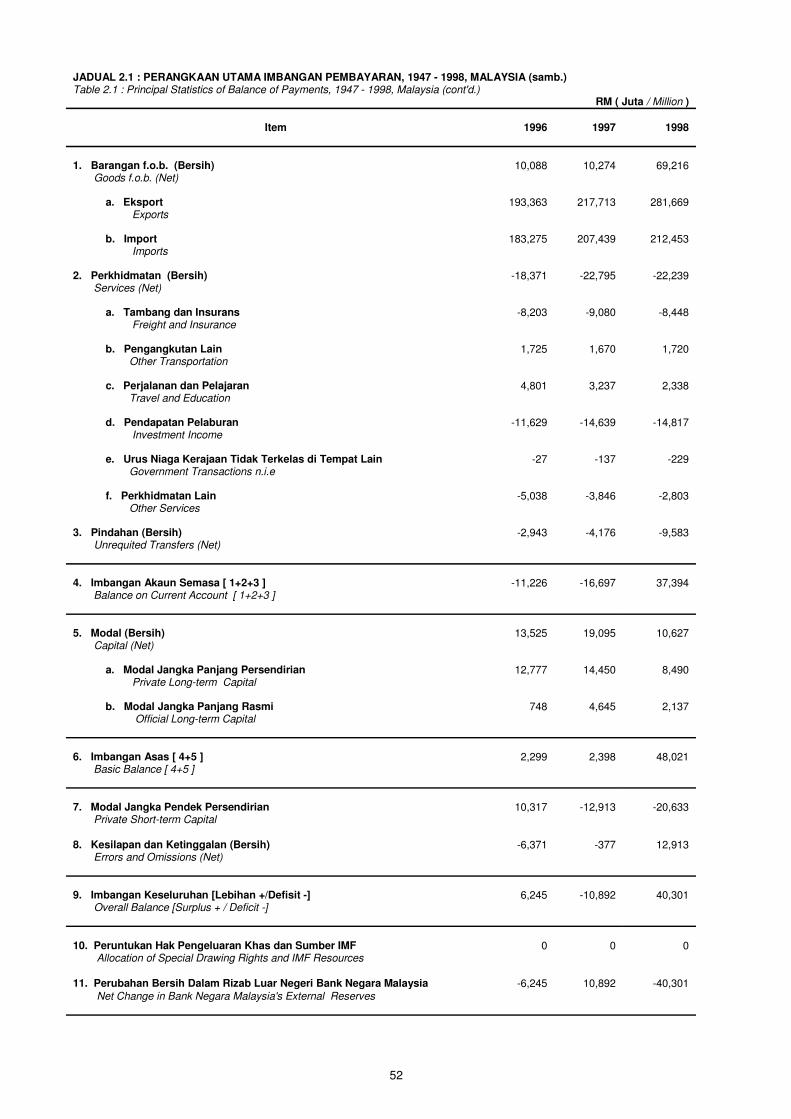
JADUAL 2.1 : PERANGKAAN UTAMA IMBANGAN PEMBAYARAN, 1947 - 1998, MALAYSIA (samb.) Table 2.1 : Principal Statistics of Balance of Payments, 1947 - 1998, Malaysia (cont'd.)
Item 1996 1997 1998
1. Barangan f.o.b. (Bersih) 10,088 10,274 69,216
Goods f.o.b. (Net) a. Eksport 193,363 217,713 281,669
Exports b. Import 183,275 207,439 212,453
Imports 2. Perkhidmatan (Bersih) -18,371 -22,795 -22,239
Services (Net) a. Tambang dan Insurans -8,203 -9,080 -8,448
Freight and Insurance b. Pengangkutan Lain 1,725 1,670 1,720
Other Transportation c. Perjalanan dan Pelajaran 4,801 3,237 2,338
Travel and Education d. Pendapatan Pelaburan -11,629 -14,639 -14,817
Investment Income e. Urus Niaga Kerajaan Tidak Terkelas di Tempat Lain -27 -137 -229
Government Transactions n.i.e f. Perkhidmatan Lain -5,038 -3,846 -2,803
Other Services 3. Pindahan (Bersih) -2,943 -4,176 -9,583
Unrequited Transfers (Net)
4. Imbangan Akaun Semasa [ 1+2+3 ] -11,226 -16,697 37,394
Balance on Current Account [ 1+2+3 ]
5. Modal (Bersih) 13,525 19,095 10,627
Capital (Net) a. Modal Jangka Panjang Persendirian 12,777 14,450 8,490
Private Long-term Capital b. Modal Jangka Panjang Rasmi 748 4,645 2,137
Official Long-term Capital
6. Imbangan Asas [ 4+5 ] 2,299 2,398 48,021
Basic Balance [ 4+5 ]
7. Modal Jangka Pendek Persendirian 10,317 -12,913 -20,633
Private Short-term Capital
8. Kesilapan dan Ketinggalan (Bersih) -6,371 -377 12,913
Errors and Omissions (Net)
9. Imbangan Keseluruhan [Lebihan +/Defisit -] 6,245 -10,892 40,301
Overall Balance [Surplus + / Deficit -]
10. Peruntukan Hak Pengeluaran Khas dan Sumber IMF 0 0 0
Allocation of Special Drawing Rights and IMF Resources
11. Perubahan Bersih Dalam Rizab Luar Negeri Bank Negara Malaysia -6,245 10,892 -40,301
Net Change in Bank Negara Malaysia's External Reserves
RM ( Juta / Million )
52
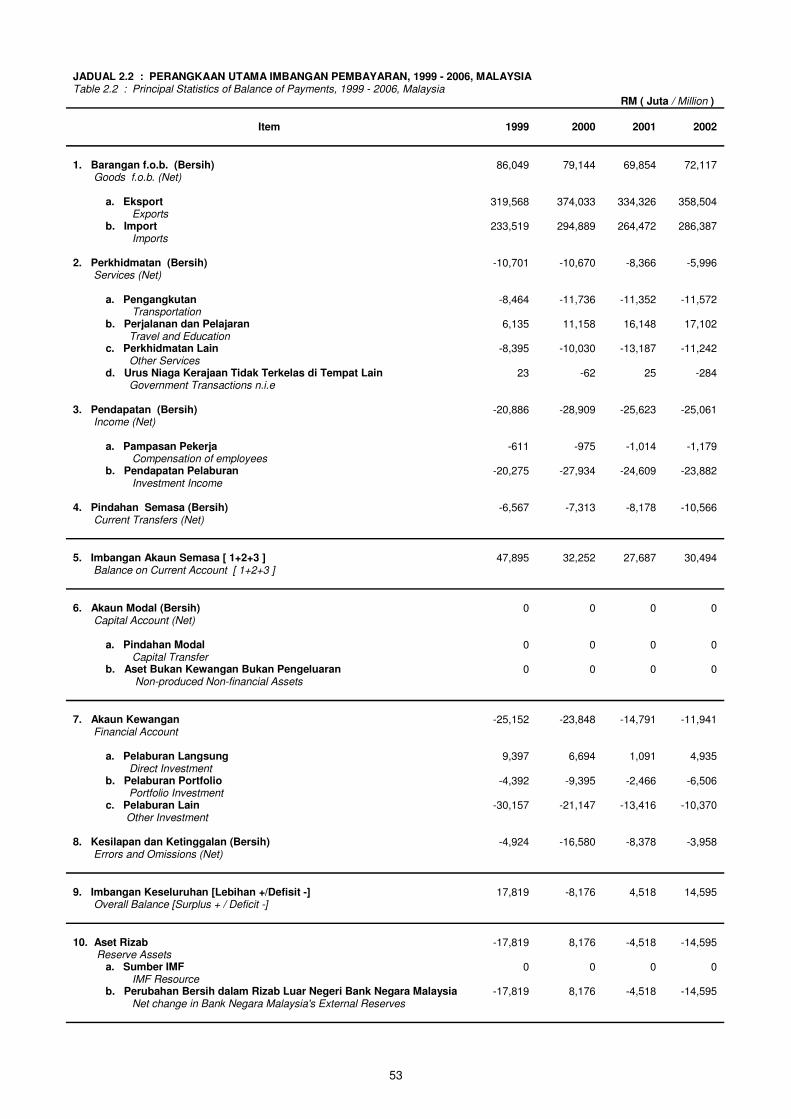
JADUAL 2.2 : PERANGKAAN UTAMA IMBANGAN PEMBAYARAN, 1999 - 2006, MALAYSIA Table 2.2 : Principal Statistics of Balance of Payments, 1999 - 2006, Malaysia
Item 1999 2000 2001 2002
1. Barangan f.o.b. (Bersih) 86,049 79,144 69,854 72,117
Goods f.o.b. (Net) a. Eksport 319,568 374,033 334,326 358,504
Exports b. Import 233,519 294,889 264,472 286,387
Imports 2. Perkhidmatan (Bersih) -10,701 -10,670 -8,366 -5,996
Services (Net) a. Pengangkutan -8,464 -11,736 -11,352 -11,572
Transportation b. Perjalanan dan Pelajaran 6,135 11,158 16,148 17,102
Travel and Education c. Perkhidmatan Lain -8,395 -10,030 -13,187 -11,242
Other Services d. Urus Niaga Kerajaan Tidak Terkelas di Tempat Lain 23 -62 25 -284
Government Transactions n.i.e 3. Pendapatan (Bersih) -20,886 -28,909 -25,623 -25,061
Income (Net) a. Pampasan Pekerja -611 -975 -1,014 -1,179
Compensation of employees b. Pendapatan Pelaburan -20,275 -27,934 -24,609 -23,882
Investment Income 4. Pindahan Semasa (Bersih) -6,567 -7,313 -8,178 -10,566
Current Transfers (Net)
5. Imbangan Akaun Semasa [ 1+2+3 ] 47,895 32,252 27,687 30,494
Balance on Current Account [ 1+2+3 ]
6. Akaun Modal (Bersih) 0 0 0 0
Capital Account (Net) a. Pindahan Modal 0 0 0 0
Capital Transfer b. Aset Bukan Kewangan Bukan Pengeluaran 0 0 0 0
Non-produced Non-financial Assets
7. Akaun Kewangan -25,152 -23,848 -14,791 -11,941
Financial Account a. Pelaburan Langsung 9,397 6,694 1,091 4,935
Direct Investment b. Pelaburan Portfolio -4,392 -9,395 -2,466 -6,506
Portfolio Investment c. Pelaburan Lain -30,157 -21,147 -13,416 -10,370
Other Investment 8. Kesilapan dan Ketinggalan (Bersih) -4,924 -16,580 -8,378 -3,958
Errors and Omissions (Net)
9. Imbangan Keseluruhan [Lebihan +/Defisit -] 17,819 -8,176 4,518 14,595
Overall Balance [Surplus + / Deficit -]
10. Aset Rizab -17,819 8,176 -4,518 -14,595
Reserve Assets a. Sumber IMF 0 0 0 0
IMF Resource b. Perubahan Bersih dalam Rizab Luar Negeri Bank Negara Malaysia -17,819 8,176 -4,518 -14,595
Net change in Bank Negara Malaysia's External Reserves
RM ( Juta / Million )
53
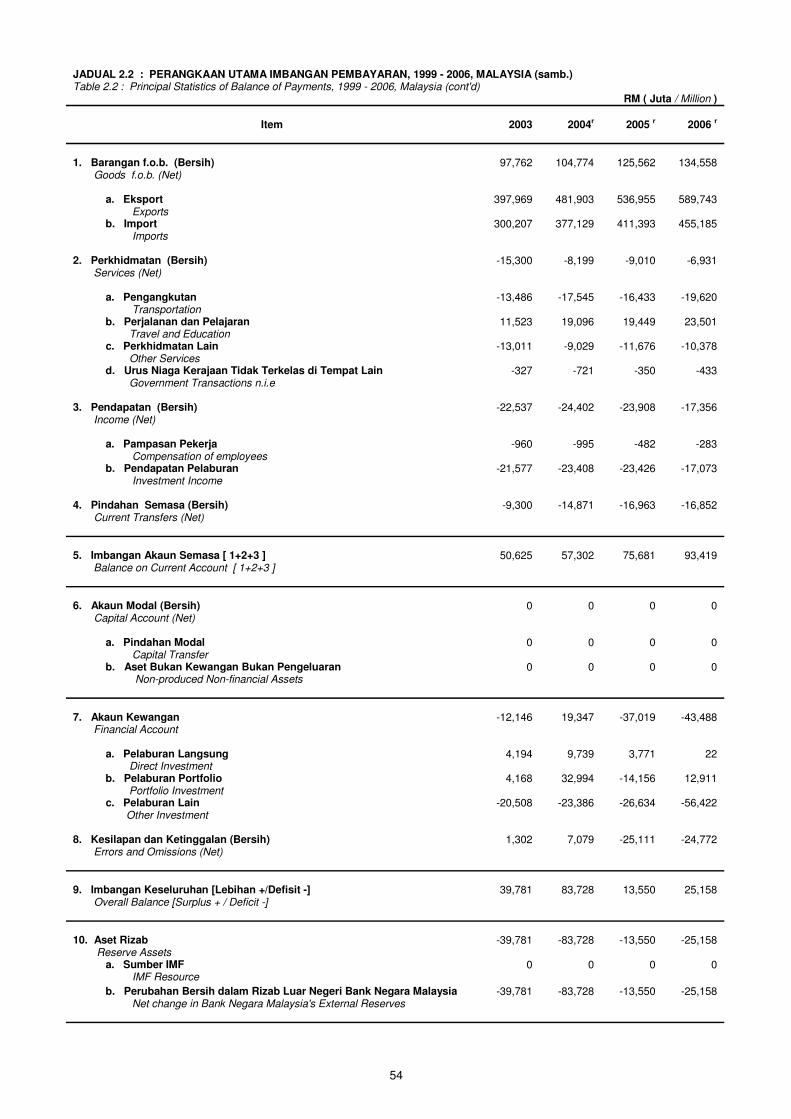
JADUAL 2.2 : PERANGKAAN UTAMA IMBANGAN PEMBAYARAN, 1999 - 2006, MALAYSIA (samb.) Table 2.2 : Principal Statistics of Balance of Payments, 1999 - 2006, Malaysia (cont'd) RM ( Juta / Million )
Item 2003 2004r
2005 r 2006 r
1. Barangan f.o.b. (Bersih) 97,762 104,774 125,562 134,558
Goods f.o.b. (Net) a. Eksport 397,969 481,903 536,955 589,743
Exports b. Import 300,207 377,129 411,393 455,185
Imports 2. Perkhidmatan (Bersih) -15,300 -8,199 -9,010 -6,931
Services (Net) a. Pengangkutan -13,486 -17,545 -16,433 -19,620
Transportation b. Perjalanan dan Pelajaran 11,523 19,096 19,449 23,501
Travel and Education c. Perkhidmatan Lain -13,011 -9,029 -11,676 -10,378
Other Services d. Urus Niaga Kerajaan Tidak Terkelas di Tempat Lain -327 -721 -350 -433
Government Transactions n.i.e 3. Pendapatan (Bersih) -22,537 -24,402 -23,908 -17,356
Income (Net) a. Pampasan Pekerja -960 -995 -482 -283
Compensation of employees b. Pendapatan Pelaburan -21,577 -23,408 -23,426 -17,073
Investment Income 4. Pindahan Semasa (Bersih) -9,300 -14,871 -16,963 -16,852
Current Transfers (Net)
5. Imbangan Akaun Semasa [ 1+2+3 ] 50,625 57,302 75,681 93,419
Balance on Current Account [ 1+2+3 ]
6. Akaun Modal (Bersih) 0 0 0 0
Capital Account (Net) a. Pindahan Modal 0 0 0 0
Capital Transfer b. Aset Bukan Kewangan Bukan Pengeluaran 0 0 0 0
Non-produced Non-financial Assets
7. Akaun Kewangan -12,146 19,347 -37,019 -43,488
Financial Account a. Pelaburan Langsung 4,194 9,739 3,771 22
Direct Investment b. Pelaburan Portfolio 4,168 32,994 -14,156 12,911
Portfolio Investment c. Pelaburan Lain -20,508 -23,386 -26,634 -56,422
Other Investment 8. Kesilapan dan Ketinggalan (Bersih) 1,302 7,079 -25,111 -24,772
Errors and Omissions (Net)
9. Imbangan Keseluruhan [Lebihan +/Defisit -] 39,781 83,728 13,550 25,158
Overall Balance [Surplus + / Deficit -]
10. Aset Rizab -39,781 -83,728 -13,550 -25,158
Reserve Assets a. Sumber IMF 0 0 0 0
IMF Resource
b. Perubahan Bersih dalam Rizab Luar Negeri Bank Negara Malaysia -39,781 -83,728 -13,550 -25,158
Net change in Bank Negara Malaysia's External Reserves
54

PERDAGANGAN LUAR NEGERI
Nota Keterangan
1. Penyusunan perangkaan perdagangan luar negeri Malaysia bertujuan untuk
membekalkan maklumat tentang prestasi perdagangan Malaysia berbanding
dengan negara-negara lain di dunia dari segi kuantiti, nilai dan nilai unit purata
barang dagangan. Dalam laporan ini, hanya nilai perdagangan luar negeri di
persembahkan.
2. Malaysia menggunakan sistem umum dalam menyusun perangkaan perdagangan
luar negeri. Di bawah sistem ini, sempadan negara digunakan sebagai sempadan
perangkaan. Semua barang yang dibawa masuk atau keluar dari negara (selain
barang yang dikecualikan) direkodkan, sama ada barang itu tertakluk kepada
kelulusan tertentu ataupun tidak. Demikian juga barang yang dibawa masuk atau
keluar dari gudang-gudang simpanan kastam, Zon Perindustrian Bebas, Zon
Komersial Bebas dan Zon Bebas direkodkan dalam perangkaan ini.
3. Barang dagangan dikelaskan mengikut Piawaian Klasifikasi Perdagangan
Antarabangsa oleh Bangsa-Bangsa Bersatu. Pengelasan jenis komoditi yang
telah digunakan sejak tahun 1947 adalah seperti berikut :-
i. 1947 sehingga 1952
‘Classified Import and Export List’
ii. 1953 sehingga 1966
‘Standard International Trade Classification’ (S.I.T.C.)
iii. 1967 sehingga 1977
‘Standard International Trade Classification, Revised’ (S.I.T.C Rev.)
iv. 1978 sehingga 1987
‘Standard International Trade Classification, Revision 2’ (S.I.T.C. Rev. 2)
v. 1988 dan seterusnya
‘Standard International Trade Classification Revision 3’ (S.I.T.C. Rev. 3)
55
4. Sistem pengelasan dan liputan yang digunakan dalam tahun 1947 hingga 1952
berbeza dari tahun 1953 dan seterusnya. Oleh itu, data mulai tahun 1953 tidak
boleh dibandingkan sepenuhnya dengan data bagi tahun 1947 hingga 1952.
5. Data bagi tahun 1947 merujuk kepada Malayan Union. Data bagi tahun 1948
sehingga 1961 merujuk kepada Persekutuan Tanah Melayu. Manakala bagi tahun
1962 sehingga tahun 1966, data merujuk kepada Semenanjung Malaysia sahaja.
Data dari tahun 1967 dan tahun selepasnya merujuk kepada Malaysia.
56
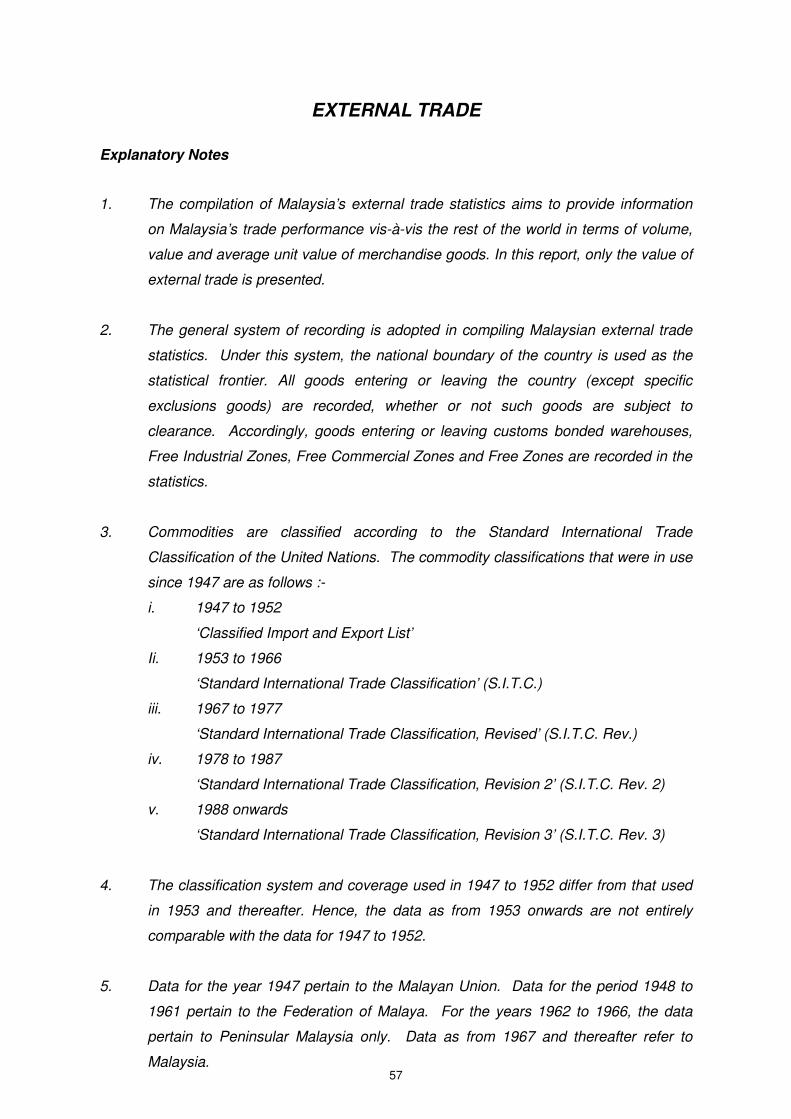
EXTERNAL TRADE
Explanatory Notes
1. The compilation of Malaysia’s external trade statistics aims to provide information
on Malaysia’s trade performance vis-à-vis the rest of the world in terms of volume,
value and average unit value of merchandise goods. In this report, only the value of
external trade is presented.
2. The general system of recording is adopted in compiling Malaysian external trade
statistics. Under this system, the national boundary of the country is used as the
statistical frontier. All goods entering or leaving the country (except specific
exclusions goods) are recorded, whether or not such goods are subject to
clearance. Accordingly, goods entering or leaving customs bonded warehouses,
Free Industrial Zones, Free Commercial Zones and Free Zones are recorded in the
statistics.
3. Commodities are classified according to the Standard International Trade
Classification of the United Nations. The commodity classifications that were in use
since 1947 are as follows :-
i. 1947 to 1952
‘Classified Import and Export List’
Ii. 1953 to 1966
‘Standard International Trade Classification’ (S.I.T.C.)
iii. 1967 to 1977
‘Standard International Trade Classification, Revised’ (S.I.T.C. Rev.)
iv. 1978 to 1987
‘Standard International Trade Classification, Revision 2’ (S.I.T.C. Rev. 2)
v. 1988 onwards
‘Standard International Trade Classification, Revision 3’ (S.I.T.C. Rev. 3)
4. The classification system and coverage used in 1947 to 1952 differ from that used
in 1953 and thereafter. Hence, the data as from 1953 onwards are not entirely
comparable with the data for 1947 to 1952.
5. Data for the year 1947 pertain to the Malayan Union. Data for the period 1948 to
1961 pertain to the Federation of Malaya. For the years 1962 to 1966, the data
pertain to Peninsular Malaysia only. Data as from 1967 and thereafter refer to
Malaysia. 57

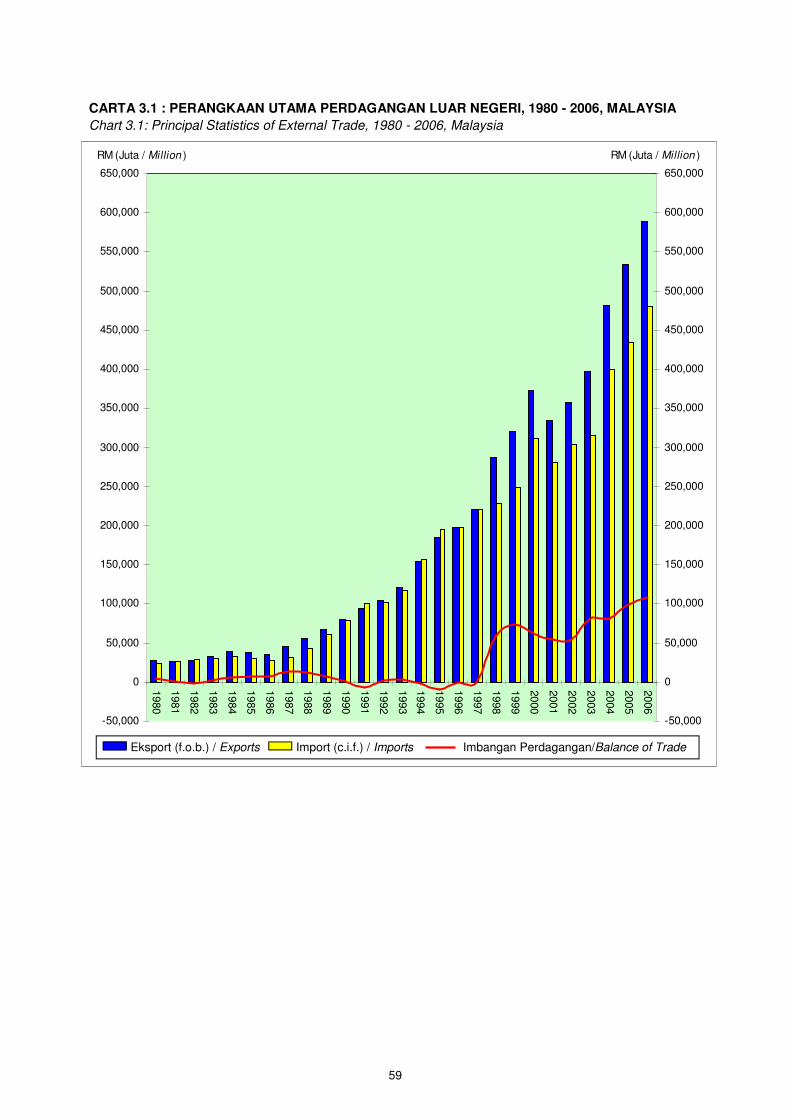
59
CARTA 3.1 : PERANGKAAN UTAMA PERDAGANGAN LUAR NEGERI, 1980 - 2006, MALAYSIA
Chart 3.1: Principal Statistics of External Trade, 1980 - 2006, Malaysia
-50,000
0
50,000
100,000
150,000
200,000
250,000
300,000
350,000
400,000
450,000
500,000
550,000
600,000
650,000
1980
1981
1982
1983
1984
1985
1986
1987
1988
1989
1990
1991
1992
1993
1994
1995
1996
1997
1998
1999
2000
2001
2002
2003
2004
2005
2006
RM (Juta / Million )
-50,000
0
50,000
100,000
150,000
200,000
250,000
300,000
350,000
400,000
450,000
500,000
550,000
600,000
650,000
RM (Juta / Million )
Eksport (f.o.b.) / Exports Import (c.i.f.) / Imports Imbangan Perdagangan/Balance of Trade
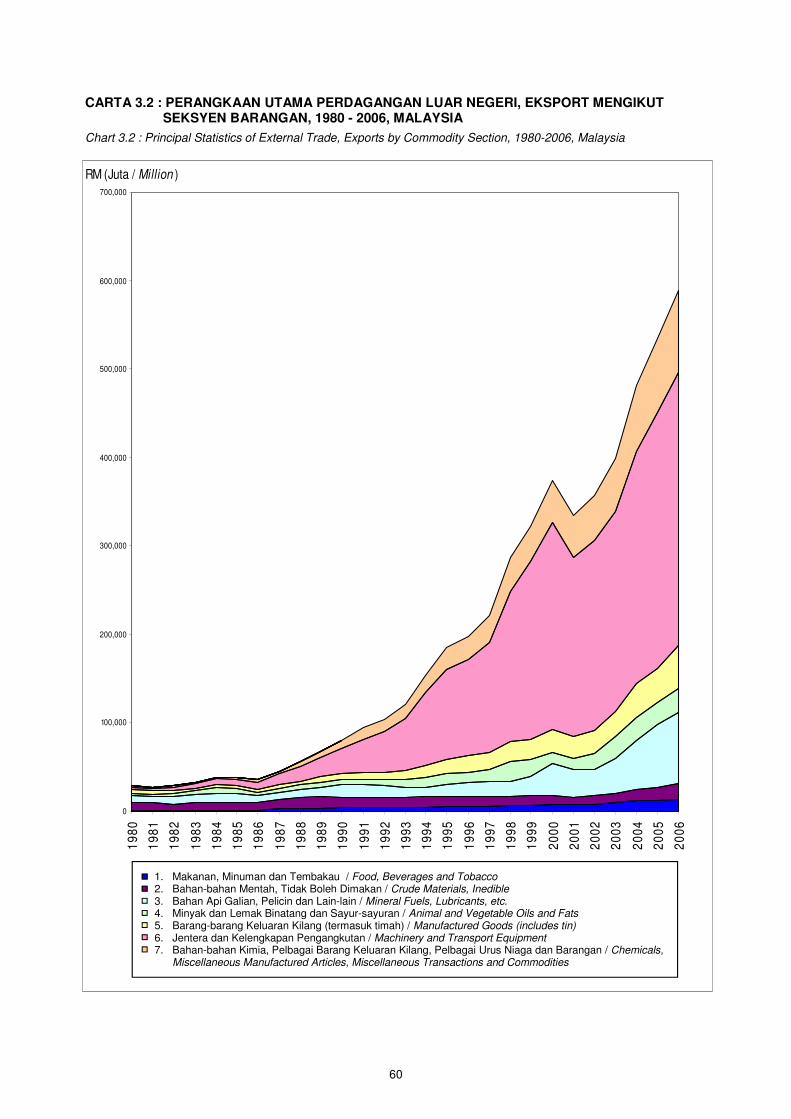
0
100,000
200,000
300,000
400,000
500,000
600,000
700,000
19
80
19
81
19
82
19
83
19
84
19
85
19
86
19
87
19
88
19
89
19
90
19
91
19
92
19
93
19
94
19
95
19
96
19
97
19
98
19
99
20
00
20
01
20
02
20
03
20
04
20
05
20
06
RM (Juta / Million )
CARTA 3.2 : PERANGKAAN UTAMA PERDAGANGAN LUAR NEGERI, EKSPORT MENGIKUT SEKSYEN BARANGAN, 1980 - 2006, MALAYSIA
Chart 3.2 : Principal Statistics of External Trade, Exports by Commodity Section, 1980-2006, Malaysia
60
1. Makanan, Minuman dan Tembakau / Food, Beverages and Tobacco 2. Bahan-bahan Mentah, Tidak Boleh Dimakan / Crude Materials, Inedible 3. Bahan Api Galian, Pelicin dan Lain-lain / Mineral Fuels, Lubricants, etc. 4. Minyak dan Lemak Binatang dan Sayur-sayuran / Animal and Vegetable Oils and Fats 5. Barang-barang Keluaran Kilang (termasuk timah) / Manufactured Goods (includes tin) 6. Jentera dan Kelengkapan Pengangkutan / Machinery and Transport Equipment 7. Bahan-bahan Kimia, Pelbagai Barang Keluaran Kilang, Pelbagai Urus Niaga dan Barangan / Chemicals,
Miscellaneous Manufactured Articles, Miscellaneous Transactions and Commodities
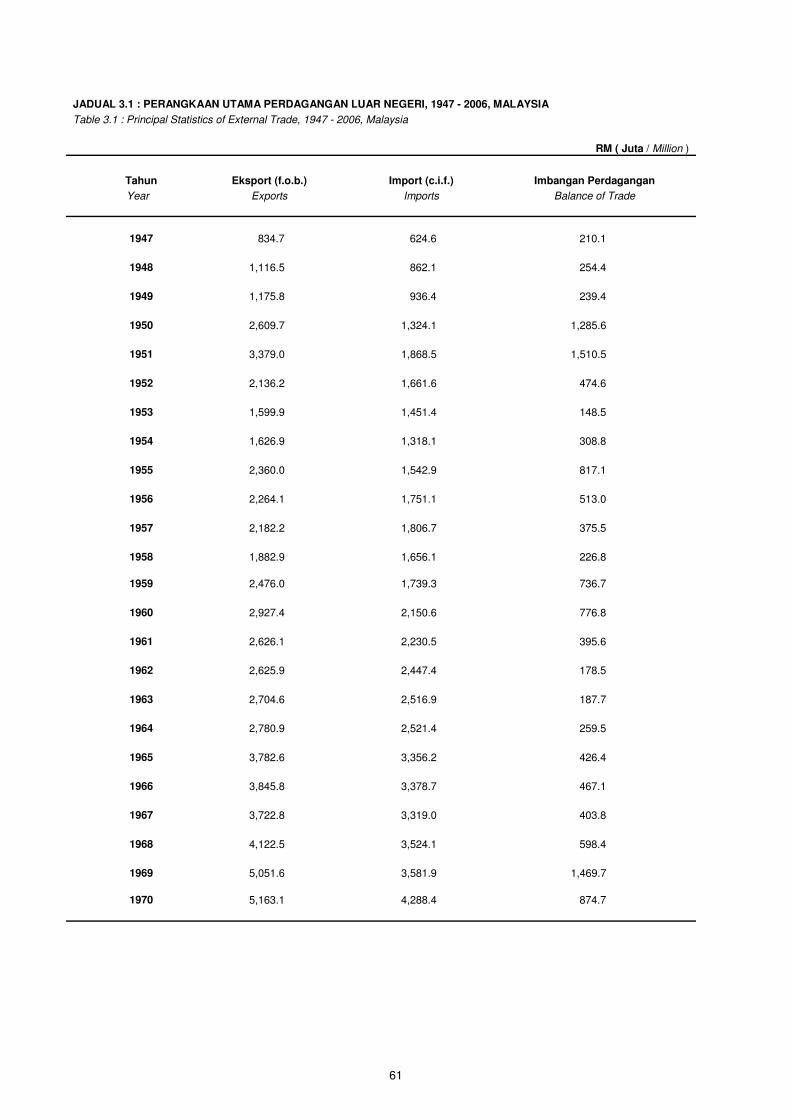
JADUAL 3.1 : PERANGKAAN UTAMA PERDAGANGAN LUAR NEGERI, 1947 - 2006, MALAYSIA
Table 3.1 : Principal Statistics of External Trade, 1947 - 2006, Malaysia
Tahun Eksport (f.o.b.) Import (c.i.f.) Imbangan Perdagangan
Year Exports Imports Balance of Trade
1947 834.7 624.6 210.1
1948 1,116.5 862.1 254.4
1949 1,175.8 936.4 239.4
1950 2,609.7 1,324.1 1,285.6
1951 3,379.0 1,868.5 1,510.5
1952 2,136.2 1,661.6 474.6
1953 1,599.9 1,451.4 148.5
1954 1,626.9 1,318.1 308.8
1955 2,360.0 1,542.9 817.1
1956 2,264.1 1,751.1 513.0
1957 2,182.2 1,806.7 375.5
1958 1,882.9 1,656.1 226.8
1959 2,476.0 1,739.3 736.7
1960 2,927.4 2,150.6 776.8
1961 2,626.1 2,230.5 395.6
1962 2,625.9 2,447.4 178.5
1963 2,704.6 2,516.9 187.7
1964 2,780.9 2,521.4 259.5
1965 3,782.6 3,356.2 426.4
1966 3,845.8 3,378.7 467.1
1967 3,722.8 3,319.0 403.8
1968 4,122.5 3,524.1 598.4
1969 5,051.6 3,581.9 1,469.7
1970 5,163.1 4,288.4 874.7
RM ( Juta / Million )
61
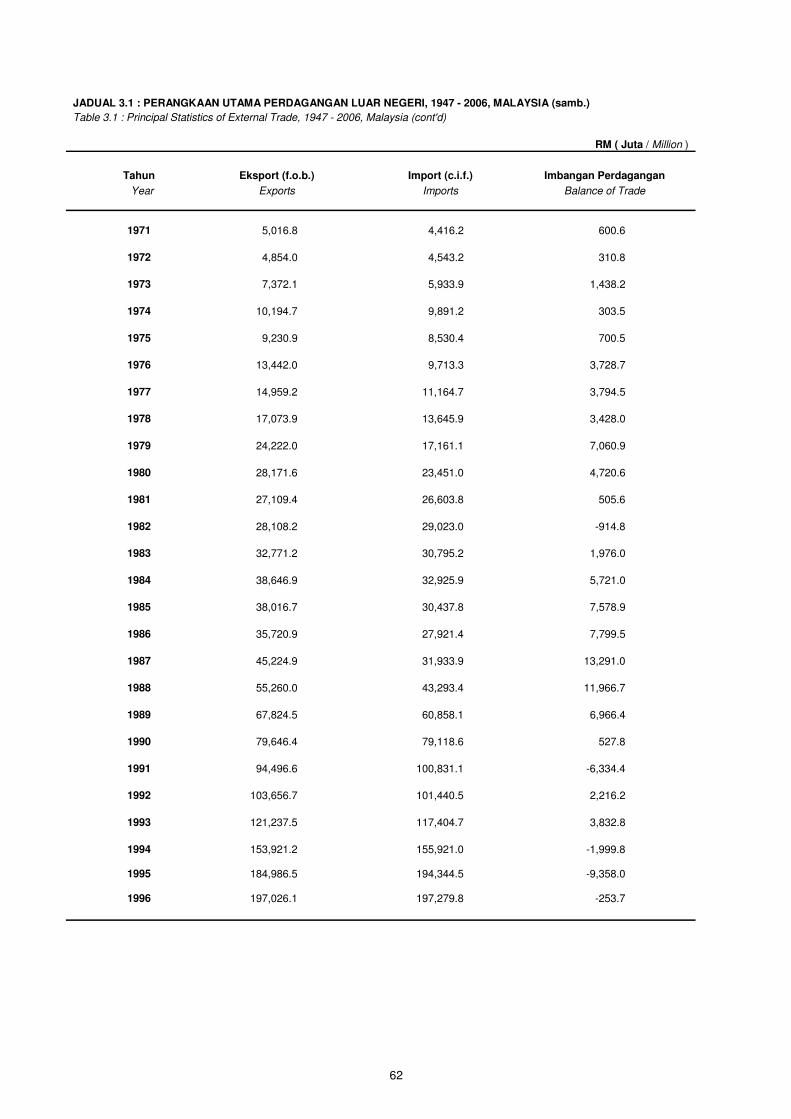
JADUAL 3.1 : PERANGKAAN UTAMA PERDAGANGAN LUAR NEGERI, 1947 - 2006, MALAYSIA (samb.)
Table 3.1 : Principal Statistics of External Trade, 1947 - 2006, Malaysia (cont'd)
Tahun Eksport (f.o.b.) Import (c.i.f.) Imbangan Perdagangan
Year Exports Imports Balance of Trade
1971 5,016.8 4,416.2 600.6
1972 4,854.0 4,543.2 310.8
1973 7,372.1 5,933.9 1,438.2
1974 10,194.7 9,891.2 303.5
1975 9,230.9 8,530.4 700.5
1976 13,442.0 9,713.3 3,728.7
1977 14,959.2 11,164.7 3,794.5
1978 17,073.9 13,645.9 3,428.0
1979 24,222.0 17,161.1 7,060.9
1980 28,171.6 23,451.0 4,720.6
1981 27,109.4 26,603.8 505.6
1982 28,108.2 29,023.0 -914.8
1983 32,771.2 30,795.2 1,976.0
1984 38,646.9 32,925.9 5,721.0
1985 38,016.7 30,437.8 7,578.9
1986 35,720.9 27,921.4 7,799.5
1987 45,224.9 31,933.9 13,291.0
1988 55,260.0 43,293.4 11,966.7
1989 67,824.5 60,858.1 6,966.4
1990 79,646.4 79,118.6 527.8
1991 94,496.6 100,831.1 -6,334.4
1992 103,656.7 101,440.5 2,216.2
1993 121,237.5 117,404.7 3,832.8
1994 153,921.2 155,921.0 -1,999.8 1995 184,986.5 194,344.5 -9,358.0
1996 197,026.1 197,279.8 -253.7
RM ( Juta / Million )
62
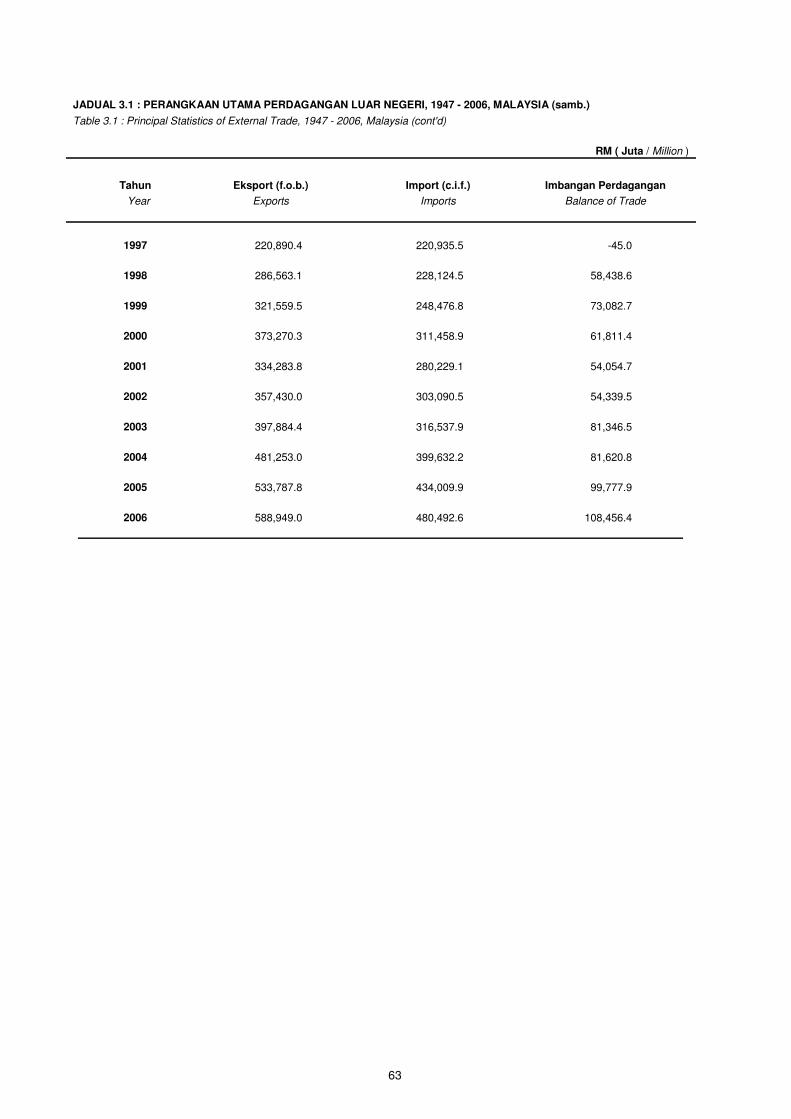
JADUAL 3.1 : PERANGKAAN UTAMA PERDAGANGAN LUAR NEGERI, 1947 - 2006, MALAYSIA (samb.)
Table 3.1 : Principal Statistics of External Trade, 1947 - 2006, Malaysia (cont'd)
Tahun Eksport (f.o.b.) Import (c.i.f.) Imbangan Perdagangan
Year Exports Imports Balance of Trade
1997 220,890.4 220,935.5 -45.0
1998 286,563.1 228,124.5 58,438.6
1999 321,559.5 248,476.8 73,082.7
2000 373,270.3 311,458.9 61,811.4
2001 334,283.8 280,229.1 54,054.7
2002 357,430.0 303,090.5 54,339.5
2003 397,884.4 316,537.9 81,346.5
2004 481,253.0 399,632.2 81,620.8
2005 533,787.8 434,009.9 99,777.9
2006 588,949.0 480,492.6 108,456.4
RM ( Juta / Million )
63
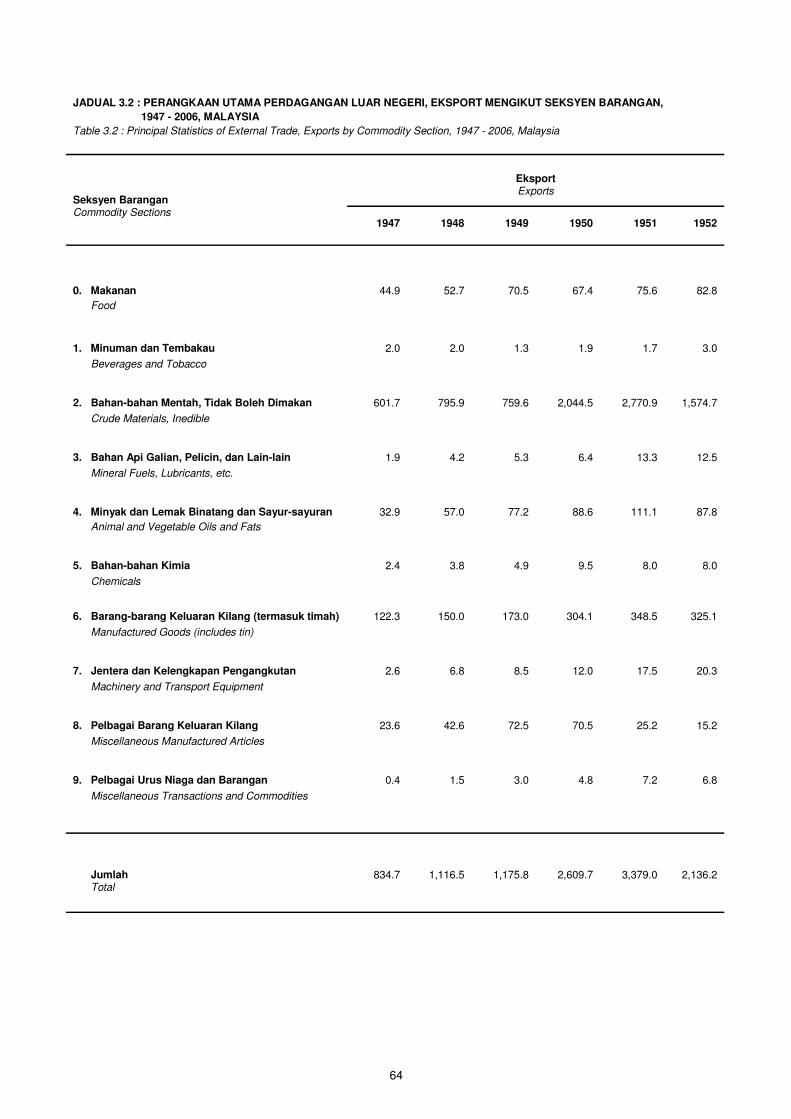
JADUAL 3.2 : PERANGKAAN UTAMA PERDAGANGAN LUAR NEGERI, EKSPORT MENGIKUT SEKSYEN BARANGAN,
1947 - 2006, MALAYSIA
Table 3.2 : Principal Statistics of External Trade, Exports by Commodity Section, 1947 - 2006, Malaysia
Eksport
Seksyen Barangan
Exports
Commodity Sections
1947 1948 1949 1950 1951 1952
0. Makanan 44.9 52.7 70.5 67.4 75.6 82.8
Food
1. Minuman dan Tembakau 2.0 2.0 1.3 1.9 1.7 3.0
Beverages and Tobacco
2. Bahan-bahan Mentah, Tidak Boleh Dimakan 601.7 795.9 759.6 2,044.5 2,770.9 1,574.7
Crude Materials, Inedible
3. Bahan Api Galian, Pelicin, dan Lain-lain 1.9 4.2 5.3 6.4 13.3 12.5
Mineral Fuels, Lubricants, etc.
4. Minyak dan Lemak Binatang dan Sayur-sayuran 32.9 57.0 77.2 88.6 111.1 87.8
Animal and Vegetable Oils and Fats
5. Bahan-bahan Kimia 2.4 3.8 4.9 9.5 8.0 8.0
Chemicals
6. Barang-barang Keluaran Kilang (termasuk timah) 122.3 150.0 173.0 304.1 348.5 325.1
Manufactured Goods (includes tin)
7. Jentera dan Kelengkapan Pengangkutan 2.6 6.8 8.5 12.0 17.5 20.3
Machinery and Transport Equipment
8. Pelbagai Barang Keluaran Kilang 23.6 42.6 72.5 70.5 25.2 15.2
Miscellaneous Manufactured Articles
9. Pelbagai Urus Niaga dan Barangan 0.4 1.5 3.0 4.8 7.2 6.8
Miscellaneous Transactions and Commodities
Jumlah 834.7 1,116.5 1,175.8 2,609.7 3,379.0 2,136.2
Total
64
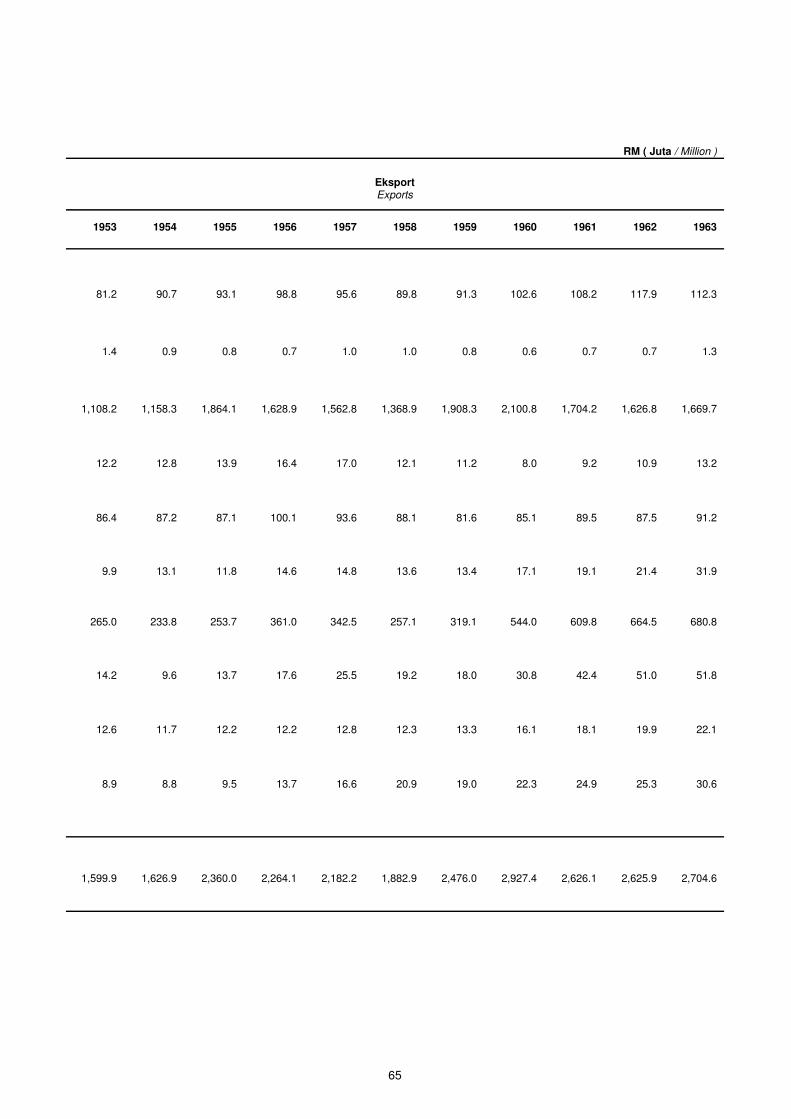
Eksport Exports
1953 1954 1955 1956 1957 1958 1959 1960 1961 1962 1963
81.2 90.7 93.1 98.8 95.6 89.8 91.3 102.6 108.2 117.9 112.3
1.4 0.9 0.8 0.7 1.0 1.0 0.8 0.6 0.7 0.7 1.3
1,108.2 1,158.3 1,864.1 1,628.9 1,562.8 1,368.9 1,908.3 2,100.8 1,704.2 1,626.8 1,669.7
12.2 12.8 13.9 16.4 17.0 12.1 11.2 8.0 9.2 10.9 13.2
86.4 87.2 87.1 100.1 93.6 88.1 81.6 85.1 89.5 87.5 91.2
9.9 13.1 11.8 14.6 14.8 13.6 13.4 17.1 19.1 21.4 31.9
265.0 233.8 253.7 361.0 342.5 257.1 319.1 544.0 609.8 664.5 680.8
14.2 9.6 13.7 17.6 25.5 19.2 18.0 30.8 42.4 51.0 51.8
12.6 11.7 12.2 12.2 12.8 12.3 13.3 16.1 18.1 19.9 22.1
8.9 8.8 9.5 13.7 16.6 20.9 19.0 22.3 24.9 25.3 30.6
1,599.9 1,626.9 2,360.0 2,264.1 2,182.2 1,882.9 2,476.0 2,927.4 2,626.1 2,625.9 2,704.6
RM ( Juta / Million )
65
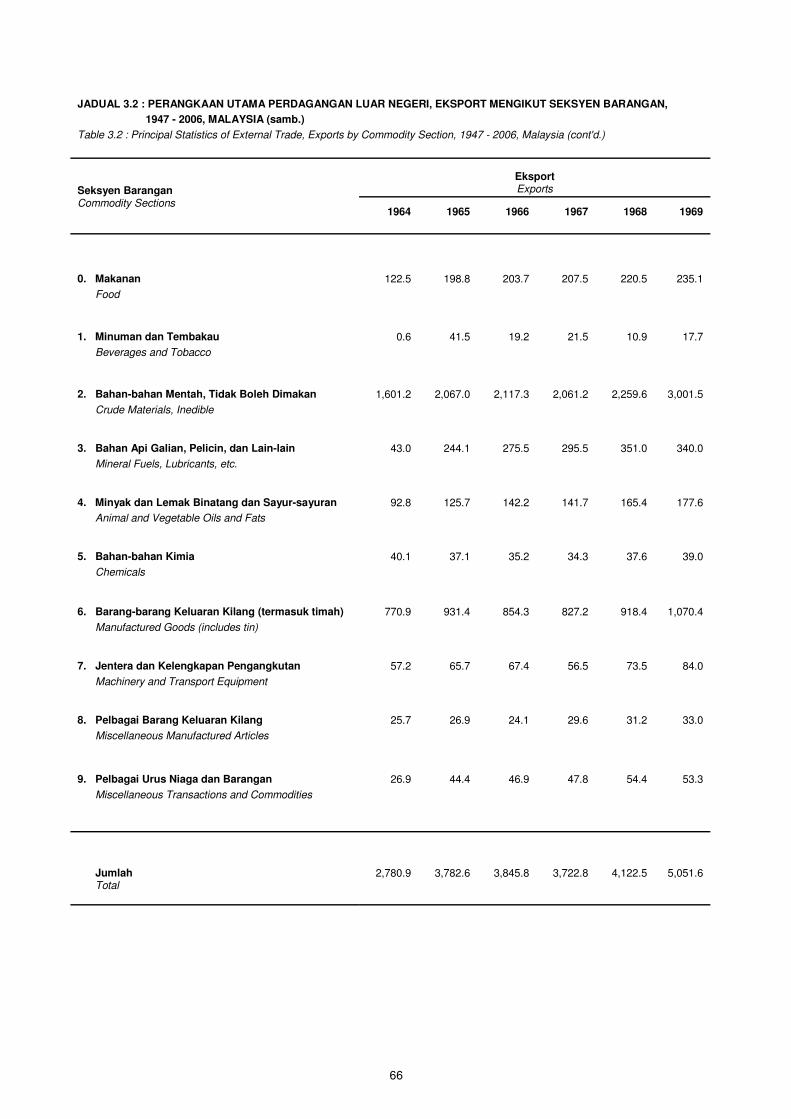
JADUAL 3.2 : PERANGKAAN UTAMA PERDAGANGAN LUAR NEGERI, EKSPORT MENGIKUT SEKSYEN BARANGAN,
1947 - 2006, MALAYSIA (samb.)
Table 3.2 : Principal Statistics of External Trade, Exports by Commodity Section, 1947 - 2006, Malaysia (cont'd.)
Eksport
Seksyen Barangan Exports
Commodity Sections
1964 1965 1966 1967 1968 1969
0. Makanan 122.5 198.8 203.7 207.5 220.5 235.1
Food
1. Minuman dan Tembakau 0.6 41.5 19.2 21.5 10.9 17.7
Beverages and Tobacco
2. Bahan-bahan Mentah, Tidak Boleh Dimakan 1,601.2 2,067.0 2,117.3 2,061.2 2,259.6
3,001.5
Crude Materials, Inedible
3. Bahan Api Galian, Pelicin, dan Lain-lain 43.0 244.1 275.5 295.5 351.0 340.0
Mineral Fuels, Lubricants, etc.
4. Minyak dan Lemak Binatang dan Sayur-sayuran 92.8 125.7 142.2 141.7 165.4 177.6
Animal and Vegetable Oils and Fats
5. Bahan-bahan Kimia 40.1 37.1 35.2 34.3 37.6 39.0
Chemicals
6. Barang-barang Keluaran Kilang (termasuk timah) 770.9 931.4 854.3 827.2 918.4
1,070.4
Manufactured Goods (includes tin)
7. Jentera dan Kelengkapan Pengangkutan 57.2 65.7 67.4 56.5 73.5 84.0
Machinery and Transport Equipment
8. Pelbagai Barang Keluaran Kilang 25.7 26.9 24.1 29.6 31.2 33.0
Miscellaneous Manufactured Articles
9. Pelbagai Urus Niaga dan Barangan 26.9 44.4 46.9 47.8 54.4 53.3
Miscellaneous Transactions and Commodities
Jumlah 2,780.9 3,782.6 3,845.8 3,722.8 4,122.5
5,051.6
Total
66
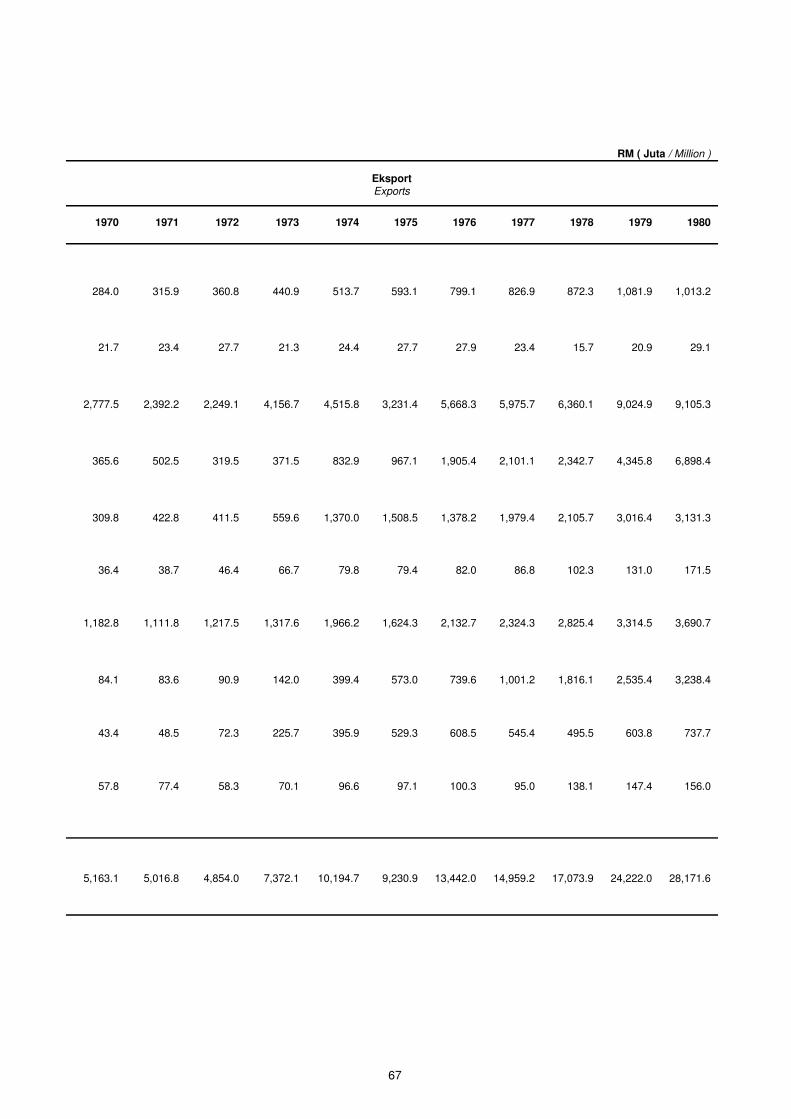
RM ( Juta / Million )
Eksport Exports
1970 1971 1972 1973 1974 1975
284.0 315.9 360.8 440.9 513.7 593.1
21.7 23.4 27.7 21.3 24.4 27.7
2,777.5 2,392.2 2,249.1 4,156.7 4,515.8
3,231.4
365.6 502.5 319.5 371.5 832.9 967.1
309.8 422.8 411.5 559.6 1,370.0
1,508.5
36.4 38.7 46.4 66.7 79.8 79.4
1,182.8 1,111.8 1,217.5 1,317.6 1,966.2
1,624.3
84.1 83.6 90.9 142.0 399.4 573.0
43.4 48.5 72.3 225.7 395.9 529.3
57.8 77.4 58.3 70.1 96.6 97.1
5,163.1 5,016.8 4,854.0 7,372.1 10,194.7
9,230.9
1976 1977 1978 1979 1980
799.1 826.9 872.3
1,081.9
1,013.2
27.9 23.4 15.7 20.9 29.1
5,668.3
5,975.7
6,360.1
9,024.9
9,105.3
1,905.4
2,101.1
2,342.7
4,345.8
6,898.4
1,378.2
1,979.4
2,105.7
3,016.4
3,131.3
82.0 86.8 102.3 131.0 171.5
2,132.7
2,324.3
2,825.4
3,314.5
3,690.7
739.6
1,001.2
1,816.1
2,535.4
3,238.4
608.5 545.4 495.5 603.8 737.7
100.3 95.0 138.1 147.4 156.0
13,442.0
14,959.2
17,073.9
24,222.0
28,171.6
67
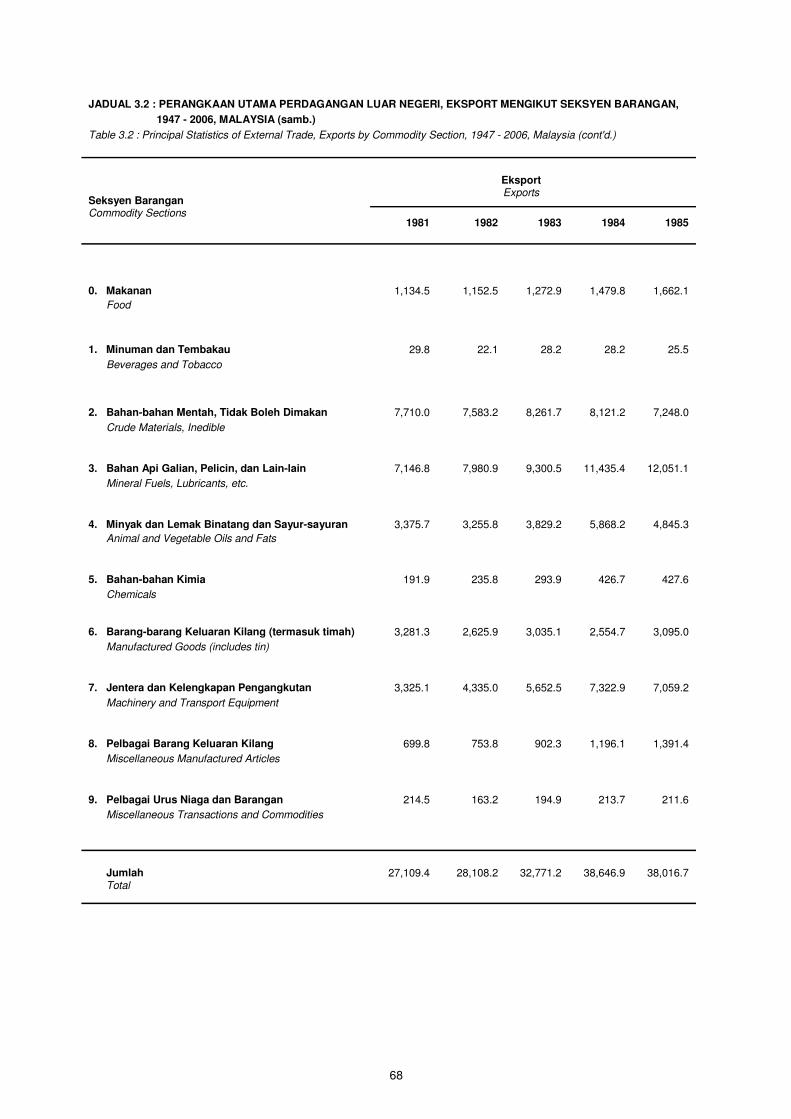
JADUAL 3.2 : PERANGKAAN UTAMA PERDAGANGAN LUAR NEGERI, EKSPORT MENGIKUT SEKSYEN BARANGAN,
1947 - 2006, MALAYSIA (samb.)
Table 3.2 : Principal Statistics of External Trade, Exports by Commodity Section, 1947 - 2006, Malaysia (cont'd.)
Eksport
Seksyen Barangan
Exports
Commodity Sections
1981 1982 1983 1984 1985
0. Makanan 1,134.5 1,152.5
1,272.9
1,479.8
1,662.1
Food
1. Minuman dan Tembakau 29.8 22.1
28.2
28.2
25.5
Beverages and Tobacco
2. Bahan-bahan Mentah, Tidak Boleh Dimakan 7,710.0 7,583.2
8,261.7
8,121.2
7,248.0
Crude Materials, Inedible
3. Bahan Api Galian, Pelicin, dan Lain-lain 7,146.8 7,980.9
9,300.5
11,435.4
12,051.1
Mineral Fuels, Lubricants, etc.
4. Minyak dan Lemak Binatang dan Sayur-sayuran 3,375.7 3,255.8
3,829.2
5,868.2
4,845.3
Animal and Vegetable Oils and Fats
5. Bahan-bahan Kimia 191.9 235.8
293.9
426.7
427.6
Chemicals
6. Barang-barang Keluaran Kilang (termasuk timah) 3,281.3 2,625.9
3,035.1
2,554.7
3,095.0
Manufactured Goods (includes tin)
7. Jentera dan Kelengkapan Pengangkutan 3,325.1 4,335.0
5,652.5
7,322.9
7,059.2
Machinery and Transport Equipment
8. Pelbagai Barang Keluaran Kilang 699.8 753.8
902.3
1,196.1
1,391.4
Miscellaneous Manufactured Articles
9. Pelbagai Urus Niaga dan Barangan 214.5 163.2
194.9
213.7
211.6
Miscellaneous Transactions and Commodities
Jumlah 27,109.4 28,108.2
32,771.2
38,646.9
38,016.7
Total
68
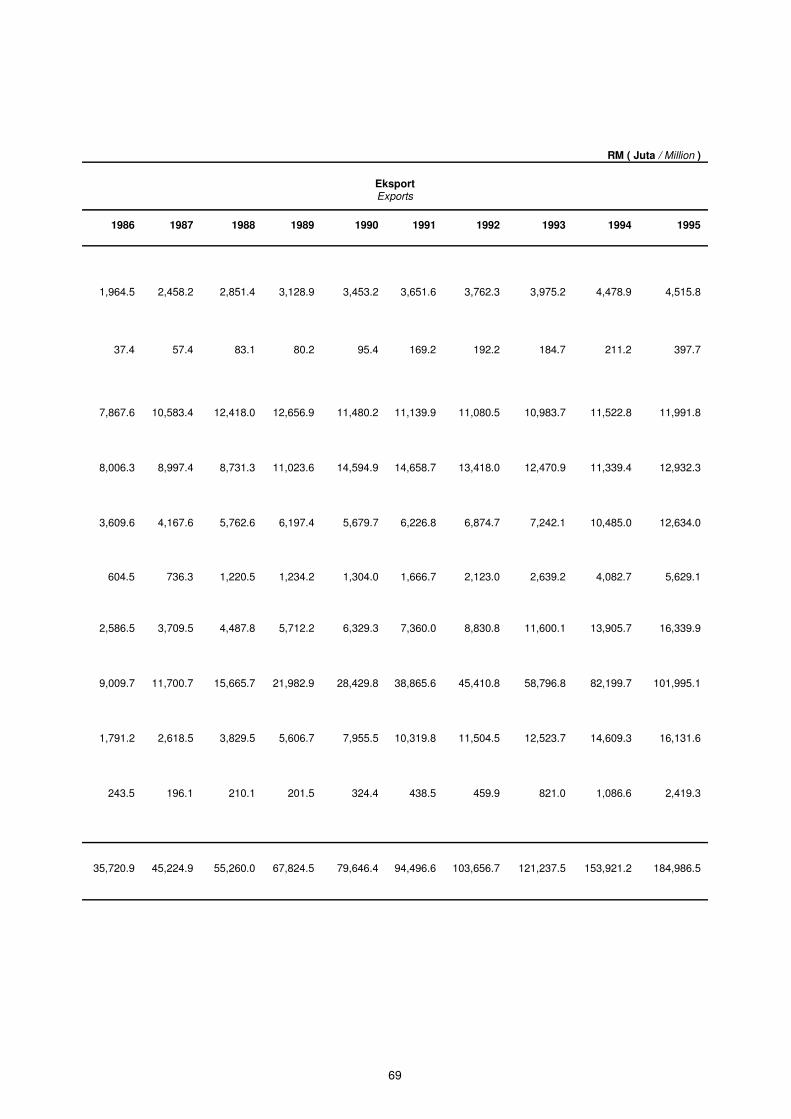
RM ( Juta / Million )
Eksport Exports
1986 1987 1988 1989 1990 1991 1992 1993 1994 1995
1,964.5
2,458.2 2,851.4 3,128.9
3,453.2
3,651.6 3,762.3 3,975.2 4,478.9 4,515.8
37.4
57.4 83.1 80.2
95.4
169.2 192.2 184.7 211.2 397.7
7,867.6
10,583.4 12,418.0
12,656.9
11,480.2
11,139.9 11,080.5 10,983.7 11,522.8 11,991.8
8,006.3
8,997.4 8,731.3
11,023.6
14,594.9
14,658.7 13,418.0 12,470.9 11,339.4 12,932.3
3,609.6
4,167.6 5,762.6 6,197.4
5,679.7
6,226.8 6,874.7 7,242.1 10,485.0 12,634.0
604.5
736.3 1,220.5 1,234.2
1,304.0
1,666.7 2,123.0 2,639.2 4,082.7 5,629.1
2,586.5
3,709.5 4,487.8 5,712.2
6,329.3
7,360.0 8,830.8 11,600.1 13,905.7 16,339.9
9,009.7
11,700.7 15,665.7
21,982.9
28,429.8
38,865.6 45,410.8 58,796.8 82,199.7 101,995.1
1,791.2
2,618.5 3,829.5 5,606.7
7,955.5
10,319.8 11,504.5 12,523.7 14,609.3 16,131.6
243.5
196.1 210.1 201.5
324.4
438.5 459.9 821.0 1,086.6 2,419.3
35,720.9
45,224.9 55,260.0
67,824.5
79,646.4
94,496.6
103,656.7 121,237.5 153,921.2 184,986.5
69
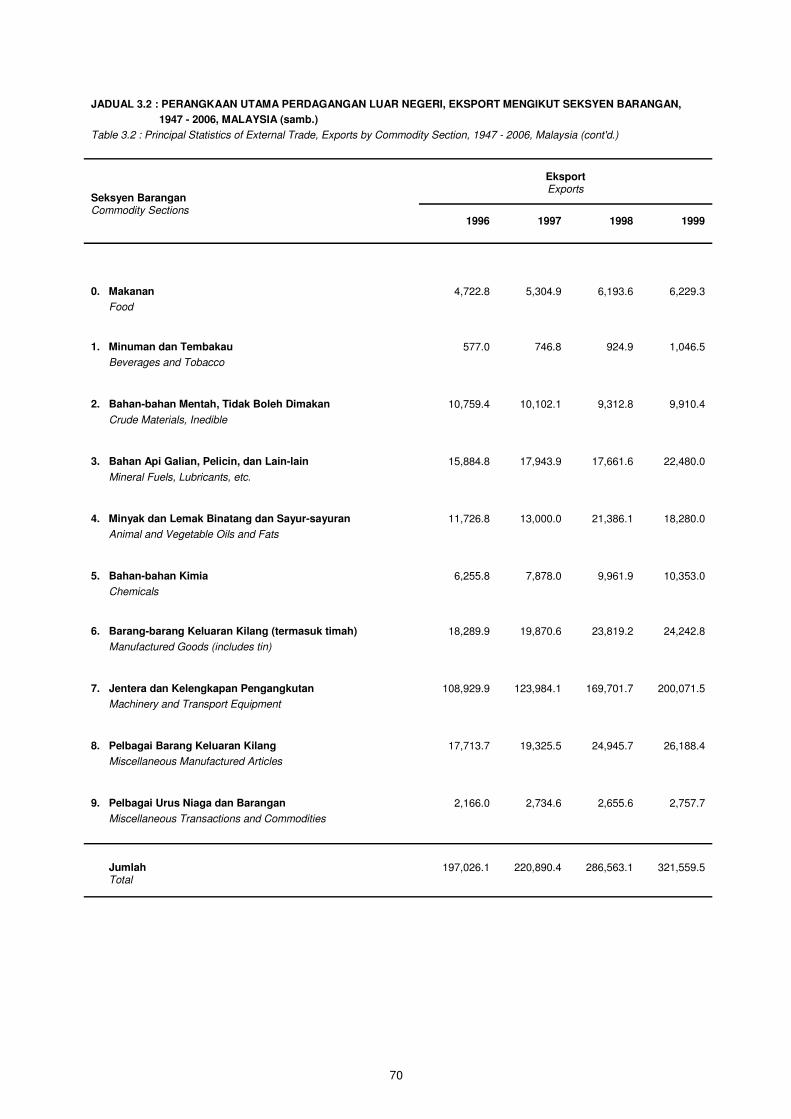
JADUAL 3.2 : PERANGKAAN UTAMA PERDAGANGAN LUAR NEGERI, EKSPORT MENGIKUT SEKSYEN BARANGAN,
1947 - 2006, MALAYSIA (samb.)
Table 3.2 : Principal Statistics of External Trade, Exports by Commodity Section, 1947 - 2006, Malaysia (cont'd.)
Eksport
Seksyen Barangan
Exports
Commodity Sections
1996 1997 1998 1999
0. Makanan 4,722.8 5,304.9 6,193.6 6,229.3
Food
1. Minuman dan Tembakau 577.0 746.8 924.9 1,046.5
Beverages and Tobacco
2. Bahan-bahan Mentah, Tidak Boleh Dimakan 10,759.4 10,102.1 9,312.8 9,910.4
Crude Materials, Inedible
3. Bahan Api Galian, Pelicin, dan Lain-lain 15,884.8 17,943.9 17,661.6 22,480.0
Mineral Fuels, Lubricants, etc.
4. Minyak dan Lemak Binatang dan Sayur-sayuran 11,726.8 13,000.0 21,386.1 18,280.0
Animal and Vegetable Oils and Fats
5. Bahan-bahan Kimia 6,255.8 7,878.0 9,961.9 10,353.0
Chemicals
6. Barang-barang Keluaran Kilang (termasuk timah) 18,289.9 19,870.6 23,819.2 24,242.8
Manufactured Goods (includes tin)
7. Jentera dan Kelengkapan Pengangkutan 108,929.9 123,984.1 169,701.7 200,071.5
Machinery and Transport Equipment
8. Pelbagai Barang Keluaran Kilang 17,713.7 19,325.5 24,945.7 26,188.4
Miscellaneous Manufactured Articles
9. Pelbagai Urus Niaga dan Barangan 2,166.0 2,734.6 2,655.6 2,757.7
Miscellaneous Transactions and Commodities
Jumlah 197,026.1 220,890.4 286,563.1 321,559.5
Total
70
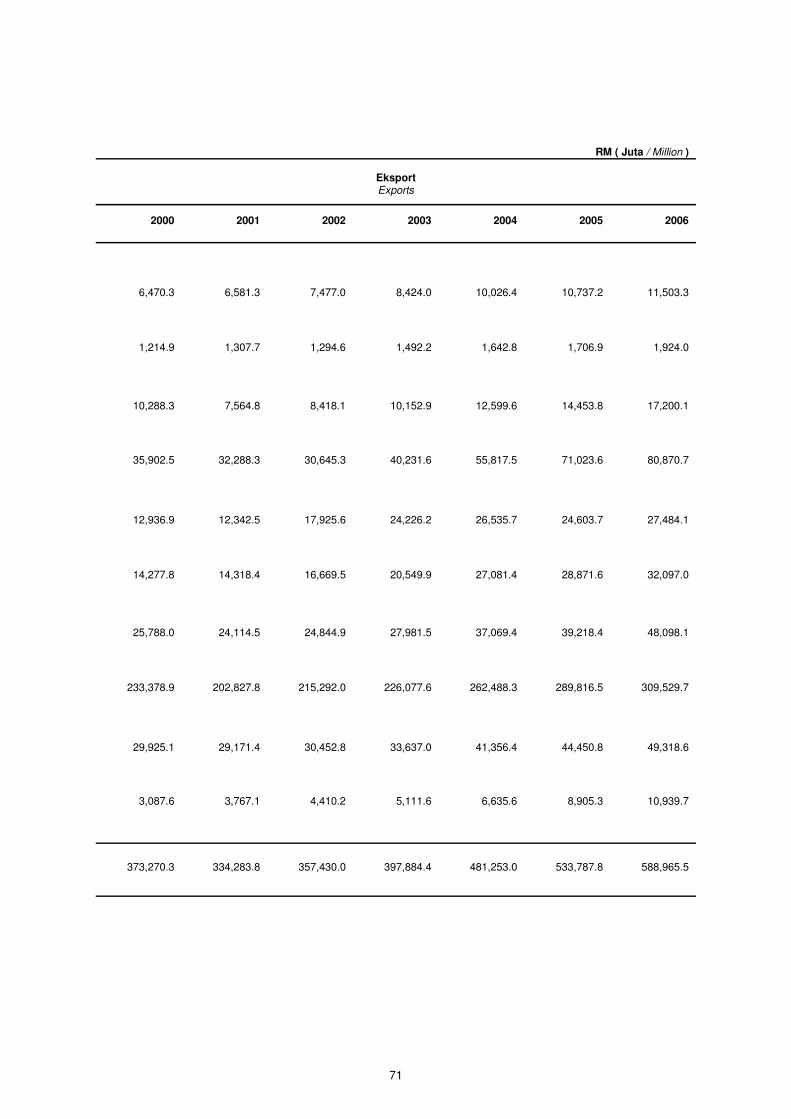
RM ( Juta / Million )
Eksport Exports
2001 2002 2003 2004 2005 2006
6,581.3 7,477.0 8,424.0 10,026.4 10,737.2 11,503.3
1,307.7 1,294.6 1,492.2 1,642.8 1,706.9 1,924.0
7,564.8 8,418.1 10,152.9 12,599.6 14,453.8 17,200.1
32,288.3 30,645.3 40,231.6 55,817.5 71,023.6 80,870.7
12,342.5 17,925.6 24,226.2 26,535.7 24,603.7 27,484.1
14,318.4 16,669.5 20,549.9 27,081.4 28,871.6 32,097.0
24,114.5 24,844.9 27,981.5 37,069.4 39,218.4 48,098.1
202,827.8 215,292.0 226,077.6 262,488.3 289,816.5 309,529.7
29,171.4 30,452.8 33,637.0 41,356.4 44,450.8 49,318.6
3,767.1 4,410.2 5,111.6 6,635.6 8,905.3 10,939.7
334,283.8 357,430.0 397,884.4 481,253.0 533,787.8 588,965.5
2000
6,470.3
1,214.9
10,288.3
35,902.5
12,936.9
14,277.8
25,788.0
233,378.9
29,925.1
3,087.6
373,270.3
71
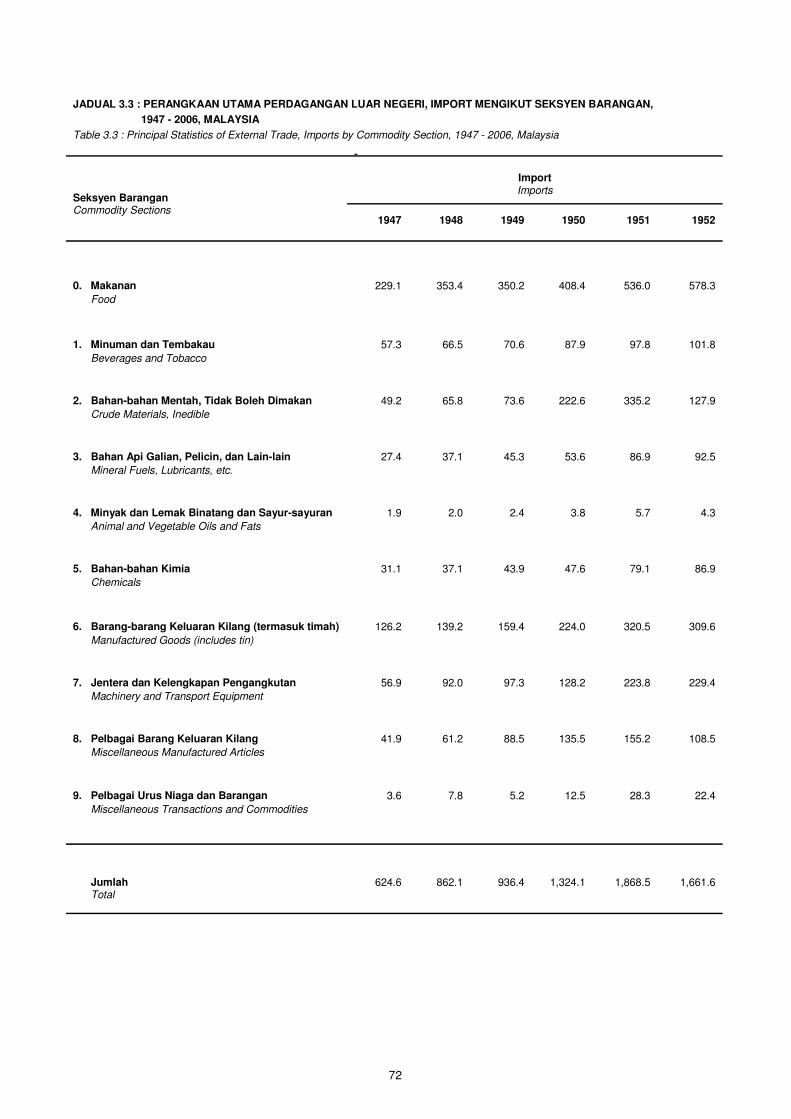
JADUAL 3.3 : PERANGKAAN UTAMA PERDAGANGAN LUAR NEGERI, IMPORT MENGIKUT SEKSYEN BARANGAN,
1947 - 2006, MALAYSIA
Table 3.3 : Principal Statistics of External Trade, Imports by Commodity Section, 1947 - 2006, Malaysia
Import
Seksyen Barangan
Imports
Commodity Sections
1947 1948 1949 1950 1951 1952
0. Makanan 229.1 353.4 350.2 408.4 536.0 578.3
Food
1. Minuman dan Tembakau 57.3 66.5 70.6 87.9 97.8 101.8
Beverages and Tobacco
2. Bahan-bahan Mentah, Tidak Boleh Dimakan 49.2 65.8 73.6 222.6 335.2 127.9
Crude Materials, Inedible
3. Bahan Api Galian, Pelicin, dan Lain-lain 27.4 37.1 45.3 53.6 86.9 92.5
Mineral Fuels, Lubricants, etc.
4. Minyak dan Lemak Binatang dan Sayur-sayuran 1.9 2.0 2.4 3.8 5.7 4.3
Animal and Vegetable Oils and Fats
5. Bahan-bahan Kimia 31.1 37.1 43.9 47.6 79.1 86.9
Chemicals
6. Barang-barang Keluaran Kilang (termasuk timah) 126.2 139.2 159.4 224.0 320.5 309.6
Manufactured Goods (includes tin)
7. Jentera dan Kelengkapan Pengangkutan 56.9 92.0 97.3 128.2 223.8 229.4
Machinery and Transport Equipment
8. Pelbagai Barang Keluaran Kilang 41.9 61.2 88.5 135.5 155.2 108.5
Miscellaneous Manufactured Articles
9. Pelbagai Urus Niaga dan Barangan 3.6 7.8 5.2 12.5 28.3 22.4
Miscellaneous Transactions and Commodities
Jumlah 624.6 862.1 936.4 1,324.1 1,868.5 1,661.6
Total
72
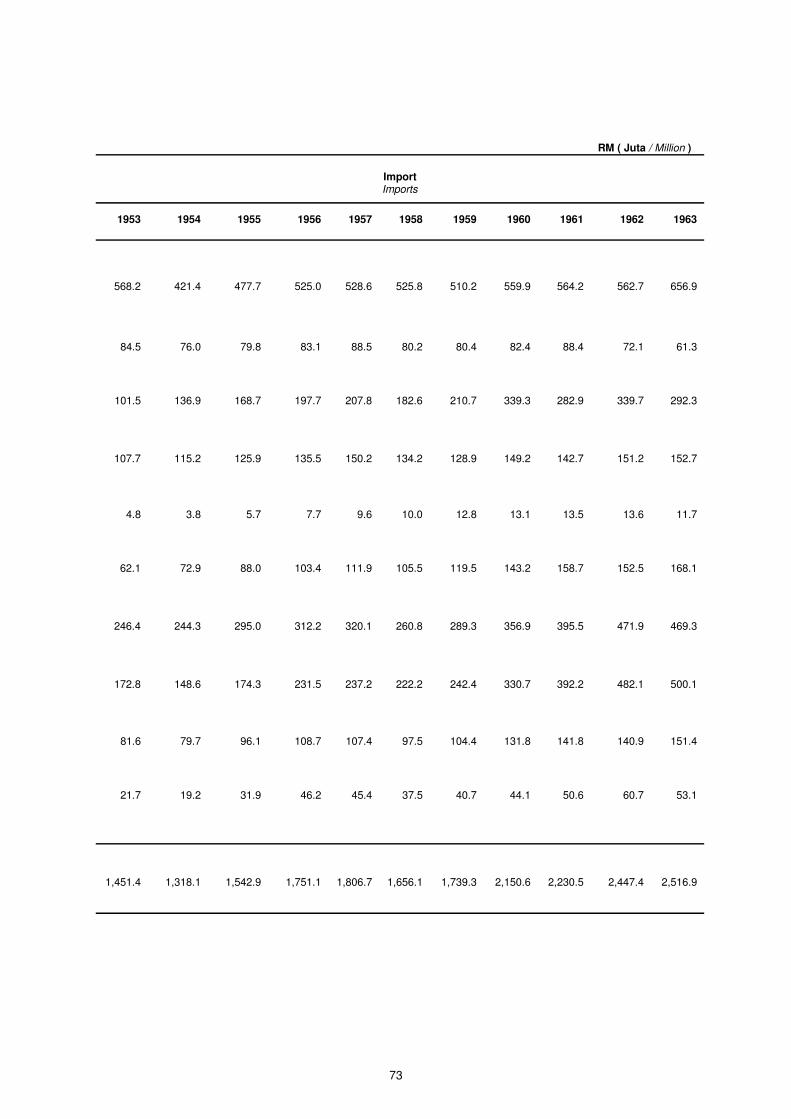
RM ( Juta / Million )
Import Imports
1953 1954 1955 1956 1957 1958
568.2 421.4 477.7 525.0
528.6
525.8
84.5 76.0 79.8 83.1
88.5
80.2
101.5 136.9 168.7 197.7
207.8
182.6
107.7 115.2 125.9 135.5
150.2
134.2
4.8 3.8 5.7 7.7
9.6
10.0
62.1 72.9 88.0 103.4
111.9
105.5
246.4 244.3 295.0 312.2
320.1
260.8
172.8 148.6 174.3 231.5
237.2
222.2
81.6 79.7 96.1 108.7 107.4 97.5
21.7 19.2 31.9 46.2 45.4 37.5
1,451.4 1,318.1 1,542.9 1,751.1
1,806.7
1,656.1
1959 1960 1961 1962 1963
510.2 559.9 564.2 562.7 656.9
80.4 82.4 88.4 72.1 61.3
210.7 339.3 282.9 339.7 292.3
128.9 149.2 142.7 151.2 152.7
12.8 13.1 13.5 13.6 11.7
119.5 143.2 158.7 152.5 168.1
289.3 356.9 395.5 471.9 469.3
242.4 330.7 392.2 482.1 500.1
104.4 131.8 141.8 140.9 151.4
40.7 44.1 50.6 60.7 53.1
1,739.3 2,150.6 2,230.5 2,447.4 2,516.9
73

JADUAL 3.3 : PERANGKAAN UTAMA PERDAGANGAN LUAR NEGERI, IMPORT MENGIKUT SEKSYEN BARANGAN,
1947 - 2006, MALAYSIA (samb.)
Table 3.3 : Principal Statistics of External Trade, Imports by Commodity Section, 1947 - 2006, Malaysia (cont'd.)
Import
Seksyen Barangan
Commodity Sections
1964 1965 1966 1967 1968 1969
0. Makanan 695.2 749.6
748.0 761.8 765.0 726.8
Food
1. Minuman dan Tembakau 58.1 123.5
90.6 90.1 77.0 87.3
Beverages and Tobacco
2. Bahan-bahan Mentah, Tidak Boleh Dimakan 227.8 237.7
163.7 166.4 283.5 302.8
Crude Materials, Inedible
3. Bahan Api Galian, Pelicin, dan Lain-lain 167.3 388.5
437.2 445.7 501.4 485.3
Mineral Fuels, Lubricants, etc.
4. Minyak dan Lemak Binatang dan Sayur-sayuran 12.4 18.2
15.2 14.9 22.1 19.3
Animal and Vegetable Oils and Fats
5. Bahan-bahan Kimia 177.0 233.9
252.0 247.2 237.9 272.5
Chemicals
6. Barang-barang Keluaran Kilang (termasuk timah) 464.7 597.6
608.4 590.9 610.2 621.6
Manufactured Goods (includes tin)
7. Jentera dan Kelengkapan Pengangkutan 515.9 728.6
799.7 735.8 776.2 827.8
Machinery and Transport Equipment
8. Pelbagai Barang Keluaran Kilang 152.3 206.3
188.9 191.3 186.2 179.6
Miscellaneous Manufactured Articles
9. Pelbagai Urus Niaga dan Barangan 50.7 72.3
75.0 74.9 64.6 58.9
Miscellaneous Transactions and Commodities
Jumlah 2,521.4 3,356.2
3,378.7 3,319.0 3,524.1 3,581.9
Total
Imports
74
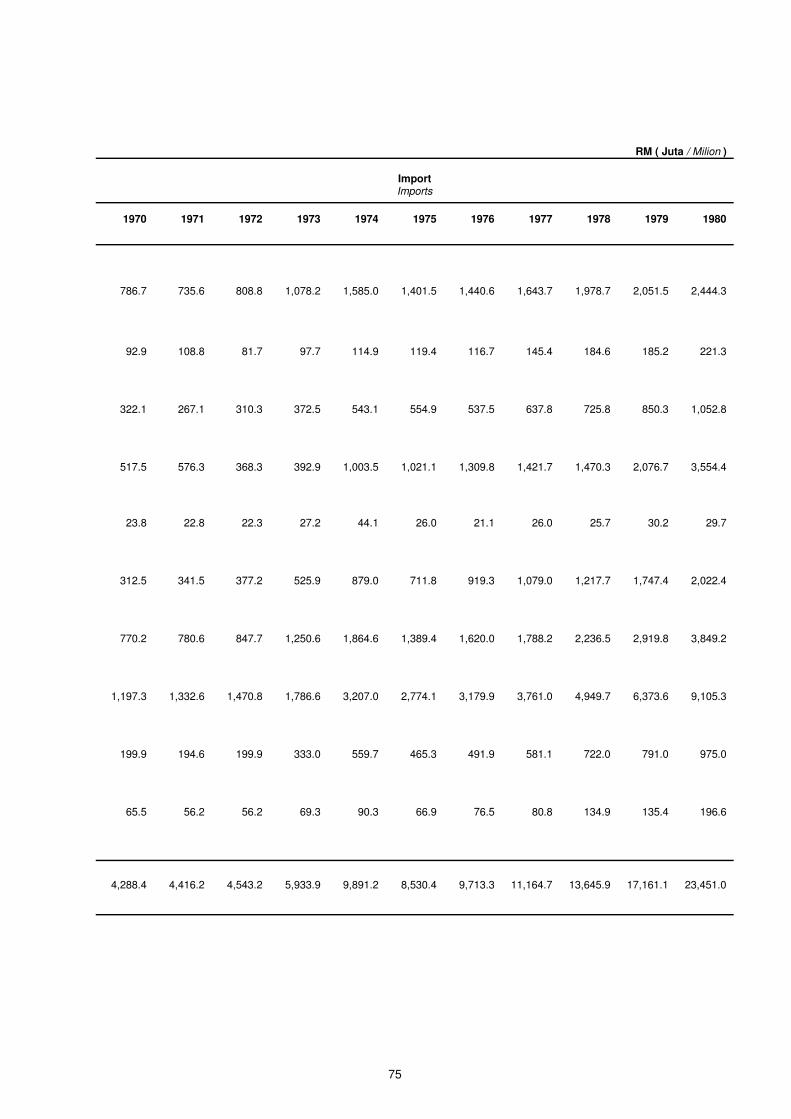
RM ( Juta / Milion )
Import Imports
1970 1971 1972 1973 1974 1975
786.7 735.6 808.8 1,078.2 1,585.0 1,401.5
92.9 108.8 81.7 97.7 114.9 119.4
322.1 267.1 310.3 372.5 543.1 554.9
517.5 576.3 368.3 392.9 1,003.5 1,021.1
23.8 22.8 22.3 27.2 44.1 26.0
312.5 341.5 377.2 525.9 879.0 711.8
770.2 780.6 847.7 1,250.6 1,864.6 1,389.4
1,197.3 1,332.6 1,470.8 1,786.6 3,207.0 2,774.1
199.9 194.6 199.9 333.0 559.7 465.3
65.5 56.2 56.2 69.3 90.3 66.9
4,288.4 4,416.2 4,543.2 5,933.9 9,891.2 8,530.4
1976 1977 1978 1979 1980
1,440.6 1,643.7
1,978.7 2,051.5 2,444.3
116.7 145.4
184.6 185.2 221.3
537.5 637.8
725.8 850.3 1,052.8
1,309.8 1,421.7
1,470.3 2,076.7 3,554.4
21.1 26.0 25.7 30.2 29.7
919.3 1,079.0
1,217.7 1,747.4 2,022.4
1,620.0 1,788.2
2,236.5 2,919.8 3,849.2
3,179.9 3,761.0
4,949.7 6,373.6 9,105.3
491.9 581.1
722.0 791.0 975.0
76.5 80.8
134.9 135.4 196.6
9,713.3
11,164.7
13,645.9
17,161.1
23,451.0
75

JADUAL 3.3 : PERANGKAAN UTAMA PERDAGANGAN LUAR NEGERI, IMPORT MENGIKUT SEKSYEN BARANGAN,
1947 - 2006, MALAYSIA (samb.)
Table 3.3 : Principal Statistics of External Trade, Imports by Commodity Section, 1947 - 2006, Malaysia (cont'd.)
Import
Seksyen Barangan
Commodity Sections
1981 1982 1983 1984 1985 1986
0. Makanan
2,941.5
2,999.4 2,984.5
3,227.1
3,064.0 2,914.2
Food
1. Minuman dan Tembakau 255.1 247.6 250.2 212.8 228.9 209.6
Beverages and Tobacco
2. Bahan-bahan Mentah, Tidak Boleh Dimakan
1,190.6
1,132.3 1,186.6
1,157.8
1,035.8 1,016.7
Crude Materials, Inedible
3. Bahan Api Galian, Pelicin, dan Lain-lain
4,578.9
4,389.6 4,241.6
3,332.3
3,722.0 2,387.8
Mineral Fuels, Lubricants, etc.
4. Minyak dan Lemak Binatang dan Sayur-sayuran 35.2 36.5 56.3 119.9 80.6 68.5
Animal and Vegetable Oils and Fats
5. Bahan-bahan Kimia
2,095.9
2,145.0 2,424.9
2,635.6
2,639.8 2,686.5
Chemicals
6. Barang-barang Keluaran Kilang (termasuk timah)
4,277.0
4,915.5 4,881.6
5,086.0
4,419.0 4,037.5
Manufactured Goods (includes tin)
7. Jentera dan Kelengkapan Pengangkutan
9,884.2
11,548.4 13,171.2
15,128.8
13,262.1 12,579.1
Machinery and Transport Equipment
8. Pelbagai Barang Keluaran Kilang
1,077.0
1,354.0 1,395.9
1,715.6
1,673.8 1,700.6
Miscellaneous Manufactured Articles
9. Pelbagai Urus Niaga dan Barangan 268.4 254.7 202.4 310.0 311.9 326.7
Miscellaneous Transactions and Commodities
Jumlah
26,603.8
29,023.0 30,795.2
32,925.9
30,437.8 27,921.4
Total
Imports
76
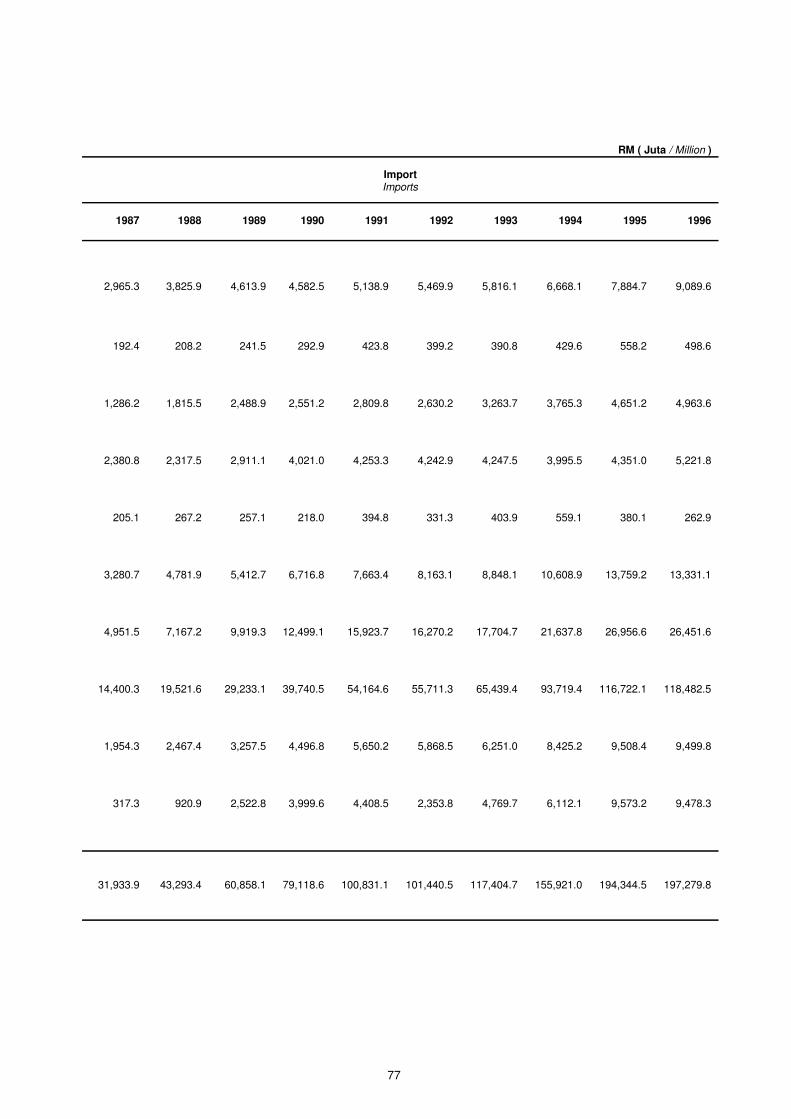
RM ( Juta / Million )
Import Imports
1987 1988 1989 1990 1991
2,965.3 3,825.9 4,613.9
4,582.5 5,138.9
192.4 208.2 241.5 292.9 423.8
1,286.2 1,815.5 2,488.9
2,551.2 2,809.8
2,380.8 2,317.5 2,911.1
4,021.0 4,253.3
205.1 267.2 257.1 218.0 394.8
3,280.7 4,781.9 5,412.7
6,716.8 7,663.4
4,951.5 7,167.2 9,919.3
12,499.1 15,923.7
14,400.3 19,521.6 29,233.1
39,740.5 54,164.6
1,954.3 2,467.4 3,257.5
4,496.8 5,650.2
317.3 920.9 2,522.8
3,999.6 4,408.5
31,933.9 43,293.4 60,858.1
79,118.6
100,831.1
1992 1993 1994 1995 1996
5,469.9 5,816.1 6,668.1 7,884.7
9,089.6
399.2 390.8 429.6 558.2 498.6
2,630.2 3,263.7 3,765.3 4,651.2
4,963.6
4,242.9 4,247.5 3,995.5 4,351.0
5,221.8
331.3 403.9 559.1 380.1 262.9
8,163.1 8,848.1 10,608.9 13,759.2
13,331.1
16,270.2 17,704.7 21,637.8 26,956.6
26,451.6
55,711.3 65,439.4 93,719.4
116,722.1
118,482.5
5,868.5 6,251.0 8,425.2 9,508.4
9,499.8
2,353.8 4,769.7 6,112.1 9,573.2
9,478.3
101,440.5
117,404.7
155,921.0
194,344.5
197,279.8
77
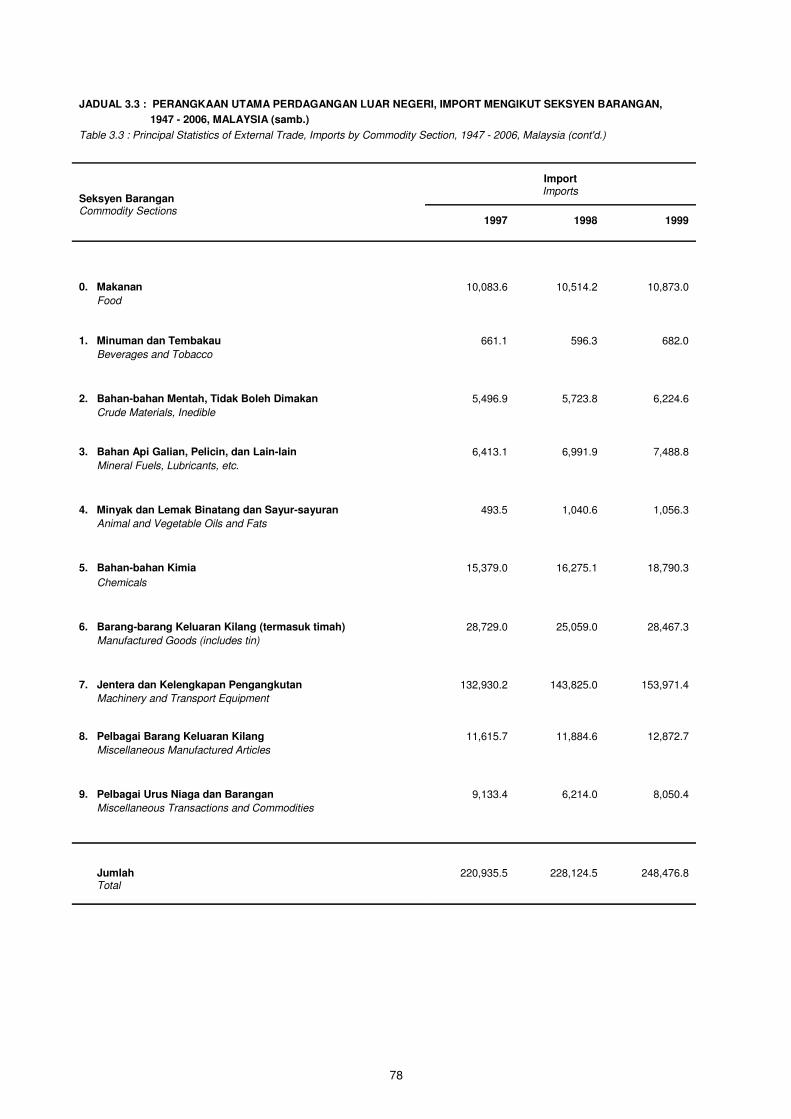
JADUAL 3.3 : PERANGKAAN UTAMA PERDAGANGAN LUAR NEGERI, IMPORT MENGIKUT SEKSYEN BARANGAN,
1947 - 2006, MALAYSIA (samb.)
Table 3.3 : Principal Statistics of External Trade, Imports by Commodity Section, 1947 - 2006, Malaysia (cont'd.)
Import
Seksyen Barangan
Imports
Commodity Sections
1997 1998 1999
0. Makanan 10,083.6 10,514.2 10,873.0
Food
1. Minuman dan Tembakau 661.1 596.3 682.0
Beverages and Tobacco
2. Bahan-bahan Mentah, Tidak Boleh Dimakan 5,496.9 5,723.8 6,224.6
Crude Materials, Inedible
3. Bahan Api Galian, Pelicin, dan Lain-lain 6,413.1 6,991.9 7,488.8
Mineral Fuels, Lubricants, etc.
4. Minyak dan Lemak Binatang dan Sayur-sayuran 493.5 1,040.6 1,056.3
Animal and Vegetable Oils and Fats
5. Bahan-bahan Kimia 15,379.0 16,275.1 18,790.3
Chemicals
6. Barang-barang Keluaran Kilang (termasuk timah) 28,729.0 25,059.0 28,467.3
Manufactured Goods (includes tin)
7. Jentera dan Kelengkapan Pengangkutan 132,930.2 143,825.0 153,971.4
Machinery and Transport Equipment
8. Pelbagai Barang Keluaran Kilang 11,615.7 11,884.6 12,872.7
Miscellaneous Manufactured Articles
9. Pelbagai Urus Niaga dan Barangan 9,133.4 6,214.0 8,050.4
Miscellaneous Transactions and Commodities
Jumlah 220,935.5 228,124.5 248,476.8
Total
78
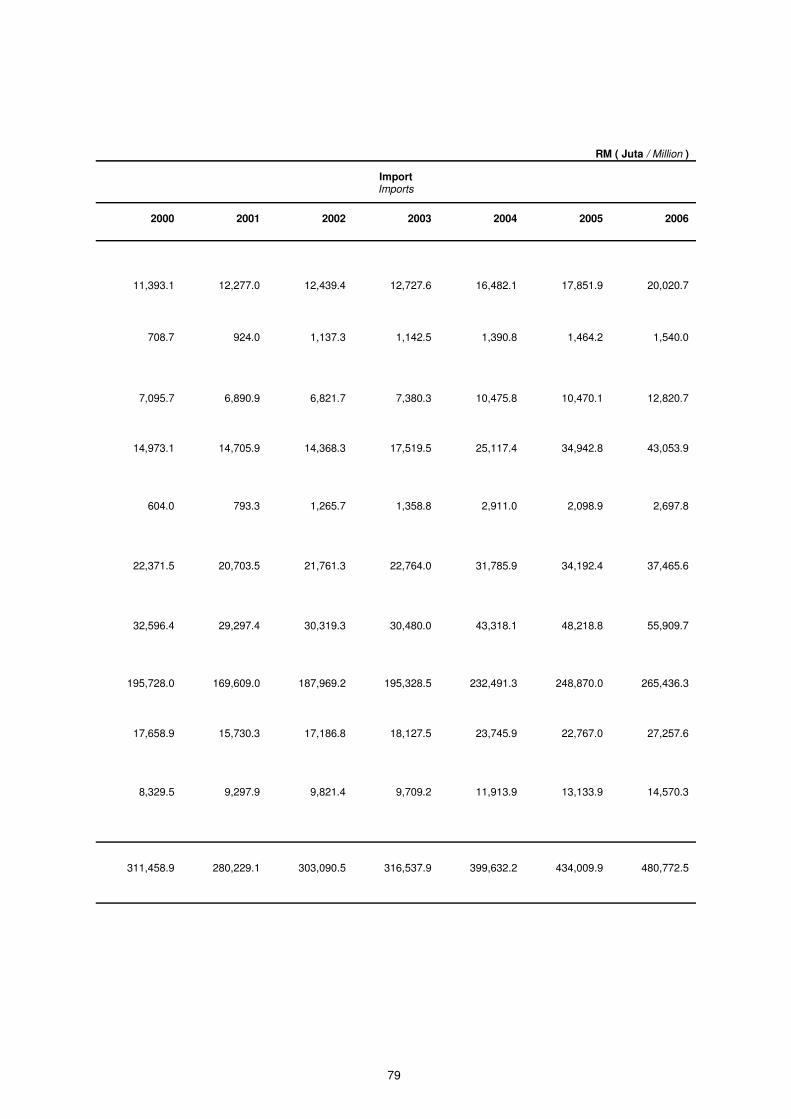
RM ( Juta / Million )
Import Imports
2002 2003 2004 2005 2006
12,439.4 12,727.6 16,482.1 17,851.9 20,020.7
1,137.3 1,142.5 1,390.8 1,464.2 1,540.0
6,821.7 7,380.3 10,475.8 10,470.1 12,820.7
14,368.3 17,519.5 25,117.4 34,942.8 43,053.9
1,265.7 1,358.8 2,911.0 2,098.9 2,697.8
21,761.3 22,764.0 31,785.9 34,192.4 37,465.6
30,319.3 30,480.0 43,318.1 48,218.8 55,909.7
187,969.2 195,328.5 232,491.3 248,870.0 265,436.3
17,186.8 18,127.5 23,745.9 22,767.0 27,257.6
9,821.4 9,709.2 11,913.9 13,133.9 14,570.3
303,090.5 316,537.9 399,632.2 434,009.9 480,772.5
2000 2001
11,393.1 12,277.0
708.7 924.0
7,095.7 6,890.9
14,973.1 14,705.9
604.0 793.3
22,371.5 20,703.5
32,596.4 29,297.4
195,728.0 169,609.0
17,658.9 15,730.3
8,329.5 9,297.9
311,458.9 280,229.1
79


GETAH
Nota Keterangan
1. Penyusunan data getah diperoleh daripada Banci Estet Getah Tahunan. Bagi tahun
-tahun rujukan 1993, 1994, 1996, 1997, 1999, 2001 dan 2003 data bersumberkan
Banci Getah Bulanan. Perangkaan getah bagi Malaysia bermula pada tahun 1965,
sementara tahun-tahun sebelumnya merujuk kepada Semenanjung Malaysia
sahaja.
2. Mulai tahun 2004, Banci Getah Bulanan dijalankan ke atas pemproses getah
manakala tahun sebelumnya ke atas peniaga getah.
3. Bagi tempoh Perang Dunia Kedua, 1941-1945, data pengeluaran getah tidak
diperoleh. Sementara bagi tahun rujukan 1946, pengeluaran getah berkurangan
ekoran daripada Perang Dunia tersebut.
4. Guna tenaga di industri ini adalah bagi Semenanjung Malaysia bagi tempoh
1946-1965. Liputan berkembang ke Sabah pada tahun 1966-1973 sementara bagi
tahun-tahun seterusnya merujuk kepada Malaysia.
81
RUBBER
Explanatory Notes
1. The compilation of rubber data were taken from the Annual Census of Rubber
Estates. For the reference years 1993, 1994, 1996, 1997, 1999, 2001 and 2003
data were obtained from Monthly Rubber Censuses. Statistics rubber for Malaysia
starts from year 1965, while those years before refer to Peninsular Malaysia only.
2. Starting from the year 2004, Census of Rubber Estates was conducted on the
rubber processors while the years before on the rubber dealers.
3. For the Second World War period, 1941-1945, data on rubber production could not
be obtained. For reference year 1946, the production of rubber was low as a result
of the World War.
4. The data on employment was refer to Peninsular Malaysia for period of 1946-1965.
The coverage was expand to Sabah for the years 1966-1973 while for the rest of
the years the data refer to Malaysia.
82
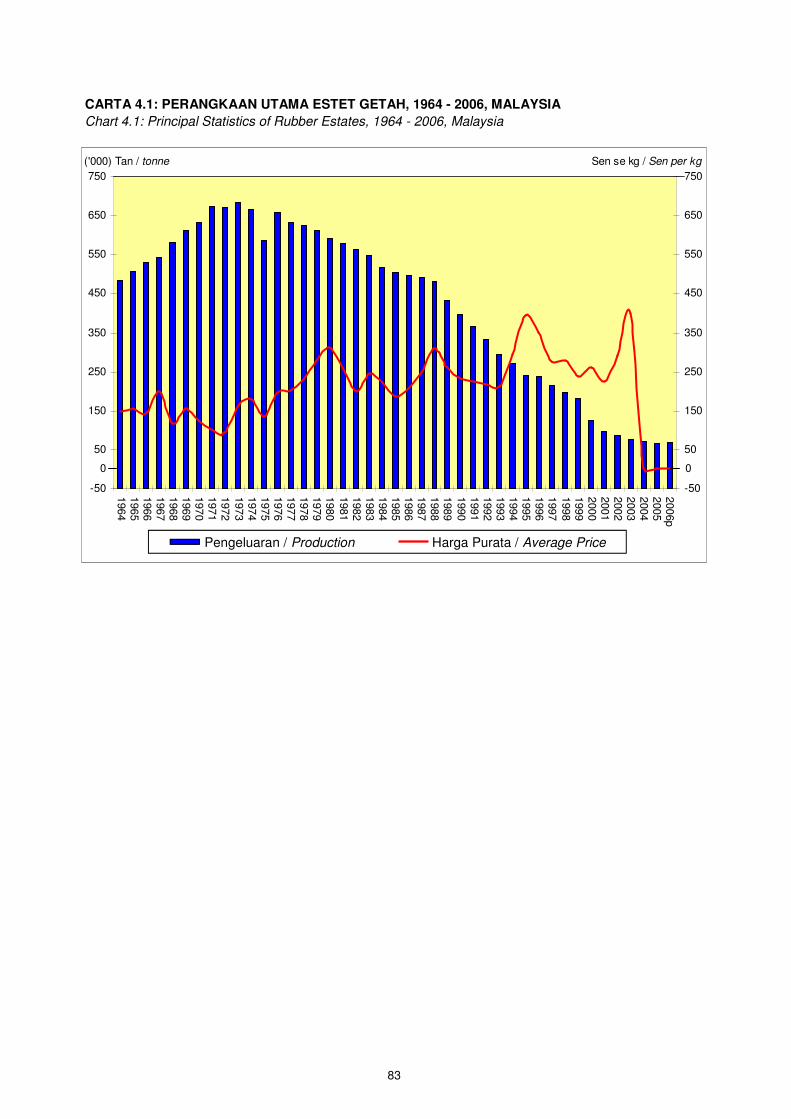
83
CARTA 4.1: PERANGKAAN UTAMA ESTET GETAH, 1964 - 2006, MALAYSIA
Chart 4.1: Principal Statistics of Rubber Estates, 1964 - 2006, Malaysia
-50
50
150
250
350
450
550
650
750
1964
1965
1966
1967
1968
1969
1970
1971
1972
1973
1974
1975
1976
1977
1978
1979
1980
1981
1982
1983
1984
1985
1986
1987
1988
1989
1990
1991
1992
1993
1994
1995
1996
1997
1998
1999
2000
2001
2002
2003
2004
2005
2006p
('000) Tan / tonne
-50
50
150
250
350
450
550
650
750
Sen se kg / Sen per kg
0 0
Pengeluaran / Production Harga Purata / Average Price

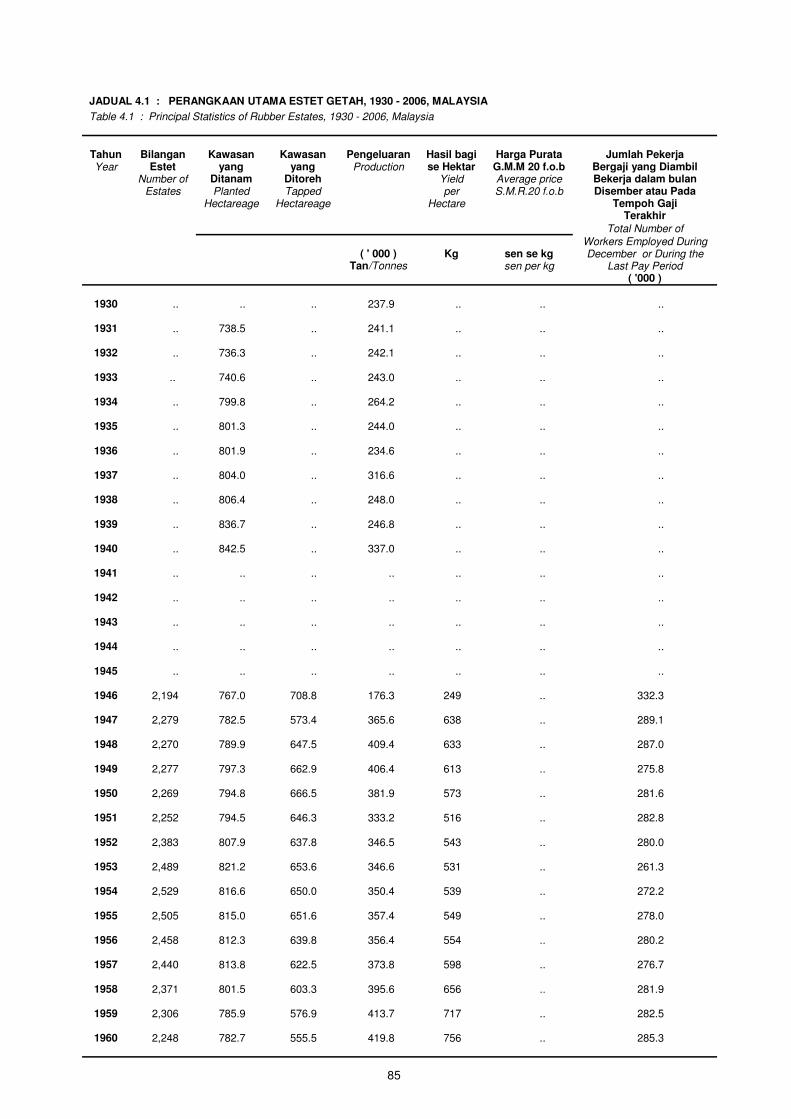
85
JADUAL 4.1 : PERANGKAAN UTAMA ESTET GETAH, 1930 - 2006, MALAYSIA
Table 4.1 : Principal Statistics of Rubber Estates, 1930 - 2006, Malaysia
Tahun Bilangan Kawasan Kawasan Pengeluaran Hasil bagi Harga Purata Jumlah Pekerja
Year Estet yang yang Production se Hektar G.M.M 20 f.o.b Bergaji yang Diambil Number of Ditanam Ditoreh Yield Average price Bekerja dalam bulan
Estates Planted Tapped per S.M.R.20 f.o.b Disember atau Pada
Hectareage Hectareage Hectare Tempoh Gaji Terakhir
Total Number of
Workers Employed During
( ' 000 ) Kg sen se kg December or During the
Tan/Tonnes sen per kg Last Pay Period
( '000 )
1930 .. .. .. 237.9 .. .. ..
1931 .. 738.5 .. 241.1 .. .. ..
1932 .. 736.3 .. 242.1 .. .. ..
1933 .. 740.6 .. 243.0 .. .. ..
1934 .. 799.8 .. 264.2 .. .. ..
1935 .. 801.3 .. 244.0 .. .. ..
1936 .. 801.9 .. 234.6 .. .. ..
1937 .. 804.0 .. 316.6 .. .. ..
1938 .. 806.4 .. 248.0 .. .. ..
1939 .. 836.7 .. 246.8 .. .. ..
1940 .. 842.5 .. 337.0 .. .. ..
1941 .. .. .. .. .. .. ..
1942 .. .. .. .. .. .. ..
1943 .. .. .. .. .. .. ..
1944 .. .. .. .. .. .. ..
1945 .. .. .. .. .. .. ..
1946 2,194 767.0 708.8 176.3 249 .. 332.3
1947 2,279 782.5 573.4 365.6 638 .. 289.1
1948 2,270 789.9 647.5 409.4 633 .. 287.0
1949 2,277 797.3 662.9 406.4 613 .. 275.8
1950 2,269 794.8 666.5 381.9 573 .. 281.6
1951 2,252 794.5 646.3 333.2 516 .. 282.8
1952 2,383 807.9 637.8 346.5 543 .. 280.0
1953 2,489 821.2 653.6 346.6 531 .. 261.3
1954 2,529 816.6 650.0 350.4 539 .. 272.2
1955 2,505 815.0 651.6 357.4 549 .. 278.0
1956 2,458 812.3 639.8 356.4 554 .. 280.2
1957 2,440 813.8 622.5 373.8 598 .. 276.7
1958 2,371 801.5 603.3 395.6 656 .. 281.9
1959 2,306 785.9 576.9 413.7 717 .. 282.5
1960 2,248 782.7 555.5 419.8 756 .. 285.3
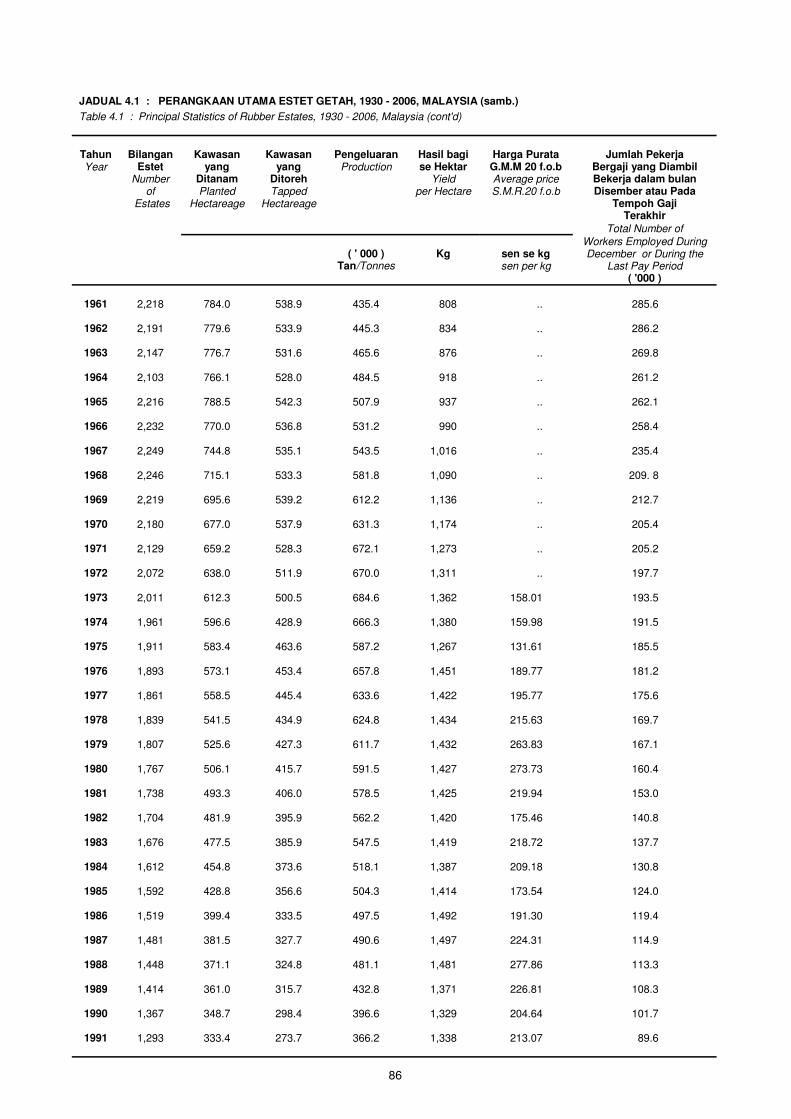
86
Table 4.1 : Principal Statistics of Rubber Estates, 1930 - 2006, Malaysia (cont'd)
Tahun Bilangan Kawasan Kawasan Pengeluaran Hasil bagi Harga Purata Jumlah Pekerja
Year Estet yang yang Production se Hektar G.M.M 20 f.o.b Bergaji yang Diambil Number Ditanam Ditoreh Yield Average price Bekerja dalam bulan
of Planted Tapped per Hectare S.M.R.20 f.o.b Disember atau Pada
Estates Hectareage Hectareage Tempoh Gaji Terakhir
Total Number of
Workers Employed During
( ' 000 ) Kg sen se kg December or During the
Tan/Tonnes sen per kg Last Pay Period
( '000 )
1961 2,218 784.0 538.9 435.4 808 .. 285.6
1962 2,191 779.6 533.9 445.3 834 .. 286.2
1963 2,147 776.7 531.6 465.6 876 .. 269.8
1964 2,103 766.1 528.0 484.5 918 .. 261.2
1965 2,216 788.5 542.3 507.9 937 .. 262.1
1966 2,232 770.0 536.8 531.2 990 .. 258.4
1967 2,249 744.8 535.1 543.5 1,016 .. 235.4
1968 2,246 715.1 533.3 581.8 1,090 .. 209. 8
1969 2,219 695.6 539.2 612.2 1,136 .. 212.7
1970 2,180 677.0 537.9 631.3 1,174 .. 205.4
1971 2,129 659.2 528.3 672.1 1,273 .. 205.2
1972 2,072 638.0 511.9 670.0 1,311 .. 197.7
1973 2,011 612.3 500.5 684.6 1,362 158.01 193.5
1974 1,961 596.6 428.9 666.3 1,380 159.98 191.5
1975 1,911 583.4 463.6 587.2 1,267 131.61 185.5
1976 1,893 573.1 453.4 657.8 1,451 189.77 181.2
1977 1,861 558.5 445.4 633.6 1,422 195.77 175.6
1978 1,839 541.5 434.9 624.8 1,434 215.63 169.7
1979 1,807 525.6 427.3 611.7 1,432 263.83 167.1
1980 1,767 506.1 415.7 591.5 1,427 273.73 160.4
1981 1,738 493.3 406.0 578.5 1,425 219.94 153.0
1982 1,704 481.9 395.9 562.2 1,420 175.46 140.8
1983 1,676 477.5 385.9 547.5 1,419 218.72 137.7
1984 1,612 454.8 373.6 518.1 1,387 209.18 130.8
1985 1,592 428.8 356.6 504.3 1,414 173.54 124.0
1986 1,519 399.4 333.5 497.5 1,492 191.30 119.4
1987 1,481 381.5 327.7 490.6 1,497 224.31 114.9
1988 1,448 371.1 324.8 481.1 1,481 277.86 113.3
1989 1,414 361.0 315.7 432.8 1,371 226.81 108.3
1990 1,367 348.7 298.4 396.6 1,329 204.64 101.7
1991 1,293 333.4 273.7 366.2 1,338 213.07 89.6
JADUAL 4.1 : PERANGKAAN UTAMA ESTET GETAH, 1930 - 2006, MALAYSIA (samb.)
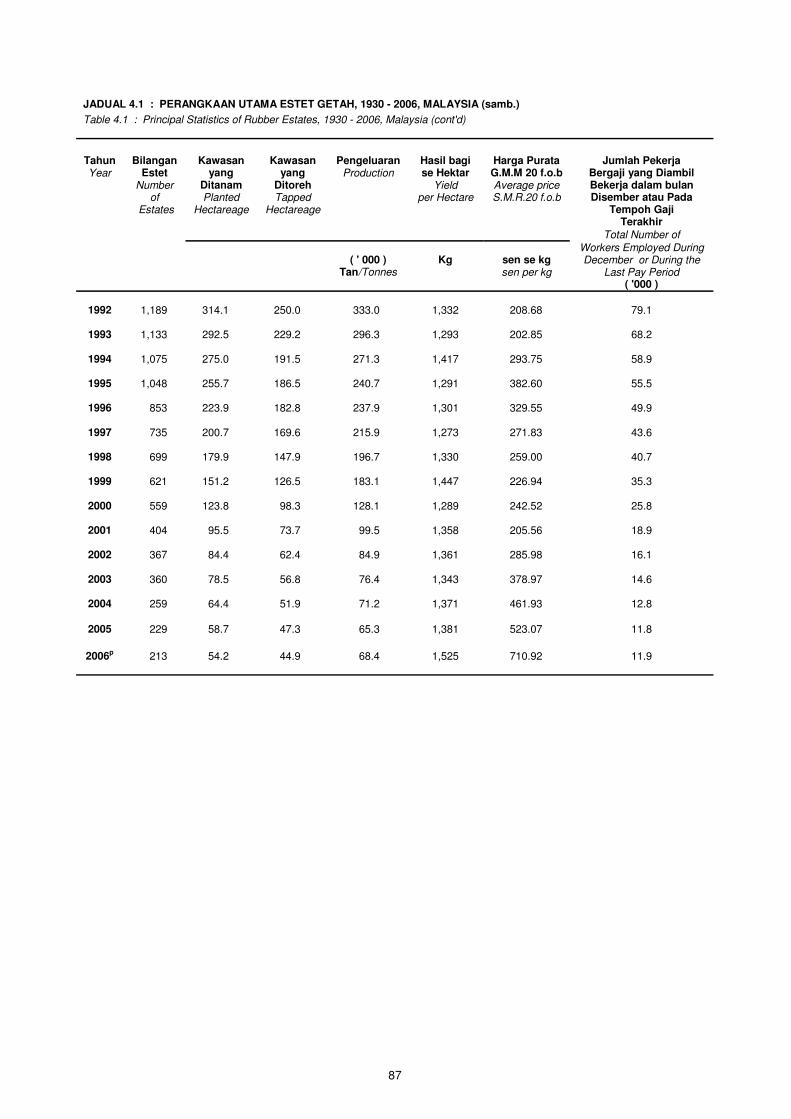
87
Table 4.1 : Principal Statistics of Rubber Estates, 1930 - 2006, Malaysia (cont'd)
Tahun Bilangan Kawasan Kawasan Pengeluaran Hasil bagi Harga Purata Jumlah Pekerja
Year Estet yang yang Production se Hektar G.M.M 20 f.o.b Bergaji yang Diambil Number Ditanam Ditoreh Yield Average price Bekerja dalam bulan
of Planted Tapped per Hectare S.M.R.20 f.o.b Disember atau Pada
Estates Hectareage Hectareage Tempoh Gaji Terakhir Total Number of
Workers Employed During
( ' 000 ) Kg sen se kg December or During the
Tan/Tonnes sen per kg Last Pay Period
( '000 )
1992 1,189 314.1 250.0 333.0 1,332 208.68 79.1
1993 1,133 292.5 229.2 296.3 1,293 202.85 68.2
1994 1,075 275.0 191.5 271.3 1,417 293.75 58.9
1995 1,048 255.7 186.5 240.7 1,291 382.60 55.5
1996 853 223.9 182.8 237.9 1,301 329.55 49.9
1997 735 200.7 169.6 215.9 1,273 271.83 43.6
1998 699 179.9 147.9 196.7 1,330 259.00 40.7
1999 621 151.2 126.5 183.1 1,447 226.94 35.3
2000 559 123.8 98.3 128.1 1,289 242.52 25.8
2001 404 95.5 73.7 99.5 1,358 205.56 18.9
2002 367 84.4 62.4 84.9 1,361 285.98 16.1
2003 360 78.5 56.8 76.4 1,343 378.97 14.6
2004 259 64.4 51.9 71.2 1,371 461.93 12.8
2005 229 58.7 47.3 65.3 1,381 523.07 11.8
2006p 213 54.2 44.9 68.4 1,525 710.92 11.9
JADUAL 4.1 : PERANGKAAN UTAMA ESTET GETAH, 1930 - 2006, MALAYSIA (samb.)
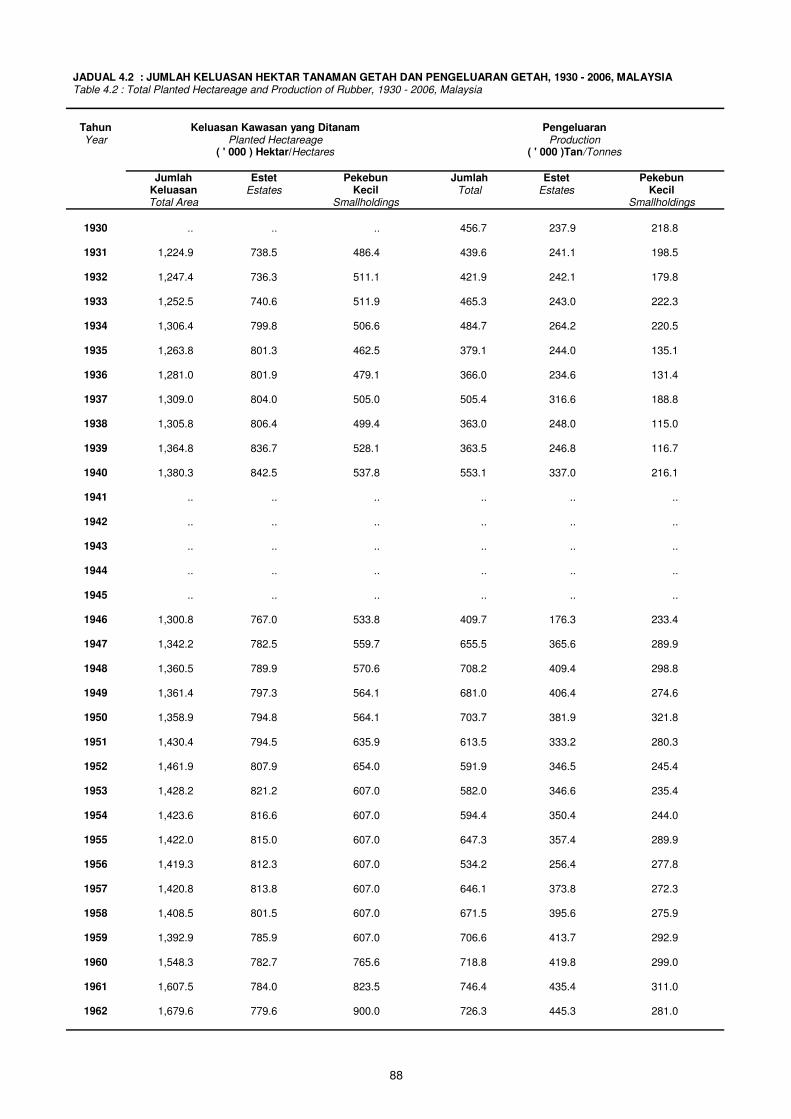
JADUAL 4.2 : JUMLAH KELUASAN HEKTAR TANAMAN GETAH DAN PENGELUARAN GETAH, 1930 - 2006, MALAYSIA
Table 4.2 : Total Planted Hectareage and Production of Rubber, 1930 - 2006, Malaysia
Tahun Keluasan Kawasan yang Ditanam Pengeluaran
Year Planted Hectareage Production
( ' 000 ) Hektar/Hectares ( ' 000 )Tan/Tonnes
Jumlah Estet Pekebun Jumlah Estet Pekebun
Keluasan Estates Kecil Total Estates Kecil Total Area Smallholdings Smallholdings
1930 .. .. .. 456.7 237.9 218.8
1931 1,224.9 738.5 486.4 439.6 241.1 198.5
1932 1,247.4 736.3 511.1 421.9 242.1 179.8
1933 1,252.5 740.6 511.9 465.3 243.0 222.3
1934 1,306.4 799.8 506.6 484.7 264.2 220.5
1935 1,263.8 801.3 462.5 379.1 244.0 135.1
1936 1,281.0 801.9 479.1 366.0 234.6 131.4
1937 1,309.0 804.0 505.0 505.4 316.6 188.8
1938 1,305.8 806.4 499.4 363.0 248.0 115.0
1939 1,364.8 836.7 528.1 363.5 246.8 116.7
1940 1,380.3 842.5 537.8 553.1 337.0 216.1
1941 .. .. .. .. .. ..
1942 .. .. .. .. .. ..
1943 .. .. .. .. .. ..
1944 .. .. .. .. .. ..
1945 .. .. .. .. .. ..
1946 1,300.8 767.0 533.8 409.7 176.3 233.4
1947 1,342.2 782.5 559.7 655.5 365.6 289.9
1948 1,360.5 789.9 570.6 708.2 409.4 298.8
1949 1,361.4 797.3 564.1 681.0 406.4 274.6
1950 1,358.9 794.8 564.1 703.7 381.9 321.8
1951 1,430.4 794.5 635.9 613.5 333.2 280.3
1952 1,461.9 807.9 654.0 591.9 346.5 245.4
1953 1,428.2 821.2 607.0 582.0 346.6 235.4
1954 1,423.6 816.6 607.0 594.4 350.4 244.0
1955 1,422.0 815.0 607.0 647.3 357.4 289.9
1956 1,419.3 812.3 607.0 534.2 256.4 277.8
1957 1,420.8 813.8 607.0 646.1 373.8 272.3
1958 1,408.5 801.5 607.0 671.5 395.6 275.9
1959 1,392.9 785.9 607.0 706.6 413.7 292.9
1960 1,548.3 782.7 765.6 718.8 419.8 299.0
1961 1,607.5 784.0 823.5 746.4 435.4 311.0
1962 1,679.6 779.6 900.0 726.3 445.3 281.0
88
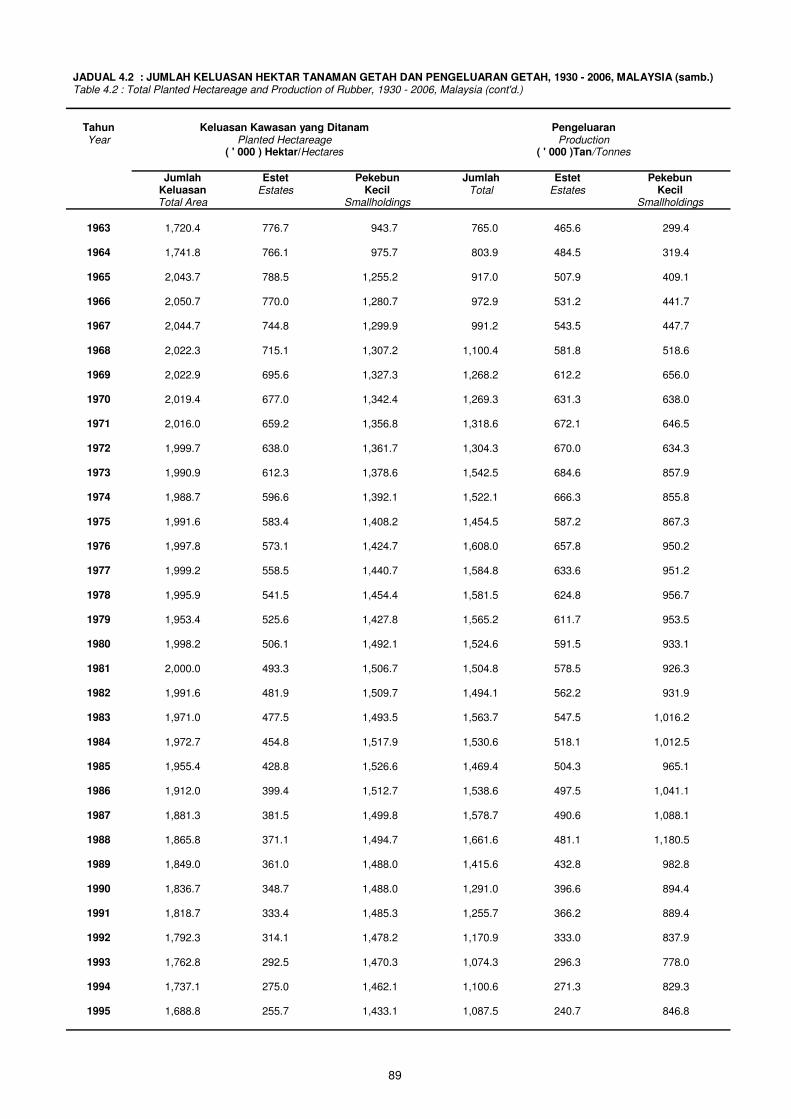
JADUAL 4.2 : JUMLAH KELUASAN HEKTAR TANAMAN GETAH DAN PENGELUARAN GETAH, 1930 - 2006, MALAYSIA (samb.) Table 4.2 : Total Planted Hectareage and Production of Rubber, 1930 - 2006, Malaysia (cont'd.)
Tahun Keluasan Kawasan yang Ditanam Pengeluaran
Year Planted Hectareage Production
( ' 000 ) Hektar/Hectares ( ' 000 )Tan/Tonnes
Jumlah Estet Pekebun Jumlah Estet Pekebun
Keluasan Estates Kecil Total Estates Kecil Total Area Smallholdings Smallholdings
1963 1,720.4 776.7 943.7 765.0 465.6 299.4
1964 1,741.8 766.1 975.7 803.9 484.5 319.4
1965 2,043.7 788.5 1,255.2 917.0 507.9 409.1
1966 2,050.7 770.0 1,280.7 972.9 531.2 441.7
1967 2,044.7 744.8 1,299.9 991.2 543.5 447.7
1968 2,022.3 715.1 1,307.2 1,100.4 581.8 518.6
1969 2,022.9 695.6 1,327.3 1,268.2 612.2 656.0
1970 2,019.4 677.0 1,342.4 1,269.3 631.3 638.0
1971 2,016.0 659.2 1,356.8 1,318.6 672.1 646.5
1972 1,999.7 638.0 1,361.7 1,304.3 670.0 634.3
1973 1,990.9 612.3 1,378.6 1,542.5 684.6 857.9
1974 1,988.7 596.6 1,392.1 1,522.1 666.3 855.8
1975 1,991.6 583.4 1,408.2 1,454.5 587.2 867.3
1976 1,997.8 573.1 1,424.7 1,608.0 657.8 950.2
1977 1,999.2 558.5 1,440.7 1,584.8 633.6 951.2
1978 1,995.9 541.5 1,454.4 1,581.5 624.8 956.7
1979 1,953.4 525.6 1,427.8 1,565.2 611.7 953.5
1980 1,998.2 506.1 1,492.1 1,524.6 591.5 933.1
1981 2,000.0 493.3 1,506.7 1,504.8 578.5 926.3
1982 1,991.6 481.9 1,509.7 1,494.1 562.2 931.9
1983 1,971.0 477.5 1,493.5 1,563.7 547.5 1,016.2
1984 1,972.7 454.8 1,517.9 1,530.6 518.1 1,012.5
1985 1,955.4 428.8 1,526.6 1,469.4 504.3 965.1
1986 1,912.0 399.4 1,512.7 1,538.6 497.5 1,041.1
1987 1,881.3 381.5 1,499.8 1,578.7 490.6 1,088.1
1988 1,865.8 371.1 1,494.7 1,661.6 481.1 1,180.5
1989 1,849.0 361.0 1,488.0 1,415.6 432.8 982.8
1990 1,836.7 348.7 1,488.0 1,291.0 396.6 894.4
1991 1,818.7 333.4 1,485.3 1,255.7 366.2 889.4
1992 1,792.3 314.1 1,478.2 1,170.9 333.0 837.9
1993 1,762.8 292.5 1,470.3 1,074.3 296.3 778.0
1994 1,737.1 275.0 1,462.1 1,100.6 271.3 829.3
1995 1,688.8 255.7 1,433.1 1,087.5 240.7 846.8
89
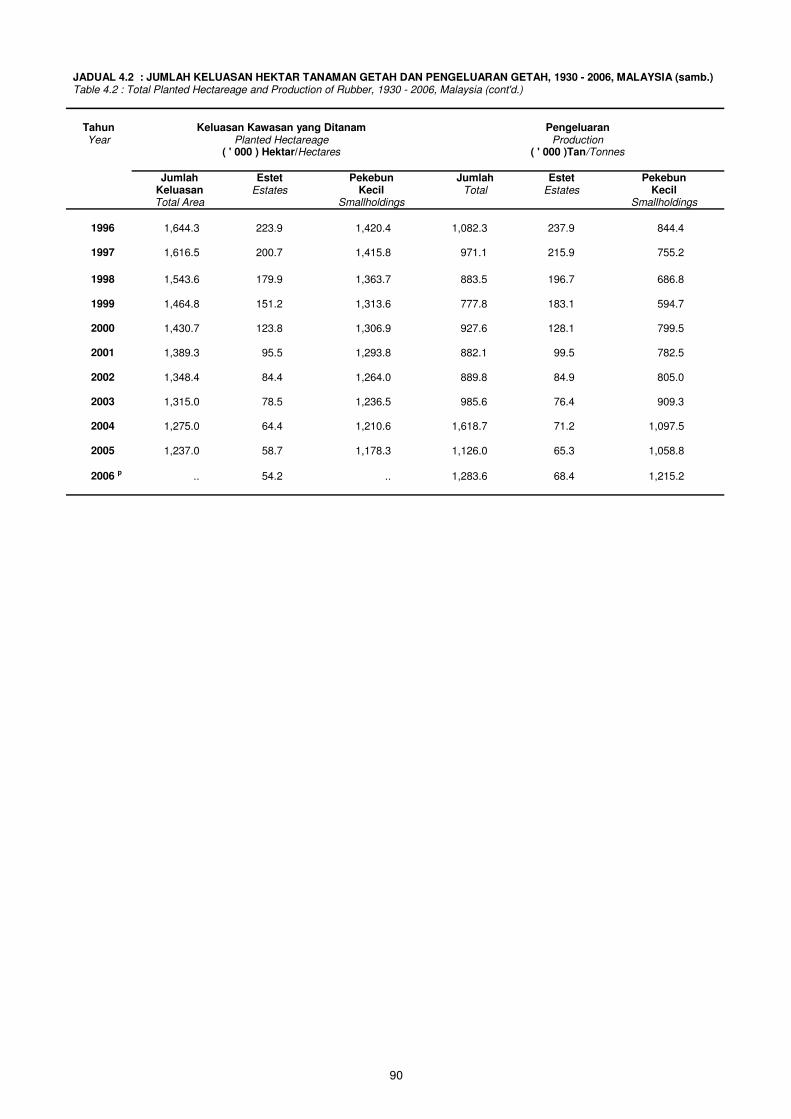
JADUAL 4.2 : JUMLAH KELUASAN HEKTAR TANAMAN GETAH DAN PENGELUARAN GETAH, 1930 - 2006, MALAYSIA (samb.) Table 4.2 : Total Planted Hectareage and Production of Rubber, 1930 - 2006, Malaysia (cont'd.)
Tahun Keluasan Kawasan yang Ditanam Pengeluaran
Year Planted Hectareage Production
( ' 000 ) Hektar/Hectares ( ' 000 )Tan/Tonnes
Jumlah Estet Pekebun Jumlah Estet Pekebun
Keluasan Estates Kecil Total Estates Kecil Total Area Smallholdings Smallholdings
1996 1,644.3 223.9 1,420.4 1,082.3 237.9 844.4
1997 1,616.5 200.7 1,415.8 971.1 215.9 755.2
1998 1,543.6 179.9 1,363.7 883.5 196.7 686.8
1999 1,464.8 151.2 1,313.6 777.8 183.1 594.7
2000 1,430.7 123.8 1,306.9 927.6 128.1 799.5
2001 1,389.3 95.5 1,293.8 882.1 99.5 782.5
2002 1,348.4 84.4 1,264.0 889.8 84.9 805.0
2003 1,315.0 78.5 1,236.5 985.6 76.4 909.3
2004 1,275.0 64.4 1,210.6 1,618.7 71.2 1,097.5
2005 1,237.0 58.7 1,178.3 1,126.0 65.3 1,058.8
2006 p .. 54.2 .. 1,283.6 68.4 1,215.2
90


KELAPA SAWIT
Nota Keterangan
1. Penyusunan data kelapa sawit berdasarkan Banci Tahunan Estet Kelapa Sawit
yang dijalankan oleh Jabatan Perangkaan Malaysia bagi tempoh 1959 – 1988.
Tugas pengumpulan data telah diambil alih oleh Lembaga Pendaftaran dan
Pelesenan Minyak Kelapa Sawit (PORLA) mulai tahun 1989. Sejak tahun 2000,
data telah diperoleh daripada Lembaga Minyak Sawit Malaysia (MPOB), iaitu
gabungan PORLA dan PORIM. Maka liputan estet PORLA mulai 1989 berbeza
dengan liputan Jabatan Perangkaan. Data mulai tahun tersebut tidak sesuai
dibandingkan dengan data tahun terdahulu.
2. Data siri masa mengenai jumlah keluasan hektar tanaman kelapa sawit meliputi
estet dan pekebun kecil (termasuk FELDA, FELCRA, RISDA dan Agensi Kerajaan
Negeri). Data bagi tahun 1959 - 1973 merujuk kepada Semenanjung Malaysia
sahaja.
3. Harga Purata Penghantaran Tempatan adalah merujuk kepada purata harga yang
diniagakan sehingga ke destinasi pembeli tempatan. Lazimnya pengeluar tempatan
merujuk kepada pengilang kelapa sawit, sementara pembeli pula adalah
pengusaha penapisan minyak sawit. Ia juga merangkumi harga pengeluar (harga di
kilang) termasuk kos pengangkutan dan insuran.
91
OIL PALM
Explanatory Notes
1. The compilation of oil palm data for reference years 1959 - 1988 were taken from
the Annual Census of Oil Palm Estates conducted by the Department of Statistics,
Malaysia. Revert from 1989, the Palm Oil Registration And Licensing Authority
(PORLA) has taken over the responsibility of data collection. Since year 2000, the
data were obtained from Malaysian Palm Oil Board (MPOB), the merger of PORLA
and PORIM. PORLA’s coverage of estates was differs from the coverage of the
Department of Statistics starting from 1989. Data for that year onwards are not
comparable with the earlier years data.
2. Time series data on total planted hectareage of oil palm include estates and
smallholdings (comprising FELDA, FELCRA, RISDA and State Agency). Data for
reference years 1959 - 1973 refer to Peninsular Malaysia only.
3. Local Delivered Average Price means the average traded price up to the local
buyers destination. Normally the local seller are the miller and the buyer are the
refinery. It includes the seller price ex-mill base plus the transportation cost and
insurance up to the buyers factory gate.
92
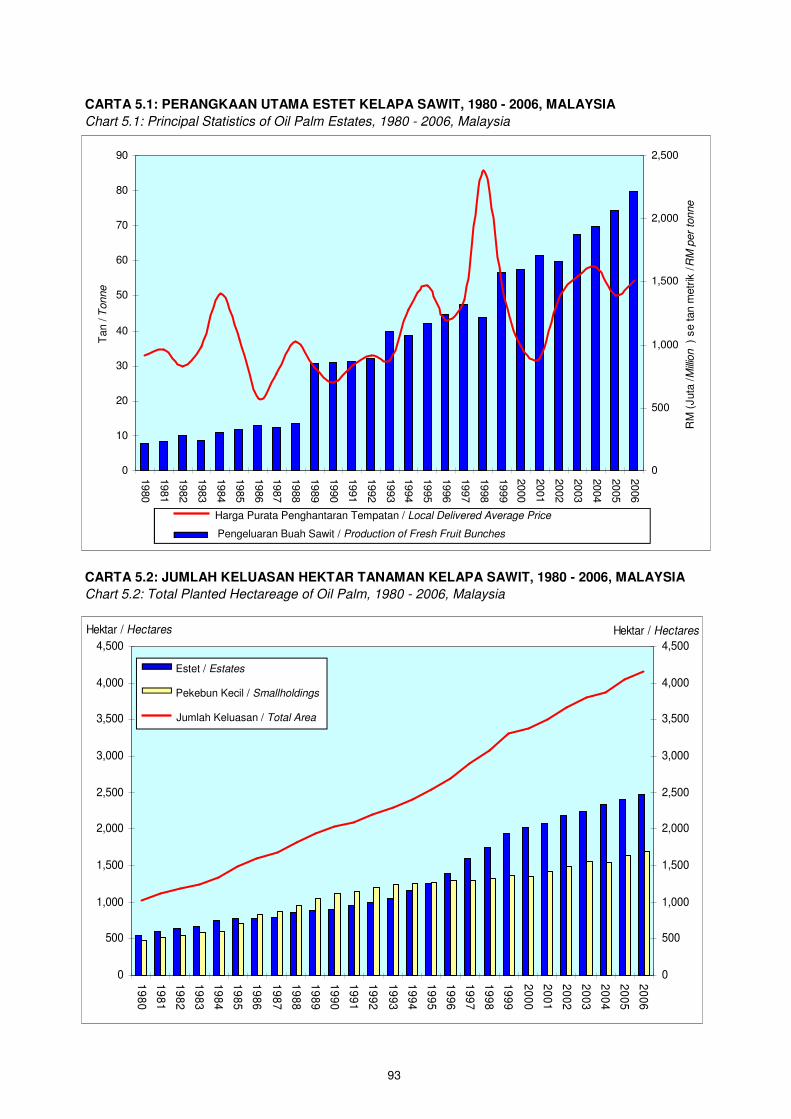
0
10
20
30
40
50
60
70
80
90
1980
1981
1982
1983
1984
1985
1986
1987
1988
1989
1990
1991
1992
1993
1994
1995
1996
1997
1998
1999
2000
2001
2002
2003
2004
2005
2006
Tan / T
onne
0
500
1,000
1,500
2,000
2,500
RM
(Juta
/ M
illio
n)
se tan m
etr
ik / R
M p
er
tonne
0
500
1,000
1,500
2,000
2,500
3,000
3,500
4,000
4,5001
98
0
19
81
19
82
19
83
19
84
19
85
19
86
19
87
19
88
19
89
19
90
19
91
19
92
19
93
19
94
19
95
19
96
19
97
19
98
19
99
20
00
20
01
20
02
20
03
20
04
20
05
20
06
Hektar / Hectares
0
500
1,000
1,500
2,000
2,500
3,000
3,500
4,000
4,500
Hektar / Hectares
93
CARTA 5.1: PERANGKAAN UTAMA ESTET KELAPA SAWIT, 1980 - 2006, MALAYSIA
Chart 5.1: Principal Statistics of Oil Palm Estates, 1980 - 2006, Malaysia
CARTA 5.2: JUMLAH KELUASAN HEKTAR TANAMAN KELAPA SAWIT, 1980 - 2006, MALAYSIA
Chart 5.2: Total Planted Hectareage of Oil Palm, 1980 - 2006, Malaysia
Harga Purata Penghantaran Tempatan / Local Delivered Average Price
Pengeluaran Buah Sawit / Production of Fresh Fruit Bunches
Estet / Estates
Pekebun Kecil / Smallholdings Jumlah Keluasan / Total Area

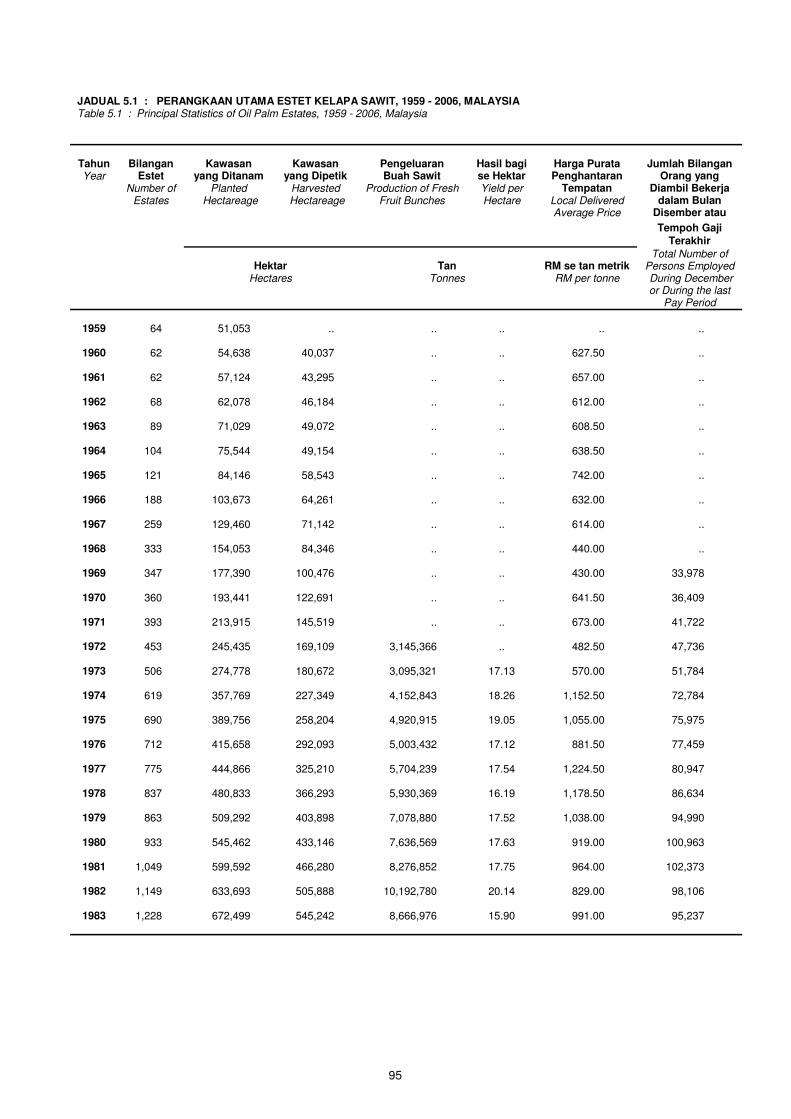
JADUAL 5.1 : PERANGKAAN UTAMA ESTET KELAPA SAWIT, 1959 - 2006, MALAYSIA
Table 5.1 : Principal Statistics of Oil Palm Estates, 1959 - 2006, Malaysia
Tahun Bilangan Kawasan Kawasan Pengeluaran Hasil bagi Harga Purata Jumlah Bilangan
Year Estet yang Ditanam yang Dipetik Buah Sawit se Hektar Penghantaran Orang yang
Number of Planted Harvested Production of Fresh Yield per Tempatan Diambil Bekerja
Estates Hectareage Hectareage Fruit Bunches Hectare Local Delivered dalam Bulan
Average Price Disember atau
Tempoh Gaji
Terakhir
Total Number of Hektar Tan RM se tan metrik Persons Employed
Hectares Tonnes RM per tonne During December
or During the last Pay Period
1959 64 51,053 .. .. .. .. ..
1960 62 54,638 40,037 .. .. 627.50 ..
1961 62 57,124 43,295 .. .. 657.00 ..
1962 68 62,078 46,184 .. .. 612.00 ..
1963 89 71,029 49,072 .. .. 608.50 ..
1964 104 75,544 49,154 .. .. 638.50 ..
1965 121 84,146 58,543 .. .. 742.00 ..
1966 188 103,673 64,261 .. .. 632.00 ..
1967 259 129,460 71,142 .. .. 614.00 ..
1968 333 154,053 84,346 .. .. 440.00 ..
1969 347 177,390 100,476 .. .. 430.00 33,978
1970 360 193,441 122,691 .. .. 641.50 36,409
1971 393 213,915 145,519 .. .. 673.00 41,722
1972 453 245,435 169,109 3,145,366 .. 482.50 47,736
1973 506 274,778 180,672 3,095,321 17.13 570.00 51,784
1974 619 357,769 227,349 4,152,843 18.26 1,152.50 72,784
1975 690 389,756 258,204 4,920,915 19.05 1,055.00 75,975
1976 712 415,658 292,093 5,003,432 17.12 881.50 77,459
1977 775 444,866 325,210 5,704,239 17.54 1,224.50 80,947
1978 837 480,833 366,293 5,930,369 16.19 1,178.50 86,634
1979 863 509,292 403,898 7,078,880 17.52 1,038.00 94,990
1980 933 545,462 433,146 7,636,569 17.63 919.00 100,963
1981 1,049 599,592 466,280 8,276,852 17.75 964.00 102,373
1982 1,149 633,693 505,888 10,192,780 20.14 829.00 98,106
1983 1,228 672,499 545,242 8,666,976 15.90 991.00 95,237
95
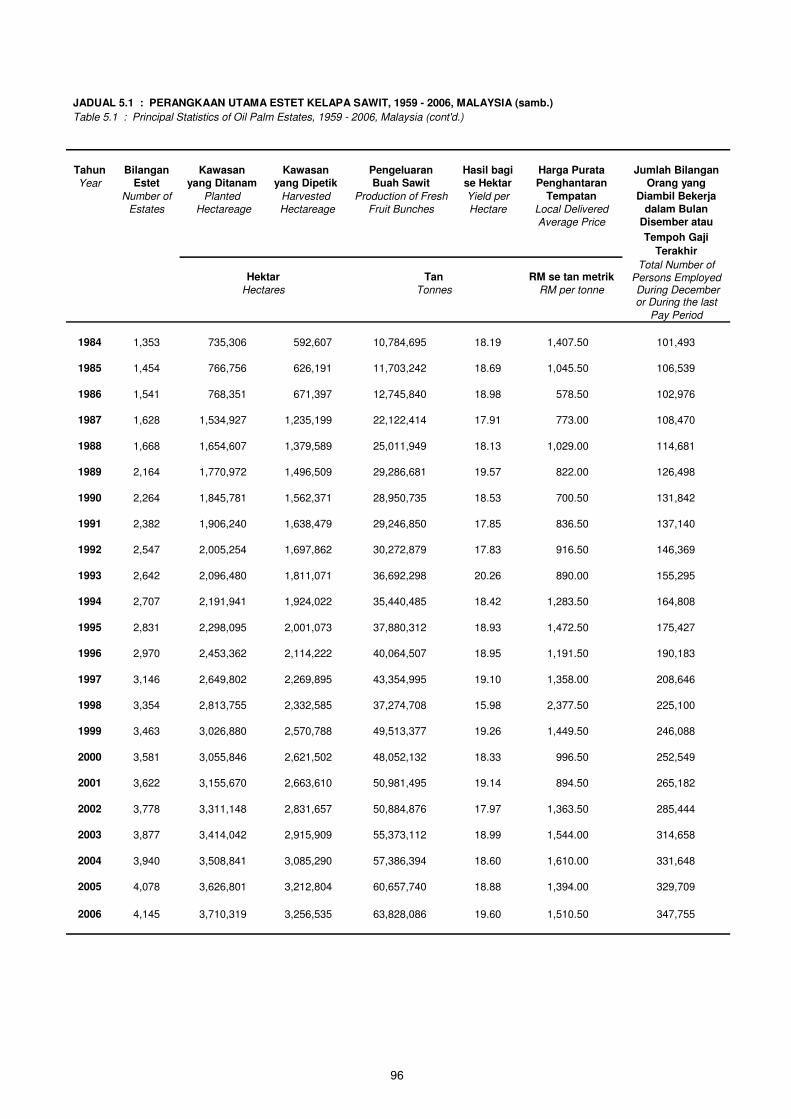
JADUAL 5.1 : PERANGKAAN UTAMA ESTET KELAPA SAWIT, 1959 - 2006, MALAYSIA (samb.)
Table 5.1 : Principal Statistics of Oil Palm Estates, 1959 - 2006, Malaysia (cont'd.)
Tahun Bilangan Kawasan Kawasan Pengeluaran Hasil bagi Harga Purata Jumlah Bilangan
Year Estet yang Ditanam yang Dipetik Buah Sawit se Hektar Penghantaran Orang yang
Number of Planted Harvested Production of Fresh Yield per Tempatan Diambil Bekerja
Estates Hectareage Hectareage Fruit Bunches Hectare Local Delivered dalam Bulan
Average Price Disember atau
Tempoh Gaji
Terakhir
Total Number of Hektar Tan RM se tan metrik Persons Employed
Hectares Tonnes RM per tonne During December
or During the last
Pay Period
1984 1,353 735,306 592,607 10,784,695 18.19 1,407.50 101,493
1985 1,454 766,756 626,191 11,703,242 18.69 1,045.50 106,539
1986 1,541 768,351 671,397 12,745,840 18.98 578.50 102,976
1987 1,628 1,534,927 1,235,199 22,122,414 17.91 773.00 108,470
1988 1,668 1,654,607 1,379,589 25,011,949 18.13 1,029.00 114,681
1989 2,164 1,770,972 1,496,509 29,286,681 19.57 822.00 126,498
1990 2,264 1,845,781 1,562,371 28,950,735 18.53 700.50 131,842
1991 2,382 1,906,240 1,638,479 29,246,850 17.85 836.50 137,140
1992 2,547 2,005,254 1,697,862 30,272,879 17.83 916.50 146,369
1993 2,642 2,096,480 1,811,071 36,692,298 20.26 890.00 155,295
1994 2,707 2,191,941 1,924,022 35,440,485 18.42 1,283.50 164,808
1995 2,831 2,298,095 2,001,073 37,880,312 18.93 1,472.50 175,427
1996 2,970 2,453,362 2,114,222 40,064,507 18.95 1,191.50 190,183
1997 3,146 2,649,802 2,269,895 43,354,995 19.10 1,358.00 208,646
1998 3,354 2,813,755 2,332,585 37,274,708 15.98 2,377.50 225,100
1999 3,463 3,026,880 2,570,788 49,513,377 19.26 1,449.50 246,088
2000 3,581 3,055,846 2,621,502 48,052,132 18.33 996.50 252,549
2001 3,622 3,155,670 2,663,610 50,981,495 19.14 894.50 265,182
2002 3,778 3,311,148 2,831,657 50,884,876 17.97 1,363.50 285,444
2003 3,877 3,414,042 2,915,909 55,373,112 18.99 1,544.00 314,658
2004 3,940 3,508,841 3,085,290 57,386,394 18.60 1,610.00 331,648
2005 4,078 3,626,801 3,212,804 60,657,740 18.88 1,394.00 329,709
2006 4,145 3,710,319 3,256,535 63,828,086 19.60 1,510.50 347,755
96
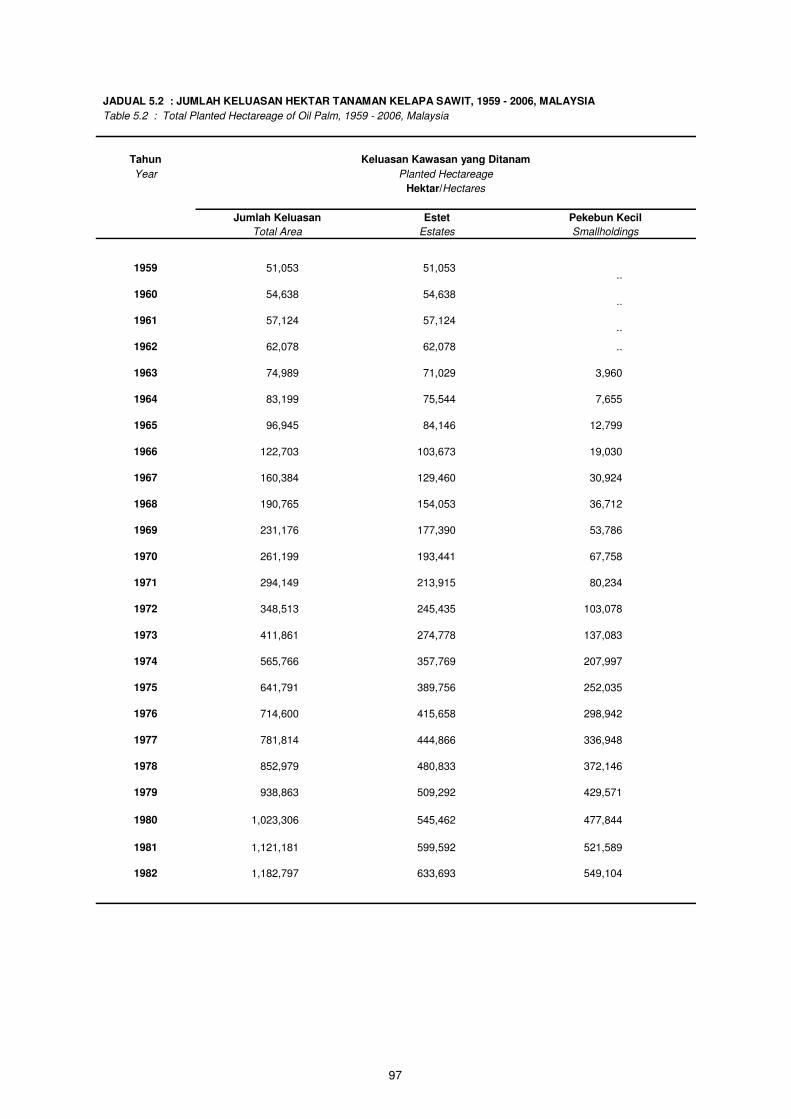
JADUAL 5.2 : JUMLAH KELUASAN HEKTAR TANAMAN KELAPA SAWIT, 1959 - 2006, MALAYSIA
Table 5.2 : Total Planted Hectareage of Oil Palm, 1959 - 2006, Malaysia
Tahun Keluasan Kawasan yang Ditanam
Year Planted Hectareage
Hektar/Hectares
Jumlah Keluasan Estet Pekebun Kecil
Total Area Estates Smallholdings
1959 51,053 51,053
..
1960 54,638 54,638
..
1961 57,124 57,124
..
1962 62,078 62,078 ..
1963 74,989 71,029 3,960
1964 83,199 75,544 7,655
1965 96,945 84,146 12,799
1966 122,703 103,673 19,030
1967 160,384 129,460 30,924
1968 190,765 154,053 36,712
1969 231,176 177,390 53,786
1970 261,199 193,441 67,758
1971 294,149 213,915 80,234
1972 348,513 245,435 103,078
1973 411,861 274,778 137,083
1974 565,766 357,769 207,997
1975 641,791 389,756 252,035
1976 714,600 415,658 298,942
1977 781,814 444,866 336,948
1978 852,979 480,833 372,146
1979 938,863 509,292 429,571
1980 1,023,306 545,462 477,844
1981 1,121,181 599,592 521,589
1982 1,182,797 633,693 549,104
97
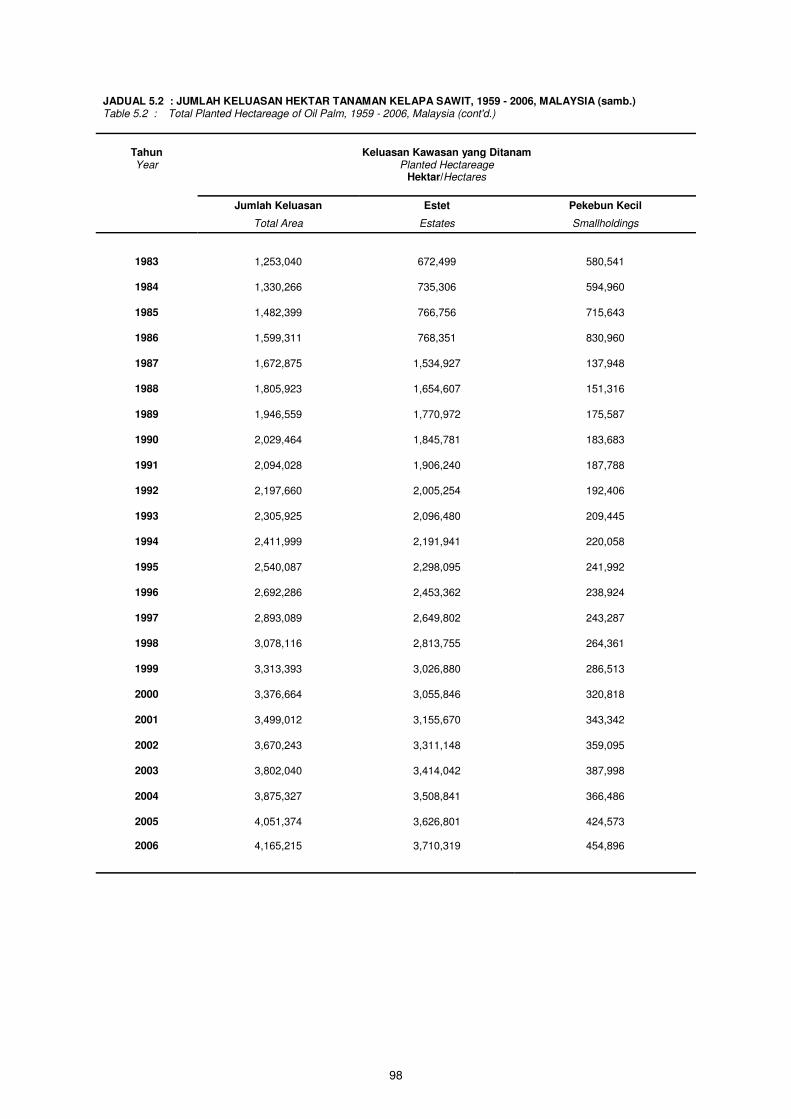
JADUAL 5.2 : JUMLAH KELUASAN HEKTAR TANAMAN KELAPA SAWIT, 1959 - 2006, MALAYSIA (samb.) Table 5.2 : Total Planted Hectareage of Oil Palm, 1959 - 2006, Malaysia (cont'd.)
Tahun Keluasan Kawasan yang Ditanam
Year Planted Hectareage
Hektar/Hectares
Jumlah Keluasan Estet Pekebun Kecil
Total Area Estates Smallholdings
1983 1,253,040 672,499 580,541
1984 1,330,266 735,306 594,960
1985 1,482,399 766,756 715,643
1986 1,599,311 768,351 830,960
1987 1,672,875 1,534,927 137,948
1988 1,805,923 1,654,607 151,316
1989 1,946,559 1,770,972 175,587
1990 2,029,464 1,845,781 183,683
1991 2,094,028 1,906,240 187,788
1992 2,197,660 2,005,254 192,406
1993 2,305,925 2,096,480 209,445
1994 2,411,999 2,191,941 220,058
1995 2,540,087 2,298,095 241,992
1996 2,692,286 2,453,362 238,924
1997 2,893,089 2,649,802 243,287
1998 3,078,116 2,813,755 264,361
1999 3,313,393 3,026,880 286,513
2000 3,376,664 3,055,846 320,818
2001 3,499,012 3,155,670 343,342
2002 3,670,243 3,311,148 359,095
2003 3,802,040 3,414,042 387,998
2004 3,875,327 3,508,841 366,486
2005 4,051,374 3,626,801 424,573
2006 4,165,215 3,710,319 454,896
98


KOKO
Nota Keterangan
1. Banci Tahunan Estet Koko yang dijalankan oleh Jabatan Perangkaan Malaysia bagi
tahun rujukan 1968 - 1995 menjadi sumber data bagi siri tanaman koko. Mulai
tahun rujukan 1996, Lembaga Koko Malaysia mengambil alih tugas menjalankan
Banci Tahunan Estet Koko.
2. Data bagi tempoh antara 1968 hingga 1977 merujuk kepada Sabah sahaja. Data
bagi tahun rujukan 1978, 1996 dan 1997 merujuk kepada Semenanjung Malaysia
dan Sabah, manakala bagi tahun-tahun seterusnya merujuk kepada Malaysia.
Walau bagaimanapun, Sabah merupakan kawasan koko utama yang meliputi
hampir 87% daripada keseluruhan kawasan tanaman tersebut. Tiada estet koko
dilaporkan di Sarawak.
3. Daripada jumlah tersebut sebanyak 50 estet atau 87.7% adalah di Sabah manakala
7 estet atau 12.3% di Semenanjung Malaysia.
COCOA
Explanatory Notes
1. Data for reference years 1968 - 1995 were sourced from the Annual Census of
Cocoa Estates conducted by Department of Statistics, Malaysia. Starting from
reference year 1996, the Malaysian Cocoa Board was responsible for conducting
the Annual Census of Cocoa Estates.
2. Data for reference years 1968 to 1977 refer to Sabah only. For reference years
1978, 1996 and 1997 the data refer to Peninsular Malaysia and Sabah only, while
for the rest of the years the data refer to Malaysia. However, Sabah is the major
cocoa growing area which contributing almost 87% of the total cocoa cultivated
area. There is no cocoa estate reported in Sarawak.
3. From the total, 50 estates or 87.7% were in Sabah while 7 estates or 12.3% in
Peninsular Malaysia.
99

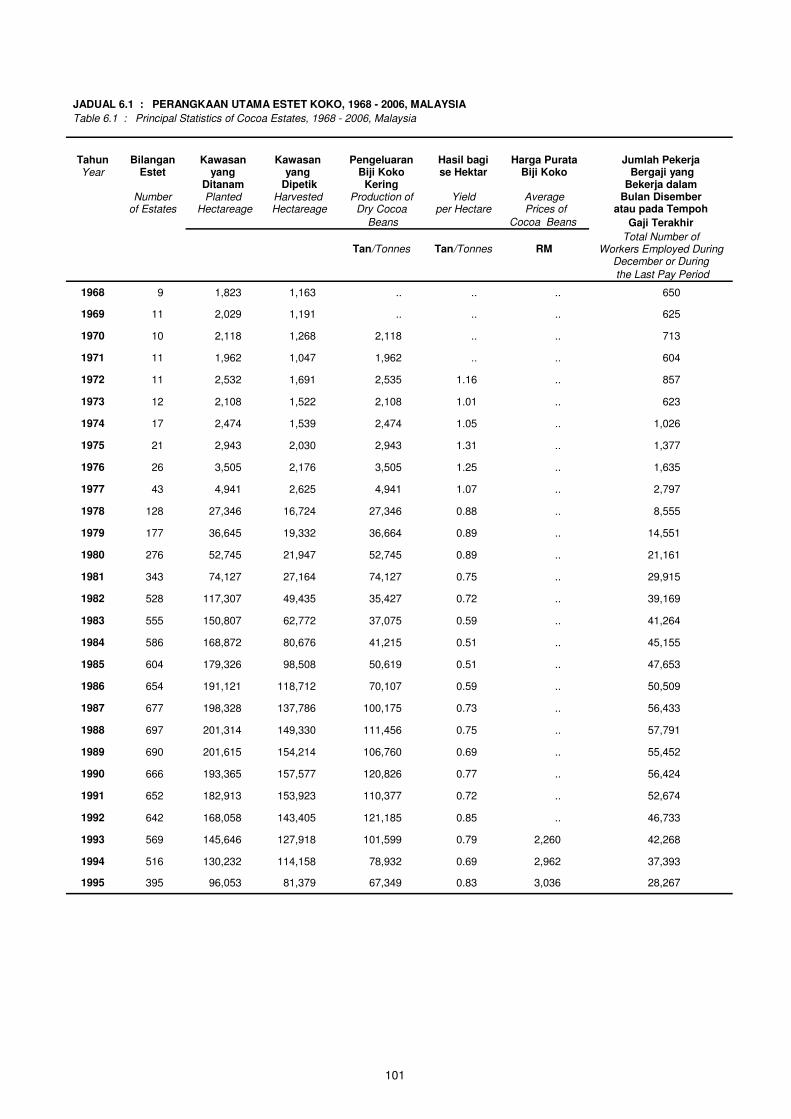
JADUAL 6.1 : PERANGKAAN UTAMA ESTET KOKO, 1968 - 2006, MALAYSIA
Table 6.1 : Principal Statistics of Cocoa Estates, 1968 - 2006, Malaysia
Tahun Bilangan Kawasan Kawasan Pengeluaran Hasil bagi Harga Purata Jumlah Pekerja
Year Estet yang yang Biji Koko se Hektar Biji Koko Bergaji yang
Ditanam Dipetik Kering Bekerja dalam
Number Planted Harvested Production of Yield Average Bulan Disember of Estates Hectareage Hectareage Dry Cocoa per Hectare Prices of atau pada Tempoh
Beans Cocoa Beans Gaji Terakhir
Total Number of Tan/Tonnes Tan/Tonnes RM Workers Employed During
December or During
the Last Pay Period
1968 9 1,823 1,163 .. .. .. 650
1969 11 2,029 1,191 .. .. .. 625
1970 10 2,118 1,268 2,118 .. .. 713
1971 11 1,962 1,047 1,962 .. .. 604
1972 11 2,532 1,691 2,535 1.16 .. 857
1973 12 2,108 1,522 2,108 1.01 .. 623
1974 17 2,474 1,539 2,474 1.05 .. 1,026
1975 21 2,943 2,030 2,943 1.31 .. 1,377
1976 26 3,505 2,176 3,505 1.25 .. 1,635
1977 43 4,941 2,625 4,941 1.07 .. 2,797
1978 128 27,346 16,724 27,346 0.88 .. 8,555
1979 177 36,645 19,332 36,664 0.89 .. 14,551
1980 276 52,745 21,947 52,745 0.89 .. 21,161
1981 343 74,127 27,164 74,127 0.75 .. 29,915
1982 528 117,307 49,435 35,427 0.72 .. 39,169
1983 555 150,807 62,772 37,075 0.59 .. 41,264
1984 586 168,872 80,676 41,215 0.51 .. 45,155
1985 604 179,326 98,508 50,619 0.51 .. 47,653
1986 654 191,121 118,712 70,107 0.59 .. 50,509
1987 677 198,328 137,786 100,175 0.73 .. 56,433
1988 697 201,314 149,330 111,456 0.75 .. 57,791
1989 690 201,615 154,214 106,760 0.69 .. 55,452
1990 666 193,365 157,577 120,826 0.77 .. 56,424
1991 652 182,913 153,923 110,377 0.72 .. 52,674
1992 642 168,058 143,405 121,185 0.85 .. 46,733
1993 569 145,646 127,918 101,599 0.79 2,260 42,268
1994 516 130,232 114,158 78,932 0.69 2,962 37,393
1995 395 96,053 81,379 67,349 0.83 3,036 28,267
101
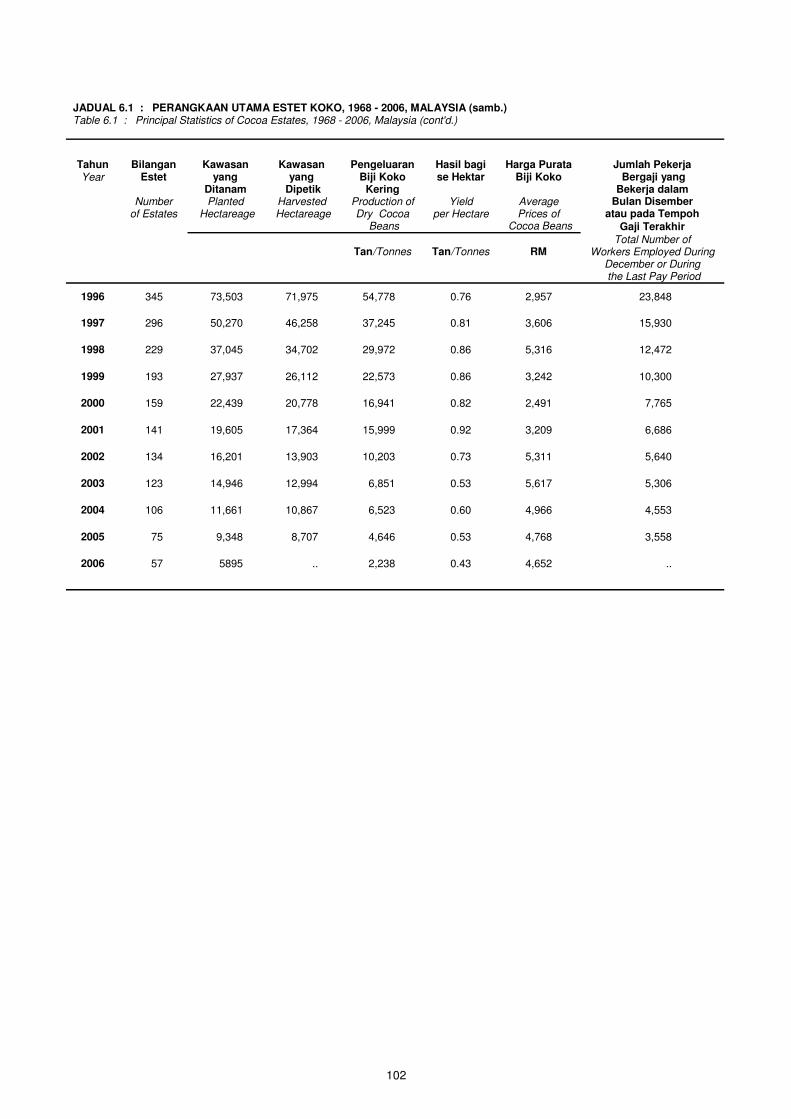
JADUAL 6.1 : PERANGKAAN UTAMA ESTET KOKO, 1968 - 2006, MALAYSIA (samb.) Table 6.1 : Principal Statistics of Cocoa Estates, 1968 - 2006, Malaysia (cont'd.)
Tahun Bilangan Kawasan Kawasan Pengeluaran Hasil bagi Harga Purata Jumlah Pekerja
Year Estet yang yang Biji Koko se Hektar Biji Koko Bergaji yang
Ditanam Dipetik Kering Bekerja dalam
Number Planted Harvested Production of Yield Average Bulan Disember of Estates Hectareage Hectareage Dry Cocoa per Hectare Prices of atau pada Tempoh
Beans Cocoa Beans Gaji Terakhir Total Number of Tan/Tonnes Tan/Tonnes RM Workers Employed During
December or During
the Last Pay Period
1996 345 73,503 71,975 54,778 0.76 2,957 23,848
1997 296 50,270 46,258 37,245 0.81 3,606 15,930
1998 229 37,045 34,702 29,972 0.86 5,316 12,472
1999 193 27,937 26,112 22,573 0.86 3,242 10,300
2000 159 22,439 20,778 16,941 0.82 2,491 7,765
2001 141 19,605 17,364 15,999 0.92 3,209 6,686
2002 134 16,201 13,903 10,203 0.73 5,311 5,640
2003 123 14,946 12,994 6,851 0.53 5,617 5,306
2004 106 11,661 10,867 6,523 0.60 4,966 4,553
2005 75 9,348 8,707 4,646 0.53 4,768 3,558
2006 57 5895 .. 2,238 0.43 4,652 ..
102
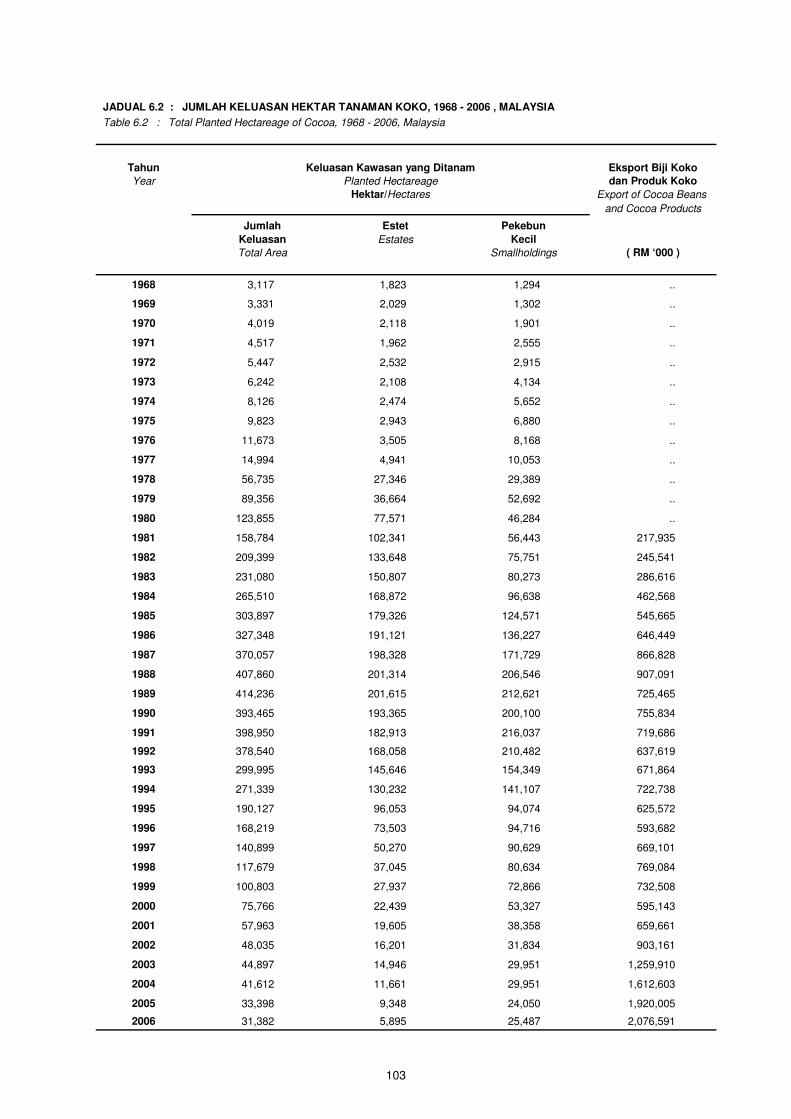
103
JADUAL 6.2 : JUMLAH KELUASAN HEKTAR TANAMAN KOKO, 1968 - 2006 , MALAYSIA
Table 6.2 : Total Planted Hectareage of Cocoa, 1968 - 2006, Malaysia
Tahun Keluasan Kawasan yang Ditanam Eksport Biji Koko
Year Planted Hectareage dan Produk Koko
Export of Cocoa Beans
and Cocoa Products
Jumlah Estet Pekebun
Keluasan Estates Kecil
Total Area Smallholdings ( RM ‘000 )
1968 3,117 1,823 1,294 ..
1969 3,331 2,029 1,302 ..
1970 4,019 2,118 1,901 ..
1971 4,517 1,962 2,555 ..
1972 5,447 2,532 2,915 ..
1973 6,242 2,108 4,134 ..
1974 8,126 2,474 5,652 ..
1975 9,823 2,943 6,880 ..
1976 11,673 3,505 8,168 ..
1977 14,994 4,941 10,053 ..
1978 56,735 27,346 29,389 ..
1979 89,356 36,664 52,692 ..
1980 123,855 77,571 46,284 ..
1981 158,784 102,341 56,443 217,935
1982 209,399 133,648 75,751 245,541
1983 231,080 150,807 80,273 286,616
1984 265,510 168,872 96,638 462,568
1985 303,897 179,326 124,571 545,665
1986 327,348 191,121 136,227 646,449
1987 370,057 198,328 171,729 866,828
1988 407,860 201,314 206,546 907,091
1989 414,236 201,615 212,621 725,465
1990 393,465 193,365 200,100 755,834
1991 398,950 182,913 216,037 719,686
1992 378,540 168,058 210,482 637,619
1993 299,995 145,646 154,349 671,864
1994 271,339 130,232 141,107 722,738
1995 190,127 96,053 94,074 625,572
1996 168,219 73,503 94,716 593,682
1997 140,899 50,270 90,629 669,101
1998 117,679 37,045 80,634 769,084
1999 100,803 27,937 72,866 732,508
2000 75,766 22,439 53,327 595,143
2001 57,963 19,605 38,358 659,661
2002 48,035 16,201 31,834 903,161
2003 44,897 14,946 29,951 1,259,910
2004 41,612 11,661 29,951 1,612,603
2005 33,398 9,348 24,050 1,920,005
2006 31,382 5,895 25,487 2,076,591
Hektar/Hectares


PERHUTANAN
Nota Keterangan
Malaysia
1. Maklumat perhutanan dan pembalakan diperoleh daripada Jabatan Perhutanan
Semenanjung Malaysia, Jabatan Perhutanan Sabah dan Jabatan Perhutanan
Sarawak. Data dari jabatan tersebut diaggregat untuk mendapatkan keluasan dan
pengeluaran di peringkat Malaysia. Perincian data perhutanan mengikut kawasan
juga dipersembahkan secara berasingan di segmen berikutnya.
Semenanjung Malaysia
1. Maklumat perhutanan dan pembalakan diperoleh daripada Jabatan Perhutanan
Semenanjung Malaysia. Data diperoleh bermula dari tahun 1947.
2. Data perhutanan meliputi keluasan hutan, pengeluaran kayu balak, bilangan
pekerja dalam industri berasaskan kayu dan bilangan pekerja dalam sektor selain
pembalakan.
3. Pengeluaran hasil kayu utama adalah kayu balak, kayu gergaji, papan lapis, venir
dan kayu kumai. Manakala industri berasaskan kayu meliputi kilang papan, kilang
papan lapis, kilang kayu kumai, kilang perabot, kilang papan blok, kilang papan
serpai, kilang papan gentian sederhana padat dan kilang papan serpih. Kilang
perabot/kilang kerja kayu/pertukangan mencatatkan bilangan kilang terbesar diikuti
oleh industri kilang papan yang lain.
Sarawak
1. Maklumat perhutanan dan pembalakan diperoleh daripada Jabatan Perhutanan
Sarawak. Data diperoleh bermula dari tahun 1964.
105
2. Data perhutanan meliputi keluasan hutan, pengeluaran kayu balak dan bilangan
pekerja dalam industri berasaskan kayu. Bilangan pekerja dalam industri
berasaskan kayu di Sarawak, tidak termasuk pekerja di dalam sektor awam dan
pembalakan.
3. Pengeluaran kayu balak boleh dibahagikan kepada dua (2) kawasan iaitu hutan
bukit dan hutan paya. Dengan adanya “National Parks and Nature Reserves
Ordinance, 1998” , pengeluaran kayu balak adalah terkawal. Ini menyebabkan,
pengeluaran kayu balak telah berkurangan mulai tahun 1998.
Sabah
1. Maklumat perhutanan dan pembalakan diperoleh daripada Jabatan Perhutanan
Sabah. Data yang diperoleh bermula dari tahun 1947.
2. Data perhutanan meliputi keluasan hutan, pengeluaran kayu balak dan bilangan
pekerja dalam industri berasaskan kayu. Bilangan pekerja dalam industri
berasaskan kayu di Sabah, tidak termasuk pekerja di dalam sektor pembalakan.
3. Pengeluaran kayu balak di Sabah meliputi pengeluaran hutan asli sahaja. Industri
berasaskan kayu di Sabah meliputi kilang papan, kilang papan lapis, kilang kayu
kumai, kilang perabot, kilang papan blok, kilang papan serpai, kilang papan gentian
sederhana padat dan kilang papan serpih. Pengeluaran kayu balak mulai 1989
telah mengalami pengurangan disebabkan terdapatnya kawalan dalam
penebangan kayu balak.
106
FORESTRY
Explanatory notes
Malaysia
1. Statistics for forestry and logging are provided by Forestry Department Peninsular
Malaysia, Forestry Department Sabah and Forestry Department Sarawak. Data
obtained from these three department were aggregated to derive the total area and
production of logs at Malaysia level. The details on forestry by region are also
presented separately in the following segments.
Peninsular Malaysia
1. Statistics for forestry and logging are provided by Forestry Department, Peninsular
Malaysia. The data are available since 1947.
2. Forestry data covers forest area, production of logs, number of workers in the
wood-based industries and number of workers in other sector.
3. Production of major timber products are saw logs, sawn timber, plywood, veneer
and moulding. Major timber industries including sawmills, plywood/veneer mills,
moulding plant, furniture factory, block board plant, chipboard plant, medium density
fibreboard plant and moulded particleboard plant. The furniture/wood-making/
joinery mills constituted the largest number followed by the other sawmill industry.
Sarawak
1. Statistics for forestry and logging are provided by Forestry Department, Sarawak.
The data are available since 1964.
2. Forestry data covers forest area, production of logs and number of workers in the
wood-based industries. Number of workers in wood-based industry in Sarawak,
excluding workers in public and logging sector.
107
3. Log production can be divided into two (2) areas, that is hill forest and swamp
forest. With the “National Parks and Nature Reserves Ordinance, 1998”, the log
production was under control. This caused the decrease in the log production since
the year 1998.
Sabah
1. Statistics for forestry and logging are provided by Forestry Department, Sabah.
The data are available since 1947.
2. Forestry data covers forest area, production of logs and number of workers in the
wood-based industries. Number of workers in wood-based industry in Sabah,
excluding workers in logging sector.
3. Production of logs in Sabah covers natural forest production only. Major timber
industries in Sabah including sawmills, plywood/veneer mills, moulding plant,
furniture factory, block board plant, chipboard plant, medium density fibreboard plant
and moulded particleboard plant. Decreased in production of logs since year 1989
caused by the control in cutting down the logs.
108
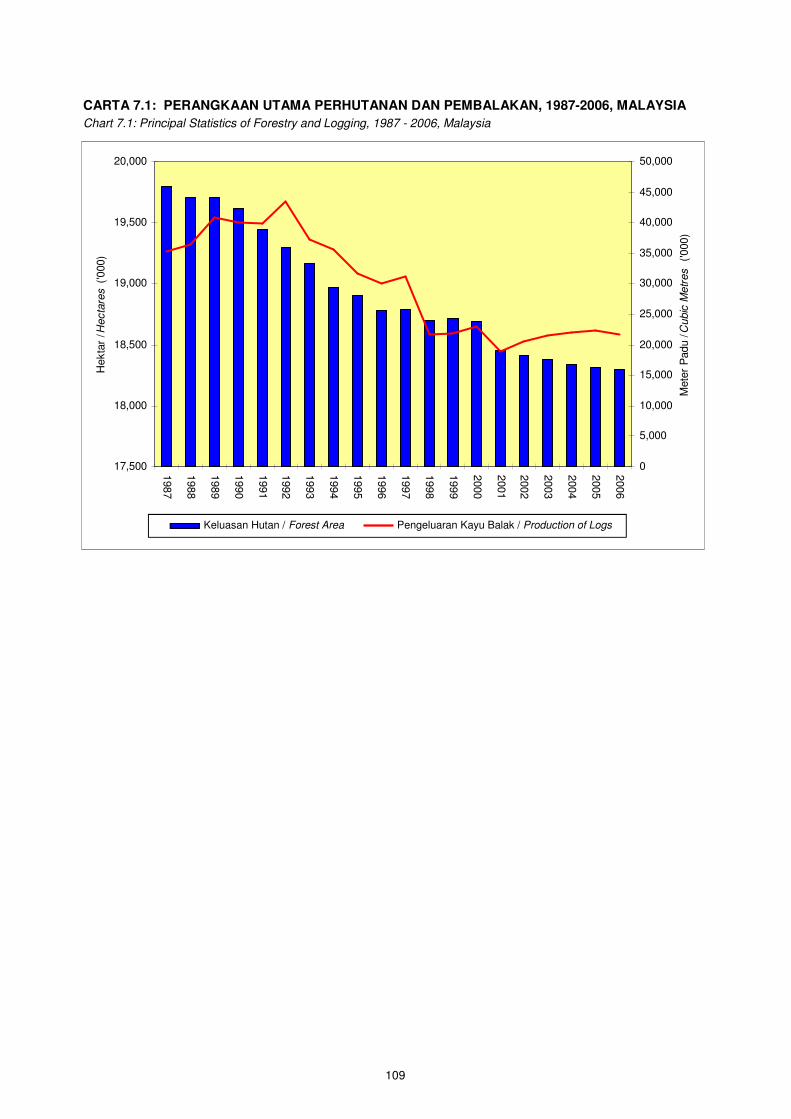
17,500
18,000
18,500
19,000
19,500
20,000
1987
1988
1989
1990
1991
1992
1993
1994
1995
1996
1997
1998
1999
2000
2001
2002
2003
2004
2005
2006
Hekta
r / H
ecta
res
('0
00)
0
5,000
10,000
15,000
20,000
25,000
30,000
35,000
40,000
45,000
50,000
Mete
r P
adu / C
ubic
Metr
es
('0
00)
Keluasan Hutan / Forest Area Pengeluaran Kayu Balak / Production of Logs
109
CARTA 7.1: PERANGKAAN UTAMA PERHUTANAN DAN PEMBALAKAN, 1987-2006, MALAYSIA
Chart 7.1: Principal Statistics of Forestry and Logging, 1987 - 2006, Malaysia

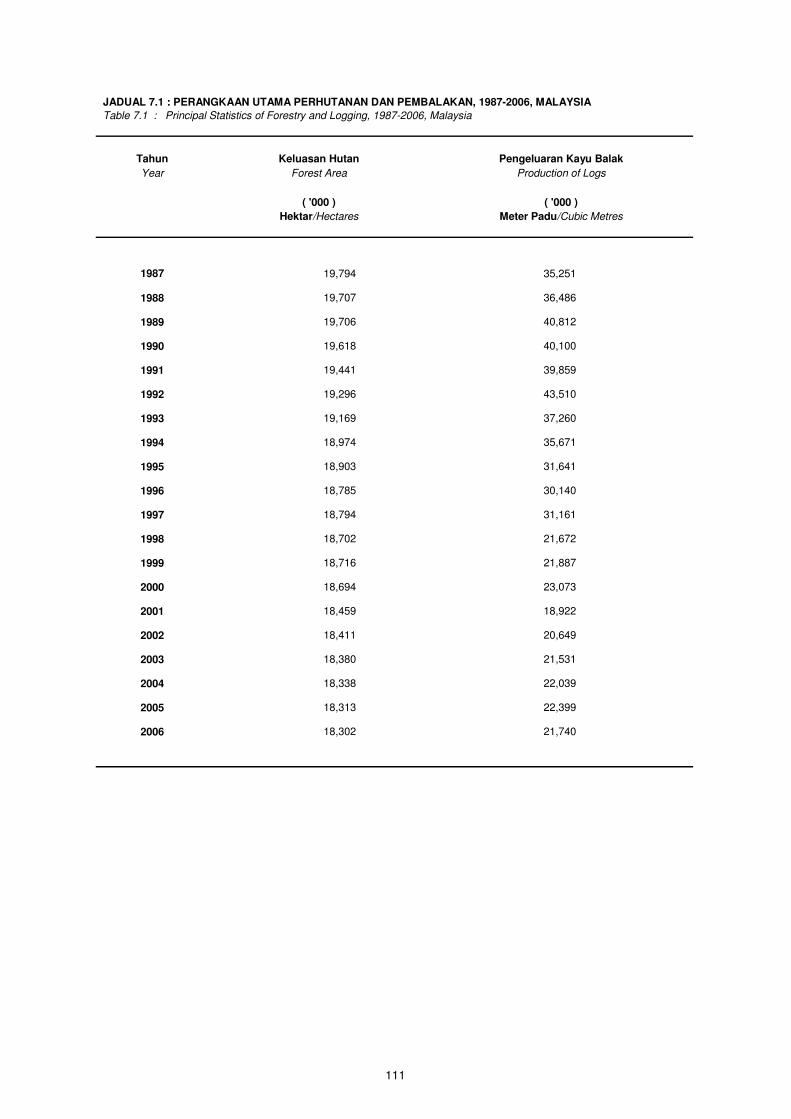
111
JADUAL 7.1 : PERANGKAAN UTAMA PERHUTANAN DAN PEMBALAKAN, 1987-2006, MALAYSIA
Table 7.1 : Principal Statistics of Forestry and Logging, 1987-2006, Malaysia
Tahun Keluasan Hutan Pengeluaran Kayu Balak
Year Forest Area Production of Logs
( '000 ) ( '000 )
Hektar/Hectares Meter Padu/Cubic Metres
1987 19,794 35,251
1988 19,707 36,486
1989 19,706 40,812
1990 19,618 40,100
1991 19,441 39,859
1992 19,296 43,510
1993 19,169 37,260
1994 18,974 35,671
1995 18,903 31,641
1996 18,785 30,140
1997 18,794 31,161
1998 18,702 21,672
1999 18,716 21,887
2000 18,694 23,073
2001 18,459 18,922
2002 18,411 20,649
2003 18,380 21,531
2004 18,338 22,039
2005 18,313 22,399
2006 18,302 21,740
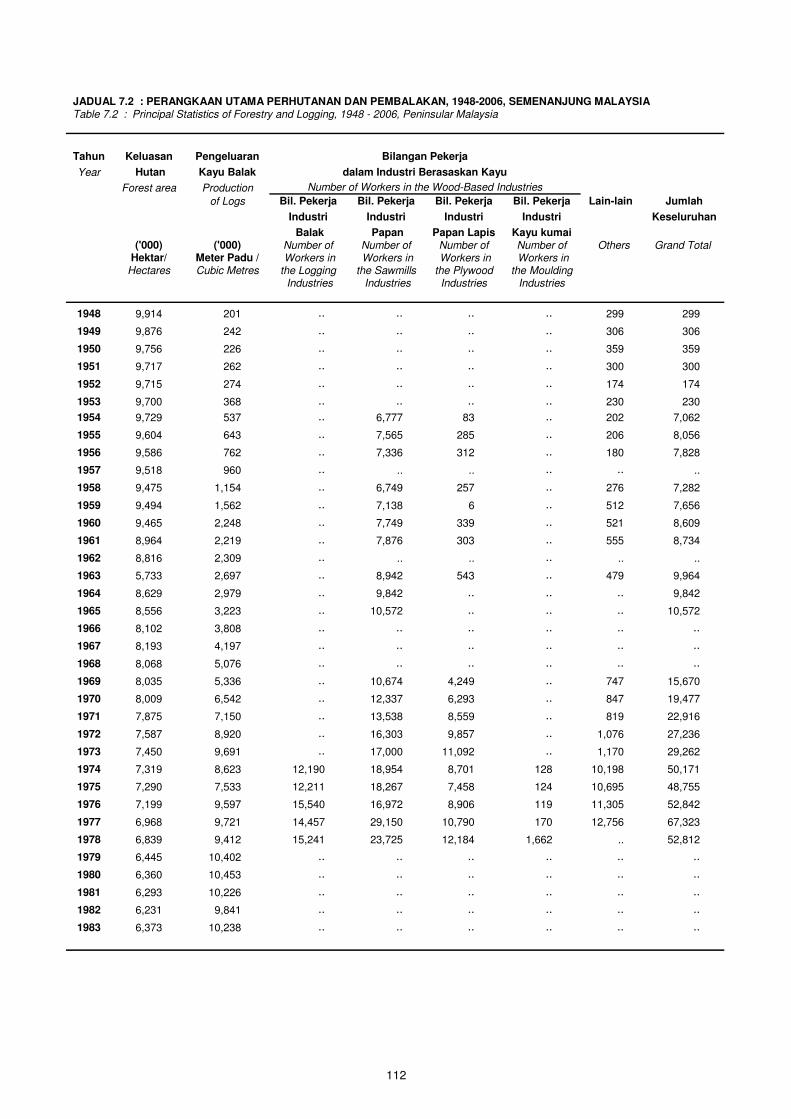
JADUAL 7.2 : PERANGKAAN UTAMA PERHUTANAN DAN PEMBALAKAN, 1948-2006, SEMENANJUNG MALAYSIA
Table 7.2 : Principal Statistics of Forestry and Logging, 1948 - 2006, Peninsular Malaysia
Tahun Keluasan Pengeluaran Bilangan Pekerja
Year Hutan Kayu Balak dalam Industri Berasaskan Kayu
Forest area Production Number of Workers in the Wood-Based Industries
of Logs Bil. Pekerja Bil. Pekerja Bil. Pekerja Bil. Pekerja Lain-lain Jumlah
Industri Industri Industri Industri Keseluruhan
Balak Papan Papan Lapis Kayu kumai
('000) ('000) Number of Number of Number of Number of Others Grand Total Hektar/ Meter Padu / Workers in Workers in Workers in Workers in Hectares Cubic Metres the Logging the Sawmills the Plywood the Moulding Industries Industries Industries Industries
1948 9,914 201 .. .. .. .. 299 299
1949 9,876 242 .. .. .. .. 306 306
1950 9,756 226 .. .. .. .. 359 359
1951 9,717 262 .. .. .. .. 300 300
1952 9,715 274 .. .. .. .. 174 174
1953 9,700 368 .. .. .. .. 230 230
1954 9,729 537 .. 6,777 83
.. 202 7,062
1955 9,604 643 .. 7,565 285
.. 206 8,056
1956 9,586 762 .. 7,336 312
.. 180 7,828
1957 9,518 960 .. .. .. .. .. ..
1958 9,475 1,154 .. 6,749 257
.. 276 7,282
1959 9,494 1,562 .. 7,138 6
.. 512 7,656
1960 9,465 2,248 .. 7,749 339
.. 521 8,609
1961 8,964 2,219 .. 7,876 303
.. 555 8,734
1962 8,816 2,309 .. .. .. .. .. ..
1963 5,733 2,697 .. 8,942 543
.. 479 9,964
1964 8,629 2,979 .. 9,842
.. .. .. 9,842
1965 8,556 3,223 .. 10,572
.. .. .. 10,572
1966 8,102 3,808 .. .. .. .. .. ..
1967 8,193 4,197 .. .. .. .. .. ..
1968 8,068 5,076 .. .. .. .. .. ..
1969 8,035 5,336 .. 10,674 4,249
.. 747 15,670
1970 8,009 6,542 .. 12,337 6,293
.. 847 19,477
1971 7,875 7,150 .. 13,538 8,559
.. 819 22,916
1972 7,587 8,920 .. 16,303 9,857
.. 1,076 27,236
1973 7,450 9,691 .. 17,000 11,092
.. 1,170 29,262
1974 7,319 8,623 12,190 18,954 8,701 128 10,198 50,171
1975 7,290 7,533 12,211 18,267 7,458 124 10,695 48,755
1976 7,199 9,597 15,540 16,972 8,906 119 11,305 52,842
1977 6,968 9,721 14,457 29,150 10,790 170 12,756 67,323
1978 6,839 9,412 15,241 23,725 12,184 1,662 .. 52,812
1979 6,445 10,402 .. .. .. .. .. ..
1980 6,360 10,453 .. .. .. .. .. ..
1981 6,293 10,226 .. .. .. .. .. ..
1982 6,231 9,841 .. .. .. .. .. ..
1983 6,373 10,238 .. .. .. .. .. ..
112
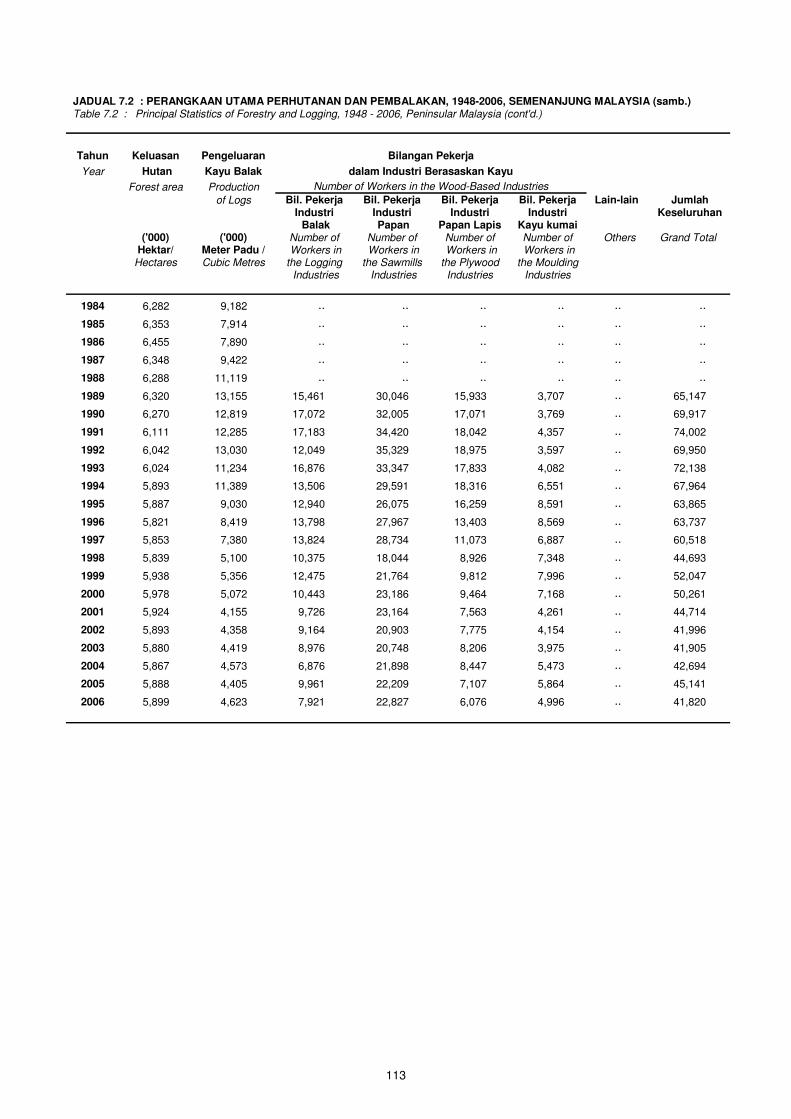
JADUAL 7.2 : PERANGKAAN UTAMA PERHUTANAN DAN PEMBALAKAN, 1948-2006, SEMENANJUNG MALAYSIA (samb.) Table 7.2 : Principal Statistics of Forestry and Logging, 1948 - 2006, Peninsular Malaysia (cont'd.)
Tahun Keluasan Pengeluaran Bilangan Pekerja
Year Hutan Kayu Balak dalam Industri Berasaskan Kayu
Forest area Production Number of Workers in the Wood-Based Industries
of Logs Bil. Pekerja Bil. Pekerja Bil. Pekerja Bil. Pekerja Lain-lain Jumlah
Industri Industri Industri Industri Keseluruhan
Balak Papan Papan Lapis Kayu kumai ('000) ('000) Number of Number of Number of Number of Others Grand Total Hektar/ Meter Padu / Workers in Workers in Workers in Workers in Hectares Cubic Metres the Logging the Sawmills the Plywood the Moulding Industries Industries Industries Industries
1984 6,282 9,182 .. .. .. .. .. ..
1985 6,353 7,914 .. .. .. .. .. ..
1986 6,455 7,890 .. .. .. .. .. ..
1987 6,348 9,422 .. .. .. .. .. ..
1988 6,288 11,119 .. .. .. .. .. ..
1989 6,320 13,155 15,461 30,046 15,933 3,707 .. 65,147
1990 6,270 12,819 17,072 32,005 17,071 3,769 .. 69,917
1991 6,111 12,285 17,183 34,420 18,042 4,357 .. 74,002
1992 6,042 13,030 12,049 35,329 18,975 3,597 .. 69,950
1993 6,024 11,234 16,876 33,347 17,833 4,082 .. 72,138
1994 5,893 11,389 13,506 29,591 18,316 6,551 .. 67,964
1995 5,887 9,030 12,940 26,075 16,259 8,591 .. 63,865
1996 5,821 8,419 13,798 27,967 13,403 8,569 .. 63,737
1997 5,853 7,380 13,824 28,734 11,073 6,887 .. 60,518
1998 5,839 5,100 10,375 18,044 8,926 7,348 .. 44,693
1999 5,938 5,356 12,475 21,764 9,812 7,996 .. 52,047
2000 5,978 5,072 10,443 23,186 9,464 7,168 .. 50,261
2001 5,924 4,155 9,726 23,164 7,563 4,261 .. 44,714
2002 5,893 4,358 9,164 20,903 7,775 4,154 .. 41,996
2003 5,880 4,419 8,976 20,748 8,206 3,975 .. 41,905
2004 5,867 4,573 6,876 21,898 8,447 5,473 .. 42,694
2005 5,888 4,405 9,961 22,209 7,107 5,864 .. 45,141
2006 5,899 4,623 7,921 22,827 6,076 4,996 .. 41,820
113
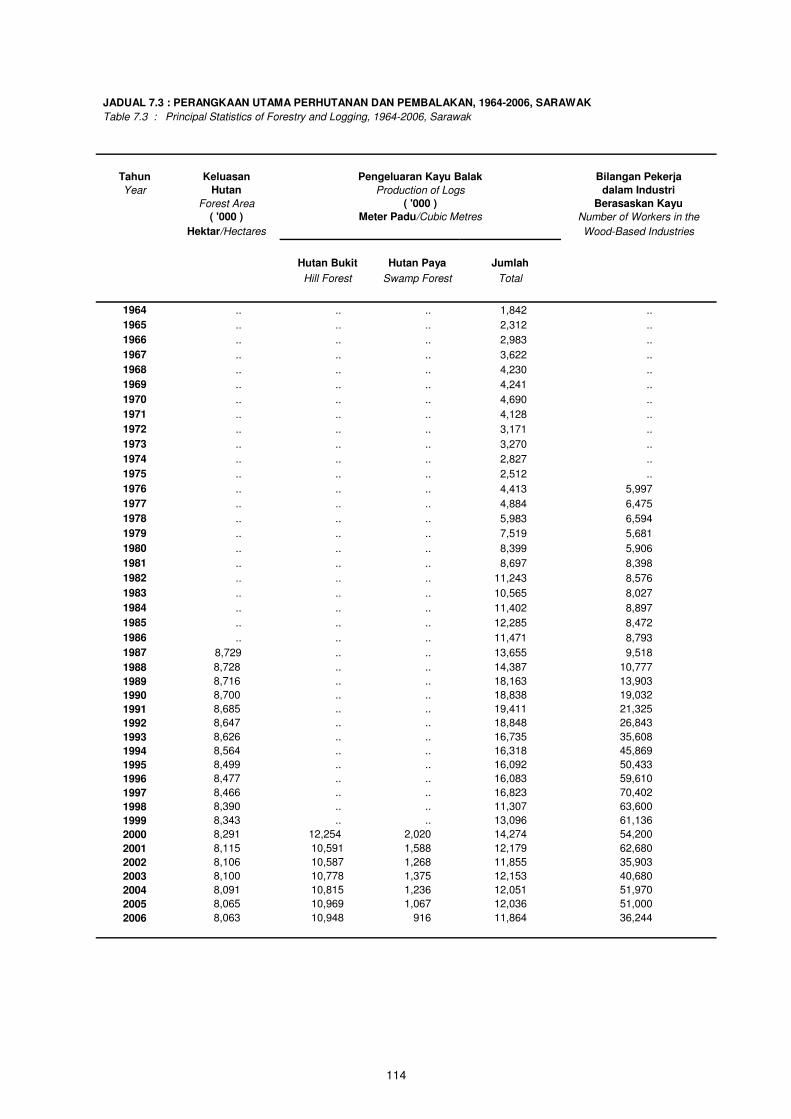
JADUAL 7.3 : PERANGKAAN UTAMA PERHUTANAN DAN PEMBALAKAN, 1964-2006, SARAWAK
Table 7.3 : Principal Statistics of Forestry and Logging, 1964-2006, Sarawak
Tahun Keluasan Pengeluaran Kayu Balak Bilangan Pekerja
Year Hutan Production of Logs dalam Industri
Forest Area ( '000 ) Berasaskan Kayu
( '000 ) Number of Workers in the
Hektar/Hectares Wood-Based Industries
Hutan Bukit Hutan Paya Jumlah
Hill Forest Swamp Forest Total
1964 .. .. .. 1,842 ..
1965 .. .. .. 2,312 ..
1966 .. .. .. 2,983 ..
1967 .. .. .. 3,622 ..
1968 .. .. .. 4,230 ..
1969 .. .. .. 4,241 ..
1970 .. .. .. 4,690 ..
1971 .. .. .. 4,128 ..
1972 .. .. .. 3,171 ..
1973 .. .. .. 3,270 ..
1974 .. .. .. 2,827 ..
1975 .. .. .. 2,512 ..
1976 .. .. .. 4,413 5,997
1977 .. .. .. 4,884 6,475
1978 .. .. .. 5,983 6,594
1979 .. .. .. 7,519 5,681
1980 .. .. .. 8,399 5,906
1981 .. .. .. 8,697 8,398
1982 .. .. .. 11,243 8,576
1983 .. .. .. 10,565 8,027
1984 .. .. .. 11,402 8,897
1985 .. .. .. 12,285 8,472
1986 .. .. .. 11,471 8,793
1987 8,729 .. .. 13,655 9,518
1988 8,728 .. .. 14,387 10,777
1989 8,716 .. .. 18,163 13,903
1990 8,700 .. .. 18,838 19,032
1991 8,685 .. .. 19,411 21,325
1992 8,647 .. .. 18,848 26,843
1993 8,626 .. .. 16,735 35,608
1994 8,564 .. .. 16,318 45,869
1995 8,499 .. .. 16,092 50,433
1996 8,477 .. .. 16,083 59,610
1997 8,466 .. .. 16,823 70,402
1998 8,390 .. .. 11,307 63,600
1999 8,343 .. .. 13,096 61,136
2000 8,291 12,254 2,020 14,274 54,200
2001 8,115 10,591 1,588 12,179 62,680
2002 8,106 10,587 1,268 11,855 35,903
2003 8,100 10,778 1,375 12,153 40,680
2004 8,091 10,815 1,236 12,051 51,970
2005 8,065 10,969 1,067 12,036 51,000
2006 8,063 10,948 916 11,864 36,244
Meter Padu/Cubic Metres
114
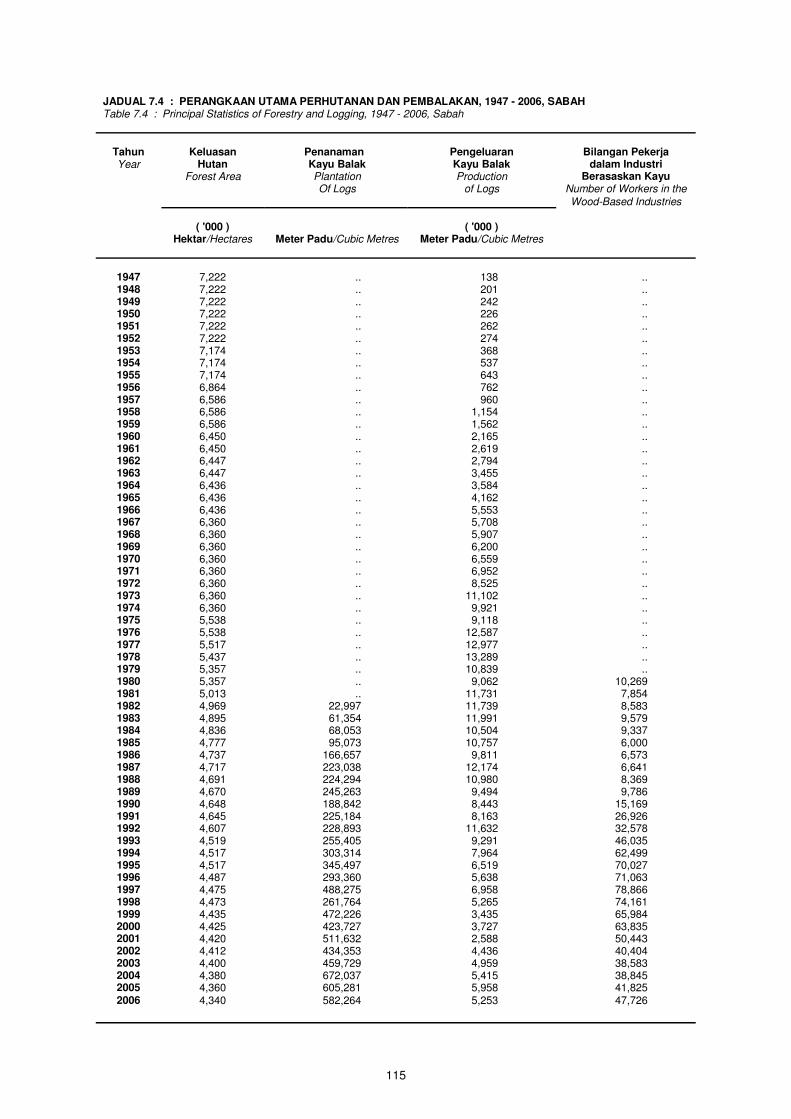
115
JADUAL 7.4 : PERANGKAAN UTAMA PERHUTANAN DAN PEMBALAKAN, 1947 - 2006, SABAH
Table 7.4 : Principal Statistics of Forestry and Logging, 1947 - 2006, Sabah
Tahun Keluasan Penanaman Pengeluaran Bilangan Pekerja
Year Hutan Kayu Balak Kayu Balak dalam Industri Forest Area Plantation Production Berasaskan Kayu
Of Logs of Logs Number of Workers in the
Wood-Based Industries
( '000 ) ( '000 ) Hektar/Hectares Meter Padu/Cubic Metres Meter Padu/Cubic Metres
1947 7,222 .. 138 .. 1948 7,222 .. 201 .. 1949 7,222 .. 242 .. 1950 7,222 .. 226 .. 1951 7,222 .. 262 .. 1952 7,222 .. 274 .. 1953 7,174 .. 368 .. 1954 7,174 .. 537 .. 1955 7,174 .. 643 .. 1956 6,864 .. 762 .. 1957 6,586 .. 960 .. 1958 6,586 .. 1,154 .. 1959 6,586 .. 1,562 .. 1960 6,450 .. 2,165 .. 1961 6,450 .. 2,619 .. 1962 6,447 .. 2,794 .. 1963 6,447 .. 3,455 .. 1964 6,436 .. 3,584 .. 1965 6,436 .. 4,162 .. 1966 6,436 .. 5,553 .. 1967 6,360 .. 5,708 .. 1968 6,360 .. 5,907 .. 1969 6,360 .. 6,200 .. 1970 6,360 .. 6,559 .. 1971 6,360 .. 6,952 .. 1972 6,360 .. 8,525 .. 1973 6,360 .. 11,102 .. 1974 6,360 .. 9,921 .. 1975 5,538 .. 9,118 .. 1976 5,538 .. 12,587 .. 1977 5,517 .. 12,977 .. 1978 5,437 .. 13,289 .. 1979 5,357 .. 10,839 .. 1980 5,357 .. 9,062 10,269
1981 5,013 .. 11,731 7,854
1982 4,969 22,997 11,739 8,583
1983 4,895 61,354 11,991 9,579
1984 4,836 68,053 10,504 9,337
1985 4,777 95,073 10,757 6,000
1986 4,737 166,657 9,811 6,573
1987 4,717 223,038 12,174 6,641
1988 4,691 224,294 10,980 8,369
1989 4,670 245,263 9,494 9,786
1990 4,648 188,842 8,443 15,169
1991 4,645 225,184 8,163 26,926
1992 4,607 228,893 11,632 32,578
1993 4,519 255,405 9,291 46,035
1994 4,517 303,314 7,964 62,499
1995 4,517 345,497 6,519 70,027
1996 4,487 293,360 5,638 71,063
1997 4,475 488,275 6,958 78,866
1998 4,473 261,764 5,265 74,161
1999 4,435 472,226 3,435 65,984
2000 4,425 423,727 3,727 63,835
2001 4,420 511,632 2,588 50,443
2002 4,412 434,353 4,436 40,404
2003 4,400 459,729 4,959 38,583
2004 4,380 672,037 5,415 38,845
2005 4,360 605,281 5,958 41,825
2006 4,340 582,264 5,253 47,726


117
PERIKANAN
Nota Keterangan
1. Data perikanan yang diterbitkan dari tahun 1954 hingga 2006 diperoleh daripada
Jabatan Perikanan Malaysia. Data perikanan meliputi bilangan nelayan, pendaratan
ikan laut serta pengeluaran akuakultur. Data bagi tempoh antara 1954 hingga 1987
merujuk kepada Semenanjung Malaysia sahaja. Manakala data mulai 1988 hingga
2006 merujuk kepada Malaysia.
2. Sektor perikanan dikategorikan kepada tangkapan ikan marin (laut) dan akuakultur.
Akuakultur merujuk kepada penangkapan ikan, kerang-kerangan, tiram dan lain-lain
di laut, tasik atau sungai dan juga penangkapan ikan untuk kegunaan sendiri dan
bukan untuk sukan. Nilai pendaratan ikan laut adalah bergantung kepada gred-gred
jenis ikan dan mengikut harga borong pasaran semasa.
FISHERIES
Explanatory Notes
1. Fisheries statistics published for the period 1954 to 2006 are provided by
Department of Fisheries Malaysia. The data cover the number of fishermen,
landings of marine fish and aquaculture production. Data for reference year 1954 to
1987 refer to Peninsular Malaysia only. While data from 1988 to 2006 refer to
Malaysia.
2. The fisheries sector is categorized into the marine capture and aquaculture.
Aquaculture refer to fish farming, shellfish cultivation, oyster farming, etc. in sea,
lakes or rivers and fishing for home consumption and not as sports. Value of
landings marine fish refer to type of grade fish and according to current wholesale
market values.

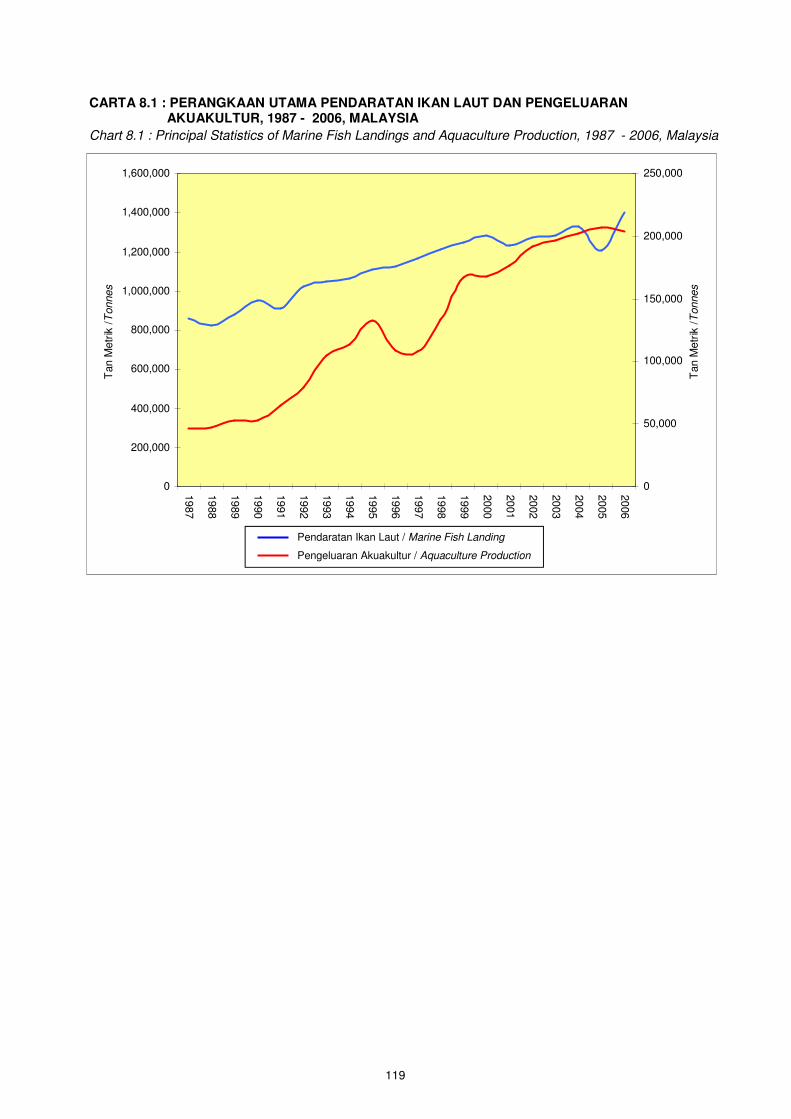
CARTA 8.1 : PERANGKAAN UTAMA PENDARATAN IKAN LAUT DAN PENGELUARAN AKUAKULTUR, 1987 - 2006, MALAYSIA
Chart 8.1 : Principal Statistics of Marine Fish Landings and Aquaculture Production, 1987 - 2006, Malaysia
0
200,000
400,000
600,000
800,000
1,000,000
1,200,000
1,400,000
1,600,000
1987
1988
1989
1990
1991
1992
1993
1994
1995
1996
1997
1998
1999
2000
2001
2002
2003
2004
2005
2006
Tan M
etr
ik / T
onnes
0
50,000
100,000
150,000
200,000
250,000
Tan M
etr
ik / T
onnes
Pendaratan Ikan Laut / Marine Fish Landing
Pengeluaran Akuakultur / Aquaculture Production
119

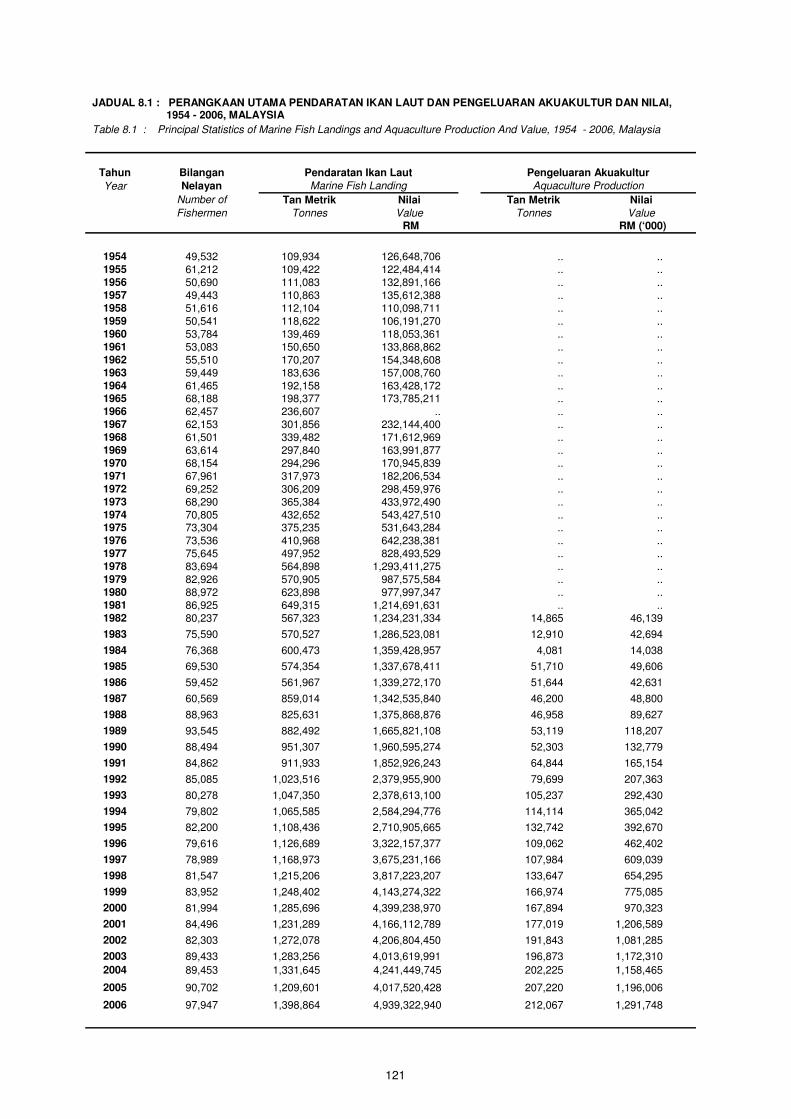
JADUAL 8.1 : PERANGKAAN UTAMA PENDARATAN IKAN LAUT DAN PENGELUARAN AKUAKULTUR DAN NILAI, 1954 - 2006, MALAYSIA
Table 8.1 : Principal Statistics of Marine Fish Landings and Aquaculture Production And Value, 1954 - 2006, Malaysia
Tahun Bilangan Pendaratan Ikan Laut Pengeluaran Akuakultur
Year Nelayan Marine Fish Landing Aquaculture Production
Number of Tan Metrik Nilai Tan Metrik Nilai
Fishermen Tonnes Value Tonnes Value
RM RM (‘000)
1954 49,532 109,934 126,648,706 .. .. 1955 61,212 109,422 122,484,414 .. .. 1956 50,690 111,083 132,891,166 .. .. 1957 49,443 110,863 135,612,388 .. .. 1958 51,616 112,104 110,098,711 .. .. 1959 50,541 118,622 106,191,270 .. .. 1960 53,784 139,469 118,053,361 .. .. 1961 53,083 150,650 133,868,862 .. .. 1962 55,510 170,207 154,348,608 .. .. 1963 59,449 183,636 157,008,760 .. .. 1964 61,465 192,158 163,428,172 .. .. 1965 68,188 198,377 173,785,211 .. .. 1966 62,457 236,607 .. .. .. 1967 62,153 301,856 232,144,400 .. .. 1968 61,501 339,482 171,612,969 .. .. 1969 63,614 297,840 163,991,877 .. .. 1970 68,154 294,296 170,945,839 .. .. 1971 67,961 317,973 182,206,534 .. .. 1972 69,252 306,209 298,459,976 .. .. 1973 68,290 365,384 433,972,490 .. .. 1974 70,805 432,652 543,427,510 .. .. 1975 73,304 375,235 531,643,284 .. .. 1976 73,536 410,968 642,238,381 .. .. 1977 75,645 497,952 828,493,529 .. .. 1978 83,694 564,898 1,293,411,275 .. .. 1979 82,926 570,905 987,575,584 .. .. 1980 88,972 623,898 977,997,347 .. .. 1981 86,925 649,315 1,214,691,631 .. .. 1982 80,237 567,323 1,234,231,334 14,865 46,139
1983 75,590 570,527 1,286,523,081 12,910 42,694
1984 76,368 600,473 1,359,428,957 4,081 14,038
1985 69,530 574,354 1,337,678,411 51,710 49,606
1986 59,452 561,967 1,339,272,170 51,644 42,631
1987 60,569 859,014 1,342,535,840 46,200 48,800
1988 88,963 825,631 1,375,868,876 46,958 89,627
1989 93,545 882,492 1,665,821,108 53,119 118,207
1990 88,494 951,307 1,960,595,274 52,303 132,779
1991 84,862 911,933 1,852,926,243 64,844 165,154
1992 85,085 1,023,516 2,379,955,900 79,699 207,363
1993 80,278 1,047,350 2,378,613,100 105,237 292,430
1994 79,802 1,065,585 2,584,294,776 114,114 365,042
1995 82,200 1,108,436 2,710,905,665 132,742 392,670
1996 79,616 1,126,689 3,322,157,377 109,062 462,402
1997 78,989 1,168,973 3,675,231,166 107,984 609,039
1998 81,547 1,215,206 3,817,223,207 133,647 654,295
1999 83,952 1,248,402 4,143,274,322 166,974 775,085
2000 81,994 1,285,696 4,399,238,970 167,894 970,323
2001 84,496 1,231,289 4,166,112,789 177,019 1,206,589
2002 82,303 1,272,078 4,206,804,450 191,843 1,081,285
2003 89,433 1,283,256 4,013,619,991 196,873 1,172,310
2004 89,453 1,331,645 4,241,449,745 202,225 1,158,465
2005 90,702 1,209,601 4,017,520,428 207,220 1,196,006
2006 97,947 1,398,864 4,939,322,940 212,067 1,291,748
121


123
PEMBUATAN
Nota Keterangan
1. Data sektor pembuatan diperoleh daripada penyiasatan dan banci bagi industri
pembuatan. Penyiasatan pertama telah dilaksanakan bagi tahun rujukan 1960
manakala banci pertama dijalankan bagi tahun rujukan 1959. Banci seterusnya
dijalankan pada tahun 1963, 1968, 1973, 1981, 1993, 2000 dan 2005.
2. Bagi tempoh antara banci, penyiasatan telah dilaksanakan secara tahunan kecuali
1980 dan 1998. Liputan penyiasatan adalah lebih daripada 75 peratus daripada
jumlah guna tenaga bagi sektor pembuatan.
3. Data bagi tahun 1959 hingga 1979 merujuk kepada Semenanjung Malaysia
manakala data bagi tahun-tahun lain merujuk kepada Malaysia.
4. Data bagi Output Kasar untuk tahun 1959 hingga 1978 merujuk kepada nilai jualan
kasar manakala data bagi Kos Input merujuk dengan nilai bagi bahan-bahan yang
dibeli. Bagi tahun 2005, Kos Input termasuk bayaran terhadap perkhidmatan bukan
perindustrian.
5. Data pekerja bagi tahun 1959 hingga 1969 merujuk kepada pekerja bergaji
manakala data bagi tahun 1970 hingga 2005 merujuk kepada jumlah pekerja.
124
MANUFACTURING
Explanatory Notes
1. Data on the manufacturing sector are collected from surveys and censuses of
manufacturing industries. The first survey was conducted for reference year 1960,
while the first census was for reference year 1959. Subsequent censuses were
carried out in 1963, 1968, 1973, 1981, 1993, 2000 and 2005.
2. During the inter-censal years, surveys were canvassed annually except for years
1980 and 1998. The survey coverage is designed to cover more than 75 percent of
total employment of the manufacturing sector.
3. Data for years 1959 to 1979 refer to Peninsular Malaysia while data for the other
years refer to Malaysia.
4. Data on Gross Output for years 1959 to 1978 refer to gross value of sales,
while data on Cost of Input refer to the value of materials purchased. For year 2005,
Cost of Input includes payments for non-industrial services.
5. Employment data for year 1959 to 1969 refer to paid employees while data for
years 1970 to 2005 refer to total employment.
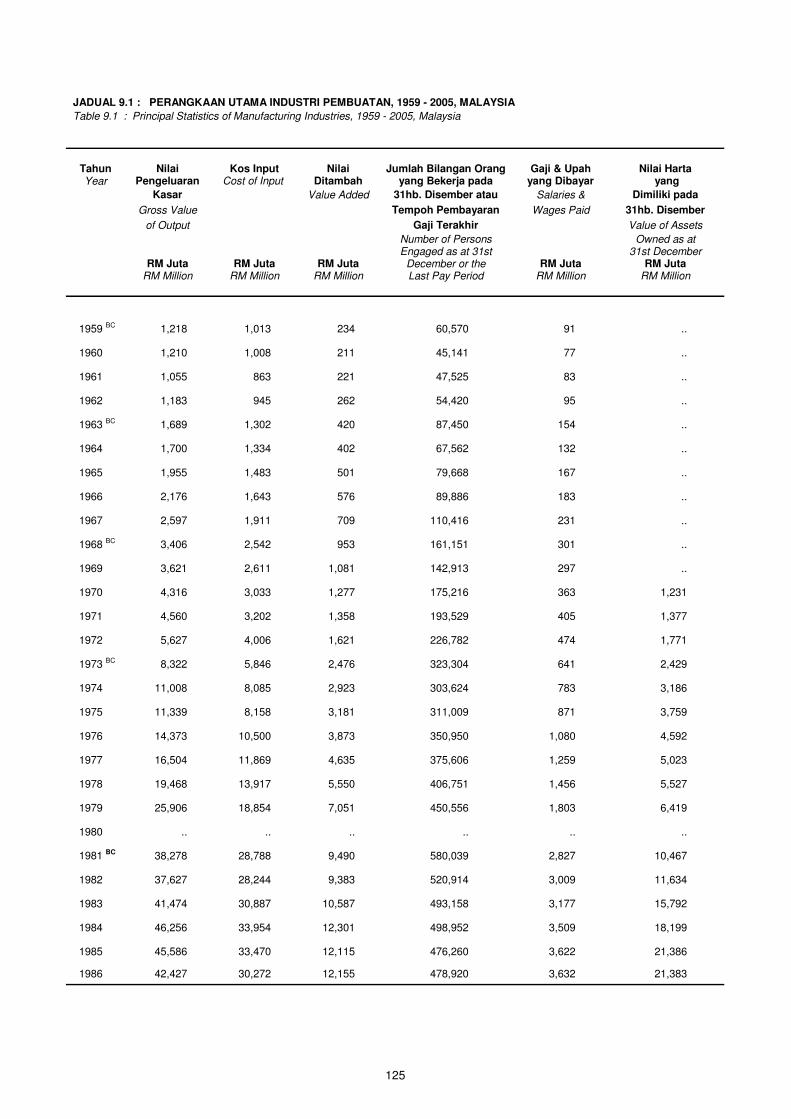
JADUAL 9.1 : PERANGKAAN UTAMA INDUSTRI PEMBUATAN, 1959 - 2005, MALAYSIA
Table 9.1 : Principal Statistics of Manufacturing Industries, 1959 - 2005, Malaysia
Tahun Nilai Kos Input Nilai Jumlah Bilangan Orang Gaji & Upah Nilai Harta
Year Pengeluaran Cost of Input Ditambah yang Bekerja pada yang Dibayar yang
Kasar
Value Added 31hb. Disember atau Salaries & Dimiliki pada
Gross Value
Tempoh Pembayaran Wages Paid 31hb. Disember
of Output
Gaji Terakhir Value of Assets
Number of Persons Owned as at Engaged as at 31st 31st December RM Juta RM Juta RM Juta December or the RM Juta RM Juta
RM Million RM Million RM Million Last Pay Period RM Million RM Million
1959 BC 1,218 1,013 234 60,570 91 ..
1960 1,210 1,008 211 45,141 77 ..
1961 1,055 863 221 47,525 83 ..
1962 1,183 945 262 54,420 95 ..
1963 BC 1,689 1,302 420 87,450 154 ..
1964 1,700 1,334 402 67,562 132 ..
1965 1,955 1,483 501 79,668 167 ..
1966 2,176 1,643 576 89,886 183 ..
1967 2,597 1,911 709 110,416 231 ..
1968 BC 3,406 2,542 953 161,151 301 ..
1969 3,621 2,611 1,081 142,913 297 ..
1970 4,316 3,033 1,277 175,216 363 1,231
1971 4,560 3,202 1,358 193,529 405 1,377
1972 5,627 4,006 1,621 226,782 474 1,771
1973 BC 8,322 5,846 2,476 323,304 641 2,429
1974 11,008 8,085 2,923 303,624 783 3,186
1975 11,339 8,158 3,181 311,009 871 3,759
1976 14,373 10,500 3,873 350,950 1,080 4,592
1977 16,504 11,869 4,635 375,606 1,259 5,023
1978 19,468 13,917 5,550 406,751 1,456 5,527
1979 25,906 18,854 7,051 450,556 1,803 6,419
1980 .. .. .. .. .. ..
1981 BC 38,278 28,788 9,490 580,039 2,827 10,467
1982 37,627 28,244 9,383 520,914 3,009 11,634
1983 41,474 30,887 10,587 493,158 3,177 15,792
1984 46,256 33,954 12,301 498,952 3,509 18,199
1985 45,586 33,470 12,115 476,260 3,622 21,386
1986 42,427 30,272 12,155 478,920 3,632 21,383
125
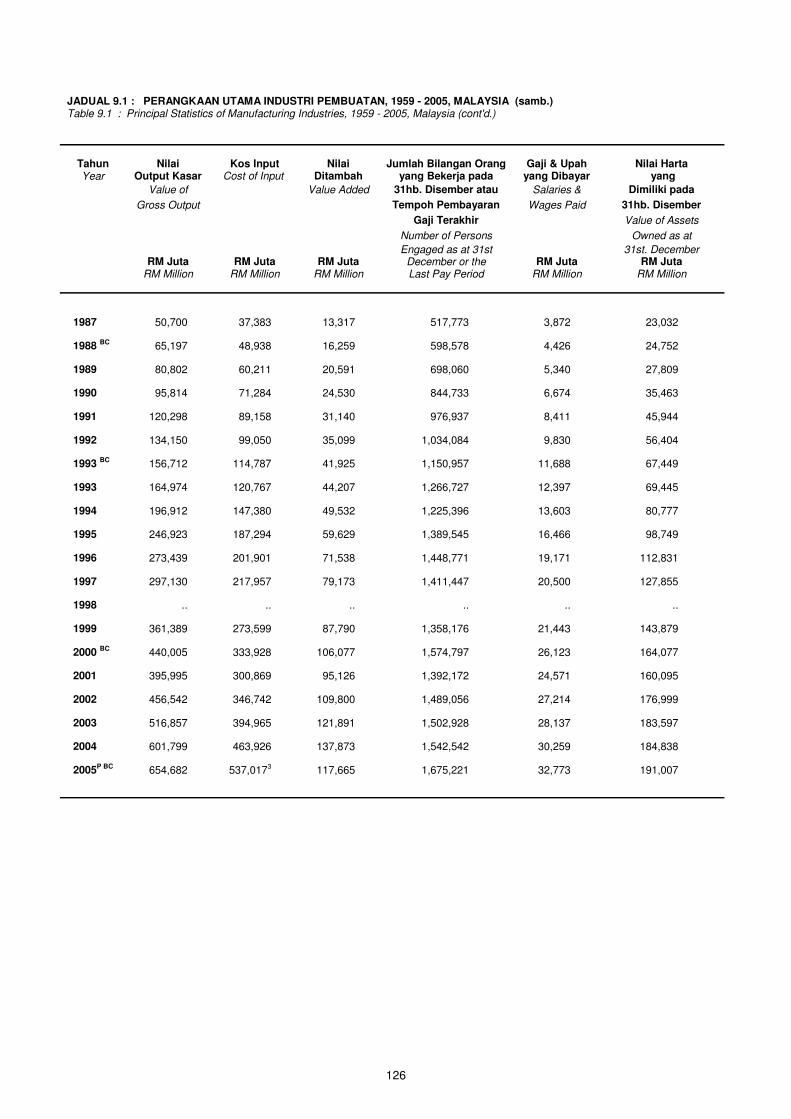
126
JADUAL 9.1 : PERANGKAAN UTAMA INDUSTRI PEMBUATAN, 1959 - 2005, MALAYSIA (samb.) Table 9.1 : Principal Statistics of Manufacturing Industries, 1959 - 2005, Malaysia (cont'd.)
Tahun Nilai Kos Input Nilai Jumlah Bilangan Orang Gaji & Upah Nilai Harta
Year Output Kasar Cost of Input Ditambah yang Bekerja pada yang Dibayar yang
Value of
Value Added 31hb. Disember atau Salaries & Dimiliki pada
Gross Output
Tempoh Pembayaran Wages Paid 31hb. Disember
Gaji Terakhir Value of Assets
Number of Persons Owned as at
Engaged as at 31st 31st. December RM Juta RM Juta RM Juta December or the RM Juta RM Juta
RM Million RM Million RM Million Last Pay Period RM Million RM Million
1987 50,700 37,383 13,317 517,773 3,872 23,032
1988 BC 65,197 48,938 16,259 598,578 4,426 24,752
1989 80,802 60,211 20,591 698,060 5,340 27,809
1990 95,814 71,284 24,530 844,733 6,674 35,463
1991 120,298 89,158 31,140 976,937 8,411 45,944
1992 134,150 99,050 35,099 1,034,084 9,830 56,404
1993 BC 156,712 114,787 41,925 1,150,957 11,688 67,449
1993 164,974 120,767 44,207 1,266,727 12,397 69,445
1994 196,912 147,380 49,532 1,225,396 13,603 80,777
1995 246,923 187,294 59,629 1,389,545 16,466 98,749
1996 273,439 201,901 71,538 1,448,771 19,171 112,831
1997 297,130 217,957 79,173 1,411,447 20,500 127,855
1998 .. .. .. .. .. ..
1999 361,389 273,599 87,790 1,358,176 21,443 143,879
2000 BC 440,005 333,928 106,077 1,574,797 26,123 164,077
2001 395,995 300,869 95,126 1,392,172 24,571 160,095
2002 456,542 346,742 109,800 1,489,056 27,214 176,999
2003 516,857 394,965 121,891 1,502,928 28,137 183,597
2005P BC 654,682 537,0173 117,665 1,675,221 32,773 191,007
2004 601,799 463,926 137,873 1,542,542 30,259 184,838


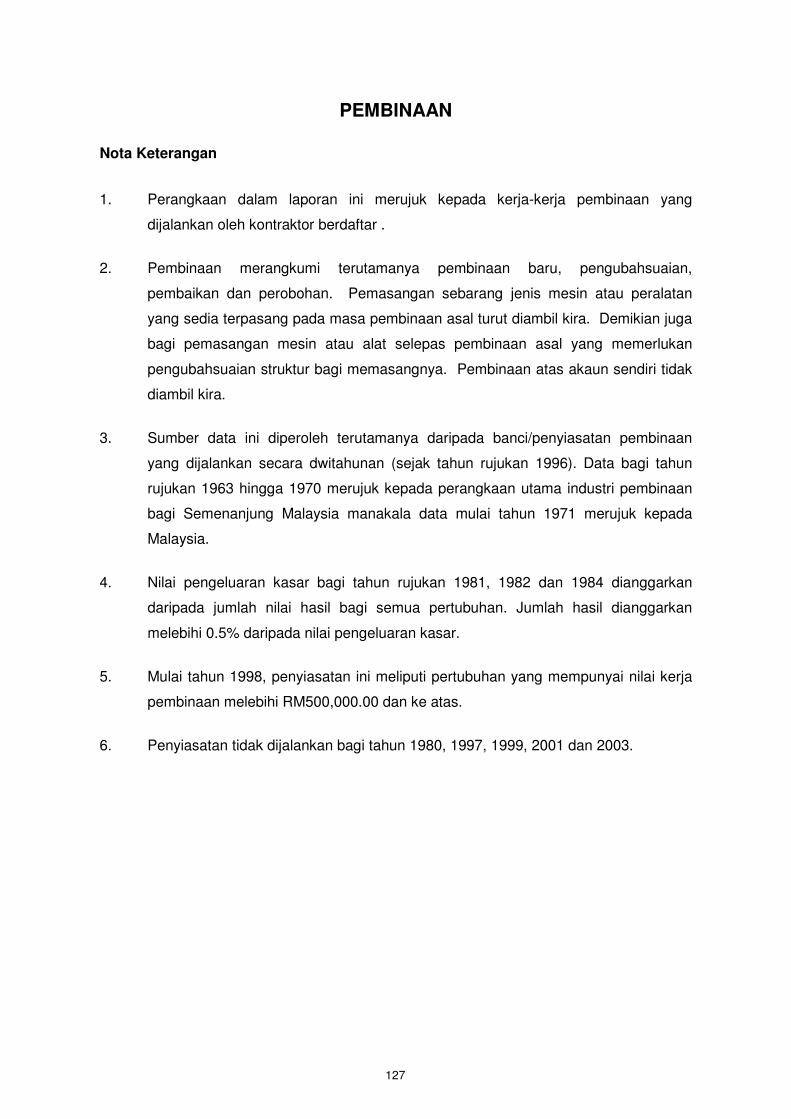
PEMBINAAN
Nota Keterangan
1. Perangkaan dalam laporan ini merujuk kepada kerja-kerja pembinaan yang
dijalankan oleh kontraktor berdaftar .
2. Pembinaan merangkumi terutamanya pembinaan baru, pengubahsuaian,
pembaikan dan perobohan. Pemasangan sebarang jenis mesin atau peralatan
yang sedia terpasang pada masa pembinaan asal turut diambil kira. Demikian juga
bagi pemasangan mesin atau alat selepas pembinaan asal yang memerlukan
pengubahsuaian struktur bagi memasangnya. Pembinaan atas akaun sendiri tidak
diambil kira.
3. Sumber data ini diperoleh terutamanya daripada banci/penyiasatan pembinaan
yang dijalankan secara dwitahunan (sejak tahun rujukan 1996). Data bagi tahun
rujukan 1963 hingga 1970 merujuk kepada perangkaan utama industri pembinaan
bagi Semenanjung Malaysia manakala data mulai tahun 1971 merujuk kepada
Malaysia.
4. Nilai pengeluaran kasar bagi tahun rujukan 1981, 1982 dan 1984 dianggarkan
daripada jumlah nilai hasil bagi semua pertubuhan. Jumlah hasil dianggarkan
melebihi 0.5% daripada nilai pengeluaran kasar.
5. Mulai tahun 1998, penyiasatan ini meliputi pertubuhan yang mempunyai nilai kerja
pembinaan melebihi RM500,000.00 dan ke atas.
6. Penyiasatan tidak dijalankan bagi tahun 1980, 1997, 1999, 2001 dan 2003.
127
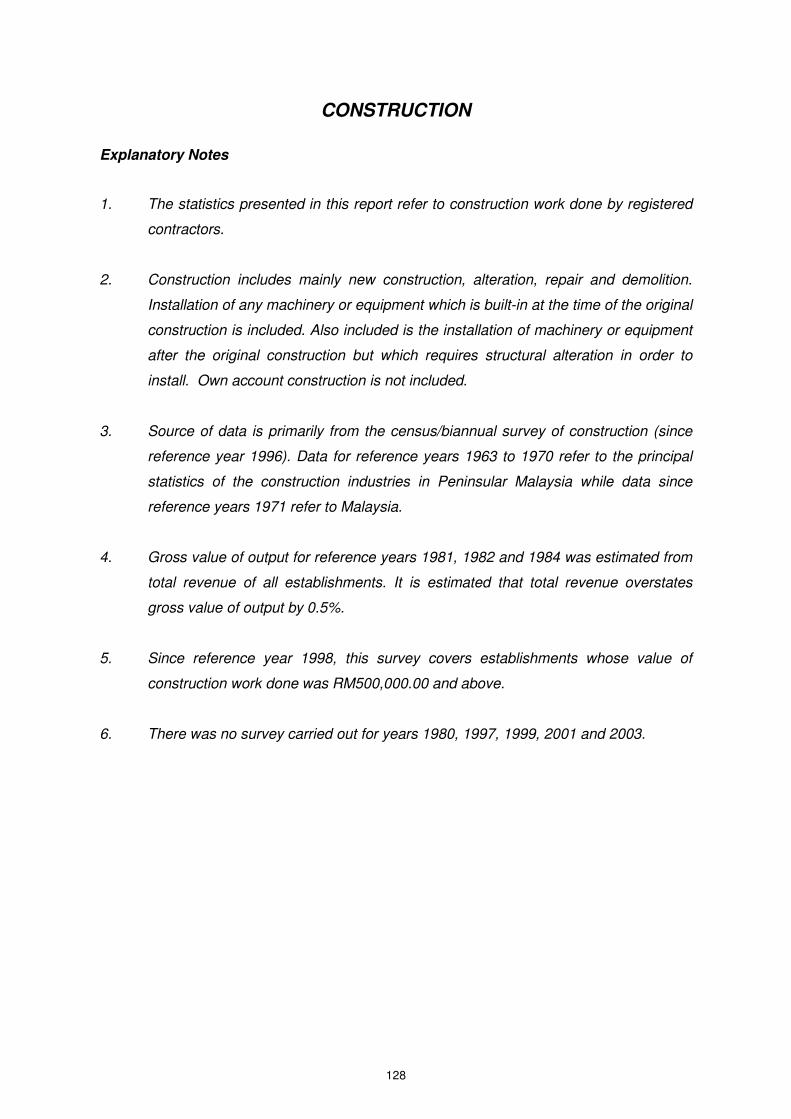
CONSTRUCTION
Explanatory Notes
1. The statistics presented in this report refer to construction work done by registered
contractors.
2. Construction includes mainly new construction, alteration, repair and demolition.
Installation of any machinery or equipment which is built-in at the time of the original
construction is included. Also included is the installation of machinery or equipment
after the original construction but which requires structural alteration in order to
install. Own account construction is not included.
3. Source of data is primarily from the census/biannual survey of construction (since
reference year 1996). Data for reference years 1963 to 1970 refer to the principal
statistics of the construction industries in Peninsular Malaysia while data since
reference years 1971 refer to Malaysia.
4. Gross value of output for reference years 1981, 1982 and 1984 was estimated from
total revenue of all establishments. It is estimated that total revenue overstates
gross value of output by 0.5%.
5. Since reference year 1998, this survey covers establishments whose value of
construction work done was RM500,000.00 and above.
6. There was no survey carried out for years 1980, 1997, 1999, 2001 and 2003.
128
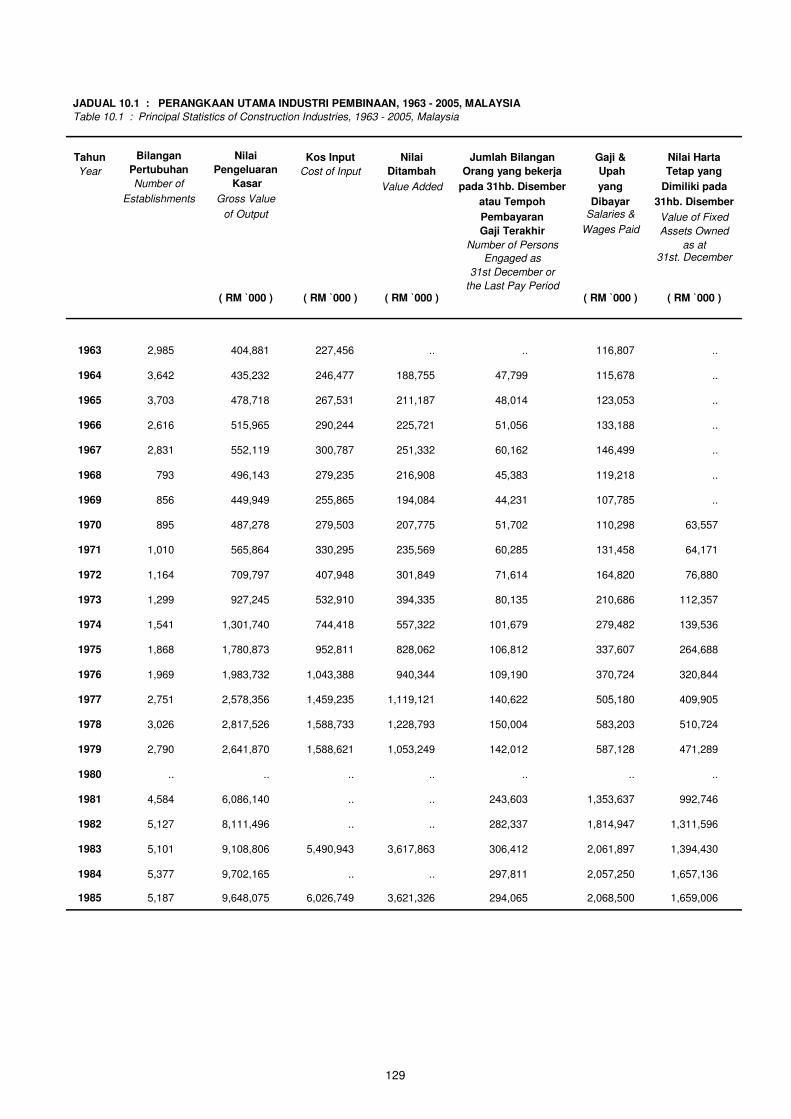
JADUAL 10.1 : PERANGKAAN UTAMA INDUSTRI PEMBINAAN, 1963 - 2005, MALAYSIA
Table 10.1 : Principal Statistics of Construction Industries, 1963 - 2005, Malaysia
Tahun Bilangan Nilai Kos Input Nilai Jumlah Bilangan Gaji & Nilai Harta
Year Pertubuhan Pengeluaran Cost of Input Ditambah Orang yang bekerja Upah Tetap yang
Number of Kasar Value Added pada 31hb. Disember yang Dimiliki pada
Establishments Gross Value
atau Tempoh Dibayar 31hb. Disember
of Output
Pembayaran
Salaries & Value of Fixed
Gaji Terakhir Wages Paid Assets Owned
Number of Persons as at
Engaged as 31st. December
31st December or
the Last Pay Period
( RM `000 ) ( RM `000 ) ( RM `000 ) ( RM `000 ) ( RM `000 )
1963 2,985 404,881 227,456 .. .. 116,807 ..
1964 3,642 435,232 246,477 188,755 47,799 115,678 ..
1965 3,703 478,718 267,531 211,187 48,014 123,053 ..
1966 2,616 515,965 290,244 225,721 51,056 133,188 ..
1967 2,831 552,119 300,787 251,332 60,162 146,499 ..
1968 793 496,143 279,235 216,908 45,383 119,218 ..
1969 856 449,949 255,865 194,084 44,231 107,785 ..
1970 895 487,278 279,503 207,775 51,702 110,298 63,557
1971 1,010 565,864 330,295 235,569 60,285 131,458 64,171
1972 1,164 709,797 407,948 301,849 71,614 164,820 76,880
1973 1,299 927,245 532,910 394,335 80,135 210,686 112,357
1974 1,541 1,301,740 744,418 557,322 101,679 279,482 139,536
1975 1,868 1,780,873 952,811 828,062 106,812 337,607 264,688
1976 1,969 1,983,732 1,043,388 940,344 109,190 370,724 320,844
1977 2,751 2,578,356 1,459,235 1,119,121 140,622 505,180 409,905
1978 3,026 2,817,526 1,588,733 1,228,793 150,004 583,203 510,724
1979 2,790 2,641,870 1,588,621 1,053,249 142,012 587,128 471,289
1980 .. .. .. .. .. .. ..
1981 4,584 6,086,140 .. .. 243,603 1,353,637 992,746
1982 5,127 8,111,496 .. .. 282,337 1,814,947 1,311,596
1983 5,101 9,108,806 5,490,943 3,617,863 306,412 2,061,897 1,394,430
1984 5,377 9,702,165 .. .. 297,811 2,057,250 1,657,136
1985 5,187 9,648,075 6,026,749 3,621,326 294,065 2,068,500 1,659,006
129
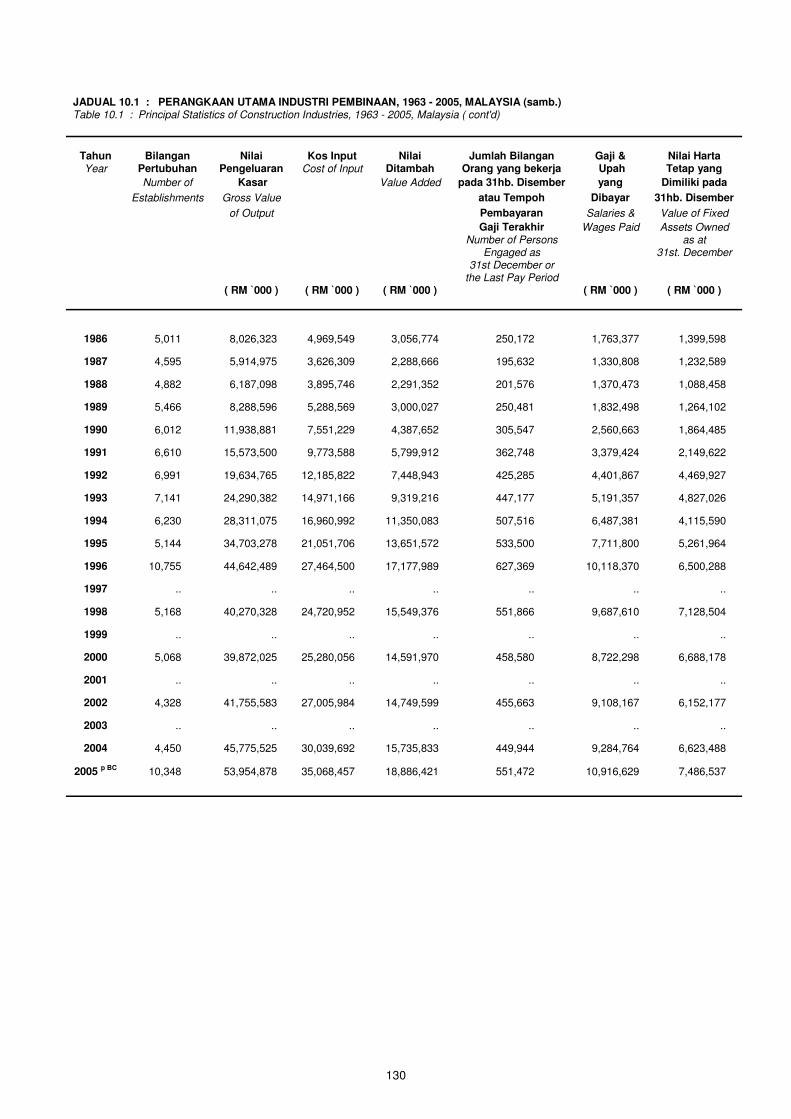
JADUAL 10.1 : PERANGKAAN UTAMA INDUSTRI PEMBINAAN, 1963 - 2005, MALAYSIA (samb.) Table 10.1 : Principal Statistics of Construction Industries, 1963 - 2005, Malaysia ( cont'd)
Tahun Bilangan Nilai Kos Input Nilai Jumlah Bilangan Gaji & Nilai Harta
Year Pertubuhan Pengeluaran Cost of Input Ditambah Orang yang bekerja Upah Tetap yang
Number of Kasar
Value Added pada 31hb. Disember yang Dimiliki pada
Establishments Gross Value
atau Tempoh Dibayar 31hb. Disember
of Output
Pembayaran Salaries & Value of Fixed
Gaji Terakhir Wages Paid Assets Owned Number of Persons as at Engaged as 31st. December 31st December or the Last Pay Period ( RM `000 ) ( RM `000 ) ( RM `000 ) ( RM `000 ) ( RM `000 )
1986 5,011 8,026,323 4,969,549 3,056,774 250,172 1,763,377 1,399,598
1987 4,595 5,914,975 3,626,309 2,288,666 195,632 1,330,808 1,232,589
1988 4,882 6,187,098 3,895,746 2,291,352 201,576 1,370,473 1,088,458
1989 5,466 8,288,596 5,288,569 3,000,027 250,481 1,832,498 1,264,102
1990 6,012 11,938,881 7,551,229 4,387,652 305,547 2,560,663 1,864,485
1991 6,610 15,573,500 9,773,588 5,799,912 362,748 3,379,424 2,149,622
1992 6,991 19,634,765 12,185,822 7,448,943 425,285 4,401,867 4,469,927
1993 7,141 24,290,382 14,971,166 9,319,216 447,177 5,191,357 4,827,026
1994 6,230 28,311,075 16,960,992 11,350,083 507,516 6,487,381 4,115,590
1995 5,144 34,703,278 21,051,706 13,651,572 533,500 7,711,800 5,261,964
1996 10,755 44,642,489 27,464,500 17,177,989 627,369 10,118,370 6,500,288
1997 .. .. .. .. .. .. ..
1998 5,168 40,270,328 24,720,952 15,549,376 551,866 9,687,610 7,128,504
1999 .. .. .. .. .. .. ..
2000 5,068 39,872,025 25,280,056 14,591,970 458,580 8,722,298 6,688,178
2001 .. .. .. .. .. .. ..
2002 4,328 41,755,583 27,005,984 14,749,599 455,663 9,108,167 6,152,177
2003 .. .. .. .. .. .. ..
2004 4,450 45,775,525 30,039,692 15,735,833 449,944 9,284,764 6,623,488
2005 p BC 10,348 53,954,878 35,068,457 18,886,421 551,472 10,916,629 7,486,537
130

131
PERLOMBONGAN
Nota Keterangan
1. Data bagi sektor ini merangkumi perlombongan bijih besi, perlombongan bijih timah,
pembilasan amang, perlombongan bauksit, perlombongan antimoni, perlombongan
emas, perlombongan tembaga, perlombongan barite, perlombongan petroleum
mentah dan gas asli.
2. Data bagi perlombongan antimoni, perlombongan tembaga, perlombongan petroleum
mentah dan perlombongan gas asli mula diambil kira sejak tahun 1981.
3. Sumber utama data adalah Banci Tahunan Industri Perlombongan yang mana telah
dimulakan pada tahun rujukan 1963. Sejak itu, banci dijalankan seperti biasa kecuali
bagi tahun rujukan 1980, 1982, 1994, 1996 dan 1998. Bagi tahun 2001 hingga 2004,
data hanya merujuk kepada Banci Petroleum Mentah dan Gas Asli sahaja.
4. Pengeluaran bersih Gas Asli bagi tahun 1973 hingga 1982 dalam Jadual 11.2 hanya
merangkumi pengeluaran Kasar bagi Gas Asli Bersekutu. Dari 1983 dan seterusnya,
data merangkumi kedua-dua Gas Asli Bersekutu dan Tidak Bersekutu.
PENGKUARIAN BATU
Nota Keterangan
1. Data diperoleh daripada Banci Pengkuarian Batu. Banci yang pertama telah mula
dijalankan pada tahun rujukan 1972. Data bagi tahun rujukan 1973 merujuk kepada
Semenanjung Malaysia sahaja. Walau bagaimanapun, banci tidak dijalankan bagi
tahun rujukan 1980, 1982, 1994, 1996, 1997, 1999 dan 2001 hingga 2004.
132
MINING
Explanatory Notes
1. Data on this sector include iron ore mining, tin ore mining, amang retreatment,
bauxite mining, antimony mining, gold mining, copper mining, barite mining, crude
petroleum and natural gas mining.
2. Data on antimony mining, copper mining, crude petroleum and natural gas mining are
included from reference year 1981.
3. The main source of data is the Annual Census of Mining Industries which was first
conducted for reference year 1963. Since then, the census has been canvassed on a
regular basis except for reference years 1980, 1982, 1994, 1996 and 1998. In 2001 to
2004, data refer to crude petroleum and natural gas only.
4. Net production of Natural Gas for years 1973 to 1982 in Table 11.2 includes only
Gross Production of Associated Natural Gas. From 1983 onwards, the data include
both Associated and Non-Associated Natural Gas.
STONE QUARRYING
Explanatory Notes
1. Data was compiled from the Annual Census of Stone Quarrying Industries. The first
census was carried out for reference year 1972. Data for reference year 1973 refer to
Peninsular Malaysia only. There was no census carried out for reference years 1980,
1982, 1994, 1996, 1997, 1999 and from 2001 until 2004.
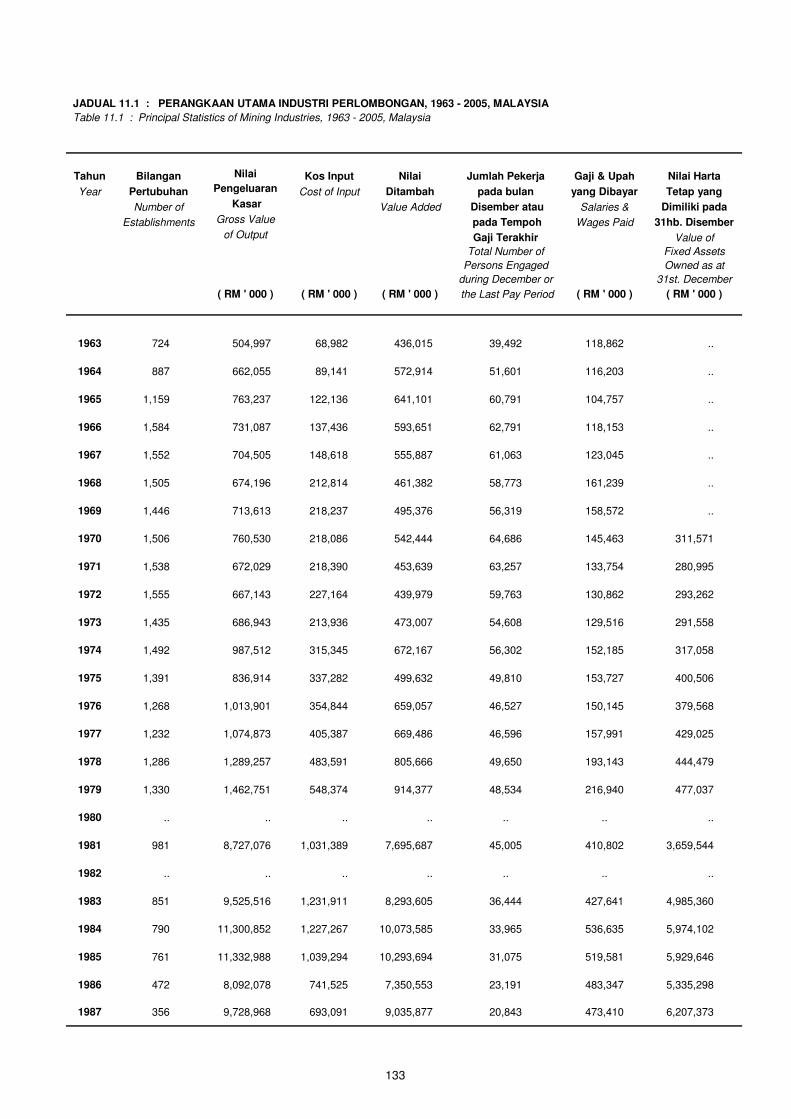
JADUAL 11.1 : PERANGKAAN UTAMA INDUSTRI PERLOMBONGAN, 1963 - 2005, MALAYSIA
Table 11.1 : Principal Statistics of Mining Industries, 1963 - 2005, Malaysia
Tahun Bilangan
Nilai Kos Input Nilai Jumlah Pekerja Gaji & Upah Nilai Harta
Year Pertubuhan
Pengeluaran Cost of Input Ditambah pada bulan yang Dibayar Tetap yang
Number of Kasar Value Added Disember atau Salaries & Dimiliki pada
Establishments
Gross Value pada Tempoh Wages Paid 31hb. Disember
of Output Gaji Terakhir Value of
Total Number of Fixed Assets
Persons Engaged Owned as at
during December or 31st. December
( RM ' 000 ) ( RM ' 000 ) ( RM ' 000 ) the Last Pay Period ( RM ' 000 ) ( RM ' 000 )
1963 724 504,997 68,982 436,015 39,492 118,862 ..
1964 887 662,055 89,141 572,914 51,601 116,203 ..
1965 1,159 763,237 122,136 641,101 60,791 104,757 ..
1966 1,584 731,087 137,436 593,651 62,791 118,153 ..
1967 1,552 704,505 148,618 555,887 61,063 123,045 ..
1968 1,505 674,196 212,814 461,382 58,773 161,239 ..
1969 1,446 713,613 218,237 495,376 56,319 158,572 ..
1970 1,506 760,530 218,086 542,444 64,686 145,463 311,571
1971 1,538 672,029 218,390 453,639 63,257 133,754 280,995
1972 1,555 667,143 227,164 439,979 59,763 130,862 293,262
1973 1,435 686,943 213,936 473,007 54,608 129,516 291,558
1974 1,492 987,512 315,345 672,167 56,302 152,185 317,058
1975 1,391 836,914 337,282 499,632 49,810 153,727 400,506
1976 1,268 1,013,901 354,844 659,057 46,527 150,145 379,568
1977 1,232 1,074,873 405,387 669,486 46,596 157,991 429,025
1978 1,286 1,289,257 483,591 805,666 49,650 193,143 444,479
1979 1,330 1,462,751 548,374 914,377 48,534 216,940 477,037
1980 .. .. .. .. .. .. ..
1981 981 8,727,076 1,031,389 7,695,687 45,005 410,802 3,659,544
1982 .. .. .. .. .. .. ..
1983 851 9,525,516 1,231,911 8,293,605 36,444 427,641 4,985,360
1984 790 11,300,852 1,227,267 10,073,585 33,965 536,635 5,974,102
1985 761 11,332,988 1,039,294 10,293,694 31,075 519,581 5,929,646
1986 472 8,092,078 741,525 7,350,553 23,191 483,347 5,335,298
1987 356 9,728,968 693,091 9,035,877 20,843 473,410 6,207,373
133
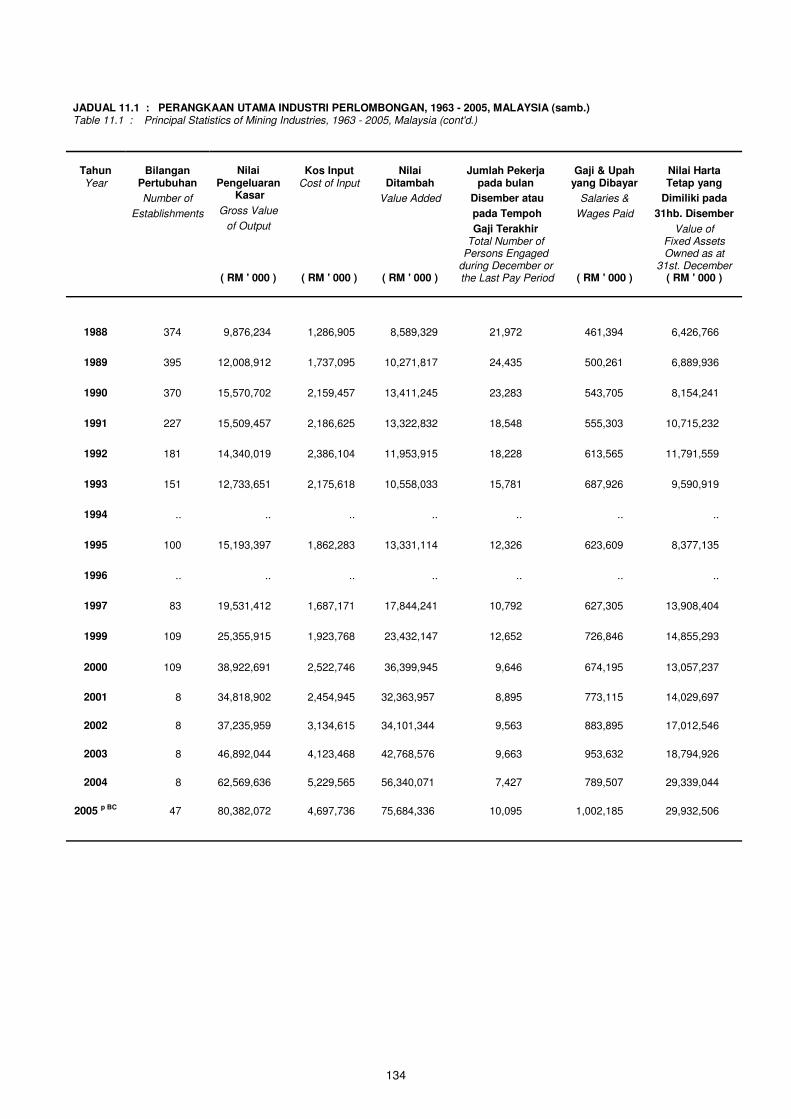
JADUAL 11.1 : PERANGKAAN UTAMA INDUSTRI PERLOMBONGAN, 1963 - 2005, MALAYSIA (samb.) Table 11.1 : Principal Statistics of Mining Industries, 1963 - 2005, Malaysia (cont'd.)
Tahun Bilangan Nilai Kos Input Nilai Jumlah Pekerja Gaji & Upah Nilai Harta
Year Pertubuhan Pengeluaran Cost of Input Ditambah pada bulan yang Dibayar Tetap yang
Number of Kasar Value Added Disember atau Salaries & Dimiliki pada
Establishments
Gross Value
pada Tempoh Wages Paid 31hb. Disember
of Output Gaji Terakhir Value of
Total Number of Fixed Assets
Persons Engaged Owned as at during December or 31st. December ( RM ' 000 ) ( RM ' 000 ) ( RM ' 000 ) the Last Pay Period ( RM ' 000 ) ( RM ' 000 )
1988 374 9,876,234 1,286,905 8,589,329 21,972 461,394 6,426,766
1989 395 12,008,912 1,737,095 10,271,817 24,435 500,261 6,889,936
1990 370 15,570,702 2,159,457 13,411,245 23,283 543,705 8,154,241
1991 227 15,509,457 2,186,625 13,322,832 18,548 555,303 10,715,232
1992 181 14,340,019 2,386,104 11,953,915 18,228 613,565 11,791,559
1993 151 12,733,651 2,175,618 10,558,033 15,781 687,926 9,590,919
1994 .. .. .. .. .. .. ..
1995 100 15,193,397 1,862,283 13,331,114 12,326 623,609 8,377,135
1996 .. .. .. .. .. .. ..
1997 83 19,531,412 1,687,171 17,844,241 10,792 627,305 13,908,404
1999 109 25,355,915 1,923,768 23,432,147 12,652 726,846 14,855,293
2000 109 38,922,691 2,522,746 36,399,945 9,646 674,195 13,057,237
2001 8 34,818,902 2,454,945 32,363,957 8,895 773,115 14,029,697
2002 8 37,235,959 3,134,615 34,101,344 9,563 883,895 17,012,546
2003 8 46,892,044 4,123,468 42,768,576 9,663 953,632 18,794,926
2004 8 62,569,636 5,229,565 56,340,071 7,427 789,507 29,339,044
2005 p BC 47 80,382,072 4,697,736 75,684,336 10,095 1,002,185 29,932,506
134
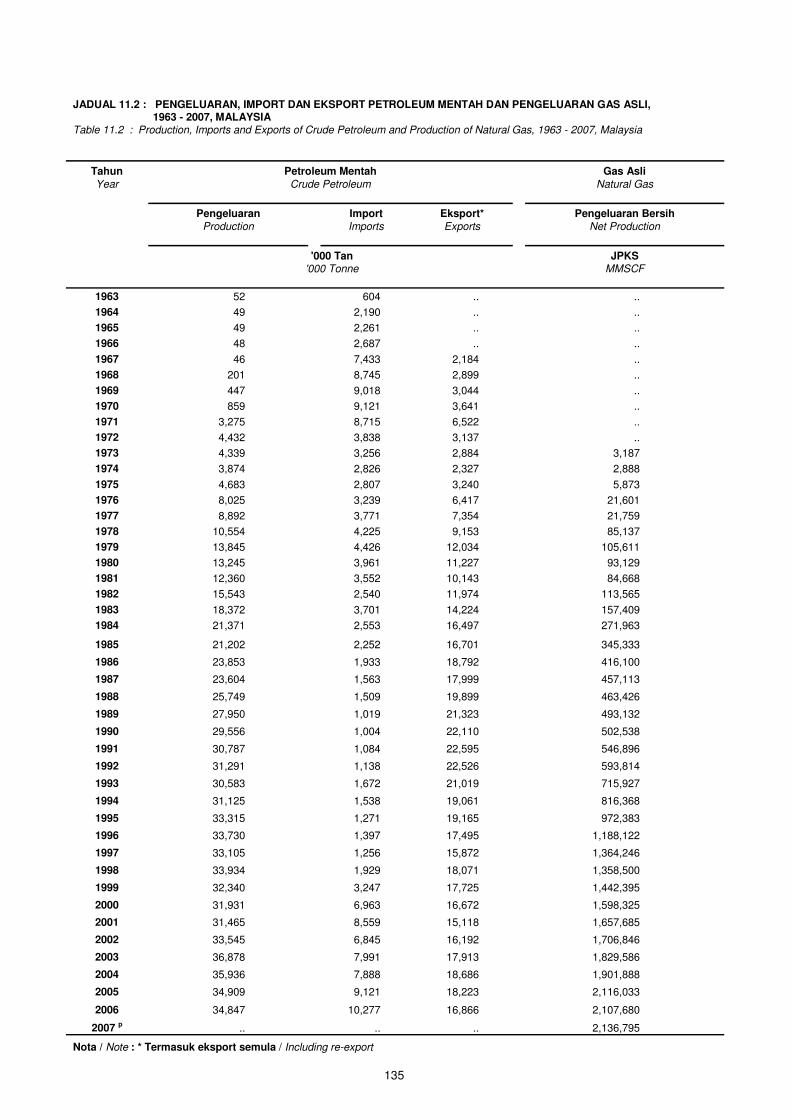
JADUAL 11.2 : PENGELUARAN, IMPORT DAN EKSPORT PETROLEUM MENTAH DAN PENGELUARAN GAS ASLI, 1963 - 2007, MALAYSIA Table 11.2 : Production, Imports and Exports of Crude Petroleum and Production of Natural Gas, 1963 - 2007, Malaysia
Tahun Petroleum Mentah Gas Asli Year Crude Petroleum Natural Gas
Pengeluaran Import Eksport* Pengeluaran Bersih
Production Imports Exports Net Production
'000 Tan JPKS
'000 Tonne MMSCF
1963 52 604 .. ..
1964 49 2,190 .. ..
1965 49 2,261 .. ..
1966 48 2,687 .. ..
1967 46 7,433 2,184 ..
1968 201 8,745 2,899 ..
1969 447 9,018 3,044 ..
1970 859 9,121 3,641 ..
1971 3,275 8,715 6,522 ..
1972 4,432 3,838 3,137 ..
1973 4,339 3,256 2,884 3,187
1974 3,874 2,826 2,327 2,888
1975 4,683 2,807 3,240 5,873
1976 8,025 3,239 6,417 21,601
1977 8,892 3,771 7,354 21,759
1978 10,554 4,225 9,153 85,137
1979 13,845 4,426 12,034 105,611
1980 13,245 3,961 11,227 93,129
1981 12,360 3,552 10,143 84,668
1982 15,543 2,540 11,974 113,565
1983 18,372 3,701 14,224 157,409
1984 21,371 2,553 16,497 271,963
1985 21,202 2,252 16,701
345,333
1986 23,853 1,933 18,792
416,100
1987 23,604 1,563 17,999
457,113
1988 25,749 1,509 19,899
463,426
1989 27,950 1,019 21,323
493,132
1990 29,556 1,004 22,110
502,538
1991 30,787 1,084 22,595
546,896
1992 31,291 1,138 22,526
593,814
1993 30,583 1,672 21,019
715,927
1994 31,125 1,538 19,061
816,368
1995 33,315 1,271 19,165
972,383
1996 33,730 1,397 17,495
1,188,122
1997 33,105 1,256 15,872
1,364,246
1998 33,934 1,929 18,071
1,358,500
1999 32,340 3,247 17,725
1,442,395
2000 31,931 6,963 16,672
1,598,325
2001 31,465 8,559 15,118
1,657,685
2002 33,545 6,845 16,192
1,706,846
2003 36,878 7,991 17,913
1,829,586
2004 35,936 7,888 18,686
1,901,888
2005 34,909 9,121 18,223
2,116,033
2006 34,847 10,277 16,866
2,107,680
2007 p .. .. .. 2,136,795
Nota / Note : * Termasuk eksport semula / Including re-export
135
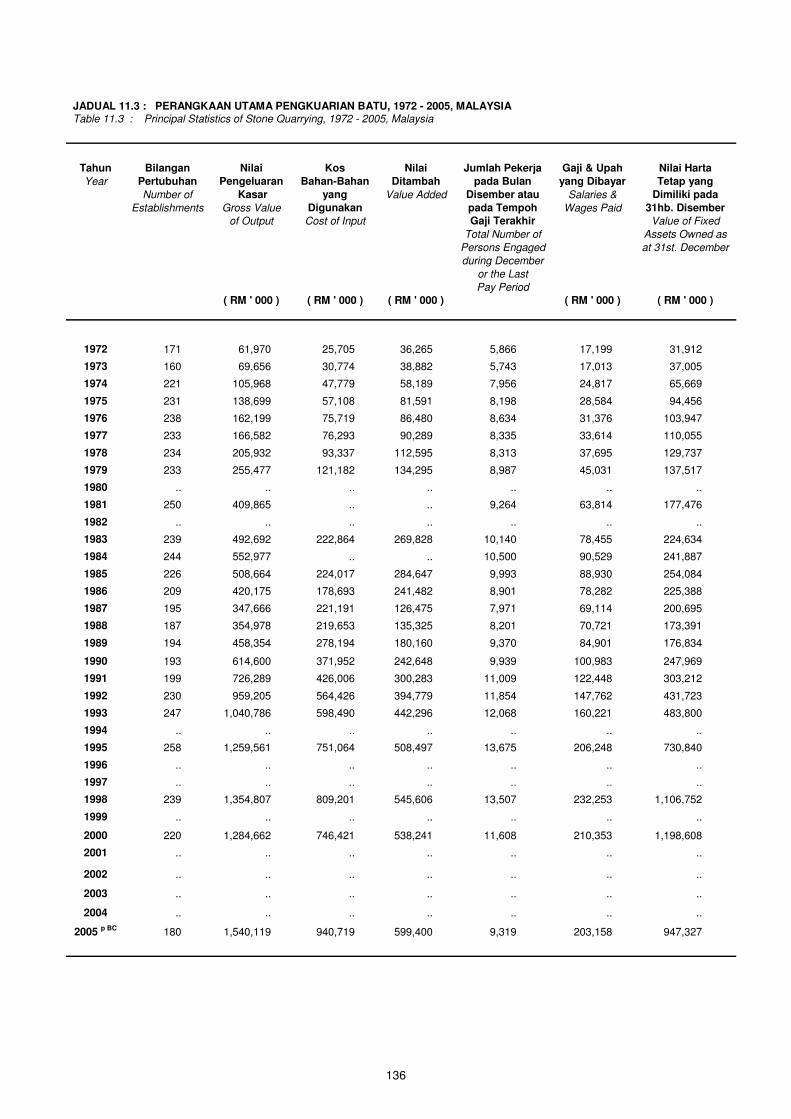
JADUAL 11.3 : PERANGKAAN UTAMA PENGKUARIAN BATU, 1972 - 2005, MALAYSIA Table 11.3 : Principal Statistics of Stone Quarrying, 1972 - 2005, Malaysia
Tahun Bilangan Nilai Kos Nilai Jumlah Pekerja Gaji & Upah Nilai Harta
Year Pertubuhan Pengeluaran Bahan-Bahan Ditambah pada Bulan yang Dibayar Tetap yang
Number of Kasar yang Value Added Disember atau Salaries & Dimiliki pada
Establishments Gross Value Digunakan pada Tempoh Wages Paid 31hb. Disember
of Output Cost of Input Gaji Terakhir Value of Fixed
Total Number of Assets Owned as
Persons Engaged at 31st. December
during December
or the Last
Pay Period
( RM ' 000 ) ( RM ' 000 ) ( RM ' 000 ) ( RM ' 000 ) ( RM ' 000 )
1972 171 61,970 25,705 36,265 5,866 17,199 31,912
1973 160 69,656 30,774 38,882 5,743 17,013 37,005
1974 221 105,968 47,779 58,189 7,956 24,817 65,669
1975 231 138,699 57,108 81,591 8,198 28,584 94,456
1976 238 162,199 75,719 86,480 8,634 31,376 103,947
1977 233 166,582 76,293 90,289 8,335 33,614 110,055
1978 234 205,932 93,337 112,595 8,313 37,695 129,737
1979 233 255,477 121,182 134,295 8,987 45,031 137,517
1980 .. .. .. .. .. .. ..
1981 250 409,865 .. .. 9,264 63,814 177,476
1982 .. .. .. .. .. .. ..
1983 239 492,692 222,864 269,828 10,140 78,455 224,634
1984 244 552,977 .. .. 10,500 90,529 241,887
1985 226 508,664 224,017 284,647 9,993 88,930 254,084
1986 209 420,175 178,693 241,482 8,901 78,282 225,388
1987 195 347,666 221,191 126,475 7,971 69,114 200,695
1988 187 354,978 219,653 135,325 8,201 70,721 173,391
1989 194 458,354 278,194 180,160 9,370 84,901 176,834
1990 193 614,600 371,952 242,648 9,939 100,983 247,969
1991 199 726,289 426,006 300,283 11,009 122,448 303,212
1992 230 959,205 564,426 394,779 11,854 147,762 431,723
1993 247 1,040,786 598,490 442,296 12,068 160,221 483,800
1994 .. .. .. .. .. .. ..
1995 258 1,259,561 751,064 508,497 13,675 206,248 730,840
1996 .. .. .. .. .. .. ..
1997 .. .. .. .. .. .. ..
1998 239 1,354,807 809,201 545,606 13,507 232,253 1,106,752
1999 .. .. .. .. .. .. ..
2000 220 1,284,662 746,421 538,241 11,608 210,353 1,198,608
2005 p BC 180 1,540,119 940,719 599,400 9,319 203,158 947,327
2001 .. .. .. .. .. .. ..
2002 .. .. .. .. .. .. ..
2003 .. .. .. .. .. .. ..
2004 .. .. .. .. .. .. ..
136


ELEKTRIK
Nota Keterangan
1. Data menunjukkan jumlah penjanaan elektrik di dalam negara. Jumlah bekalan
ditunjukkan secara berasingan bagi pemasangan perbadanan awam (TNB, SESB
dan SESCO) dan pemasangan swasta.
2. Data bagi tenaga elektrik yang dieksport/import merujuk kepada eksport/import
tenaga elektrik ke/dari negara Thailand/Singapura.
3. Sumber data tenaga elektrik diperoleh daripada Tenaga Nasional Berhad (TNB),
Sabah Elektrik Sdn. Bhd. (SESB), Perbadanan Bekalan Elektrik Sarawak (SESCO)
dan pengeluar tenaga bebas.
ELECTRICITY
Explanatory Notes
1 Data refer to total electricity generated in the country. Total supply is shown
separately for public corporations (TNB, SESB and SESCO) and private
installations.
2. Data on electricity exported/imported refer to the export/import of electricity to/from
Thailand/Singapore.
3. Data are sourced from Tenaga Nasional Berhad (TNB), Sabah Electricity Sdn. Bhd.
(SESB), Sarawak Electricity Supply Corporation (SESCO) and independent power
producers.
137

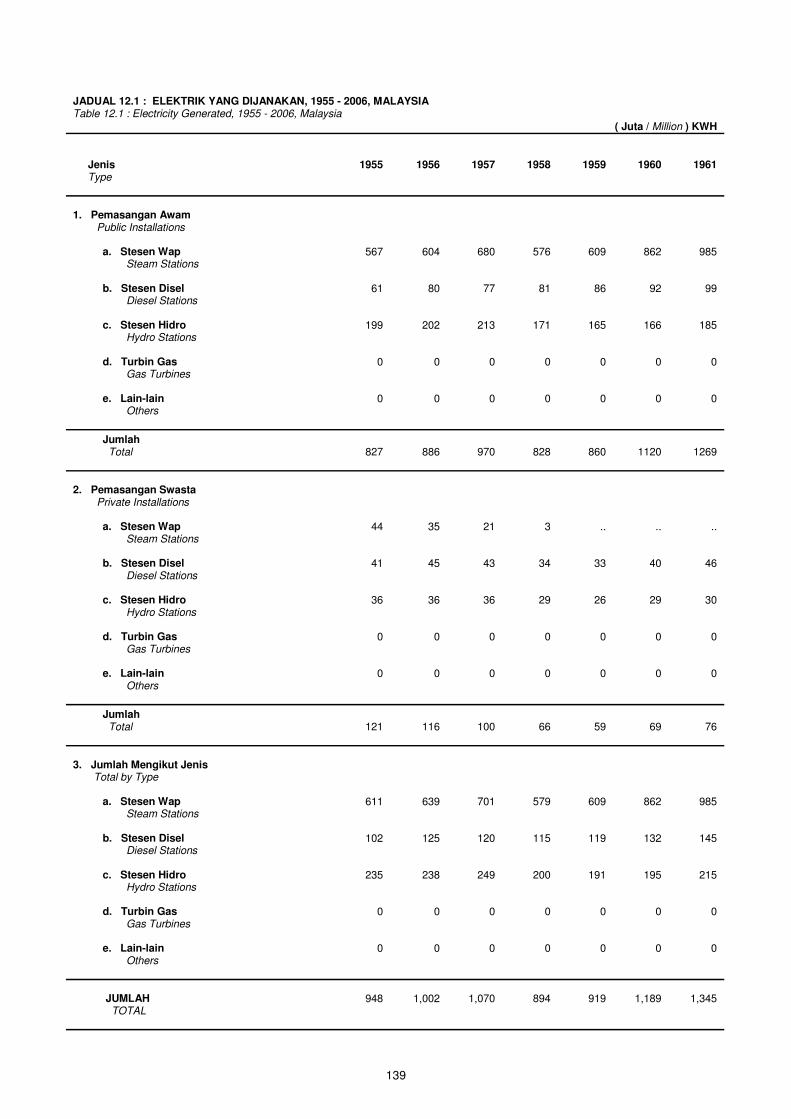
JADUAL 12.1 : ELEKTRIK YANG DIJANAKAN, 1955 - 2006, MALAYSIA Table 12.1 : Electricity Generated, 1955 - 2006, Malaysia
( Juta / Million ) KWH
Jenis 1955 1956 1957 1958 1959 1960 1961
Type
1. Pemasangan Awam Public Installations a. Stesen Wap 567 604 680 576 609 862 985
Steam Stations b. Stesen Disel 61 80 77 81 86 92 99
Diesel Stations c. Stesen Hidro 199 202 213 171 165 166 185
Hydro Stations d. Turbin Gas 0 0 0 0 0 0 0
Gas Turbines e. Lain-lain 0 0 0 0 0 0 0
Others
Jumlah
Total
2. Pemasangan Swasta Private Installations a. Stesen Wap 44 35 21 3 .. .. .. Steam Stations b. Stesen Disel 41 45 43 34 33 40 46
Diesel Stations c. Stesen Hidro 36 36 36 29 26 29 30
Hydro Stations d. Turbin Gas 0 0 0 0 0 0 0
Gas Turbines e. Lain-lain 0 0 0 0 0 0 0
Others
Jumlah
Total 121 116 100 66 59 69 76
3. Jumlah Mengikut Jenis Total by Type a. Stesen Wap 611 639 701 579 609 862 985
Steam Stations b. Stesen Disel 102 125 120 115 119 132 145
Diesel Stations c. Stesen Hidro 235 238 249 200 191 195 215
Hydro Stations d. Turbin Gas 0 0 0 0 0 0 0
Gas Turbines e. Lain-lain 0 0 0 0 0 0 0
Others
JUMLAH 948 1,002 1,070 894 919 1,189 1,345
TOTAL
827 886 970 828 860 1120 1269
139
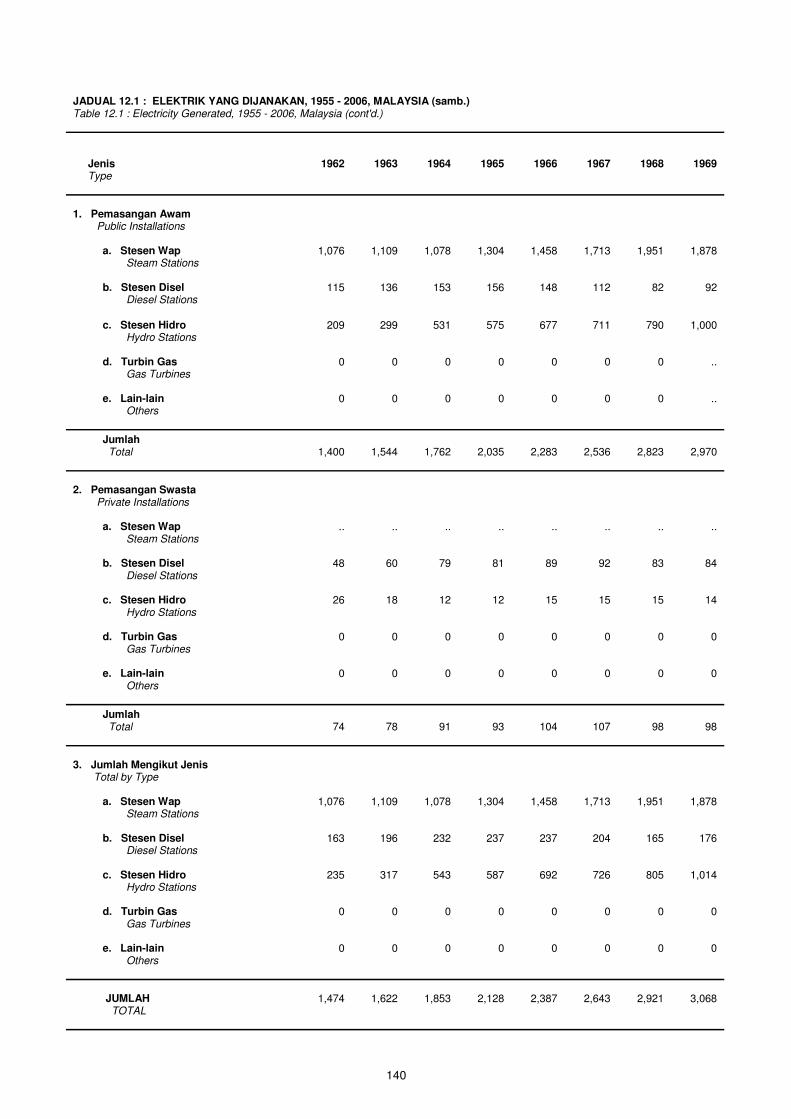
JADUAL 12.1 : ELEKTRIK YANG DIJANAKAN, 1955 - 2006, MALAYSIA (samb.) Table 12.1 : Electricity Generated, 1955 - 2006, Malaysia (cont'd.)
Jenis 1962 1963 1964 1965 1966 1967 1968 1969
Type
1. Pemasangan Awam Public Installations a. Stesen Wap 1,076 1,109 1,078 1,304 1,458 1,713 1,951 1,878
Steam Stations b. Stesen Disel 115 136 153 156 148 112 82 92
Diesel Stations
c. Stesen Hidro 209 299 531 575 677 711 790 1,000
Hydro Stations d. Turbin Gas 0 0 0 0 0 0 0 .. Gas Turbines e. Lain-lain 0 0 0 0 0 0 0 .. Others
Jumlah
Total 1,400 1,544 1,762 2,035 2,283 2,536 2,823 2,970
2. Pemasangan Swasta Private Installations a. Stesen Wap .. .. .. .. .. .. .. .. Steam Stations b. Stesen Disel 48 60 79 81 89 92 83 84
Diesel Stations c. Stesen Hidro 26 18 12 12 15 15 15 14
Hydro Stations d. Turbin Gas 0 0 0 0 0 0 0 0
Gas Turbines e. Lain-lain 0 0 0 0 0 0 0 0
Others
Jumlah
Total 74 78 91 93 104 107 98 98
3. Jumlah Mengikut Jenis Total by Type a. Stesen Wap 1,076 1,109 1,078 1,304 1,458 1,713 1,951 1,878
Steam Stations b. Stesen Disel 163 196 232 237 237 204 165 176
Diesel Stations c. Stesen Hidro 235 317 543 587 692 726 805 1,014
Hydro Stations d. Turbin Gas 0 0 0 0 0 0 0 0
Gas Turbines e. Lain-lain 0 0 0 0 0 0 0 0
Others
JUMLAH 1,474 1,622 1,853 2,128 2,387 2,643 2,921 3,068
TOTAL
140
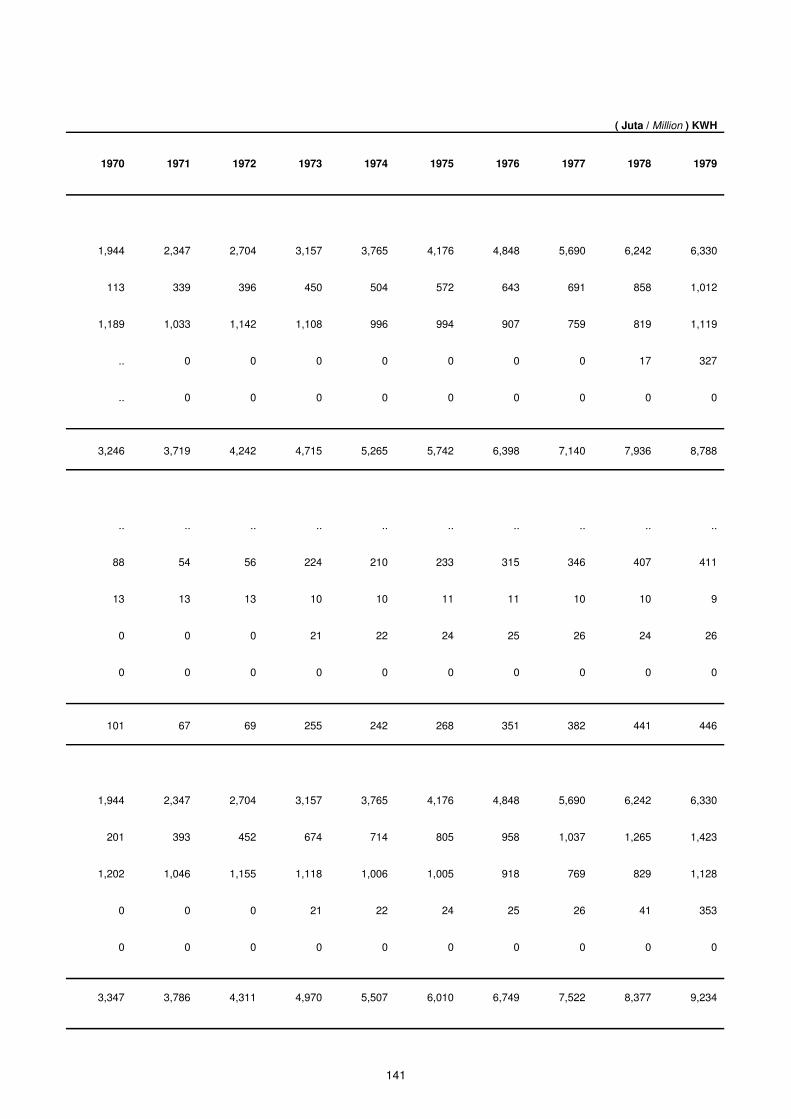
1970 1971 1972 1973 1974 1975 1976 1977 1978 1979
1,944 2,347 2,704 3,157 3,765 4,176 4,848 5,690 6,242 6,330
113 339 396 450 504 572 643 691 858 1,012
1,189 1,033 1,142 1,108 996 994 907 759 819 1,119
.. 0 0 0 0 0 0 0 17 327
.. 0 0 0 0 0 0 0 0 0
3,246 3,719 4,242 4,715 5,265 5,742 6,398 7,140 7,936 8,788
.. .. .. .. .. .. .. .. .. ..
88 54 56 224 210 233 315 346 407 411
13 13 13 10 10 11 11 10 10 9
0 0 0 21 22 24 25 26 24 26
0 0 0 0 0 0 0 0 0 0
101 67 69 255 242 268 351 382 441 446
1,944 2,347 2,704 3,157 3,765 4,176 4,848 5,690 6,242 6,330
201 393 452 674 714 805 958 1,037 1,265 1,423
1,202 1,046 1,155 1,118 1,006 1,005 918 769 829 1,128
0 0 0 21 22 24 25 26 41 353
0 0 0 0 0 0 0 0 0 0
3,347 3,786 4,311 4,970 5,507 6,010 6,749 7,522 8,377 9,234
( Juta / Million ) KWH
141
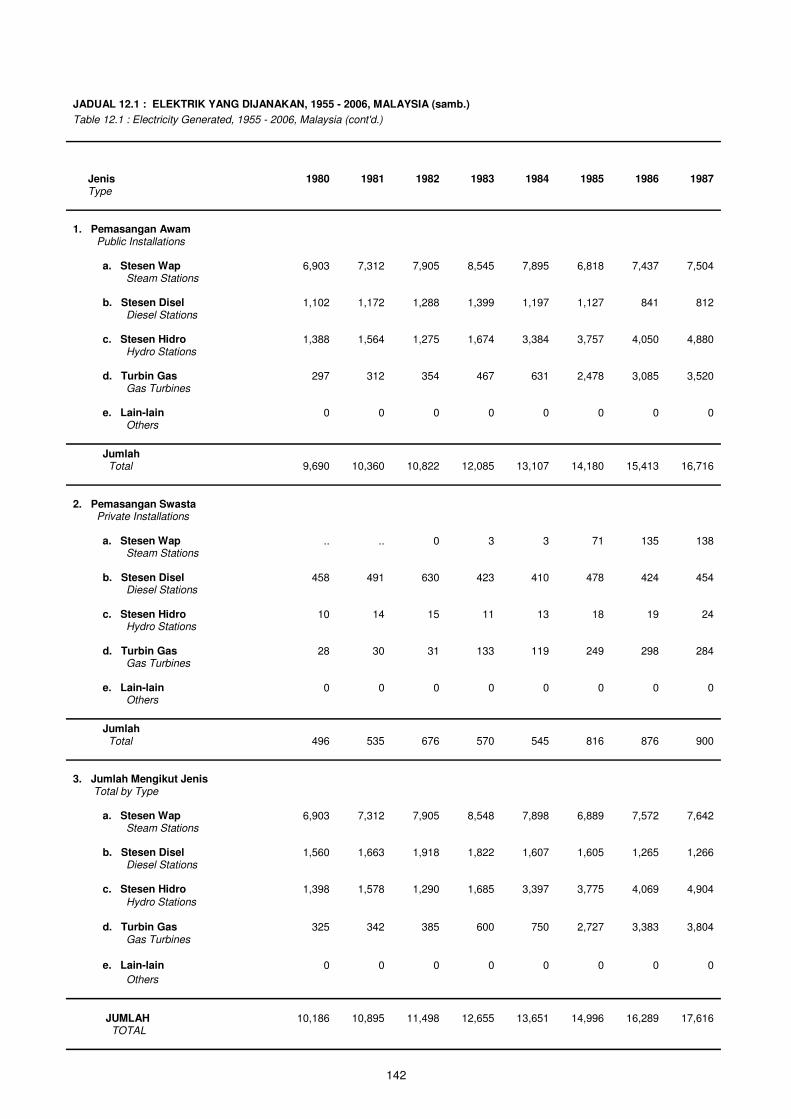
JADUAL 12.1 : ELEKTRIK YANG DIJANAKAN, 1955 - 2006, MALAYSIA (samb.)
Table 12.1 : Electricity Generated, 1955 - 2006, Malaysia (cont'd.)
Jenis 1980 1981 1982 1983 1984 1985 1986
Type
1. Pemasangan Awam Public Installations a. Stesen Wap 6,903 7,312 7,905 8,545 7,895 6,818 7,437
Steam Stations b. Stesen Disel 1,102 1,172 1,288 1,399 1,197 1,127 841
Diesel Stations c. Stesen Hidro 1,388 1,564 1,275 1,674 3,384 3,757 4,050
Hydro Stations d. Turbin Gas 297 312 354 467 631 2,478 3,085
Gas Turbines e. Lain-lain 0 0 0 0 0 0 0
Others
Jumlah
Total 9,690 10,360 10,822 12,085 13,107 14,180 15,413
2. Pemasangan Swasta Private Installations a. Stesen Wap .. .. 0 3 3 71 135
Steam Stations b. Stesen Disel 458 491 630 423 410 478 424
Diesel Stations c. Stesen Hidro 10 14 15 11 13 18 19
Hydro Stations d. Turbin Gas 28 30 31 133 119 249 298
Gas Turbines e. Lain-lain 0 0 0 0 0 0 0
Others
Jumlah
Total 496 535 676 570 545 816 876
3. Jumlah Mengikut Jenis Total by Type a. Stesen Wap 6,903 7,312 7,905 8,548 7,898 6,889 7,572
Steam Stations b. Stesen Disel 1,560 1,663 1,918 1,822 1,607 1,605 1,265
Diesel Stations c. Stesen Hidro 1,398 1,578 1,290 1,685 3,397 3,775 4,069
Hydro Stations d. Turbin Gas 325 342 385 600 750 2,727 3,383
Gas Turbines
e. Lain-lain 0 0 0 0 0 0 0
Others
JUMLAH 10,186 10,895 11,498 12,655 13,651 14,996 16,289
TOTAL
1987
7,504
812
4,880
3,520
0
16,716
138
454
24
284
0
900
7,642
1,266
4,904
3,804
0
17,616
142
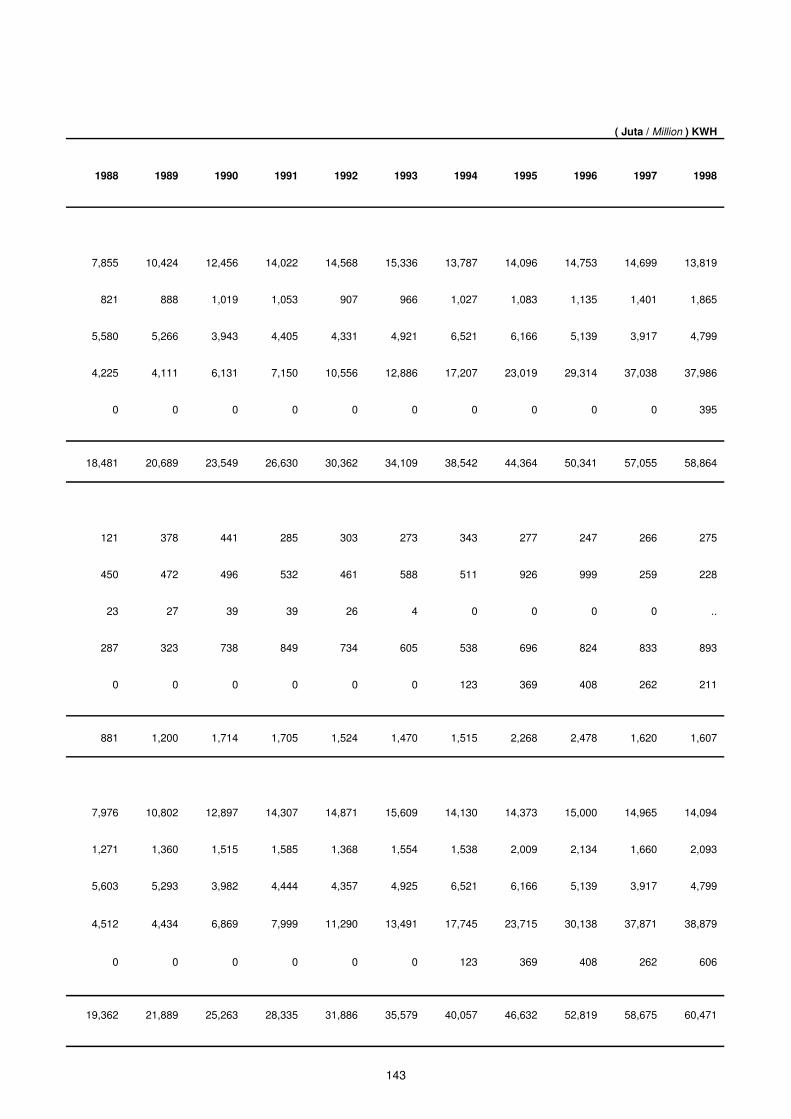
( Juta / Million ) KWH
1988 1989 1990 1991 1992 1993 1994 1995 1996 1997
7,855 10,424 12,456 14,022 14,568 15,336 13,787 14,096 14,753 14,699
821 888 1,019 1,053 907 966 1,027 1,083 1,135 1,401
5,580 5,266 3,943 4,405 4,331 4,921 6,521 6,166 5,139 3,917
4,225 4,111 6,131 7,150 10,556 12,886 17,207 23,019 29,314 37,038
0 0 0 0 0 0 0 0 0 0
18,481 20,689 23,549 26,630 30,362 34,109 38,542 44,364 50,341 57,055
121 378 441 285 303 273 343 277 247 266
450 472 496 532 461 588 511 926 999 259
23 27 39 39 26 4 0 0 0 0
287 323 738 849 734 605 538 696 824 833
0 0 0 0 0 0 123 369 408 262
881 1,200 1,714 1,705 1,524 1,470 1,515 2,268 2,478 1,620
7,976 10,802 12,897 14,307 14,871 15,609 14,130 14,373 15,000 14,965
1,271 1,360 1,515 1,585 1,368 1,554 1,538 2,009 2,134 1,660
5,603 5,293 3,982 4,444 4,357 4,925 6,521 6,166 5,139 3,917
4,512 4,434 6,869 7,999 11,290 13,491 17,745 23,715 30,138 37,871
0 0 0 0 0 0 123 369 408 262
19,362 21,889 25,263 28,335 31,886 35,579 40,057 46,632 52,819 58,675
1998
13,819
1,865
4,799
37,986
395
58,864
275
228
..
893
211
1,607
14,094
2,093
4,799
38,879
606
60,471
143
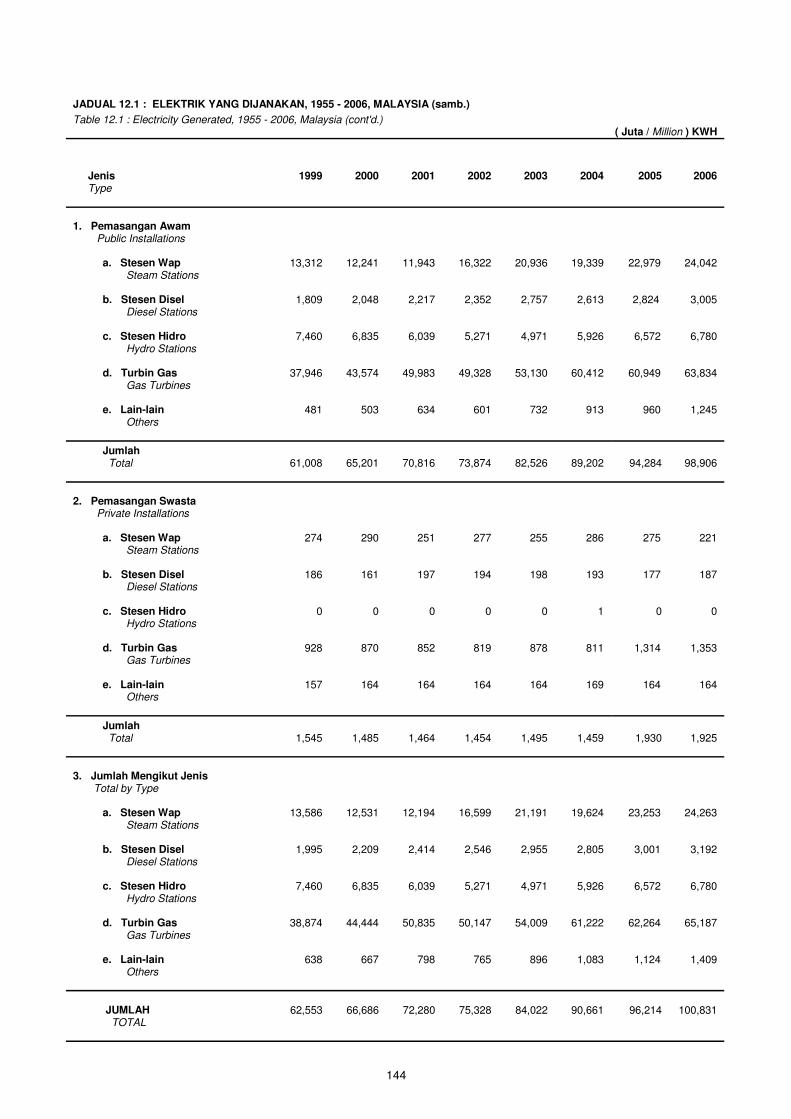
JADUAL 12.1 : ELEKTRIK YANG DIJANAKAN, 1955 - 2006, MALAYSIA (samb.)
( Juta / Million ) KWH
Jenis 1999 2000 2001 2002 2003 2004 2005 2006 Type
1. Pemasangan Awam Public Installations a. Stesen Wap 13,312 12,241 11,943 16,322 20,936 19,339 22,979 24,042 Steam Stations b. Stesen Disel 1,809 2,048 2,217 2,352 2,757 2,613 2,824 3,005 Diesel Stations c. Stesen Hidro 7,460 6,835 6,039 5,271 4,971 5,926 6,572 6,780 Hydro Stations d. Turbin Gas 37,946 43,574 49,983 49,328 53,130 60,412 60,949 63,834 Gas Turbines e. Lain-lain 481 503 634 601 732 913 960 1,245 Others
Jumlah Total 61,008 65,201 70,816 73,874 82,526 89,202 94,284 98,906
2. Pemasangan Swasta Private Installations a. Stesen Wap 274 290 251 277 255 286 275 221 Steam Stations b. Stesen Disel 186 161 197 194 198 193 177 187 Diesel Stations c. Stesen Hidro 0 0 0 0 0 1 0 0 Hydro Stations d. Turbin Gas 928 870 852 819 878 811 1,314 1,353 Gas Turbines e. Lain-lain 157 164 164 164 164 169 164 164 Others
Jumlah Total 1,545 1,485 1,464 1,454 1,495 1,459 1,930 1,925
3. Jumlah Mengikut Jenis Total by Type a. Stesen Wap 13,586 12,531 12,194 16,599 21,191 19,624 23,253 24,263 Steam Stations b. Stesen Disel 1,995 2,209 2,414 2,546 2,955 2,805 3,001 3,192 Diesel Stations c. Stesen Hidro 7,460 6,835 6,039 5,271 4,971 5,926 6,572 6,780 Hydro Stations d. Turbin Gas 38,874 44,444 50,835 50,147 54,009 61,222 62,264 65,187 Gas Turbines e. Lain-lain 638 667 798 765 896 1,083 1,124 1,409 Others
JUMLAH 62,553 66,686 72,280 75,328 84,022 90,661 96,214 100,831 TOTAL
Table 12.1 : Electricity Generated, 1955 - 2006, Malaysia (cont'd.)
144

INDEKS PENGELUARAN PERINDUSTRIAN
Nota Keterangan
1. Indeks Pengeluaran Perindustrian (IPP) meliputi sektor Perlombongan, Pembuatan
dan Elektrik. Objektif utama IPP adalah untuk mengukur kadar perubahan sebenar
dalam pengeluaran komoditi bagi satu tempoh masa.
2. IPP yang disusun adalah satu wajaran purata aritmetik tahun asas bagi kuantiti
relatif yang dikira mengikut formula Laspeyres. Ia telah disusun buat kali pertama
dengan menggunakan tahun 1968 sebagai tahun asas (1968=100). Pengasasan
semula telah dilakukan pada tahun 1981, 1985, 1988, 1993 dan terkini kepada
tahun 2000.
3. IPP merujuk kepada peringkat Malaysia manakala bagi tahun asas 1968 dan 1981
merujuk kepada Semenanjung Malaysia.
INDEX OF INDUSTRIAL PRODUCTION
Explanatory Notes
1. The Index of Industrial Production (IIP) covers the Mining, Manufacturing and
Electricity sectors. The main objective of the IIP is to measure the rate of change in
the production of industrial commodities in real terms over time.
2. The IIP compiled is a base year weighted arithmetic average of quantity relatives
calculated by the Laspeyres formula. It was first constructed with 1968 as the base
year (1968=100). Subsequently, the IIP was rebased to 1981, 1985, 1988, 1993
and currently to 2000.
3. The IIP refers to Malaysia except those for 1968 and 1981 base years refer to
Peninsular Malaysia.
145

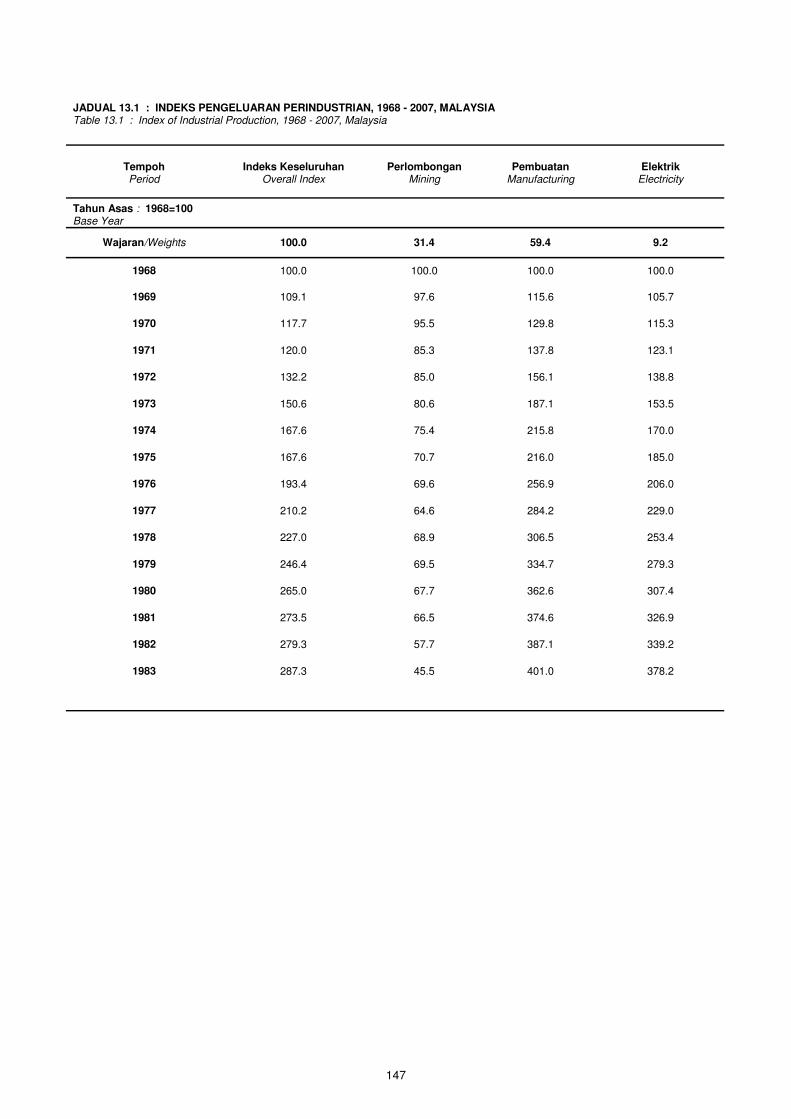
JADUAL 13.1 : INDEKS PENGELUARAN PERINDUSTRIAN, 1968 - 2007, MALAYSIA
Table 13.1 : Index of Industrial Production, 1968 - 2007, Malaysia
Tempoh Indeks Keseluruhan Perlombongan Pembuatan Elektrik
Period Overall Index Mining Manufacturing Electricity
Tahun Asas : 1968=100 Base Year
Wajaran/Weights 100.0 31.4 59.4 9.2
1968 100.0 100.0 100.0 100.0
1970 117.7 95.5 129.8 115.3
1971 120.0 85.3 137.8 123.1
1972 132.2 85.0 156.1 138.8
1973 150.6 80.6 187.1 153.5
1974 167.6 75.4 215.8 170.0
1975 167.6 70.7 216.0 185.0
1976 193.4 69.6 256.9 206.0
1977 210.2 64.6 284.2 229.0
1978 227.0 68.9 306.5 253.4
1979 246.4 69.5 334.7 279.3
1980 265.0 67.7 362.6 307.4
1981 273.5 66.5 374.6 326.9
1982 279.3 57.7 387.1 339.2
1983 287.3 45.5 401.0 378.2
1969 109.1 97.6 115.6 105.7
147
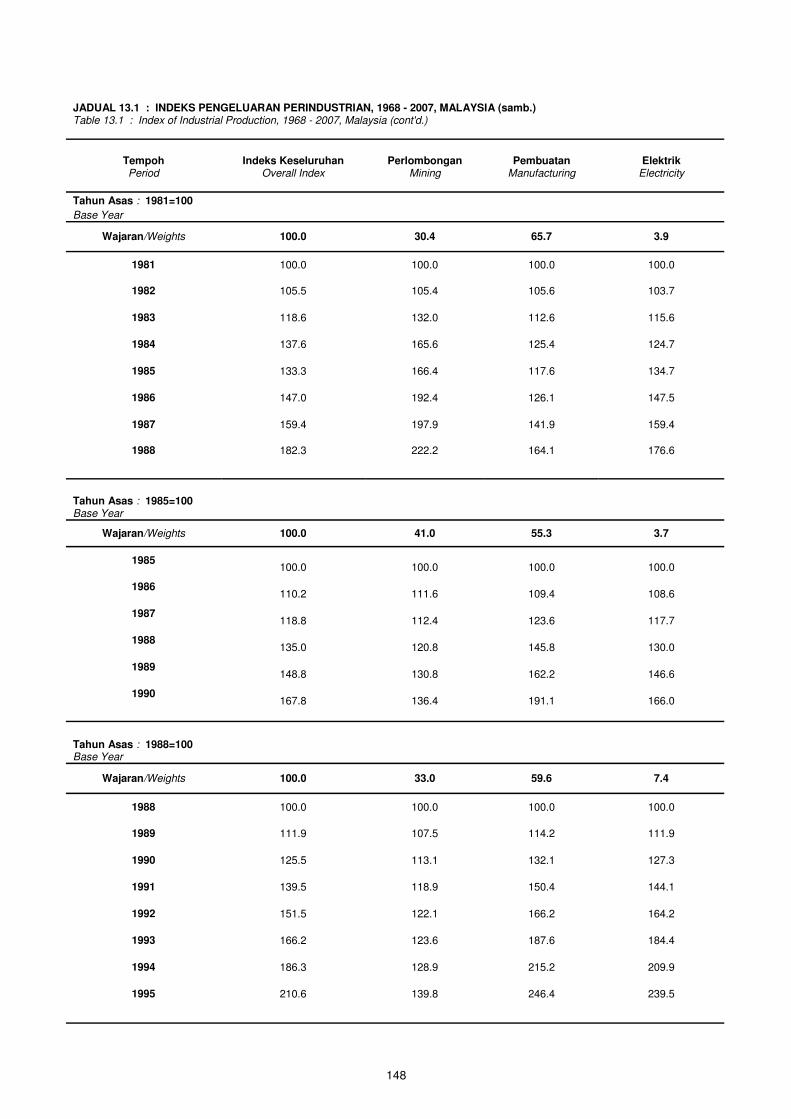
JADUAL 13.1 : INDEKS PENGELUARAN PERINDUSTRIAN, 1968 - 2007, MALAYSIA (samb.) Table 13.1 : Index of Industrial Production, 1968 - 2007, Malaysia (cont'd.)
Tempoh Indeks Keseluruhan Perlombongan Pembuatan Elektrik
Period Overall Index Mining Manufacturing Electricity
Tahun Asas : 1981=100 Base Year
Wajaran/Weights 100.0 30.4 65.7 3.9
1981 100.0 100.0 100.0 100.0
1983 118.6 132.0 112.6 115.6
1984 137.6 165.6 125.4 124.7
1985 133.3 166.4 117.6 134.7
1986 147.0 192.4 126.1 147.5
1987 159.4 197.9 141.9 159.4
1988 182.3 222.2 164.1 176.6
Tahun Asas : 1985=100 Base Year
Wajaran/Weights 100.0 41.0 55.3 3.7
1985 100.0 100.0 100.0 100.0
1987 118.8 112.4 123.6 117.7
1988 135.0 120.8 145.8 130.0
1989 148.8 130.8 162.2 146.6
1990 167.8 136.4 191.1 166.0
Tahun Asas : 1988=100 Base Year
Wajaran/Weights 100.0 33.0 59.6 7.4
1988 100.0 100.0 100.0 100.0
1990 125.5 113.1 132.1 127.3
1991 139.5 118.9 150.4 144.1
1992 151.5 122.1 166.2 164.2
1993 166.2 123.6 187.6 184.4
1994 186.3 128.9 215.2 209.9
1995 210.6 139.8 246.4 239.5
1982 105.5 105.4 105.6 103.7
1986 110.2 111.6 109.4 108.6
1989 111.9 107.5 114.2 111.9
148
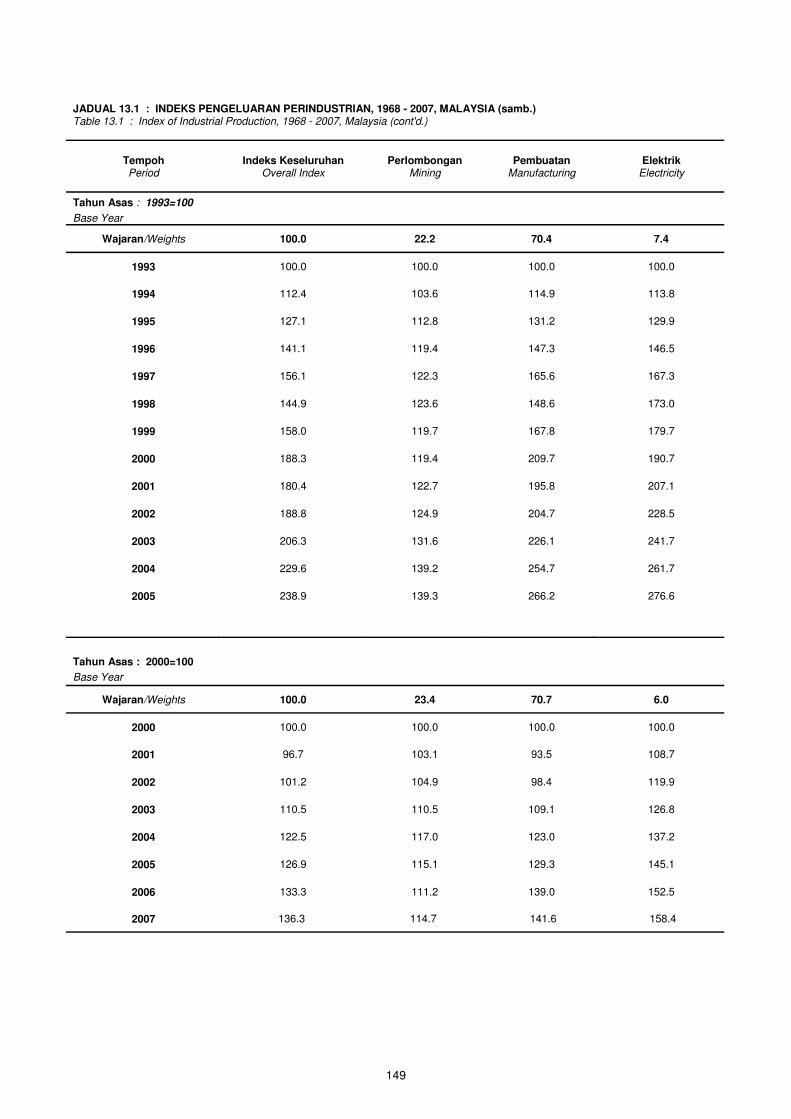
JADUAL 13.1 : INDEKS PENGELUARAN PERINDUSTRIAN, 1968 - 2007, MALAYSIA (samb.) Table 13.1 : Index of Industrial Production, 1968 - 2007, Malaysia (cont'd.)
Tempoh Indeks Keseluruhan Perlombongan Pembuatan Elektrik Period Overall Index Mining Manufacturing Electricity
Tahun Asas : 1993=100 Base Year
Wajaran/Weights 100.0 22.2 70.4 7.4
1993 100.0 100.0 100.0 100.0
1995 127.1 112.8 131.2 129.9
1996 141.1 119.4 147.3 146.5
1997 156.1 122.3 165.6 167.3
1998 144.9 123.6 148.6 173.0
1999 158.0 119.7 167.8 179.7
2000 188.3 119.4 209.7 190.7
2001 180.4 122.7 195.8 207.1
2002 188.8 124.9 204.7 228.5
2003 206.3 131.6 226.1 241.7
2004 229.6 139.2 254.7 261.7
2005 238.9 139.3 266.2 276.6
Tahun Asas : 2000=100
Base Year
Wajaran/Weights 100.0 23.4 70.7 6.0
2000 100.0 100.0 100.0 100.0
2002 101.2 104.9 98.4 119.9
2003 110.5 110.5 109.1 126.8
2004 122.5 117.0 123.0 137.2
2005 126.9 115.1 129.3 145.1
2006 133.3 111.2 139.0 152.5
2007 136.3 114.7 141.6 158.4
1994 112.4 103.6 114.9 113.8
2001 96.7 103.1 93.5 108.7
149


INDEKS HARGA PENGELUAR
Nota Keterangan
1. Indeks Harga Pengeluar (IHPR) adalah satu indeks yang disusun menggunakan
formula Laspeyres base-weighted. Ia bertujuan untuk mengukur perubahan harga
komoditi yang dikenakan oleh pengeluar tempatan dan yang dibayar oleh
pengimport bagi mengimport barangan ke Malaysia.
2. IHPR bagi tahun asas 1972, 1978 dan 1989 meliputi sektor industri berikut:
i. Pertanian, Perhutanan & Pembalakan dan Perikanan
ii. Perlombongan & Penggalian
iii. Perkilangan
iv. Air, Gas & Elektrik
Namun bagi tahun asas 2000, IHPR meliputi lima sektor ekonomi berikut iaitu:
i. Pertanian
ii. Perikanan
iii. Perlombongan
iv. Pembuatan
v. Elektrik, Gas dan Bekalan air
3. IHPR bagi tahun asas 1972 merujuk kepada Semenanjung Malaysia sahaja
manakala bagi tahun asas 1978 dan seterusnya merujuk kepada Malaysia.
4. Bagi siri tahun asas 1972, IHPR dikelaskan mengikut sembilan kumpulan komoditi
(0-8), S.I.T.C. Manakala bagi tahun asas 1978 dan seterusnya dikelaskan
mengikut sepuluh kumpulan komoditi (0-9), S.I.T.C. Penambahan ini berpunca
daripada pemecahan kumpulan komoditi daripada “Pelbagai barang keluaran
kilang” dan “Pelbagai komoditi & transaksi yang tidak dikelaskan secara khusus
dalam S.I.T.C.”.
151
PRODUCER PRICE INDEX
Explanatory Notes
1. The Laspeyres base-weighted formula is used to compile Producer Price Index
(PPI). It is designed to measure the changes in the price of commodities charged
by domestic producers and those paid by importers for importing goods into
Malaysia.
2. The PPI for base year 1972, 1978 and 1989 covers the following industrial sectors :
i. Agriculture, Forestry & Logging and Fishing
ii. Mining & Quarrying
iii. Manufacturing
iv. Water, Gas & Electricity
For base year 2000, PPI covers five broad sectors of economy as follows:
i. Agriculture
ii. Fishing
iii. Mining
iv. Manufacturing
v. Electricity, gas and water supply
3. The PPI for base year 1972 refers to Peninsular Malaysia only while for base year
1978 and year after refers to Malaysia.
4. For the series with 1972 as the base year, the PPI is sub-classified into nine
commodity groups (0-8), S.I.T.C.. For base year 1978 and year after being
classified into ten commodity groups (0-9), S.I.T.C.. The difference is due to a
further sub-classification of the commodity group “Miscellaneous manufactured
articles” of the series with 1972 as the base year into two groups viz,
“Miscellaneous manufactured articles” and “Commodities & transactions not
classified elsewhere in the S.I.T.C.”.
152
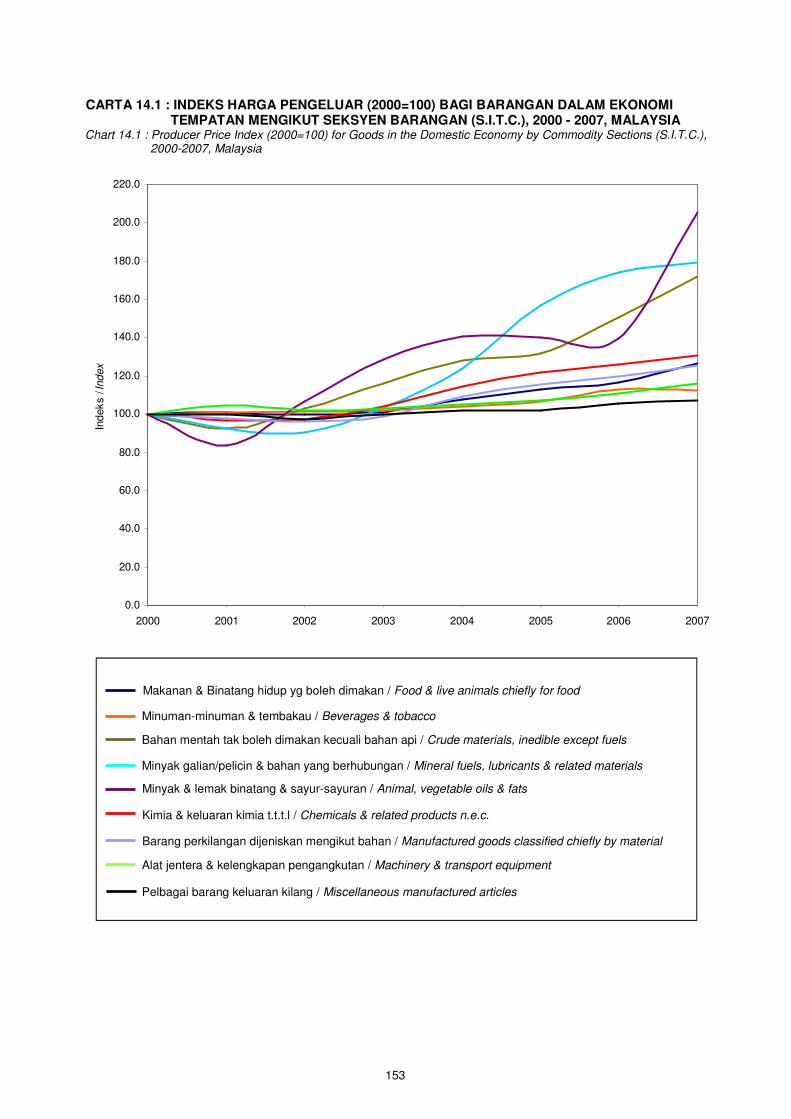
153
CARTA 14.1 : INDEKS HARGA PENGELUAR (2000=100) BAGI BARANGAN DALAM EKONOMI TEMPATAN MENGIKUT SEKSYEN BARANGAN (S.I.T.C.), 2000 - 2007, MALAYSIA
Chart 14.1 : Producer Price Index (2000=100) for Goods in the Domestic Economy by Commodity Sections (S.I.T.C.), 2000-2007, Malaysia
Makanan & Binatang hidup yg boleh dimakan / Food & live animals chiefly for food
Minuman-minuman & tembakau / Beverages & tobacco
Bahan mentah tak boleh dimakan kecuali bahan api / Crude materials, inedible except fuels
Kimia & keluaran kimia t.t.t.l / Chemicals & related products n.e.c.
Minyak galian/pelicin & bahan yang berhubungan / Mineral fuels, lubricants & related materials
Minyak & lemak binatang & sayur-sayuran / Animal, vegetable oils & fats
Barang perkilangan dijeniskan mengikut bahan / Manufactured goods classified chiefly by material
Alat jentera & kelengkapan pengangkutan / Machinery & transport equipment
Pelbagai barang keluaran kilang / Miscellaneous manufactured articles
0.0
20.0
40.0
60.0
80.0
100.0
120.0
140.0
160.0
180.0
200.0
220.0
2000 2001 2002 2003 2004 2005 2006 2007
Indeks /
Index

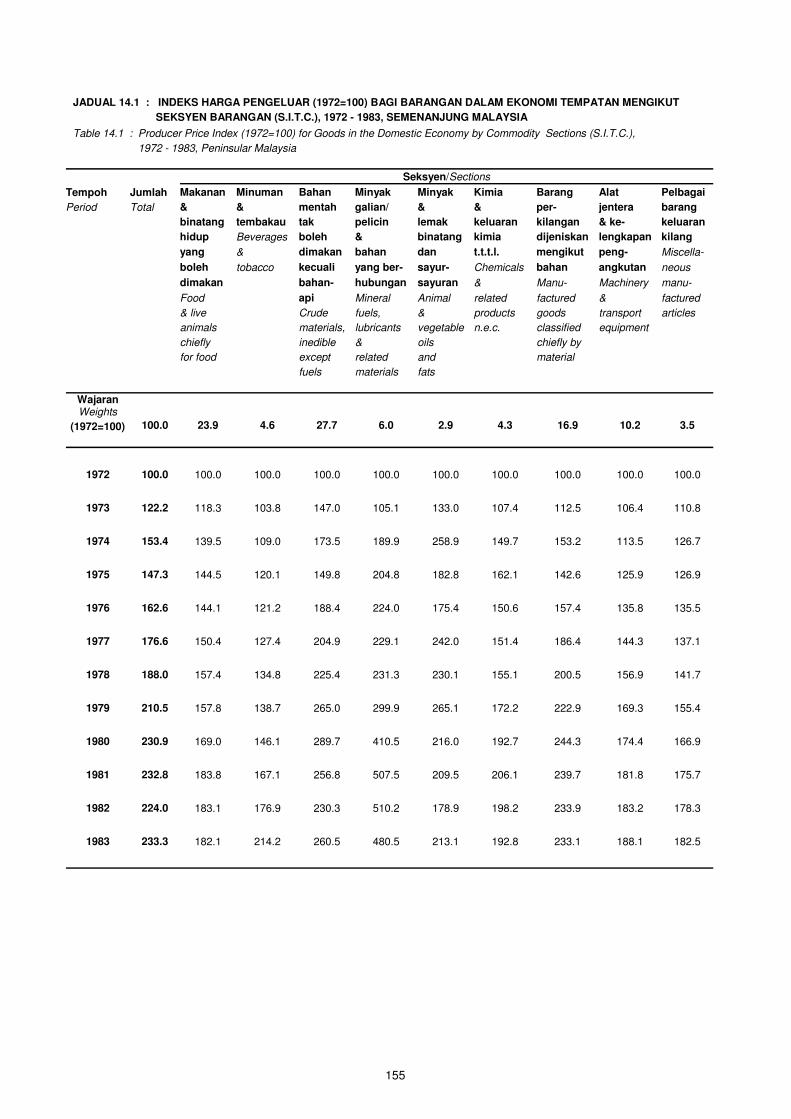
JADUAL 14.1 : INDEKS HARGA PENGELUAR (1972=100) BAGI BARANGAN DALAM EKONOMI TEMPATAN MENGIKUT
SEKSYEN BARANGAN (S.I.T.C.), 1972 - 1983, SEMENANJUNG MALAYSIA
Table 14.1 : Producer Price Index (1972=100) for Goods in the Domestic Economy by Commodity Sections (S.I.T.C.),
1972 - 1983, Peninsular Malaysia
Seksyen/Sections
Tempoh Jumlah Makanan Minuman Bahan Minyak Minyak Kimia Barang Alat Pelbagai
Period Total & & mentah galian/ & & per- jentera barang
binatang tembakau tak pelicin lemak keluaran kilangan & ke- keluaran
hidup Beverages boleh & binatang kimia dijeniskan lengkapan kilang
yang & dimakan bahan dan t.t.t.l. mengikut peng- Miscella-
boleh tobacco kecuali yang ber- sayur- Chemicals bahan angkutan neous
dimakan bahan- hubungan sayuran & Manu- Machinery manu-
Food api Mineral Animal related factured & factured
& live Crude fuels, & products goods transport articles
animals materials, lubricants vegetable n.e.c. classified equipment
chiefly inedible & oils chiefly by
for food except related and material
fuels materials fats
Wajaran Weights
(1972=100) 100.0 23.9 4.6 27.7 6.0 2.9 4.3 16.9 10.2 3.5
1972 100.0 100.0 100.0 100.0 100.0 100.0 100.0 100.0 100.0 100.0
1973 122.2 118.3 103.8 147.0 105.1 133.0 107.4 112.5 106.4 110.8
1974 153.4 139.5 109.0 173.5 189.9 258.9 149.7 153.2 113.5 126.7
1975 147.3 144.5 120.1 149.8 204.8 182.8 162.1 142.6 125.9 126.9
1976 162.6 144.1 121.2 188.4 224.0 175.4 150.6 157.4 135.8 135.5
1977 176.6 150.4 127.4 204.9 229.1 242.0 151.4 186.4 144.3 137.1
1978 188.0 157.4 134.8 225.4 231.3 230.1 155.1 200.5 156.9 141.7
1979 210.5 157.8 138.7 265.0 299.9 265.1 172.2 222.9 169.3 155.4
1980 230.9 169.0 146.1 289.7 410.5 216.0 192.7 244.3 174.4 166.9
1981 232.8 183.8 167.1 256.8 507.5 209.5 206.1 239.7 181.8 175.7
1982 224.0 183.1 176.9 230.3 510.2 178.9 198.2 233.9 183.2 178.3
1983 233.3 182.1 214.2 260.5 480.5 213.1 192.8 233.1 188.1 182.5
155
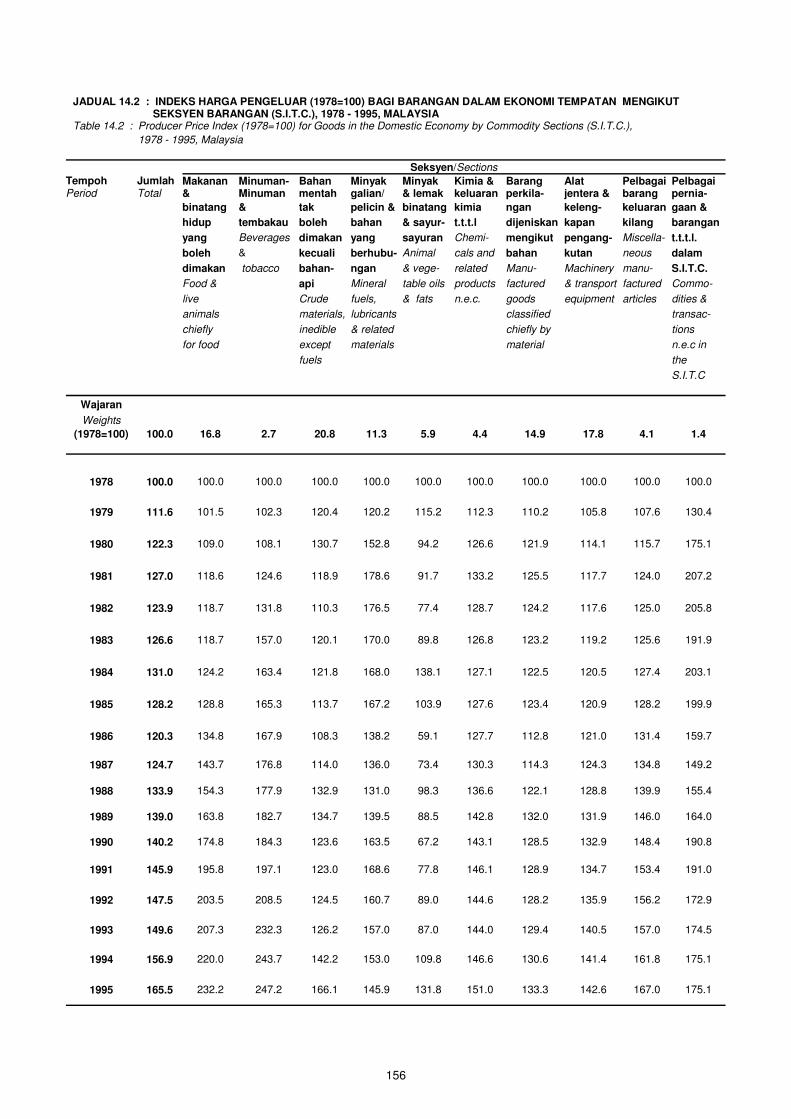
JADUAL 14.2 : INDEKS HARGA PENGELUAR (1978=100) BAGI BARANGAN DALAM EKONOMI TEMPATAN MENGIKUT SEKSYEN BARANGAN (S.I.T.C.), 1978 - 1995, MALAYSIA Table 14.2 : Producer Price Index (1978=100) for Goods in the Domestic Economy by Commodity Sections (S.I.T.C.),
1978 - 1995, Malaysia
Seksyen/Sections
Tempoh Jumlah Makanan Minuman- Bahan Minyak Minyak Kimia & Barang Alat Pelbagai Pelbagai Period Total & Minuman mentah galian/ & lemak keluaran perkila- jentera & barang pernia-
binatang & tak pelicin & binatang kimia ngan keleng- keluaran gaan &
hidup tembakau boleh bahan & sayur- t.t.t.l dijeniskan kapan kilang barangan
yang Beverages dimakan yang sayuran Chemi- mengikut pengang- Miscella- t.t.t.l.
boleh & kecuali berhubu- Animal cals and bahan kutan neous dalam
dimakan tobacco bahan- ngan & vege- related Manu- Machinery manu- S.I.T.C.
Food & api Mineral table oils products factured & transport factured Commo-
live Crude fuels, & fats n.e.c. goods equipment articles dities &
animals materials, lubricants classified
transac-
chiefly inedible & related
chiefly by
tions
for food except materials
material
n.e.c in
fuels
the
S.I.T.C
Wajaran
Weights
(1978=100) 100.0 16.8 2.7 20.8 11.3 5.9 4.4 14.9 17.8 4.1 1.4
1978 100.0 100.0 100.0 100.0 100.0 100.0 100.0 100.0 100.0 100.0 100.0
1979 111.6 101.5 102.3 120.4 120.2 115.2 112.3 110.2 105.8 107.6 130.4
1980 122.3 109.0 108.1 130.7 152.8 94.2 126.6 121.9 114.1 115.7 175.1
1981 127.0 118.6 124.6 118.9 178.6 91.7 133.2 125.5 117.7 124.0 207.2
1982 123.9 118.7 131.8 110.3 176.5 77.4 128.7 124.2 117.6 125.0 205.8
1983 126.6 118.7 157.0 120.1 170.0 89.8 126.8 123.2 119.2 125.6 191.9
1984 131.0 124.2 163.4 121.8 168.0 138.1 127.1 122.5 120.5 127.4 203.1
1985 128.2 128.8 165.3 113.7 167.2 103.9 127.6 123.4 120.9 128.2 199.9
1986 120.3 134.8 167.9 108.3 138.2 59.1 127.7 112.8 121.0 131.4 159.7
1987 124.7 143.7 176.8 114.0 136.0 73.4 130.3 114.3 124.3 134.8 149.2
1988 133.9 154.3 177.9 132.9 131.0 98.3 136.6 122.1 128.8 139.9 155.4
1989 139.0 163.8 182.7 134.7 139.5 88.5 142.8 132.0 131.9 146.0 164.0
1990 140.2 174.8 184.3 123.6 163.5 67.2 143.1 128.5 132.9 148.4 190.8
1991 145.9 195.8 197.1 123.0 168.6 77.8 146.1 128.9 134.7 153.4 191.0
1992 147.5 203.5 208.5 124.5 160.7 89.0 144.6 128.2 135.9 156.2 172.9
1993 149.6 207.3 232.3 126.2 157.0 87.0 144.0 129.4 140.5 157.0 174.5
1994 156.9 220.0 243.7 142.2 153.0 109.8 146.6 130.6 141.4 161.8 175.1
1995 165.5 232.2 247.2 166.1 145.9 131.8 151.0 133.3 142.6 167.0 175.1
156
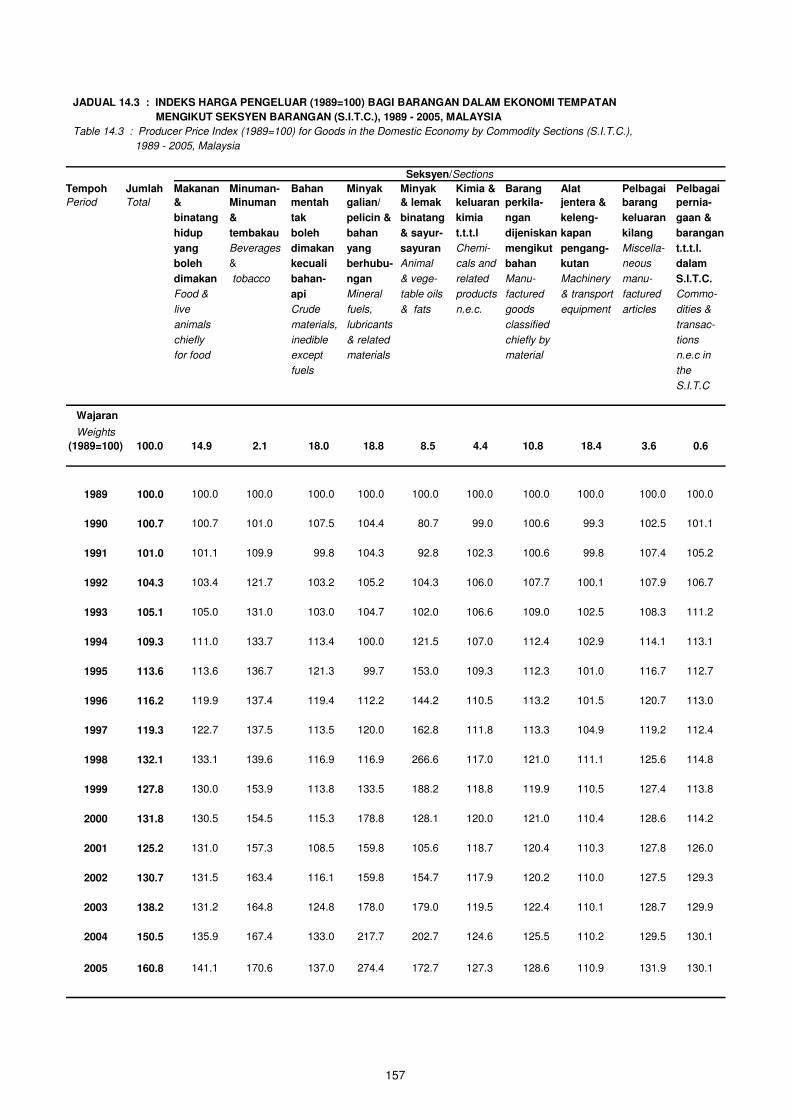
JADUAL 14.3 : INDEKS HARGA PENGELUAR (1989=100) BAGI BARANGAN DALAM EKONOMI TEMPATAN
MENGIKUT SEKSYEN BARANGAN (S.I.T.C.), 1989 - 2005, MALAYSIA
Table 14.3 : Producer Price Index (1989=100) for Goods in the Domestic Economy by Commodity Sections (S.I.T.C.),
1989 - 2005, Malaysia
Seksyen/Sections
Tempoh Jumlah Makanan Minuman- Bahan Minyak Minyak Kimia & Barang Alat Pelbagai Pelbagai
Period Total & Minuman mentah galian/ & lemak keluaran perkila- jentera & barang pernia-
binatang & tak pelicin & binatang kimia ngan keleng- keluaran gaan &
hidup tembakau boleh bahan & sayur- t.t.t.l dijeniskan kapan kilang barangan
yang Beverages dimakan yang sayuran Chemi- mengikut pengang- Miscella- t.t.t.l.
boleh & kecuali berhubu- Animal cals and bahan kutan neous dalam
dimakan tobacco bahan- ngan & vege- related Manu- Machinery manu- S.I.T.C.
Food & api Mineral table oils products factured & transport factured Commo-
live Crude fuels, & fats n.e.c. goods equipment articles dities &
animals materials, lubricants classified transac-
chiefly inedible & related chiefly by tions
for food except materials material n.e.c in
fuels the
S.I.T.C
Wajaran
Weights
(1989=100) 100.0 14.9 2.1 18.0 18.8 8.5 4.4 10.8 18.4 3.6 0.6
1989 100.0 100.0 100.0 100.0 100.0 100.0 100.0 100.0 100.0 100.0 100.0
1990 100.7 100.7 101.0 107.5 104.4 80.7 99.0 100.6 99.3 102.5 101.1
1991 101.0 101.1 109.9 99.8 104.3 92.8 102.3 100.6 99.8 107.4 105.2
1992 104.3 103.4 121.7 103.2 105.2 104.3 106.0 107.7 100.1 107.9 106.7
1993 105.1 105.0 131.0 103.0 104.7 102.0 106.6 109.0 102.5 108.3 111.2
1994 109.3 111.0 133.7 113.4 100.0 121.5 107.0 112.4 102.9 114.1 113.1
1995 113.6 113.6 136.7 121.3 99.7 153.0 109.3 112.3 101.0 116.7 112.7
1996 116.2 119.9 137.4 119.4 112.2 144.2 110.5 113.2 101.5 120.7 113.0
1997 119.3 122.7 137.5 113.5 120.0 162.8 111.8 113.3 104.9 119.2 112.4
1998 132.1 133.1 139.6 116.9 116.9 266.6 117.0 121.0 111.1 125.6 114.8
1999 127.8 130.0 153.9 113.8 133.5 188.2 118.8 119.9 110.5 127.4 113.8
2000 131.8 130.5 154.5 115.3 178.8 128.1 120.0 121.0 110.4 128.6 114.2
2001 125.2 131.0 157.3 108.5 159.8 105.6 118.7 120.4 110.3 127.8 126.0
2002 130.7 131.5 163.4 116.1 159.8 154.7 117.9 120.2 110.0 127.5 129.3
2003 138.2 131.2 164.8 124.8 178.0 179.0 119.5 122.4 110.1 128.7 129.9
2004 150.5 135.9 167.4 133.0 217.7 202.7 124.6 125.5 110.2 129.5 130.1
2005 160.8 141.1 170.6 137.0 274.4 172.7 127.3 128.6 110.9 131.9 130.1
157
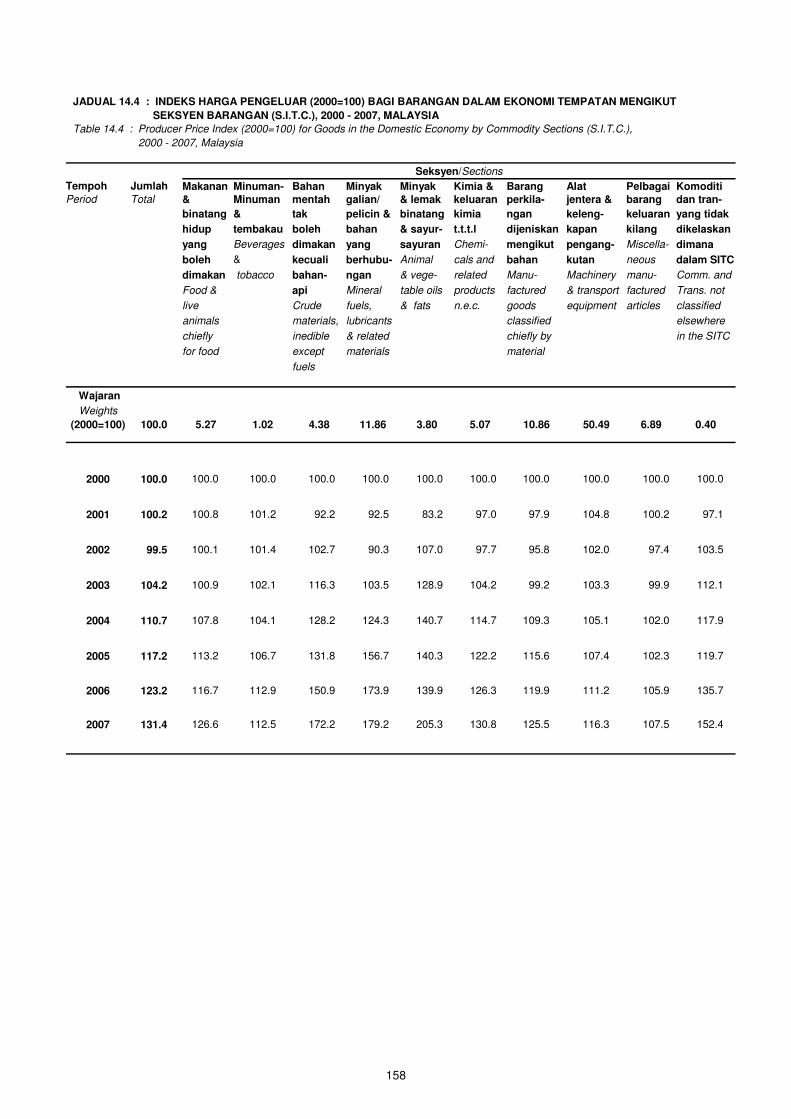
JADUAL 14.4 : INDEKS HARGA PENGELUAR (2000=100) BAGI BARANGAN DALAM EKONOMI TEMPATAN MENGIKUT
SEKSYEN BARANGAN (S.I.T.C.), 2000 - 2007, MALAYSIA
Table 14.4 : Producer Price Index (2000=100) for Goods in the Domestic Economy by Commodity Sections (S.I.T.C.),
2000 - 2007, Malaysia
Seksyen/Sections
Tempoh Jumlah Makanan Minuman- Bahan Minyak Minyak Kimia & Barang Alat Pelbagai Komoditi Period Total & Minuman mentah galian/ & lemak keluaran perkila- jentera & barang dan tran-
binatang & tak pelicin & binatang kimia ngan keleng- keluaran yang tidak
hidup tembakau boleh bahan & sayur- t.t.t.l dijeniskan kapan kilang dikelaskan
yang Beverages dimakan yang sayuran Chemi- mengikut pengang- Miscella- dimana
boleh & kecuali berhubu- Animal cals and bahan kutan neous dalam SITC
dimakan tobacco bahan- ngan & vege- related Manu- Machinery manu- Comm. and
Food & api Mineral table oils products factured & transport factured Trans. not
live Crude fuels, & fats n.e.c. goods equipment articles classified
animals materials, lubricants
classified
elsewhere
chiefly inedible & related
chiefly by
in the SITC
for food except materials
material
fuels
Wajaran
Weights
(2000=100) 100.0 5.27 1.02 4.38 11.86 3.80 5.07 10.86 50.49 6.89 0.40
2000 100.0 100.0 100.0 100.0 100.0 100.0 100.0 100.0 100.0 100.0 100.0
2001 100.2 100.8 101.2 92.2 92.5 83.2 97.0 97.9 104.8 100.2 97.1
2002 99.5 100.1 101.4 102.7 90.3 107.0 97.7 95.8 102.0 97.4 103.5
2003 104.2 100.9 102.1 116.3 103.5 128.9 104.2 99.2 103.3 99.9 112.1
2004 110.7 107.8 104.1 128.2 124.3 140.7 114.7 109.3 105.1 102.0 117.9
2005 117.2 113.2 106.7 131.8 156.7 140.3 122.2 115.6 107.4 102.3 119.7
2006 123.2 116.7 112.9 150.9 173.9 139.9 126.3 119.9 111.2 105.9 135.7
2007 131.4 126.6 112.5 172.2 179.2 205.3 130.8 125.5 116.3 107.5 152.4
158

JADUAL 14.5 : INDEKS HARGA PENGELUAR (1972=100) BAGI PENGELUARAN TEMPATAN MENGIKUT SEKSYEN
BARANGAN (S.I.T.C.), 1972 - 1983, SEMENANJUNG MALAYSIA Table 14.5 : Producer Price Index (1972=100) for Local Production by Commodity Sections (S.I.T.C.), 1972 - 1983, Peninsular Malaysia
Seksyen/Sections
Tempoh Jumlah Makanan Minuman Bahan Minyak Minyak Kimia Barang Alat Pelbagai Period Total & & mentah galian/ & & per- jentera barang
binatang tembakau tak pelicin lemak keluaran kilangan & ke- keluaran
hidup Beverages boleh & binatang kimia dijeniskan lengkapan kilang
yang & dimakan bahan dan t.t.t.l. mengikut peng- Miscella-
boleh tobacco kecuali yang ber- sayur- Chemicals bahan angkutan neous
dimakan bahan- hubungan sayuran & Manu- Machinery manu-
Food api Mineral Animal related factured & factured
& live Crude fuels, & products goods transport articles
animals materials, lubricants vegetable n.e.c. classified equipment chiefly inedible & oils chiefly by for food except related and material fuels materials fats
Wajaran Weights
(1972=100) 100.0 25.8 4.2 35.7 5.1 3.8 2.8 15.8 4.1 2.7
1972 100.0 100.0 100.0 100.0 100.0 100.0 100.0 100.0 100.0 100.0
1973 126.2 116.7 102.6 149.2 102.5 133.2 110.5 113.1 104.7 115.1
1974 158.7 136.4 106.7 175.0 163.0 262.4 155.2 162.8 119.0 135.8
1975 146.7 141.9 114.8 149.4 174.8 182.3 163.7 145.8 126.5 131.5
1976 165.2 141.2 113.7 189.5 190.6 175.6 147.5 164.4 138.6 139.5
1977 182.6 148.0 118.6 206.2 197.9 243.9 147.4 205.8 150.7 145.8
1978 195.4 154.4 124.9 227.2 202.8 232.5 154.6 223.5 166.0 149.4
1979 220.7 155.9 128.6 268.6 269.8 268.4 169.8 250.5 174.6 161.0
1980 240.1 165.7 138.3 293.2 359.1 216.5 189.1 275.7 179.1 175.9
1981 236.2 178.6 160.4 258.2 464.3 209.6 201.3 264.1 188.7 186.9
1982 225.8 183.7 172.4 230.5 468.3 177.4 192.5 254.7 193.6 192.7
1983 239.4 183.9 202.6 262.6 450.8 213.6 187.2 254.8 203.1 198.0
159
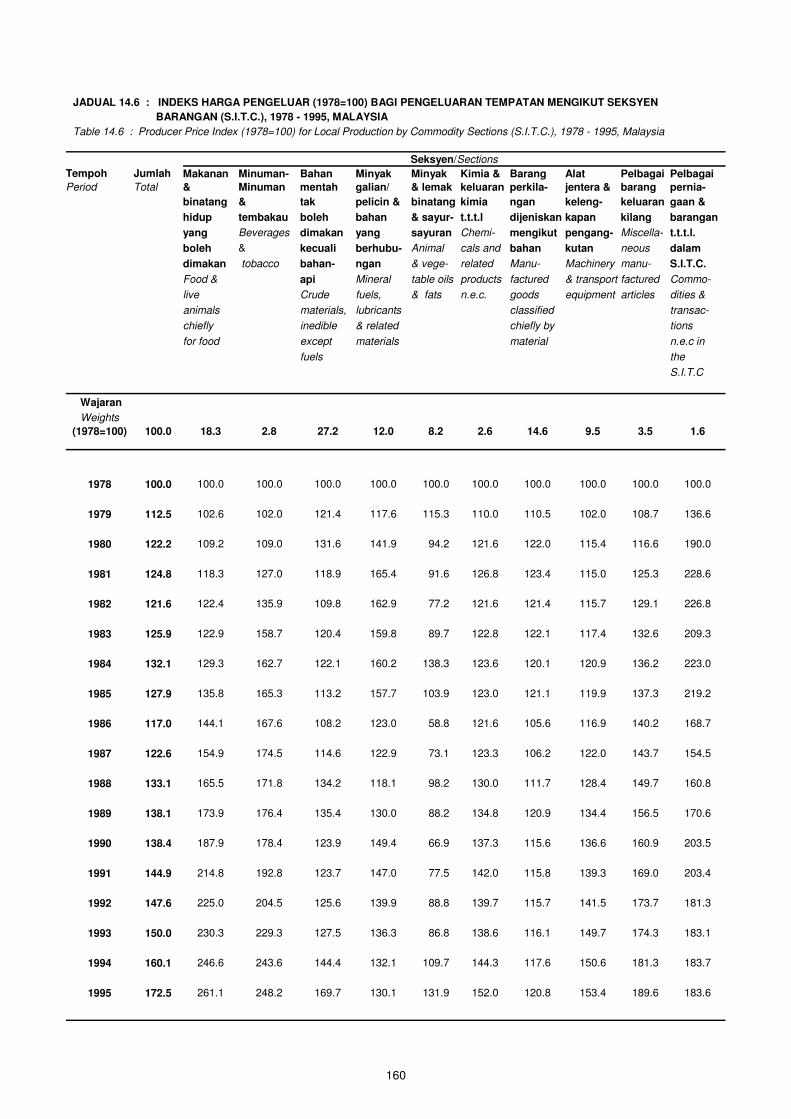
JADUAL 14.6 : INDEKS HARGA PENGELUAR (1978=100) BAGI PENGELUARAN TEMPATAN MENGIKUT SEKSYEN
BARANGAN (S.I.T.C.), 1978 - 1995, MALAYSIA
Table 14.6 : Producer Price Index (1978=100) for Local Production by Commodity Sections (S.I.T.C.), 1978 - 1995, Malaysia
Seksyen/Sections
Tempoh Jumlah Makanan Minuman- Bahan Minyak Minyak Kimia & Barang Alat Pelbagai Pelbagai
Period Total & Minuman mentah galian/ & lemak keluaran perkila- jentera & barang pernia-
binatang & tak pelicin & binatang kimia ngan keleng- keluaran gaan &
hidup tembakau boleh bahan & sayur- t.t.t.l dijeniskan kapan kilang barangan
yang Beverages dimakan yang sayuran Chemi- mengikut pengang- Miscella- t.t.t.l.
boleh & kecuali berhubu- Animal cals and bahan kutan neous dalam
dimakan tobacco bahan- ngan & vege- related Manu- Machinery manu- S.I.T.C.
Food & api Mineral table oils products factured & transport factured Commo-
live Crude fuels, & fats n.e.c. goods equipment articles dities &
animals materials, lubricants classified
transac-
chiefly inedible & related
chiefly by
tions
for food except materials
material
n.e.c in
fuels
the
S.I.T.C
Wajaran
Weights
(1978=100) 100.0 18.3 2.8 27.2 12.0 8.2 2.6 14.6 9.5 3.5 1.6
1978 100.0 100.0 100.0 100.0 100.0 100.0 100.0 100.0 100.0 100.0 100.0
1979 112.5 102.6 102.0 121.4 117.6 115.3 110.0 110.5 102.0 108.7 136.6
1980 122.2 109.2 109.0 131.6 141.9 94.2 121.6 122.0 115.4 116.6 190.0
1981 124.8 118.3 127.0 118.9 165.4 91.6 126.8 123.4 115.0 125.3 228.6
1982 121.6 122.4 135.9 109.8 162.9 77.2 121.6 121.4 115.7 129.1 226.8
1983 125.9 122.9 158.7 120.4 159.8 89.7 122.8 122.1 117.4 132.6 209.3
1984 132.1 129.3 162.7 122.1 160.2 138.3 123.6 120.1 120.9 136.2 223.0
1985 127.9 135.8 165.3 113.2 157.7 103.9 123.0 121.1 119.9 137.3 219.2
1986 117.0 144.1 167.6 108.2 123.0 58.8 121.6 105.6 116.9 140.2 168.7
1987 122.6 154.9 174.5 114.6 122.9 73.1 123.3 106.2 122.0 143.7 154.5
1988 133.1 165.5 171.8 134.2 118.1 98.2 130.0 111.7 128.4 149.7 160.8
1989 138.1 173.9 176.4 135.4 130.0 88.2 134.8 120.9 134.4 156.5 170.6
1990 138.4 187.9 178.4 123.9 149.4 66.9 137.3 115.6 136.6 160.9 203.5
1991 144.9 214.8 192.8 123.7 147.0 77.5 142.0 115.8 139.3 169.0 203.4
1992 147.6 225.0 204.5 125.6 139.9 88.8 139.7 115.7 141.5 173.7 181.3
1993 150.0 230.3 229.3 127.5 136.3 86.8 138.6 116.1 149.7 174.3 183.1
1994 160.1 246.6 243.6 144.4 132.1 109.7 144.3 117.6 150.6 181.3 183.7
1995 172.5 261.1 248.2 169.7 130.1 131.9 152.0 120.8 153.4 189.6 183.6
160
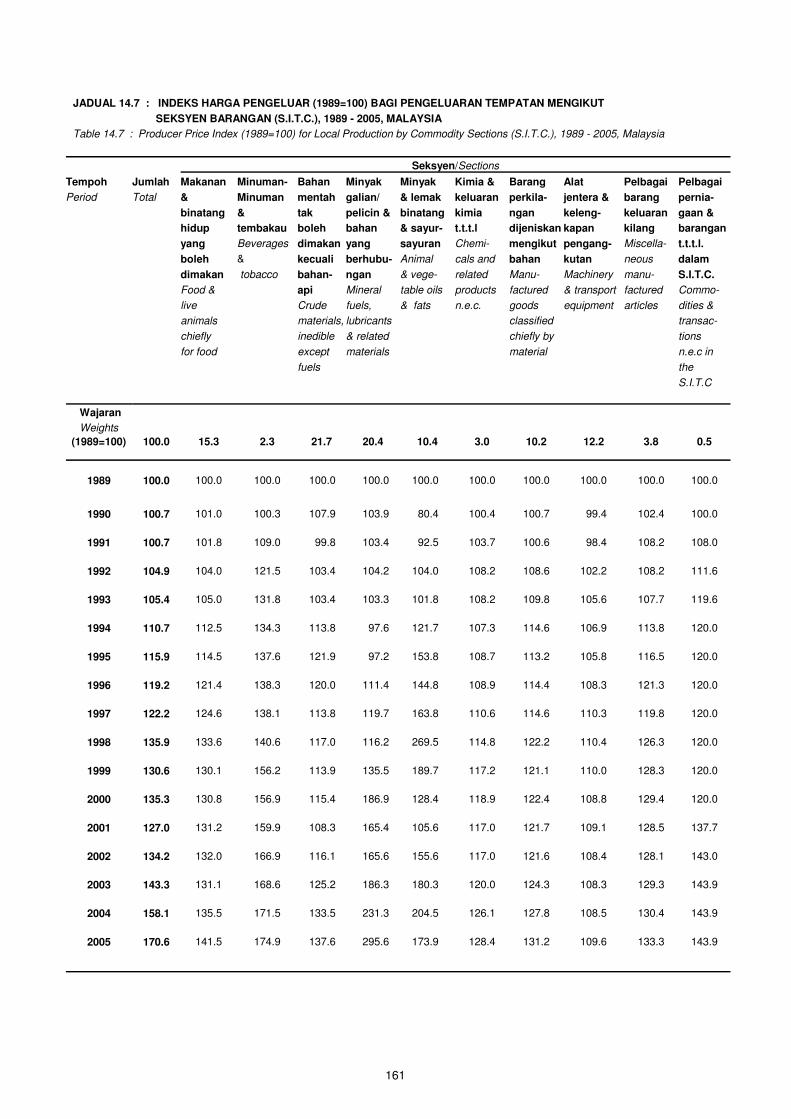
JADUAL 14.7 : INDEKS HARGA PENGELUAR (1989=100) BAGI PENGELUARAN TEMPATAN MENGIKUT
SEKSYEN BARANGAN (S.I.T.C.), 1989 - 2005, MALAYSIA
Table 14.7 : Producer Price Index (1989=100) for Local Production by Commodity Sections (S.I.T.C.), 1989 - 2005, Malaysia
Seksyen/Sections
Tempoh Jumlah Makanan Minuman- Bahan Minyak Minyak Kimia & Barang Alat Pelbagai Pelbagai
Period Total & Minuman mentah galian/ & lemak keluaran perkila- jentera & barang pernia-
binatang & tak pelicin & binatang kimia ngan keleng- keluaran gaan &
hidup tembakau boleh bahan & sayur- t.t.t.l dijeniskan kapan kilang barangan
yang Beverages dimakan yang sayuran Chemi- mengikut pengang- Miscella- t.t.t.l.
boleh & kecuali berhubu- Animal cals and bahan kutan neous dalam
dimakan tobacco bahan- ngan & vege- related Manu- Machinery manu- S.I.T.C.
Food & api Mineral table oils products factured & transport factured Commo-
live Crude fuels, & fats n.e.c. goods equipment articles dities &
animals materials, lubricants classified transac-
chiefly inedible & related chiefly by tions
for food except materials material n.e.c in
fuels the
S.I.T.C
Wajaran
Weights
(1989=100) 100.0 15.3 2.3 21.7 20.4 10.4 3.0 10.2 12.2 3.8 0.5
1989 100.0 100.0 100.0 100.0 100.0 100.0 100.0 100.0 100.0 100.0 100.0
1990 100.7 101.0 100.3 107.9 103.9 80.4 100.4 100.7 99.4 102.4 100.0
1991 100.7 101.8 109.0 99.8 103.4 92.5 103.7 100.6 98.4 108.2 108.0
1992 104.9 104.0 121.5 103.4 104.2 104.0 108.2 108.6 102.2 108.2 111.6
1993 105.4 105.0 131.8 103.4 103.3 101.8 108.2 109.8 105.6 107.7 119.6
1994 110.7 112.5 134.3 113.8 97.6 121.7 107.3 114.6 106.9 113.8 120.0
1995 115.9 114.5 137.6 121.9 97.2 153.8 108.7 113.2 105.8 116.5 120.0
1996 119.2 121.4 138.3 120.0 111.4 144.8 108.9 114.4 108.3 121.3 120.0
1997 122.2 124.6 138.1 113.8 119.7 163.8 110.6 114.6 110.3 119.8 120.0
1998 135.9 133.6 140.6 117.0 116.2 269.5 114.8 122.2 110.4 126.3 120.0
1999 130.6 130.1 156.2 113.9 135.5 189.7 117.2 121.1 110.0 128.3 120.0
2000 135.3 130.8 156.9 115.4 186.9 128.4 118.9 122.4 108.8 129.4 120.0
2001 127.0 131.2 159.9 108.3 165.4 105.6 117.0 121.7 109.1 128.5 137.7
2002 134.2 132.0 166.9 116.1 165.6 155.6 117.0 121.6 108.4 128.1 143.0
2003 143.3 131.1 168.6 125.2 186.3 180.3 120.0 124.3 108.3 129.3 143.9
2004 158.1 135.5 171.5 133.5 231.3 204.5 126.1 127.8 108.5 130.4 143.9
2005 170.6 141.5 174.9 137.6 295.6 173.9 128.4 131.2 109.6 133.3 143.9
161
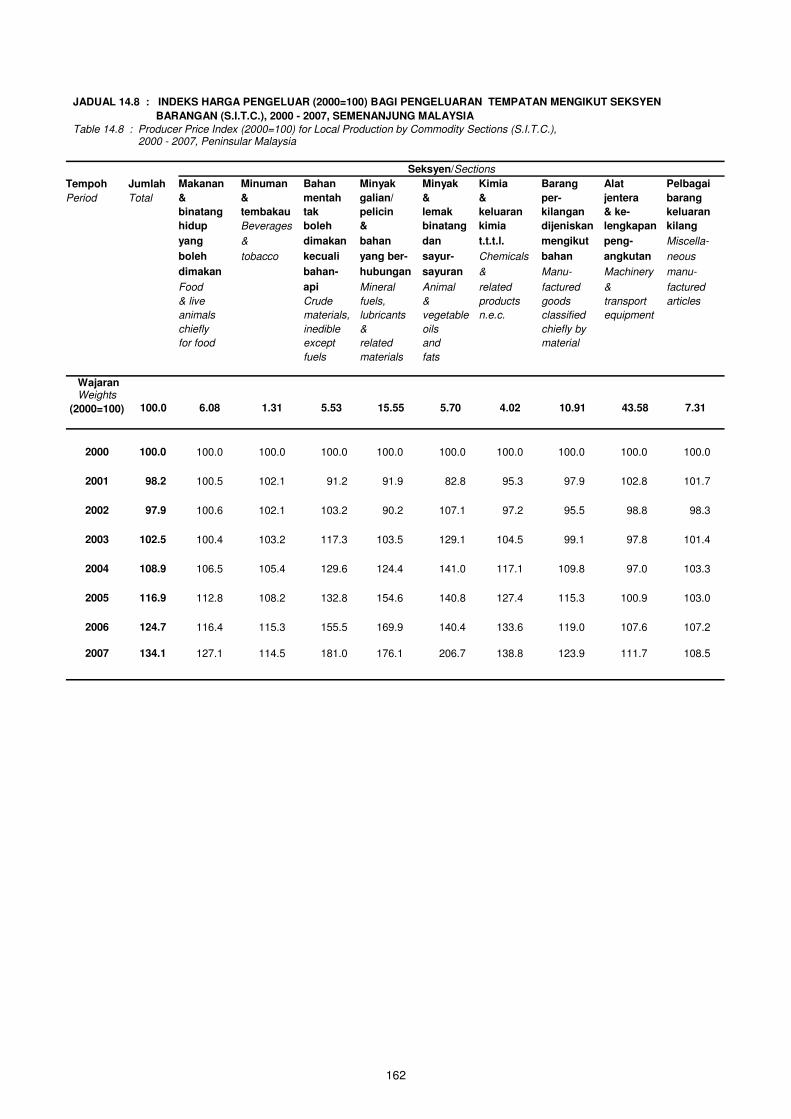
JADUAL 14.8 : INDEKS HARGA PENGELUAR (2000=100) BAGI PENGELUARAN TEMPATAN MENGIKUT SEKSYEN
BARANGAN (S.I.T.C.), 2000 - 2007, SEMENANJUNG MALAYSIA
Table 14.8 : Producer Price Index (2000=100) for Local Production by Commodity Sections (S.I.T.C.), 2000 - 2007, Peninsular Malaysia
Seksyen/Sections
Tempoh Jumlah Makanan Minuman Bahan Minyak Minyak Kimia Barang Alat Pelbagai
Period Total & & mentah galian/ & & per- jentera barang
binatang tembakau tak pelicin lemak keluaran kilangan & ke- keluaran
hidup Beverages boleh & binatang kimia dijeniskan lengkapan kilang
yang & dimakan bahan dan t.t.t.l. mengikut peng- Miscella-
boleh tobacco kecuali yang ber- sayur- Chemicals bahan angkutan neous
dimakan bahan- hubungan sayuran & Manu- Machinery manu-
Food api Mineral Animal related factured & factured
& live Crude fuels, & products goods transport articles
animals materials, lubricants vegetable n.e.c. classified equipment
chiefly inedible & oils chiefly by
for food except related and material
fuels materials fats
Wajaran Weights
(2000=100) 100.0 6.08 1.31 5.53 15.55 5.70 4.02 10.91 43.58 7.31
2000 100.0 100.0 100.0 100.0 100.0 100.0 100.0 100.0 100.0 100.0
2001 98.2 100.5 102.1 91.2 91.9 82.8 95.3 97.9 102.8 101.7
2002 97.9 100.6 102.1 103.2 90.2 107.1 97.2 95.5 98.8 98.3
2003 102.5 100.4 103.2 117.3 103.5 129.1 104.5 99.1 97.8 101.4
2004 108.9 106.5 105.4 129.6 124.4 141.0 117.1 109.8 97.0 103.3
2005 116.9 112.8 108.2 132.8 154.6 140.8 127.4 115.3 100.9 103.0
2006 124.7 116.4 115.3 155.5 169.9 140.4 133.6 119.0 107.6 107.2
2007 134.1 127.1 114.5 181.0 176.1 206.7 138.8 123.9 111.7 108.5
162
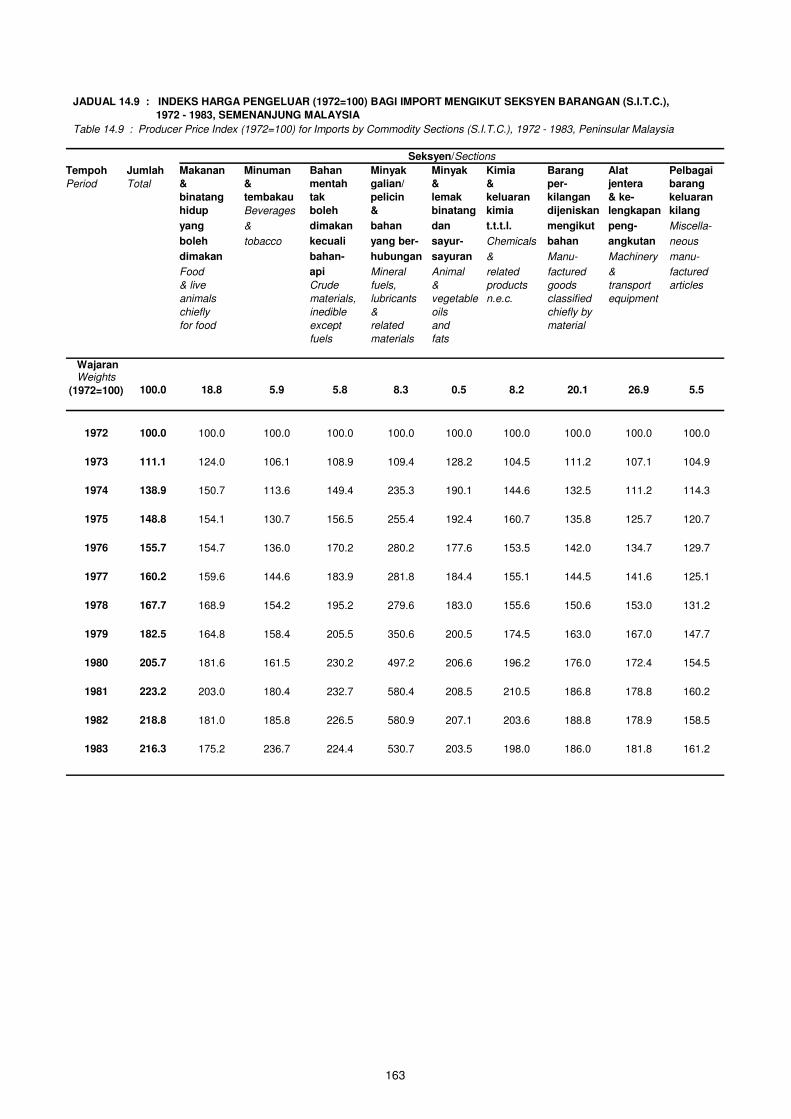
JADUAL 14.9 : INDEKS HARGA PENGELUAR (1972=100) BAGI IMPORT MENGIKUT SEKSYEN BARANGAN (S.I.T.C.),
1972 - 1983, SEMENANJUNG MALAYSIA
Table 14.9 : Producer Price Index (1972=100) for Imports by Commodity Sections (S.I.T.C.), 1972 - 1983, Peninsular Malaysia
Seksyen/Sections
Tempoh Jumlah Makanan Minuman Bahan Minyak Minyak Kimia Barang Alat Pelbagai
Period Total & & mentah galian/ & & per- jentera barang
binatang tembakau tak pelicin lemak keluaran kilangan & ke- keluaran
hidup Beverages boleh & binatang kimia dijeniskan lengkapan kilang
yang & dimakan bahan dan t.t.t.l. mengikut peng- Miscella-
boleh tobacco kecuali yang ber- sayur- Chemicals bahan angkutan neous
dimakan bahan- hubungan sayuran & Manu- Machinery manu-
Food api Mineral Animal related factured & factured
& live Crude fuels, & products goods transport articles
animals materials, lubricants vegetable n.e.c. classified equipment
chiefly inedible & oils chiefly by
for food except related and material
fuels materials fats
Wajaran Weights
(1972=100) 100.0 18.8 5.9 5.8 8.3 0.5 8.2 20.1 26.9 5.5
1972 100.0 100.0 100.0 100.0 100.0 100.0 100.0 100.0 100.0 100.0
1973 111.1 124.0 106.1 108.9 109.4 128.2 104.5 111.2 107.1 104.9
1974 138.9 150.7 113.6 149.4 235.3 190.1 144.6 132.5 111.2 114.3
1975 148.8 154.1 130.7 156.5 255.4 192.4 160.7 135.8 125.7 120.7
1976 155.7 154.7 136.0 170.2 280.2 177.6 153.5 142.0 134.7 129.7
1977 160.2 159.6 144.6 183.9 281.8 184.4 155.1 144.5 141.6 125.1
1978 167.7 168.9 154.2 195.2 279.6 183.0 155.6 150.6 153.0 131.2
1979 182.5 164.8 158.4 205.5 350.6 200.5 174.5 163.0 167.0 147.7
1980 205.7 181.6 161.5 230.2 497.2 206.6 196.2 176.0 172.4 154.5
1981 223.2 203.0 180.4 232.7 580.4 208.5 210.5 186.8 178.8 160.2
1982 218.8 181.0 185.8 226.5 580.9 207.1 203.6 188.8 178.9 158.5
1983 216.3 175.2 236.7 224.4 530.7 203.5 198.0 186.0 181.8 161.2
163
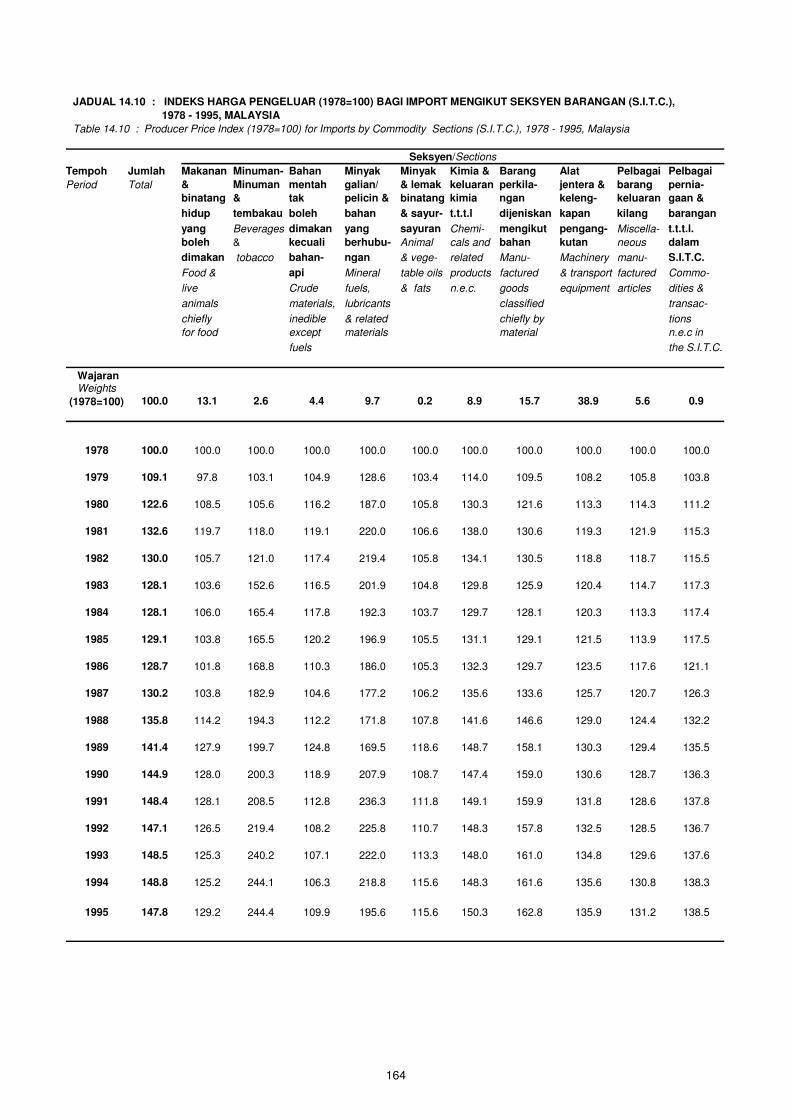
JADUAL 14.10 : INDEKS HARGA PENGELUAR (1978=100) BAGI IMPORT MENGIKUT SEKSYEN BARANGAN (S.I.T.C.),
1978 - 1995, MALAYSIA
Table 14.10 : Producer Price Index (1978=100) for Imports by Commodity Sections (S.I.T.C.), 1978 - 1995, Malaysia
Seksyen/Sections
Tempoh Jumlah Makanan Minuman- Bahan Minyak Minyak Kimia & Barang Alat Pelbagai Pelbagai
Period Total & Minuman mentah galian/ & lemak keluaran perkila- jentera & barang pernia-
binatang & tak pelicin & binatang kimia ngan keleng- keluaran gaan &
hidup tembakau boleh bahan & sayur- t.t.t.l dijeniskan kapan kilang barangan
yang Beverages dimakan yang sayuran Chemi- mengikut pengang- Miscella- t.t.t.l.
boleh & kecuali berhubu- Animal cals and bahan kutan neous dalam
dimakan tobacco bahan- ngan & vege- related Manu- Machinery manu- S.I.T.C.
Food & api Mineral table oils products factured & transport factured Commo-
live Crude fuels, & fats n.e.c. goods equipment articles dities &
animals materials, lubricants classified transac-
chiefly inedible & related chiefly by tions
for food except materials material n.e.c in
fuels the S.I.T.C.
(1978=100) 100.0 13.1 2.6 4.4 9.7 0.2 8.9 15.7 38.9 5.6 0.9
1979 109.1 97.8 103.1 104.9 128.6 103.4 114.0 109.5 108.2 105.8 103.8
1980 122.6 108.5 105.6 116.2 187.0 105.8 130.3 121.6 113.3 114.3 111.2
1981 132.6 119.7 118.0 119.1 220.0 106.6 138.0 130.6 119.3 121.9 115.3
1982 130.0 105.7 121.0 117.4 219.4 105.8 134.1 130.5 118.8 118.7 115.5
1983 128.1 103.6 152.6 116.5 201.9 104.8 129.8 125.9 120.4 114.7 117.3
1984 128.1 106.0 165.4 117.8 192.3 103.7 129.7 128.1 120.3 113.3 117.4
1985 129.1 103.8 165.5 120.2 196.9 105.5 131.1 129.1 121.5 113.9 117.5
1986 128.7 101.8 168.8 110.3 186.0 105.3 132.3 129.7 123.5 117.6 121.1
1987 130.2 103.8 182.9 104.6 177.2 106.2 135.6 133.6 125.7 120.7 126.3
1988 135.8 114.2 194.3 112.2 171.8 107.8 141.6 146.6 129.0 124.4 132.2
1989 141.4 127.9 199.7 124.8 169.5 118.6 148.7 158.1 130.3 129.4 135.5
1990 144.9 128.0 200.3 118.9 207.9 108.7 147.4 159.0 130.6 128.7 136.3
1991 148.4 128.1 208.5 112.8 236.3 111.8 149.1 159.9 131.8 128.6 137.8
1992 147.1 126.5 219.4 108.2 225.8 110.7 148.3 157.8 132.5 128.5 136.7
1993 148.5 125.3 240.2 107.1 222.0 113.3 148.0 161.0 134.8 129.6 137.6
1994 148.8 125.2 244.1 106.3 218.8 115.6 148.3 161.6 135.6 130.8 138.3
1995 147.8 129.2 244.4 109.9 195.6 115.6 150.3 162.8 135.9 131.2 138.5
Wajaran Weights
1978 100.0 100.0 100.0 100.0 100.0 100.0 100.0 100.0 100.0 100.0 100.0
164
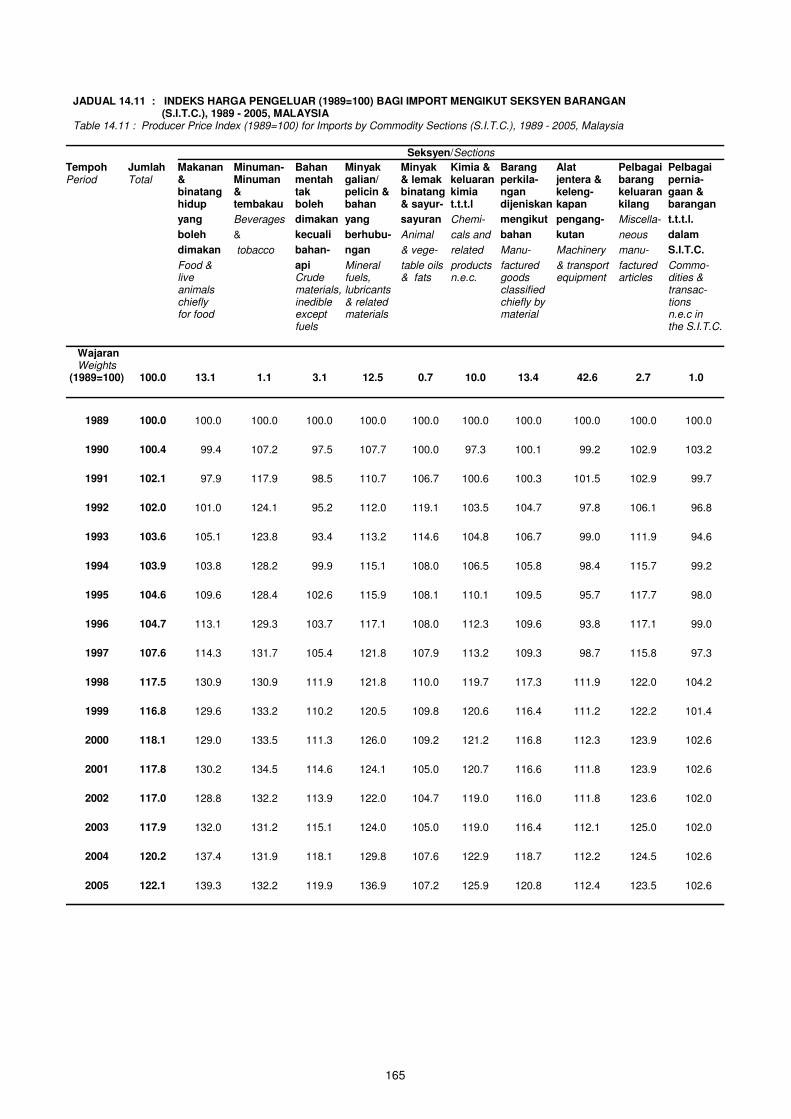
JADUAL 14.11 : INDEKS HARGA PENGELUAR (1989=100) BAGI IMPORT MENGIKUT SEKSYEN BARANGAN
(S.I.T.C.), 1989 - 2005, MALAYSIA
Table 14.11 : Producer Price Index (1989=100) for Imports by Commodity Sections (S.I.T.C.), 1989 - 2005, Malaysia
Seksyen/Sections
Tempoh Jumlah Makanan Minuman- Bahan Minyak Minyak Kimia & Barang Alat Pelbagai Pelbagai Period Total & Minuman mentah galian/ & lemak keluaran perkila- jentera & barang pernia- binatang & tak pelicin & binatang kimia ngan keleng- keluaran gaan &
hidup tembakau boleh bahan & sayur- t.t.t.l dijeniskan kapan kilang barangan
yang Beverages dimakan yang sayuran Chemi- mengikut pengang- Miscella- t.t.t.l.
boleh & kecuali berhubu- Animal cals and bahan kutan neous dalam
dimakan tobacco bahan- ngan & vege- related Manu- Machinery manu- S.I.T.C.
Food & api Mineral table oils products factured & transport factured Commo- live Crude fuels, & fats n.e.c. goods equipment articles dities &
animals materials, lubricants classified transac- chiefly inedible & related chiefly by tions
for food except materials material n.e.c in
fuels the S.I.T.C.
Wajaran Weights
(1989=100) 100.0 13.1 1.1 3.1 12.5 0.7 10.0 13.4 42.6 2.7 1.0
1989 100.0 100.0 100.0 100.0 100.0 100.0 100.0 100.0 100.0 100.0 100.0
1990 100.4 99.4 107.2 97.5 107.7 100.0 97.3 100.1 99.2 102.9 103.2
1991 102.1 97.9 117.9 98.5 110.7 106.7 100.6 100.3 101.5 102.9 99.7
1992 102.0 101.0 124.1 95.2 112.0 119.1 103.5 104.7 97.8 106.1 96.8
1993 103.6 105.1 123.8 93.4 113.2 114.6 104.8 106.7 99.0 111.9 94.6
1994 103.9 103.8 128.2 99.9 115.1 108.0 106.5 105.8 98.4 115.7 99.2
1995 104.6 109.6 128.4 102.6 115.9 108.1 110.1 109.5 95.7 117.7 98.0
1996 104.7 113.1 129.3 103.7 117.1 108.0 112.3 109.6 93.8 117.1 99.0
1997 107.6 114.3 131.7 105.4 121.8 107.9 113.2 109.3 98.7 115.8 97.3
1998 117.5 130.9 130.9 111.9 121.8 110.0 119.7 117.3 111.9 122.0 104.2
1999 116.8 129.6 133.2 110.2 120.5 109.8 120.6 116.4 111.2 122.2 101.4
2000 118.1 129.0 133.5 111.3 126.0 109.2 121.2 116.8 112.3 123.9 102.6
2001 117.8 130.2 134.5 114.6 124.1 105.0 120.7 116.6 111.8 123.9 102.6
2002 117.0 128.8 132.2 113.9 122.0 104.7 119.0 116.0 111.8 123.6 102.0
2003 117.9 132.0 131.2 115.1 124.0 105.0 119.0 116.4 112.1 125.0 102.0
2004 120.2 137.4 131.9 118.1 129.8 107.6 122.9 118.7 112.2 124.5 102.6
2005 122.1 139.3 132.2 119.9 136.9 107.2 125.9 120.8 112.4 123.5 102.6
165
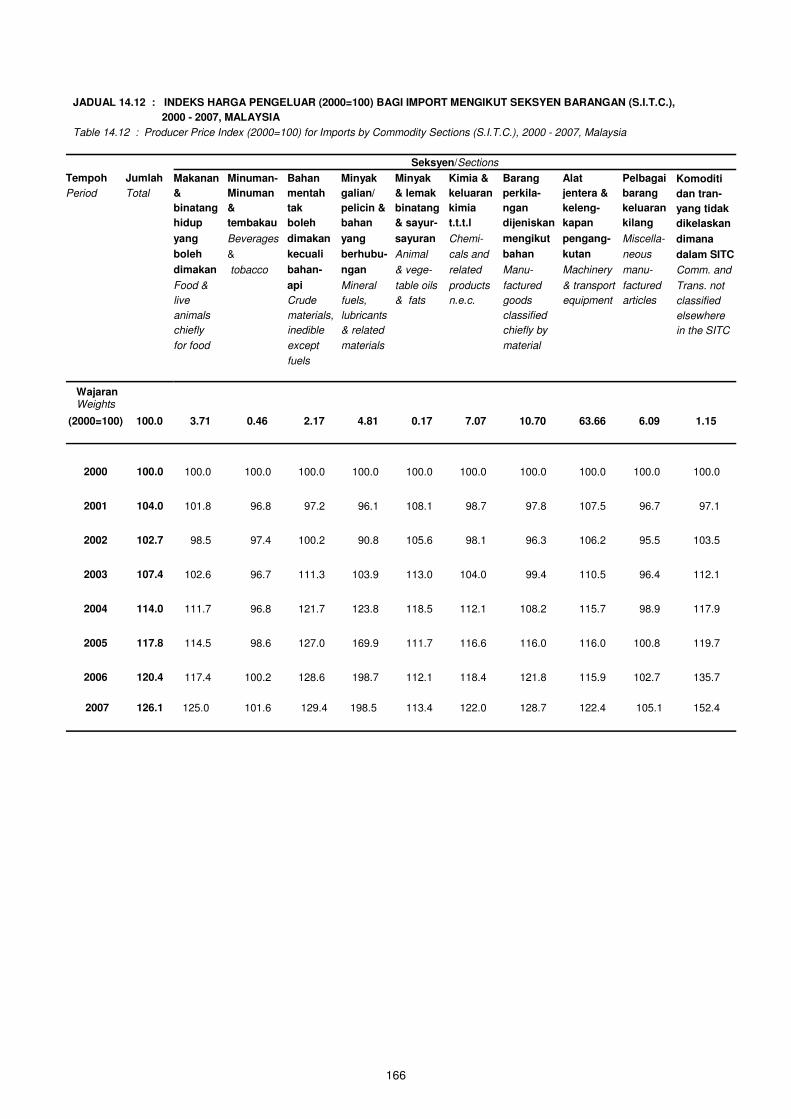
JADUAL 14.12 : INDEKS HARGA PENGELUAR (2000=100) BAGI IMPORT MENGIKUT SEKSYEN BARANGAN (S.I.T.C.),
2000 - 2007, MALAYSIA
Table 14.12 : Producer Price Index (2000=100) for Imports by Commodity Sections (S.I.T.C.), 2000 - 2007, Malaysia
Seksyen/Sections
Tempoh Jumlah Makanan Minuman- Bahan Minyak Minyak Kimia & Barang Alat Pelbagai Komoditi
Period Total & Minuman mentah galian/ & lemak keluaran perkila- jentera & barang dan tran-
binatang & tak pelicin & binatang kimia ngan keleng- keluaran yang tidak
hidup tembakau boleh bahan & sayur- t.t.t.l dijeniskan kapan kilang dikelaskan
yang Beverages dimakan yang sayuran Chemi- mengikut pengang- Miscella- dimana
boleh & kecuali berhubu- Animal cals and bahan kutan neous dalam SITC
dimakan tobacco bahan- ngan & vege- related Manu- Machinery manu- Comm. and
Food & api Mineral table oils products factured & transport factured Trans. not
live Crude fuels, & fats n.e.c. goods equipment articles classified
animals materials, lubricants classified elsewhere
chiefly inedible & related chiefly by in the SITC
for food except materials material
fuels
Wajaran Weights
(2000=100) 100.0 3.71 0.46 2.17 4.81 0.17 7.07 10.70 63.66 6.09 1.15
2000 100.0 100.0 100.0 100.0 100.0 100.0 100.0 100.0 100.0 100.0 100.0
2001 104.0 101.8 96.8 97.2 96.1 108.1 98.7 97.8 107.5 96.7 97.1
2002 102.7 98.5 97.4 100.2 90.8 105.6 98.1 96.3 106.2 95.5 103.5
2003 107.4 102.6 96.7 111.3 103.9 113.0 104.0 99.4 110.5 96.4 112.1
2004 114.0 111.7 96.8 121.7 123.8 118.5 112.1 108.2 115.7 98.9 117.9
2005 117.8 114.5 98.6 127.0 169.9 111.7 116.6 116.0 116.0 100.8 119.7
2006 120.4 117.4 100.2 128.6 198.7 112.1 118.4 121.8 115.9 102.7 135.7
2007 126.1 125.0 101.6 129.4 198.5 113.4 122.0 128.7 122.4 105.1 152.4
166


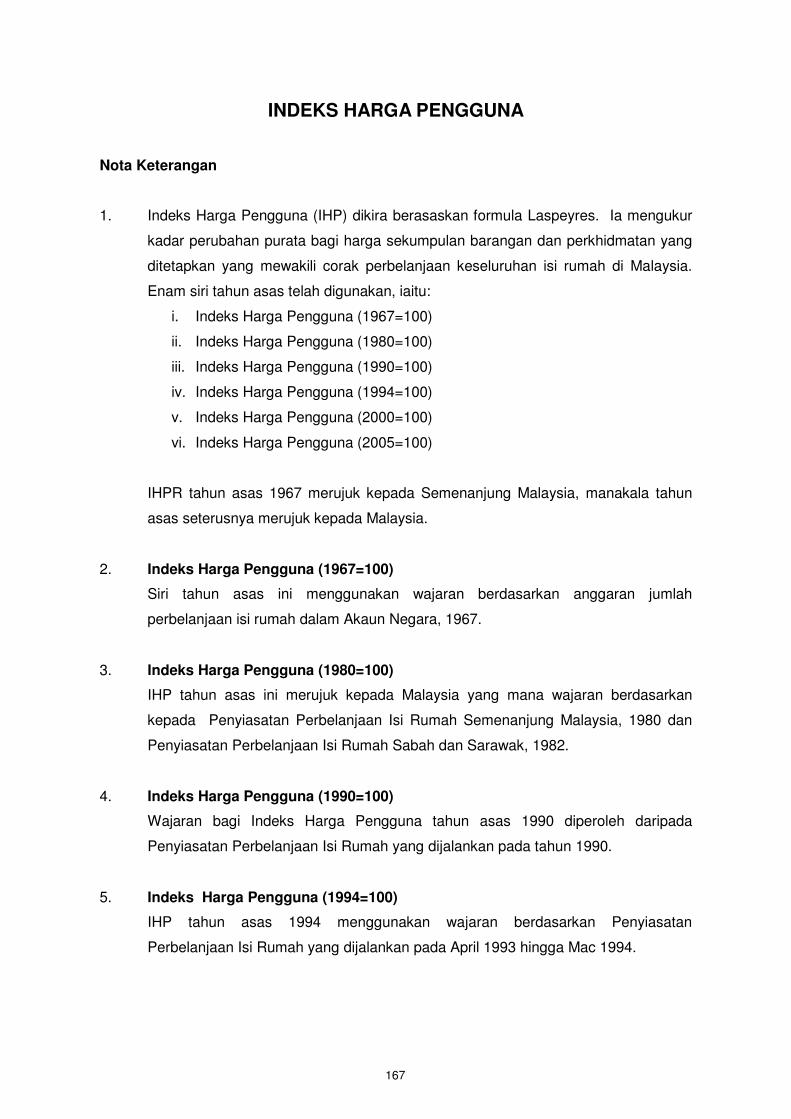
INDEKS HARGA PENGGUNA
Nota Keterangan
1. Indeks Harga Pengguna (IHP) dikira berasaskan formula Laspeyres. Ia mengukur
kadar perubahan purata bagi harga sekumpulan barangan dan perkhidmatan yang
ditetapkan yang mewakili corak perbelanjaan keseluruhan isi rumah di Malaysia.
Enam siri tahun asas telah digunakan, iaitu:
i. Indeks Harga Pengguna (1967=100)
ii. Indeks Harga Pengguna (1980=100)
iii. Indeks Harga Pengguna (1990=100)
iv. Indeks Harga Pengguna (1994=100)
v. Indeks Harga Pengguna (2000=100)
vi. Indeks Harga Pengguna (2005=100)
IHPR tahun asas 1967 merujuk kepada Semenanjung Malaysia, manakala tahun
asas seterusnya merujuk kepada Malaysia.
2. Indeks Harga Pengguna (1967=100)
Siri tahun asas ini menggunakan wajaran berdasarkan anggaran jumlah
perbelanjaan isi rumah dalam Akaun Negara, 1967.
3. Indeks Harga Pengguna (1980=100)
IHP tahun asas ini merujuk kepada Malaysia yang mana wajaran berdasarkan
kepada Penyiasatan Perbelanjaan Isi Rumah Semenanjung Malaysia, 1980 dan
Penyiasatan Perbelanjaan Isi Rumah Sabah dan Sarawak, 1982.
4. Indeks Harga Pengguna (1990=100)
Wajaran bagi Indeks Harga Pengguna tahun asas 1990 diperoleh daripada
Penyiasatan Perbelanjaan Isi Rumah yang dijalankan pada tahun 1990.
5. Indeks Harga Pengguna (1994=100)
IHP tahun asas 1994 menggunakan wajaran berdasarkan Penyiasatan
Perbelanjaan Isi Rumah yang dijalankan pada April 1993 hingga Mac 1994.
167
6. Indeks Harga Pengguna (2000=100)
Wajaran perbelanjaan untuk Semenanjung Malaysia, Sabah dan Sarawak diperoleh
daripada Penyiasatan Perbelanjaan Isi Rumah yang dijalankan bagi dua belas
bulan rujukan dari Julai 1998 hingga Jun 1999 dan kemudiannya disesuaikan
kepada tahun asas. Berdasarkan wajaran ini, perkadaran perbelanjaan kawasan
telah diperoleh iaitu 81.57 peratus bagi Semenanjung Malaysia, 8.90 peratus bagi
Sabah dan 9.53 peratus bagi Sarawak. Wajaran-wajaran kawasan kemudiannya
ditukarkan menjadi wajaran Malaysia dengan menggunakan perkadaran
perbelanjaan kawasan-kawasan berkenaan.
7. Indeks Harga Pengguna (2005=100) Siri ini merupakan siri semasa yang dikumpul dan diterbitkan oleh Jabatan.
Wajaran perbelanjaan untuk Semenanjung Malaysia, Sabah dan Sarawak diperoleh
daripada penyiasatan Perbelanjaan Isi Rumah yang dijalankan daripada Jun 2004
hingga Mei 2005 yang kemudian disesuaikan kepada tahun asas. Untuk siri ini,
wajaran bagi Malaysia diperoleh berdasarkan wajaran bandar dan luar bandar
dengan menggunakan perkadaran perbelanjaan.
168
CONSUMER PRICE INDEX
Explanatory Notes
1. The Consumer Price Index (CPI) is calculated based on the Laspeyres formula.
It measures the average rate of change in prices of a fixed basket of goods and
services that represents the expenditure pattern of all households in Malaysia.
Six series with different base years are being used, that is :
i. Consumer Price Index (1967=100)
ii. Consumer Price Index (1980=100)
iii. Consumer Price Index (1990=100)
iv. Consumer Price Index (1994=100)
v. Consumer Price Index (2000=100)
vi. Consumer Price Index (2005=100)
Relatives Consumer Price Index for base year 1967 refers to Peninsular Malaysia,
while the base year after refers to Malaysia.
2. Consumer Price Index (1967=100)
The series of this base year relates to weight that based on the estimated total
household expenditure in the National Accounts, 1967.
3. Consumer Price Index (1980=100)
The CPI for this base year refers to Malaysia which is weighted based on the
Household Expenditure Surveys Peninsular Malaysia, 1980 and the Household
Expenditure Surveys Sabah and Sarawak, 1982.
4. Consumer Price Index (1990=100)
The weights for Consumer Price Index based 1990 are derived from the Household
Expenditure Survey which conducted in 1990.
5. Consumer Price Index (1994=100)
The CPI for base year 1994 is weighted based on the Household Expenditure
Survey which conducted in April 1993 to March 1994.
169
6. Consumer Price Index (2000=100)
The expenditure weights for Peninsular Malaysia, Sabah and Sarawak were
derived from the Household Expenditure Survey conducted for twelve reference
months from July 1998 to June 1999 and were subsequently adjusted to the base
year. Based on these weights, the regional expenditure proportions were obtained
as 81.57 per cent for Peninsular Malaysia, 8.90 per cent for Sabah and 9.53 per
cent for Sarawak. The regional weights were then converted to Malaysia weights
using these regional expenditure proportions.
7. Consumer Price Index (2005=100)
This is the current series compiled and published by the Department. The
expenditure weights for Peninsular Malaysia, Sabah and Sarawak were derived
from the Household Expenditure Survey conducted for twelve reference months
from June 2004 to May 2005 and were subsequently adjusted to the base year. For
this series, weights for Malaysia were derived based on urban and rural weights
using the expenditure proportions.
170
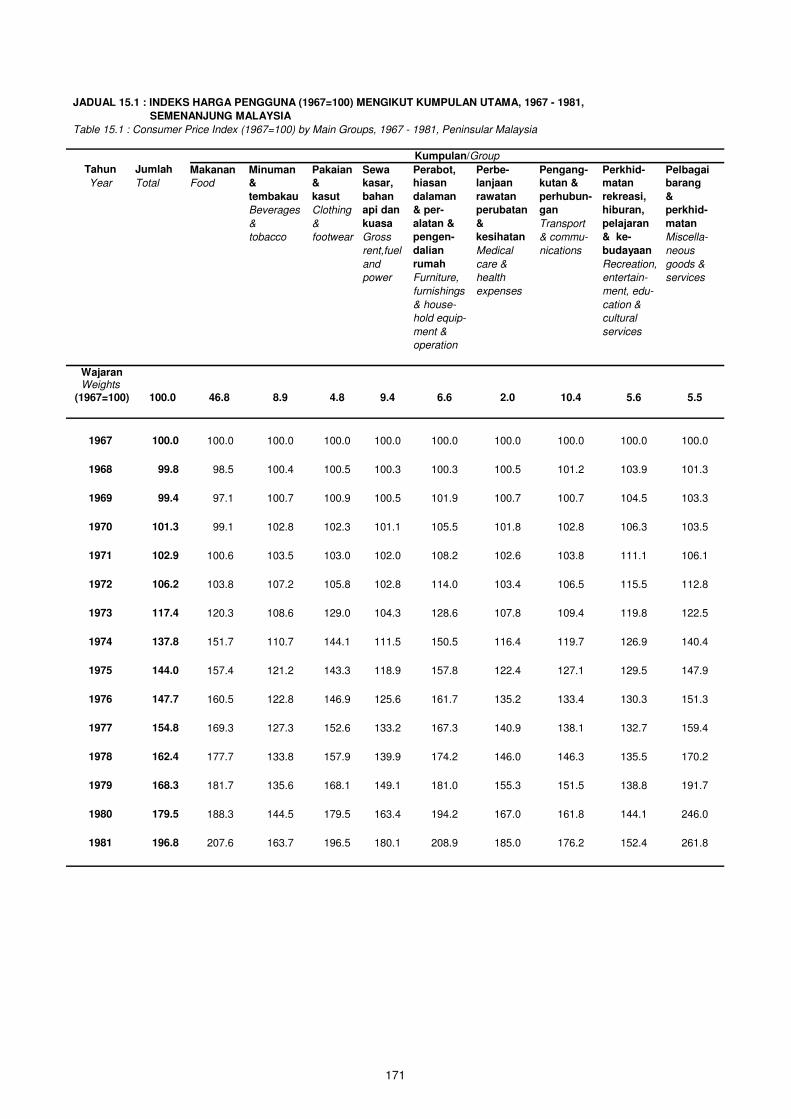
JADUAL 15.1 : INDEKS HARGA PENGGUNA (1967=100) MENGIKUT KUMPULAN UTAMA, 1967 - 1981,
SEMENANJUNG MALAYSIA
Table 15.1 : Consumer Price Index (1967=100) by Main Groups, 1967 - 1981, Peninsular Malaysia
Kumpulan/Group
Tahun Jumlah Makanan Minuman Pakaian Sewa Perabot, Perbe- Pengang- Perkhid- Pelbagai
Year Total Food & & kasar, hiasan lanjaan kutan & matan barang
tembakau kasut bahan dalaman rawatan perhubun- rekreasi, &
Beverages Clothing api dan & per- perubatan gan hiburan, perkhid-
& & kuasa alatan & & Transport pelajaran matan
tobacco footwear Gross pengen- kesihatan & commu- & ke- Miscella-
rent,fuel dalian Medical nications budayaan neous
and rumah care & Recreation, goods &
power Furniture, health entertain- services
furnishings expenses ment, edu-
& house- cation &
hold equip- cultural
ment & services
operation
Wajaran Weights
(1967=100) 100.0 46.8 8.9 4.8 9.4 6.6 2.0 10.4 5.6 5.5
1967 100.0 100.0 100.0 100.0 100.0 100.0 100.0 100.0 100.0 100.0
1968 99.8 98.5 100.4 100.5 100.3 100.3 100.5 101.2 103.9 101.3
1969 99.4 97.1 100.7 100.9 100.5 101.9 100.7 100.7 104.5 103.3
1970 101.3 99.1 102.8 102.3 101.1 105.5 101.8 102.8 106.3 103.5
1971 102.9 100.6 103.5 103.0 102.0 108.2 102.6 103.8 111.1 106.1
1972 106.2 103.8 107.2 105.8 102.8 114.0 103.4 106.5 115.5 112.8
1973 117.4 120.3 108.6 129.0 104.3 128.6 107.8 109.4 119.8 122.5
1974 137.8 151.7 110.7 144.1 111.5 150.5 116.4 119.7 126.9 140.4
1975 144.0 157.4 121.2 143.3 118.9 157.8 122.4 127.1 129.5 147.9
1976 147.7 160.5 122.8 146.9 125.6 161.7 135.2 133.4 130.3 151.3
1977 154.8 169.3 127.3 152.6 133.2 167.3 140.9 138.1 132.7 159.4
1978 162.4 177.7 133.8 157.9 139.9 174.2 146.0 146.3 135.5 170.2
1979 168.3 181.7 135.6 168.1 149.1 181.0 155.3 151.5 138.8 191.7
1980 179.5 188.3 144.5 179.5 163.4 194.2 167.0 161.8 144.1 246.0
1981 196.8 207.6 163.7 196.5 180.1 208.9 185.0 176.2 152.4 261.8
171
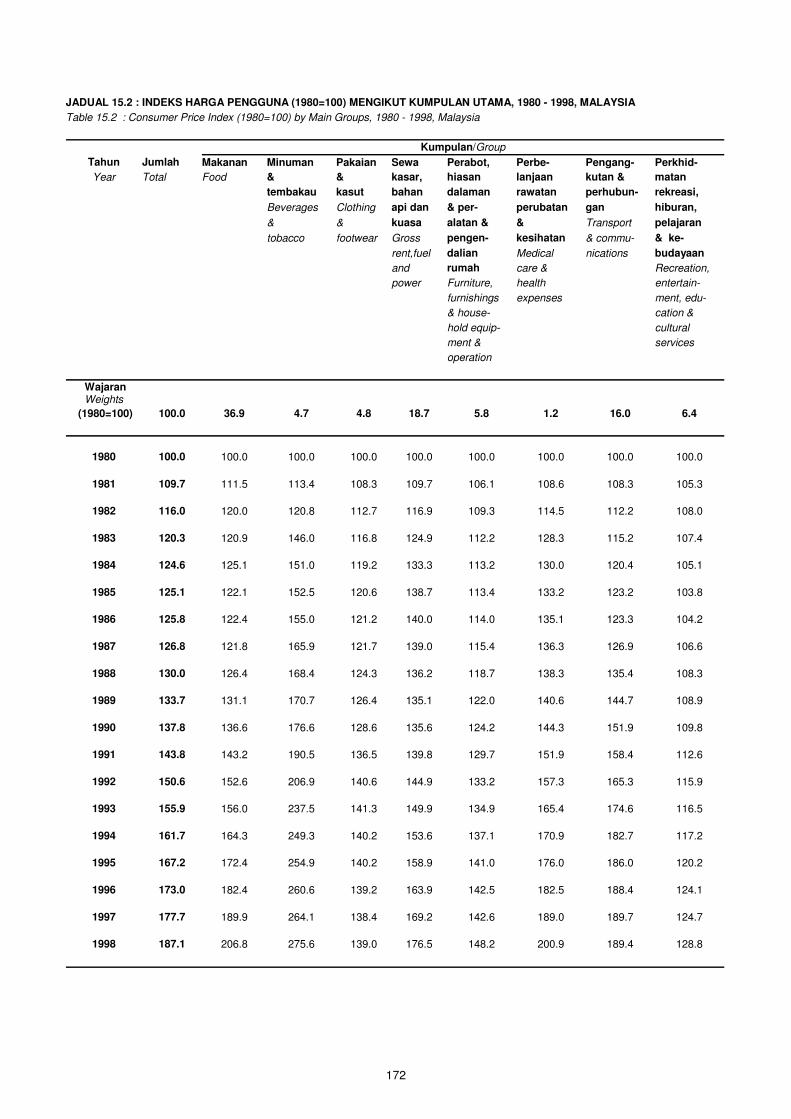
JADUAL 15.2 : INDEKS HARGA PENGGUNA (1980=100) MENGIKUT KUMPULAN UTAMA, 1980 - 1998, MALAYSIA
Table 15.2 : Consumer Price Index (1980=100) by Main Groups, 1980 - 1998, Malaysia
Kumpulan/Group
Tahun Jumlah Makanan Minuman Pakaian Sewa Perabot, Perbe- Pengang- Perkhid-
Year Total Food & & kasar, hiasan lanjaan kutan & matan
tembakau kasut bahan dalaman rawatan perhubun- rekreasi,
Beverages Clothing api dan & per- perubatan gan hiburan,
& & kuasa alatan & & Transport pelajaran
tobacco footwear Gross pengen- kesihatan & commu- & ke-
rent,fuel dalian Medical nications budayaan
and rumah care & Recreation,
power Furniture, health entertain-
furnishings expenses ment, edu-
& house- cation &
hold equip- cultural
ment & services
operation
Wajaran Weights
(1980=100) 100.0 36.9 4.7 4.8 18.7 5.8 1.2 16.0 6.4
1980 100.0 100.0 100.0 100.0 100.0 100.0 100.0 100.0 100.0
1981 109.7 111.5 113.4 108.3 109.7 106.1 108.6 108.3 105.3
1982 116.0 120.0 120.8 112.7 116.9 109.3 114.5 112.2 108.0
1983 120.3 120.9 146.0 116.8 124.9 112.2 128.3 115.2 107.4
1984 124.6 125.1 151.0 119.2 133.3 113.2 130.0 120.4 105.1
1985 125.1 122.1 152.5 120.6 138.7 113.4 133.2 123.2 103.8
1986 125.8 122.4 155.0 121.2 140.0 114.0 135.1 123.3 104.2
1987 126.8 121.8 165.9 121.7 139.0 115.4 136.3 126.9 106.6
1988 130.0 126.4 168.4 124.3 136.2 118.7 138.3 135.4 108.3
1989 133.7 131.1 170.7 126.4 135.1 122.0 140.6 144.7 108.9
1990 137.8 136.6 176.6 128.6 135.6 124.2 144.3 151.9 109.8
1991 143.8 143.2 190.5 136.5 139.8 129.7 151.9 158.4 112.6
1992 150.6 152.6 206.9 140.6 144.9 133.2 157.3 165.3 115.9
1993 155.9 156.0 237.5 141.3 149.9 134.9 165.4 174.6 116.5
1994 161.7 164.3 249.3 140.2 153.6 137.1 170.9 182.7 117.2
1995 167.2 172.4 254.9 140.2 158.9 141.0 176.0 186.0 120.2
1996 173.0 182.4 260.6 139.2 163.9 142.5 182.5 188.4 124.1
1997 177.7 189.9 264.1 138.4 169.2 142.6 189.0 189.7 124.7
1998 187.1 206.8 275.6 139.0 176.5 148.2 200.9 189.4 128.8
172
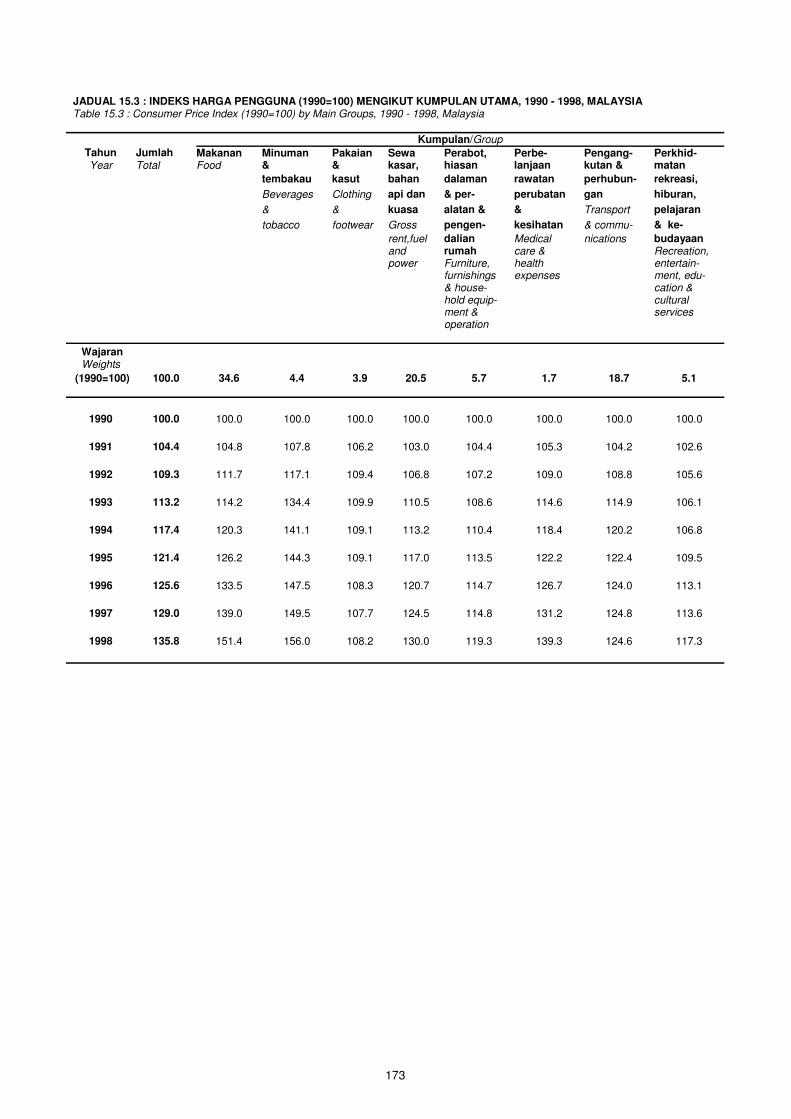
JADUAL 15.3 : INDEKS HARGA PENGGUNA (1990=100) MENGIKUT KUMPULAN UTAMA, 1990 - 1998, MALAYSIA
Table 15.3 : Consumer Price Index (1990=100) by Main Groups, 1990 - 1998, Malaysia
Kumpulan/Group
Tahun Jumlah Makanan Minuman Pakaian Sewa Perabot, Perbe- Pengang- Perkhid- Year Total Food & & kasar, hiasan lanjaan kutan & matan
tembakau kasut bahan dalaman rawatan perhubun- rekreasi,
Beverages Clothing api dan & per- perubatan gan hiburan,
& & kuasa alatan & & Transport pelajaran
tobacco footwear Gross pengen- kesihatan & commu- & ke-
rent,fuel dalian Medical nications budayaan
and rumah care & Recreation, power Furniture, health entertain-
furnishings expenses ment, edu- & house- cation &
hold equip- cultural ment & services
operation
Wajaran Weights
(1990=100) 100.0 34.6 4.4 3.9 20.5 5.7 1.7 18.7 5.1
1990 100.0 100.0 100.0 100.0 100.0 100.0 100.0 100.0 100.0
1991 104.4 104.8 107.8 106.2 103.0 104.4 105.3 104.2 102.6
1992 109.3 111.7 117.1 109.4 106.8 107.2 109.0 108.8 105.6
1993 113.2 114.2 134.4 109.9 110.5 108.6 114.6 114.9 106.1
1994 117.4 120.3 141.1 109.1 113.2 110.4 118.4 120.2 106.8
1995 121.4 126.2 144.3 109.1 117.0 113.5 122.2 122.4 109.5
1996 125.6 133.5 147.5 108.3 120.7 114.7 126.7 124.0 113.1
1997 129.0 139.0 149.5 107.7 124.5 114.8 131.2 124.8 113.6
1998 135.8 151.4 156.0 108.2 130.0 119.3 139.3 124.6 117.3
173
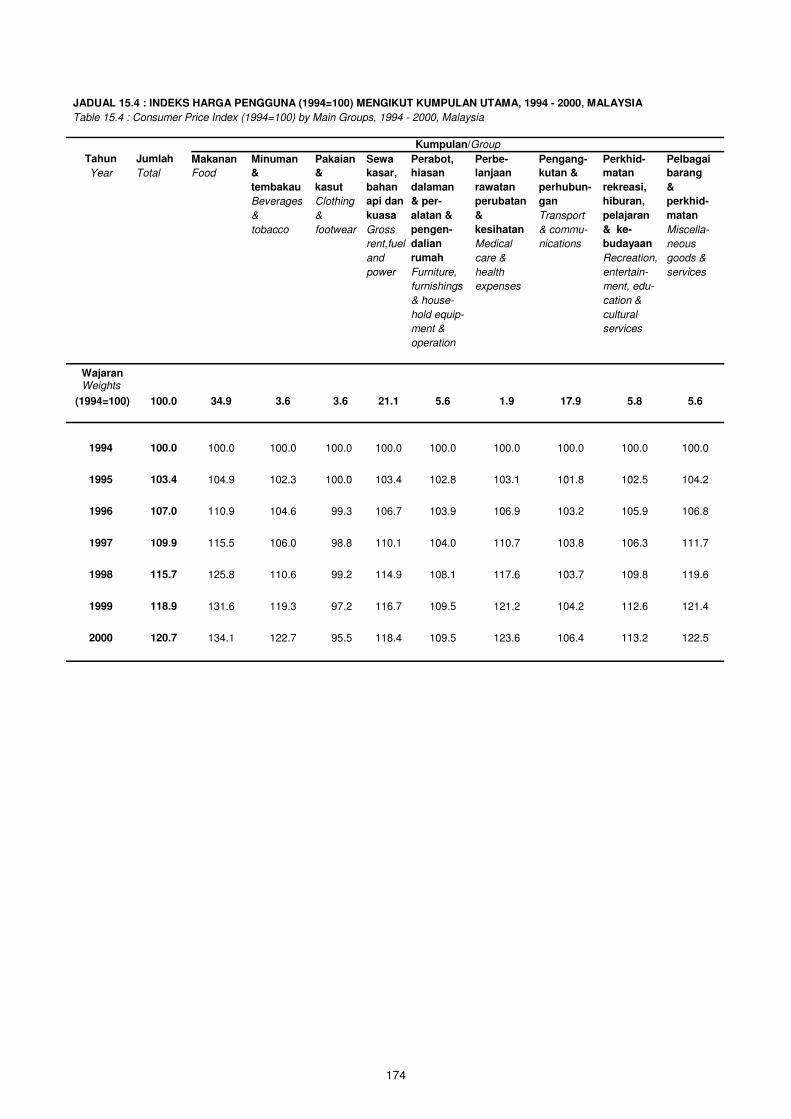
JADUAL 15.4 : INDEKS HARGA PENGGUNA (1994=100) MENGIKUT KUMPULAN UTAMA, 1994 - 2000, MALAYSIA
Table 15.4 : Consumer Price Index (1994=100) by Main Groups, 1994 - 2000, Malaysia
Kumpulan/Group
Tahun Jumlah Makanan Minuman Pakaian Sewa Perabot, Perbe- Pengang- Perkhid- Pelbagai
Year Total Food & & kasar, hiasan lanjaan kutan & matan barang
tembakau kasut bahan dalaman rawatan perhubun- rekreasi, &
Beverages Clothing api dan & per- perubatan gan hiburan, perkhid-
& & kuasa alatan & & Transport pelajaran matan
tobacco footwear Gross pengen- kesihatan & commu- & ke- Miscella-
rent,fuel dalian Medical nications budayaan neous
and rumah care & Recreation, goods &
power Furniture, health entertain- services
furnishings expenses ment, edu-
& house- cation &
hold equip- cultural
ment & services
operation
Wajaran Weights
(1994=100) 100.0 34.9 3.6 3.6 21.1 5.6 1.9 17.9 5.8 5.6
1994 100.0 100.0 100.0 100.0 100.0 100.0 100.0 100.0 100.0 100.0
1995 103.4 104.9 102.3 100.0 103.4 102.8 103.1 101.8 102.5 104.2
1996 107.0 110.9 104.6 99.3 106.7 103.9 106.9 103.2 105.9 106.8
1997 109.9 115.5 106.0 98.8 110.1 104.0 110.7 103.8 106.3 111.7
1998 115.7 125.8 110.6 99.2 114.9 108.1 117.6 103.7 109.8 119.6
1999 118.9 131.6 119.3 97.2 116.7 109.5 121.2 104.2 112.6 121.4
2000 120.7 134.1 122.7 95.5 118.4 109.5 123.6 106.4 113.2 122.5
174
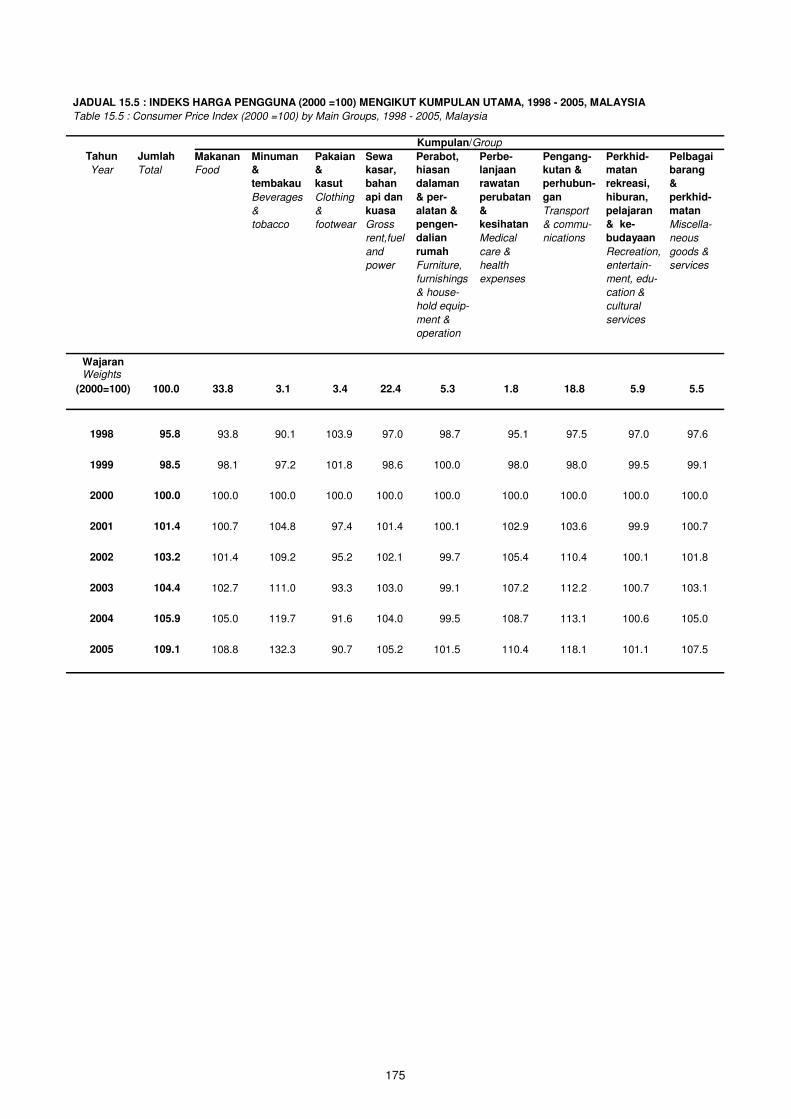
JADUAL 15.5 : INDEKS HARGA PENGGUNA (2000 =100) MENGIKUT KUMPULAN UTAMA, 1998 - 2005, MALAYSIA
Table 15.5 : Consumer Price Index (2000 =100) by Main Groups, 1998 - 2005, Malaysia
Kumpulan/Group
Tahun Jumlah Makanan Minuman Pakaian Sewa Perabot, Perbe- Pengang- Perkhid- Pelbagai
Year Total Food & & kasar, hiasan lanjaan kutan & matan barang
tembakau kasut bahan dalaman rawatan perhubun- rekreasi, &
Beverages Clothing api dan & per- perubatan gan hiburan, perkhid-
& & kuasa alatan & & Transport pelajaran matan
tobacco footwear Gross pengen- kesihatan & commu- & ke- Miscella-
rent,fuel dalian Medical nications budayaan neous
and rumah care & Recreation, goods &
power Furniture, health entertain- services
furnishings expenses ment, edu-
& house- cation &
hold equip- cultural
ment & services
operation
Wajaran Weights
(2000=100) 100.0 33.8 3.1 3.4 22.4 5.3 1.8 18.8 5.9 5.5
1998 95.8 93.8 90.1 103.9 97.0 98.7 95.1 97.5 97.0 97.6
1999 98.5 98.1 97.2 101.8 98.6 100.0 98.0 98.0 99.5 99.1
2000 100.0 100.0 100.0 100.0 100.0 100.0 100.0 100.0 100.0 100.0
2001 101.4 100.7 104.8 97.4 101.4 100.1 102.9 103.6 99.9 100.7
2002 103.2 101.4 109.2 95.2 102.1 99.7 105.4 110.4 100.1 101.8
2003 104.4 102.7 111.0 93.3 103.0 99.1 107.2 112.2 100.7 103.1
2004 105.9 105.0 119.7 91.6 104.0 99.5 108.7 113.1 100.6 105.0
2005 109.1 108.8 132.3 90.7 105.2 101.5 110.4 118.1 101.1 107.5
175
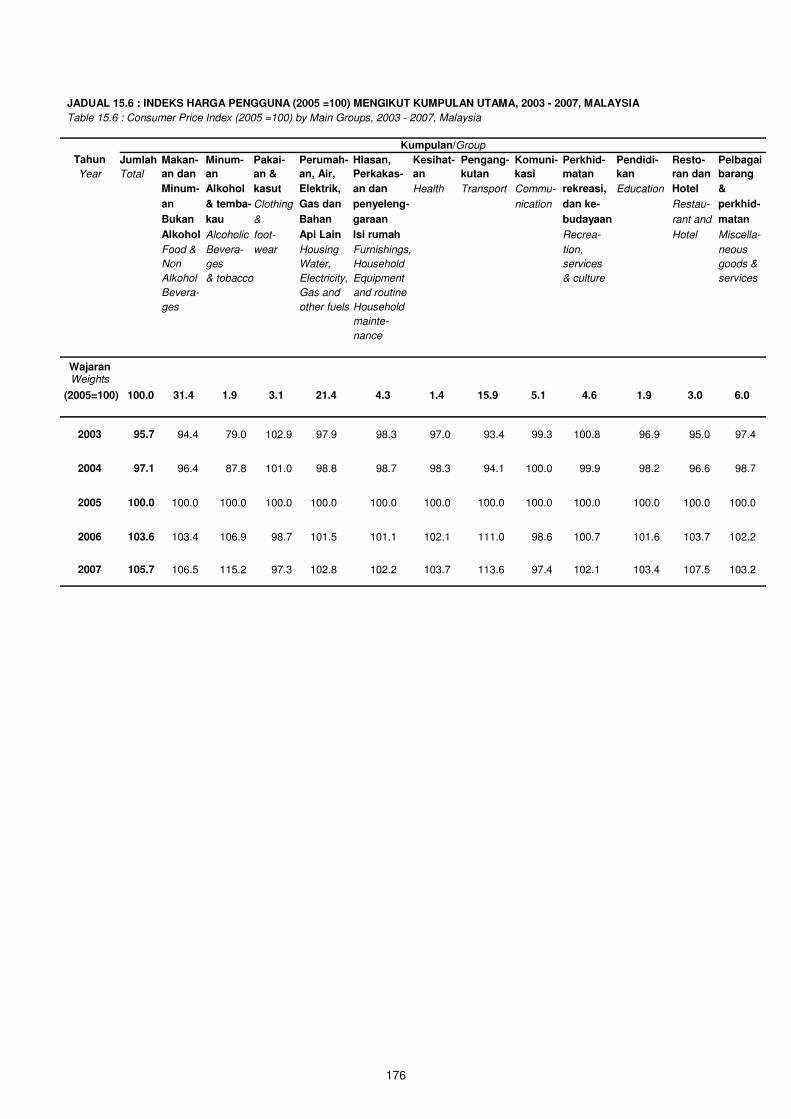
JADUAL 15.6 : INDEKS HARGA PENGGUNA (2005 =100) MENGIKUT KUMPULAN UTAMA, 2003 - 2007, MALAYSIA
Table 15.6 : Consumer Price Index (2005 =100) by Main Groups, 2003 - 2007, Malaysia
Kumpulan/Group
Tahun Jumlah Makan- Minum- Pakai- Perumah- Hiasan, Kesihat- Pengang- Komuni- Perkhid- Pendidi- Resto- Pelbagai
Year Total an dan an an & an, Air, Perkakas- an kutan kasi matan kan ran dan barang
Minum- Alkohol kasut Elektrik, an dan Health Transport Commu- rekreasi, Education Hotel &
an & temba- Clothing Gas dan penyeleng- nication dan ke- Restau- perkhid-
Bukan kau & Bahan garaan budayaan rant and matan
Alkohol Alcoholic foot- Api Lain Isi rumah Recrea- Hotel Miscella-
Food & Bevera- wear Housing Furnishings, tion, neous
Non ges Water, Household services goods &
Alkohol & tobacco Electricity, Equipment & culture services
Bevera- Gas and and routine
ges other fuels Household
mainte-
nance
Wajaran Weights
(2005=100) 100.0 31.4 1.9 3.1 21.4 4.3 1.4 15.9 5.1 4.6 1.9 3.0 6.0
2003 95.7 94.4 79.0 102.9 97.9 98.3 97.0 93.4 99.3 100.8 96.9 95.0 97.4
2004 97.1 96.4 87.8 101.0 98.8 98.7 98.3 94.1 100.0 99.9 98.2 96.6 98.7
2005 100.0 100.0 100.0 100.0 100.0 100.0 100.0 100.0 100.0 100.0 100.0 100.0 100.0
2006 103.6 103.4 106.9 98.7 101.5 101.1 102.1 111.0 98.6 100.7 101.6 103.7 102.2
2007 105.7 106.5 115.2 97.3 102.8 102.2 103.7 113.6 97.4 102.1 103.4 107.5 103.2
176


177
PERKHIDMATAN
Nota Keterangan
1. Data perkhidmatan diperoleh daripada pelbagai banci iaitu: Banci Perkhidmatan
Profesional (Sektor swasta), Banci Perkhidmatan Pendidikan (Sektor swasta), Banci
Perkhidmatan Kesihatan (Sektor swasta), Banci Perkhidmatan Penginapan, Banci
Perkhidmatan Terpilih, Banci Perkhidmatan Pengangkutan & Komunikasi dan
Perangkaan Perkhidmatan Teknologi Maklumat & Komunikasi bagi tahun di mana
banci berkenaan dijalankan.
2. Perkhidmatan Profesional (Sektor Swasta) yang diliputi merangkumi:
• Perkhidmatan guaman
• Perkhidmatan perakaunan
• Perkhidmatan arkitek
• Perkhidmatan lukisan pelan
• Perkhidmatan kejuruteraan
• Perkhidmatan juruukur
3. Perkhidmatan Pendidikan (Sektor Swasta) meliputi institusi pengajian dan
sekolah memandu. Institusi pengajian swasta merangkumi:
i. Tadika
ii. Sekolah rendah
iii. Sekolah menengah am
iv. Kolej dan Universiti
v. Sekolah/institusi menengah teknik dan vokasional
vi. Sekolah/institusi lain
vii. Sekolah muzik dan tarian
viii. Institusi perdagangan dan teknik lain
4. Perkhidmatan Kesihatan (Sektor Swasta) yang diliputi merangkumi:
• Perkhidmatan perubatan
• Perkhidmatan pergigian
• Perkhidmatan veterinar
• Hospital & rumah bersalin persendirian
178
5. Perkhidmatan Penginapan yang diliputi merangkumi:
• Hotel (termasuk resort)
• Hotel bajet/ motel
• Pangsapuri khidmat
• Chalet
• Rumah rehat/ rumah tetamu
• Hostel
• Bed & breakfast
6. Perkhidmatan Terpilih yang diliputi merangkumi:
• Broker stok, saham, komoditi dan perkhidmatan tukaran wang asing
• Ejen hartanah
• Agensi pengiklanan
• Perkhidmatan penayangan wayang gambar
7. Perkhidmatan Pengangkutan dan Komunikasi meliputi semua industri di sektor
pengangkutan dan komunikasi iaitu:
• Pengangkutan bas awam
• Pengangkutan muatan
• Pengangkutan laut
• Pengangkutan air pedalaman (Sabah & Sarawak)
• Pengangkutan udara
• Kereta api/Transit aliran ringan
• Pengendalian kargo
• Pemunggahan kapal
• Penyimpanan & Gudang
• Tempat letak kereta
• Pengoperasian lebuh raya
• Pengoperasian pelabuhan
• Agensi pengembaraan dan operator pelancongan
• Agensi perkapalan
• Agensi penghantaran
• Perkhidmatan pos & kurier
• Telekomunikasi
8. Data Perkhidmatan Komputer diperoleh daripada Perangkaan Perkhidmatan
Teknologi Maklumat dan Komunikasi. Skop dan liputan merangkumi:
• Banci Pertubuhan Perkhidmatan Telekomunikasi
• Penyiasatan Pertubuhan Perkhidmatan Komputer & aktiviti berkaitan dan
pertubuhan teknologi maklumat & komunikasi bagi industri pembuatan.
• Data sekunder daripada:
a) Perdagangan Luar Negeri
b) Isi rumah yang mempunyai kemudahan peralatan ICT
c) Suruhanjaya Komunikasi & Multimedia
d) Laman web International Telecommunication Union
9. Data Perkhidmatan Perdagangan Edaran diperoleh daripada Penyiasatan
Perdagangan Borong dan Runcit Suku Tahunan dan Penyiasatan Perdagangan
Edaran Suku Tahunan oleh Jabatan Perangkaan Malaysia.
a) Perdagangan borong merujuk kepada “penjualan semula (tanpa
pengubahsuaian) barangan baru dan barangan yang telah digunakan kepada
peruncit, pengguna perindustrian, perdagangan, institusi atau professional; atau
kepada pemborong lain; atau menjual barangan dagangan kepada orang atau
syarikat berkenaan”.
b) Perdagangan runcit merujuk kepada “penjualan semula (tanpa
pengubahsuaian) barangan baru dan terpakai kepada pengguna terakhir untuk
kegunaan isi rumah atau persendirian”. Ini termasuk jualan yang dilakukan oleh
kedai, stor aneka jabatan, gerai, koperasi pengguna dan lain-lain.
c) Kenderaan bermotor merujuk kepada aktiviti yang meliputi jualan secara
borong dan runcit kenderaan bermotor, sama ada baru atau terpakai, jualan alat
-alat ganti dan aksesori kenderaan dan kegiatan agen berkomisen yang terli-
bat dalam jualan.
179
180
SERVICES
Explanatory Notes
1. Data on services were obtained from various census such as: Census of
Professional Services (Private Sector), Census of Education Services (Private
Sector), Census of Health Services (Private Sector), Census of Accommodation
Services, Census of Selected Services, Census of Transport & Communications
Services, Census of Information & Communications Technology Services Statistics
for the years in which censuses were conducted.
2. The Professional Services (Private Sector) covered are:
• Legal services
• Accounting services
• Architectural services
• Drafting services
• Engineering services
• Surveying services
3. The Education Services (Private Sector) covered private institutions and driving
schools. The private institutions covered are:
i. Kindergartens
ii. Primary schools
iii. General secondary schools
iv. Colleges and Universities
v. Technical and vocational secondary schools/institutes
vi. Other schools/institutes
vii. Music and dancing schools
viii. Commercial and other technical institutes
4. The Health Services (Private Sector) covered are:
• Medical services
• Dental services
• Veterinary services
• Private hospitals & maternity homes
181
5. The Accommodation Services covered are:
• Hotels (including resort)
• Budget hotels/ motels
• Chalets
• Rest houses/ guest houses
• Hostels
• Bed & breakfast
6. The Selected Services covered are:
• Stock, share, commodity brokers and foreign exchange services
• Real estate agents
• Advertising agencies
• Motion picture projection services
7. The Transport and Communications Services covered all industries in the
transportation and communication sectors, which are:
• Public bus transport
• Road haulage
• Sea transport
• Inland water transport (Sabah & Sarawak)
• Air transport
• Train/Light rail transit
• Cargo handling
• Stevedoring companies
• Storage & Warehousing
• Car parking
• Highway operations
• Port operations
• Travel agencies and tour operators
• Shipping agencies
• Forwarding agencies
• Post & courier services
• Telecommunications
8. The Computer Services data are compiled from the Information and
Communications Technology Services Statistics. The scope and coverage
comprised the following:
• Census of Telecommunications Services Establishments
• Survey of Computer Services and Related Activities and ICT
establishments of the manufacturing industries.
• Secondary data sources encompassed the following:
a) External trade
b) Households with access to ICT items
c) Malaysian Communications and Multimedia Commission
d) International Telecommunication Union website
9. Data on Distributive Trade were obtained from Quarterly Survey of Wholesale and
Retail Trade and Quarterly Survey of Distributive Trade from Department of
Statistics, Malaysia.
a) Wholesale trade refer to “the resale (sale without transformation) of new and
used goods to retailers; to industrial, commercial, institutional or professional
users; or to other wholesalers; or selling merchandise to, such persons or
companies”.
b) Retail trade refer to “the resale (sale without transformation) of new and used
goods to the general public for personal or household consumption or utilization.
It includes selling by shops, department stores, stalls, consumer co-operatives
etc.
c) Motor vehicles trade refer to activities which covers wholesale and retail sale
of motor vehicles, either new or used, sale of motor vehicle parts and
accessories and commission agents.
182
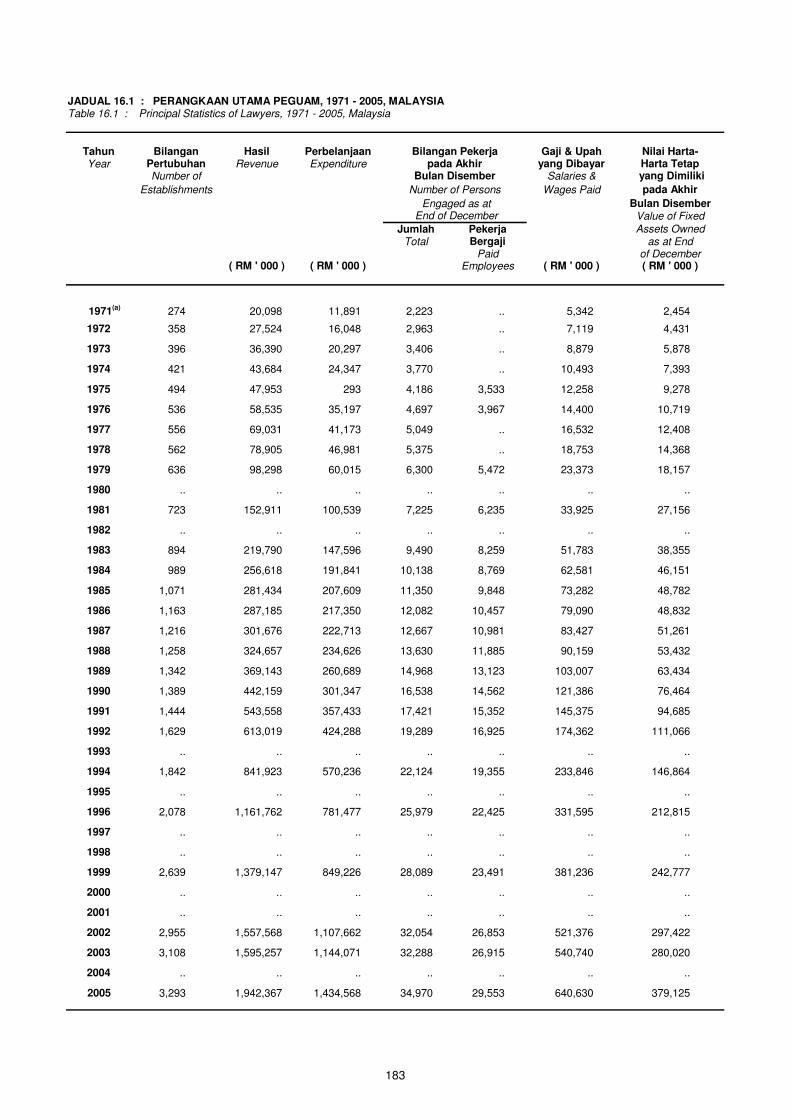
JADUAL 16.1 : PERANGKAAN UTAMA PEGUAM, 1971 - 2005, MALAYSIA Table 16.1 : Principal Statistics of Lawyers, 1971 - 2005, Malaysia
Tahun Bilangan Hasil Perbelanjaan Bilangan Pekerja Gaji & Upah Nilai Harta- Year Pertubuhan Revenue Expenditure pada Akhir yang Dibayar Harta Tetap
Number of Bulan Disember Salaries & yang Dimiliki
Establishments
Number of Persons Wages Paid pada Akhir
Engaged as at Bulan Disember End of December Value of Fixed
Jumlah Pekerja Assets Owned
Total Bergaji as at End
Paid of December ( RM ' 000 ) ( RM ' 000 ) Employees ( RM ' 000 ) ( RM ' 000 )
1971(a) 274 20,098 11,891 2,223 .. 5,342 2,454
1972 358 27,524 16,048 2,963 .. 7,119 4,431
1973 396 36,390 20,297 3,406 .. 8,879 5,878
1974 421 43,684 24,347 3,770 .. 10,493 7,393
1975 494 47,953 293 4,186 3,533 12,258 9,278
1976 536 58,535 35,197 4,697 3,967 14,400 10,719
1977 556 69,031 41,173 5,049 .. 16,532 12,408
1978 562 78,905 46,981 5,375 .. 18,753 14,368
1979 636 98,298 60,015 6,300 5,472 23,373 18,157
1980 .. .. .. .. .. .. ..
1981 723 152,911 100,539 7,225 6,235 33,925 27,156
1982 .. .. .. .. .. .. ..
1983 894 219,790 147,596 9,490 8,259 51,783 38,355
1984 989 256,618 191,841 10,138 8,769 62,581 46,151
1985 1,071 281,434 207,609 11,350 9,848 73,282 48,782
1986 1,163 287,185 217,350 12,082 10,457 79,090 48,832
1987 1,216 301,676 222,713 12,667 10,981 83,427 51,261
1988 1,258 324,657 234,626 13,630 11,885 90,159 53,432
1989 1,342 369,143 260,689 14,968 13,123 103,007 63,434
1990 1,389 442,159 301,347 16,538 14,562 121,386 76,464
1991 1,444 543,558 357,433 17,421 15,352 145,375 94,685
1992 1,629 613,019 424,288 19,289 16,925 174,362 111,066
1993 .. .. .. .. .. .. ..
1994 1,842 841,923 570,236 22,124 19,355 233,846 146,864
1995 .. .. .. .. .. .. ..
1996 2,078 1,161,762 781,477 25,979 22,425 331,595 212,815
1997 .. .. .. .. .. .. ..
1998 .. .. .. .. .. .. ..
1999 2,639 1,379,147 849,226 28,089 23,491 381,236 242,777
2000 .. .. .. .. .. .. ..
2001 .. .. .. .. .. .. ..
2002 2,955 1,557,568 1,107,662 32,054 26,853 521,376 297,422
2003 3,108 1,595,257 1,144,071 32,288 26,915 540,740 280,020
2005 3,293 1,942,367 1,434,568 34,970 29,553 640,630 379,125
2004 .. .. .. .. .. .. ..
183
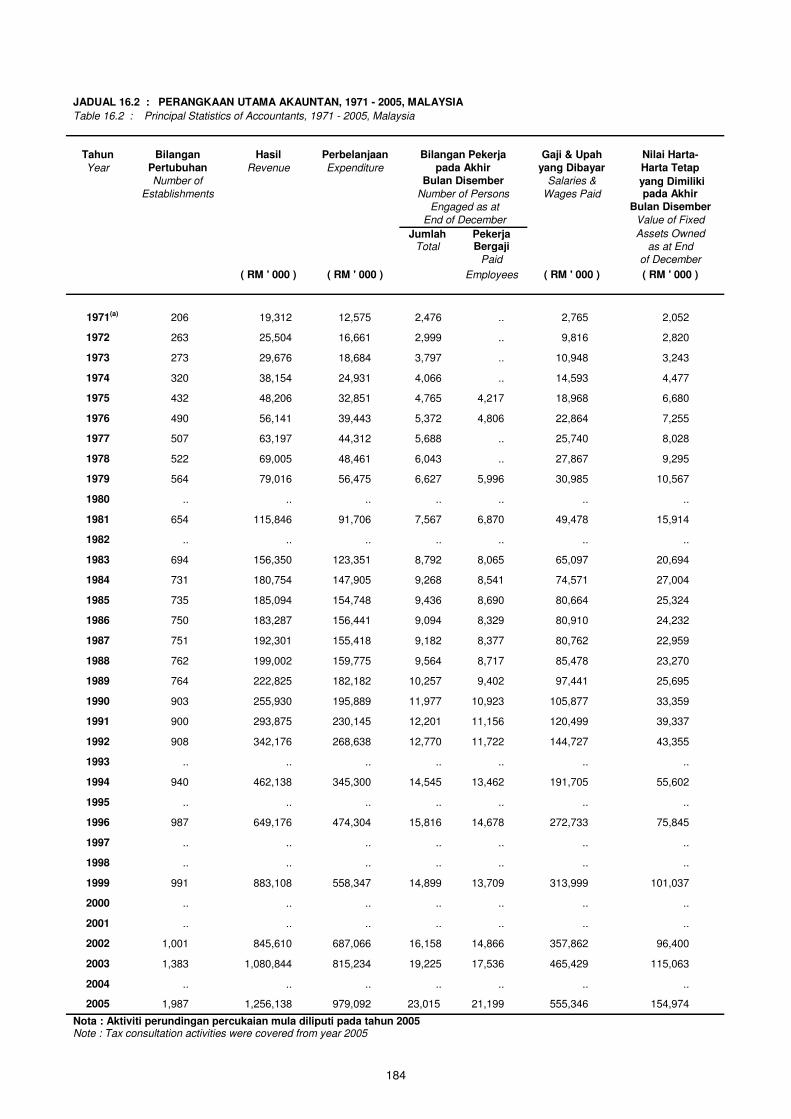
JADUAL 16.2 : PERANGKAAN UTAMA AKAUNTAN, 1971 - 2005, MALAYSIA
Table 16.2 : Principal Statistics of Accountants, 1971 - 2005, Malaysia
Tahun Bilangan Hasil Perbelanjaan Bilangan Pekerja Gaji & Upah Nilai Harta-
Year Pertubuhan Revenue Expenditure pada Akhir yang Dibayar Harta Tetap
Number of Bulan Disember Salaries & yang Dimiliki Establishments Number of Persons Wages Paid pada Akhir
Engaged as at Bulan Disember
End of December Value of Fixed
Jumlah Pekerja Assets Owned
Total Bergaji as at End
Paid of December
( RM ' 000 ) ( RM ' 000 ) Employees ( RM ' 000 ) ( RM ' 000 )
1971(a) 206 19,312 12,575 2,476 .. 2,765 2,052
1972 263 25,504 16,661 2,999 .. 9,816 2,820
1973 273 29,676 18,684 3,797 .. 10,948 3,243
1974 320 38,154 24,931 4,066 .. 14,593 4,477
1975 432 48,206 32,851 4,765 4,217 18,968 6,680
1976 490 56,141 39,443 5,372 4,806 22,864 7,255
1977 507 63,197 44,312 5,688 .. 25,740 8,028
1978 522 69,005 48,461 6,043 .. 27,867 9,295
1979 564 79,016 56,475 6,627 5,996 30,985 10,567
1980 .. .. .. .. .. .. ..
1981 654 115,846 91,706 7,567 6,870 49,478 15,914
1982 .. .. .. .. .. .. ..
1983 694 156,350 123,351 8,792 8,065 65,097 20,694
1984 731 180,754 147,905 9,268 8,541 74,571 27,004
1985 735 185,094 154,748 9,436 8,690 80,664 25,324
1986 750 183,287 156,441 9,094 8,329 80,910 24,232
1987 751 192,301 155,418 9,182 8,377 80,762 22,959
1988 762 199,002 159,775 9,564 8,717 85,478 23,270
1989 764 222,825 182,182 10,257 9,402 97,441 25,695
1990 903 255,930 195,889 11,977 10,923 105,877 33,359
1991 900 293,875 230,145 12,201 11,156 120,499 39,337
1992 908 342,176 268,638 12,770 11,722 144,727 43,355
1993 .. .. .. .. .. .. ..
1994 940 462,138 345,300 14,545 13,462 191,705 55,602
1995 .. .. .. .. .. .. ..
1996 987 649,176 474,304 15,816 14,678 272,733 75,845
1997 .. .. .. .. .. .. ..
1998 .. .. .. .. .. .. ..
1999 991 883,108 558,347 14,899 13,709 313,999 101,037
2000 .. .. .. .. .. .. ..
2001 .. .. .. .. .. .. ..
2002 1,001 845,610 687,066 16,158 14,866 357,862 96,400
2003 1,383 1,080,844 815,234 19,225 17,536 465,429 115,063
2005 1,987 1,256,138 979,092 23,015 21,199 555,346 154,974
Nota : Aktiviti perundingan percukaian mula diliputi pada tahun 2005 Note : Tax consultation activities were covered from year 2005
2004 .. .. .. .. .. .. ..
184
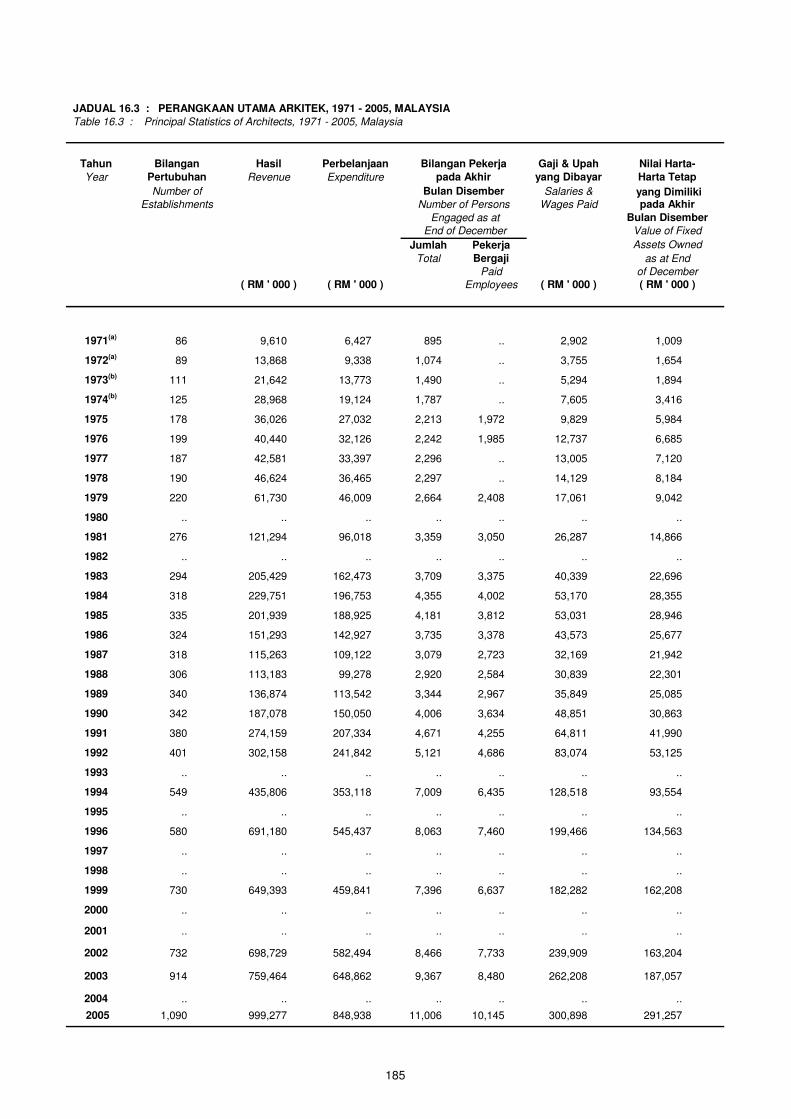
JADUAL 16.3 : PERANGKAAN UTAMA ARKITEK, 1971 - 2005, MALAYSIA
Table 16.3 : Principal Statistics of Architects, 1971 - 2005, Malaysia
Tahun Bilangan Hasil Perbelanjaan Bilangan Pekerja Gaji & Upah Nilai Harta-
Year Pertubuhan Revenue Expenditure pada Akhir yang Dibayar Harta Tetap
Number of Bulan Disember Salaries & yang Dimiliki Establishments Number of Persons Wages Paid pada Akhir
Engaged as at Bulan Disember
End of December Value of Fixed
Jumlah Pekerja Assets Owned
Total Bergaji as at End
Paid of December
( RM ' 000 ) ( RM ' 000 ) Employees ( RM ' 000 ) ( RM ' 000 )
1971(a) 86 9,610 6,427 895 .. 2,902 1,009
1972(a) 89 13,868 9,338 1,074 .. 3,755 1,654
1973(b) 111 21,642 13,773 1,490 .. 5,294 1,894
1974(b) 125 28,968 19,124 1,787 .. 7,605 3,416
1975 178 36,026 27,032 2,213 1,972 9,829 5,984
1976 199 40,440 32,126 2,242 1,985 12,737 6,685
1977 187 42,581 33,397 2,296 .. 13,005 7,120
1978 190 46,624 36,465 2,297 .. 14,129 8,184
1979 220 61,730 46,009 2,664 2,408 17,061 9,042
1980 .. .. .. .. .. .. ..
1981 276 121,294 96,018 3,359 3,050 26,287 14,866
1982 .. .. .. .. .. .. ..
1983 294 205,429 162,473 3,709 3,375 40,339 22,696
1984 318 229,751 196,753 4,355 4,002 53,170 28,355
1985 335 201,939 188,925 4,181 3,812 53,031 28,946
1986 324 151,293 142,927 3,735 3,378 43,573 25,677
1987 318 115,263 109,122 3,079 2,723 32,169 21,942
1988 306 113,183 99,278 2,920 2,584 30,839 22,301
1989 340 136,874 113,542 3,344 2,967 35,849 25,085
1990 342 187,078 150,050 4,006 3,634 48,851 30,863
1991 380 274,159 207,334 4,671 4,255 64,811 41,990
1992 401 302,158 241,842 5,121 4,686 83,074 53,125
1993 .. .. .. .. .. .. ..
1994 549 435,806 353,118 7,009 6,435 128,518 93,554
1995 .. .. .. .. .. .. ..
1996 580 691,180 545,437 8,063 7,460 199,466 134,563
1997 .. .. .. .. .. .. ..
1998 .. .. .. .. .. .. ..
1999 730 649,393 459,841 7,396 6,637 182,282 162,208
2000 .. .. .. .. .. .. ..
2001 .. .. .. .. .. .. ..
2002 732 698,729 582,494 8,466 7,733 239,909 163,204
2003 914 759,464 648,862 9,367 8,480 262,208 187,057
2005 1,090 999,277 848,938 11,006 10,145 300,898 291,257
2004 .. .. .. .. .. .. ..
185
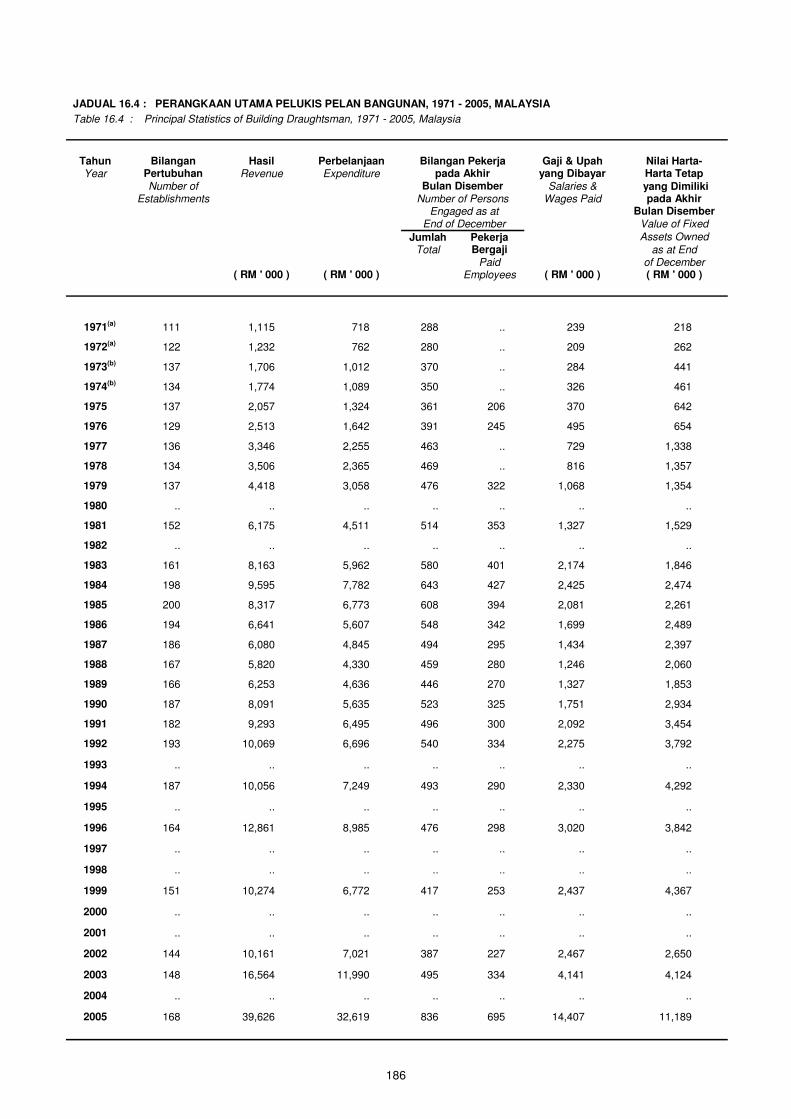
JADUAL 16.4 : PERANGKAAN UTAMA PELUKIS PELAN BANGUNAN, 1971 - 2005, MALAYSIA
Table 16.4 : Principal Statistics of Building Draughtsman, 1971 - 2005, Malaysia
Tahun Bilangan Hasil Perbelanjaan Bilangan Pekerja Gaji & Upah Nilai Harta- Year Pertubuhan Revenue Expenditure pada Akhir yang Dibayar Harta Tetap
Number of Bulan Disember Salaries & yang Dimiliki Establishments Number of Persons Wages Paid pada Akhir Engaged as at Bulan Disember End of December Value of Fixed
Jumlah Pekerja Assets Owned
Total Bergaji as at End
Paid of December ( RM ' 000 ) ( RM ' 000 ) Employees ( RM ' 000 ) ( RM ' 000 )
1971(a) 111 1,115 718 288 .. 239 218
1972(a) 122 1,232 762 280 .. 209 262
1973(b) 137 1,706 1,012 370 .. 284 441
1974(b) 134 1,774 1,089 350 .. 326 461
1975 137 2,057 1,324 361 206 370 642
1976 129 2,513 1,642 391 245 495 654
1977 136 3,346 2,255 463 .. 729 1,338
1978 134 3,506 2,365 469 .. 816 1,357
1979 137 4,418 3,058 476 322 1,068 1,354
1980 .. .. .. .. .. .. ..
1981 152 6,175 4,511 514 353 1,327 1,529
1982 .. .. .. .. .. .. ..
1983 161 8,163 5,962 580 401 2,174 1,846
1984 198 9,595 7,782 643 427 2,425 2,474
1985 200 8,317 6,773 608 394 2,081 2,261
1986 194 6,641 5,607 548 342 1,699 2,489
1987 186 6,080 4,845 494 295 1,434 2,397
1988 167 5,820 4,330 459 280 1,246 2,060
1989 166 6,253 4,636 446 270 1,327 1,853
1990 187 8,091 5,635 523 325 1,751 2,934
1991 182 9,293 6,495 496 300 2,092 3,454
1992 193 10,069 6,696 540 334 2,275 3,792
1993 .. .. .. .. .. .. ..
1994 187 10,056 7,249 493 290 2,330 4,292
1995 .. .. .. .. .. .. ..
1996 164 12,861 8,985 476 298 3,020 3,842
1997 .. .. .. .. .. .. ..
1998 .. .. .. .. .. .. ..
1999 151 10,274 6,772 417 253 2,437 4,367
2000 .. .. .. .. .. .. ..
2001 .. .. .. .. .. .. ..
2002 144 10,161 7,021 387 227 2,467 2,650
2003 148 16,564 11,990 495 334 4,141 4,124
2005 168 39,626 32,619 836 695 14,407 11,189
2004 .. .. .. .. .. .. ..
186
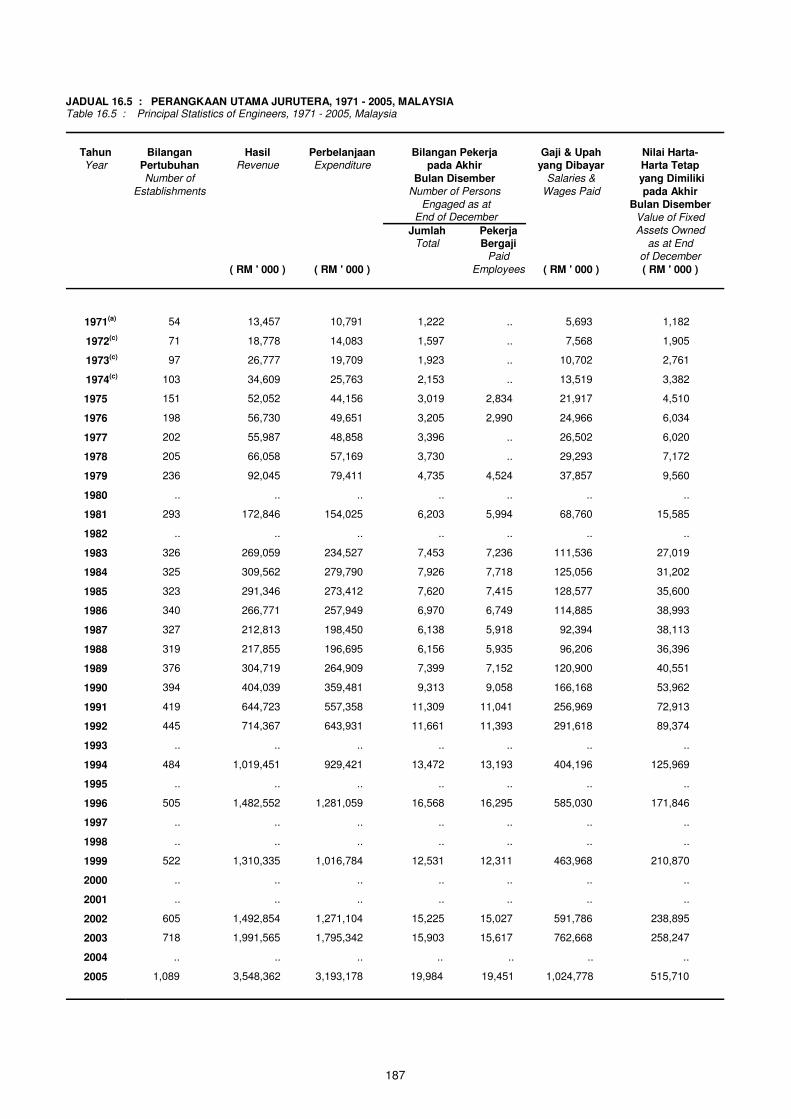
JADUAL 16.5 : PERANGKAAN UTAMA JURUTERA, 1971 - 2005, MALAYSIA
Table 16.5 : Principal Statistics of Engineers, 1971 - 2005, Malaysia
Tahun Bilangan Hasil Perbelanjaan Bilangan Pekerja Gaji & Upah Nilai Harta- Year Pertubuhan Revenue Expenditure pada Akhir yang Dibayar Harta Tetap
Number of Bulan Disember Salaries & yang Dimiliki
Establishments Number of Persons Wages Paid pada Akhir Engaged as at Bulan Disember
End of December Value of Fixed
Jumlah Pekerja Assets Owned
Total Bergaji as at End
Paid of December
( RM ' 000 ) ( RM ' 000 ) Employees ( RM ' 000 ) ( RM ' 000 )
1971(a) 54 13,457 10,791 1,222 .. 5,693 1,182
1972(c) 71 18,778 14,083 1,597 .. 7,568 1,905
1973(c) 97 26,777 19,709 1,923 .. 10,702 2,761
1974(c) 103 34,609 25,763 2,153 .. 13,519 3,382
1975 151 52,052 44,156 3,019 2,834 21,917 4,510
1976 198 56,730 49,651 3,205 2,990 24,966 6,034
1977 202 55,987 48,858 3,396 .. 26,502 6,020
1978 205 66,058 57,169 3,730 .. 29,293 7,172
1979 236 92,045 79,411 4,735 4,524 37,857 9,560
1980 .. .. .. .. .. .. ..
1981 293 172,846 154,025 6,203 5,994 68,760 15,585
1982 .. .. .. .. .. .. ..
1983 326 269,059 234,527 7,453 7,236 111,536 27,019
1984 325 309,562 279,790 7,926 7,718 125,056 31,202
1985 323 291,346 273,412 7,620 7,415 128,577 35,600
1986 340 266,771 257,949 6,970 6,749 114,885 38,993
1987 327 212,813 198,450 6,138 5,918 92,394 38,113
1988 319 217,855 196,695 6,156 5,935 96,206 36,396
1989 376 304,719 264,909 7,399 7,152 120,900 40,551
1990 394 404,039 359,481 9,313 9,058 166,168 53,962
1991 419 644,723 557,358 11,309 11,041 256,969 72,913
1992 445 714,367 643,931 11,661 11,393 291,618 89,374
1993 .. .. .. .. .. .. ..
1994 484 1,019,451 929,421 13,472 13,193 404,196 125,969
1995 .. .. .. .. .. .. ..
1996 505 1,482,552 1,281,059 16,568 16,295 585,030 171,846
1997 .. .. .. .. .. .. ..
1998 .. .. .. .. .. .. ..
1999 522 1,310,335 1,016,784 12,531 12,311 463,968 210,870
2000 .. .. .. .. .. .. ..
2001 .. .. .. .. .. .. ..
2002 605 1,492,854 1,271,104 15,225 15,027 591,786 238,895
2003 718 1,991,565 1,795,342 15,903 15,617 762,668 258,247
2005 1,089 3,548,362 3,193,178 19,984 19,451 1,024,778 515,710
2004 .. .. .. .. .. .. ..
187
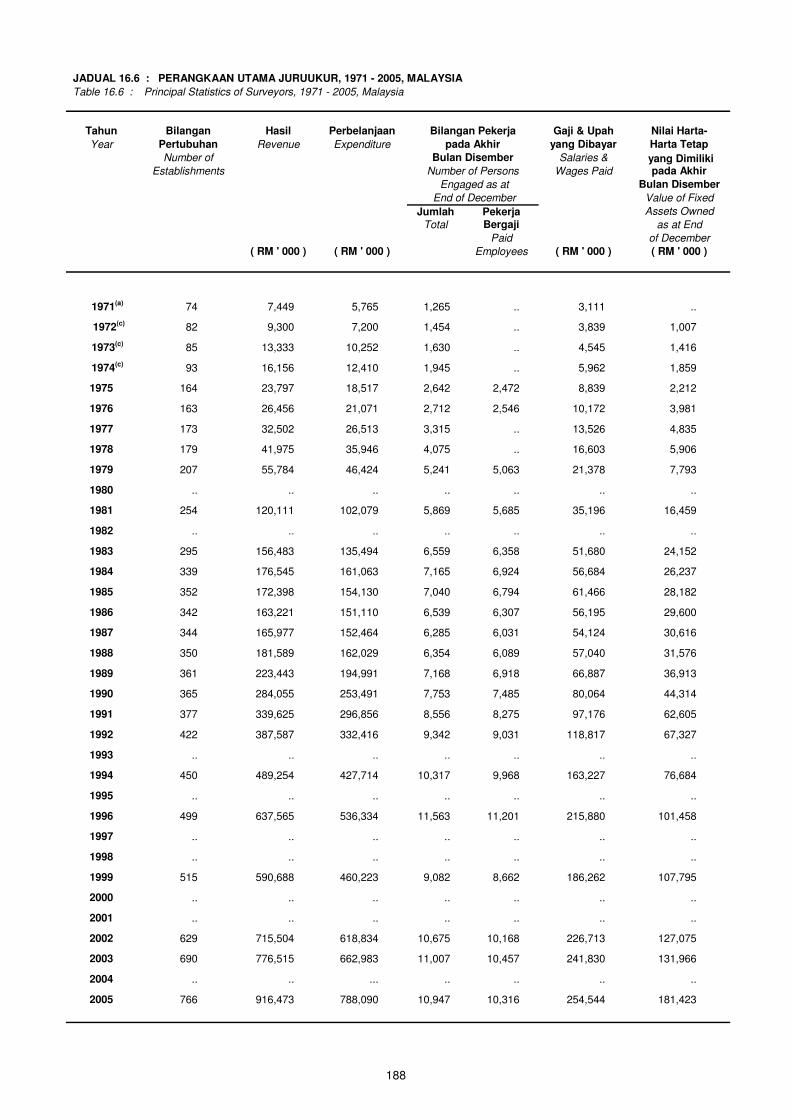
JADUAL 16.6 : PERANGKAAN UTAMA JURUUKUR, 1971 - 2005, MALAYSIA
Table 16.6 : Principal Statistics of Surveyors, 1971 - 2005, Malaysia
Tahun Bilangan Hasil Perbelanjaan Bilangan Pekerja Gaji & Upah Nilai Harta-
Year Pertubuhan Revenue Expenditure pada Akhir yang Dibayar Harta Tetap
Number of Bulan Disember Salaries & yang Dimiliki Establishments Number of Persons Wages Paid pada Akhir
Engaged as at Bulan Disember
End of December Value of Fixed
Jumlah Pekerja Assets Owned
Total Bergaji as at End
Paid of December
( RM ' 000 ) ( RM ' 000 ) Employees ( RM ' 000 ) ( RM ' 000 )
1971(a) 74 7,449 5,765 1,265 .. 3,111 ..
1972(c) 82 9,300 7,200 1,454 .. 3,839 1,007
1973(c) 85 13,333 10,252 1,630 .. 4,545 1,416
1974(c) 93 16,156 12,410 1,945 .. 5,962 1,859
1975 164 23,797 18,517 2,642 2,472 8,839 2,212
1976 163 26,456 21,071 2,712 2,546 10,172 3,981
1977 173 32,502 26,513 3,315 .. 13,526 4,835
1978 179 41,975 35,946 4,075 .. 16,603 5,906
1979 207 55,784 46,424 5,241 5,063 21,378 7,793
1980 .. .. .. .. .. .. ..
1981 254 120,111 102,079 5,869 5,685 35,196 16,459
1982 .. .. .. .. .. .. ..
1983 295 156,483 135,494 6,559 6,358 51,680 24,152
1984 339 176,545 161,063 7,165 6,924 56,684 26,237
1985 352 172,398 154,130 7,040 6,794 61,466 28,182
1986 342 163,221 151,110 6,539 6,307 56,195 29,600
1987 344 165,977 152,464 6,285 6,031 54,124 30,616
1988 350 181,589 162,029 6,354 6,089 57,040 31,576
1989 361 223,443 194,991 7,168 6,918 66,887 36,913
1990 365 284,055 253,491 7,753 7,485 80,064 44,314
1991 377 339,625 296,856 8,556 8,275 97,176 62,605
1992 422 387,587 332,416 9,342 9,031 118,817 67,327
1993 .. .. .. .. .. .. ..
1994 450 489,254 427,714 10,317 9,968 163,227 76,684
1995 .. .. .. .. .. .. ..
1996 499 637,565 536,334 11,563 11,201 215,880 101,458
1997 .. .. .. .. .. .. ..
1998 .. .. .. .. .. .. ..
1999 515 590,688 460,223 9,082 8,662 186,262 107,795
2000 .. .. .. .. .. .. ..
2001 .. .. .. .. .. .. ..
2002 629 715,504 618,834 10,675 10,168 226,713 127,075
2003 690 776,515 662,983 11,007 10,457 241,830 131,966
2005 766 916,473 788,090 10,947 10,316 254,544 181,423
2004 .. .. ... .. .. .. ..
188

JADUAL 16.7 : PERANGKAAN UTAMA SEKOLAH PERSENDIRIAN, 1971 - 2005, MALAYSIA
Table 16.7 : Principal Statistics of Private Schools, 1971 - 2005, Malaysia
Tahun Bilangan Hasil Perbelanjaan Bilangan Pekerja Gaji & Upah Nilai Harta-
Year Pertubuhan Revenue Expenditure pada Akhir yang Dibayar Harta Tetap
Number of Bulan Disember Salaries & yang Dimiliki Establishments Number of Persons Wages Paid pada Akhir
Engaged as at Bulan Disember
End of December Value of Fixed
Jumlah Pekerja Assets Owned
Total Bergaji as at End
Paid of December ( RM ' 000 ) ( RM ' 000 ) Employees ( RM ' 000 ) ( RM ' 000 )
1971(a) 546 17,507 15,985 4,424 .. 10,242 12,176
1972 801 25,237 23,385 6,145 .. 15,273 28,937
1973 886 30,852 27,751 6,967 .. 17,910 38,577
1974 962 36,592 32,614 7,677 .. 20,895 43,107
1975 1,009 43,799 38,312 8,057 .. 24,515 52,403
1976 1,129 51,202 45,805 9,199 .. 28,697 61,919
1977 1,237 60,464 53,282 10,103 .. 33,216 62,791
1978 1,281 66,160 58,537 10,783 .. 36,076 69,615
1979 1,348 76,003 67,275 11,398 .. 40,876 74,830
1980 .. .. .. .. .. .. ..
1981 1,507 104,429 95,095 12,462 11,794 53,299 91,593
1982 .. .. .. .. .. .. ..
1983 1,565 136,595 123,317 14,102 13,415 70,675 123,713
1984 1,726 166,438 155,339 15,186 14,353 87,750 152,706
1985 1,838 191,665 169,539 16,993 16,076 94,676 162,274
1986 1,910 202,093 187,690 17,888 16,982 104,429 173,607
1987 1,992 211,076 201,203 18,579 17,631 110,590 182,397
1988 1,999 225,063 213,863 19,543 18,383 116,878 224,281
1989 2,055 259,346 239,956 21,026 19,788 130,858 253,723
1990 2,163 304,048 275,476 22,812 21,461 147,831 274,343
1991 2,217 359,465 329,633 24,421 23,024 171,946 339,274
1992 2,300 474,695 426,126 26,351 24,943 213,180 399,849
1993 .. .. .. .. .. .. ..
1994 2,332 696,313 626,383 29,984 28,507 307,461 610,415
1995 .. .. .. .. .. .. ..
1996 2,781 1,078,770 974,491 35,689 33,713 454,090 868,641
1997 .. .. .. .. .. .. ..
1998 .. .. .. .. .. .. ..
1999 3,003 1,756,335 1,567,426 44,124 41,976 672,269 1,644,385
2000 .. .. .. .. .. .. ..
2001 .. .. .. .. .. .. ..
2002 (d) 2,241 2,896,084 2,694,675 52,638 50,854 1,128,704 3,893,707
2003 2,955 3,164,717 2,935,971 57,664 55,274 1,213,226 4,929,620
2005 5,443 4,798,064 4,524,895 82,188 77,817 1,724,901 4,972,693
2004 .. .. .. .. .. .. ..
189
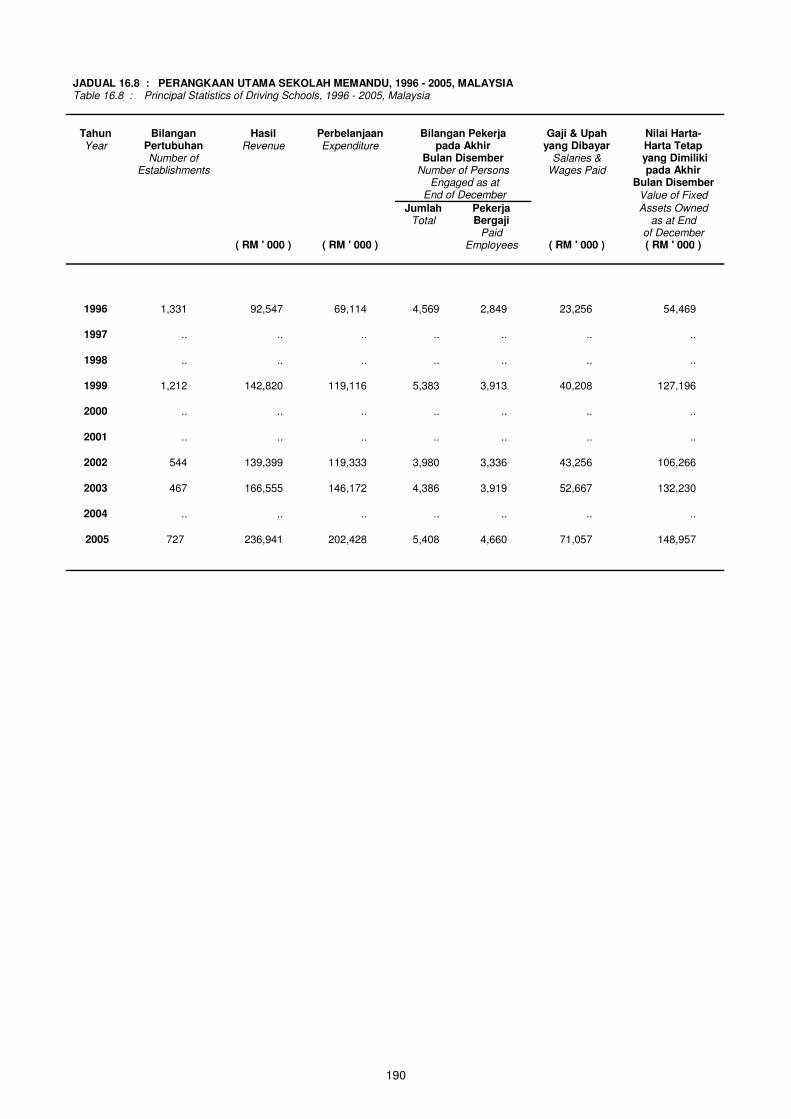
JADUAL 16.8 : PERANGKAAN UTAMA SEKOLAH MEMANDU, 1996 - 2005, MALAYSIA Table 16.8 : Principal Statistics of Driving Schools, 1996 - 2005, Malaysia
Tahun Bilangan Hasil Perbelanjaan Bilangan Pekerja Gaji & Upah Nilai Harta- Year Pertubuhan Revenue Expenditure pada Akhir yang Dibayar Harta Tetap
Number of Bulan Disember Salaries & yang Dimiliki Establishments Number of Persons Wages Paid pada Akhir Engaged as at Bulan Disember End of December Value of Fixed
Jumlah Pekerja Assets Owned
Total Bergaji as at End
Paid of December ( RM ' 000 ) ( RM ' 000 ) Employees ( RM ' 000 ) ( RM ' 000 )
1996 1,331 92,547 69,114 4,569 2,849 23,256 54,469
1997 .. .. .. .. .. .. ..
1998 .. .. .. .. .. .. ..
1999 1,212 142,820 119,116 5,383 3,913 40,208 127,196
2000 .. .. .. .. .. .. ..
2001 .. .. .. .. .. .. ..
2002 544 139,399 119,333 3,980 3,336 43,256 106,266
2003 467 166,555 146,172 4,386 3,919 52,667 132,230
2005 727 236,941 202,428 5,408 4,660 71,057 148,957
2004 .. .. .. .. .. .. ..
190
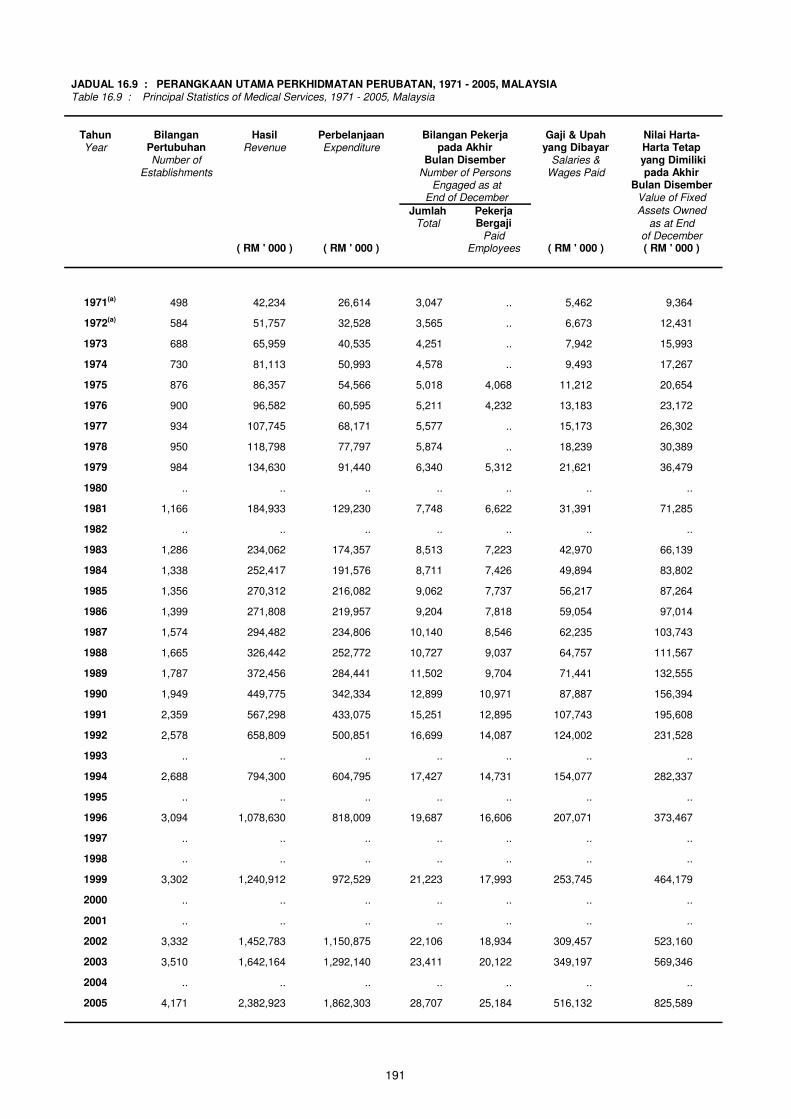
Table 16.9 : Principal Statistics of Medical Services, 1971 - 2005, Malaysia
Tahun Bilangan Hasil Perbelanjaan Bilangan Pekerja Gaji & Upah Nilai Harta- Year Pertubuhan Revenue Expenditure pada Akhir yang Dibayar Harta Tetap
Number of Bulan Disember Salaries & yang Dimiliki Establishments Number of Persons Wages Paid pada Akhir Engaged as at Bulan Disember End of December Value of Fixed
Jumlah Pekerja Assets Owned
Total Bergaji as at End
Paid of December ( RM ' 000 ) ( RM ' 000 ) Employees ( RM ' 000 ) ( RM ' 000 )
1971(a) 498 42,234 26,614 3,047 .. 5,462 9,364
1972(a) 584 51,757 32,528 3,565 .. 6,673 12,431
1973 688 65,959 40,535 4,251 .. 7,942 15,993
1974 730 81,113 50,993 4,578 .. 9,493 17,267
1975 876 86,357 54,566 5,018 4,068 11,212 20,654
1976 900 96,582 60,595 5,211 4,232 13,183 23,172
1977 934 107,745 68,171 5,577 .. 15,173 26,302
1978 950 118,798 77,797 5,874 .. 18,239 30,389
1979 984 134,630 91,440 6,340 5,312 21,621 36,479
1980 .. .. .. .. .. .. ..
1981 1,166 184,933 129,230 7,748 6,622 31,391 71,285
1982 .. .. .. .. .. .. ..
1983 1,286 234,062 174,357 8,513 7,223 42,970 66,139
1984 1,338 252,417 191,576 8,711 7,426 49,894 83,802
1985 1,356 270,312 216,082 9,062 7,737 56,217 87,264
1986 1,399 271,808 219,957 9,204 7,818 59,054 97,014
1987 1,574 294,482 234,806 10,140 8,546 62,235 103,743
1988 1,665 326,442 252,772 10,727 9,037 64,757 111,567
1989 1,787 372,456 284,441 11,502 9,704 71,441 132,555
1990 1,949 449,775 342,334 12,899 10,971 87,887 156,394
1991 2,359 567,298 433,075 15,251 12,895 107,743 195,608
1992 2,578 658,809 500,851 16,699 14,087 124,002 231,528
1993 .. .. .. .. .. .. ..
1994 2,688 794,300 604,795 17,427 14,731 154,077 282,337
1995 .. .. .. .. .. .. ..
1996 3,094 1,078,630 818,009 19,687 16,606 207,071 373,467
1997 .. .. .. .. .. .. ..
1998 .. .. .. .. .. .. ..
1999 3,302 1,240,912 972,529 21,223 17,993 253,745 464,179
2000 .. .. .. .. .. .. ..
2001 .. .. .. .. .. .. ..
2002 3,332 1,452,783 1,150,875 22,106 18,934 309,457 523,160
2003 3,510 1,642,164 1,292,140 23,411 20,122 349,197 569,346
JADUAL 16.9 : PERANGKAAN UTAMA PERKHIDMATAN PERUBATAN, 1971 - 2005, MALAYSIA
2005 4,171 2,382,923 1,862,303 28,707 25,184 516,132 825,589
2004 .. .. .. .. .. .. ..
191
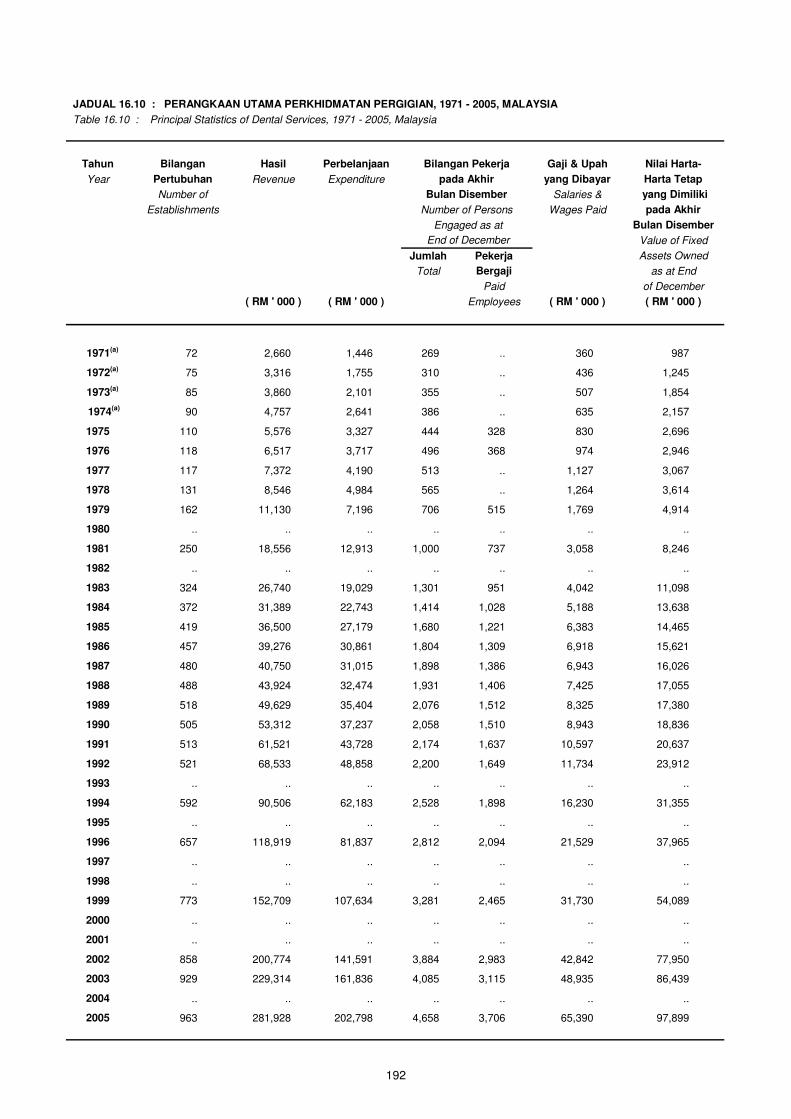
JADUAL 16.10 : PERANGKAAN UTAMA PERKHIDMATAN PERGIGIAN, 1971 - 2005, MALAYSIA
Table 16.10 : Principal Statistics of Dental Services, 1971 - 2005, Malaysia
Tahun Bilangan Hasil Perbelanjaan Bilangan Pekerja Gaji & Upah Nilai Harta-
Year Pertubuhan Revenue Expenditure pada Akhir yang Dibayar Harta Tetap
Number of Bulan Disember Salaries & yang Dimiliki
Establishments Number of Persons Wages Paid pada Akhir
Engaged as at Bulan Disember
End of December Value of Fixed
Jumlah Pekerja Assets Owned
Total Bergaji as at End
Paid of December
( RM ' 000 ) ( RM ' 000 ) Employees ( RM ' 000 ) ( RM ' 000 )
1971(a) 72 2,660 1,446 269 .. 360 987
1972(a) 75 3,316 1,755 310 .. 436 1,245
1973(a) 85 3,860 2,101 355 .. 507 1,854
1974(a) 90 4,757 2,641 386 .. 635 2,157
1975 110 5,576 3,327 444 328 830 2,696
1976 118 6,517 3,717 496 368 974 2,946
1977 117 7,372 4,190 513 .. 1,127 3,067
1978 131 8,546 4,984 565 .. 1,264 3,614
1979 162 11,130 7,196 706 515 1,769 4,914
1980 .. .. .. .. .. .. ..
1981 250 18,556 12,913 1,000 737 3,058 8,246
1982 .. .. .. .. .. .. ..
1983 324 26,740 19,029 1,301 951 4,042 11,098
1984 372 31,389 22,743 1,414 1,028 5,188 13,638
1985 419 36,500 27,179 1,680 1,221 6,383 14,465
1986 457 39,276 30,861 1,804 1,309 6,918 15,621
1987 480 40,750 31,015 1,898 1,386 6,943 16,026
1988 488 43,924 32,474 1,931 1,406 7,425 17,055
1989 518 49,629 35,404 2,076 1,512 8,325 17,380
1990 505 53,312 37,237 2,058 1,510 8,943 18,836
1991 513 61,521 43,728 2,174 1,637 10,597 20,637
1992 521 68,533 48,858 2,200 1,649 11,734 23,912
1993 .. .. .. .. .. .. ..
1994 592 90,506 62,183 2,528 1,898 16,230 31,355
1995 .. .. .. .. .. .. ..
1996 657 118,919 81,837 2,812 2,094 21,529 37,965
1997 .. .. .. .. .. .. ..
1998 .. .. .. .. .. .. ..
1999 773 152,709 107,634 3,281 2,465 31,730 54,089
2000 .. .. .. .. .. .. ..
2001 .. .. .. .. .. .. ..
2002 858 200,774 141,591 3,884 2,983 42,842 77,950
2003 929 229,314 161,836 4,085 3,115 48,935 86,439
2005 963 281,928 202,798 4,658 3,706 65,390 97,899
2004 .. .. .. .. .. .. ..
192
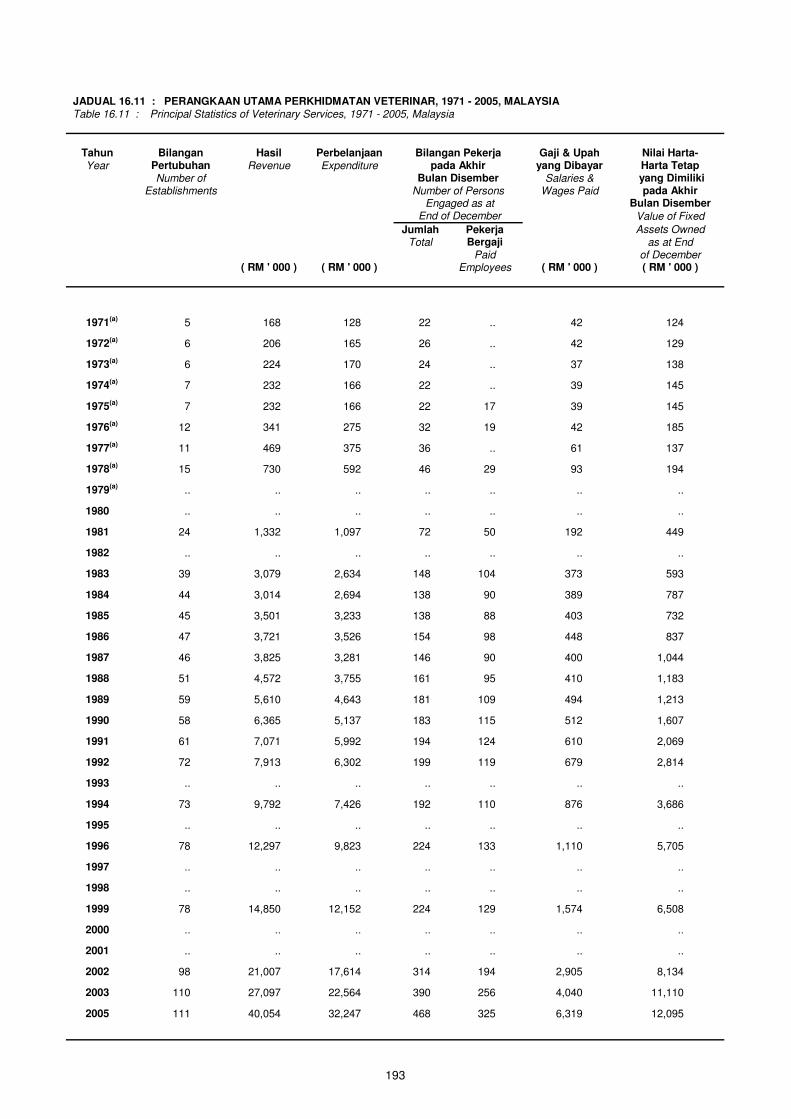
JADUAL 16.11 : PERANGKAAN UTAMA PERKHIDMATAN VETERINAR, 1971 - 2005, MALAYSIA
Table 16.11 : Principal Statistics of Veterinary Services, 1971 - 2005, Malaysia
Tahun Bilangan Hasil Perbelanjaan Bilangan Pekerja Gaji & Upah Nilai Harta- Year Pertubuhan Revenue Expenditure pada Akhir yang Dibayar Harta Tetap
Number of Bulan Disember Salaries & yang Dimiliki Establishments Number of Persons Wages Paid pada Akhir Engaged as at Bulan Disember
End of December Value of Fixed
Jumlah Pekerja Assets Owned
Total Bergaji as at End
Paid of December ( RM ' 000 ) ( RM ' 000 ) Employees ( RM ' 000 ) ( RM ' 000 )
1971(a) 5 168 128 22 .. 42 124
1972(a) 6 206 165 26 .. 42 129
1973(a) 6 224 170 24 .. 37 138
1974(a) 7 232 166 22 .. 39 145
1975(a) 7 232 166 22 17 39 145
1976(a) 12 341 275 32 19 42 185
1977(a) 11 469 375 36 .. 61 137
1978(a) 15 730 592 46 29 93 194
1979(a) .. .. .. .. .. .. ..
1980 .. .. .. .. .. .. ..
1981 24 1,332 1,097 72 50 192 449
1982 .. .. .. .. .. .. ..
1983 39 3,079 2,634 148 104 373 593
1984 44 3,014 2,694 138 90 389 787
1985 45 3,501 3,233 138 88 403 732
1986 47 3,721 3,526 154 98 448 837
1987 46 3,825 3,281 146 90 400 1,044
1988 51 4,572 3,755 161 95 410 1,183
1989 59 5,610 4,643 181 109 494 1,213
1990 58 6,365 5,137 183 115 512 1,607
1991 61 7,071 5,992 194 124 610 2,069
1992 72 7,913 6,302 199 119 679 2,814
1993 .. .. .. .. .. .. ..
1994 73 9,792 7,426 192 110 876 3,686
1995 .. .. .. .. .. .. ..
1996 78 12,297 9,823 224 133 1,110 5,705
1997 .. .. .. .. .. .. ..
1998 .. .. .. .. .. .. ..
1999 78 14,850 12,152 224 129 1,574 6,508
2000 .. .. .. .. .. .. ..
2001 .. .. .. .. .. .. ..
2002 98 21,007 17,614 314 194 2,905 8,134
2003 110 27,097 22,564 390 256 4,040 11,110
2005 111 40,054 32,247 468 325 6,319 12,095
193
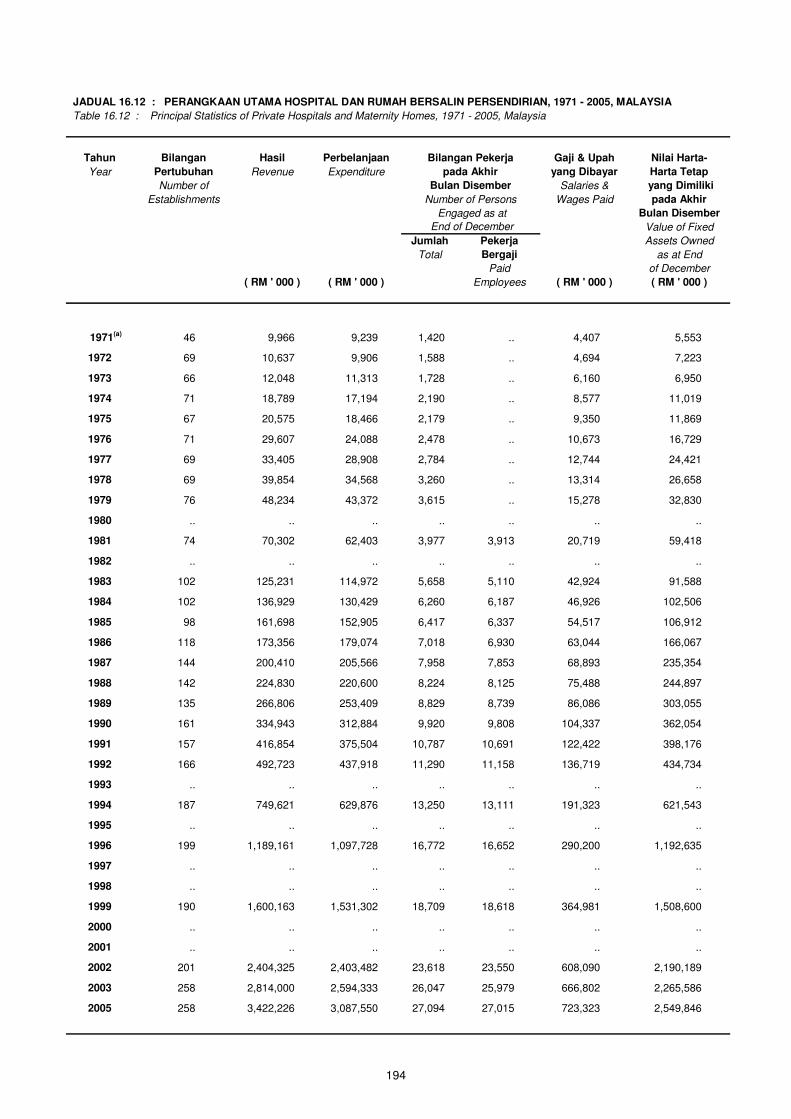
JADUAL 16.12 : PERANGKAAN UTAMA HOSPITAL DAN RUMAH BERSALIN PERSENDIRIAN, 1971 - 2005, MALAYSIA
Table 16.12 : Principal Statistics of Private Hospitals and Maternity Homes, 1971 - 2005, Malaysia
Tahun Bilangan Hasil Perbelanjaan Bilangan Pekerja Gaji & Upah Nilai Harta-
Year Pertubuhan Revenue Expenditure pada Akhir yang Dibayar Harta Tetap
Number of Bulan Disember Salaries & yang Dimiliki
Establishments Number of Persons Wages Paid pada Akhir
Engaged as at Bulan Disember
End of December Value of Fixed
Jumlah Pekerja Assets Owned
Total Bergaji as at End
Paid of December
( RM ' 000 ) ( RM ' 000 ) Employees ( RM ' 000 ) ( RM ' 000 )
1971(a) 46 9,966 9,239 1,420 .. 4,407 5,553
1972 69 10,637 9,906 1,588 .. 4,694 7,223
1973 66 12,048 11,313 1,728 .. 6,160 6,950
1974 71 18,789 17,194 2,190 .. 8,577 11,019
1975 67 20,575 18,466 2,179 .. 9,350 11,869
1976 71 29,607 24,088 2,478 .. 10,673 16,729
1977 69 33,405 28,908 2,784 .. 12,744 24,421
1978 69 39,854 34,568 3,260 .. 13,314 26,658
1979 76 48,234 43,372 3,615 .. 15,278 32,830
1980 .. .. .. .. .. .. ..
1981 74 70,302 62,403 3,977 3,913 20,719 59,418
1982 .. .. .. .. .. .. ..
1983 102 125,231 114,972 5,658 5,110 42,924 91,588
1984 102 136,929 130,429 6,260 6,187 46,926 102,506
1985 98 161,698 152,905 6,417 6,337 54,517 106,912
1986 118 173,356 179,074 7,018 6,930 63,044 166,067
1987 144 200,410 205,566 7,958 7,853 68,893 235,354
1988 142 224,830 220,600 8,224 8,125 75,488 244,897
1989 135 266,806 253,409 8,829 8,739 86,086 303,055
1990 161 334,943 312,884 9,920 9,808 104,337 362,054
1991 157 416,854 375,504 10,787 10,691 122,422 398,176
1992 166 492,723 437,918 11,290 11,158 136,719 434,734
1993 .. .. .. .. .. .. ..
1994 187 749,621 629,876 13,250 13,111 191,323 621,543
1995 .. .. .. .. .. .. ..
1996 199 1,189,161 1,097,728 16,772 16,652 290,200 1,192,635
1997 .. .. .. .. .. .. ..
1998 .. .. .. .. .. .. ..
1999 190 1,600,163 1,531,302 18,709 18,618 364,981 1,508,600
2000 .. .. .. .. .. .. ..
2001 .. .. .. .. .. .. ..
2002 201 2,404,325 2,403,482 23,618 23,550 608,090 2,190,189
2003 258 2,814,000 2,594,333 26,047 25,979 666,802 2,265,586
2005 258 3,422,226 3,087,550 27,094 27,015 723,323 2,549,846
194
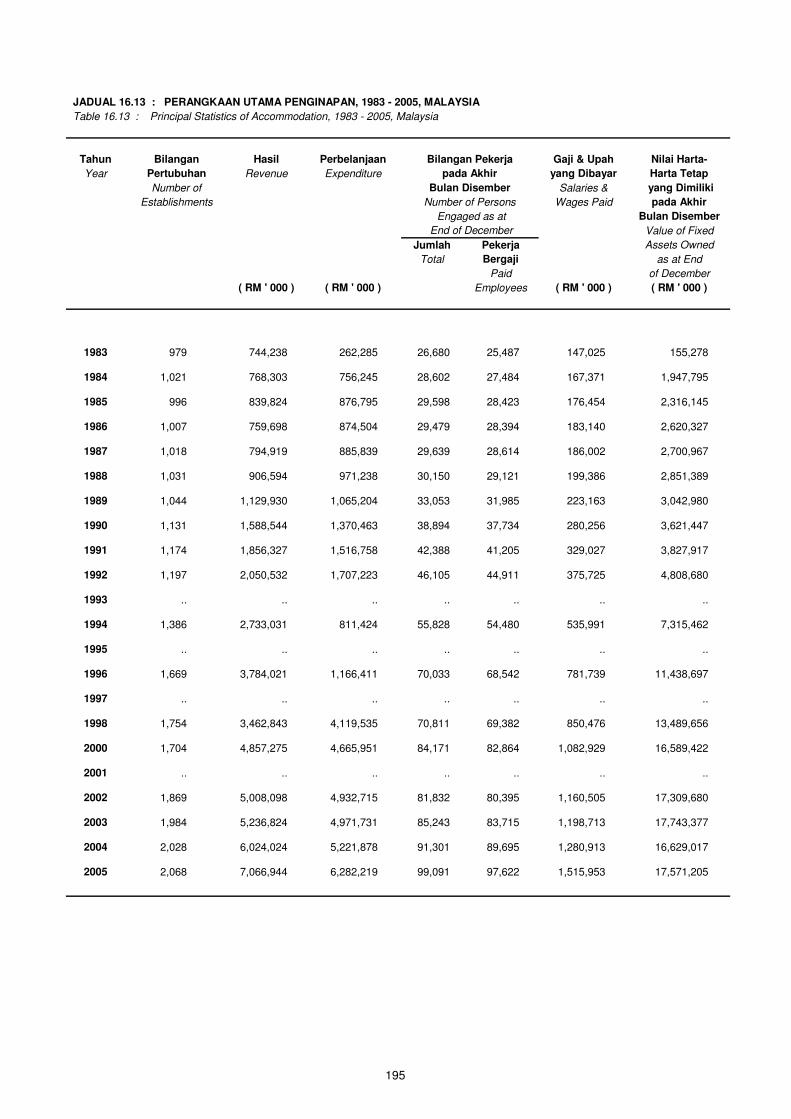
JADUAL 16.13 : PERANGKAAN UTAMA PENGINAPAN, 1983 - 2005, MALAYSIA
Table 16.13 : Principal Statistics of Accommodation, 1983 - 2005, Malaysia
Tahun Bilangan Hasil Perbelanjaan Bilangan Pekerja Gaji & Upah Nilai Harta-
Year Pertubuhan Revenue Expenditure pada Akhir yang Dibayar Harta Tetap
Number of Bulan Disember Salaries & yang Dimiliki
Establishments Number of Persons Wages Paid pada Akhir
Engaged as at Bulan Disember
End of December Value of Fixed
Jumlah Pekerja Assets Owned
Total Bergaji as at End
Paid of December
( RM ' 000 ) ( RM ' 000 ) Employees ( RM ' 000 ) ( RM ' 000 )
1983 979 744,238 262,285 26,680 25,487 147,025 155,278
1984 1,021 768,303 756,245 28,602 27,484 167,371 1,947,795
1985 996 839,824 876,795 29,598 28,423 176,454 2,316,145
1986 1,007 759,698 874,504 29,479 28,394 183,140 2,620,327
1987 1,018 794,919 885,839 29,639 28,614 186,002 2,700,967
1988 1,031 906,594 971,238 30,150 29,121 199,386 2,851,389
1989 1,044 1,129,930 1,065,204 33,053 31,985 223,163 3,042,980
1990 1,131 1,588,544 1,370,463 38,894 37,734 280,256 3,621,447
1991 1,174 1,856,327 1,516,758 42,388 41,205 329,027 3,827,917
1992 1,197 2,050,532 1,707,223 46,105 44,911 375,725 4,808,680
1993 .. .. .. .. .. .. ..
1994 1,386 2,733,031 811,424 55,828 54,480 535,991 7,315,462
1995 .. .. .. .. .. .. ..
1996 1,669 3,784,021 1,166,411 70,033 68,542 781,739 11,438,697
1997 .. .. .. .. .. .. ..
1998 1,754 3,462,843 4,119,535 70,811 69,382 850,476 13,489,656
2000 1,704 4,857,275 4,665,951 84,171 82,864 1,082,929 16,589,422
2001 .. .. .. .. .. .. ..
2002 1,869 5,008,098 4,932,715 81,832 80,395 1,160,505 17,309,680
2003 1,984 5,236,824 4,971,731 85,243 83,715 1,198,713 17,743,377
2004 2,028 6,024,024 5,221,878 91,301 89,695 1,280,913 16,629,017
2005 2,068 7,066,944 6,282,219 99,091 97,622 1,515,953 17,571,205
195
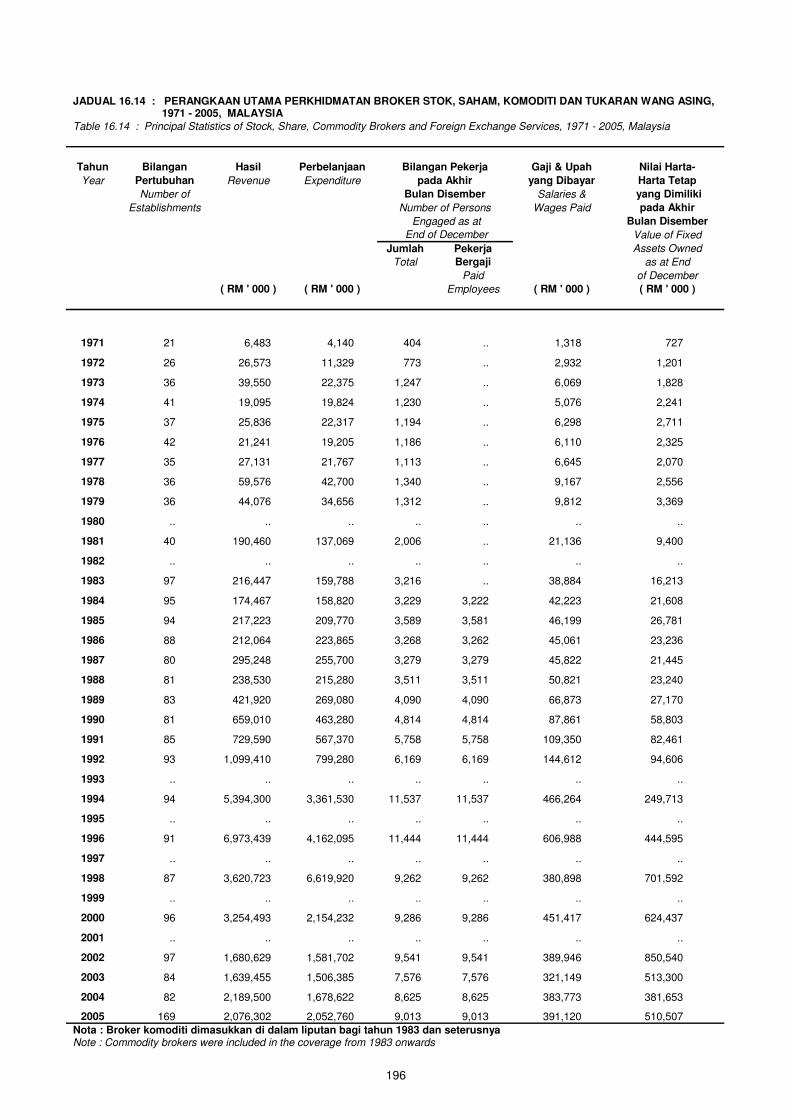
JADUAL 16.14 : PERANGKAAN UTAMA PERKHIDMATAN BROKER STOK, SAHAM, KOMODITI DAN TUKARAN WANG ASING, 1971 - 2005, MALAYSIA
Table 16.14 : Principal Statistics of Stock, Share, Commodity Brokers and Foreign Exchange Services, 1971 - 2005, Malaysia
Tahun Bilangan Hasil Perbelanjaan Bilangan Pekerja Gaji & Upah Nilai Harta-
Year Pertubuhan Revenue Expenditure pada Akhir yang Dibayar Harta Tetap
Number of Bulan Disember Salaries & yang Dimiliki
Establishments Number of Persons Wages Paid pada Akhir
Engaged as at Bulan Disember
End of December Value of Fixed
Jumlah Pekerja Assets Owned
Total Bergaji as at End
Paid of December
( RM ' 000 ) ( RM ' 000 ) Employees ( RM ' 000 ) ( RM ' 000 )
1971 21 6,483 4,140 404 .. 1,318 727
1972 26 26,573 11,329 773 .. 2,932 1,201
1973 36 39,550 22,375 1,247 .. 6,069 1,828
1974 41 19,095 19,824 1,230 .. 5,076 2,241
1975 37 25,836 22,317 1,194 .. 6,298 2,711
1976 42 21,241 19,205 1,186 .. 6,110 2,325
1977 35 27,131 21,767 1,113 .. 6,645 2,070
1978 36 59,576 42,700 1,340 .. 9,167 2,556
1979 36 44,076 34,656 1,312 .. 9,812 3,369
1980 .. .. .. .. .. .. ..
1981 40 190,460 137,069 2,006 .. 21,136 9,400
1982 .. .. .. .. .. .. ..
1983 97 216,447 159,788 3,216 .. 38,884 16,213
1984 95 174,467 158,820 3,229 3,222 42,223 21,608
1985 94 217,223 209,770 3,589 3,581 46,199 26,781
1986 88 212,064 223,865 3,268 3,262 45,061 23,236
1987 80 295,248 255,700 3,279 3,279 45,822 21,445
1988 81 238,530 215,280 3,511 3,511 50,821 23,240
1989 83 421,920 269,080 4,090 4,090 66,873 27,170
1990 81 659,010 463,280 4,814 4,814 87,861 58,803
1991 85 729,590 567,370 5,758 5,758 109,350 82,461
1992 93 1,099,410 799,280 6,169 6,169 144,612 94,606
1993 .. .. .. .. .. .. ..
1994 94 5,394,300 3,361,530 11,537 11,537 466,264 249,713
1995 .. .. .. .. .. .. ..
1996 91 6,973,439 4,162,095 11,444 11,444 606,988 444,595
1997 .. .. .. .. .. .. ..
1998 87 3,620,723 6,619,920 9,262 9,262 380,898 701,592
1999 .. .. .. .. .. .. ..
2000 96 3,254,493 2,154,232 9,286 9,286 451,417 624,437
2001 .. .. .. .. .. .. ..
2002 97 1,680,629 1,581,702 9,541 9,541 389,946 850,540
2003 84 1,639,455 1,506,385 7,576 7,576 321,149 513,300
2004 82 2,189,500 1,678,622 8,625 8,625 383,773 381,653
2005 169 2,076,302 2,052,760 9,013 9,013 391,120 510,507
Nota : Broker komoditi dimasukkan di dalam liputan bagi tahun 1983 dan seterusnya Note : Commodity brokers were included in the coverage from 1983 onwards
196
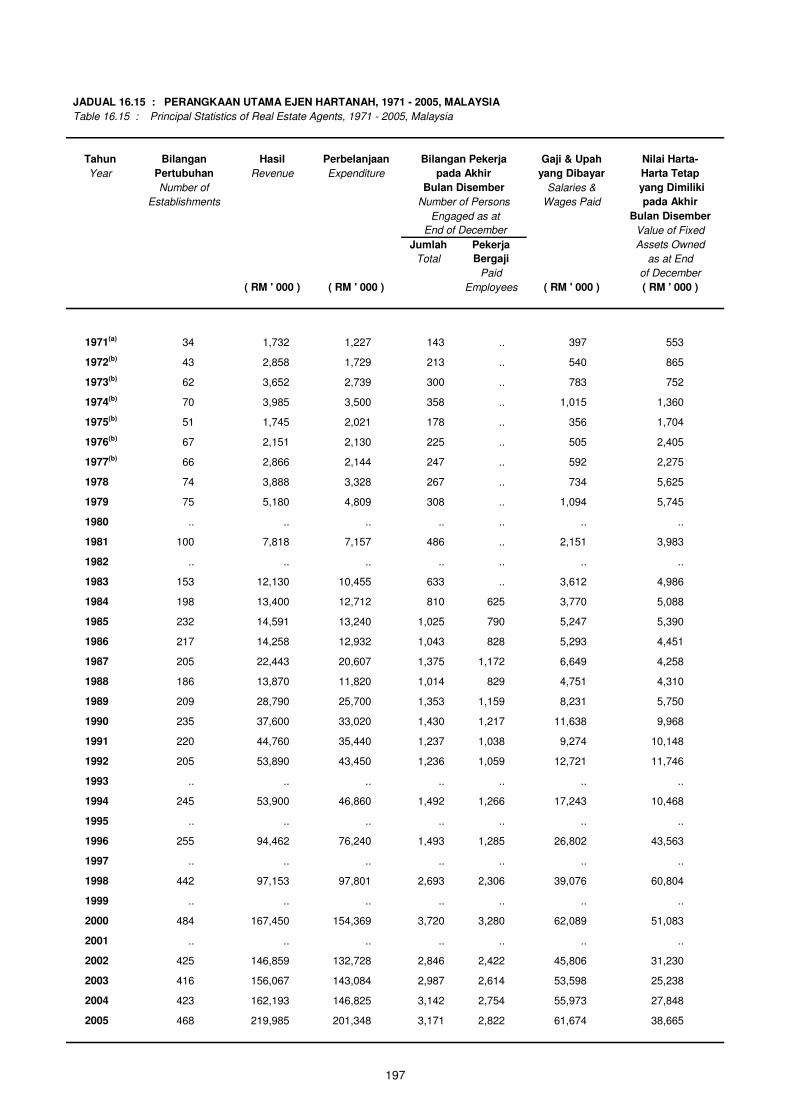
JADUAL 16.15 : PERANGKAAN UTAMA EJEN HARTANAH, 1971 - 2005, MALAYSIA
Table 16.15 : Principal Statistics of Real Estate Agents, 1971 - 2005, Malaysia
Tahun Bilangan Hasil Perbelanjaan Bilangan Pekerja Gaji & Upah Nilai Harta-
Year Pertubuhan Revenue Expenditure pada Akhir yang Dibayar Harta Tetap
Number of Bulan Disember Salaries & yang Dimiliki
Establishments Number of Persons Wages Paid pada Akhir
Engaged as at Bulan Disember
End of December Value of Fixed
Jumlah Pekerja Assets Owned
Total Bergaji as at End
Paid of December
( RM ' 000 ) ( RM ' 000 ) Employees ( RM ' 000 ) ( RM ' 000 )
1971(a) 34 1,732 1,227 143 .. 397 553
1972(b) 43 2,858 1,729 213 .. 540 865
1973(b) 62 3,652 2,739 300 .. 783 752
1974(b) 70 3,985 3,500 358 .. 1,015 1,360
1975(b) 51 1,745 2,021 178 .. 356 1,704
1976(b) 67 2,151 2,130 225 .. 505 2,405
1977(b) 66 2,866 2,144 247 .. 592 2,275
1978 74 3,888 3,328 267 .. 734 5,625
1979 75 5,180 4,809 308 .. 1,094 5,745
1980 .. .. .. .. .. .. ..
1981 100 7,818 7,157 486 .. 2,151 3,983
1982 .. .. .. .. .. .. ..
1983 153 12,130 10,455 633 .. 3,612 4,986
1984 198 13,400 12,712 810 625 3,770 5,088
1985 232 14,591 13,240 1,025 790 5,247 5,390
1986 217 14,258 12,932 1,043 828 5,293 4,451
1987 205 22,443 20,607 1,375 1,172 6,649 4,258
1988 186 13,870 11,820 1,014 829 4,751 4,310
1989 209 28,790 25,700 1,353 1,159 8,231 5,750
1990 235 37,600 33,020 1,430 1,217 11,638 9,968
1991 220 44,760 35,440 1,237 1,038 9,274 10,148
1992 205 53,890 43,450 1,236 1,059 12,721 11,746
1993 .. .. .. .. .. .. ..
1994 245 53,900 46,860 1,492 1,266 17,243 10,468
1995 .. .. .. .. .. .. ..
1996 255 94,462 76,240 1,493 1,285 26,802 43,563
1997 .. .. .. .. .. .. ..
1998 442 97,153 97,801 2,693 2,306 39,076 60,804
1999 .. .. .. .. .. .. ..
2000 484 167,450 154,369 3,720 3,280 62,089 51,083
2001 .. .. .. .. .. .. ..
2002 425 146,859 132,728 2,846 2,422 45,806 31,230
2003 416 156,067 143,084 2,987 2,614 53,598 25,238
2004 423 162,193 146,825 3,142 2,754 55,973 27,848
2005 468 219,985 201,348 3,171 2,822 61,674 38,665
197
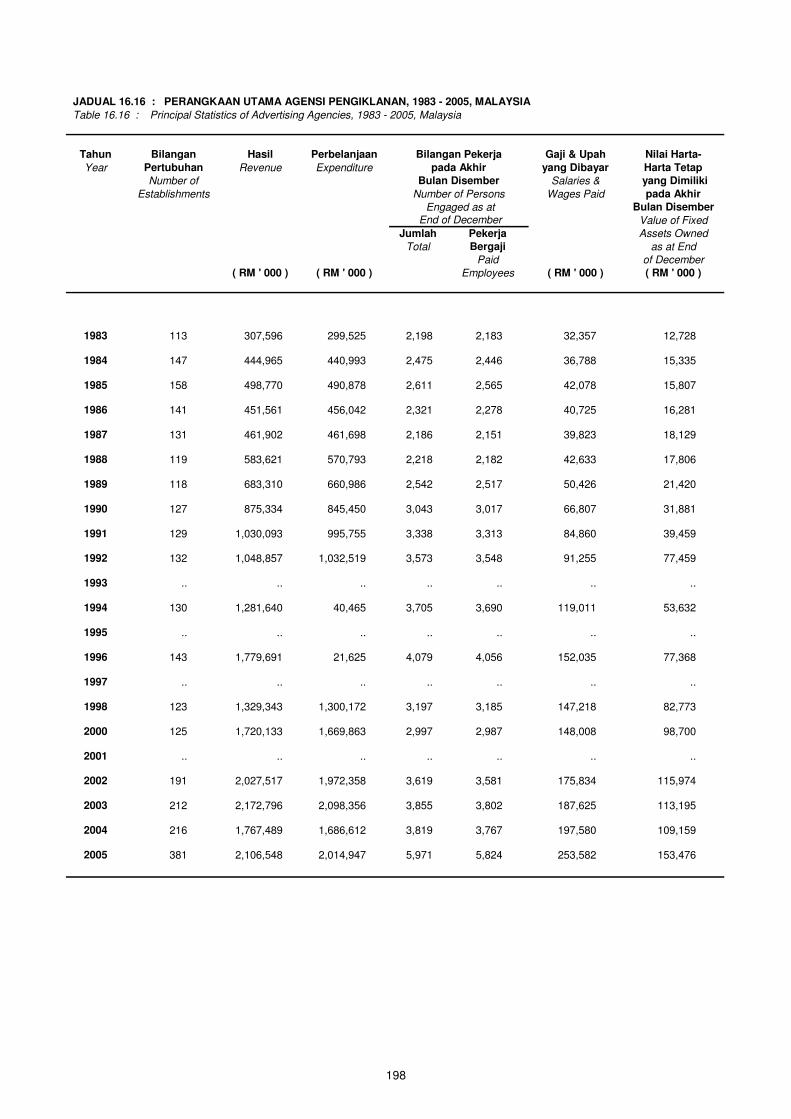
JADUAL 16.16 : PERANGKAAN UTAMA AGENSI PENGIKLANAN, 1983 - 2005, MALAYSIA
Table 16.16 : Principal Statistics of Advertising Agencies, 1983 - 2005, Malaysia
Tahun Bilangan Hasil Perbelanjaan Bilangan Pekerja Gaji & Upah Nilai Harta-
Year Pertubuhan Revenue Expenditure pada Akhir yang Dibayar Harta Tetap
Number of Bulan Disember Salaries & yang Dimiliki
Establishments Number of Persons Wages Paid pada Akhir
Engaged as at Bulan Disember
End of December Value of Fixed
Jumlah Pekerja Assets Owned
Total Bergaji as at End
Paid of December
( RM ' 000 ) ( RM ' 000 ) Employees ( RM ' 000 ) ( RM ' 000 )
1983 113 307,596 299,525 2,198 2,183 32,357 12,728
1984 147 444,965 440,993 2,475 2,446 36,788 15,335
1985 158 498,770 490,878 2,611 2,565 42,078 15,807
1986 141 451,561 456,042 2,321 2,278 40,725 16,281
1987 131 461,902 461,698 2,186 2,151 39,823 18,129
1988 119 583,621 570,793 2,218 2,182 42,633 17,806
1989 118 683,310 660,986 2,542 2,517 50,426 21,420
1990 127 875,334 845,450 3,043 3,017 66,807 31,881
1991 129 1,030,093 995,755 3,338 3,313 84,860 39,459
1992 132 1,048,857 1,032,519 3,573 3,548 91,255 77,459
1993 .. .. .. .. .. .. ..
1994 130 1,281,640 40,465 3,705 3,690 119,011 53,632
1995 .. .. .. .. .. .. ..
1996 143 1,779,691 21,625 4,079 4,056 152,035 77,368
1997 .. .. .. .. .. .. ..
1998 123 1,329,343 1,300,172 3,197 3,185 147,218 82,773
2000 125 1,720,133 1,669,863 2,997 2,987 148,008 98,700
2001 .. .. .. .. .. .. ..
2002 191 2,027,517 1,972,358 3,619 3,581 175,834 115,974
2003 212 2,172,796 2,098,356 3,855 3,802 187,625 113,195
2004 216 1,767,489 1,686,612 3,819 3,767 197,580 109,159
2005 381 2,106,548 2,014,947 5,971 5,824 253,582 153,476
198
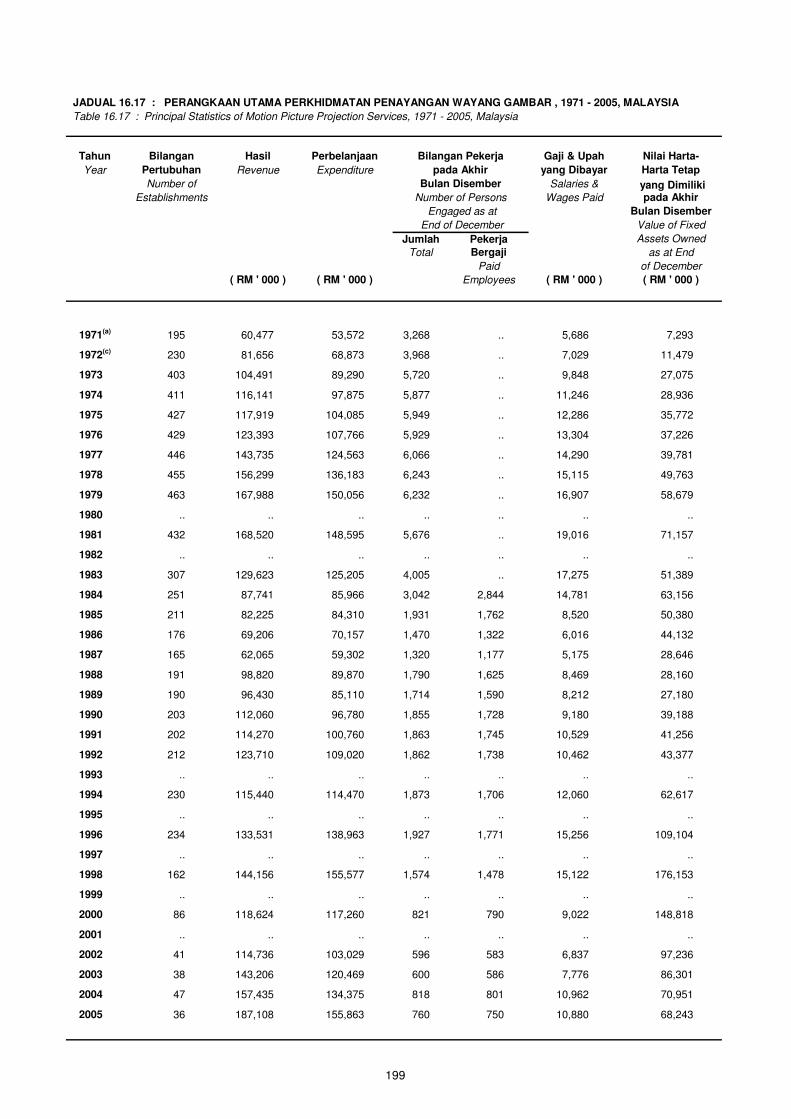
JADUAL 16.17 : PERANGKAAN UTAMA PERKHIDMATAN PENAYANGAN WAYANG GAMBAR , 1971 - 2005, MALAYSIA
Tahun Bilangan Hasil Perbelanjaan Bilangan Pekerja Gaji & Upah Nilai Harta-
Year Pertubuhan Revenue Expenditure pada Akhir yang Dibayar Harta Tetap
Number of Bulan Disember Salaries & yang Dimiliki Establishments Number of Persons Wages Paid pada Akhir
Engaged as at Bulan Disember
End of December Value of Fixed
Jumlah Pekerja Assets Owned
Total Bergaji as at End
Paid of December
( RM ' 000 ) ( RM ' 000 ) Employees ( RM ' 000 ) ( RM ' 000 )
1971(a) 195 60,477 53,572 3,268 .. 5,686 7,293
1972(c) 230 81,656 68,873 3,968 .. 7,029 11,479
1973 403 104,491 89,290 5,720 .. 9,848 27,075
1974 411 116,141 97,875 5,877 .. 11,246 28,936
1975 427 117,919 104,085 5,949 .. 12,286 35,772
1976 429 123,393 107,766 5,929 .. 13,304 37,226
1977 446 143,735 124,563 6,066 .. 14,290 39,781
1978 455 156,299 136,183 6,243 .. 15,115 49,763
1979 463 167,988 150,056 6,232 .. 16,907 58,679
1980 .. .. .. .. .. .. ..
1981 432 168,520 148,595 5,676 .. 19,016 71,157
1982 .. .. .. .. .. .. ..
1983 307 129,623 125,205 4,005 .. 17,275 51,389
1984 251 87,741 85,966 3,042 2,844 14,781 63,156
1985 211 82,225 84,310 1,931 1,762 8,520 50,380
1986 176 69,206 70,157 1,470 1,322 6,016 44,132
1987 165 62,065 59,302 1,320 1,177 5,175 28,646
1988 191 98,820 89,870 1,790 1,625 8,469 28,160
1989 190 96,430 85,110 1,714 1,590 8,212 27,180
1990 203 112,060 96,780 1,855 1,728 9,180 39,188
1991 202 114,270 100,760 1,863 1,745 10,529 41,256
1992 212 123,710 109,020 1,862 1,738 10,462 43,377
1993 .. .. .. .. .. .. ..
1994 230 115,440 114,470 1,873 1,706 12,060 62,617
1995 .. .. .. .. .. .. ..
1996 234 133,531 138,963 1,927 1,771 15,256 109,104
1997 .. .. .. .. .. .. ..
1998 162 144,156 155,577 1,574 1,478 15,122 176,153
1999 .. .. .. .. .. .. ..
2000 86 118,624 117,260 821 790 9,022 148,818
2001 .. .. .. .. .. .. ..
2002 41 114,736 103,029 596 583 6,837 97,236
2003 38 143,206 120,469 600 586 7,776 86,301
2004 47 157,435 134,375 818 801 10,962 70,951
Table 16.17 : Principal Statistics of Motion Picture Projection Services, 1971 - 2005, Malaysia
2005 36 187,108 155,863 760 750 10,880 68,243
199
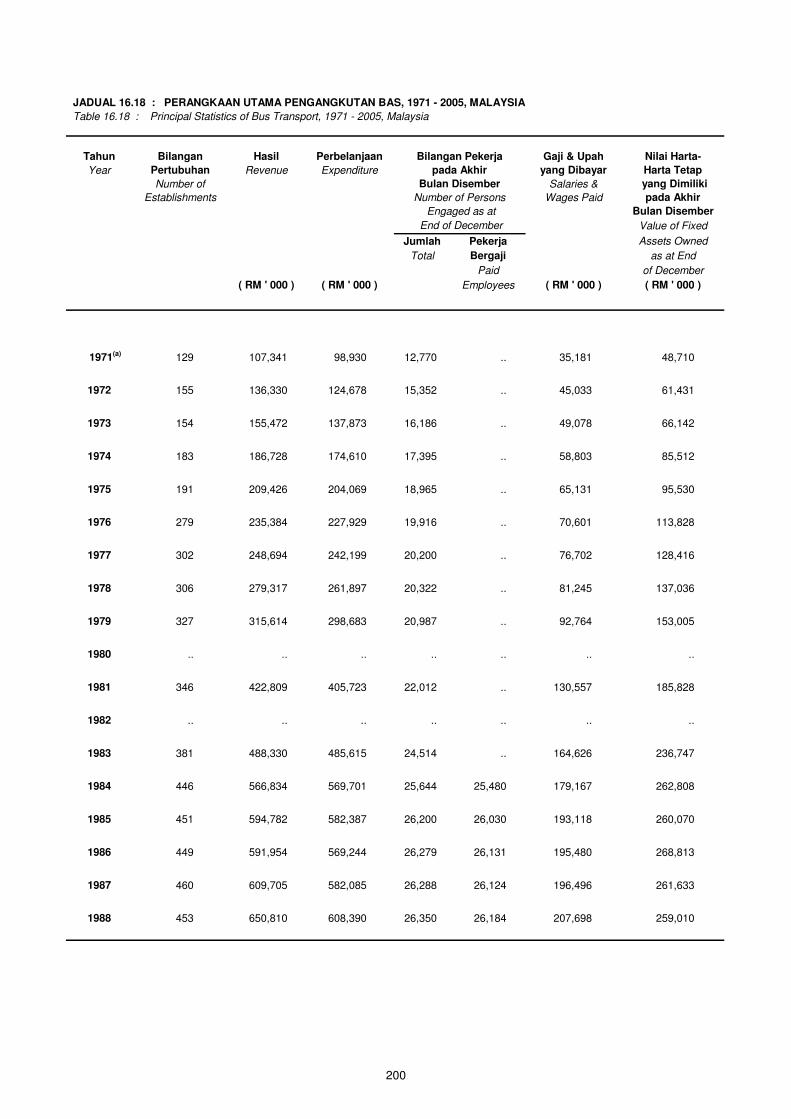
JADUAL 16.18 : PERANGKAAN UTAMA PENGANGKUTAN BAS, 1971 - 2005, MALAYSIA
Table 16.18 : Principal Statistics of Bus Transport, 1971 - 2005, Malaysia
Tahun Bilangan Hasil Perbelanjaan Bilangan Pekerja Gaji & Upah Nilai Harta-
Year Pertubuhan Revenue Expenditure pada Akhir yang Dibayar Harta Tetap
Number of Bulan Disember Salaries & yang Dimiliki
Establishments Number of Persons Wages Paid pada Akhir
Engaged as at Bulan Disember
End of December Value of Fixed
Jumlah Pekerja Assets Owned
Total Bergaji as at End
Paid of December
( RM ' 000 ) ( RM ' 000 ) Employees ( RM ' 000 ) ( RM ' 000 )
1971(a) 129 107,341 98,930 12,770 .. 35,181 48,710
1972 155 136,330 124,678 15,352 .. 45,033 61,431
1973 154 155,472 137,873 16,186 .. 49,078 66,142
1974 183 186,728 174,610 17,395 .. 58,803 85,512
1975 191 209,426 204,069 18,965 .. 65,131 95,530
1976 279 235,384 227,929 19,916 .. 70,601 113,828
1977 302 248,694 242,199 20,200 .. 76,702 128,416
1978 306 279,317 261,897 20,322 .. 81,245 137,036
1979 327 315,614 298,683 20,987 .. 92,764 153,005
1980 .. .. .. .. .. .. ..
1981 346 422,809 405,723 22,012 .. 130,557 185,828
1982 .. .. .. .. .. .. ..
1983 381 488,330 485,615 24,514 .. 164,626 236,747
1984 446 566,834 569,701 25,644 25,480 179,167 262,808
1985 451 594,782 582,387 26,200 26,030 193,118 260,070
1986 449 591,954 569,244 26,279 26,131 195,480 268,813
1987 460 609,705 582,085 26,288 26,124 196,496 261,633
1988 453 650,810 608,390 26,350 26,184 207,698 259,010
200
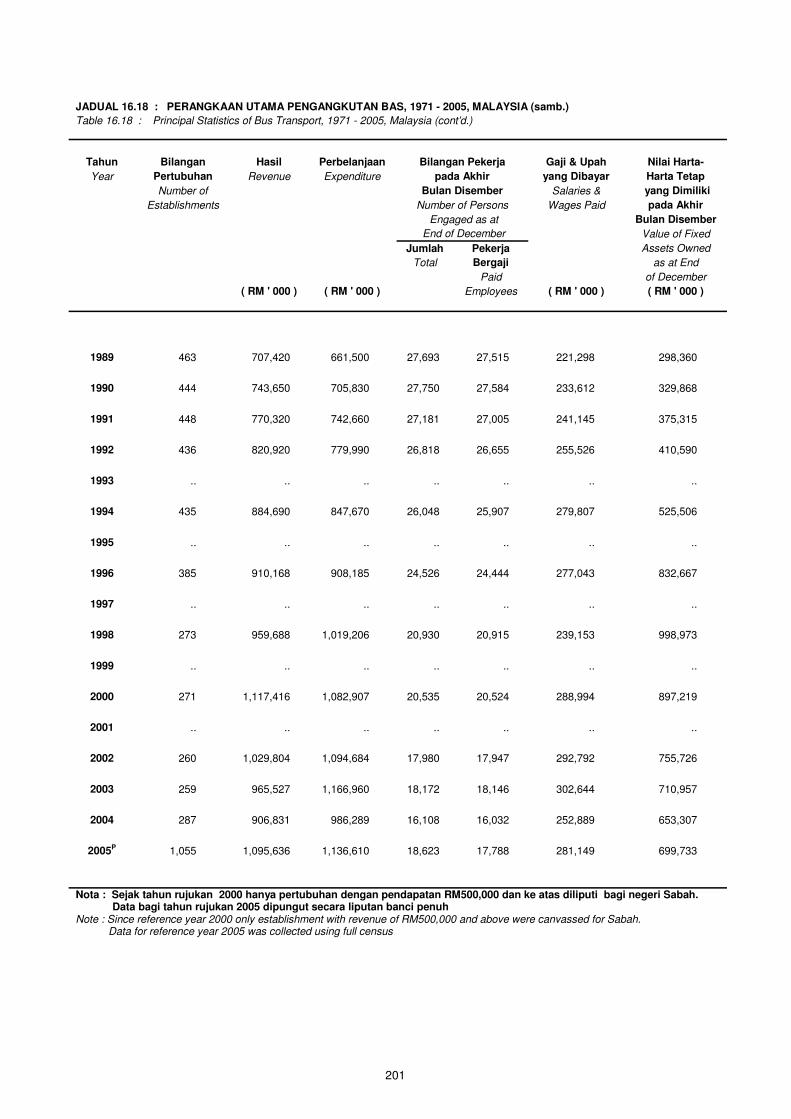
201
JADUAL 16.18 : PERANGKAAN UTAMA PENGANGKUTAN BAS, 1971 - 2005, MALAYSIA (samb.)
Table 16.18 : Principal Statistics of Bus Transport, 1971 - 2005, Malaysia (cont’d.)
Tahun Bilangan Hasil Perbelanjaan Bilangan Pekerja Gaji & Upah Nilai Harta-
Year Pertubuhan Revenue Expenditure pada Akhir yang Dibayar Harta Tetap
Number of Bulan Disember Salaries & yang Dimiliki
Establishments Number of Persons Wages Paid pada Akhir
Engaged as at Bulan Disember
End of December Value of Fixed
Jumlah Pekerja Assets Owned
Total Bergaji as at End
Paid of December
( RM ' 000 ) ( RM ' 000 ) Employees ( RM ' 000 ) ( RM ' 000 )
1989 463 707,420 661,500 27,693 27,515 221,298 298,360
1990 444 743,650 705,830 27,750 27,584 233,612 329,868
1991 448 770,320 742,660 27,181 27,005 241,145 375,315
1992 436 820,920 779,990 26,818 26,655 255,526 410,590
1993 .. .. .. .. .. .. ..
1994 435 884,690 847,670 26,048 25,907 279,807 525,506
1995 .. .. .. .. .. .. ..
1996 385 910,168 908,185 24,526 24,444 277,043 832,667
1997 .. .. .. .. .. .. ..
1998 273 959,688 1,019,206 20,930 20,915 239,153 998,973
1999 .. .. .. .. .. .. ..
2000 271 1,117,416 1,082,907 20,535 20,524 288,994 897,219
2001 .. .. .. .. .. .. ..
2002 260 1,029,804 1,094,684 17,980 17,947 292,792 755,726
2003 259 965,527 1,166,960 18,172 18,146 302,644 710,957
2004 287 906,831 986,289 16,108 16,032 252,889 653,307
Nota : Sejak tahun rujukan 2000 hanya pertubuhan dengan pendapatan RM500,000 dan ke atas diliputi bagi negeri Sabah. Data bagi tahun rujukan 2005 dipungut secara liputan banci penuh Note : Since reference year 2000 only establishment with revenue of RM500,000 and above were canvassed for Sabah. Data for reference year 2005 was collected using full census
2005P 1,055 1,095,636 1,136,610 18,623 17,788 281,149 699,733
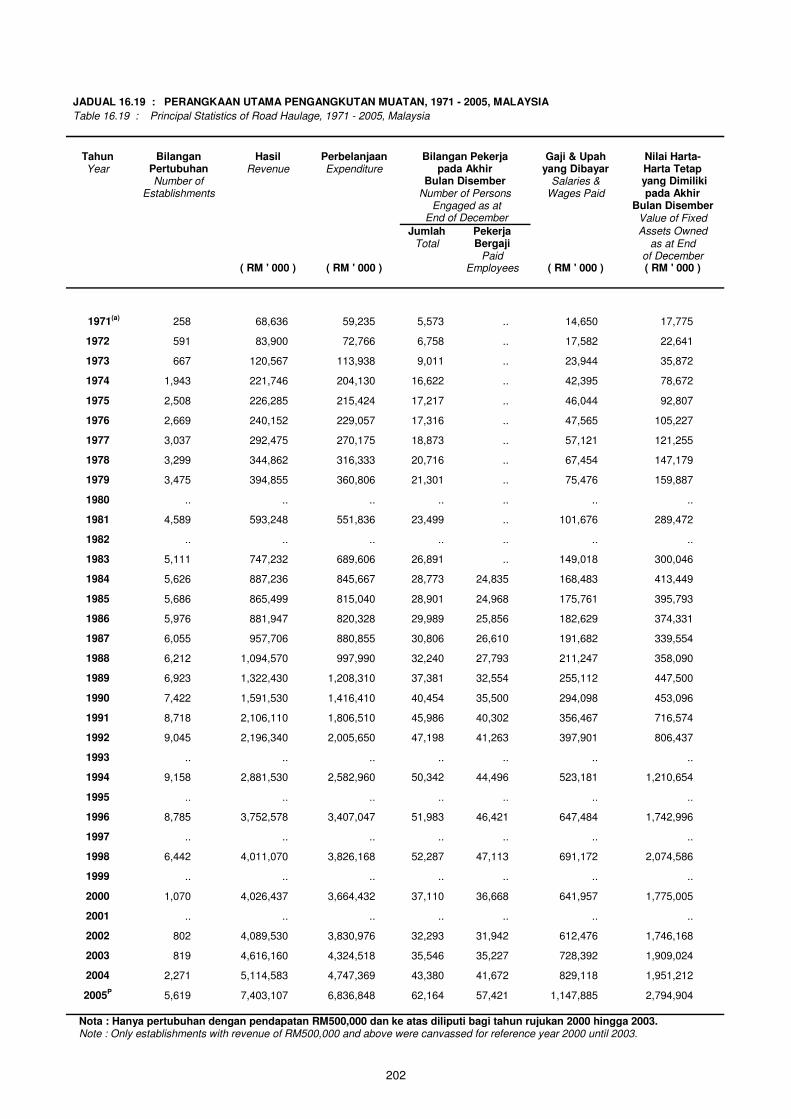
JADUAL 16.19 : PERANGKAAN UTAMA PENGANGKUTAN MUATAN, 1971 - 2005, MALAYSIA
Table 16.19 : Principal Statistics of Road Haulage, 1971 - 2005, Malaysia
Tahun Bilangan Hasil Perbelanjaan Bilangan Pekerja Gaji & Upah Nilai Harta- Year Pertubuhan Revenue Expenditure pada Akhir yang Dibayar Harta Tetap
Number of Bulan Disember Salaries & yang Dimiliki Establishments Number of Persons Wages Paid pada Akhir Engaged as at Bulan Disember End of December Value of Fixed
Jumlah Pekerja Assets Owned
Total Bergaji as at End
Paid of December ( RM ' 000 ) ( RM ' 000 ) Employees ( RM ' 000 ) ( RM ' 000 )
1971(a) 258 68,636 59,235 5,573 .. 14,650 17,775
1972 591 83,900 72,766 6,758 .. 17,582 22,641
1973 667 120,567 113,938 9,011 .. 23,944 35,872
1974 1,943 221,746 204,130 16,622 .. 42,395 78,672
1975 2,508 226,285 215,424 17,217 .. 46,044 92,807
1976 2,669 240,152 229,057 17,316 .. 47,565 105,227
1977 3,037 292,475 270,175 18,873 .. 57,121 121,255
1978 3,299 344,862 316,333 20,716 .. 67,454 147,179
1979 3,475 394,855 360,806 21,301 .. 75,476 159,887
1980 .. .. .. .. .. .. ..
1981 4,589 593,248 551,836 23,499 .. 101,676 289,472
1982 .. .. .. .. .. .. ..
1983 5,111 747,232 689,606 26,891 .. 149,018 300,046
1984 5,626 887,236 845,667 28,773 24,835 168,483 413,449
1985 5,686 865,499 815,040 28,901 24,968 175,761 395,793
1986 5,976 881,947 820,328 29,989 25,856 182,629 374,331
1987 6,055 957,706 880,855 30,806 26,610 191,682 339,554
1988 6,212 1,094,570 997,990 32,240 27,793 211,247 358,090
1989 6,923 1,322,430 1,208,310 37,381 32,554 255,112 447,500
1990 7,422 1,591,530 1,416,410 40,454 35,500 294,098 453,096
1991 8,718 2,106,110 1,806,510 45,986 40,302 356,467 716,574
1992 9,045 2,196,340 2,005,650 47,198 41,263 397,901 806,437
1993 .. .. .. .. .. .. ..
1994 9,158 2,881,530 2,582,960 50,342 44,496 523,181 1,210,654
1995 .. .. .. .. .. .. ..
1996 8,785 3,752,578 3,407,047 51,983 46,421 647,484 1,742,996
1997 .. .. .. .. .. .. ..
1998 6,442 4,011,070 3,826,168 52,287 47,113 691,172 2,074,586
1999 .. .. .. .. .. .. ..
2000 1,070 4,026,437 3,664,432 37,110 36,668 641,957 1,775,005
2001 .. .. .. .. .. .. ..
2002 802 4,089,530 3,830,976 32,293 31,942 612,476 1,746,168
2003 819 4,616,160 4,324,518 35,546 35,227 728,392 1,909,024
2004 2,271 5,114,583 4,747,369 43,380 41,672 829,118 1,951,212
2005P 5,619 7,403,107 6,836,848 62,164 57,421 1,147,885 2,794,904
Nota : Hanya pertubuhan dengan pendapatan RM500,000 dan ke atas diliputi bagi tahun rujukan 2000 hingga 2003. Note : Only establishments with revenue of RM500,000 and above were canvassed for reference year 2000 until 2003.
202
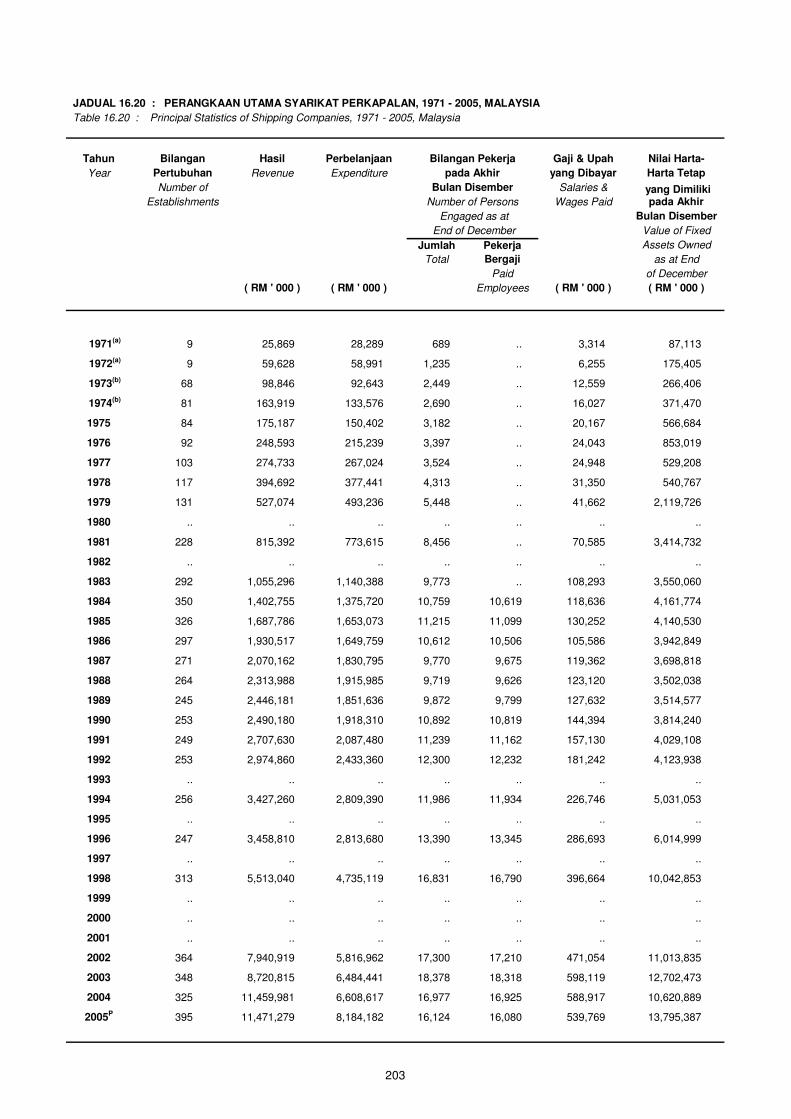
JADUAL 16.20 : PERANGKAAN UTAMA SYARIKAT PERKAPALAN, 1971 - 2005, MALAYSIA
Table 16.20 : Principal Statistics of Shipping Companies, 1971 - 2005, Malaysia
Tahun Bilangan Hasil Perbelanjaan Bilangan Pekerja Gaji & Upah Nilai Harta-
Year Pertubuhan Revenue Expenditure pada Akhir yang Dibayar Harta Tetap
Number of Bulan Disember Salaries & yang Dimiliki Establishments Number of Persons Wages Paid pada Akhir
Engaged as at Bulan Disember
End of December Value of Fixed
Jumlah Pekerja Assets Owned
Total Bergaji as at End
Paid of December
( RM ' 000 ) ( RM ' 000 ) Employees ( RM ' 000 ) ( RM ' 000 )
1971(a) 9 25,869 28,289 689 .. 3,314 87,113
1972(a) 9 59,628 58,991 1,235 .. 6,255 175,405
1973(b) 68 98,846 92,643 2,449 .. 12,559 266,406
1974(b) 81 163,919 133,576 2,690 .. 16,027 371,470
1975 84 175,187 150,402 3,182 .. 20,167 566,684
1976 92 248,593 215,239 3,397 .. 24,043 853,019
1977 103 274,733 267,024 3,524 .. 24,948 529,208
1978 117 394,692 377,441 4,313 .. 31,350 540,767
1979 131 527,074 493,236 5,448 .. 41,662 2,119,726
1980 .. .. .. .. .. .. ..
1981 228 815,392 773,615 8,456 .. 70,585 3,414,732
1982 .. .. .. .. .. .. ..
1983 292 1,055,296 1,140,388 9,773 .. 108,293 3,550,060
1984 350 1,402,755 1,375,720 10,759 10,619 118,636 4,161,774
1985 326 1,687,786 1,653,073 11,215 11,099 130,252 4,140,530
1986 297 1,930,517 1,649,759 10,612 10,506 105,586 3,942,849
1987 271 2,070,162 1,830,795 9,770 9,675 119,362 3,698,818
1988 264 2,313,988 1,915,985 9,719 9,626 123,120 3,502,038
1989 245 2,446,181 1,851,636 9,872 9,799 127,632 3,514,577
1990 253 2,490,180 1,918,310 10,892 10,819 144,394 3,814,240
1991 249 2,707,630 2,087,480 11,239 11,162 157,130 4,029,108
1992 253 2,974,860 2,433,360 12,300 12,232 181,242 4,123,938
1993 .. .. .. .. .. .. ..
1994 256 3,427,260 2,809,390 11,986 11,934 226,746 5,031,053
1995 .. .. .. .. .. .. ..
1996 247 3,458,810 2,813,680 13,390 13,345 286,693 6,014,999
1997 .. .. .. .. .. .. ..
1998 313 5,513,040 4,735,119 16,831 16,790 396,664 10,042,853
1999 .. .. .. .. .. .. ..
2000 .. .. .. .. .. .. ..
2001 .. .. .. .. .. .. ..
2002 364 7,940,919 5,816,962 17,300 17,210 471,054 11,013,835
2003 348 8,720,815 6,484,441 18,378 18,318 598,119 12,702,473
2004 325 11,459,981 6,608,617 16,977 16,925 588,917 10,620,889
2005P 395 11,471,279 8,184,182 16,124 16,080 539,769 13,795,387
203

JADUAL 16.21 : PERANGKAAN UTAMA PENGANGKUTAN AIR PEDALAMAN, 2000 - 2005, MALAYSIA
Table 16.21 : Principal Statistics of Inland Water Transport, 2000 - 2005, Malaysia
Tahun Bilangan Hasil Perbelanjaan Bilangan Pekerja Gaji & Upah Nilai Harta-
Year Pertubuhan Revenue Expenditure pada Akhir yang Dibayar Harta Tetap
Number of Bulan Disember Salaries & yang Dimiliki
Establishments Number of Persons Wages Paid pada Akhir
Engaged as at Bulan Disember
End of December Value of Fixed
Jumlah Pekerja Assets Owned
Total Bergaji as at End
Paid of December
( RM ' 000 ) ( RM ' 000 ) Employees ( RM ' 000 ) ( RM ' 000 )
2000 235 169,854 139,664 2,193 2,028 34,165 88,989
2001 .. .. .. .. .. .. ..
2002 58 136,369 108,065 1,450 1,432 24,624 76,948
2003 55 147,862 123,425 1,363 1,345 24,802 67,153
2004 57 154,553 133,445 1,332 1,314 23,764 72,120
2005P 371 241,344 206,718 2,376 2,054 35,233 112,850
JADUAL 16.22 : PERANGKAAN UTAMA PENGANGKUTAN UDARA, 2000 - 2005, MALAYSIA
Table 16.22 : Principal Statistics of Air Transport, 2000 - 2005, Malaysia
Tahun Bilangan Hasil Perbelanjaan Bilangan Pekerja Gaji & Upah Nilai Harta-
Year Pertubuhan Revenue Expenditure pada Akhir yang Dibayar Harta Tetap
Number of Bulan Disember Salaries & yang Dimiliki
Establishments Number of Persons Wages Paid pada Akhir
Engaged as at Bulan Disember
End of December Value of Fixed
Jumlah Pekerja Assets Owned
Total Bergaji as at End
Paid of December
( RM ' 000 ) ( RM ' 000 ) Employees ( RM ' 000 ) ( RM ' 000 )
2000 19 9,021,925 11,089,284 23,835 23,835 975,097 9,994,199
2001 .. .. .. .. .. .. ..
2002 15 11,318,423 10,681,676 23,899 23,899 1,021,150 6,602,081
2003 15 11,427,111 10,931,489 24,620 24,620 1,277,189 2,053,322
2004 14 13,283,944 12,734,238 25,323 25,323 1,775,347 2,499,127
2005P 18 13,903,222 15,014,263 24,345 24,345 1,133,333 10,491,732
204

JADUAL 16.23 : PERANGKAAN UTAMA KERETA API / TRANSIT ALIRAN RINGAN, 2000 - 2005, MALAYSIA
Table 16.23 : Principal Statistics of Train / Light Rail Transit Services , 2000 - 2005, Malaysia
Tahun Bilangan Hasil Perbelanjaan Bilangan Pekerja Gaji & Upah Nilai Harta-
Year Pertubuhan Revenue Expenditure pada Akhir yang Dibayar Harta Tetap
Number of Bulan Disember Salaries & yang Dimiliki
Establishments Number of Persons Wages Paid pada Akhir
Engaged as at Bulan Disember
End of December Value of Fixed
Jumlah Pekerja Assets Owned
Total Bergaji as at End
Paid of December
( RM ' 000 ) ( RM ' 000 ) Employees ( RM ' 000 ) ( RM ' 000 )
2000 3 388,724 728,450 6,588 6,588 127,504 4,030,329
2001 .. .. .. .. .. .. ..
2002 3 497,449 645,596 6,735 6,735 162,842 11,325,568
2003 4 628,282 901,032 6,916 6,916 187,930 12,411,703
2004 4 1,027,099 1,339,600 8,546 8,546 252,815 12,348,498
2005P 4 690,943 812,504 6,368 6,368 185,299 4,264,979
205
JADUAL 16.24 : PERANGKAAN UTAMA LAIN-LAIN PERKHIDMATAN PENGHANTARAN KARGO, 2000 - 2005, MALAYSIA
Table 16.24 : Principal Statistics of Other Forwarding Cargo Services, 2000 - 2005, Malaysia
Tahun Bilangan Hasil Perbelanjaan Bilangan Pekerja Gaji & Upah Nilai Harta-
Year Pertubuhan Revenue Expenditure pada Akhir yang Dibayar Harta Tetap
Number of Bulan Disember Salaries & yang Dimiliki
Establishments Number of Persons Wages Paid pada Akhir
Engaged as at Bulan Disember
End of December Value of Fixed
Jumlah Pekerja Assets Owned
Total Bergaji as at End
Paid of December
( RM ' 000 ) ( RM ' 000 ) Employees ( RM ' 000 ) ( RM ' 000 )
2000 55 917,775 781,000 5,550 5,546 148,414 495,020
2001 .. .. .. .. .. .. ..
2002 50 482,394 471,883 2,247 2,241 51,589 49,299
2003 54 353,603 328,474 2,241 2,237 57,137 157,308
2004 42 245,625 222,408 1,629 1,625 45,654 161,757
2005P 147 902,630 849,426 4,558 4,529 116,901 279,272
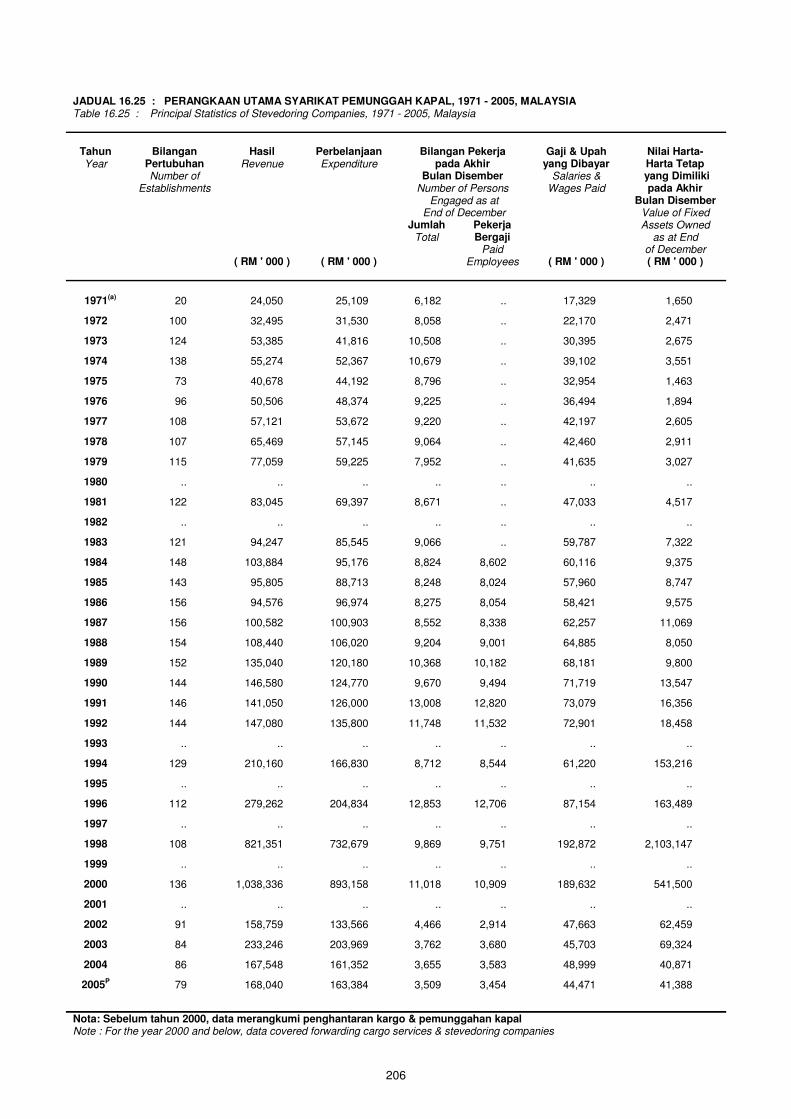
JADUAL 16.25 : PERANGKAAN UTAMA SYARIKAT PEMUNGGAH KAPAL, 1971 - 2005, MALAYSIA Table 16.25 : Principal Statistics of Stevedoring Companies, 1971 - 2005, Malaysia
Tahun Bilangan Hasil Perbelanjaan Bilangan Pekerja Gaji & Upah Nilai Harta- Year Pertubuhan Revenue Expenditure pada Akhir yang Dibayar Harta Tetap
Number of Bulan Disember Salaries & yang Dimiliki Establishments Number of Persons Wages Paid pada Akhir Engaged as at Bulan Disember End of December Value of Fixed
Jumlah Pekerja Assets Owned
Total Bergaji as at End
Paid of December ( RM ' 000 ) ( RM ' 000 ) Employees ( RM ' 000 ) ( RM ' 000 )
1971(a) 20 24,050 25,109 6,182 .. 17,329 1,650
1972 100 32,495 31,530 8,058 .. 22,170 2,471
1973 124 53,385 41,816 10,508 .. 30,395 2,675
1974 138 55,274 52,367 10,679 .. 39,102 3,551
1975 73 40,678 44,192 8,796 .. 32,954 1,463
1976 96 50,506 48,374 9,225 .. 36,494 1,894
1977 108 57,121 53,672 9,220 .. 42,197 2,605
1978 107 65,469 57,145 9,064 .. 42,460 2,911
1979 115 77,059 59,225 7,952 .. 41,635 3,027
1980 .. .. .. .. .. .. ..
1981 122 83,045 69,397 8,671 .. 47,033 4,517
1982 .. .. .. .. .. .. ..
1983 121 94,247 85,545 9,066 .. 59,787 7,322
1984 148 103,884 95,176 8,824 8,602 60,116 9,375
1985 143 95,805 88,713 8,248 8,024 57,960 8,747
1986 156 94,576 96,974 8,275 8,054 58,421 9,575
1987 156 100,582 100,903 8,552 8,338 62,257 11,069
1988 154 108,440 106,020 9,204 9,001 64,885 8,050
1989 152 135,040 120,180 10,368 10,182 68,181 9,800
1990 144 146,580 124,770 9,670 9,494 71,719 13,547
1991 146 141,050 126,000 13,008 12,820 73,079 16,356
1992 144 147,080 135,800 11,748 11,532 72,901 18,458
1993 .. .. .. .. .. .. ..
1994 129 210,160 166,830 8,712 8,544 61,220 153,216
1995 .. .. .. .. .. .. ..
1996 112 279,262 204,834 12,853 12,706 87,154 163,489
1997 .. .. .. .. .. .. ..
1998 108 821,351 732,679 9,869 9,751 192,872 2,103,147
1999 .. .. .. .. .. .. ..
2000 136 1,038,336 893,158 11,018 10,909 189,632 541,500
2001 .. .. .. .. .. .. ..
2002 91 158,759 133,566 4,466 2,914 47,663 62,459
2003 84 233,246 203,969 3,762 3,680 45,703 69,324
2004 86 167,548 161,352 3,655 3,583 48,999 40,871
Nota: Sebelum tahun 2000, data merangkumi penghantaran kargo & pemunggahan kapal Note : For the year 2000 and below, data covered forwarding cargo services & stevedoring companies
2005P 79 168,040 163,384 3,509 3,454 44,471 41,388
206
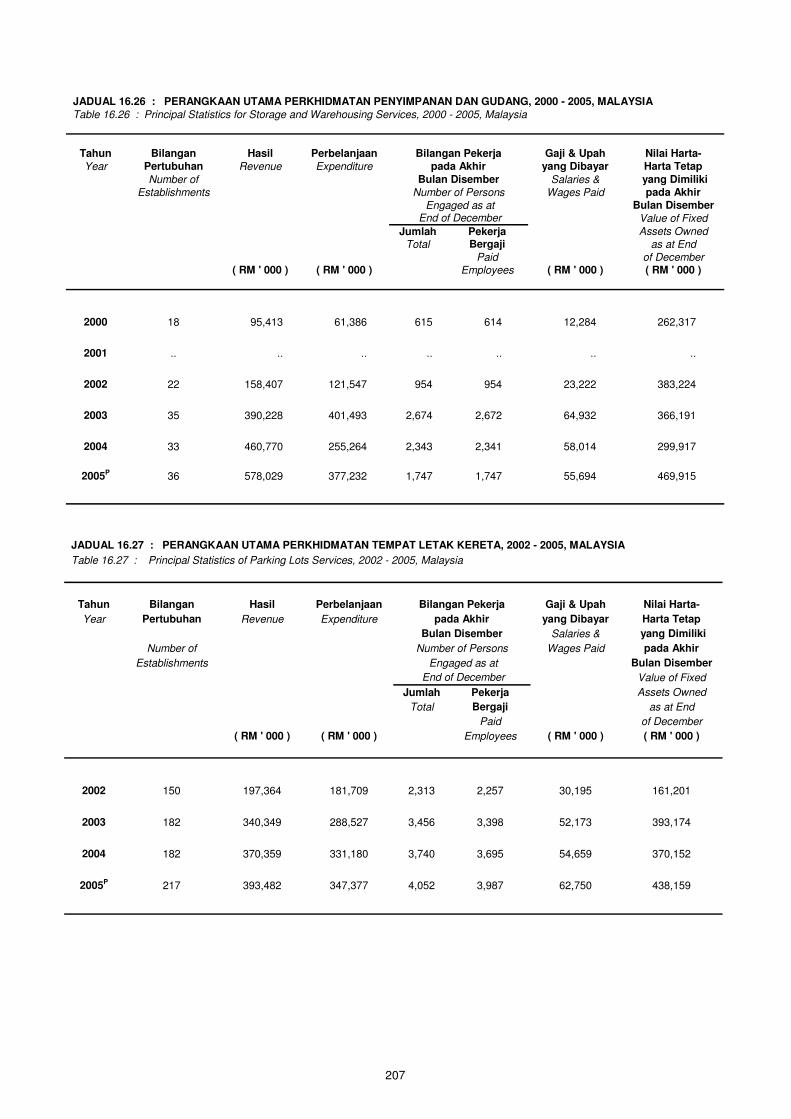
JADUAL 16.26 : PERANGKAAN UTAMA PERKHIDMATAN PENYIMPANAN DAN GUDANG, 2000 - 2005, MALAYSIA
Table 16.26 : Principal Statistics for Storage and Warehousing Services, 2000 - 2005, Malaysia
Tahun Bilangan Hasil Perbelanjaan Bilangan Pekerja Gaji & Upah Nilai Harta-
Year Pertubuhan Revenue Expenditure pada Akhir yang Dibayar Harta Tetap
Number of Bulan Disember Salaries & yang Dimiliki
Establishments Number of Persons Wages Paid pada Akhir
Engaged as at Bulan Disember
End of December Value of Fixed
Jumlah Pekerja Assets Owned
Total Bergaji as at End
Paid of December
( RM ' 000 ) ( RM ' 000 ) Employees ( RM ' 000 ) ( RM ' 000 )
2000 18 95,413 61,386 615 614 12,284 262,317
2001 .. .. .. .. .. .. ..
2002 22 158,407 121,547 954 954 23,222 383,224
2003 35 390,228 401,493 2,674 2,672 64,932 366,191
2004 33 460,770 255,264 2,343 2,341 58,014 299,917
2005P 36 578,029 377,232 1,747 1,747 55,694 469,915
207
JADUAL 16.27 : PERANGKAAN UTAMA PERKHIDMATAN TEMPAT LETAK KERETA, 2002 - 2005, MALAYSIA
Table 16.27 : Principal Statistics of Parking Lots Services, 2002 - 2005, Malaysia
Tahun Bilangan Hasil Perbelanjaan Bilangan Pekerja Gaji & Upah Nilai Harta-
Year Pertubuhan Revenue Expenditure pada Akhir yang Dibayar Harta Tetap
Bulan Disember Salaries & yang Dimiliki
Number of Number of Persons Wages Paid pada Akhir
Establishments Engaged as at Bulan Disember
End of December Value of Fixed
Jumlah Pekerja Assets Owned
Total Bergaji as at End
Paid of December
( RM ' 000 ) ( RM ' 000 ) Employees ( RM ' 000 ) ( RM ' 000 )
2002 150 197,364 181,709 2,313 2,257 30,195 161,201
2003 182 340,349 288,527 3,456 3,398 52,173 393,174
2004 182 370,359 331,180 3,740 3,695 54,659 370,152
2005P 217 393,482 347,377 4,052 3,987 62,750 438,159
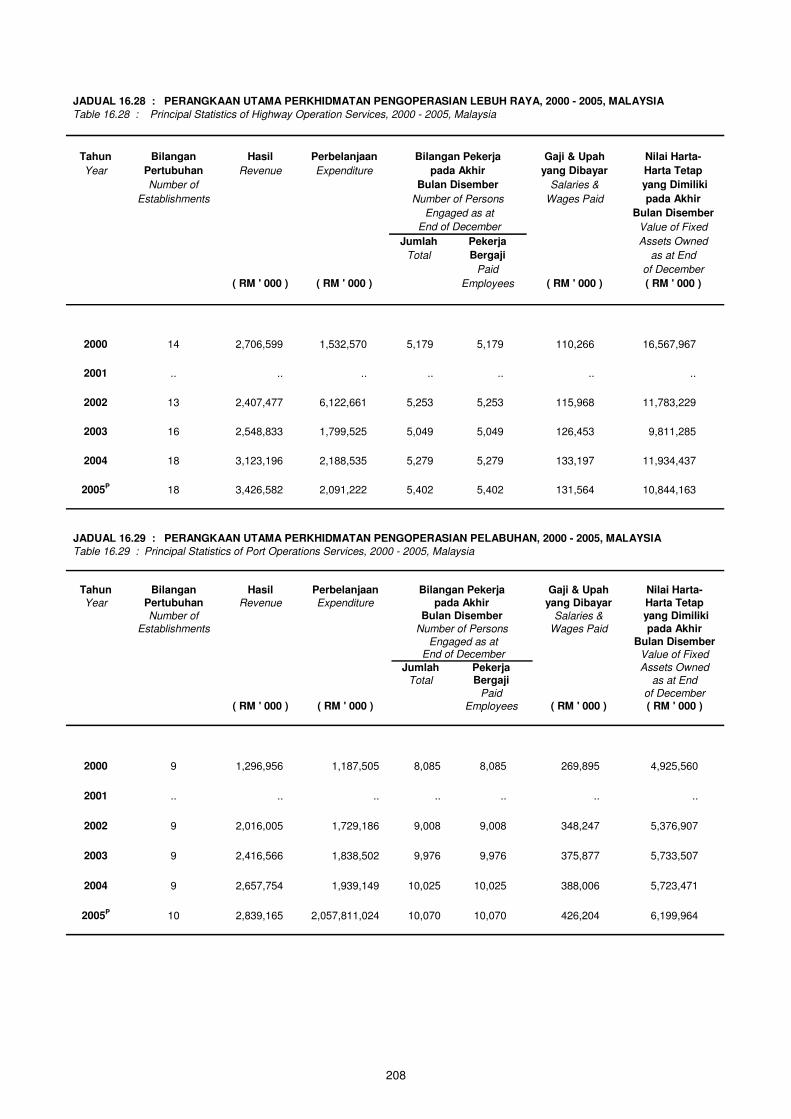
JADUAL 16.28 : PERANGKAAN UTAMA PERKHIDMATAN PENGOPERASIAN LEBUH RAYA, 2000 - 2005, MALAYSIA
Table 16.28 : Principal Statistics of Highway Operation Services, 2000 - 2005, Malaysia
Tahun Bilangan Hasil Perbelanjaan Bilangan Pekerja Gaji & Upah Nilai Harta-
Year Pertubuhan Revenue Expenditure pada Akhir yang Dibayar Harta Tetap
Number of Bulan Disember Salaries & yang Dimiliki
Establishments Number of Persons Wages Paid pada Akhir
Engaged as at Bulan Disember
End of December Value of Fixed
Jumlah Pekerja Assets Owned
Total Bergaji as at End
Paid of December
( RM ' 000 ) ( RM ' 000 ) Employees ( RM ' 000 ) ( RM ' 000 )
2000 14 2,706,599 1,532,570 5,179 5,179 110,266 16,567,967
2001 .. .. .. .. .. .. ..
2002 13 2,407,477 6,122,661 5,253 5,253 115,968 11,783,229
2003 16 2,548,833 1,799,525 5,049 5,049 126,453 9,811,285
2004 18 3,123,196 2,188,535 5,279 5,279 133,197 11,934,437
2005P 18 3,426,582 2,091,222 5,402 5,402 131,564 10,844,163
JADUAL 16.29 : PERANGKAAN UTAMA PERKHIDMATAN PENGOPERASIAN PELABUHAN, 2000 - 2005, MALAYSIA
Table 16.29 : Principal Statistics of Port Operations Services, 2000 - 2005, Malaysia
Tahun Bilangan Hasil Perbelanjaan Bilangan Pekerja Gaji & Upah Nilai Harta-
Year Pertubuhan Revenue Expenditure pada Akhir yang Dibayar Harta Tetap
Number of Bulan Disember Salaries & yang Dimiliki
Establishments Number of Persons Wages Paid pada Akhir
Engaged as at Bulan Disember End of December Value of Fixed
Jumlah Pekerja Assets Owned
Total Bergaji as at End
Paid of December
( RM ' 000 ) ( RM ' 000 ) Employees ( RM ' 000 ) ( RM ' 000 )
2000 9 1,296,956 1,187,505 8,085 8,085 269,895 4,925,560
2001 .. .. .. .. .. .. ..
2002 9 2,016,005 1,729,186 9,008 9,008 348,247 5,376,907
2003 9 2,416,566 1,838,502 9,976 9,976 375,877 5,733,507
2004 9 2,657,754 1,939,149 10,025 10,025 388,006 5,723,471
2005P 10 2,839,165 2,057,811,024 10,070 10,070 426,204 6,199,964
208
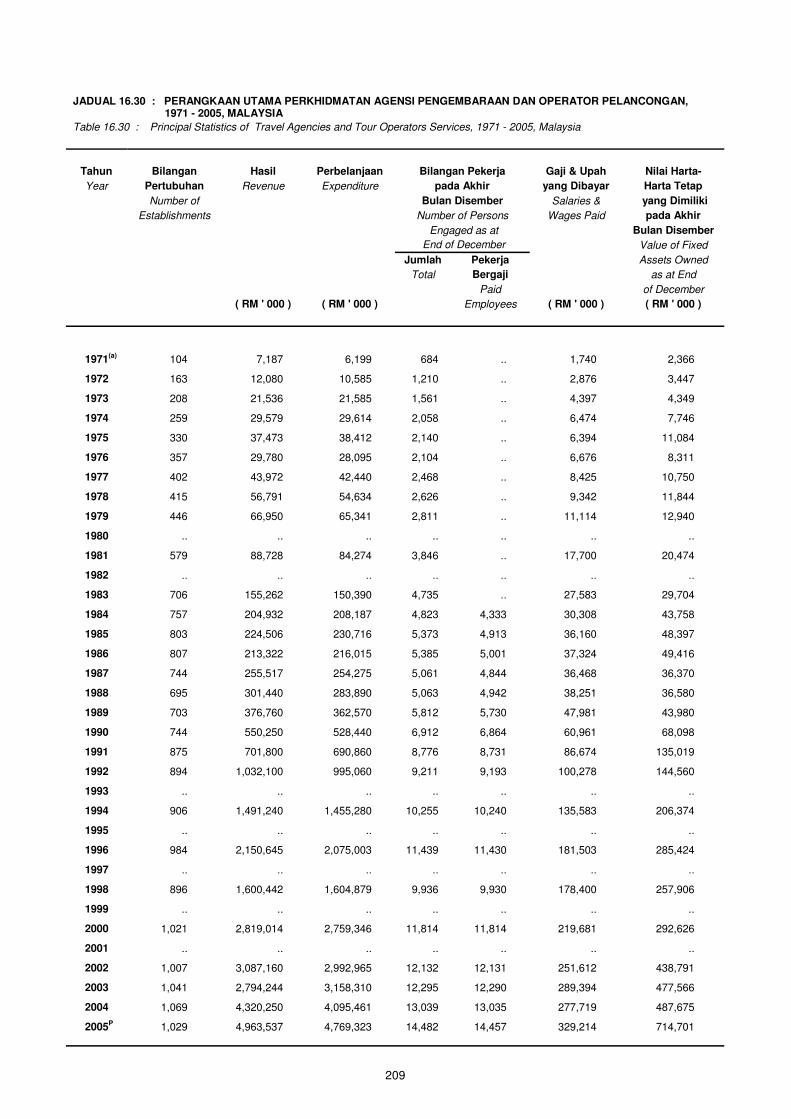
JADUAL 16.30 : PERANGKAAN UTAMA PERKHIDMATAN AGENSI PENGEMBARAAN DAN OPERATOR PELANCONGAN, 1971 - 2005, MALAYSIA
Table 16.30 : Principal Statistics of Travel Agencies and Tour Operators Services, 1971 - 2005, Malaysia
Tahun Bilangan Hasil Perbelanjaan Bilangan Pekerja Gaji & Upah Nilai Harta-
Year Pertubuhan Revenue Expenditure pada Akhir yang Dibayar Harta Tetap
Number of Bulan Disember Salaries & yang Dimiliki
Establishments Number of Persons Wages Paid pada Akhir
Engaged as at Bulan Disember
End of December Value of Fixed
Jumlah Pekerja Assets Owned
Total Bergaji as at End
Paid of December
( RM ' 000 ) ( RM ' 000 ) Employees ( RM ' 000 ) ( RM ' 000 )
1971(a) 104 7,187 6,199 684 .. 1,740 2,366
1972 163 12,080 10,585 1,210 .. 2,876 3,447
1973 208 21,536 21,585 1,561 .. 4,397 4,349
1974 259 29,579 29,614 2,058 .. 6,474 7,746
1975 330 37,473 38,412 2,140 .. 6,394 11,084
1976 357 29,780 28,095 2,104 .. 6,676 8,311
1977 402 43,972 42,440 2,468 .. 8,425 10,750
1978 415 56,791 54,634 2,626 .. 9,342 11,844
1979 446 66,950 65,341 2,811 .. 11,114 12,940
1980 .. .. .. .. .. .. ..
1981 579 88,728 84,274 3,846 .. 17,700 20,474
1982 .. .. .. .. .. .. ..
1983 706 155,262 150,390 4,735 .. 27,583 29,704
1984 757 204,932 208,187 4,823 4,333 30,308 43,758
1985 803 224,506 230,716 5,373 4,913 36,160 48,397
1986 807 213,322 216,015 5,385 5,001 37,324 49,416
1987 744 255,517 254,275 5,061 4,844 36,468 36,370
1988 695 301,440 283,890 5,063 4,942 38,251 36,580
1989 703 376,760 362,570 5,812 5,730 47,981 43,980
1990 744 550,250 528,440 6,912 6,864 60,961 68,098
1991 875 701,800 690,860 8,776 8,731 86,674 135,019
1992 894 1,032,100 995,060 9,211 9,193 100,278 144,560
1993 .. .. .. .. .. .. ..
1994 906 1,491,240 1,455,280 10,255 10,240 135,583 206,374
1995 .. .. .. .. .. .. ..
1996 984 2,150,645 2,075,003 11,439 11,430 181,503 285,424
1997 .. .. .. .. .. .. ..
1998 896 1,600,442 1,604,879 9,936 9,930 178,400 257,906
1999 .. .. .. .. .. .. ..
2000 1,021 2,819,014 2,759,346 11,814 11,814 219,681 292,626
2001 .. .. .. .. .. .. ..
2002 1,007 3,087,160 2,992,965 12,132 12,131 251,612 438,791
2003 1,041 2,794,244 3,158,310 12,295 12,290 289,394 477,566
2004 1,069 4,320,250 4,095,461 13,039 13,035 277,719 487,675
2005P 1,029 4,963,537 4,769,323 14,482 14,457 329,214 714,701
209
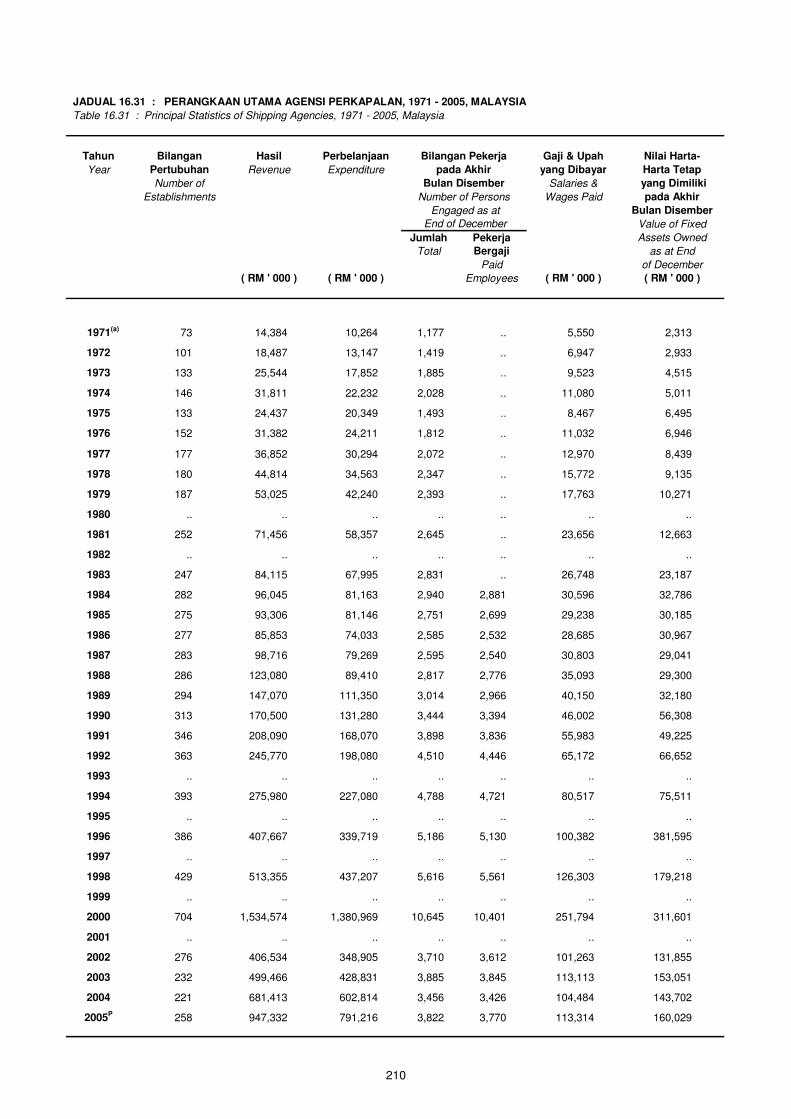
JADUAL 16.31 : PERANGKAAN UTAMA AGENSI PERKAPALAN, 1971 - 2005, MALAYSIA
Table 16.31 : Principal Statistics of Shipping Agencies, 1971 - 2005, Malaysia
Tahun Bilangan Hasil Perbelanjaan Bilangan Pekerja Gaji & Upah Nilai Harta-
Year Pertubuhan Revenue Expenditure pada Akhir yang Dibayar Harta Tetap
Number of Bulan Disember Salaries & yang Dimiliki
Establishments Number of Persons Wages Paid pada Akhir
Engaged as at Bulan Disember
End of December Value of Fixed
Jumlah Pekerja Assets Owned
Total Bergaji as at End
Paid of December
( RM ' 000 ) ( RM ' 000 ) Employees ( RM ' 000 ) ( RM ' 000 )
1971(a) 73 14,384 10,264 1,177 .. 5,550 2,313
1972 101 18,487 13,147 1,419 .. 6,947 2,933
1973 133 25,544 17,852 1,885 .. 9,523 4,515
1974 146 31,811 22,232 2,028 .. 11,080 5,011
1975 133 24,437 20,349 1,493 .. 8,467 6,495
1976 152 31,382 24,211 1,812 .. 11,032 6,946
1977 177 36,852 30,294 2,072 .. 12,970 8,439
1978 180 44,814 34,563 2,347 .. 15,772 9,135
1979 187 53,025 42,240 2,393 .. 17,763 10,271
1980 .. .. .. .. .. .. ..
1981 252 71,456 58,357 2,645 .. 23,656 12,663
1982 .. .. .. .. .. .. ..
1983 247 84,115 67,995 2,831 .. 26,748 23,187
1984 282 96,045 81,163 2,940 2,881 30,596 32,786
1985 275 93,306 81,146 2,751 2,699 29,238 30,185
1986 277 85,853 74,033 2,585 2,532 28,685 30,967
1987 283 98,716 79,269 2,595 2,540 30,803 29,041
1988 286 123,080 89,410 2,817 2,776 35,093 29,300
1989 294 147,070 111,350 3,014 2,966 40,150 32,180
1990 313 170,500 131,280 3,444 3,394 46,002 56,308
1991 346 208,090 168,070 3,898 3,836 55,983 49,225
1992 363 245,770 198,080 4,510 4,446 65,172 66,652
1993 .. .. .. .. .. .. ..
1994 393 275,980 227,080 4,788 4,721 80,517 75,511
1995 .. .. .. .. .. .. ..
1996 386 407,667 339,719 5,186 5,130 100,382 381,595
1997 .. .. .. .. .. .. ..
1998 429 513,355 437,207 5,616 5,561 126,303 179,218
1999 .. .. .. .. .. .. ..
2000 704 1,534,574 1,380,969 10,645 10,401 251,794 311,601
2001 .. .. .. .. .. .. ..
2002 276 406,534 348,905 3,710 3,612 101,263 131,855
2003 232 499,466 428,831 3,885 3,845 113,113 153,051
2004 221 681,413 602,814 3,456 3,426 104,484 143,702
2005P 258 947,332 791,216 3,822 3,770 113,314 160,029
210

211
JADUAL 16.32 : PERANGKAAN UTAMA PERKHIDMATAN AGENSI PENGHANTARAN, 2000 - 2005, MALAYSIA
Table 16.32 : Principal Statistics of Forwarding Agencies Services, 2000 - 2005, Malaysia
Tahun Bilangan Hasil Perbelanjaan Bilangan Pekerja Gaji & Upah Nilai Harta-
Year Pertubuhan Revenue Expenditure pada Akhir yang Dibayar Harta Tetap
Number of Bulan Disember Salaries & yang Dimiliki
Establishments Number of Persons Wages Paid pada Akhir
Engaged as at Bulan Disember
End of December Value of Fixed
Jumlah Pekerja Assets Owned
Total Bergaji as at End
Paid of December
( RM ' 000 ) ( RM ' 000 ) Employees ( RM ' 000 ) ( RM ' 000 )
2000 374 797,493 739,888 5,926 5,742 129,989 153,219
2001 .. .. .. .. .. .. ..
2002 495 1,316,686 1,201,864 9,180 8,946 187,865 224,644
2003 518 1,834,318 1,651,775 11,130 10,909 257,826 291,565
2004 539 2,064,238 1,907,057 11,118 10,867 275,685 325,645
2005P 718 3,180,100 2,962,856 11,867 11,573 282,569 384,329
JADUAL 16.33 : PERANGKAAN UTAMA PERKHIDMATAN POS DAN KURIER, 2000 - 2005, MALAYSIA
Table 16.33 : Principal Statistics of Post and Courier Services, 2000 - 2005, Malaysia
Tahun Bilangan Hasil Perbelanjaan Bilangan Pekerja Gaji & Upah Nilai Harta-
Year Pertubuhan Revenue Expenditure pada Akhir yang Dibayar Harta Tetap
Number of Bulan Disember Salaries & yang Dimiliki
Establishments Number of Persons Wages Paid pada Akhir
Engaged as at Bulan Disember
End of December Value of Fixed
Jumlah Pekerja Assets Owned
Total Bergaji as at End
Paid of December
( RM ' 000 ) ( RM ' 000 ) Employees ( RM ' 000 ) ( RM ' 000 )
2000 42 846,639 794,278 5,841 5,826 91,522 97,648
2001 .. .. .. .. .. .. ..
2002 81 1,037,283 1,000,584 7,767 7,743 149,851 472,771
2003 84 1,550,152 1,463,121 21,369 21,342 459,587 452,980
2004 92 1,636,582 1,549,832 22,679 22,655 484,301 430,184
2005P 118 2,243,323 1,986,914 24,026 23,983 515,399 503,766
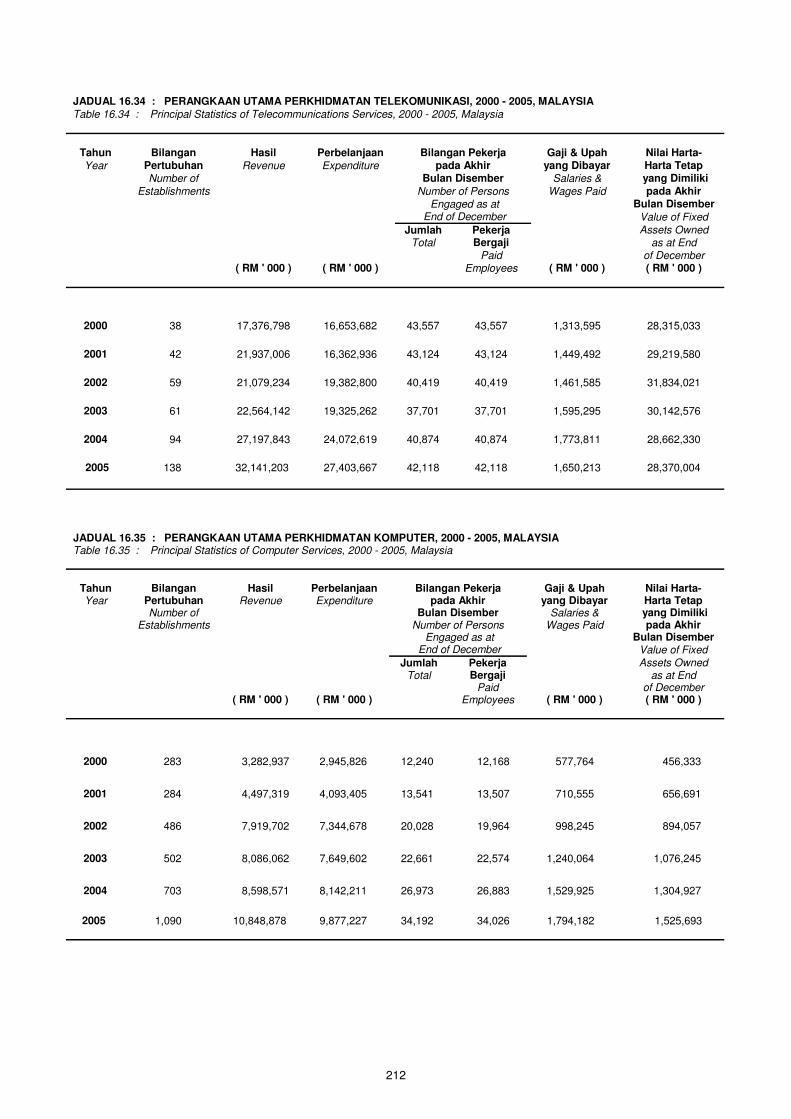
JADUAL 16.34 : PERANGKAAN UTAMA PERKHIDMATAN TELEKOMUNIKASI, 2000 - 2005, MALAYSIA
Table 16.34 : Principal Statistics of Telecommunications Services, 2000 - 2005, Malaysia
Tahun Bilangan Hasil Perbelanjaan Bilangan Pekerja Gaji & Upah Nilai Harta- Year Pertubuhan Revenue Expenditure pada Akhir yang Dibayar Harta Tetap
Number of Bulan Disember Salaries & yang Dimiliki
Establishments Number of Persons Wages Paid pada Akhir Engaged as at Bulan Disember
End of December Value of Fixed
Jumlah Pekerja Assets Owned
Total Bergaji as at End
Paid of December ( RM ' 000 ) ( RM ' 000 ) Employees ( RM ' 000 ) ( RM ' 000 )
2000 38 17,376,798 16,653,682 43,557 43,557 1,313,595 28,315,033
2001 42 21,937,006 16,362,936 43,124 43,124 1,449,492 29,219,580
2002 59 21,079,234 19,382,800 40,419 40,419 1,461,585 31,834,021
2003 61 22,564,142 19,325,262 37,701 37,701 1,595,295 30,142,576
2004 94 27,197,843 24,072,619 40,874 40,874 1,773,811 28,662,330
2005 138 32,141,203 27,403,667 42,118 42,118 1,650,213 28,370,004
212
JADUAL 16.35 : PERANGKAAN UTAMA PERKHIDMATAN KOMPUTER, 2000 - 2005, MALAYSIA Table 16.35 : Principal Statistics of Computer Services, 2000 - 2005, Malaysia
Tahun Bilangan Hasil Perbelanjaan Bilangan Pekerja Gaji & Upah Nilai Harta- Year Pertubuhan Revenue Expenditure pada Akhir yang Dibayar Harta Tetap
Number of Bulan Disember Salaries & yang Dimiliki Establishments Number of Persons Wages Paid pada Akhir Engaged as at Bulan Disember End of December Value of Fixed
Jumlah Pekerja Assets Owned
Total Bergaji as at End
Paid of December ( RM ' 000 ) ( RM ' 000 ) Employees ( RM ' 000 ) ( RM ' 000 )
2000 283 3,282,937 2,945,826 12,240 12,168 577,764 456,333
2001 284 4,497,319 4,093,405 13,541 13,507 710,555 656,691
2002 486 7,919,702 7,344,678 20,028 19,964 998,245 894,057
2003 502 8,086,062 7,649,602 22,661 22,574 1,240,064 1,076,245
2004 703 8,598,571 8,142,211 26,973 26,883 1,529,925 1,304,927
2005 1,090 10,848,878 9,877,227 34,192 34,026 1,794,182 1,525,693
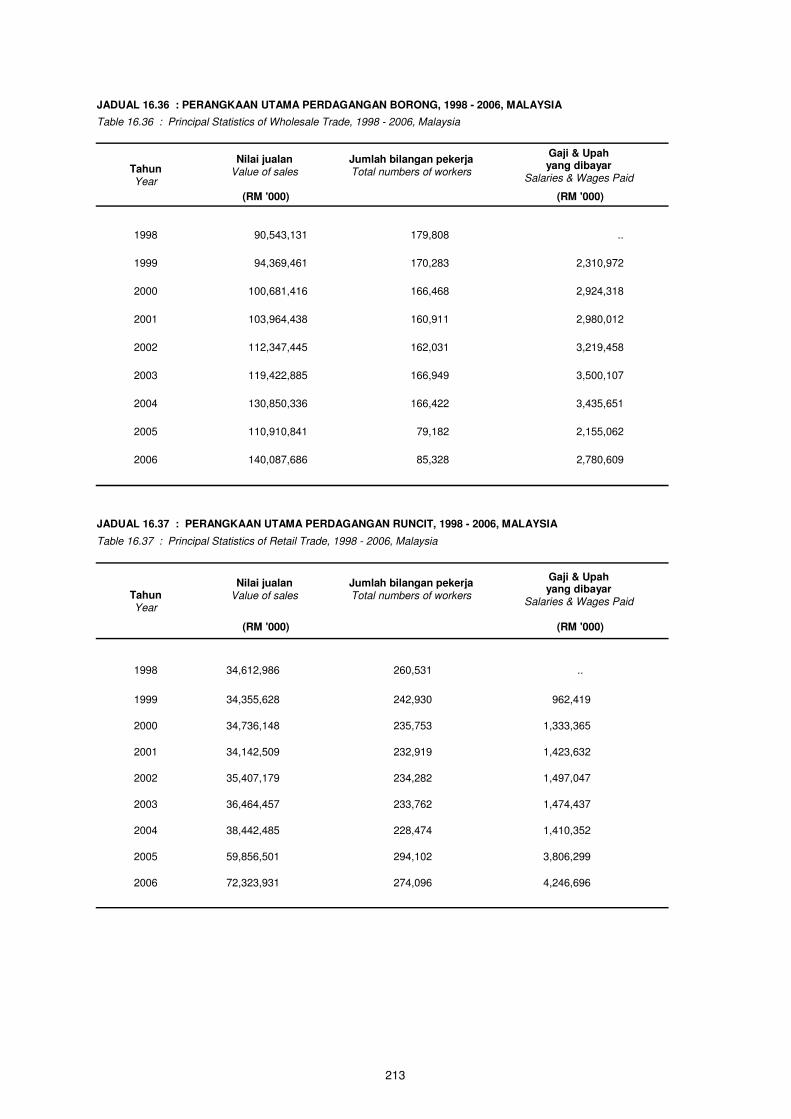
JADUAL 16.36 : PERANGKAAN UTAMA PERDAGANGAN BORONG, 1998 - 2006, MALAYSIA
Table 16.36 : Principal Statistics of Wholesale Trade, 1998 - 2006, Malaysia
Tahun Year
Nilai jualan Value of sales
Jumlah bilangan pekerja Total numbers of workers
Gaji & Upah yang dibayar
Salaries & Wages Paid
(RM '000) (RM '000)
1998 90,543,131 179,808 ..
1999 94,369,461 170,283 2,310,972
2000 100,681,416 166,468 2,924,318
2001 103,964,438 160,911 2,980,012
2002 112,347,445 162,031 3,219,458
2003 119,422,885 166,949 3,500,107
2004 130,850,336 166,422 3,435,651
2005 110,910,841 79,182 2,155,062
2006 140,087,686 85,328 2,780,609
JADUAL 16.37 : PERANGKAAN UTAMA PERDAGANGAN RUNCIT, 1998 - 2006, MALAYSIA
Table 16.37 : Principal Statistics of Retail Trade, 1998 - 2006, Malaysia
Tahun Year
Nilai jualan Value of sales
Jumlah bilangan pekerja Total numbers of workers
Gaji & Upah yang dibayar
Salaries & Wages Paid
(RM '000) (RM '000)
1998 34,612,986 260,531 ..
1999 34,355,628 242,930 962,419
2000 34,736,148 235,753 1,333,365
2001 34,142,509 232,919 1,423,632
2002 35,407,179 234,282 1,497,047
2003 36,464,457 233,762 1,474,437
2004 38,442,485 228,474 1,410,352
2005 59,856,501 294,102 3,806,299
2006 72,323,931 274,096 4,246,696
213
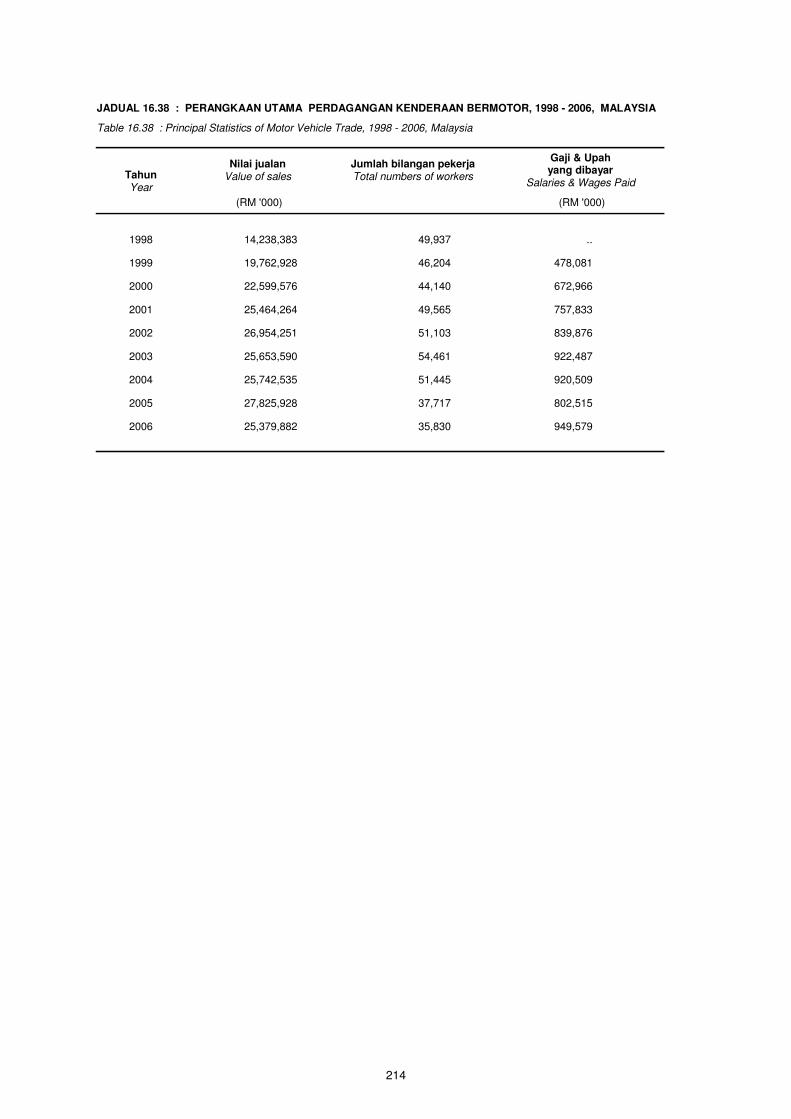
JADUAL 16.38 : PERANGKAAN UTAMA PERDAGANGAN KENDERAAN BERMOTOR, 1998 - 2006, MALAYSIA
Table 16.38 : Principal Statistics of Motor Vehicle Trade, 1998 - 2006, Malaysia
Tahun Year
Nilai jualan Value of sales
Jumlah bilangan pekerja Total numbers of workers
Gaji & Upah yang dibayar
Salaries & Wages Paid
(RM '000) (RM '000)
1998 14,238,383 49,937 ..
1999 19,762,928 46,204 478,081
2000 22,599,576 44,140 672,966
2001 25,464,264 49,565 757,833
2002 26,954,251 51,103 839,876
2003 25,653,590 54,461 922,487
2004 25,742,535 51,445 920,509
2005 27,825,928 37,717 802,515
2006 25,379,882 35,830 949,579
214

215
ALAM SEKITAR Nota Keterangan
1. Data berhubung dengan indeks pencemaran udara dan kualiti air sungai diperoleh
daripada Jabatan Alam Sekitar (JAS). Data diperoleh bermula dari tahun 1998
hingga 2006.
Indeks Pencemaran Udara (IPU)
2. IPU menunjukkan status kualiti udara di stesen terpilih iaitu di Kuala Lumpur, Johor
Bahru, Melaka, Seberang Jaya, Kuching dan Kota Kinabalu. Bahan cemar udara
yang terlibat dalam pengiraan IPU Malaysia adalah ozon (O3), karbon monoksida
(CO), nitrogen dioksida (NO2), sulfur dioksida (SO2) dan bahan zarah yang
berukuran kurang dari 10 mikron (PM10).
3. Ukuran indeks bagi menunjukkan status kualiti udara dan kesannya kepada
kesihatan manusia dikategorikan seperti berikut :
IPU Kesan Kesihatan IPU Kesan kesihatan
0 – 50 Bagus 201 – 300 Sangat tidak sihat
51 – 100 Sederhana 301 – 500 Berbahaya
101 – 200 Tidak sihat Melebihi 500 Kecemasan
Kualiti Air Sungai
4. Program Pemantauan Kualiti Air Sungai dijalankan oleh JAS untuk mengenalpasti
status kualiti air sungai, mengesan perubahan kualiti air disebabkan oleh aktiviti
pembangunan dan juga mengenal pasti punca pencemaran.
5. Contoh-contoh air telah diambil daripada stesen-stesen pemantauan dan dianalisa
bagi mengukur Indeks Kualiti Air (IKA). Parameter yang dianalisa ialah keperluan
oksigen biokimia (BOD5), ammoniacal nitrogen (NH3-N) dan pepejal terampai (SS).
6. Hasil daripada penganalisaan tersebut, kualiti air sungai boleh diklasifikasikan
kepada tiga kategori iaitu bersih (B), sederhana tercemar (ST) dan tercemar (T).
ENVIRONMENT
Explanatory Notes
1. Data pertaining to air pollutant index and river water quality are obtained from the
Department of Environment (DOE). The data are available since 1998 to 2006.
Air Pollutant Index (API)
2. The API shows the air quality status in the selected stations namely in Kuala
Lumpur, Johor Bahru, Melaka, Seberang Jaya, Kuching and Kota Kinabalu. The air
pollutants included in Malaysian’s API calculation are ozone (O3), carbon monoxide
(CO), nitrogen dioxide (NO2), sulphur dioxide (SO2) and suspended particulate
matter of less than 10 microns in size (PM10).
3. Index value to reflect the status of the air quality and its effect on human health are
categorized as follows :
API Health Effects API Health Effects
0 – 50 Good 201 – 300 Very unhealthy
51 – 100 Moderate 301 – 500 Hazardous
101 – 200 Unhealthy Above 500 Emergency
River Water Quality
4. River Water Quality Monitoring Programme done by DOE is to establish the status
of river water quality, to detect changes in water quality as a result of development
activities and also to identify the pollution sources.
5. Water samples collected from monitored stations are analysed to derive the Water
Quality Index (WQI). The parameters which analysed are biochemical oxygen
demand (BOD5), ammoniacal nitrogen (NH3-N) and suspended solids (SS).
6. As a result, river water quality could be classified into three categories namely clean
(C), slightly polluted (SP) and polluted (P).
216
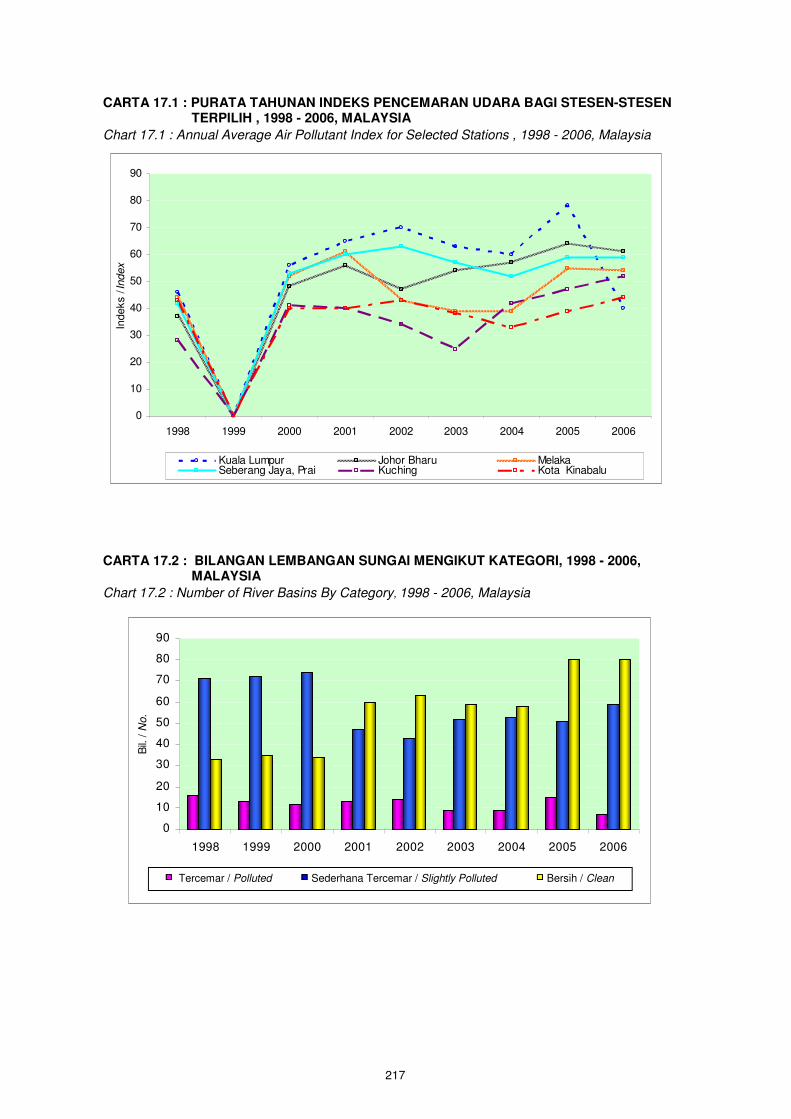
0
10
20
30
40
50
60
70
80
90
1998 1999 2000 2001 2002 2003 2004 2005 2006
Indeks / In
dex
Kuala Lumpur Johor Bharu MelakaSeberang Jaya, Prai Kuching Kota Kinabalu
0
10
20
30
40
50
60
70
80
90
1998 1999 2000 2001 2002 2003 2004 2005 2006
Bil.
/ N
o.
CARTA 17.1 : PURATA TAHUNAN INDEKS PENCEMARAN UDARA BAGI STESEN-STESEN TERPILIH , 1998 - 2006, MALAYSIA
Chart 17.1 : Annual Average Air Pollutant Index for Selected Stations , 1998 - 2006, Malaysia
CARTA 17.2 : BILANGAN LEMBANGAN SUNGAI MENGIKUT KATEGORI, 1998 - 2006, MALAYSIA
Chart 17.2 : Number of River Basins By Category, 1998 - 2006, Malaysia
Tercemar / Polluted Sederhana Tercemar / Slightly Polluted Bersih / Clean
217

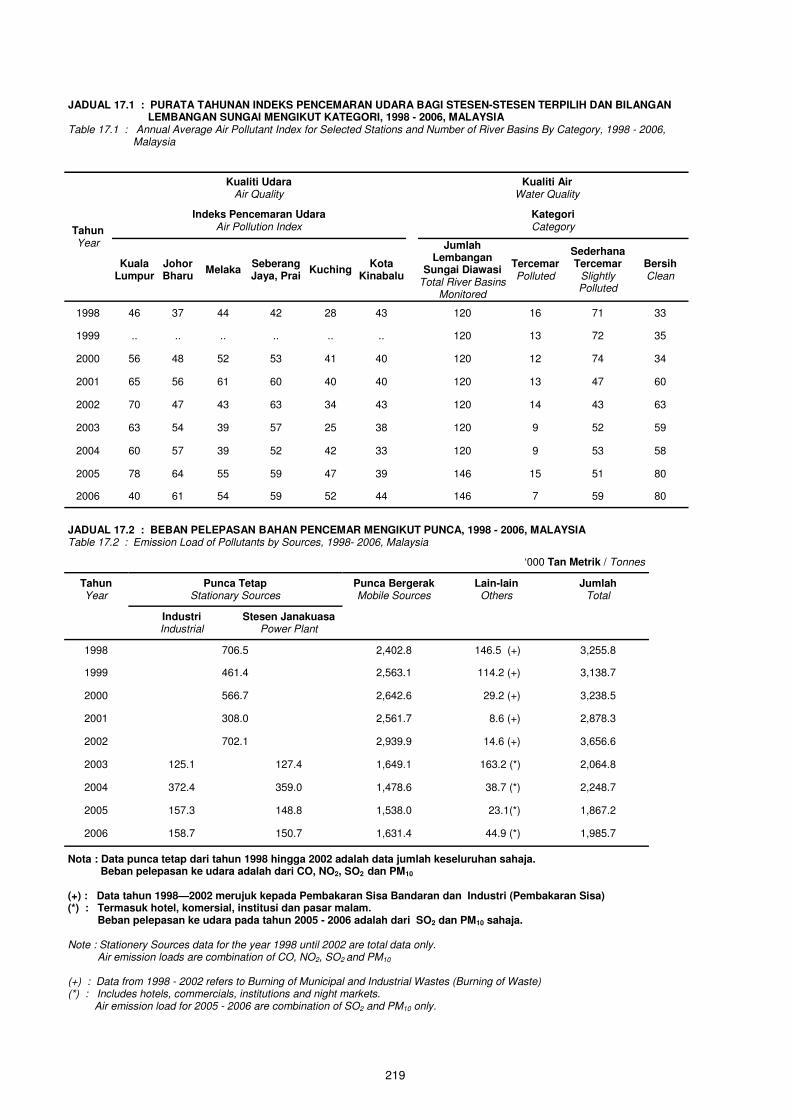
JADUAL 17.1 : PURATA TAHUNAN INDEKS PENCEMARAN UDARA BAGI STESEN-STESEN TERPILIH DAN BILANGAN LEMBANGAN SUNGAI MENGIKUT KATEGORI, 1998 - 2006, MALAYSIA Table 17.1 : Annual Average Air Pollutant Index for Selected Stations and Number of River Basins By Category, 1998 - 2006, Malaysia
Tahun Year
Kualiti Udara Air Quality
Kualiti Air Water Quality
Indeks Pencemaran Udara Air Pollution Index
Kuala Lumpur
Johor Bharu
Melaka Seberang Jaya, Prai
Kuching Kota
Kinabalu
Jumlah Lembangan
Sungai Diawasi Total River Basins
Monitored
Tercemar Polluted
Sederhana Tercemar
Slightly Polluted
Bersih Clean
1998 46 37 44 42 28 43 120 16 71 33
1999 .. .. .. .. .. .. 120 13 72 35
2000 56 48 52 53 41 40 120 12 74 34
2001 65 56 61 60 40 40 120 13 47 60
2002 70 47 43 63 34 43 120 14 43 63
2003 63 54 39 57 25 38 120 9 52 59
2004 60 57 39 52 42 33 120 9 53 58
2005 78 64 55 59 47 39 146 15 51 80
2006 40 61 54 59 52 44 146 7 59 80
Kategori Category
JADUAL 17.2 : BEBAN PELEPASAN BAHAN PENCEMAR MENGIKUT PUNCA, 1998 - 2006, MALAYSIA Table 17.2 : Emission Load of Pollutants by Sources, 1998- 2006, Malaysia
‘000 Tan Metrik / Tonnes
Tahun Year
Punca Tetap Stationary Sources
Punca Bergerak Mobile Sources
Lain-lain Others
Jumlah Total
Industri Industrial
Stesen Janakuasa Power Plant
1998 706.5 2,402.8 146.5 (+) 3,255.8
1999 461.4 2,563.1 114.2 (+) 3,138.7
2000 566.7 2,642.6 29.2 (+) 3,238.5
2001 308.0 2,561.7 8.6 (+) 2,878.3
2002 702.1 2,939.9 14.6 (+) 3,656.6
2003 125.1 127.4 1,649.1 163.2 (*) 2,064.8
2004 372.4 359.0 1,478.6 38.7 (*) 2,248.7
2005 157.3 148.8 1,538.0 23.1(*) 1,867.2
2006 158.7 150.7 1,631.4 44.9 (*) 1,985.7
Nota : Data punca tetap dari tahun 1998 hingga 2002 adalah data jumlah keseluruhan sahaja. Beban pelepasan ke udara adalah dari CO, NO2, SO2 dan PM10 (+) : Data tahun 1998—2002 merujuk kepada Pembakaran Sisa Bandaran dan Industri (Pembakaran Sisa) (*) : Termasuk hotel, komersial, institusi dan pasar malam. Beban pelepasan ke udara pada tahun 2005 - 2006 adalah dari SO2 dan PM10 sahaja. Note : Stationery Sources data for the year 1998 until 2002 are total data only. Air emission loads are combination of CO, NO2, SO2 and PM10
(+) : Data from 1998 - 2002 refers to Burning of Municipal and Industrial Wastes (Burning of Waste) (*) : Includes hotels, commercials, institutions and night markets. Air emission load for 2005 - 2006 are combination of SO2 and PM10 only.
219
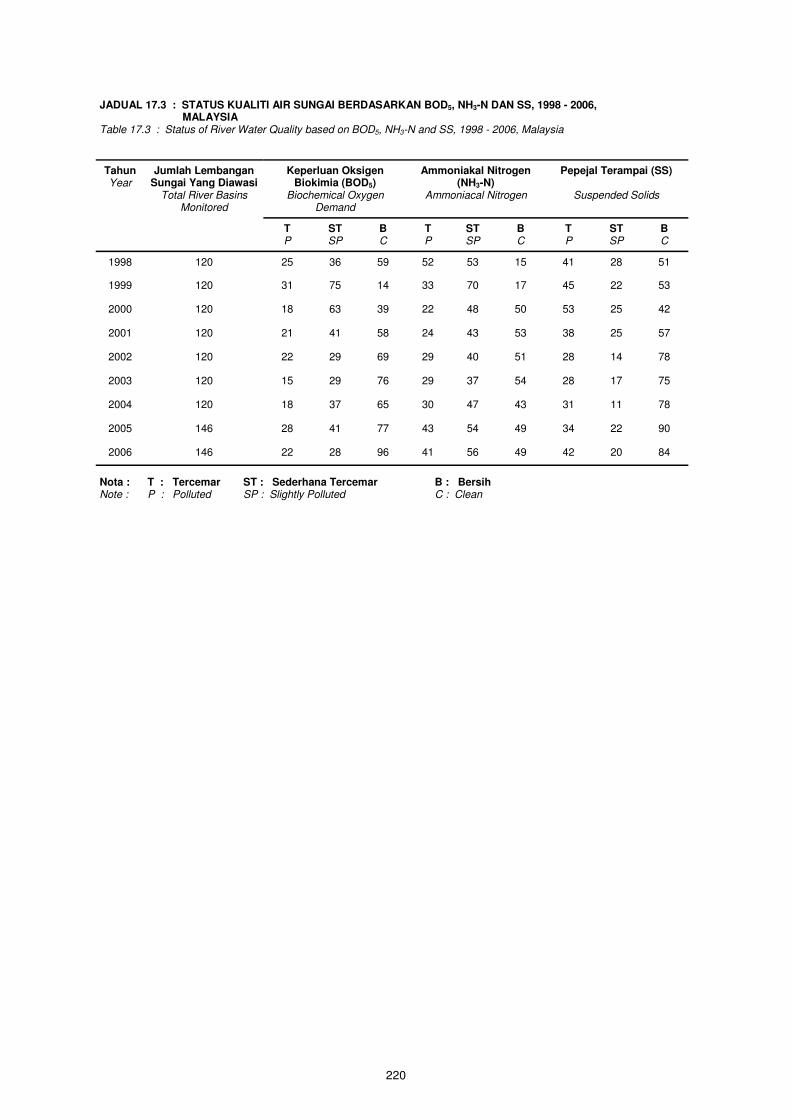
JADUAL 17.3 : STATUS KUALITI AIR SUNGAI BERDASARKAN BOD5, NH3-N DAN SS, 1998 - 2006, MALAYSIA Table 17.3 : Status of River Water Quality based on BOD5, NH3-N and SS, 1998 - 2006, Malaysia
Jumlah Lembangan Sungai Yang Diawasi
Total River Basins Monitored
Keperluan Oksigen Biokimia (BOD5)
Biochemical Oxygen Demand
Ammoniakal Nitrogen (NH3-N)
Ammoniacal Nitrogen
Pepejal Terampai (SS)
Suspended Solids
T P
ST SP
B C
T P
ST SP
B C
T P
ST SP
B C
1998 120 25 36 59 52 53 15 41 28 51
1999 120 31 75 14 33 70 17 45 22 53
2000 120 18 63 39 22 48 50 53 25 42
2001 120 21 41 58 24 43 53 38 25 57
2002 120 22 29 69 29 40 51 28 14 78
2003 120 15 29 76 29 37 54 28 17 75
2004 120 18 37 65 30 47 43 31 11 78
2005 146 28 41 77 43 54 49 34 22 90
2006 146 22 28 96 41 56 49 42 20 84
Tahun Year
Nota : T : Tercemar ST : Sederhana Tercemar B : Bersih Note : P : Polluted SP : Slightly Polluted C : Clean
220


PERANGKAAN TENAGA BURUH
Nota Keterangan
1. Perangkaan Tenaga Buruh yang diperoleh daripada Penyiasatan Tenaga Buruh
dipersembahkan mulai tahun 1982. Data tahun 1991 dan 1994 tidak diperoleh
kerana penyiasatan tidak dijalankan pada tahun tersebut.
2. Perangkaan Tenaga Buruh ini mempersembahkan anggaran tenaga buruh, taburan
guna tenaga mengikut pekerjaan dan industri, dan pengangguran.
3. Tenaga Buruh
Tenaga buruh merujuk kepada mereka yang berumur 15 hingga 64 tahun (dalam
tahun genap pada hari jadi terakhir) semasa minggu rujukan, sama ada bekerja
atau menganggur.
4. Bekerja
Semua orang yang bekerja sekurang-kurangnya sejam semasa minggu rujukan
untuk mendapatkan upah, keuntungan atau keuntungan keluarga (sebagai majikan,
pekerja, pekerja sendiri atau pekerja keluarga tanpa gaji).
Juga dianggap sebagai bekerja ialah mereka yang tidak bekerja semasa minggu
rujukan disebabkan sakit, kecederaan, tiada upaya, cuaca buruk, bercuti,
pertelingkahan buruh dan sebab-sebab sosial atau keagamaan tetapi mempunyai
pekerjaan, ladang, perusahaan atau perusahaan keluarga lain untuk kembali
bekerja. Termasuk juga ialah mereka yang tidak bekerja buat sementara waktu
tetapi bergaji dan pasti akan dipanggil bekerja semula.
221
5. Menganggur
Tenaga buruh dikelaskan sebagai menganggur jika dalam minggu rujukan mereka
tidak bekerja tetapi bersedia untuk bekerja dan aktif mencari pekerjaan (penganggur
aktif). Mereka dianggap tidak aktif seperti di bawah :
a) Tidak mencari pekerjaan dalam minggu rujukan kerana percaya tidak
terdapat pekerjaan ataupun mereka tidak berkelayakan,
b) Mungkin mencari pekerjaan jika tidak kerana sakit atau cuaca buruk,
c) Menunggu jawapan permohonan pekerjaan, dan
d) Telah mencari pekerjaan sebelum minggu rujukan.
6. Pekerjaan
Pekerjaan dikelaskan mengikut klasifikasi “Piawaian Pengelasan Pekerjaan
Malaysia (MASCO) 1998” berasaskan kepada “International Standard
Classification of Occupations (ISCO - 88)”. Bagi data tahun 2000 dan sebelumnya,
ia merujuk kepada “Dictionary of Occupations Classification (DOC)”. Bagi
seseorang yang mempunyai lebih daripada satu pekerjaan, hanya pekerjaan yang
mengambil masa terbanyak semasa tempoh rujukan dianggap sebagai pekerjaan
utamanya. Jika masa bekerja bagi tiap-tiap pekerjaan itu sama, maka pekerjaan
yang menghasilkan pendapatan yang tertinggi adalah pekerjaan utamanya. Dalam
kes di mana bilangan jam bekerja dan pendapatannya adalah sama bagi setiap
pekerjaan, pekerjaan di mana dia telah bekerja paling lama dianggap sebagai
pekerjaan utamanya.
7. Industri
Industri dikelaskan mengikut "Piawaian Klasifikasi Industri Malaysia (MSIC) 2000",
yang diterbitkan oleh Jabatan Perangkaan Malaysia, berasaskan kepada
"International Standard Industrial Classifications of All Economic Activities (ISIC -
88), Revision 3". Sebelum tahun 2001, ia merujuk “Malaysia Industrial
Classification (MIC1972)”. Pengelasan industri seseorang merujuk kepada yang
berkaitan dengan pekerjaan utamanya.
222
8. Kadar Penyertaan Tenaga Buruh
Kadar penyertaan tenaga buruh adalah merujuk kepada peratusan bilangan orang
dalam tenaga buruh daripada jumlah orang dalam umur bekerja (15 hingga 64
tahun).
9. Kadar Pengangguran
Kadar pengangguran adalah peratusan bilangan penganggur daripada bilangan
tenaga buruh.
223
LABOUR FORCE STATISTICS
Explanatory Notes
1. Statistics of the labour force obtained from the Labour Force Survey was presented
since 1982. Data for the year 1991 and 1994 were not available since the survey
was not conducted for that particular years.
2. Statistics of the labour force that being presented is the estimation of labour force,
distribution of employment by occupation and industry and unemployment.
3. Labour Force
Labour Force refers to those who were in the 15 to 64 years age group (in com-
pleted years at last birthday) and who were either employed or unemployed.
4. Employed
All persons who, at any time during the reference week worked at least one hour for
pay, profit or family gain (as an employer, employee, own-account worker or unpaid
family worker).
Also considered as employed were persons who did not work during the reference
week because of illness, injury, disability, bad weather, vacation, labour dispute and
social or religious reason but had a job, farm, enterprise or other family enterprise to
return to. Also included were those on temporary lay-off with pay who would
definitely be called back to work.
224
5. Unemployed
Labour force is classified as unemployed if they are not working during the
reference week but available for work and actively looking for work (active
unemployed). Unemployed also include the person which inactive unemployed as
follows:-
a) Did not look for work because they believed no work was available or they
were not qualified;
b) Would have looked for work if they had not been temporarily ill or had it not
been for bad weather;
c) Waiting for answers to job applications; and
d) Looked for work prior to the reference week.
6. Occupation
Occupation is classified according to the “Malaysia Standard Classification of
Occupations (MASCO) 1998” based on the “International Standard Classification of
Occupations (ISCO - 88)”. For the year 2000 and before, it refers to “Dictionary of
Occupations Classification (DOC)”. For a person having more than one job, only
the job at which he worked for the longest number of hours during the reference
week was treated as his principal occupation. Should the number of hours worked
for each job be the same, then the job with the highest income was the principal
occupation. When the number of hours worked and the income earned from each
job were the same, the job at which he was working for the longest period of time
was the principal occupation.
7. Industry
Industry is classified according to the "Malaysia Standard Industrial Classification,
(MSIC) 2000" published by the Department of Statistics, Malaysia based on the
"International Standard Industrial Classification of All Economic Activities (ISIC -
88), Revision 3". Prior to the year 2001, it refers to “Malaysia Industrial
Classification (MIC 1972)”. A person's industry classification refers to that of his
principal occupation.
225
8. Labour Force Participation Rates
Labour force participation rates refer to the percentage of number of persons in the
labour force from the total number of persons in the working age (15 to 64 years
old).
9. Unemployment Rates
Unemployment rates refer to the percentage of number unemployed persons from
the number of persons in the labour force.
226
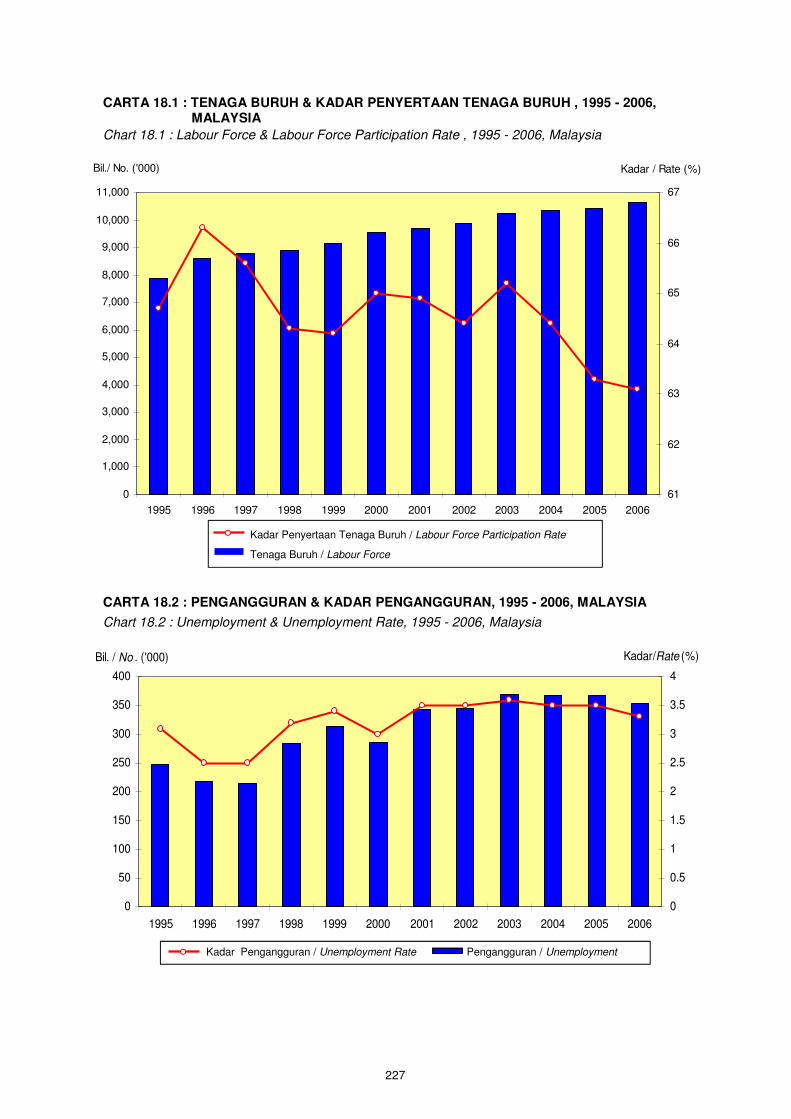
0
50
100
150
200
250
300
350
400
1995 1996 1997 1998 1999 2000 2001 2002 2003 2004 2005 2006
Bil. / No . ('000)
0
0.5
1
1.5
2
2.5
3
3.5
4
Kadar/Rate (%)
0
1,000
2,000
3,000
4,000
5,000
6,000
7,000
8,000
9,000
10,000
11,000
1995 1996 1997 1998 1999 2000 2001 2002 2003 2004 2005 2006
Bil./ No. ('000)
61
62
63
64
65
66
67
Kadar / Rate (%)
227
CARTA 18.1 : TENAGA BURUH & KADAR PENYERTAAN TENAGA BURUH , 1995 - 2006, MALAYSIA
Chart 18.1 : Labour Force & Labour Force Participation Rate , 1995 - 2006, Malaysia
CARTA 18.2 : PENGANGGURAN & KADAR PENGANGGURAN, 1995 - 2006, MALAYSIA
Chart 18.2 : Unemployment & Unemployment Rate, 1995 - 2006, Malaysia
Kadar Pengangguran / Unemployment Rate Pengangguran / Unemployment
Kadar Penyertaan Tenaga Buruh / Labour Force Participation Rate
Tenaga Buruh / Labour Force

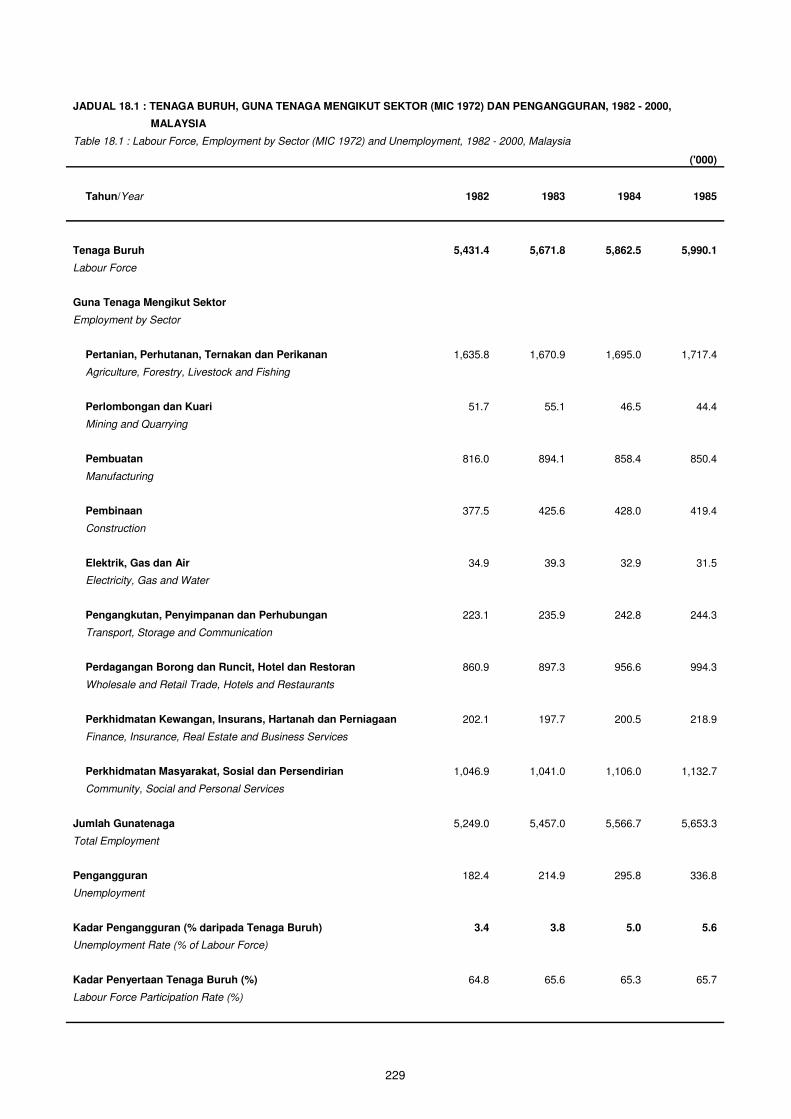
JADUAL 18.1 : TENAGA BURUH, GUNA TENAGA MENGIKUT SEKTOR (MIC 1972) DAN PENGANGGURAN, 1982 - 2000,
MALAYSIA
Table 18.1 : Labour Force, Employment by Sector (MIC 1972) and Unemployment, 1982 - 2000, Malaysia
('000)
Tahun/Year 1982 1983 1984 1985
Tenaga Buruh 5,431.4 5,671.8 5,862.5 5,990.1
Labour Force
Guna Tenaga Mengikut Sektor
Employment by Sector
Pertanian, Perhutanan, Ternakan dan Perikanan 1,635.8 1,670.9 1,695.0 1,717.4
Agriculture, Forestry, Livestock and Fishing
Perlombongan dan Kuari 51.7 55.1 46.5 44.4
Mining and Quarrying
Pembuatan 816.0 894.1 858.4 850.4
Manufacturing
Pembinaan 377.5 425.6 428.0 419.4
Construction
Elektrik, Gas dan Air 34.9 39.3 32.9 31.5
Electricity, Gas and Water
Pengangkutan, Penyimpanan dan Perhubungan 223.1 235.9 242.8 244.3
Transport, Storage and Communication
Perdagangan Borong dan Runcit, Hotel dan Restoran 860.9 897.3 956.6 994.3
Wholesale and Retail Trade, Hotels and Restaurants
Perkhidmatan Kewangan, Insurans, Hartanah dan Perniagaan 202.1 197.7 200.5 218.9
Finance, Insurance, Real Estate and Business Services
Perkhidmatan Masyarakat, Sosial dan Persendirian 1,046.9 1,041.0 1,106.0 1,132.7
Community, Social and Personal Services
Jumlah Gunatenaga 5,249.0 5,457.0 5,566.7 5,653.3
Total Employment
Pengangguran 182.4 214.9 295.8 336.8
Unemployment
Kadar Pengangguran (% daripada Tenaga Buruh) 3.4 3.8 5.0 5.6
Unemployment Rate (% of Labour Force)
Kadar Penyertaan Tenaga Buruh (%) 64.8 65.6 65.3 65.7
Labour Force Participation Rate (%)
229
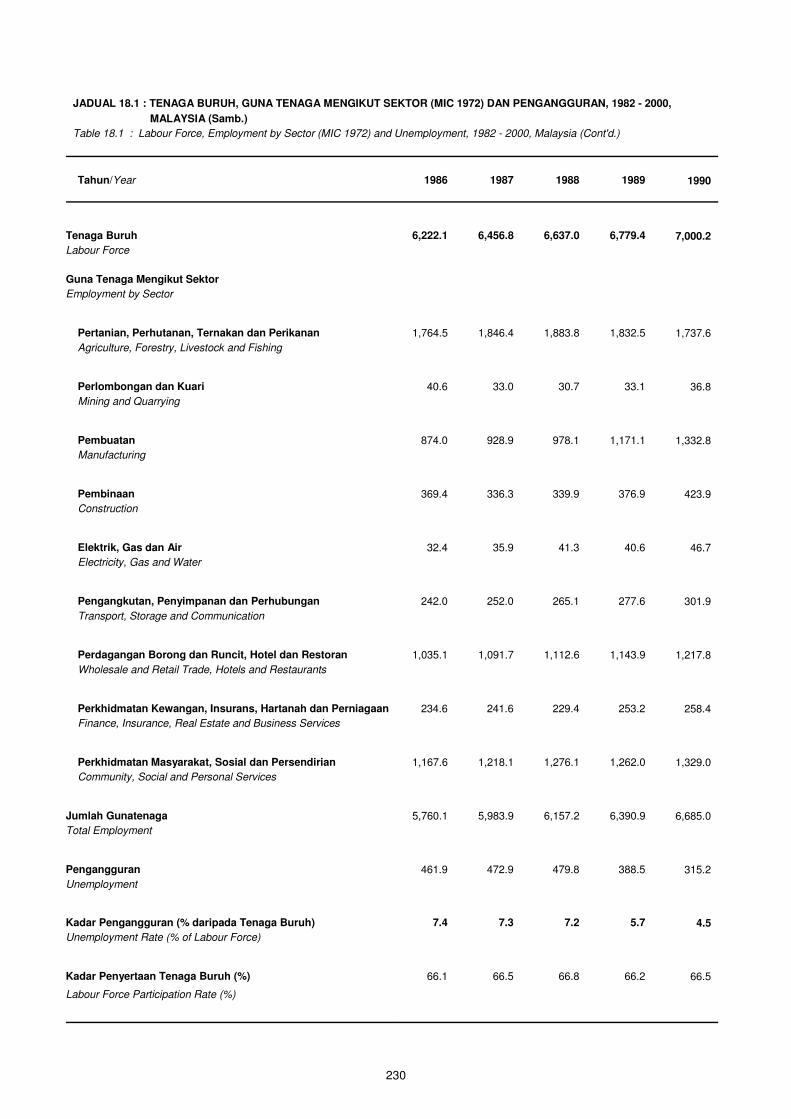
JADUAL 18.1 : TENAGA BURUH, GUNA TENAGA MENGIKUT SEKTOR (MIC 1972) DAN PENGANGGURAN, 1982 - 2000,
MALAYSIA (Samb.)
Table 18.1 : Labour Force, Employment by Sector (MIC 1972) and Unemployment, 1982 - 2000, Malaysia (Cont'd.)
Tahun/Year 1986 1987 1988 1989 1990
Tenaga Buruh
6,222.1
6,456.8
6,637.0
6,779.4
7,000.2
Labour Force
Guna Tenaga Mengikut Sektor
Employment by Sector
Pertanian, Perhutanan, Ternakan dan Perikanan
1,764.5
1,846.4
1,883.8
1,832.5
1,737.6
Agriculture, Forestry, Livestock and Fishing
Perlombongan dan Kuari
40.6
33.0
30.7
33.1
36.8
Mining and Quarrying
Pembuatan
874.0
928.9
978.1
1,171.1
1,332.8
Manufacturing
Pembinaan
369.4
336.3
339.9
376.9
423.9
Construction
Elektrik, Gas dan Air
32.4
35.9
41.3
40.6
46.7
Electricity, Gas and Water
Pengangkutan, Penyimpanan dan Perhubungan
242.0
252.0
265.1
277.6
301.9
Transport, Storage and Communication
Perdagangan Borong dan Runcit, Hotel dan Restoran
1,035.1
1,091.7
1,112.6
1,143.9
1,217.8
Wholesale and Retail Trade, Hotels and Restaurants
Perkhidmatan Kewangan, Insurans, Hartanah dan Perniagaan
234.6
241.6
229.4
253.2
258.4
Finance, Insurance, Real Estate and Business Services
Perkhidmatan Masyarakat, Sosial dan Persendirian
1,167.6
1,218.1
1,276.1
1,262.0
1,329.0
Community, Social and Personal Services
Jumlah Gunatenaga
5,760.1
5,983.9
6,157.2
6,390.9
6,685.0
Total Employment
Pengangguran 461.9 472.9 479.8 388.5
315.2
Unemployment
Kadar Pengangguran (% daripada Tenaga Buruh) 7.4 7.3 7.2 5.7 4.5
Unemployment Rate (% of Labour Force)
Kadar Penyertaan Tenaga Buruh (%)
66.1
66.5
66.8
66.2
66.5
Labour Force Participation Rate (%)
230
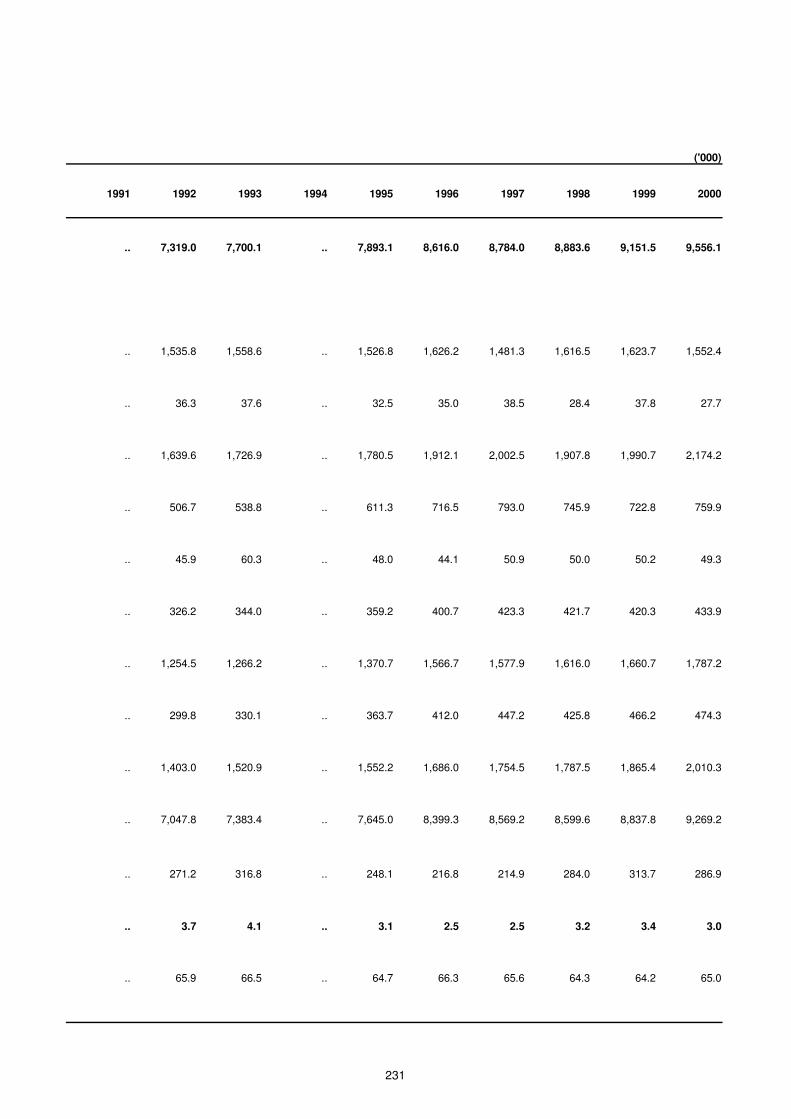
('000)
1991 1992 1993 1994 1995 1996 1997 1998 1999 2000
.. 7,319.0 7,700.1 .. 7,893.1 8,616.0 8,784.0 8,883.6 9,151.5 9,556.1
.. 1,535.8 1,558.6 .. 1,526.8 1,626.2 1,481.3 1,616.5 1,623.7 1,552.4
.. 36.3 37.6 .. 32.5 35.0 38.5 28.4 37.8 27.7
.. 1,639.6 1,726.9 .. 1,780.5 1,912.1 2,002.5 1,907.8 1,990.7 2,174.2
.. 506.7 538.8 .. 611.3 716.5 793.0 745.9 722.8 759.9
.. 45.9 60.3 .. 48.0 44.1 50.9 50.0 50.2 49.3
.. 326.2 344.0 .. 359.2 400.7 423.3 421.7 420.3 433.9
.. 1,254.5 1,266.2 .. 1,370.7 1,566.7 1,577.9 1,616.0 1,660.7 1,787.2
.. 299.8 330.1 .. 363.7 412.0 447.2 425.8 466.2 474.3
.. 1,403.0 1,520.9 .. 1,552.2 1,686.0 1,754.5 1,787.5 1,865.4 2,010.3
.. 7,047.8 7,383.4 .. 7,645.0 8,399.3 8,569.2 8,599.6 8,837.8 9,269.2
.. 271.2 316.8 .. 248.1 216.8 214.9 284.0 313.7 286.9
.. 3.7 4.1 .. 3.1 2.5 2.5 3.2 3.4 3.0
.. 65.9 66.5 .. 64.7 66.3 65.6 64.3 64.2 65.0
231
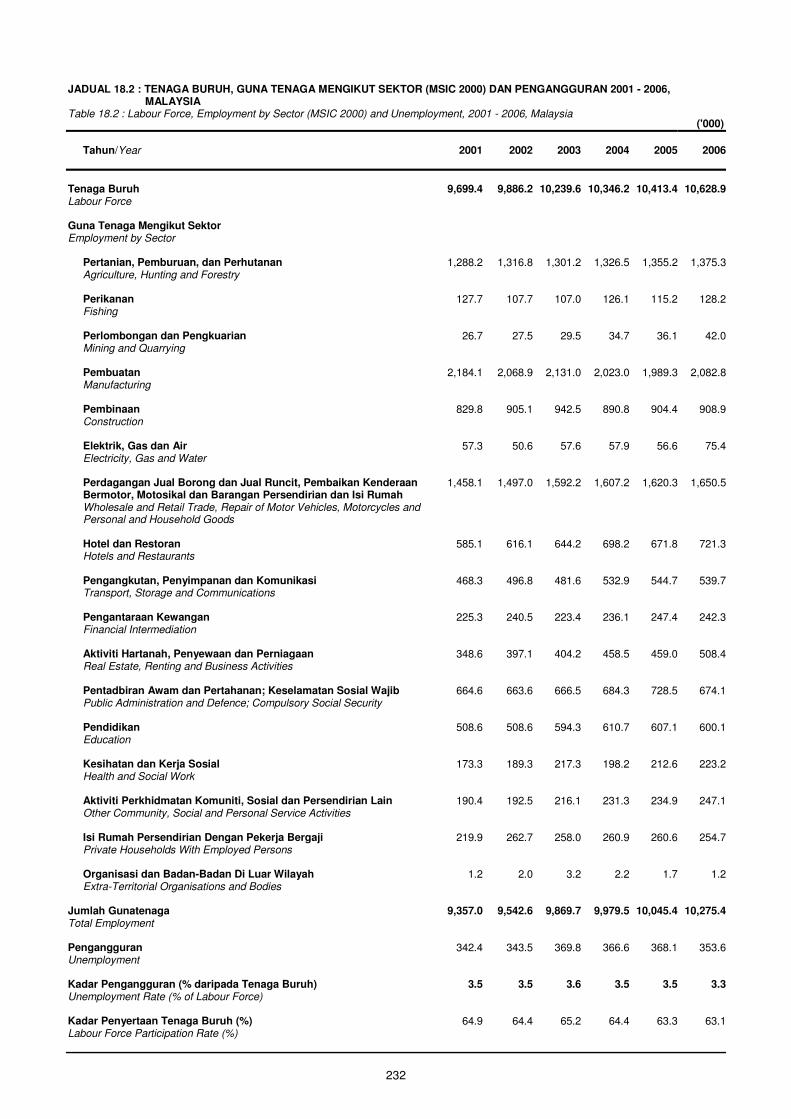
JADUAL 18.2 : TENAGA BURUH, GUNA TENAGA MENGIKUT SEKTOR (MSIC 2000) DAN PENGANGGURAN 2001 - 2006, MALAYSIA
Table 18.2 : Labour Force, Employment by Sector (MSIC 2000) and Unemployment, 2001 - 2006, Malaysia
('000)
Tahun/Year 2001 2002 2003 2004 2005 2006
Tenaga Buruh 9,699.4 9,886.2 10,239.6 10,346.2 10,413.4 10,628.9
Labour Force
Guna Tenaga Mengikut Sektor Employment by Sector
Pertanian, Pemburuan, dan Perhutanan 1,288.2 1,316.8 1,301.2 1,326.5 1,355.2 1,375.3
Agriculture, Hunting and Forestry Perikanan 127.7 107.7 107.0 126.1 115.2 128.2
Fishing Perlombongan dan Pengkuarian 26.7 27.5 29.5 34.7 36.1 42.0
Mining and Quarrying Pembuatan 2,184.1 2,068.9 2,131.0 2,023.0 1,989.3 2,082.8
Manufacturing Pembinaan 829.8 905.1 942.5 890.8 904.4 908.9
Construction Elektrik, Gas dan Air 57.3 50.6 57.6 57.9 56.6 75.4
Electricity, Gas and Water Perdagangan Jual Borong dan Jual Runcit, Pembaikan Kenderaan 1,458.1 1,497.0 1,592.2 1,607.2 1,620.3 1,650.5
Bermotor, Motosikal dan Barangan Persendirian dan Isi Rumah Wholesale and Retail Trade, Repair of Motor Vehicles, Motorcycles and Personal and Household Goods Hotel dan Restoran 585.1 616.1 644.2 698.2 671.8 721.3
Hotels and Restaurants Pengangkutan, Penyimpanan dan Komunikasi 468.3 496.8 481.6 532.9 544.7 539.7
Transport, Storage and Communications Pengantaraan Kewangan 225.3 240.5 223.4 236.1 247.4 242.3
Financial Intermediation Aktiviti Hartanah, Penyewaan dan Perniagaan 348.6 397.1 404.2 458.5 459.0 508.4
Real Estate, Renting and Business Activities Pentadbiran Awam dan Pertahanan; Keselamatan Sosial Wajib 664.6 663.6 666.5 684.3 728.5 674.1
Public Administration and Defence; Compulsory Social Security Pendidikan 508.6 508.6 594.3 610.7 607.1 600.1
Education Kesihatan dan Kerja Sosial 173.3 189.3 217.3 198.2 212.6 223.2
Health and Social Work Aktiviti Perkhidmatan Komuniti, Sosial dan Persendirian Lain 190.4 192.5 216.1 231.3 234.9 247.1
Other Community, Social and Personal Service Activities Isi Rumah Persendirian Dengan Pekerja Bergaji 219.9 262.7 258.0 260.9 260.6 254.7
Private Households With Employed Persons Organisasi dan Badan-Badan Di Luar Wilayah 1.2 2.0 3.2 2.2 1.7 1.2
Extra-Territorial Organisations and Bodies
Jumlah Gunatenaga 9,357.0 9,542.6 9,869.7 9,979.5 10,045.4 10,275.4
Total Employment
Pengangguran 342.4 343.5 369.8 366.6 368.1 353.6
Unemployment
Kadar Pengangguran (% daripada Tenaga Buruh) 3.5 3.5 3.6 3.5 3.5 3.3
Unemployment Rate (% of Labour Force)
Kadar Penyertaan Tenaga Buruh (%) 64.9 64.4 65.2 64.4 63.3 63.1
Labour Force Participation Rate (%)
232

PERANGKAAN PENDUDUK
Nota Keterangan
1. Anggaran Penduduk
Anggaran penduduk bagi tahun 1891 – 1901 merujuk kepada Perak, Pahang,
Selangor dan Negeri Sembilan sahaja, yang diperoleh dari Banci Negeri-negeri
Melayu Bersekutu.
Anggaran penduduk bagi tempoh 1911 – 1959 pula merujuk kepada Semenanjung
Malaysia sahaja. Manakala maklumat mengikut umur bagi tahun 1911, 1921, 1931
dan 1947 tidak diperoleh dengan lengkap.
Anggaran penduduk bagi tahun rujukan 1960 – 1969 adalah berasaskan kepada
penyusunan Perangkaan Penting Semenanjung Malaysia, Perangkaan Penting
Sabah dan Perangkaan Penting Sarawak. Manakala data bagi tahun rujukan
1970 – 1999 disusun berdasarkan Kajian Semula Anggaran Penduduk
Pertengahan Tahun Antara Banci. Ia melibatkan Banci Penduduk bagi tahun 1970,
1980, 1991 dan 2000.
Bagi tempoh 2000 – 2007, anggaran disediakan berdasarkan Banci Penduduk 2000
yang telah disesuaikan untuk kurang penghitungan dan salah lapor umur.
Seterusnya ia diunjurkan kepada tahun-tahun semasa berdasarkan andaian
komponen-komponen kesuburan, mortaliti dan migrasi.
2. Kadar Utama Demografi
Kadar utama demografi adalah berasaskan kepada data kelahiran dan kematian
yang disusun oleh Jabatan Perangkaan, Malaysia yang bersumberkan pendaftaran
sivil oleh Jabatan Pendaftaran Negara. Penyusunan mulai tahun 1963 bagi
Semenanjung Malaysia dan tahun 1966 bagi Sabah dan Sarawak. Maklumat
sebelumnya diperoleh daripada “Report of the Registrar General of Births and
Deaths” dan Laporan Banci Penduduk bagi tahun-tahun tertentu.
233
Kadar Demografi adalah seperti berikut :-
• Kadar Pertambahan Semula Jadi Kasar merupakan lebihan bilangan
kelahiran setelah ditolak dengan bilangan kematian bagi setiap 1,000 penduduk.
• Kadar Kelahiran Hidup Kasar merujuk kepada kelahiran yang bernyawa
semasa dilahirkan bagi setiap 1,000 penduduk.
• Kadar Kematian Kasar merujuk kepada kematian bagi semua peringkat umur
bagi setiap 1,000 penduduk.
• Kadar Kematian Neonatal merujuk kepada kematian bayi yang berumur
kurang daripada 28 hari bagi setiap 1,000 kelahiran hidup.
• Kadar Kematian Bayi merujuk kepada kematian bayi yang berumur kurang
daripada 1 tahun bagi setiap 1,000 kelahiran hidup.
• Kadar Kematian Kanak-kanak merujuk kepada kematian kanak-kanak yang
berumur 1 – 4 tahun bagi setiap 1,000 penduduk berumur 1-4 tahun.
• Kadar Kematian Ibu Bersalin merujuk kepada kematian yang
disebabkan oleh kesulitan semasa hamil atau semasa melahirkan anak atau
kematian dalam tempoh 42 hari selepas bersalin bagi setiap 1,000 kelahiran
hidup.
Data bagi tahun rujukan 1911 – 1939 diperoleh daripada Laporan Banci Negeri-
negeri Melayu Bersekutu, (Perak, Pahang, Selangor dan Negeri Sembilan)
sahaja. Bagi tahun rujukan 1946, data tidak diperoleh kecuali bagi data kadar
kematian neonatal, kematian bayi dan kematian ibu bersalin.
Data-data sebelum tahun 1964 adalah mengikut tempat kelahiran dan kematian,
manakala bagi tempoh selepas 1964 adalah berdasarkan tempat kediaman
biasa si ibu atau si mati.
3. Jangkaan Hayat
Jangkaan hayat menjadi pengukur ringkasan yang paling baik tentang paras
keseluruhan mortaliti penduduk. Ia tidak dipengaruhi oleh kesan taburan umur dan
tidak memerlukan piawai penduduk untuk membuat perbandingan yang sewajarnya
di antara tahap mortaliti penduduk yang berlainan. Data jangkaan hayat bagi tahun
rujukan 1966 – 1990 merujuk kepada Semenanjung Malaysia sahaja.
234
POPULATION STATISTICS
Explanatory Notes
1. Population Estimates
Population estimates for reference years 1891 – 1901 refer to Perak, Pahang,
Selangor and Negeri Sembilan only, based on the Federated Malay States Census.
Population estimates for the period 1911 – 1959, refer to Peninsular Malaysia only .
While information regarding population by age for the years 1911, 1921, 1931 and
1947 were not fully available.
Population estimates for the years 1960 – 1969 were based on the compilation of
Vital Statistics Peninsular Malaysia, Vital Statistics Sabah and Vital Statistics
Sarawak. Data for reference years 1970 – 1999 were compiled from the Revised
Intercensus Mid-Year Population Estimates. These involved Population Census for
the year 1970, 1980, 1991 and 2000.
For the period 2000 – 2007, the estimates were compiled based on the 2000
population census data which had earlier been adjusted for under-enumeration and
age misreporting. Subsequently, the data were projected to current years based on
assumptions of components of fertility, mortality and migration.
2. Main Demographic Rates
The main demographic rates on birth and death data compiled by the Department of
Statistics, Malaysia, are based on civil registration process provided by the National
Registration Department since 1963 for Peninsular Malaysia and 1966 for Sabah
and Sarawak. Prior to that, the information were collected from “Report of the
Registrar General of Births and Deaths” and Population Census Report for certain
years.
235
The Demographic rate is as follows :-
• Crude Rate of Natural Increase which refers to the excess of births over
deaths per 1,000 populations.
• Crude Births Rate refers to births which are alive during delivery per 1,000
populations.
• Crude Deaths Rate refers to death for all ages per 1,000 populations.
• Neonatal Mortality Rate refers to deaths of infants aged less than 28 days per
1,000 live births.
• Infant Mortality Rate refers to deaths of infants aged less than 1 year per 1,000
live births.
• Toddler Mortality Rate refers to deaths of toddlers aged 1 – 4 years per 1,000
population aged 1 – 4 years old.
• Maternal Mortality Rate refers to deaths which are caused by complications of
pregnancies, childbirth and the puerperium, within the period of 42 days after
childbirth per 1,000 live births.
Data for reference years 1911 – 1939 pertained to the Census Report of the
Federated Malay States (Perak, Pahang, Selangor and Negeri Sembilan) only. For
reference year 1946, the information was not available except data on neonatal
mortality, infant mortality and maternal mortality rate.
Data prior to the year 1964 was by place of occurrence whereas for the period after
1964, data was based on place of residence of the mother or the deceased.
3. Life Expectancy
Life expectancy is the most useful summary measure of the overall level of mortality
of a population. It is not influenced by the effects of age distribution and does not
require a standard population for acceptable comparisons of levels of mortality in
different populations. Life expectancy data for reference years 1966 – 1990
pertained to Peninsular Malaysia only.
236
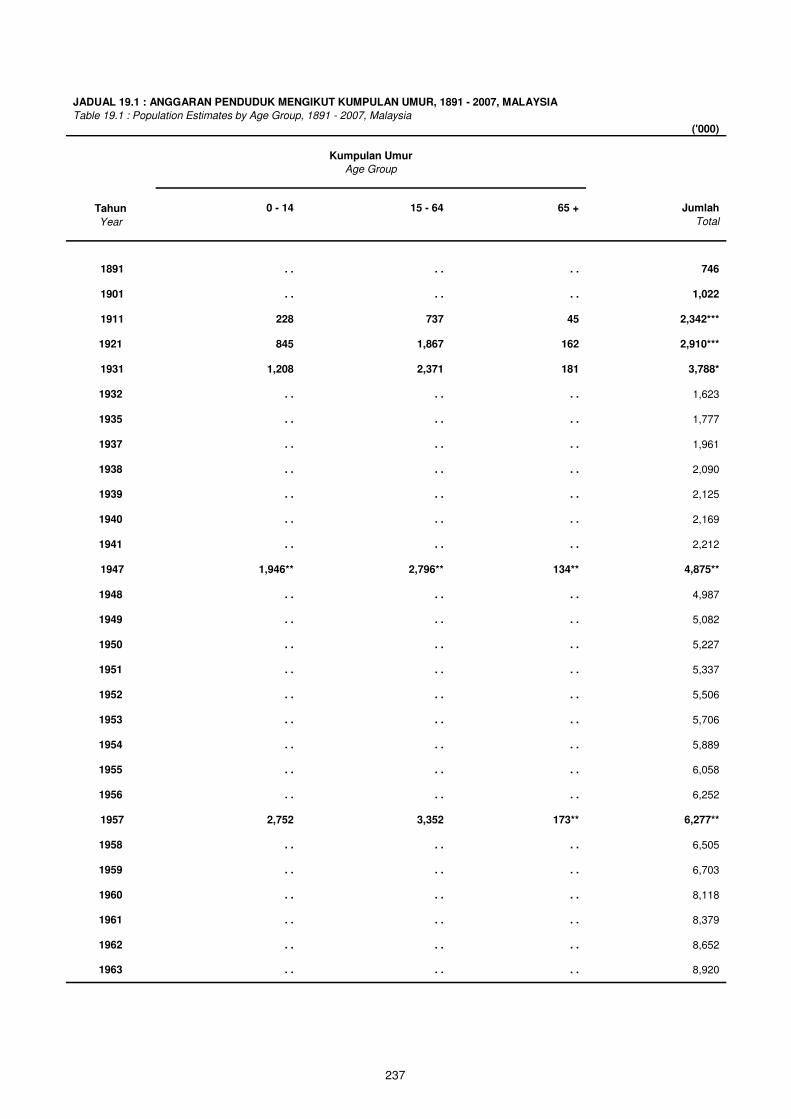
JADUAL 19.1 : ANGGARAN PENDUDUK MENGIKUT KUMPULAN UMUR, 1891 - 2007, MALAYSIA
Table 19.1 : Population Estimates by Age Group, 1891 - 2007, Malaysia
('000)
Kumpulan Umur
Age Group
Tahun 0 - 14 15 - 64 65 + Jumlah
Year Total
1891 . . . . . . 746
1901 . . . . . . 1,022
1911 228 737 45 2,342***
1921 845 1,867 162 2,910***
1931 1,208 2,371 181 3,788*
1932 . . . . . . 1,623
1935 . . . . . . 1,777
1937 . . . . . . 1,961
1938 . . . . . . 2,090
1939 . . . . . . 2,125
1940 . . . . . . 2,169
1941 . . . . . . 2,212
1947 1,946** 2,796** 134** 4,875**
1948 . . . . . . 4,987
1949 . . . . . . 5,082
1950 . . . . . . 5,227
1951 . . . . . . 5,337
1952 . . . . . . 5,506
1953 . . . . . . 5,706
1954 . . . . . . 5,889
1955 . . . . . . 6,058
1956 . . . . . . 6,252
1957 2,752 3,352 173** 6,277**
1958 . . . . . . 6,505
1959 . . . . . . 6,703
1960 . . . . . . 8,118
1961 . . . . . . 8,379
1962 . . . . . . 8,652
1963 . . . . . . 8,920
237
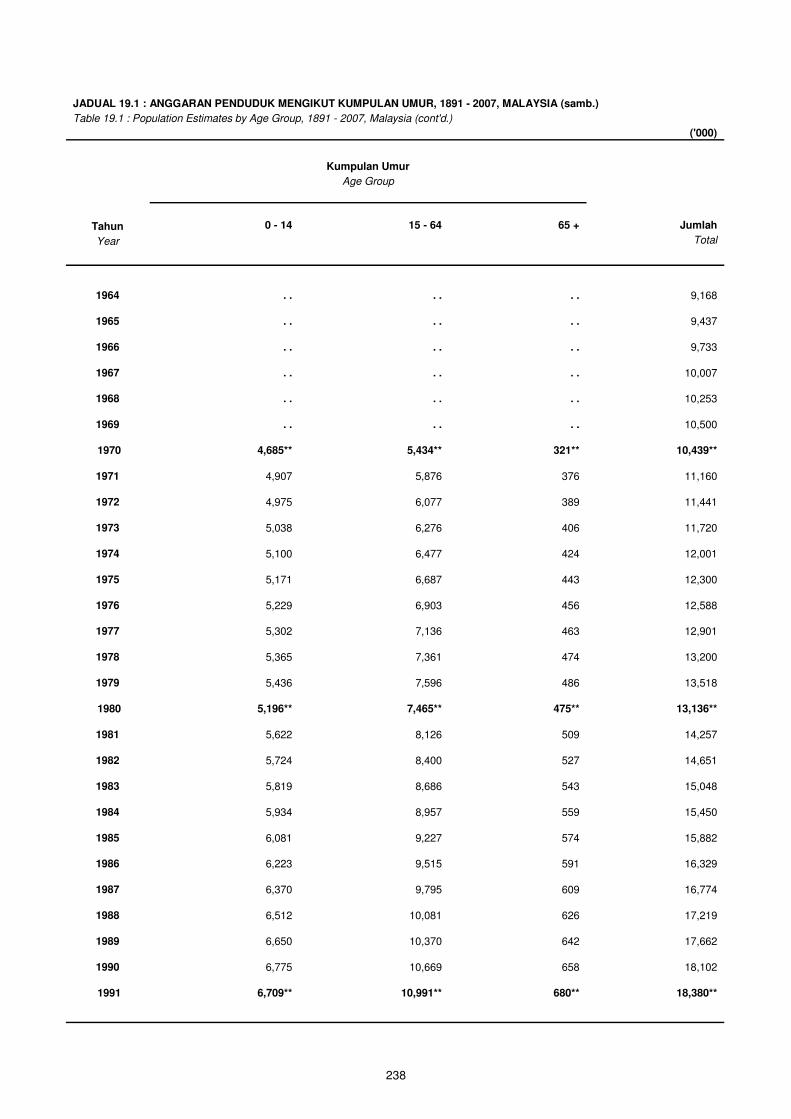
JADUAL 19.1 : ANGGARAN PENDUDUK MENGIKUT KUMPULAN UMUR, 1891 - 2007, MALAYSIA (samb.)
Table 19.1 : Population Estimates by Age Group, 1891 - 2007, Malaysia (cont'd.)
('000)
Kumpulan Umur
Age Group
Tahun 0 - 14 15 - 64 65 + Jumlah
Year Total
1964 . . . . . . 9,168
1965 . . . . . . 9,437
1966 . . . . . . 9,733
1967 . . . . . . 10,007
1968 . . . . . . 10,253
1969 . . . . . . 10,500
1970 4,685** 5,434** 321** 10,439**
1971 4,907 5,876 376 11,160
1972 4,975 6,077 389 11,441
1973 5,038 6,276 406 11,720
1974 5,100 6,477 424 12,001
1975 5,171 6,687 443 12,300
1976 5,229 6,903 456 12,588
1977 5,302 7,136 463 12,901
1978 5,365 7,361 474 13,200
1979 5,436 7,596 486 13,518
1980 5,196** 7,465** 475** 13,136**
1981 5,622 8,126 509 14,257
1982 5,724 8,400 527 14,651
1983 5,819 8,686 543 15,048
1984 5,934 8,957 559 15,450
1985 6,081 9,227 574 15,882
1986 6,223 9,515 591 16,329
1987 6,370 9,795 609 16,774
1988 6,512 10,081 626 17,219
1989 6,650 10,370 642 17,662
1990 6,775 10,669 658 18,102
1991 6,709** 10,991** 680** 18,380**
238
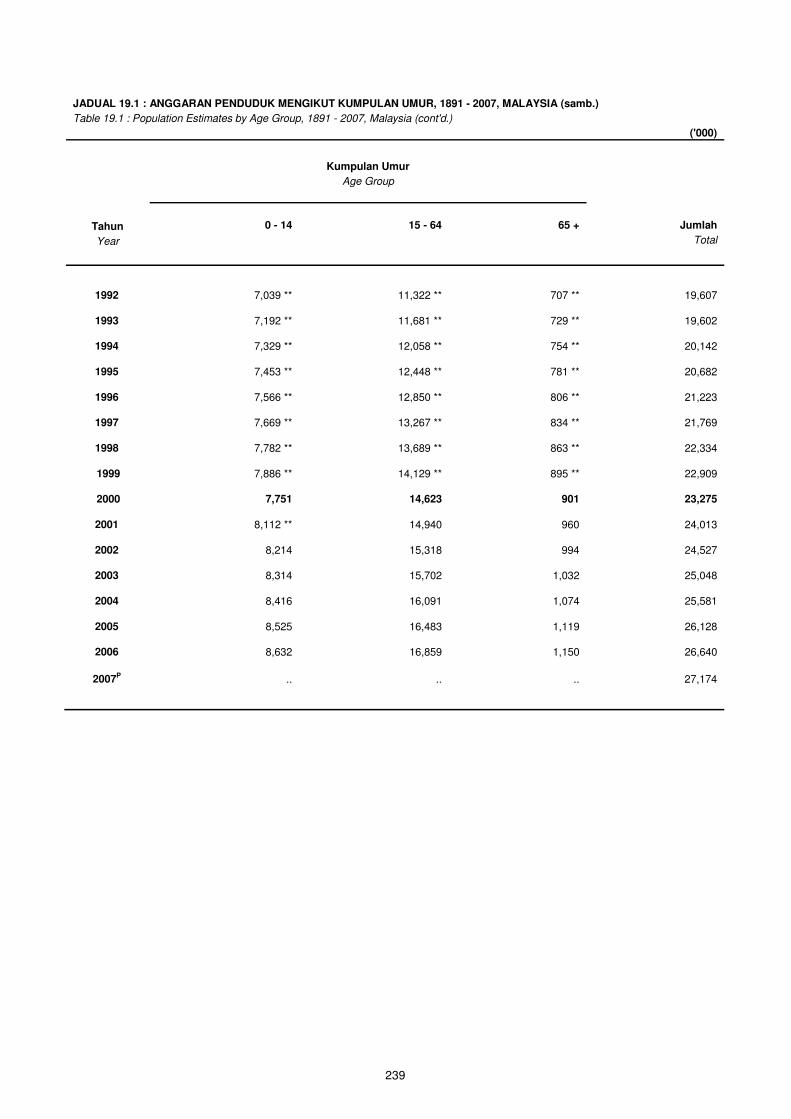
JADUAL 19.1 : ANGGARAN PENDUDUK MENGIKUT KUMPULAN UMUR, 1891 - 2007, MALAYSIA (samb.)
Table 19.1 : Population Estimates by Age Group, 1891 - 2007, Malaysia (cont'd.)
('000)
Kumpulan Umur
Age Group
Tahun 0 - 14 15 - 64 65 + Jumlah
Year Total
1992 7,039 ** 11,322 ** 707 ** 19,607
1993 7,192 ** 11,681 ** 729 ** 19,602
1994 7,329 ** 12,058 ** 754 ** 20,142
1995 7,453 ** 12,448 ** 781 ** 20,682
1996 7,566 ** 12,850 ** 806 ** 21,223
1997 7,669 ** 13,267 ** 834 ** 21,769
1998 7,782 ** 13,689 ** 863 ** 22,334
1999 7,886 ** 14,129 ** 895 ** 22,909
2000 7,751 14,623 901 23,275
2001 8,112 ** 14,940 960 24,013
2002 8,214 15,318 994 24,527
2003 8,314 15,702 1,032 25,048
2004 8,416 16,091 1,074 25,581
2005 8,525 16,483 1,119 26,128
2006 8,632 16,859 1,150 26,640
2007P .. .. .. 27,174
239
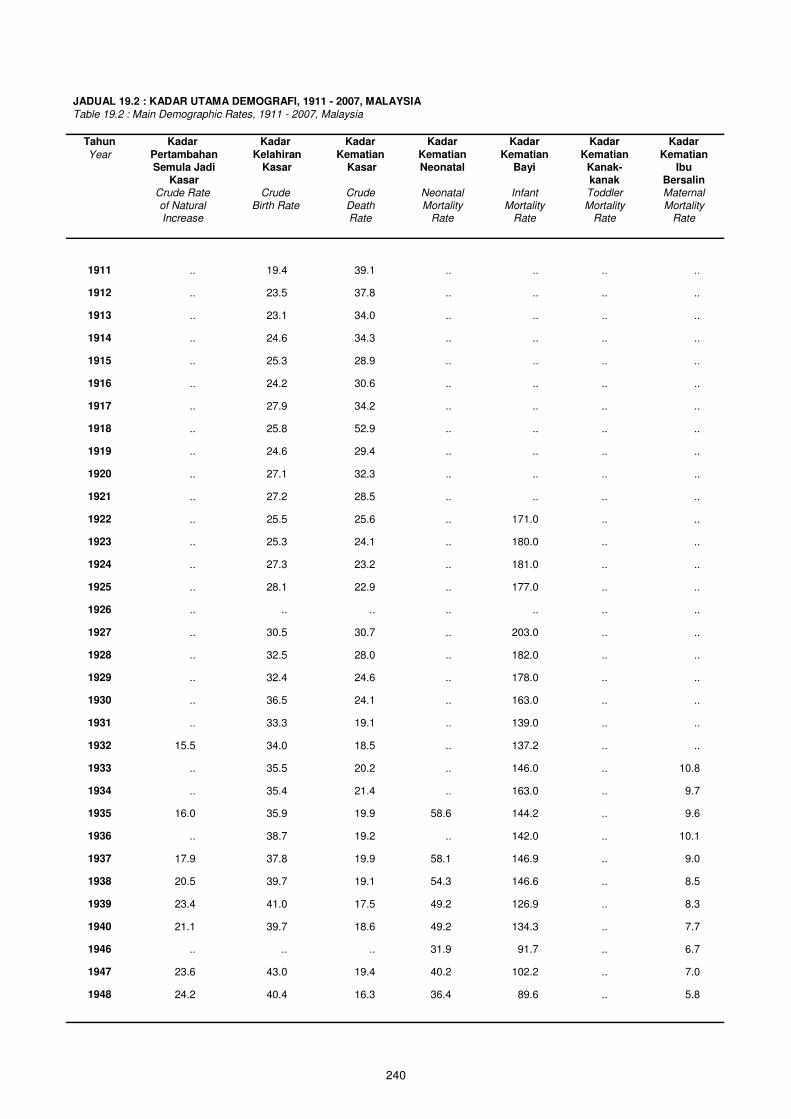
JADUAL 19.2 : KADAR UTAMA DEMOGRAFI, 1911 - 2007, MALAYSIA Table 19.2 : Main Demographic Rates, 1911 - 2007, Malaysia
Tahun Kadar Kadar Kadar Kadar Kadar Kadar Kadar
Year Pertambahan Kelahiran Kematian Kematian Kematian Kematian Kematian
Semula Jadi Kasar Kasar Neonatal Bayi Kanak- Ibu
Kasar kanak Bersalin
Crude Rate Crude Crude Neonatal Infant Toddler Maternal of Natural Birth Rate Death Mortality Mortality Mortality Mortality
Increase Rate Rate Rate Rate Rate
1911 .. 19.4 39.1 .. .. .. ..
1912 .. 23.5 37.8 .. .. .. ..
1913 .. 23.1 34.0 .. .. .. ..
1914 .. 24.6 34.3 .. .. .. ..
1915 .. 25.3 28.9 .. .. .. ..
1916 .. 24.2 30.6 .. .. .. ..
1917 .. 27.9 34.2 .. .. .. ..
1918 .. 25.8 52.9 .. .. .. ..
1919 .. 24.6 29.4 .. .. .. ..
1920 .. 27.1 32.3 .. .. .. ..
1921 .. 27.2 28.5 .. .. .. ..
1922 .. 25.5 25.6 .. 171.0 .. ..
1923 .. 25.3 24.1 .. 180.0 .. ..
1924 .. 27.3 23.2 .. 181.0 .. ..
1925 .. 28.1 22.9 .. 177.0 .. ..
1926 .. .. .. .. .. .. ..
1927 .. 30.5 30.7 .. 203.0 .. ..
1928 .. 32.5 28.0 .. 182.0 .. ..
1929 .. 32.4 24.6 .. 178.0 .. ..
1930 .. 36.5 24.1 .. 163.0 .. ..
1931 .. 33.3 19.1 .. 139.0 .. ..
1932 15.5 34.0 18.5 .. 137.2 .. ..
1933 .. 35.5 20.2 .. 146.0 .. 10.8
1934 .. 35.4 21.4 .. 163.0 .. 9.7
1935 16.0 35.9 19.9 58.6 144.2 .. 9.6
1936 .. 38.7 19.2 .. 142.0 .. 10.1
1937 17.9 37.8 19.9 58.1 146.9 .. 9.0
1938 20.5 39.7 19.1 54.3 146.6 .. 8.5
1939 23.4 41.0 17.5 49.2 126.9 .. 8.3
1940 21.1 39.7 18.6 49.2 134.3 .. 7.7
1946 .. .. .. 31.9 91.7 .. 6.7
1947 23.6 43.0 19.4 40.2 102.2 .. 7.0
1948 24.2 40.4 16.3 36.4 89.6 .. 5.8
240
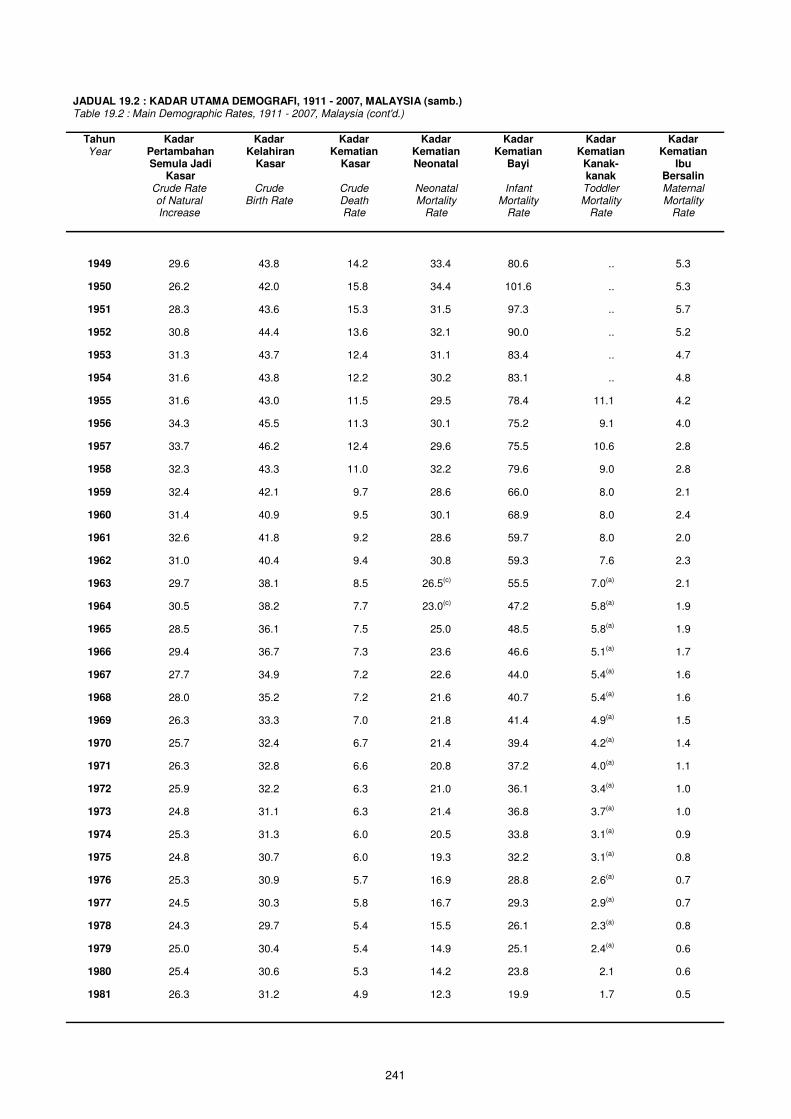
JADUAL 19.2 : KADAR UTAMA DEMOGRAFI, 1911 - 2007, MALAYSIA (samb.) Table 19.2 : Main Demographic Rates, 1911 - 2007, Malaysia (cont'd.)
Tahun Kadar Kadar Kadar Kadar Kadar Kadar Kadar Year Pertambahan Kelahiran Kematian Kematian Kematian Kematian Kematian
Semula Jadi Kasar Kasar Neonatal Bayi Kanak- Ibu
Kasar kanak Bersalin
Crude Rate Crude Crude Neonatal Infant Toddler Maternal of Natural Birth Rate Death Mortality Mortality Mortality Mortality
Increase Rate Rate Rate Rate Rate
1949 29.6 43.8 14.2 33.4 80.6 .. 5.3
1950 26.2 42.0 15.8 34.4 101.6 .. 5.3
1951 28.3 43.6 15.3 31.5 97.3 .. 5.7
1952 30.8 44.4 13.6 32.1 90.0 .. 5.2
1953 31.3 43.7 12.4 31.1 83.4 .. 4.7
1954 31.6 43.8 12.2 30.2 83.1 .. 4.8
1955 31.6 43.0 11.5 29.5 78.4 11.1 4.2
1956 34.3 45.5 11.3 30.1 75.2 9.1 4.0
1957 33.7 46.2 12.4 29.6 75.5 10.6 2.8
1958 32.3 43.3 11.0 32.2 79.6 9.0 2.8
1959 32.4 42.1 9.7 28.6 66.0 8.0 2.1
1960 31.4 40.9 9.5 30.1 68.9 8.0 2.4
1961 32.6 41.8 9.2 28.6 59.7 8.0 2.0
1962 31.0 40.4 9.4 30.8 59.3 7.6 2.3
1963 29.7 38.1 8.5 26.5(c) 55.5 7.0(a)
2.1
1964 30.5 38.2 7.7 23.0(c) 47.2 5.8(a)
1.9
1965 28.5 36.1 7.5 25.0 48.5 5.8(a) 1.9
1966 29.4 36.7 7.3 23.6 46.6 5.1(a) 1.7
1967 27.7 34.9 7.2 22.6 44.0 5.4(a) 1.6
1968 28.0 35.2 7.2 21.6 40.7 5.4(a) 1.6
1969 26.3 33.3 7.0 21.8 41.4 4.9(a) 1.5
1970 25.7 32.4 6.7 21.4 39.4 4.2(a) 1.4
1971 26.3 32.8 6.6 20.8 37.2 4.0(a) 1.1
1972 25.9 32.2 6.3 21.0 36.1 3.4(a) 1.0
1973 24.8 31.1 6.3 21.4 36.8 3.7(a) 1.0
1974 25.3 31.3 6.0 20.5 33.8 3.1(a) 0.9
1975 24.8 30.7 6.0 19.3 32.2 3.1(a) 0.8
1976 25.3 30.9 5.7 16.9 28.8 2.6(a) 0.7
1977 24.5 30.3 5.8 16.7 29.3 2.9(a) 0.7
1978 24.3 29.7 5.4 15.5 26.1 2.3(a) 0.8
1979 25.0 30.4 5.4 14.9 25.1 2.4(a) 0.6
1980 25.4 30.6 5.3 14.2 23.8 2.1 0.6
1981 26.3 31.2 4.9 12.3 19.9 1.7 0.5
241
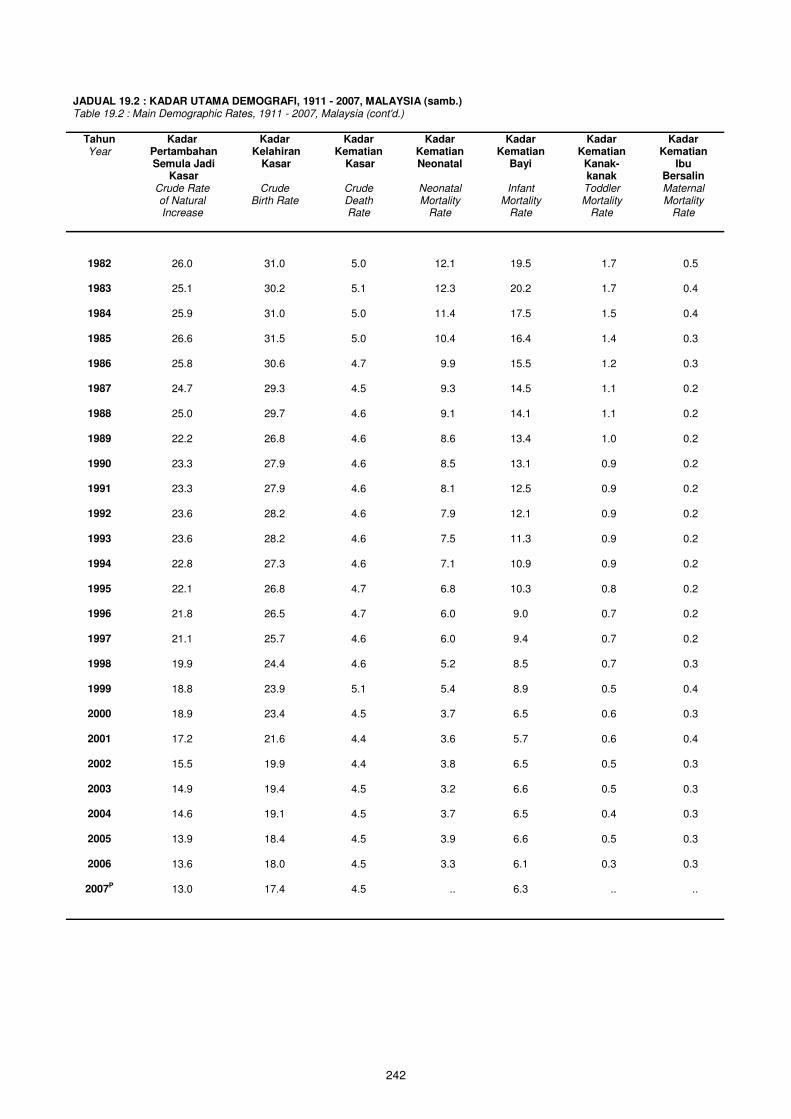
JADUAL 19.2 : KADAR UTAMA DEMOGRAFI, 1911 - 2007, MALAYSIA (samb.) Table 19.2 : Main Demographic Rates, 1911 - 2007, Malaysia (cont'd.)
Tahun Kadar Kadar Kadar Kadar Kadar Kadar Kadar Year Pertambahan Kelahiran Kematian Kematian Kematian Kematian Kematian
Semula Jadi Kasar Kasar Neonatal Bayi Kanak- Ibu
Kasar kanak Bersalin
Crude Rate Crude Crude Neonatal Infant Toddler Maternal of Natural Birth Rate Death Mortality Mortality Mortality Mortality
Increase Rate Rate Rate Rate Rate
1982 26.0 31.0 5.0 12.1 19.5 1.7 0.5
1983 25.1 30.2 5.1 12.3 20.2 1.7 0.4
1984 25.9 31.0 5.0 11.4 17.5 1.5 0.4
1985 26.6 31.5 5.0 10.4 16.4 1.4 0.3
1986 25.8 30.6 4.7 9.9 15.5 1.2 0.3
1987 24.7 29.3 4.5 9.3 14.5 1.1 0.2
1988 25.0 29.7 4.6 9.1 14.1 1.1 0.2
1989 22.2 26.8 4.6 8.6 13.4 1.0 0.2
1990 23.3 27.9 4.6 8.5 13.1 0.9 0.2
1991 23.3 27.9 4.6 8.1 12.5 0.9 0.2
1992 23.6 28.2 4.6 7.9 12.1 0.9 0.2
1993 23.6 28.2 4.6 7.5 11.3 0.9 0.2
1994 22.8 27.3 4.6 7.1 10.9 0.9 0.2
1995 22.1 26.8 4.7 6.8 10.3 0.8 0.2
1996 21.8 26.5 4.7 6.0 9.0 0.7 0.2
1997 21.1 25.7 4.6 6.0 9.4 0.7 0.2
1998 19.9 24.4 4.6 5.2 8.5 0.7 0.3
1999 18.8 23.9 5.1 5.4 8.9 0.5 0.4
2000 18.9 23.4 4.5 3.7 6.5 0.6 0.3
2001 17.2 21.6 4.4 3.6 5.7 0.6 0.4
2002 15.5 19.9 4.4 3.8 6.5 0.5 0.3
2003 14.9 19.4 4.5 3.2 6.6 0.5 0.3
2004 14.6 19.1 4.5 3.7 6.5 0.4 0.3
2005 13.9 18.4 4.5 3.9 6.6 0.5 0.3
2006 13.6 18.0 4.5 3.3 6.1 0.3 0.3
2007P 13.0 17.4 4.5 .. 6.3 .. ..
242
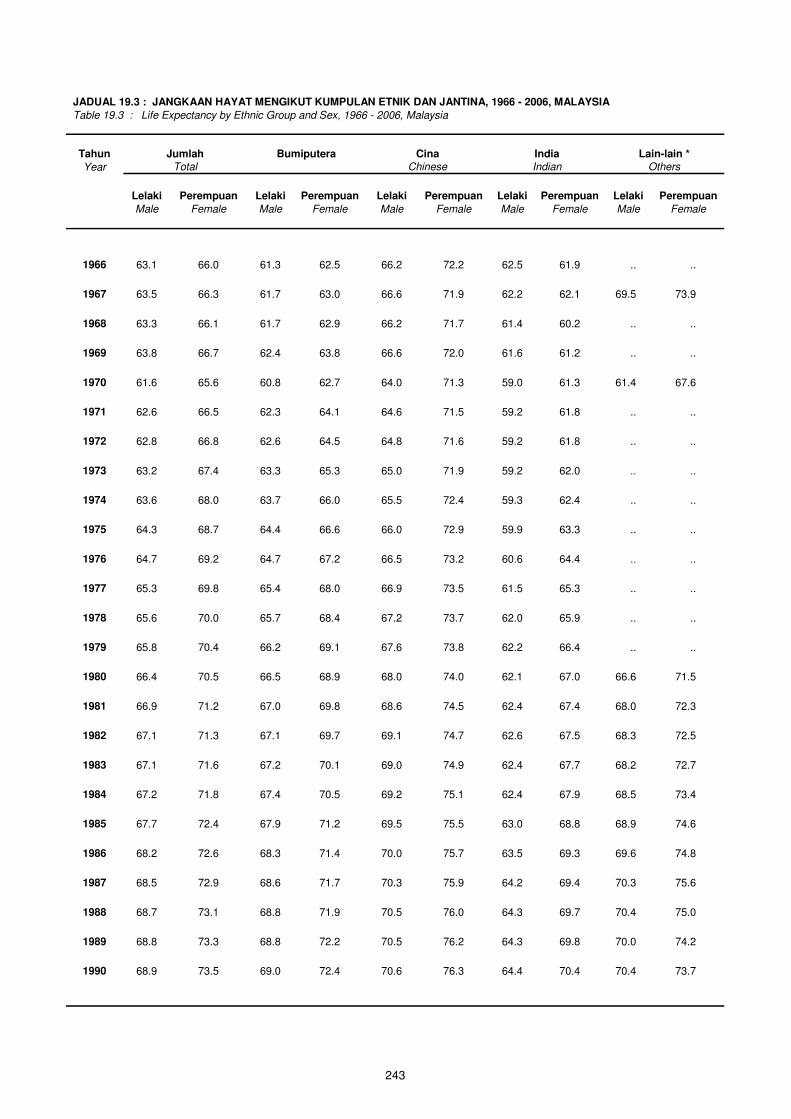
JADUAL 19.3 : JANGKAAN HAYAT MENGIKUT KUMPULAN ETNIK DAN JANTINA, 1966 - 2006, MALAYSIA
Tahun Jumlah Bumiputera Cina India Lain-lain *
Year Total Chinese Indian Others
Lelaki Perempuan Lelaki Perempuan Lelaki Perempuan Lelaki Perempuan Lelaki Perempuan
Male Female Male Female Male Female Male Female Male Female
1966 63.1 66.0 61.3 62.5 66.2 72.2 62.5 61.9 .. ..
1967 63.5 66.3 61.7 63.0 66.6 71.9 62.2 62.1 69.5 73.9
1968 63.3 66.1 61.7 62.9 66.2 71.7 61.4 60.2 .. ..
1969 63.8 66.7 62.4 63.8 66.6 72.0 61.6 61.2 .. ..
1970 61.6 65.6 60.8 62.7 64.0 71.3 59.0 61.3 61.4 67.6
1971 62.6 66.5 62.3 64.1 64.6 71.5 59.2 61.8 .. ..
1972 62.8 66.8 62.6 64.5 64.8 71.6 59.2 61.8 .. ..
1973 63.2 67.4 63.3 65.3 65.0 71.9 59.2 62.0 .. ..
1974 63.6 68.0 63.7 66.0 65.5 72.4 59.3 62.4 .. ..
1975 64.3 68.7 64.4 66.6 66.0 72.9 59.9 63.3 .. ..
1976 64.7 69.2 64.7 67.2 66.5 73.2 60.6 64.4 .. ..
1977 65.3 69.8 65.4 68.0 66.9 73.5 61.5 65.3 .. ..
1978 65.6 70.0 65.7 68.4 67.2 73.7 62.0 65.9 .. ..
1979 65.8 70.4 66.2 69.1 67.6 73.8 62.2 66.4 .. ..
1980 66.4 70.5 66.5 68.9 68.0 74.0 62.1 67.0 66.6 71.5
1981 66.9 71.2 67.0 69.8 68.6 74.5 62.4 67.4 68.0 72.3
1982 67.1 71.3 67.1 69.7 69.1 74.7 62.6 67.5 68.3 72.5
1983 67.1 71.6 67.2 70.1 69.0 74.9 62.4 67.7 68.2 72.7
1984 67.2 71.8 67.4 70.5 69.2 75.1 62.4 67.9 68.5 73.4
1985 67.7 72.4 67.9 71.2 69.5 75.5 63.0 68.8 68.9 74.6
1986 68.2 72.6 68.3 71.4 70.0 75.7 63.5 69.3 69.6 74.8
1987 68.5 72.9 68.6 71.7 70.3 75.9 64.2 69.4 70.3 75.6
1988 68.7 73.1 68.8 71.9 70.5 76.0 64.3 69.7 70.4 75.0
1989 68.8 73.3 68.8 72.2 70.5 76.2 64.3 69.8 70.0 74.2
1990 68.9 73.5 69.0 72.4 70.6 76.3 64.4 70.4 70.4 73.7
Table 19.3 : Life Expectancy by Ethnic Group and Sex, 1966 - 2006, Malaysia
243
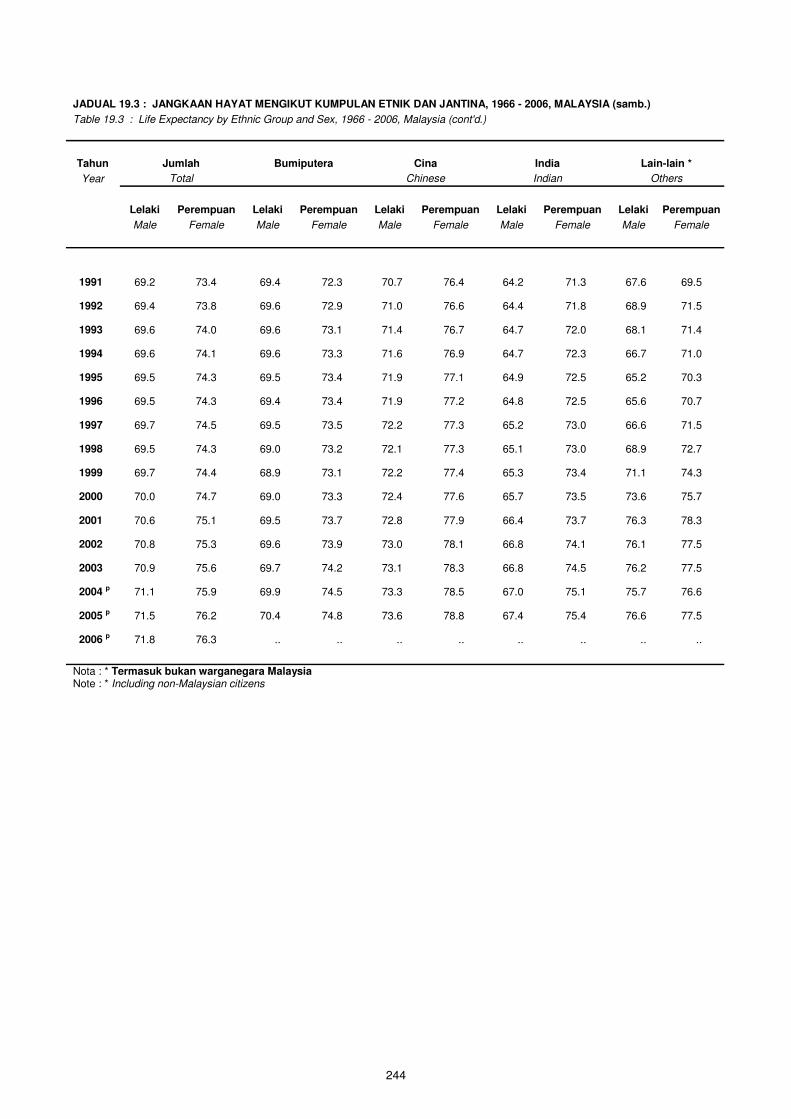
JADUAL 19.3 : JANGKAAN HAYAT MENGIKUT KUMPULAN ETNIK DAN JANTINA, 1966 - 2006, MALAYSIA (samb.)
Table 19.3 : Life Expectancy by Ethnic Group and Sex, 1966 - 2006, Malaysia (cont'd.)
Tahun Jumlah Bumiputera Cina India Lain-lain *
Year Total Chinese Indian Others
Lelaki Perempuan Lelaki Perempuan Lelaki Perempuan Lelaki Perempuan Lelaki Perempuan
Male Female Male Female Male Female Male Female Male Female
1991 69.2 73.4 69.4 72.3 70.7 76.4 64.2 71.3 67.6 69.5
1992 69.4 73.8 69.6 72.9 71.0 76.6 64.4 71.8 68.9 71.5
1993 69.6 74.0 69.6 73.1 71.4 76.7 64.7 72.0 68.1 71.4
1994 69.6 74.1 69.6 73.3 71.6 76.9 64.7 72.3 66.7 71.0
1995 69.5 74.3 69.5 73.4 71.9 77.1 64.9 72.5 65.2 70.3
1996 69.5 74.3 69.4 73.4 71.9 77.2 64.8 72.5 65.6 70.7
1997 69.7 74.5 69.5 73.5 72.2 77.3 65.2 73.0 66.6 71.5
1998 69.5 74.3 69.0 73.2 72.1 77.3 65.1 73.0 68.9 72.7
1999 69.7 74.4 68.9 73.1 72.2 77.4 65.3 73.4 71.1 74.3
2000 70.0 74.7 69.0 73.3 72.4 77.6 65.7 73.5 73.6 75.7
2001 70.6 75.1 69.5 73.7 72.8 77.9 66.4 73.7 76.3 78.3
2002 70.8 75.3 69.6 73.9 73.0 78.1 66.8 74.1 76.1 77.5
2003 70.9 75.6 69.7 74.2 73.1 78.3 66.8 74.5 76.2 77.5
2004 p 71.1 75.9 69.9 74.5 73.3 78.5 67.0 75.1 75.7 76.6
2005 p 71.5 76.2 70.4 74.8 73.6 78.8 67.4 75.4 76.6 77.5
2006 p 71.8 76.3 .. .. .. .. .. .. .. ..
Nota : * Termasuk bukan warganegara Malaysia
Note : * Including non-Malaysian citizens
244

