distribution patterns, growth and biomass …journal.usm.my/journal/jb19-01-05simon45-79.pdfkata...
TRANSCRIPT

Journal of Bioscience, 19(1), 45–79, 2008 DISTRIBUTION PATTERNS, GROWTH AND BIOMASS ALLOCATION OF CRYPTOCORYNE CILIATA (ROXBURGH) SCHOTT (ARACEAE) FROM SUNGAI SARAWAK, KUCHING, SARAWAK, MALAYSIA A Simon, Ipor I B* and Tawan C S Faculty of Resource Science and Technology, Universiti Malaysia Sarawak, 94300 Kota Samarahan, Sarawak, Malaysia Abstrak: Corak sebaran Cryptocoryne ciliata (Roxburgh) Schott (Araceae) sepanjang 22 km di Sungai Sarawak, Kuching telah dikaji. Terdapat perbezaan morfologi antara tumbuhan yang disampel daripada lokasi yang berbeza. Jumlah bilangan tumbuhan, jumlah daun per kuadrat, jumlah berat kering tumbuhan, luas permukaan daun, berat kering daun, rizom, akar, runners dan buah sinkarp direkodkan. Luas daun spesifik (SLA), nisbah luas daun (LAR), nisbah berat daun (LWR), nisbah berat rizom (RhWR), nisbah berat akar (RWR) nisbah berat pucuk (SWR) dan nisbah berat runner (RUWR) turut direkod. Analisa tanah dan sukatan air in situ turut dijalankan. Analisa pertumbuhan pokok berkait dengan lindungan dan kadar fotosintetik turut dikaji. Kata kunci: Cryptocoryne ciliata, Ciri-ciri Morfologi, Allokasi Biojisim Abstract: The distribution pattern of Cryptocoryne ciliata (Roxburgh) Schott (Araceae) along 22 km of Sungai Sarawak, Kuching was studied. There was a morphological variation between the plants collected at different sampling points. Number of plants, leaves per quadrate, total plant dry weight, leaf area, dry weight for leaves, rhizomes, roots, runners and syncarpous fruit were recorded. Specific leaf area (SLA), leaf area ratio (LAR), leaf weight ratio (LWR), rhizome weight ratio (RhWR), root weight ratio (RWR), shoot weight ratio (SWR), and runner weight ratio (RuWR) were also recorded. Soil analyses and the in situ water measurement were also carried out. Growth analyses with regards to shading and photosynthetic rates were also investigated. Keywords: Cryptocoryne ciliata, Morphological Characteristics, Biomass Allocation INTRODUCTION
Cryptocoryne (Araceae) is an aquatic to amphibious plant genus known to people who keep aquaria (Holttum 1969; Jacobsen 1976; Mühlberg 1982). Vernacularly, Cryptocoryne is also known as tropical-bog, kiambang batu (Melayu Sarawak), kelatai (Iban), hati-hati paya (Semenanjung Malaysia), keladi laut, bakong (Melayu Samarahan), Teron Amun (Melanau) and tropong ajer (Banjarmasin, Kalimantan). Cryptocoryne are commercially exported to the international aquarium markets such as to Singapore, Japan and Europe.
According to Jacobsen (1985), most Cryptocoryne species found in Borneo are endemic and may face extinction due to the rapid exploitation and demolishment of the forest. The rapid development contributes problems to the
*Corresponding author: [email protected]
45

A Simon et al. riverine ecosystem that causes strong erosion in the rivers and eventually washed out all the nutrients and substrate needed by the Cryptocoryne (Mansor & Masnadi 1994; Jacobsen 1985). This in the end changes the natural habitat of the Cryptocoryne, which are very sensitive to slight changes in the environment (Sulaiman & Mansor 1998). It is now known that the number of Cryptocoryne are decreasing due to the human activities that result in the changes of the habitat. Many of the wet places in Malaysia are the result of human activities such as paddy fields, drainage canals, borrow pits on the sides of the roads, and fishponds and reservoirs which resulted in most Malaysian rivers being heavily polluted (Polunin 1992).
There are more than 50 species of Cryptocoryne in the Southeast Asia (Bastmeijer 2006). Cryptocoryne species of Borneo can be found growing in three major different habitats as reported by Jacobsen (1985). The habitats were in the inner tidal zones (amphibious mode of life); slow to fast running rivers and streams (aquatic way of life), and the banks of some smaller rivers and streams (rheophatic way of life).
Two varieties of C. ciliata may be recognized (Mühlberg 1982; Rataj 1975; Jacobsen 1985). Cryptocoryne ciliata (Roxb.) Schott var. ciliata, which had lanceolate to broad lanceolate leaf blades forms long creeping runners eventually producing slips. The second variety is C. ciliata (Roxb.) Schott var. latifolia Rataj, which the leaf blades are ovate or cordate. The plant forms no runners, but many short, lateral shoots. Jacobsen (1985) found the chromosome numbers in C. ciliata to be 2n = 22, 33. The C. ciliata var. ciliata has a chromosome numbers of 2n = 22 whereas C. ciliata var. latifolia has 2n = 33 (Rataj 1975). There are no close similarities to any other Bornean species; however C. vesteegii Engl. from New Guinea shows habitat and embryo similarities and has chromosome numbers of 2n = 34. However, these morphological similarities may be due to separation from the common habitat. According to Jacobsen (1985), the exact distribution of diploids and triploids is unknown; only that triploids have been found in Bangkok, Singapore, and at Kuching, Matang and Kpg. Stutong in Sarawak.
C. ciliata can be found throughout most of Asia and also the Malay Peninsula (Jacobsen 1985). It can also be found at the Southeast Asiatic mainland, Kalimantan, Java, Sumatra, Celebes, Moluccas Islands and New Guinea (Hay et al. 1995). C. ciliata is a herbaceous plant with thick rhizomes predominantly growing in bogs. The leaves are thick with green petiole. Their leaf blades are variable in form depending on the place of origin, relatively tough, adaxial pale-green to dark-green. Without markings, abaxial usually slightly paler in color. The spathe is brownish with a yellow throat, a rough surface and ciliate margins. The seeds have multicilate embryos (Jacobsen 1985).
The present study is mainly to determine the distribution pattern of the C. ciliata var. ciliata from different salinity regimes besides gathering more information about the environmental conditions which are suitable and affects the plant growth. This research was also conducted to understand more about its ecological function in the riverine ecosystem and to determine factors such as water quality and soil fertility affecting the surrounding of C. ciliata.
46

Distribution Patterns, Growth and Biomass Allocation MATERIALS AND METHODS Study Area This research was conducted along Sungai Sarawak (Sungai = River) [Fig. 1(a)] from the barrage at Pending until Batu Kawa area [Fig. 1(b)].
Fig 1a: Location of Sungai Sarawak, Kuching
Figure 1b: Location of C. ciliata sampling along Sungai Sarawak (P = Point)
Morphological Characteristics of C. ciliata The morphological assessment of the flowering plant was conducted by selecting five plants randomly per quadrate. The morphological characteristics of the fertile specimens collected were recorded. These also included the vegetative characteristics namely the leaves, cataphylls, rhizomes, syncarpous fruit and inflorescences.
47

A Simon et al. Growth Pattern and Biomass Allocation of C. ciliate Three quadrates of 1 × 1 m were established randomly for every 1 km along Sungai Sarawak with the occurrence of C. ciliata. All plants within quadrate were separated to determine the total dry weight of the vegetative parts such as leaf blades, roots, leaf petiole, syncarp, runners and rhizomes. All the plants in the quadrate were taken to be counted and for the morphological measurements. The C. ciliata was separated according to a few sections that are the leaf blades, leaf petioles, rhizomes, roots, runners, and syncarpous infructescences. Each part of the plant was washed, cleaned and oven dried at 60oC for seven days to determine their dry weight. The leaf area was measured using the AT Delta-T Scan (DELTA_T devices LTD, England) before being oven dried. The biomass pattern was analyzed mathematically using the method described by Peterson and Flint (1983). Water Sampling Water samplings were taken during the low tide for every 2 km from Point 0 (Barrage of Pending) until Point 22. Water samples were also taken at the Batu Kitang (Point 28) as a reference. Water samples were subjected to chemical analyses to determine the presence of copper (Cu), ferum (Fe), potassium (K), magnesium (Mg), zinc (Zn), calcium (Ca), phosphorus (P), manganese (Mn), boron (B), nitrate (NO3), chloride (CI), nitrite (NO2), bromide(Br), phosphate (Ph), fluoride (F) and sulfate (SO4). For the in situ assessment, the water quality measurements were taken (pH, conductivity, temperature (oC), turbidity, dissolved oxygen and salinity of the river) from each sampling point. Soil Analysis Soil samples were also taken for every 2 km from the Point 0 (Barrage of Pending) till Point 22 along Sungai Sarawak. Soil samples were also taken at 6 km upstream from Point 22 that was at Batu Kitang (Point 28) as a control. From each sampling point, five replicates were taken from every quadrate of 1 × 1m. The soil samples were collected for layer depths of 0–30 cm with 2.5 cm diameter auger. Five auger holes were made in each 1 × 1 m quadrate giving a total of 15 points. The soils were put into different plastic bags according to the same quadrate taken. The samples were left to air-dried in room temperature for two weeks. All the samples were analysed for pH (Hesse 1979; Mc Lean 1986), soil organic carbon (C) (Dewis & Freites 1970), total nitrogen (N) (Anon 1980; Beitz 1974), cation exchange capacity (CEC) and base saturation (BS) (Anon 1980), K, Sodium (Na), Ca, Mg, as well as exchangeable cations. Response of C. ciliata to Shading Newly germinated seedlings were collected from Sungai Sarawak. The seedlings were planted using loamy clay soils into a polybag and were raised in the greenhouse of FRST, UNIMAS for the growth analysis. The polybags were placed in a basin filled with water. The water level was about 1–2 cm above the soil surface. After two weeks, 30 uniform seedlings at second leaf stage were selected randomly to be placed each at the different shading regimes that were at 0%, 50% and 75% shading. On the first day of transfer, number of leaves and
48

Distribution Patterns, Growth and Biomass Allocation plant height (cm) were taken. The assessment for number of leaves and plant height were conducted every two weeks.
In another assessment, five plants were selected randomly after 40 days of planting to determine the biomass allocation. Leaves, rhizomes, roots, runners and syncarpous fruit were separated from each other, washed clean and then oven-dried at 60oC for 72 h to determine their dry weight. Leaf area were also measured using the AT Delta-T Scan (DELTA_T devices LTD, England) before being oven-dried. The second harvest was conducted after 70 days of planting using the same procedure as mentioned above. The growth analysis and biomass allocation were assessed using the method described by Patterson (1980).
RESULTS
Morphological Description for C. ciliata var. ciliata Rhizome Elongated 7–17 cm, internodes runners 1–19 cm long, 2–24 mm in diameter, brown greenish, or creamy brown slightly whitish. Cataphyll 11–21 cm × 10–40 mm, falcate to oblong, thin and greenish-grey with slightly pink at adaxial, grayish-purple in the middle and slightly whitish at base, transparent, convulate, two lines in the middle, apex retuse. Leaves 20–48 × 3–8 cm, broadly or narrowly lanceolate to narrowly elliptic or narrowly lanceolate, smooth, glossy on the adaxial side, apex acuminate, base oblique to cordate, very dark green to dark green on the adaxial side, green to dull light green on the abaxial side, young leaves light green on both surfaces, margin entire, midrib flattened on the adaxial side, raised on the abaxial side, secondary veins of 6–11 pairs sometimes indistinct, flattened. Petioles 26–67 cm long, 7–18 mm diameter near base, 3–12 mm in the middle, 2–8 mm at the upper end, spongy, flattened-slightly channeled at the upper 1–3 cm, purplish-green or whitish-purple near the base. Inflorescence 30–33 cm long; peduncle 3–7 cm long, diameter 3 mm, pink creamy with slightly green at the upper end; spathe 26–28 cm long; kettle constricted, outer surface pink creamy with slightly whitish, inner surface whitish; tube, lining parallel, 3–8 cm long from limb to tube, clear dark maroon lining thinning towards tube, 18–20 cm long, tube base 2–5 mm in diameter, upper tube 2–4 mm in diameter, inner surface whitish, outer surface greenish-creamy, lining grey, twisted; limb recurved, 7–8 cm long, 11–20 mm wide (widest part), apex acuminate, narrowly
49

A Simon et al. ovate, upper surface rough, waxy, dark maroon with numerous 1–2 cm long branched cilia at the margins, outer surface smooth, greenish-grey; throat collar yellow, surface cream yellowish with tiny maroon spots scattered around. Female flowers 6–7, stigma spherical elongate, light yellow, pistil 4–6 mm long, 1–2 mm wide. Olfactory bodies small with rounded or more or less irregular.
A: Limb of spathe
B: The Spathe
C: Opened kettle D: A syncarp
E: The burst syncarpous fruit releasing the Seeds
F: Plants with runners
Figure 2: Morphological features of C. ciliata var. ciliata (A = Limb of spathe; B = Spathe; C = Opened kettle; D = A syncarp; E = The burst syncarpous fruit releasing the seeds; F = Plants with runners)
50
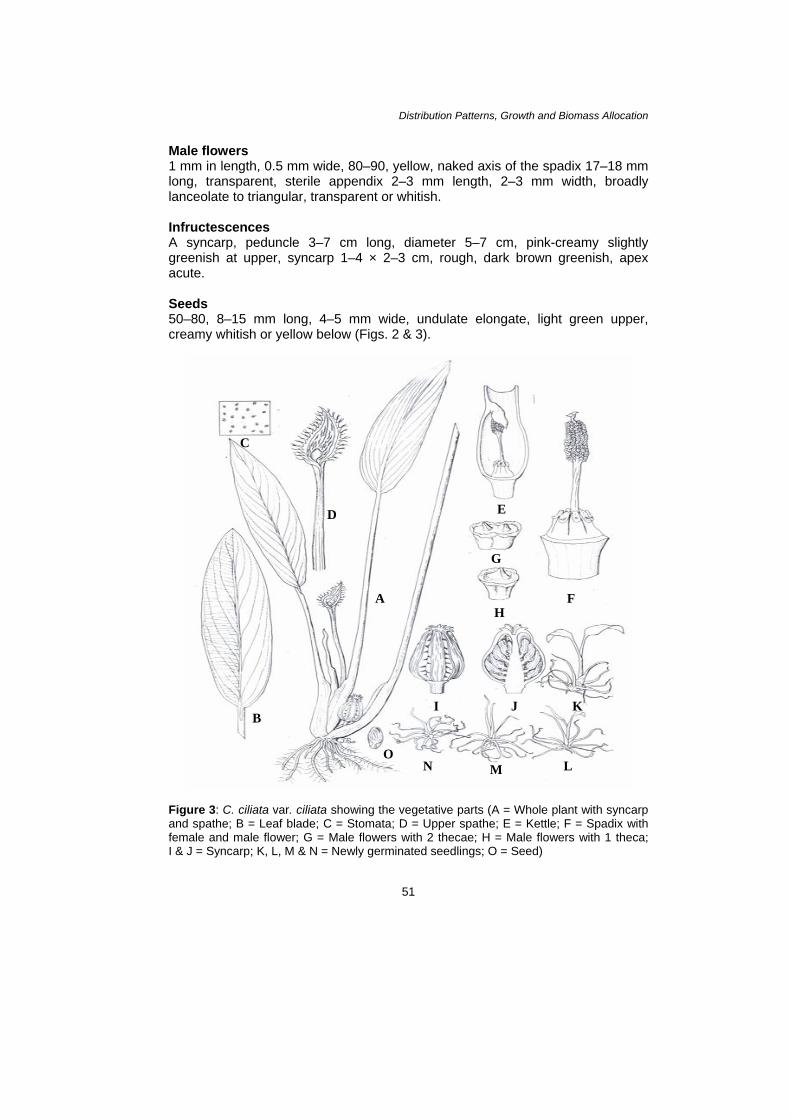
Distribution Patterns, Growth and Biomass Allocation Male flowers 1 mm in length, 0.5 mm wide, 80–90, yellow, naked axis of the spadix 17–18 mm long, transparent, sterile appendix 2–3 mm length, 2–3 mm width, broadly lanceolate to triangular, transparent or whitish.
Infructescences A syncarp, peduncle 3–7 cm long, diameter 5–7 cm, pink-creamy slightly greenish at upper, syncarp 1–4 × 2–3 cm, rough, dark brown greenish, apex acute. Seeds 50–80, 8–15 mm long, 4–5 mm wide, undulate elongate, light green upper, creamy whitish or yellow below (Figs. 2 & 3).
C
E D
G
A F H
K I JB
O
M L N
Figure 3: C. ciliata var. ciliata showing the vegetative parts (A = Whole plant with syncarp and spathe; B = Leaf blade; C = Stomata; D = Upper spathe; E = Kettle; F = Spadix with female and male flower; G = Male flowers with 2 thecae; H = Male flowers with 1 theca; I & J = Syncarp; K, L, M & N = Newly germinated seedlings; O = Seed)
51

A Simon et al. Morphological Variations of C. ciliata along Sungai Sarawak There was a morphological variation in C. ciliata as observed along Sungai Sarawak. This variation can be seen clearly in terms of size and color. However, due to the time factor, samples were unavailable for a complete description for Point 5, 10 and 11. The inflorescences were only present at Point 4, 17, 20 and 22 at the time of sampling. There were a few points in which no occurrence of C. ciliata was recorded at all: Point 0, 3, 9, 15, 16 and 19. A detailed occurrence of C. ciliata is as shown in Table 1. Table 1: The occurrences of C. ciliata along Sungai Sarawak
Point GPS position Plants/m2 Habitat 0 km
(Barrage) N 01o 34’ 36.3”
E 110o 24’ 30.3”
None
Habitat disturbed due to extensive soil erosion. Dominated by Spinifex littoreus Merr.
1 km N 01o 34’ 46.4” E 110o 23’
40.8”
27 Population average, shade area, inner parts of the inner tidal zones up on the river bank (rheophytes) together with Avicennia alba, muddy
2 km N 01o 34’ 39.3” E 110o 22’
53.1”
16 Population sparse, inner parts of the inner tidal zones up on the river bank (rheophytes) together with Avicennia alba, sand to coarse gravel, shaded area
Steep river bank. Area dominated by Nypa fruticans Wurmb.
3 km N 01o 34’ 19.6” E 110o 22’
22.1”
N 01
None
Abundant, shade area, muddy, near residential area, submerged only if water level is high
4 km o 33’ 44.1” E 110o 22’
49.5”
N 01
33
Population the least, muddy, near residential area, on top of a bank
5 km o 33’ 16.8” E 110o 22’
06.8”
5
6 km N 01o 33’ 34.5” E 110o 21’
37.9”
13 Sparse, shaded area, on a bank, together with Sonneratia sp.
7 km N 01o 33’ 39.1” E 110o 21’
07.6”
46 Abundant, muddy, shade area
8 km N 01o 33’ 38.8” E 110o 20’
39.3”
43 Abundant, sand to coarse gravel, together with Sonneratia sp., shaded area
9 km N 01o 33’ 39.1” E 110o 20’
12.1”
N 01
None Steep river bank
10 km o 33’ 59.7” E 110o 19’
48.8”
N 01
21 Population average, muddy, near residential area, shaded area under the Sonneratia sp., growing up on the river banks, submerged only if water level is high
Not very dense, muddy, near residential area, shady area under Sonneratia sp., submerged only if water level is high
11 km o 34’ 04.4” E 110o 19’
23.4”
29
(continue on next page)
52
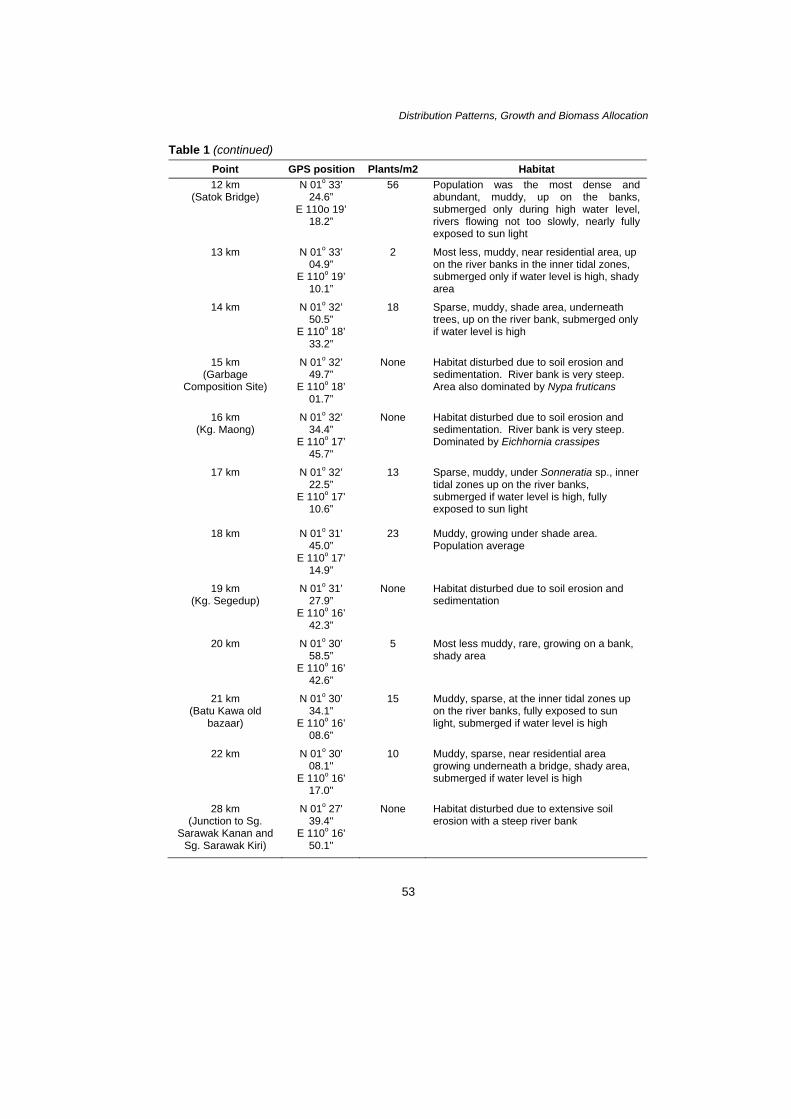
Distribution Patterns, Growth and Biomass Allocation Table 1 (continued)
Point GPS position Plants/m2 Habitat 12 km
(Satok Bridge) N 01o 33’
24.6” E 110o 19’
18.2”
56 Population was the most dense and abundant, muddy, up on the banks, submerged only during high water level, rivers flowing not too slowly, nearly fully exposed to sun light
13 km N 01o 33’ 04.9”
E 110o 19’ 10.1”
2 Most less, muddy, near residential area, up on the river banks in the inner tidal zones, submerged only if water level is high, shady area
14 km N 01o 32’ 50.5”
E 110o 18’ 33.2”
N 01
18 Sparse, muddy, shade area, underneath trees, up on the river bank, submerged only if water level is high
15 km (Garbage
Composition Site)
o 32’ 49.7”
E 110o 18’ 01.7”
None Habitat disturbed due to soil erosion and sedimentation. River bank is very steep. Area also dominated by Nypa fruticans
16 km (Kg. Maong)
N 01o 32’ 34.4”
E 110o 17’ 45.7”
None Habitat disturbed due to soil erosion and sedimentation. River bank is very steep. Dominated by Eichhornia crassipes
17 km N 01o 32’ 22.5”
E 110o 17’ 10.6”
13 Sparse, muddy, under Sonneratia sp., inner tidal zones up on the river banks, submerged if water level is high, fully exposed to sun light
18 km N 01o 31’ 45.0”
E 110o 17’ 14.9”
N 01
23 Muddy, growing under shade area. Population average
19 km (Kg. Segedup)
o 31’ 27.9”
E 110o 16’ 42.3”
None Habitat disturbed due to soil erosion and sedimentation
20 km N 01o 30’ 58.5”
E 110o 16’ 42.6”
N 01
5 Most less muddy, rare, growing on a bank, shady area
21 km (Batu Kawa old
bazaar)
o 30’ 34.1”
E 110o 16’ 08.6”
N 01
15 Muddy, sparse, at the inner tidal zones up on the river banks, fully exposed to sun light, submerged if water level is high
22 km o 30' 08.1"
E 110o 16' 17.0"
10 Muddy, sparse, near residential area growing underneath a bridge, shady area, submerged if water level is high
28 km (Junction to Sg.
Sarawak Kanan and Sg. Sarawak Kiri)
N 01o 27' 39.4"
E 110o 16' 50.1"
None Habitat disturbed due to extensive soil erosion with a steep river bank
53
A Simon et al.
Point 0 was situated at the Barrage of Pending. This site has been fully developed into a water control gate. This explains why no occurrence of C. ciliata was found at all due to the strong water current since nearly every day, water would be released into the river to maintain the water level of Sungai Sarawak. When the water is released, it will be running very quickly. The habitats here were disturbed due to extensive soil erosion and were mostly dominated by the Spinifex littoreus Merr. At Point 3, this site was exposed to strong water current since the riverbank is very steep. The area here was mostly dominated by Nypa fruticans Wurmb. This site was also exposed to soil erosion.
Point 9 is a residential area. No plants were found and this may be the result of destruction of natural habitats due to the development activities. The river bank was also very steep, thus making it easier to be affected by the strong water current.
Point 15, this site has been turned into a placed to collect rubbish from the river. This site was called the garbage components site. Through the river bank here was not very wide, thus making it easy to be washed away by the tide. Point 16 was mostly dominated by the water hyacinth [Eichhornia crassipes (Mart) Solms]. This site was prone to extensive soil erosion and sedimentation. Similar to this site, Point 19 was also exposed to extensive soil erosions and sedimentations which are not suitable for C. ciliata. The riverbank was also very steep.
The plants obtained from Point 1 were found growing at the inner part of the river bank. This site was muddy, sandy to coarse gravel and was a shady area. If the water level was high, the plants could be found submerged. The population here was abundant with a total of 27 plants per quadrate. The plants here had a very short rhizome, 2–3 cm and with very few roots. The leaves here were broadly lanceolate to narrowly elliptic. At this site, more biomass was partitioned to the leaves (20.6 ± 4.8 g/m2), followed by the rhizomes (13.6 ± 0.4 g/m2), runners (3.9 ± 0.03 g/m2), roots (3.5 ± 0.2 g/m2) and fruits (0.1 ± 0.1 g/m2). The total plant dry weight is only 41.7 ± 4.5 g/m2. Since the plants here grow at the inner part of the river bank, they were affected by the strong current. In addition, the plants were found growing together with Avicennia alba. The pneumatophores roots of the Avicennia alba help to reduce the effect of the strong water current.
At Point 2, C. ciliata was found growing at the inner parts of the inner tidal zones. This site was less muddy but sandy to coarse gravel and was shady. The population here was sparse with a total of 16 plants per quadrate only. The plants here were short in size. The plants at this location had the highest biomass partitioned to the leaves (19.7 ± 10.7 g/m2), followed by rhizomes (11.2 ± 8.5 g/m2), roots (4.4 ± 3.4 g/m2) and runners (0.9 ± 0.1 g/m2). As observed in the field, the plants were growing in patches behind the Avicennia alba trees. The leaf blades were usually longer than the leaf petioles and the roots were more numerous and stronger than of the other localities.
54
Distribution Patterns, Growth and Biomass Allocation
Point 4 was situated at a residential area. The area here was muddy, shady and the plants were big and tall in size. The leaves were linear to narrowly elliptic. The rhizomes were long and stout. The population here was abundant (33 plants per quadrate). The highest biomass partitioned to the plants here was leaves (57.4 ± 40.5 g/m2), followed by rhizomes (13.6 ± 8.9 g/m2), roots (11.3 ± 9.0 g/m2) and runners (0.9 ± 0.0 g/m2) with a total plant dry weight of 83.1 ± 59.1 g/m2.
Point 5 is situated on the slope, near to the residential area. The area was not muddy. The plants here were with the lowest density with only five plants per quadrate. The plants here were short. The roots were few but long. The leaf blade's color is dark green but not as dark as in Point 6. At the time of sampling, the river was polluted with oil spill at this location. The highest biomass partitioned to this plant was rhizomes (10.9 ± 2.1 g/m2), followed by leaves (8.3 ± 1.20 g/m2), roots (6.9 ± 0.6 g/m2) and fruits (0.7 ± 0.5 g/m2). No runners were formed and no fruits were found at the time of sampling.
At Point 6, the plants were growing on a bank and could be found growing together with Sonneratia sp. The population here was sparse (13 plants per quadrate). The plants growing here had the darkest color for both leaf blade and petiole (very dark green) as compared to other locations. This is probably due to the shady area, which resulted in the plants producing more chlorophyll for photosynthesis. The leaf blade is very broad (narrowly elliptic to broadly lanceolate). The plants here were big in size. The internodes of the rhizomes were found to be the thickest, very spongy and long. The highest biomass partitioned to this plant was the leaves (45.6 ± 12.3 g/m2), followed by rhizomes (23.1 ± 7.4 g/m2), roots (10.6 ± 3.8 g/m2), fruits (0.7 ± 0.4 g/m2) and runners (0.2 ± 0.0 g/m2) with a total plant dry weight of 80.2 ± 15.8 g/m2.
The plants found at Point 7 were growing in a less muddy situation with coarse gravel together with Sonneratia sp. Population here was abundant (46 per quadrate). The plants here were getting smaller and shorter. This is probably due to the strong water current. The leaves were short but the blades longer than the petiole. The rhizomes and roots were short and smaller. The highest biomass partitioned to this plant was the leaves (49.17 ± 14.67 g/m2), followed by rhizomes (25.5 ± 11.5 g/m2), roots (14.8 ± 7.0 g/m2), fruits (0.8 ± 0.5 g/m2) and runners (0.2 ± 0.0 g/m2) with a total plant dry weight of 90.5 ± 27.4 g/m2.
The plants at Point 8 were found growing on the top of a bank, in a shady area. The population here was abundant (43 plants per quadrate). The plants here were shorter in size. The leaf blades were shorter than the petioles. However, the rhizomes were longer at this location. Fruits available were big in size. The highest biomass partitioned to this plant was the leaves (115.9 ± 25.1 g/m2), followed by rhizomes (97.0 ± 16.9 g/m2), roots (85.4 ± 7.2 g/m2), fruits (9.3 ± 4.8 g/m2) and runners (0.3 ± 0.0 g/m2) with a total plant dry weight of 307.9 ± 38.1 g/m2.
55

A Simon et al.
At Point 10, the habitat here was muddy with plants, growing up to the river banks, near to residential area. The population here was not too dense (21 plants per quadrate). The plants were found growing under the Sonneratia sp. The plants here had narrowly elliptic leaf blades. The highest biomass partitioned to this plant was leaves (74.47 ± 13.20 g/m2), followed by rhizomes (54.2 ± 12.5 g/m2), roots (18.1 ± 7.1 g/m2), fruits (1.3 ± 0.8 g/m2) and runners (0.2 ± 0.0 g/m2) with a total plant dry weight of 148.3 ± 24.9 g/m2.
At Point 11, the plants were also found growing under the Sonneratia sp. This area was muddy. The population here was not very dense (29 plants per quadrate). C. ciliata had very big, thick and long rhizome internodes. The petioles were thick and long whereas the leaves were narrowly elliptic. The highest biomass partitioned to the plants was leaves (83.4 ± 25.9 g/m2), followed by rhizomes (28.1 ± 8.7 g/m2), roots (17.8 ± 3.5 g/m2), fruits (4.8 ± 0.8 g/m2) and runners (0.0 ± 0.0 g/m2) with a total plant dry weight of 134.6 ± 37.7 g/m2.
At Point 12, the area was very muddy and the river was flowing moderately slow. The plants were growing at the inner part of the river banks and were nearly fully exposed to the sun light. The water here was muddy especially during the rainy season. The population here was the most dense and abundant found. Overall, Point 12 showed the highest values for total number of plants collected (56 plant per quadrate), total number of leaves (148 per quadrate) and dry weight for rhizomes (115.0 ± 32.2 g/m2). Through observation from the field, the plants were growing very well at this point and this site was far away from any development activities or a residential area which allowed the plant to thrive well as compared to any other points. As observed, the plants formed many runners which allowed them to continually reproduce to maintain their population. The rhizome at this site was found to be the longest (up to 24 cm long) and stout. The leaves were linear to narrowly elliptic. Sometimes the leaf blades appear to be very short with a longer petiole. Since the population here is very dense, this has probably caused the plants to grow taller in order to compete for sun light. The highest biomass partitioned to this plant was rhizomes, followed by leaves (110.3 ± 4.5 g/m2), roots (24.6 ± 13.2 g/m2), fruits (8.2 ± 4.2 g/m2) and runners (5.1 ± 0.0 g/m2) with a total plant dry weight of 263.2 ± 53.6 g/m2.
At Point 13, the plants were growing up on the river bank underneath residential houses. The area here was muddy. Only two plants were found in the quadrate and they were found growing together with Aglaodorum griffithii (Schott) Schott. C. ciliata can sometimes be mistaken for A. griffithii if not identified properly. The leaf blades of C. ciliata were broadly lanceolate to narrowly elliptic. The highest biomass partitioned to the plants was roots (3.5 ± 1.2 g/m2), followed by rhizomes (3.1 ± 1.5 g/m2) and leaves (2.2 ± 0.4 g/m2) with a total plant dry weight of 8.8 ± 1.7 g/m2. There were no runners formed and no fruits found at the time of sampling.
56
Distribution Patterns, Growth and Biomass Allocation
The plants growing at Point 14 were in a shaded area, growing on banks between the bushes. Population here was sparse with a total of 18 plants per quadrate only. The leaf blades were linear to broadly elliptic. The highest biomass partitioned to this plant here was leaves (70.0 ± 4.1 g/m2), followed by rhizomes (23.8 ± 4.0 g/m2), roots (4.6 ± 2.3 g/m2), fruits (0.6 ± 0.3 g/m2) and runners (0.3 ± 0.0 g/m2) with a total plant dry weight of 99.4 ± 3.7 g/m2.
At Point 17, the habitat was muddy and the plants were fully exposed to sun light. The population here was sparse (13 plant per quadrate). The leaf blades here were linear to narrowly elliptic, sometimes falcate. At this site, it was observed that the morphological appearances of C. ciliata were influenced by the high tide. The sizes of the plants were smaller and shorter to avoid being washed away by the current. The highest biomass partitioned to the plants was leaves (23.5 ± 9.1 g/m2), followed by rhizomes (11. 6 ± 3.4 g/m2), roots (4.1 ± 0.7 g/m2), runners (0.9 ± 0.0 g/m2) and fruits (0.0 ± 0.0 g/m2) with a total plant dry weight of 40.1 ± 13.2 g/m2.
The plants at Point 18 were found growing in a muddy area. The population here was abundant (23 plants per quadrate). The highest biomass partitioned to this plant was leaves (62.6 ± 4.8 g/m2), followed by rhizomes (41.6 ± 8.4 g/m2), roots (13.0 ± 0.7 g/m2), fruits (1.9 ± 1.0 g/m2) and runners (1.9 ± 0.0 g/m2) with a total plant dry weight of 126.9 ± 13.3 g/m2.
At Point 20, the plants were growing on top of a bank near to the river bank. The area here was muddy. The population here was the smallest with a total of 5 plants per quadrate only. The leaves were linear to narrowly elliptic. The soil here was exposed to erosion and sedimentations. This had probably resulted in plants growing in higher places, such as on top of the bank, avoided being affected by the soil erosion. The highest biomass partitioned to this plant was leaves (3.0 ± 2.2 g/m2), followed by rhizomes (0.9 ± 0.2 g/m2) and roots (0.5 ± 0.2 g/m2) and runners (0.0 ± 0.2 g/m2) with a total plant dry weight of 4.4 ± 2.2 g/m2.
The plants growing at Point 21 were growing at the upper part of the river bank, near to a concrete wall (at Batu Kawa main bazaar). The population here was sparse (15 plants per quadrate). The plants were fully exposed to sun light. The area here was muddy. The leaves were linear to narrowly elliptic. The highest biomass partitioned to the plant here was leaves (34.6 ± 10.5 g/m2), followed by rhizomes (18.8 ± 8.9 g/m2), roots (11.5 ± 5.3 g/m2), runners (0.6 ± 0.0 g/m2) and fruits (0.0 ± 0.0 g/m2) with a total plant dry weight of 65.4 ± 21.0 g/m2.
Finally, the plants growing at Point 22 were found growing at the upper part of the river bank, under a bridge at a residential area. The population here was sparse (10 plants per quadrate). The leaf blades were broadly lanceolate to narrowly elliptic, sometimes falcate. The area here was muddy. The highest biomass partitioned to this plant was leaves (60.0 ± 15.4 g/m2), followed by roots (12.7 ± 8. 7 g/m2), rhizomes (8.7 ± 1.5 g/m2), runners (1.9 ± 0.0 g/m2) and fruits (0.2 ± 0.1 g/m2) with a total plant dry weight of 83.5 ± 21.2 g/m2 .
The inflorescences available for description were only found at Point 4, 7, 20 and 22. Not much variation was observed. In terms of size, Point 22 had the longest length of inflorescence that of 33 cm whereas the other points were in the
57

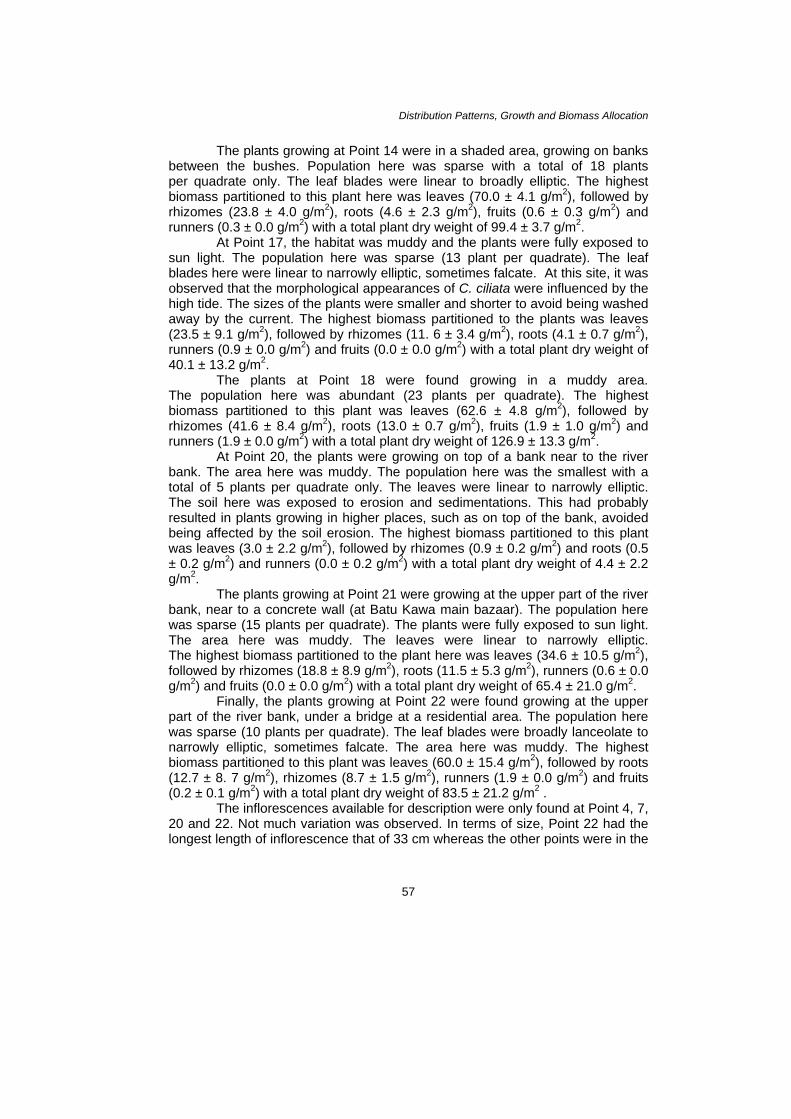
A Simon et al. range of 30–32 cm. The length of the peduncle for Point 22 was recorded the longest (7.3 cm), whereas Point 17 was the shortest with 3.2 cm. The color of the outer tube of the inflorescence was differed as, Point 17 and 22 had a creamy, slightly greenish color while Point 4 and 20 were recorded to have pink creamy color of the outer tube. The length of the limb was recorded the longest at Point 22 (7.7 cm) whereas the shortest at Point 20 (5 cm). The widest width of the limb was recorded at Point 17 (1.6 cm) whereas Point 20 was only one cm in width. Growth Pattern and Biomass Allocation of C. ciliata along Sungai Sarawak The growth pattern of C. ciliata along Sungai Sarawak is as shown in Figure 4(a). The highest total number of plants was recorded at Point 12 with a total of 56 plants per quadrate, [Fig. 4(a)] which had the highest total number of leaves with 148 leaves per quadrate [Fig. 4(b)]. The lowest total number of plant recorded was at Point 13 with only two plants per quadrate. The lowest total number of leaves was recorded at Point 20 with only 10 leaves per quadrate. The highest total plant dry weight was recorded at Point 8 with a total of 307.9 g/m2 whereas Point 20 had the lowest total plant dry weight with a total of 4.4 g/m2 [Fig. 4(c)]. The total plant dry weight showed significant difference (P < 0.05) at Point 1, 2, 6, 8, 13 and 14.
As a whole, Point 8 had the highest amount of dry weight recorded for leaves, roots and syncarp with a total of 115.9 g/m2, 85.4 g/m2 and 9.3 g/m2, respectively [Figs. 4(d), (f) & (g)]. Point 12 had the highest dry weight for rhizomes with a total of 115.0 g/m2 [Fig. 4(e)]. Point 13 had the lowest amount of dry weight recorded for leaves and rhizomes with 2.2 g/m2 and 3.1 g/m2 respectively. The lowest dry weight of roots was recorded at Point 20 with a total of 0.5 g/m2. The lowest dry weight for syncarpous fruit was recorded at Point 1 with a total of 0.1 g/m2 only. However, there were a few points at which no fruits were found at the time of sampling which were at Point 2, 4, 13 and 20. Point 1 had the highest dry weight for runners recorded which were 3.9 g/m2 whereas Point 11 stated the lowest dry weight for runners collected being 0.03 g/m2 only [Fig. 4(h)]. The dry weight of leaves showed significant difference (P < 0.05) at Point 12, 14 and 22. As for the dry weight of rhizomes, Point 1, 6, 8, 10, 12 and 14 showed significant differences. The dry weight of roots showed significant differences at Point 5, 6, 7, 8, and 11. The dry weight of fruits showed no significant difference at Point 5, 6, 7, 8, 10, 11, 12, 14, 17 and 18. As for the dry weight of runners, Point 1, 2, 4, 6, 7, 8, 10, 12, 17, 21 and 22 showed no significant differences.
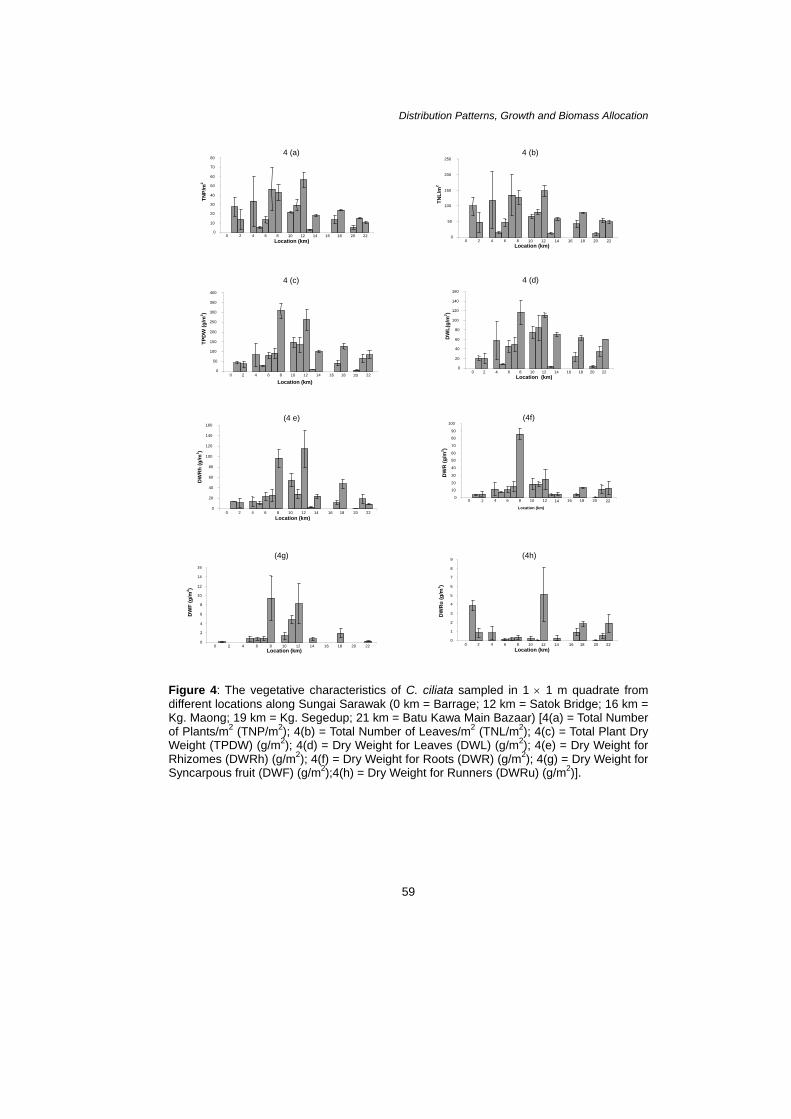
The LWR was highest at Point 22 with 0.7154 g/g and lowest at Point 13 with 0.2539 g/g [Fig. 5(a)]. Point 12 had the highest ratio for RhWR with 0.4207 g/g whereas Point 22 had the lowest ratio with 0.1261 g/g [Fig. 5(b)]. As for RWR, Point 13 had the highest ratio with 0.4026 g/g while Point 14 had the lowest ratio with 0.0452 g/g [Fig. 5(c)]. The syncarpous fruit weight ratio (FWR) was highest for Point 11 with 0.0400 g/g whereas Point 17 had the lowest ratio with 0.0005 g/g [Fig. 5(d)]. Finally, Point 1 had the highest ratio for RuWR with 0.0987 g/g whereas Point 11 had the lowest ratio with 0.0002 g/g [Fig. 5(e)].
58
Distribution Patterns, Growth and Biomass Allocation
4 (a)
0 2 4 6 8 10 12 14 16 18 20 220
10
20
30
40
50
60
70
80
Location (km)
TN
P/m
2
4 (b)
0 2 4 6 8 10 12 14 16 18 20 220
50
100
150
200
250
Location (km)
TNL/
m2
4 (c)
0 2 4 6 8 10 12 14 16 18 20 220
50
100 150 200 250 300 350 400
Location (km)
TP
DW
(g/m
2 )
4 (d)
0 2 4 6 8 10 12 14 16 18 20 220
20
40
60
80
100
120
140
160
Location (km)
DW
L(g/
m2 )
(4f)
0 2 4 6 8 10 12 14 16 18 20 220
10
20
30
40
50
60
70
80
90
100
Location (km)
DW
R (g
/m2 )
(4 e)
0 2 4 6 8 10 12 14 16 18 20 220
20
40
60
80
100
120
140
160
Location (km)
DW
Rh
(g/m
2 )
(4g)
0 2 4 6 8 10 12 14 16 18 20 220 2 4 6 8
10
12
14
16
Location (km)
DW
F (g
/m2 )
(4h)
0 2 4 6 8 10 12 14 16 18 20 220
1
2
3
4
5
6
7
8
9
Location (km)
DW
Ru
(g/m
2 )
Figure 4: The vegetative characteristics of C. ciliata sampled in 1 × 1 m quadrate from different locations along Sungai Sarawak (0 km = Barrage; 12 km = Satok Bridge; 16 km = Kg. Maong; 19 km = Kg. Segedup; 21 km = Batu Kawa Main Bazaar) [4(a) = Total Number of Plants/m2 (TNP/m2); 4(b) = Total Number of Leaves/m2 (TNL/m2); 4(c) = Total Plant Dry Weight (TPDW) (g/m2); 4(d) = Dry Weight for Leaves (DWL) (g/m2); 4(e) = Dry Weight for Rhizomes (DWRh) (g/m2); 4(f) = Dry Weight for Roots (DWR) (g/m2); 4(g) = Dry Weight for Syncarpous fruit (DWF) (g/m2);4(h) = Dry Weight for Runners (DWRu) (g/m2)].
59
A Simon et al.
5 (b)
0 2 4 6 8 10 12 14 16 18 20 220
0.1
0.2
0.3
0.4
0.5
0.6
Location (km)
RhW
R (g
/g)
5 (a)
0 2 4 6 8 10 12 14 16 18 20 220
0.1
0.2
0.3
0.4
0.5
0.6
0.7
0.8
Location (km)
LWR
(g/g
)
5 (d)
0 2 4 6 8 10 12 14 16 18 20 220
0.01
0.02
0.03
0.04
0.05
0.06
Location (km)
FWR
(g/g
)
5 (c)
0 2 4 6 8 10 12 14 16 18 20 220
0.1 0.2 0.3 0.4 0.5 0.6
Location (km)
RW
R (g
/g)
(continue on next page)
Figure 5: The vegetative characteristics of C. ciliata sampled in 1 x 1 m quadrate from different locations along Sungai Sarawak (0 km = Barrage; 12 km = Satok Bridge; 16 km = Kg. Maong; 19 km = Kg. Segedup; 21 km = Batu Kawa Main Bazaar) [5(a) = Leaf Weight Ratio (LWR) (g/g); 5(b) = Rhizomes Weight Ratio (RhWR) (g/g); 5(c)= Root Weight Ratio (RWR) (g/g); (5d)= Syncarpous fruit Weight Ratio (FWR) (g/g); 5(e)= Runners Weight Ratio (RuWR) (g/g); 5(f)= Total Leaf Area (TLA) (cm2/m2); 5(g)= Leaf Area Ratio (LAR) (cm2/g); 5(h)= Specific Leaf Area (SLA) (cm2/g)].
5 (f)
0 2 4 6 8 10 12 14 16 18 20 22 0
2000
4000
6000
8000
10000
12000
14000
16000
Location (km)
TLA
(cm
2 /m2 )
5 (e)
0 2 4 6 8 10 12 14 16 18 20 220
0.02 0.04 0.06 0.08
0.1
0.12 0.14 0.16 0.18
Location (km)
RuW
R (g
/g)
60
Distribution Patterns, Growth and Biomass Allocation
Figure 5: (continued)
he highest total leaf area (TLA) per quadrate was recorded at Point 8
with a t
ater Analysis
ater Quality Analysis ty was recorded at Point 0 with 41.9 mv whereas the
Barrage (Point 0) till about
6.80 to 7.31 indicates that C.
5(
0 2 4 6 8 10 12 14 16 18 20 220
20 40 60 80
100 120 140 160
Location (km)
LAR
(cm
2 /g)
g) 5 )
0 2 4 6 8 10 12 14 16 18 20 22 0
50
100
150
250
300
Location (km)
200
SLA
(cm
2 /g)
(h
Total of 11464.4 cm2/m2 whereas the lowest was recorded at Point 13 with
only 406.7 cm2/m2 [Fig. 5(f)]. The LAR was highest at Point 4 with a total of 396.7 cm2/g whereas lowest at Point 8 with a total of 2.2 cm2/g [Fig. 5(g)]. All the points except Point 1, 2, 5, 6, 7, 8, 10 and 20 showed significant differences. The SLA was highest at Point 20 with a total of 215.9 cm2/g and lowest at Point 10 with a total of 91.4 cm2/g [Fig. 5(h)]. All of the points along Sungai Sarawak showed significant difference (P < 0.05) for SLA. W WThe highest conductivilowest conductivity was recorded at Point 22 with 9.5 mv [Fig. 6(a)]. There was a marched decrease in the conductivity from Point 0 till Point 3. Between Point 4 till Point 21, the conductivity range was 11–25 mv. The dissolved oxygen was lower from the Point 8 and there was an increase in the dissolved oxygen towards the upper part of the river (till Point 22) as shown in [Fig. 6(b)]. The highest dissolved oxygen was recorded at Point 18 with 4.6 mg/l whereas the lowest dissolved oxygen was recorded at Point 2 and Point 7 with 0.4 mg/l.
The water pH along Sungai Sarawak ranges fromciliata can grow at lower acidity to lower alkalinity [Fig. 6(c)]. The water pH
was recorded the highest at Point 0 (7.3) and lowest at Point 6 (6.8). The water salinity was higher at the Point 0 with 4.6o and lowest at the upper stream of Point 22 with 0.1o [Fig. 6(d)]. Salinity decreases towards the upper stream of Sungai Sarawak. The highest turbidity (NTU) was recorded at Point 15 with 85.7 NTU and lowest at Point 0 with 8.7 NTU [Fig. 6(e)]. The water temperatures along Sungai Sarawak were in the range of 28.1oC–32.1oC [Fig. 6(f)].
61

A Simon et al.
igure 6: Water Quality along Sungai Sar ak (0 km = Barrage; 12 km = Satok Bridge; 16
the highest amount of N available in the er th
F awkm = Kg. Maong; 19 km = Kg. Segedup; 21 km = Batu Kawa Main Bazaar) [6(a) = Conductivity (mv); 6(b) = Dissolved Oxygen (mg/l); 6(c) = pH; 6(d) = Salinity (o), 6(e) = Turbidity (NTU); 6(f) = Temperature (oC)].
oth Point 0 and Point 1 hadBwat at is 0.36% whereas Point 16 had the lowest amount of N available in the water (0.22%) as shown in Table 2. Higher water conductivity was detected at Point 6 with 7301 micromhos/cm as lowest was at Point 20 with 445 micromhos/cm. The highest amount of K was recorded at Point 6 (52.77 ppm), followed by Point 10 (27.04 ppm) and Point 12 (2.83 ppm). Ca was recorded the highest at Point 6 with 62.17 ppm, followed by Point 10 with 39.43 ppm and Point 12 with 9.28 ppm. Mg was also detected the highest at Point 6 (167.60 ppm), followed by Point 10 (84.24 ppm) and Point 12 (8.24 ppm). B was only detected at Point 6 and Point 10 with 0.35 ppm and 0.10 ppm, respectively. The presence of CI was recorded the highest at Point 6 with 2294.47 ppm and the lowest was at Point 14 with 23.43 ppm.
6 (b)
00.5
11.5
22.5
33.5
44.5
5
0 2 4 6 8 10 12 14 16 18 20 22 24 26 28
Location (km)
Dis
solv
ed O
xyge
n (m
g/l)
6 (d)
0
0.5
1
1.5
2
2.5
3
3.5
4
4.5
0 2 4 6 8 10 12 14 16 18 20 22 24 26 28
Location (km)Sa
linty
(°)
6 (c)
6.5 6.6 6.7 6.8 6.9
7 7.1 7.2 7.3 7.4
0 2 4 6 8 10 12 14 16 18 20 22 24 26 28
Location (km)
pH
6 (f)
25
26
27
28
29
30
31
32
33
0 2 4 6 8 10 12 14 16 18 20 22 24 26 28 Location (km)
Tem
pera
ture
(°C
)
6 (e)
0 10 20 30 40 50 60 70 80 90
0 2 4 6 8 10 12 14 16 18 20 22 24 26 28
Location (km)
Turb
idity
(NTU
)
6 (a)
0 5
10
15
20
25
30
35
40
45
0 2 4 6 8 10 12 14 16 18 20 22 24 26 28
Location (km)
Con
duct
ivity
(mv)
62

Distribution Patterns, Growth and Biomass Allocation
63
ever, no presence of NO was recorded at other amplin
he soil pH ranged from 2.8–5.7 (Table 3). Point 6 had highest pH (5.7) whereas lowest pH (2.8). The highest percentage of N was found at Point
g). The highest availability of Mg was at Point 6 (12.14 c
he relative humidity and air temperature ( C) were also taken for a given period n the range of 22.6oC–34.6oC at 0%
The presence of NO2 was highest at Point 10 with 2.12 ppm, followed by Point 6 with 1.35 ppm. How 2s g points. Br was found the most at Point 6 (5.84 ppm), followed by 3.71 ppm at Point 10. Point 3 had the lowest level of Br at 0.09 ppm. The presence of NO3 was detected the highest at Point 12 with 0.66 ppm. No NO3 was detected at all at Point 6, 10 and 22. SO4 was detected the most at Point 6 (463.82 ppm) and the least at Point 22 (0.04 ppm). The presence of F was recorded the highest at Point 10 and 14 (0.11 ppm), and lowest at Point 1, 3, 6, 18 and 22 (0.07 ppm). The presence of Fe was found highest at Point 16 and 18 (0.29 ppm). No iron was detected at Point 6, 10, 12 (0.00 ppm). Cu was only detected at Point 0 with 0.01 ppm. There was no amount of P, Mn and Ph detected in all sampling points. Soil Analysis TPoint 0 had the12 with 0.25% and lowest at Point 20 with 0.09%. Point 3 stated the highest amount of C available that is 2.93% whereas Point 20 stated the lowest amount of C available (0.88%).
The amount of Ca was highest at Point 12 (10.49 cmolc/kg) and lowest at Point 1 (2.08 cmolc/k
molc/kg) and lowest at Point 20 (1.34 cmolc/kg). Point 6 had the highest amount of K with 0.95 cmolc/kg whereas the lowest was at Point 0 with 0.11 cmolc/kg. Point 12 had the highest amount of Na available (5.77 cmolc/kg) whereas the lowest was at Point 20 (0.18 cmolc/kg). The CEC was the highest at Point 7 with 25.00 cmolc/kg whereas the lowest was at Point 20 with 13.14 cmolc/kg. The BS was the highest at Point 6 with 128.59% whereas the lowest was at Point 1 with 33.85%. High amount of clay was recorded at Point 3 with 47.11% whereas the lowest was at Point 20 with 8.18%. High amount of silt was also recorded at Point 1 with 46.62% and lowest at Point 20 with 16.37%. Point 3 had the highest amount of fine soil with 16.82% and the lowest was recorded at Point 6 with 2.59%. The highest amount of coarse soil was recorded at Point 10 with 58.35% and lowest at Point 1 with 5.13%. Growing Conditions in the Greenhouse
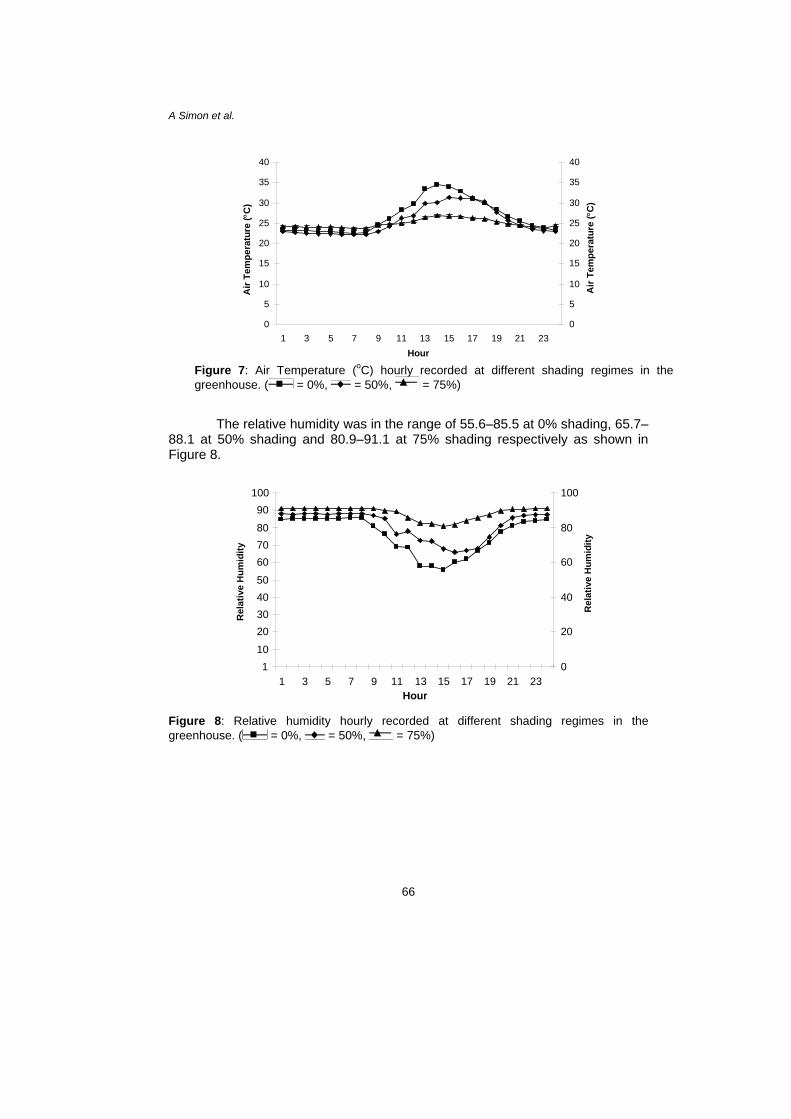
oTof seven days. The air temperature was ishading, 22.1oC–31.1oC at 50% shading and 23.6oC–26.9oC at 75% shading as shown in Figure 7.

Table 2: Chemical analysis for water sample for every 2 km from the Barrage (Point 0) along Sg. Sarawak
K Ca Mg Fe Cu Zn B Cl NO2 Br NO3 SO4 F Location
(km)
% N Conductivity
(micromhos/
cm) ppm
0 0.36 1223 2.13 0.00 0.26 0.16 0.01 0.00 0.00 24.75 0.00 0.14 0.47 0.64 0.08
1 0.36 667 1.49 0.00 0.10 0.28 0.00 0.00 0.00 24.18 0.00 0.18 0.44 0.07 0.07
3 0.31 779 1.37 0.00 0.12 0.27 0.00 0.00 0.00 24.147 0.00 0.09 0.45 0.08 0.07
6 0.28 7301 52.77 62.17 167.6 0.00 0.00 0.00 0.35 2294.47 1.35 5.84 0.00 463.82 0.07
10 0.26 3755 27.04 39.43 84.24 0.00 0.00 0.00 0.10 1114.24 2.12 3.71 0.00 224.94 0.11
12 0.26 5215 2.83 9.28 8.24 0.00 0.00 0.00 0.00 112.89 0.00 0.38 0.66 20.62 0.08
14 0.35 667 0.98 0.00 0.07 0.23 0.00 0.00 0.00 23.43 0.00 0.27 0.48 4.22 0.11
16 0.22 556 1.17 0.00 0.07 0.29 0.00 0.00 0.00 24.21 0.00 0.15 0.45 0.18 0.08
18 0.33 556 1.01 0.00 0.09 0.29 0.00 0.00 0.00 24.15 0.00 0.10 0.45 0.07 0.07
20 0.34 445 0.98 0.00 0.08 0.28 0.00 0.00 0.00 24.13 0.00 0.13 0.44 0.07 0.08
22 0.28 556 0.83 0.00 0.07 0.22 0.00 0.00 0.00 24.12 0.00 0.26 0.00 0.04 0.07
28 0.46 556 0.94 0.00 0.09 0.17 0.00 0.04 0.00 24.15 0.00 0.08 0.44 0.07 0.07
(N = Nitrogen; K = Potassium; Ca = Calcium; Mg = Magnesium; Fe = Ferum; Cu = Copper; Zn = Zinc; B = Boron; Cl = Chloride; NO2 = Nitrite; Br = Bromide; NO3 = Nitrate; SO4 = Sulfate; F = Fluoride)

Table 3: Chemical analysis for soil samples for every 2 km from Barrage (Point 0) along Sungai Sarawak
Ca Mg K Na CEC Clay Silt Fine Coarse Location
(km)
pH % N % C % BS
cmolc/kg %
0 2.8 0.16 2.84 56.67 3.91 6.97 0.11 0.77 20.75 40.00 45.71 6.69 7.60
1 3.5 0.14 2.16 33.85 2.08 3.60 0025 0.92 20.56 40.79 46.62 7.46 5.13
3 3.8 0.19 2.93 54.63 4.43 6.27 0.52 1.16 22.66 47.11 26.92 16.82 9.15
5 4.6 0.17 2.66 95.17 6.37 10.87 0.88 4.15 23.40 45.91 32.13 11.78 10.18
6 5.7 0.15 2.48 128.59 7.61 12.14 0.95 3.99 19.20 46.25 38.85 2.59 12.30
7 4.9 0.19 2.66 95.28 7.25 12.13 0.83 3.61 25.00 46.81 35.74 4.77 12.68
8 5.4 0.17 2.20 69.24 8.05 4.70 0.47 3.26 23.80 28.38 20.81 13.25 37.56
10 5.4 0.18 2.54 89.19 6.04 8.01 0.51 3.10 19.80 14.64 23.43 3.59 58.35
12 4.5 0.25 2.83 116.63 10.49 6.84 0.46 5.77 20.20 14.42 23.07 15.07 47.44
14 4.8 0.16 2.57 66.32 7.87 7.64 0.34 0.69 24.94 16.47 24.71 11.75 47.06
16 5.2 0.18 2.33 66.11 6.98 5.93 0.45 0.61 21.13 18.89 37.78 10.89 32.43
18 4.8 0.15 2.07 66.02 8.26 5.60 0.25 0.85 22.66 28.54 44.39 6.47 20.61
20 5.2 0.09 0.88 80.90 8.94 1.34 0.17 0.18 13.14 8.18 16.37 2.78 72.67
22 5.4 0.12 1.46 72.34 7.51 3.99 0.26 0.22 16.56 16.72 29.26 8.95 45.07
28 4.4 0.12 1.98 44.75 6.23 1.34 0.15 0.29 17.90 12.38 18.56 16.77 52.29
(N = Nitrogen; C = Carbon; BS = Base saturation; Ca = Calcium; Mg =Magnesium; K = Potassium; Na = Sodium; CEC = Cation Exchange Capacity)
A Simon et al.
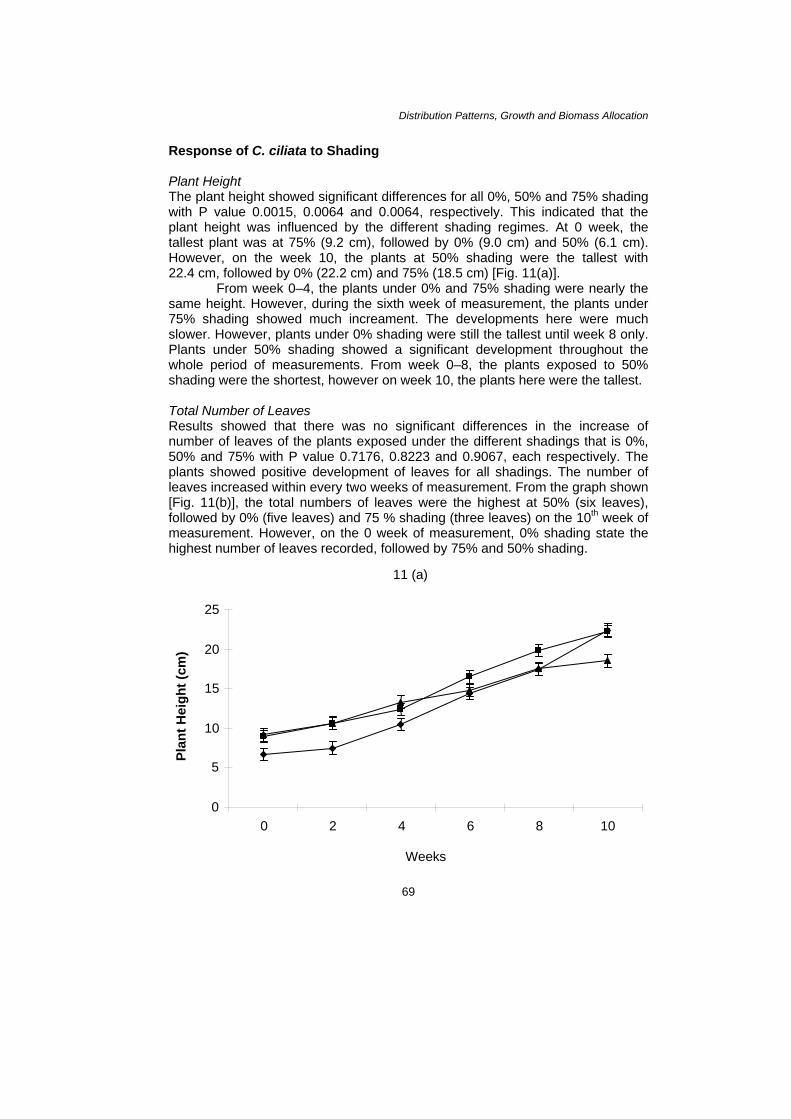
The relative humidity was in the range of 55.6–85.5 at 0% shading, 65.7–88.1 at 50% shading and 80.9–91.1 at 75% shading respectively as shown in Figure 8.
0 5
10
15
20
25
30
35
40
1 3 5 7 9 11 13 15 17 19 21 23Hour
Air
Tem
pera
ture
(°C
)
0
5
10
15
20
25
30
35
40
Air
Tem
pera
ture
(°C
)
Figure 7: Air Temperature (oC) hourly recorded at different shading regimes in the greenhouse. ( = 0%, = 50%, = 75%)
110
20304050
607080
90100
1 3 5 7 9 11 13 15 17 19 21 23Hour
Rel
ativ
e H
umid
ity
0
20
40
60
80
100
Rel
ativ
e H
umid
ity
Figure 8: Relative humidity hourly recorded at different shading regimes in the greenhouse. ( = 0%, = 50%, = 75%)
66

Distribution Patterns, Growth and Biomass Allocation
The light intensity of the shading regimes was taken using the Skye light meter as shown in Figure 9. At 0% shading, the light intensity was in the rage of 350–1260.9 umol m-2 sec-1, whereas at 50% shading, the light intensity was in the range of 190–950.4 umol m-2 sec-1 and at 75% shading was around 30–600 umol m-2 sec-1.
0
200
400
600
800
1000
1200
1400
6 7 8 9 10 11 12 1 2 3 4 5 6
Day Time
Ligh
t Int
ensi
ty (
umol
m-2
sec
-1)
Figure 9: Light intensity measurements under different shading regimes in the greenhouse. ( = 0%, = 50%, = 75%)
The soil pH and water temperature (oC) were taken to monitor the environment conditions of the plants grown under the different shading. From the data obtained, the soil pH showed significant different from the first week till the last week of measurement [Figure 10(a)]. At 0 week, the soil pH was the highest at 50% with 5.5, followed by 0% with 5.3 and 75% (5.2). Until the 8th week, the soil pH was more acidic with the lowest pH (more acidic) at 50% (4.8), followed by 0% (4.7) and 75% (4.7).
As for the water temperature (oC) which was taken nearly the whole day, results showed that the water temperature was in the range of 26oC–31oC at 0% shading, 26oC–32oC at 50% shading and 25oC–29oC at 75% shading [Fig. 10(b)].
67

A Simon et al.
10 (a)
4.2
4.4
4.6
4.8
5
5.2
5.4
5.6
1 5 6 8Week
Soil
pH
10 (b)
0
5
10
15
20
25
30
35
9 12 15 18 21 21Hour
Wat
er T
empe
ratu
re (°
C)
Figure 10: Growing conditions of C. ciliata under different shading regimes [10(a) = Soil pH; 10(b) = Water Temperature (oC)] at the greenhouse. ( = 0%, = 50%, = 75%)
68
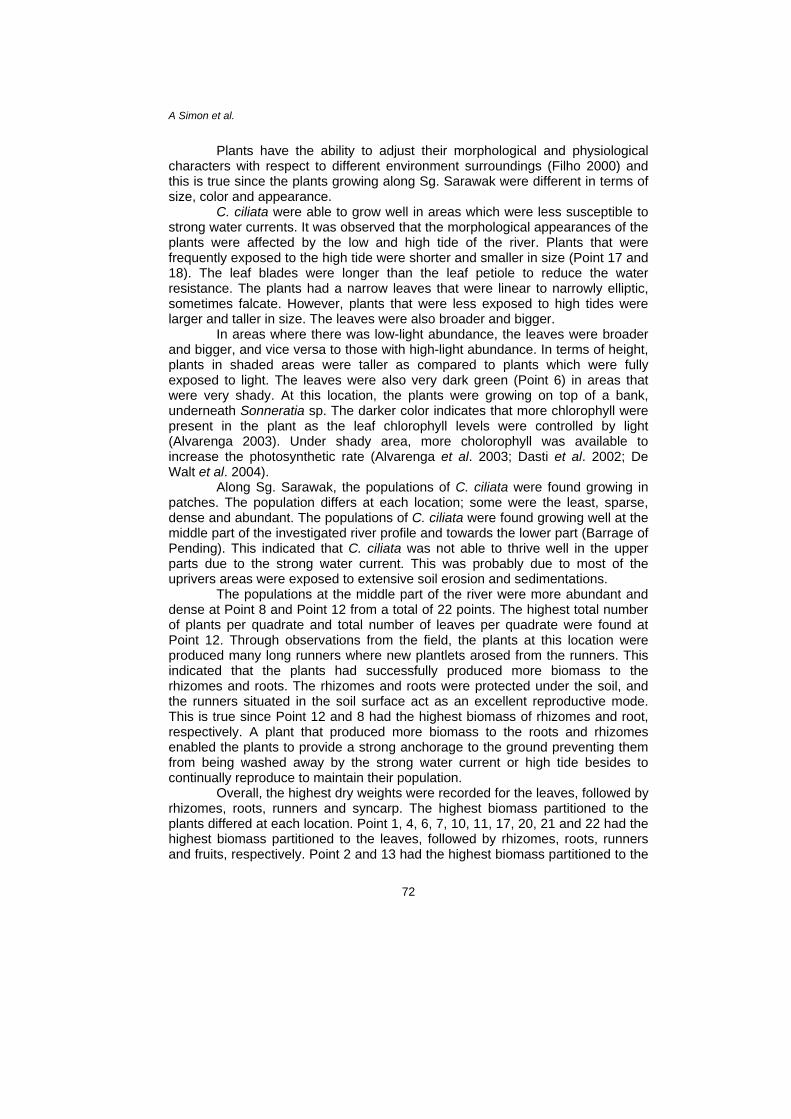
Distribution Patterns, Growth and Biomass Allocation Response of C. ciliata to Shading Plant Height The plant height showed significant differences for all 0%, 50% and 75% shading with P value 0.0015, 0.0064 and 0.0064, respectively. This indicated that the plant height was influenced by the different shading regimes. At 0 week, the tallest plant was at 75% (9.2 cm), followed by 0% (9.0 cm) and 50% (6.1 cm). However, on the week 10, the plants at 50% shading were the tallest with 22.4 cm, followed by 0% (22.2 cm) and 75% (18.5 cm) [Fig. 11(a)].
From week 0–4, the plants under 0% and 75% shading were nearly the same height. However, during the sixth week of measurement, the plants under 75% shading showed much increament. The developments here were much slower. However, plants under 0% shading were still the tallest until week 8 only. Plants under 50% shading showed a significant development throughout the whole period of measurements. From week 0–8, the plants exposed to 50% shading were the shortest, however on week 10, the plants here were the tallest. Total Number of Leaves Results showed that there was no significant differences in the increase of number of leaves of the plants exposed under the different shadings that is 0%, 50% and 75% with P value 0.7176, 0.8223 and 0.9067, each respectively. The plants showed positive development of leaves for all shadings. The number of leaves increased within every two weeks of measurement. From the graph shown [Fig. 11(b)], the total numbers of leaves were the highest at 50% (six leaves), followed by 0% (five leaves) and 75 % shading (three leaves) on the 10th week of measurement. However, on the 0 week of measurement, 0% shading state the highest number of leaves recorded, followed by 75% and 50% shading.
11 (a)
0
5
10
15
20
25
0 2 4 6 8 10
Weeks
Plan
t Hei
ght (
cm)
69

A Simon et al.
11 (b)
0
1
2
3
4
5
6
7
0 2 4 6 8 10Week
Num
ber o
f Lea
ves
Figure 11: Effect of Shading on [11(a) = Plant Height (cm); 11(b) = Number of leaves] on C. ciliata. Vertical bars showing the LSD value = 0.05 ( = 0%, = 50%, = 75%)
Overall, plants grown under 50% shading showed a positive development in the number of leaves developed as from week 0 till week 10, the number of leaves kept on increasing. At both 0% and 75% shading, the number of leaves increased from 0 till the week six, but on the week eight, the number of leaves showed no increment. However, on the week 10, both 0% and 75% shading showed increment in the number of leaves. Between weeks 6–8, there were runners formed at 0% shading. A few runners were observed at 50% shading but not to all of the plants. However, there were no runners formed yet at 75% shading.
The highest LWR for C. ciliata were recorded under 75% shading, followed by 50% shading and 0% shading (Table 4). The RhWR showed significant differences for all shade levels. This indicates that the production of rhizome was influenced by the different shading. The highest RWR were recorded at 50% shading, followed by 0% shading and 75% shading. The RWR also showed significant differences with P value 0.0024, 0.0024 and 0.0026 each for 0%, 50% and 75% shading, respectively. The production of the roots was greatly influenced by the shading. Plant exposed to full sun light showed higher production in the roots. This is true, since the total dry weight for roots were higher at 0% shading with 0.3468 g, followed by 50% (0.2759 g) and 75% (0.0401 g). As for the RuWR, 0% shading showed the highest RuWR with 0.0731, followed by 50% and 75% with 0.0519 and 0.0000, respectively. At 75% shade, no runners were formed at all. This showed that shading had significantly influenced the production of runners.
70

Distribution Patterns, Growth and Biomass Allocation Table 4: Effect of shading on vegetative growth, leaf area production and biomass allocation in C. ciliata (70th day harvest).
TLA Shade Plant Dry
Weight (g)
LWR RhWR RWR Level (g/g) (g/g) (g/g) (%)
RuWR (g/g)
SLA (cm2/g)
LAR (cm2/g)
0 1.412a 167c 0.584a 0.040a 0.304a 0.073a 50.998b 29.770b 50 0.780b 377a 0.589a 0.007a 0.354a 0.052a 139.525b 82.009b 75 0.191c 370b 0.795a 0.061a 0.210a 0.000b 536.020a 2815.385a
* Values sharing the same letter within column are not significantly different at 0.05 levels The SLA was highest at 75% shading (536.0 cm2/g), followed by 50%
shading (139.5 cm2/g) and 0% shading (50.9 cm2/g). Plants that were exposed to higher shade levels tend to show higher SLA. This is because, the plants grown under full shade formed a broader leaf area, as compared to plants exposed to sun light. Plants exposed to full sun light tended to form a narrower elliptic to linear leaf blade as observed in this study. The LAR was also highest at, 75% shading, followed by 50% and 0% with 2815.4 cm2/g, 82.0 cm2/g and 29.7 cm2/g, respectively. The LAR showed significant differences for plants grown under different shade levels. The higher the shade level, the plant tended to produce higher LAR. Overall through observations, the C. ciliata grew well at 50%, followed by 0% shading and lastly 75% shading.
Analysis of the component of dry matter production (DMP), NAR, leaf area duration (LAD) (Table 5) of C. ciliata at the three shade level indicated that the DMP and net assimilation rates NAR showed highest value at 0% shading with 0.9460 g and 0.000205 g/dm2/day, respectively. The LAD was highest at 50% with 8206.31 dm2/day. Table 5: Effect of shading on DMP, NAR and LAD of C. ciliata during 40th–70th day interval.
Shade (%)
DMP LAD NAR (g/dm2/day) (dm2/day) (g)
0% 0.9460a 0.000205a 4496.85c 50% 0.4749b 0.000071b 8206.31a 75% 0.0635c 0.000010c 6992.46b
* Values sharing the same letter within column are not significantly different at 0.05 levels DISCUSSION
The study conducted showed that C. ciliata could be found mostly growing in the inner tidal zones at the upper part of the river bank along Sungai Sarawak. The plants could be found submerged if the water level was high. Some of the plants were found growing with fully exposed to sun light, in a shaded and less shaded area. There were some locations in which the river bank was very steep. A few locations occured in a less muddy area, others in a coarse sand to gravel areas.
71
A Simon et al. Plants have the ability to adjust their morphological and physiological characters with respect to different environment surroundings (Filho 2000) and this is true since the plants growing along Sg. Sarawak were different in terms of size, color and appearance.
C. ciliata were able to grow well in areas which were less susceptible to strong water currents. It was observed that the morphological appearances of the plants were affected by the low and high tide of the river. Plants that were frequently exposed to the high tide were shorter and smaller in size (Point 17 and 18). The leaf blades were longer than the leaf petiole to reduce the water resistance. The plants had a narrow leaves that were linear to narrowly elliptic, sometimes falcate. However, plants that were less exposed to high tides were larger and taller in size. The leaves were also broader and bigger.
In areas where there was low-light abundance, the leaves were broader and bigger, and vice versa to those with high-light abundance. In terms of height, plants in shaded areas were taller as compared to plants which were fully exposed to light. The leaves were also very dark green (Point 6) in areas that were very shady. At this location, the plants were growing on top of a bank, underneath Sonneratia sp. The darker color indicates that more chlorophyll were present in the plant as the leaf chlorophyll levels were controlled by light (Alvarenga 2003). Under shady area, more cholorophyll was available to increase the photosynthetic rate (Alvarenga et al. 2003; Dasti et al. 2002; De Walt et al. 2004).
Along Sg. Sarawak, the populations of C. ciliata were found growing in patches. The population differs at each location; some were the least, sparse, dense and abundant. The populations of C. ciliata were found growing well at the middle part of the investigated river profile and towards the lower part (Barrage of Pending). This indicated that C. ciliata was not able to thrive well in the upper parts due to the strong water current. This was probably due to most of the uprivers areas were exposed to extensive soil erosion and sedimentations. The populations at the middle part of the river were more abundant and dense at Point 8 and Point 12 from a total of 22 points. The highest total number of plants per quadrate and total number of leaves per quadrate were found at Point 12. Through observations from the field, the plants at this location were produced many long runners where new plantlets arosed from the runners. This indicated that the plants had successfully produced more biomass to the rhizomes and roots. The rhizomes and roots were protected under the soil, and the runners situated in the soil surface act as an excellent reproductive mode. This is true since Point 12 and 8 had the highest biomass of rhizomes and root, respectively. A plant that produced more biomass to the roots and rhizomes enabled the plants to provide a strong anchorage to the ground preventing them from being washed away by the strong water current or high tide besides to continually reproduce to maintain their population. Overall, the highest dry weights were recorded for the leaves, followed by rhizomes, roots, runners and syncarp. The highest biomass partitioned to the plants differed at each location. Point 1, 4, 6, 7, 10, 11, 17, 20, 21 and 22 had the highest biomass partitioned to the leaves, followed by rhizomes, roots, runners and fruits, respectively. Point 2 and 13 had the highest biomass partitioned to the
72
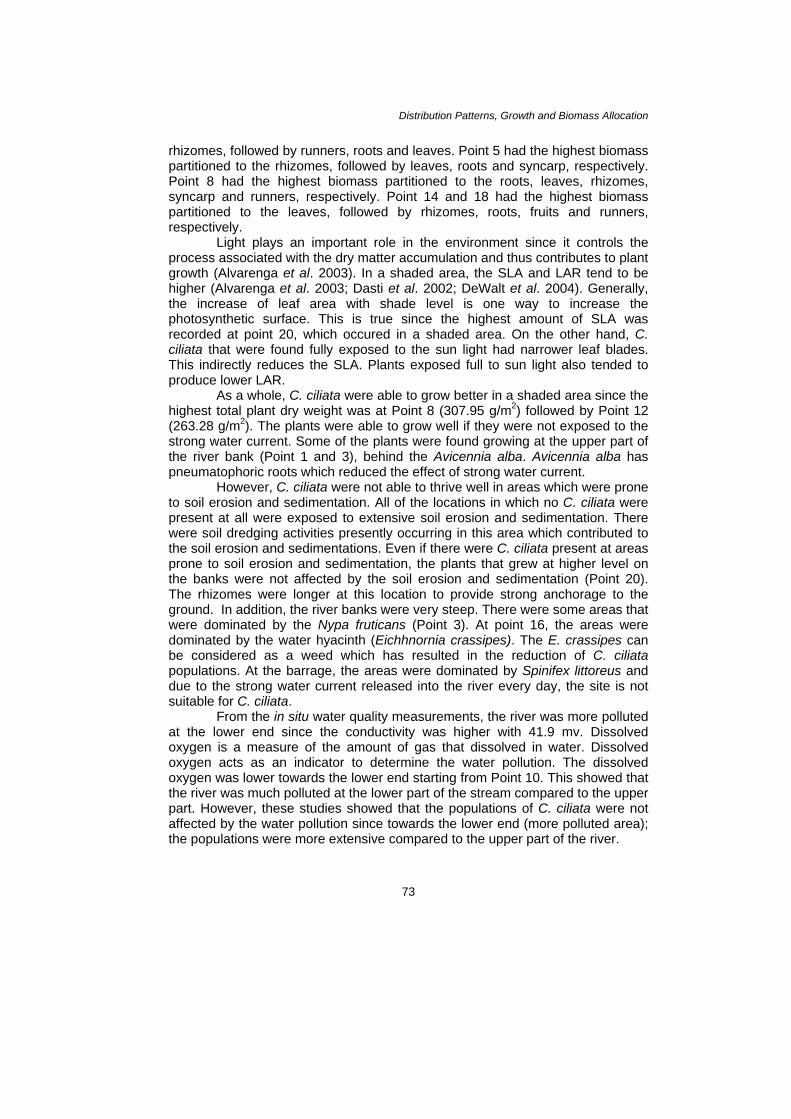
Distribution Patterns, Growth and Biomass Allocation rhizomes, followed by runners, roots and leaves. Point 5 had the highest biomass partitioned to the rhizomes, followed by leaves, roots and syncarp, respectively. Point 8 had the highest biomass partitioned to the roots, leaves, rhizomes, syncarp and runners, respectively. Point 14 and 18 had the highest biomass partitioned to the leaves, followed by rhizomes, roots, fruits and runners, respectively.
Light plays an important role in the environment since it controls the process associated with the dry matter accumulation and thus contributes to plant growth (Alvarenga et al. 2003). In a shaded area, the SLA and LAR tend to be higher (Alvarenga et al. 2003; Dasti et al. 2002; DeWalt et al. 2004). Generally, the increase of leaf area with shade level is one way to increase the photosynthetic surface. This is true since the highest amount of SLA was recorded at point 20, which occured in a shaded area. On the other hand, C. ciliata that were found fully exposed to the sun light had narrower leaf blades. This indirectly reduces the SLA. Plants exposed full to sun light also tended to produce lower LAR.
As a whole, C. ciliata were able to grow better in a shaded area since the highest total plant dry weight was at Point 8 (307.95 g/m2) followed by Point 12 (263.28 g/m2). The plants were able to grow well if they were not exposed to the strong water current. Some of the plants were found growing at the upper part of the river bank (Point 1 and 3), behind the Avicennia alba. Avicennia alba has pneumatophoric roots which reduced the effect of strong water current.
However, C. ciliata were not able to thrive well in areas which were prone to soil erosion and sedimentation. All of the locations in which no C. ciliata were present at all were exposed to extensive soil erosion and sedimentation. There were soil dredging activities presently occurring in this area which contributed to the soil erosion and sedimentations. Even if there were C. ciliata present at areas prone to soil erosion and sedimentation, the plants that grew at higher level on the banks were not affected by the soil erosion and sedimentation (Point 20). The rhizomes were longer at this location to provide strong anchorage to the ground. In addition, the river banks were very steep. There were some areas that were dominated by the Nypa fruticans (Point 3). At point 16, the areas were dominated by the water hyacinth (Eichhnornia crassipes). The E. crassipes can be considered as a weed which has resulted in the reduction of C. ciliata populations. At the barrage, the areas were dominated by Spinifex littoreus and due to the strong water current released into the river every day, the site is not suitable for C. ciliata.
From the in situ water quality measurements, the river was more polluted at the lower end since the conductivity was higher with 41.9 mv. Dissolved oxygen is a measure of the amount of gas that dissolved in water. Dissolved oxygen acts as an indicator to determine the water pollution. The dissolved oxygen was lower towards the lower end starting from Point 10. This showed that the river was much polluted at the lower part of the stream compared to the upper part. However, these studies showed that the populations of C. ciliata were not affected by the water pollution since towards the lower end (more polluted area); the populations were more extensive compared to the upper part of the river.
73

A Simon et al.
The water pH along Sungai Sarawak was in the range of 6.8 to 7.3. Point 6 had the lowest pH of 6.8 whereas Point 0 was neutral with 7.3. The water salinity showed that the lower part had a higher salinity than the upper part. Salinity is an important factor because this affects the aquatic plants and animals that were adapted to live in certain ranges of salinity. Salinity causes ionic imbalance and toxicity. Salinity reduces the substrate water potential, indirectly restricting water and nutrient uptake by plants (Houle et al. 2000). The highest salinity was recorded at the Barrage (Point 0) with 4.1o. Towards the upper stream, the salinity decreased and starting at point 24 upwards, the salinity was 0o. However, in this project study, the salinity does not seem to affect the distribution pattern of C. ciliata along Sungai Sarawak. The turbidity is a measurement to indicate how bad the river is polluted. The highest amounts of turbidity were recorded at point 15 with 85.5 NTU. At Point 15, the areas were prone to soil erosion and sedimentation which was one of the factors that increases the turbidity. Turbidity had also no effect on the population’s growth since the water was always moving. Generally, turbidity was higher towards the upper part compared to the lower ones. At the Point 28 (junction towards Sungai Sarawak Kiri and Sungai Sarawak Kanan) which was the reference, the turbidity was 29.8 NTU. This indicates that the area here was not so polluted compared to other points.
Water chemical analysis showed that there were no significant differences between chemical properties of the water and the occurrence of C. ciliata. There were a few points with population of C. ciliata which had high chemical contents and certain points with low chemical contents.
The soil pH was in the range of 2.8–5.7. Point 0 had the lowest pH of 2.8 and the highest was at Point 6 with a pH of 5.7. Here, we can conclude that a lower pH soil is not suitable for C. ciliata since no occurrence of C. ciliata were found at all at this area. The most suitable soil pH was around 4.5–5.4 since the plants were growing very well as observed in the field at this pH.
The growths of the plants were also affected by the nutrient availability in the soil. C. ciliata are able to grow well if sufficient nutrients are provided (Mulberg 1982; Jacobsen 1984). The higher amounts of N, Ca and Na were recorded the highest at point 12 with 0.25%, 10.49 cmolc/kg and 5.77 cmolc/kg, respectively. Through observation from the fields, the plants here were growing well and the population was more dense and abundant as compared to other locations. The rhizomes found recorded had the longest length compared to any other points. The amount of nitrogen available gave a great effect especially on the plant growth development. Nitrogen is required in large quantities for the synthesis of proteins, chlorophyll and enzymes. The lowest amounts of N was present at Point 20 (0.09%). As observed in the field, the plants here had the thinnest leaf petioles. The leaf blades were also very narrow. However the rhizomes were long and the roots were many and long. At Point 20, the area was prone to soil erosion and sedimentations which indirectly washed out the nutrients needed by the plants. From the water chemical analysis, this point recorded the third highest amount of N available in the water with 0.34%.
74

Distribution Patterns, Growth and Biomass Allocation
The highest amounts of C was detected at Point 3 (2.93%) and lowest at Point 20 (0.88%). As mentioned earlier, no C. ciliata was found at all at Point 3 due to the habitat conditions which were not suitable for the plant growth. This point was dominated by Nypa fruticans and had a very steep river bank. Point 20 also had the lowest amount of Mg and Na available in the soil. This has clearly proven that the soil erosion had caused the nutrients to be washed away into the water. From the nutrient analysis, the lower part of the stream (Point 0, 1, 3, 5, 6, 7 and 10) had more Mg, followed by Ca, Na and K. At the upper part of the stream including Point 8, more Ca was detected followed by Mg, Na and K (Point 10, 12, 14, 18, 18, 20, 22 and 28). This indicated that Ca is important after N and C since its function is for the cell wall component in terms of structure and permeability of the membranes as noted by Foth (1990). Mg had a similar function as N that is for constituent of chlorophyll and enzyme activator. Therefore, in areas where there is lack of N, Mg plays an important role in the plant growth.
The BS for every soil sample was higher than the CEC. The highest BS was recorded at Point 6 (128.59%) and lowest at Point 1 (33.85%). The highest CEC was recorded at Point 7 (25.00 cmolc/kg) and lowest at Point 20 (13.14 cmolc /kg). C. ciliata were able to grow well in higher amount of coarse, silt, clay and fine soil.
One interesting finding during the growth development period was a few of the plants died at 50% shading due to being completely submerged. Mühlberg (1982) reported that the plant grows slowly when submerged. This result indicates that young seedlings of C. ciliata were not able to survive if completely submerged. Jacobsen (2005) reported a locality for C. ciliata var. ciliata in Southern Thailand where continuously submerged specimens were small compared to the large specimens on the banks of the same small stream.
From the plant height measurements, result showed that plants grown under 50% shade were very healthy and developed well. Even though the height of the plants was the lowest from week 0–8, however, on the week 10, the plants under 50% shade level were the tallest. This indicates that C. ciliata needs moderate light in order to grow well. The leaf blades were broad to narrowly elliptic at 50% shading. At 0% shade level, the plants had the lightest green colored leaves. This indicates that the plants lacked of chlorophyll. The plants were not very healthy because of the presence of chlorosis signs on the leaves that were burned due to being fully exposed to the sunlight. The leaf blades were narrow compared to other shadings. At 75% shading, though the plants were the tallest at week 0–4, the plant height developed slower starting from week 6 onwards. On the 10th week, the plants were the shortest. The plants here had the broadest leaves and were the darkest in color. This indicates that at young stage, C. ciliata needs moderate light in order to grow well and that shading gives significant impact of the plant height development. However, under natural conditions C. ciliata leaves are normally covered with thin layer of silt deposited by the muddy tidal water. he likely protection effect of this silt cover was not included in the shade/sun cultivation experiments.
75

A Simon et al. There was no significant difference among all the treatment in term of the development of leaves. The numbers of leaves were recorded the highest at a 50% shade level, followed by 0% and 75% shading, respectively. This showed that the plants were able to grow well at a 50% shade level.
Based on our experiment, the water temperatures recorded along sungai Sarawak was in the range of 28.1oC–32.1oC and the water temperatures recorded in the greenhouse was in the range of 26oC–32oC from all different shadings. This indicated that C. ciliata were able to tolerate with these temperatures.
The relative humidity was in the range of 55.6%–91.1% from all shadings. The air temperatures were 22.1oC–34.6oC from all shadings. The light intensity was the highest at 0% shading followed by 50% and 75% shading respectively. The soil pH recorded along Sungai Sarawak was in the range of 4.5–5.7 whereas the ones taken from the greehouse was in the range of 4.6–5.5 as an overall from every shadings. This showed that the plants were able to grow well with lower pH conditions. In the green house, the soils became more acidic due to growth activity. The respiration of roots and other organisms contribute to the acidity of the soils (Foth 1990).
Along Sungai Sarawak, most of the plants were well-developed in shaded area. In the experiment conducted in the greenhouse at FRST, UNIMAS, the plants were developing well at 50% shading. From here, we can conclude that C. ciliata were able to thrive well if not exposed fully to sun light that is with moderate light intensity. Therefore the suitable environment condition for the plant growth is at 50% shade level with water temperature at 26oC–32oC, where as the air temperature at 22.1oC –31.1oC, relative humidity at 65.7%–91.1%, light intensity at 190–950 μmol m-2 sec-1 and soil pH at 4.8–8.5.
In the experiment conducted in the greenhouse under the different shading regimes, the plants showed higher accumulation in the RWR and LWR if exposed to lower light intensity. Low light availability leads to the reduction in biomass allocation to RWR but an increase in the LWR (Dasti et al. 2002). The 0% shading has the highest amount of RWR, followed by 50% shading and 75% shading. The plants under 0% shading had the narrowest leaf blade but those in 75% had the broadest leaf blade. Shading showed significant difference in the SLA and LAR. The 75% shading accumulated the highest amount for both of SLA and LAR, followed by 50% shading and 0% shading respectively. Shading also had a significant impact on the development of runners. This is because runners were only formed at 0% and 50% shade level. However, biomass study indicated that there was a significant result from both study sites.
CONCLUSION
The distribution and occurrence of C. ciliata along Sungai Sarawak clearly showed that the environmental factors played a major role in determining the population of the plant. C. ciliata were able to adapt to the different environmental conditions such as temperature, pH, light, salinity and the nutrient availability of
76

Distribution Patterns, Growth and Biomass Allocation the soil. The morphological variations of C. ciliata along Sungai Sarawak also indicated that the C. ciliata had to adapt to the environmental surroundings in order to maintain its population. The tide system of the Sungai Sarawak also affects the distribution of the plants. C. ciliata are not able to withstand strong water current.
The rapid developments and activities such as sand dredging have caused problems to the riverine ecosystem that eventually leads to soil erosion and sedimentation. This has indirectly affected the population of C. ciliata since this plant is very sensitive to slight changes in the environment surroundings. From this study, it can be concluded that C. ciliata can act as an indicator in determining how bad the soil erosion and sedimentation are along Sungai Sarawak. Further studies should therefore be conducted to understand more of the plants especially on the growth and development of C. ciliata. The studies of nutrient uptake of C. ciliata along Sungai Sarawak should also be conducted to determine the most important nutrient that affects the plant growth. Further monitoring should also be conducted to observe and study the adaptations of C. ciliata along Sungai Sarawak. This study only included the diploid of C. ciliata var. ciliata, and it could be interesting to compare it to the triploid C. ciliata var. latifolia.
ACKNOWLEDGEMENTS
The authors would like to thank Professor Niels Jacobsen who kindly spared his time for his suggestions and comments. Special appreciation also goes to Joseph Pao for the botanical illustration and utmost appreciation to James Abai, Mohd. Rizan Abdullah, Norhasmah Saufi and Karni Taha for their assistance.
REFERENCES
Anon (1980). Malaysian Standard MS 678 Part I to V. Recommended Methods for Soil Chemical Analysis (Part I to V).
Alvarenga A A, de Castro E M, Junior E C L and Magalhaes M M. (2003). Effects of different light levels on the initial growth and photosynthesis of Croton urucurana Baill. in Southeastern Brazil. R. Árvore, Viçosa-MG, 27(1): 53–57.
Bastmeijer J D. (2006). The crypts. http://132.229.93.11/Cryptocoryne/index.htm1.
Beitz J A. (1974). Micro-Kjedahl digestion by an improved automated ammonia determination following manual digestion. Analytical Chemistry 46: 1617–1618.
Dasti A A, Fatime K and Malik S A. (2002). How photoperiod affects growth rate and biomass allocation pattern: A comparative study on three genotypes of Arabidopsis thaliana. Asian J. of Plant Sci. 1(2): 176–179.
77
A Simon et al. DeWalt S J, Denslow J S and Hamrick J L. (2004). Biomass allocation, growth, and
photosynthesis of genotypes from native and introduced ranges of the tropical shrub Clidemia hirta. Oecologia 138: 521–531.
Dewis J and Freitesf. (1970). Physical and chemical methods of soil and water analysis. Soil Bull. 10: 73–77.
Filho M B D. (2000). Growth and biomass allocation of the C4 grasses Brachiaria brizantha and B. humidicola under shade. Pesq. Agropec. Bras., 35(12): 2335–2341.
Foth H D. (1990). Fundamentals of soil science. New York : John Wiley & Sons.
Hay A, Boyce P C, Hetterscheid W L A, Jacobsen N, Murata J and Bogner J. (1995). Checklist of the Araceae of Malesia, Australia and the Tropical Western Pacific Region. Blumea Suppl. 8: 1–161.
Hesse P R. (1979). A textbook of soil chemical analysis. London: John Murray, 204–252.
Holttum R E. (1969). Plants in Malaysia. London: Longman Group Limited.
Houle G, Morel L, Reynolds C E and Siégel J. (2000). The effect of salinity on different developmental stages of an endemic annual plant, Aster laurentianus (Asteraceae). Amer. J. of Bot. 88: 62–67.
Jacobsen N. (1976). Notes on Cryptocoryne of Sri Lanka (Ceylon). Bot. Notiser 129: 179–190.
________. (1984). Cryptocoryne. In S M Wallters et al. (eds.). The European garden flora, Vol. 2. UK: Cambridge University Press, 110–112.
________. (1985). The Cryptocoryne (Araceae) of Borneo. Nord. J. Bot. 5: 31–50.
________. (2005). Tha Pom Keong Song Nam – aussergeuröhlirher Fundort van Cryptocoryne ciliata (Roxb.) Schott in Südthailand. Aqua Planta 30: 58–64.
Mühlberg H. (1982). The complete guide to water plants. Germany: EP Publishing Limited.
Mansor K and Masnadi M. (1994). Cryptocoryne elliptica: An endangered amphibious plant in Pondok Tanjung Forest Reserve, Peninsular Malaysia. Aquatic Botany 47: 91–96.
McLean E O. (1986). Soil pH and lime requirement. In A L Page et al. (eds.). Method of soil analysis, Part 2. 2nd ed. Madison: Am. Soc. of Agronomy, 199–208.
Patterson D T. (1980). Shading effect on growth and partitioning of plant biomass on Cogon Grass (Imperata cylindrical) from shaded and exposed habitat. Weed Sci. 28: 735–740.
Peterson D T and Flint E P. (1983). Comparative water relation photosynthesis and growth of Soybean (Glycine max) and seven associated weeds. Weed Sci. 31: 318–322.
78

Distribution Patterns, Growth and Biomass Allocation Polunin I. (1992). Plants and flowers of Malaysia. Times Edition, Malaysia.
Rataj K. (1975). Revision of the genus Cryptocoryne Fischer. Studie CSAV, c 3. Praha.
Sulaiman B and Mansor M. (1998). Endemic riverine Araceae of Peninsular Malaysia. In L L G Saw, L S L Chua and K C Khoo (eds.). Taxonomy: The cornerstone of biodiversity. Proceedings of the Fourth International Flora Malesiana Symposium 1998, Forest Research Institute Malaysia, 279–288.
79