distribution of opportunities in tertiary education in ...web.usm.my/apjee/jpp_08_1986/jilid 08...
TRANSCRIPT
PENDIDIK DAN PENDIDIKAN Jld. 8, 1986
Distribution of opportunities in tertiary education in Malaysia: A review of the fifth Malaysia Plan.
R. Karthigesu Pusat Pengajian Ilmu Kemanusiaan Universiti Sains Malaysia
Sejak Dasar Ekonomi Baru (DEB) dilancarkan di Malaysia, peluang untuk pelajar-pelajar tempatan untuk mendapat pelajaran tinggi telah diperluaskan dengan hebatnya. Pelajar-pelajar bumiputera khususnya telah mendapat peluang yang banyak sekali dan ini adalah selaras dengan objektif-objektif · DEB. Jelaslah bahawa dalam usaha membahagikan semula peluang-peluang yang ada itu supaya semua kaum di negara ini dapat menikmati faedahnya dengan saksama, pihak kerajaan telah campurtangan dalam proses pengambilan pelajar ke institusi-institusi pelajaran tinggi dalam negeri. Polisi ini telah menghasilkan faedah yang banyak tetapi belum berjaya dengan penuh. Hampir 1/3 daripada semua pelajar yang berdaftar dalam kursus-kursus ijazah masih lagj terpaksa mendapat pendidikannya daripada institusi-institusi luar negeri juga. Lebih daripada 50% pelajar kaum Cina dan kaum India terpaksa mendapat pendidikan tinggi mereka dari luar negeri.
Pertimbangan harus juga diberikan kepada soalan apakah akibatnya polisi campurtangan ini dari segj mutu pelajaran yang dapat dicapai oleh institusi-institusi pelajaran tinggi kita. Satu analisis graduangraduan yang telah keluar dari universiti-universiti tempatan pada tahun 1986 dari segj etnik, menunjukkan sebilangan besar pelajar bumiputera telah dapat ijazah-ijazah peringkat rendah sahaja. Perkara ini haruslah dikaji dengan mendalam dan di perbaiki. DEB harus juga memberi pertimbangan kepada kecemerlangan pelajar di samping memberi kepentingan kepada penyusunan semula peluang-peluang pelajaran tinggi.
In a fast developing country like Malaysia, which is well endowed with resources to achieve a good level of socio-economic development, it is fitting that government planners should think and plan for both material development and the equitable distribution of its benefits. The Fifth Malaysian Plan (1985:5) states: "One of the multificated approaches towards building national unity was the creation of a socio-economic environment that would allow a viable and equiptable participation of all races in the development process. In this regard the NEP (New Economic Policy) represents one of the instruments towards forging national unity and integration through poverty eradication and the restructuring of society".
The Fifth Malaysia Plan, in advancing the policies of the NEP to a further five year period, rightly accords a pre-eminent position to education and stresses that it will "continue to be an important means of promoting national unity among the young, irrespective of ethnic origin and cultural background (Ibid). However in achieving that aim the plan inevitably apportions the available and created opportunities on the basis of ethnic origin following its pattern in other aspects of socio-economic development. As such this paper examines the distribution of educational opportunities in tertiary education to the major component races of Malaysia as enumerated in the Fifth Malaysia Plan, provides interpretation to some of its strengths and highlights some of its and weaknesses. Although tertiary education is its general thrust, particular attention is focussed on degree level education.
Achievement in Tertiary Education Under NEP
Educational development in Malaysia should recieve equal attention with economic development in order that the citizens qualify themselves equitably to benefit from the economic opportunities generated by the NEP. The one fact that had been of great concern to the plan-
Distribution of opportunities in tertiary education in Malaysia: A review of the fifth Malaysia Plan 35
ners of the NEP from the time the plan was conceived was the wide gap that existed between the bumiputeras and the non-bumiputeras in educational opportunities at tertiary level. Since acquisition of tertiary educational determines the access the respective communities would have into the higher levels of employment in the technical and professional fields, an earnest thrust was made to increase the opportunities of bumiputeras in tertiary education, both at post-secondary and degree levels.
Considering that to increase the enrolment of bumiputeras at tertiary level, their participation and perfomance had to be strengthened at a very wide base of primary, secondary and post-secondary levels, what had been achieved from 1966 to 1985 can be said be remarkble.
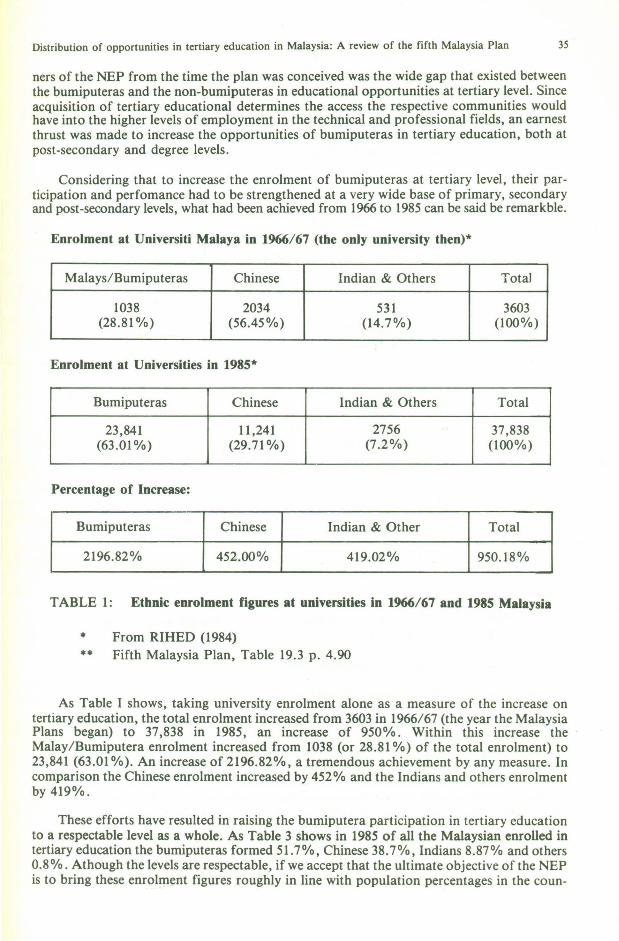
Enrolment at Universiti Malaya in 1966/67 (the only university then)*
Malays/Bumiputeras Chinese Indian & Others Total
1038 2034 531 3603 (28.81 %) (56.45%) (14.7%) (100%)
Enrolment at Universities in 1985*
Bumiputeras Chinese Indian & Others Total
23,841 11,241 2756 37,838 (63.01 %) (29.71 %) (7.2%) (100%)
Percentage of Increase:
Bumiputeras Chinese Indian & Other Total
2196.82% 452.00% 419.02% 950.18%
TABLE 1: Ethnic enrolment figures at universities in 1966/67 and 1985 Malaysia
• From RIHED (1984) •• Fifth Malaysia Plan, Table 19.3 p. 4.90
As Table I shows, taking university enrolment alone as a measure of the increase on tertiary education, the total enrolment increased from 3603 in 1966/67 (the year the Malaysia Plans began) to 37,838 in 1985, an increase of 950%. Within this increase the Malay/Bumiputera enrolment increased from 1038 (or 28.81 %) of the total enrolment) to 23,841 (63.01 %). An increase of 2196.82%, a tremendous achievement by any measure. In comparison the Chinese enrolment increased by 452% and the Indians and others enrolment by419%.
These efforts have resulted in raising the bumiputera participation in tertiary education to a respectable level as a whole. As Table 3 shows in 1985 of all the Malaysian enrolled in tertiary education the bumiputeras formed 51.7%, Chinese 38.7%, Indians 8.87% and others 0.8%. Athough the levels are respectable, if we accept that the ultimate objective of the NEP is to bring these enrolment figures roughly in line with population percentages in the coun-
36 R. Karthigesu
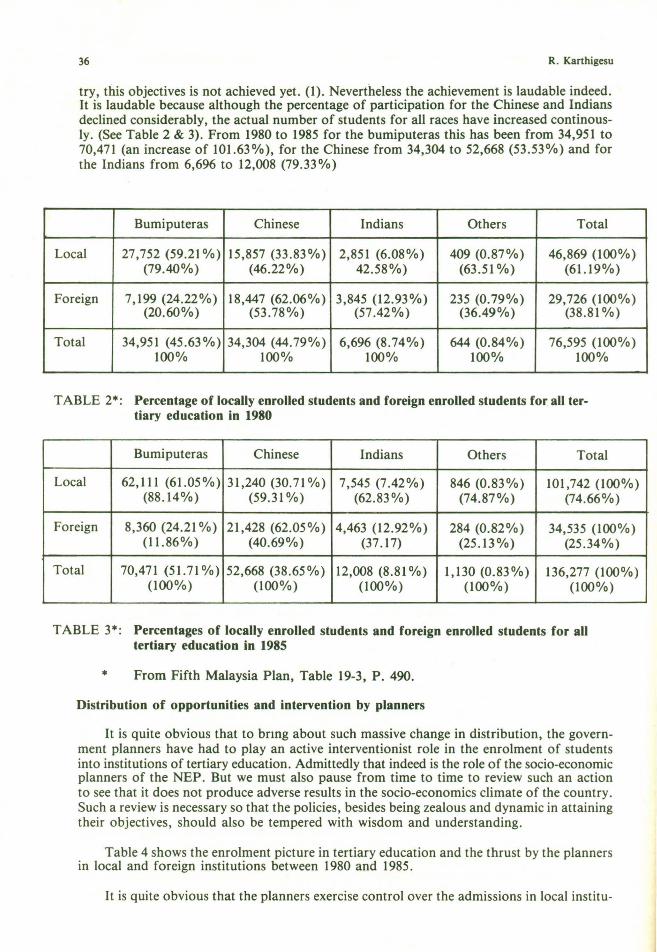
try, this objectives is not achieved yet. (1). Nevertheless the achievement is laudable indeed. It is laudable because although the percentage of participation for the Chinese and Indians declined considerably, the actual number of students for all races have increased continously. (See Table 2 & 3). From 1980 to 1985 for the bumiputeras this has been from 34,951 to 70,471 (an increase of 101.63%), for the Chinese from 34,304 to 52,668 (53.53%) and for the Indians from 6,696 to 12,008 (79.33%)
Bumiputeras Chinese Indians Others Total
Local 27,752 (59.21 %) 15,857 (33 .83%) 2,851 (6.08%) 409 (0.87%) 46,869 (100%) (79.40%) (46.22%) 42.58%) (63.51 %) (61.19%)
Foreign 7,199 (24.22%) 18,447 (62.06%) 3,845 (12.93%) 235 (0.79%) 29,726 (100%) (20.60%) (53.78%) (57.42%) (36.49%) (38.81 %)
Total 34,951 (45.63%) 34,304 (44. 79%) 6,696 (8.74%) 644 (0.84%) 76,595 (100%) 100% 100% 100% 100% 100%
TABLE 2 • : Percentage of locally enrolled students and foreign enrolled students for all tertiary education in 1980
Bumiputeras Chinese Indians Others Total
Local 62,111 (61.05%) 31,240 (30.71 %) 7,545 (7.42%) 846 (0.83%) 101,742 (100%) (88.14%) (59.31 %) (62.83%) (74.87%) (74.66%)
Foreign 8,360 (24.21 %) 21,428 (62.05%) 4,463 (12.92%) 284 (0.82%) 34,535 (100%) (11.86%) (40.69%) (37 .17) (25.13%) (25.34%)
Total 70,471 (51.71 %) 52,668 (38.65%) 12,008 (8.81 %) 1,130 (0.83%) 136,277 (100%) (100%) (100%) (100%) (100%) (100%)
TABLE 3*: Percentages of locally enrolled students and foreign enrolled students for all tertiary education in 1985
• From Fifth Malaysia Plan, Table 19-3, P. 490 .
Distribution of opportunities and intervention by planners
It is quite obvious that to bnng about such massive change in distribution, the government planners have had to play an active interventionist role in the enrolment of students into institutions of tertiary education. Admittedly that indeed is the role of the socio-economic planners of the NEP. But we must also pause from time to time to review such an action to see that it does not produce adverse results in the socio-economics climate of the country. Such a review is necessary so that the policies, besides being zealous and dynamic in attaining their objectives, should also be tempered with wisdom and understanding.
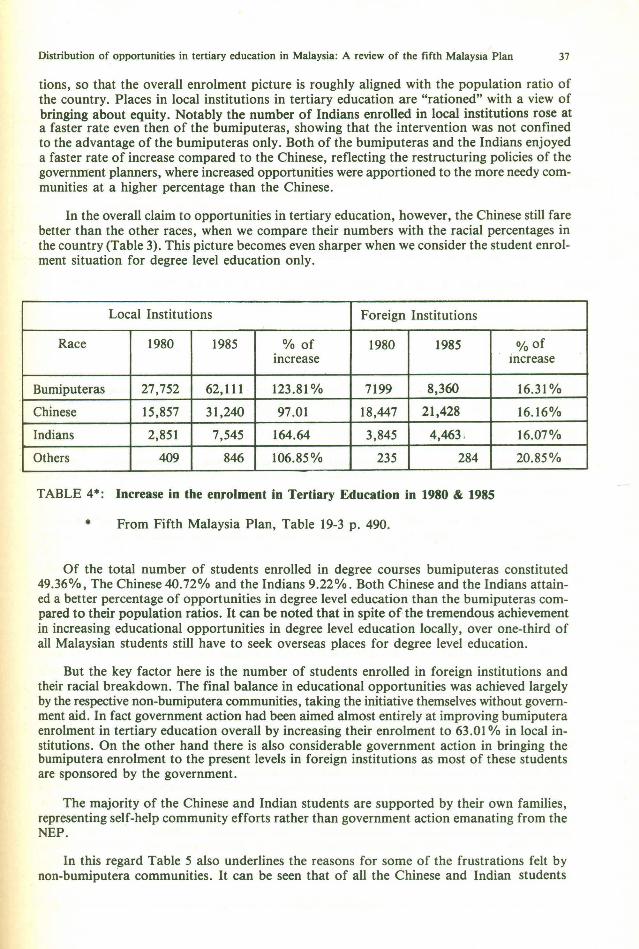
Table 4 shows the enrolment picture in tertiary education and the thrust by the planners in local and foreign institutions between 1980 and 1985.
It is quite obvious that the planners exercise control over the admissions in local institu-
Distribution of opportunities in tertiary education in Malaysia: A review of the fifth Malaysia Plan 37
tions, so that the overall enrolment picture is roughly aligned with the population ratio of the country. Places in local institutions in tertiary education are "rationed" with a view of bringing about equity. Notably the number of Indians enrolled in local institutions rose at a faster rate even then of the bumiputeras, showing that the intervention was not confined to the advantage of the bumiputeras only. Both of the bumiputeras and the Indians enjoyed a faster rate of increase compared to the Chinese, reflecting the restructuring policies of the government planners, where increased opportunities were apportioned to the more needy communities at a higher percentage than the Chinese.
In the overall claim to opportunities in tertiary education, however, the Chinese still fare better than the other races, when we compare their numbers with the racial percentages in the country (Table 3). This picture becomes even sharper when we consider the student enrolment situation for degree level education only.
Local Institutions Foreign Institutions
Race 1980 1985 % of 1980 1985 %Of increase increase
Bumiputeras 27,752 62,111 123.81% 7199 8,360 16.31%
Chinese 15,857 31,240 97.01 18,447 21,428 16.16%
Indians 2,851 7,545 164.64 3,845 4,463 , 16.07%
Others 409 846 106.85% 235 284 20.85%
TABLE 4*: Increase in the enrolment in Tertiary Education in 1980 & 1985
• From Fifth Malaysia Plan, Table 19-3 p. 490 .
Of the total number of students enrolled in degree courses bumiputeras constituted 49.36%, The Chinese 40.72% and the Indians 9.22%. Both Chinese and the Indians attained a better percentage of opportunities in degree level education than the bumiputeras compared to their population ratios. It can be noted that in spite of the tremendous achievement in increasing educational opportunities in degree level education locally, over one-third of all Malaysian students still have to seek overseas places for degree level education.
But the key factor here is the number of students enrolled in foreign institutions and their racial breakdown. The final balance in educational opportunities was achieved largely by the respective non-bumiputera communities, taking the initiative themselves without government aid. In fact government action had been aimed almost entirely at improving bumiputera enrolment in tertiary education overall by increasing their enrolment to 63 .01% in local institutions. On the other hand there is also considerable government action in bringing the bumiputera enrolment to the present levels in foreign institutions as most of these students are sponsored by the government.
The majority of the Chinese and Indian students are supported by their own families, representing self-help community efforts rather than government action emanating from the NEP.
In this regard Table 5 also underlines the reasons for some of the frustrations felt by non-bumiputera communities. It can be seen that of all the Chinese and Indian students
38 R. Karthigesu
Bumiputeras Chinese Indians Others Total
Local 23,84I (63.0I %) II ,24I (29.7I %) 2,473 (6.54%) 283 (0.75%) 7.838 (IOO%) (79.80%) (45.61 %) (44.3I %) (67.54%) (62.52%)
Foreign 6,034 (26.60%) 13,406 (59.10%) 3,108 (13.70%) I36 (0.60%) 22,684(100%) (20.20%) (54.39%) (55.69%) (32.46%) (37.48%)
Total 29,875 (49.36%) 24,647 (40.72%) 5,58I (9.22%) 4I9 (0.69%) 60,522 (IOO%) (IOO%) (IOO%) (100%) (IOO%) (IOO%)
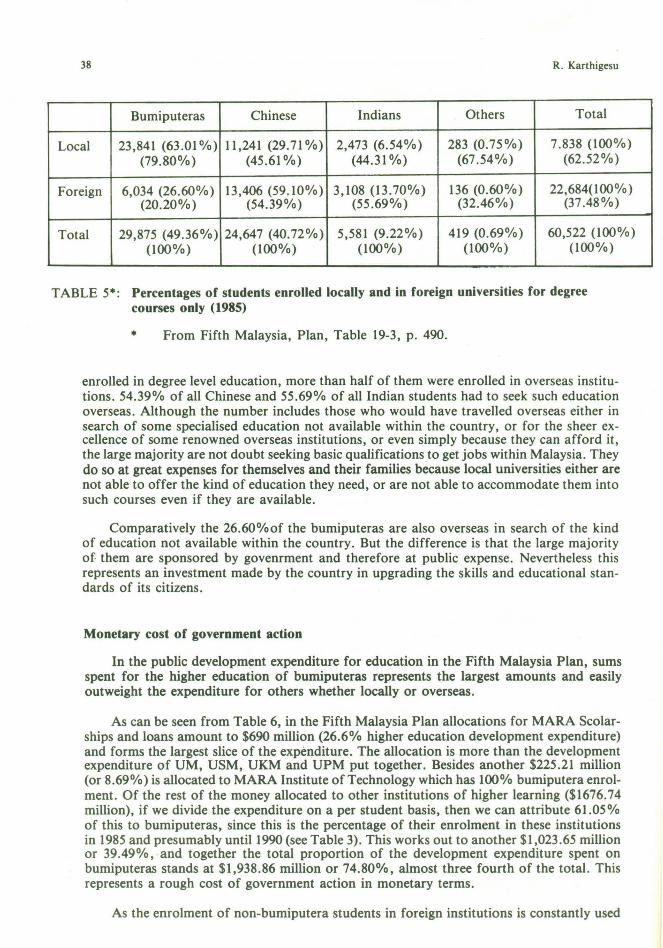
TABLE 5* : Percentages of students enrolled locally and in foreign universities for degree courses only (1985)
• From Fifth Malaysia, Plan, Table I9-3, p. 490 .
enrolled in degree level education, more than half of them were enrolled in overseas institutions. 54.39% of all Chinese and 55.69% of all Indian students had to seek such education overseas. Although the number includes those who would have travelled overseas either in search of some specialised education not available within the country, or for the sheer excellence of some renowned overseas institutions, or even simply because they can afford it, the large majority are not doubt seeking basic qualifications to get jobs within Malaysia. They do so at great expenses for themselves and their families because local universities either are not able to offer the kind of education they need, or are not able to accommodate them into such courses even if they are available.
Comparatively the 26.60%of the bumiputeras are also overseas in search of the kind of education not available within the country. But the difference is that the large majority of them are sponsored by govenrment and therefore at public expense. Nevertheless this represents an investment made by the country in upgrading the skills and educational standards of its citizens.
Monetary cost of government action
In the public development expenditure for education in the Fifth Malaysia Plan, sums spent for the higher education of burniputeras represents the largest amounts and easily outweight the expenditure for others whether locally or overseas.
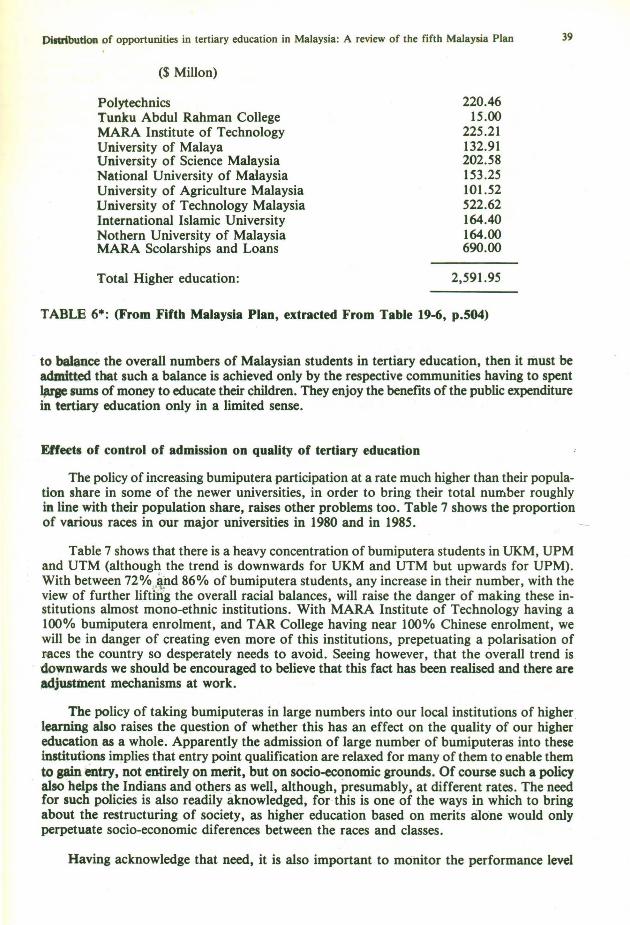
As can be seen from Table 6, in the Fifth Malaysia Plan allocations for MARA Scalarships and loans amount to $690 million (26.6% higher education development expenditure) and forms the largest slice of the expenditure. The allocation is more than the development expenditure of UM, USM, UKM and UPM put together. Besides another $225.2I million (or 8.69%) is allocated to MARA Institute of Technology which has IOO% bumiputera enrolment. Of the rest of the money allocated to other institutions of higher learning ($1676.74 million}, if we divide the expenditure on a per student basis, then we can attribute 61.05% of this to bumiputeras, since this is the percentage of their enrolment in these institutions in I985 and presumably untili990 (see Table 3). This works out to another $1,023.65 million or 39.49%, and together the total proportion of the development expenditure spent on burniputeras stands at $I ,938.86 million or 74.80%, almost three fourth of the total. This represents a rough cost of government action in monetary terms.
As the enrolment of non-burniputera students in foreign institutions is constantly used
Pinribution of opportunities in tertiary education in Malaysia: A review of the fifth Malaysia Plan 39
($Millon)
Polytechnics Tunku Abdul Rahman College MARA Institute of Technology University of Malaya University of Science Malaysia National University of Mcdaysia University of Agriculture Malaysia University of Technology Malaysia International Islamic University Nothern University of Malaysia MARA Scolarships and Loans
Total Higher education:
220.46 15.00
225.21 132.91 202.58 153.25 101.52 522.62 164.40 164.00 690.00
2,591.95
TABLE 6*: (From Fifth Malaysia Plan, extracted From Table 19-6, p.504)
· to balance the overall numbers of Malaysian students in tertiary education, then it must be admitted that such a balance is achieved only by the respective communities having to spent !,use sums of money to educate their children. They enjoy the benefits of the public expenditure in tertiary education only in a limited sense.
Elfects of control of admission on quality of tertiary education
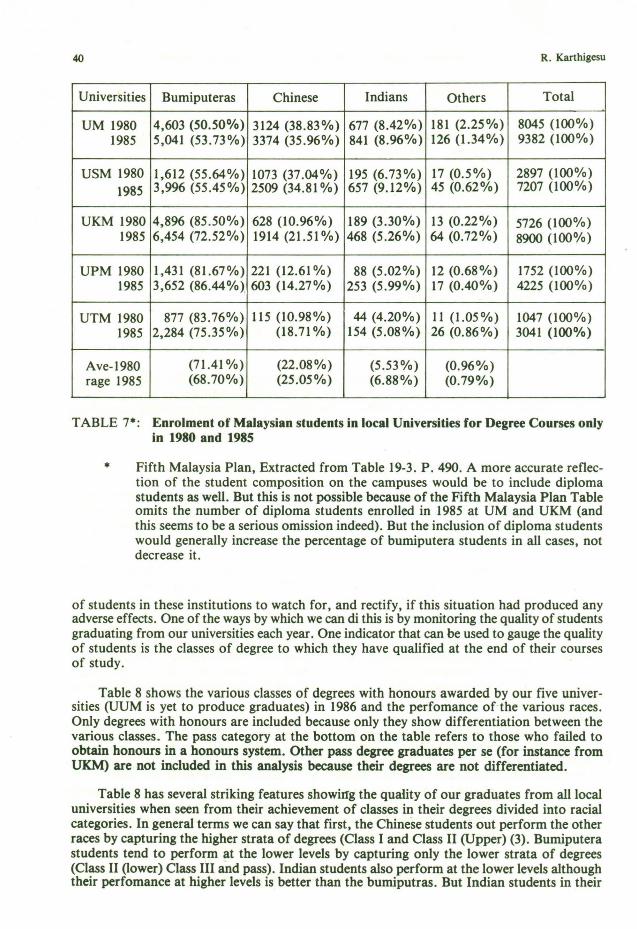
The policy of increasing bumiputera participation at a rate much higher than their population share in some of the newer universities, in order to bring their total number roughly in line with their population share, raises other problems too. Table 7 shows the proportion of various races in our major universities in 1980 and in 1985.
Table 7 shows that there is a heavy concentration of bumiputera students in UKM, UPM and UTM (although the trend is downwards for UKM and UTM but upwards for UPM). With between 72 o/o ,.~:Od 86% of bumiputera students, any increase in their number, with the view of further lifting the overall racial balances, will raise the danger of making these institutions almost mono-ethnic institutions. With MARA Institute of Technology having a 100% bumiputera enrolment, and TAR College having near 100% Chinese enrolment, we will be in danger of creating even more of this institutions, prepetuating a polarisation of r-aces the country so desperately needs to avoid. Seeing however, that the overall trend is
· downwards we should be encouraged to believe that this fact has been realised and there are ~juatinent mechanisms at work.
The policy of taking bumiputeras in large numbers into our local institutions of higher learning also raises the question of whether this has an effect on the quality of our higher education as a whole. Apparently the admission of large number of bumiputeras into these institutions implies that entry point qualification are relaxed for many of them to enable them to gain entry, not entirely on merit, but on socio-economic grounds. Of course such a policy also helps the Indians and others as well, although, presumably, at different rates. The need for such policies is also readily aknowledged, for this is one of the ways in which to bring about the restructuring of society, as higher education based on merits alone would only perpetuate socio-economic diferences between the races and classes.
Having acknowledge that need, it is also important to monitor the performance level
40 R. Karthigesu
Universities Bumiputeras Chinese Indians Others Total
UM 1980 4,603 (50.50%) 3124 (38.83%) 677 (8.42%) 181 (2.25%) 8045 (100%) 1985 5,041 (53.73%) 3374 (35.96%) 841 (8.96%) 126 (1.34%) 9382 (100%)
USM 1980 1,612 (55.64%) 1073 (37.04%) 195 (6.73%) 17 (0.5%) 2897 (100%) 1985 3,996 (55.45%) 2509 (34.81 %) 657 (9.12%) 45 (0.62%) 7207 (100%)
UKM 1980 4,896 (85.50%) 628 (10.96%) 189 (3.30%) 13 (0.22%) 5726 (100%) 1985 6,454 (72.52%) 1914 (21.51 %) 468 (5.26%) 64 (0.72%) 8900 (100%)
UPM 1980 1,431 (81.67%) 221 (12.61 %) 88 (5.02%) 12 (0.68%) 1752 (100%) 1985 3,652 (86.44%), 603 (14.27%) 253 (5.99%) 17 (0.40%) 4225 (100%)
UTM 1980 877 (83.76%) 115 (10.98%) 44 (4.20%) 11 (1.05%) 1047 (100%) 1985 2,284 (75.35%) (18.71 %) 154 (5.08%) 26 (0.86%) 3041 (100%)
Ave-1980 (71.41%) (22.08%) (5.53%) (0.96%) rage 1985 (68.70%) (25.05%) (6.88%) (0.79%)
TABLE 7*: Enrolment of Malaysian students in local Universities for Degree Courses only in 1980 and 1985
• Fifth Malaysia Plan, Extracted from Table 19-3. P. 490. A more accurate reflection of the student composition on the campuses would be to include diploma students as well. But this is not possible because of the Fifth Malaysia Plan Table omits the number of diploma students enrolled in 1985 at UM and UKM (and this seems to be a serious omission indeed). But the inclusion of diploma students would generally increase the percentage of bumiputera students in all cases, not decrease it.
of students in these institutions to watch for, and rectify, if this situation had produced any adverse effects. One of the ways by which we can di this is by monitoring the quality of students graduating from our universities each year. One indicator that can be used to gauge the quality of students is the classes of degree to which they have qualified at the end of their courses of study.
Table 8 shows the various classes of degrees with honours awarded by our five universities (UUM is yet to produce graduates) in 1986 and the perfomance ofthe various races. Only degrees with honours are included because only they show differentiation between the various classes. The pass category at the bottom on the table refers to those who failed to obtain honours in a honours system. Other pass degree graduates per se (for instance from UKM) are not included in this analysis because their degrees are not differentiated.
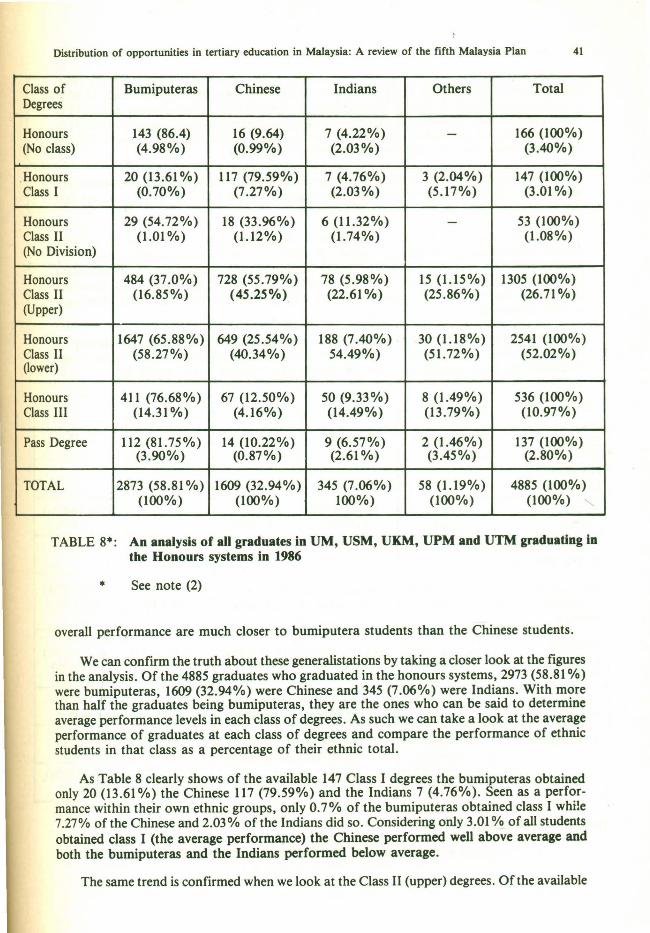
Table 8 has several striking features showirrg the quality of our graduates from all local universities when seen from their achievement of classes in their degrees divided into racial categories. In general terms we can say that first, the Chinese students out perform the other races by capturing the higher strata of degrees (Class I and Class II (Upper) (3). Bumiputera students tend to perform at the lower levels by capturing only the lower strata of degrees (Class II (lower) Class III and pass). Indian students also perform at the lower levels although their perfomance at higher levels is better than the bumiputras. But Indian students in their
Distribution of opportunities in tertiary education in Malaysia: A review of the fifth Malaysia Plan 41
Class of Bumiputeras Chinese Indians Others Total Degrees
Honours 143 (86.4) 16 (9.64) 7 (4.22%) - 166 (100%) (No class) (4.98%) (0.99%) (2.03%) (3.40%)
.Honours 20 (13.61 %) 117 (79.59%) 7 (4.76%) 3 (2.04%) 147 (100%) Class I (0.70%) (7.27%) (2.03%) (5.17%) (3.01 %)
Honours 29 (54.72%) 18 (33.96%) 6 (11.32%) - 53 (100%) Class II (1.01 %) (1.12%) (1.74%) (1.08%) (No Division)
Honours 484 (37.0%) 728 (55.79%) 78 (5.98%) 15 (1.15%) 1305 (100%) Class II (16.85%) (45.25%) (22.61 %) (25.86%) (26.71 %) (Upper)
Honours 1647 (65.88%) 649 (25.54%) 188 (7.40%) 30 (1.18%) 2541 (100%) Class II (58.27%) (40.34%) 54.49%) (51.72%) (52.02%) (lower)
Honours 411 (76.68%) 67 (12.50%) 50 (9.33%) 8 (1.49%) 536 (100%) Class III (14.31 %) (4.16%) (14.49%) (13.79%) (10.97%)
Pass Degree 112 (81.75%) 14 (10.22%) 9 (6.57%) 2 (1.46%) 137 (100%) (3.90%) (0.87%) (2.61 %) (3 .45%) (2.80%)
TOTAL 2873 (58.81 %) 1609 (32.94%) 345 (7.06%) 58 (1.19%) 4885 (100%) (100%) (100%) 100%) (100%) (100%)
""" TABLE 8*: An analysis of all graduates in UM, USM, UKM, UPM and UTM graduating in
the Honours systems in 1986
• See note (2)
overall performance are much closer to bumiputera students than the Chinese students.
We can confirm the truth about these generalistations by taking a closer look at the figures in the analysis. Of the 4885 graduates who graduated in the honours systems, 2973 (58.81%) were bumiputeras, 1609 (32.94%) were Chinese and 345 (7.06%) were Indians . With more than half the graduates being bumiputeras, they are the ones who can be said to determine average performance levels in each class of degrees. As such we can take a look at the average performance of graduates at each class of degrees and compare the performance of ethnic students in that class as a percentage of their ethnic total.
As Table 8 clearly shows of the available 147 Class I degrees the bumiputeras obtained only 20 (13.61 %) the Chinese 117 (79.59%) and the Indians 7 (4.76%). Seen as a performance within their own ethnic groups, only 0.7% of the bumiputeras obtained class I whi!e 7.27% of the Chinese and 2.03% of the Indians did so. Considering only 3.01 % .. of all students obtained class I (the average performance) the Chinese performed well above average and both the burniputeras and the Indians performed below average.
The same trend is confirmed when we look at the Class II (upper) degrees. Of the available
42 R. JUrthtsesu
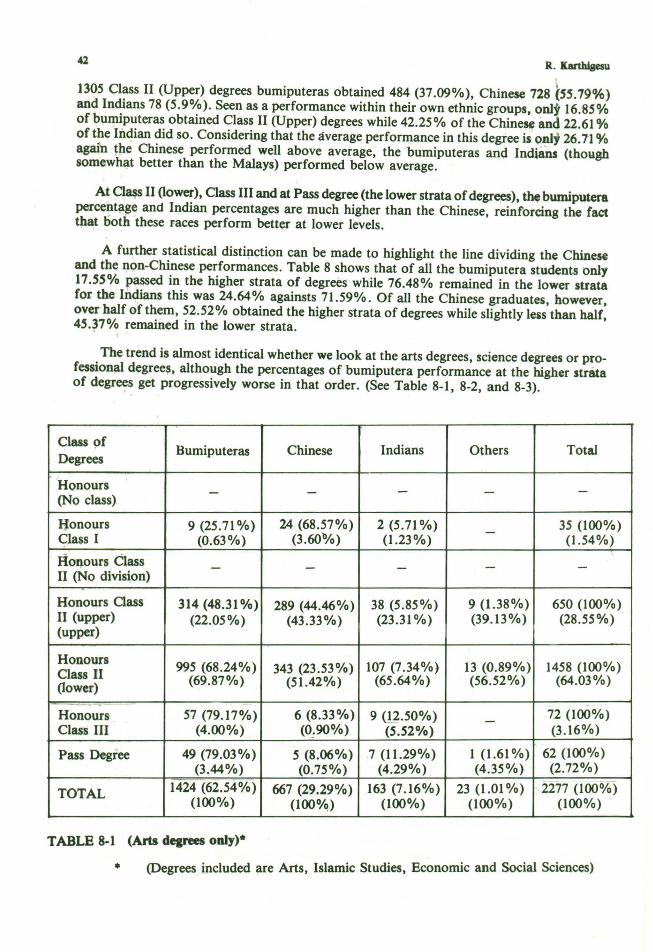
1305 Class II (Upper) degrees bumiputeras obtained 484 (37.09%), Chinese 728 (.ss.79%) and Indians 78 (5 .9%). Seen as a performance within their own ethnic groups, onl:t 16:85% of bumiputeras obtained Class II (Upper) degrees while 42.25% of the Chine~ and 22.61 o/o of the Indian did so. Considering that the average performance in this degree is only 26.11 'Yo again tpe Chinese performed well above average, the bumiputeras and Indians (though somewh~t better than the Malays) performed below average.
At a~ II (lower), Class III and at Pass degree (the lower strata of degrees), the bumiputera percent!l~e and Indian percentages are much higher than the Chinese, reinforcing the fact tp~t tioth these races perform better at lower levels.
A further statistical distinction can be made to highlight the line dividing the Chinese and the non-Chinese performances. Table 8 shows that of all the bumiputera students only 17.55% passed in the higher strata of degrees while 76.48% remained in the lower strata for the Indians this was 24.64% againsts 71.59%. Of all the Chinese graduates, however, over half of them, 52.52% obtained the higher strata of degrees while slightly leaos than half, 45.~7% remained in the lower strata.
The trend is almost identical whether we look at the arts degrees, science degrees or professional degree~. although the percentages of bumiputera performance at the higher strata of degr~s get progressively worse in that order. (See Table 8-1, 8-2, and 8-3).
Class pf Bumiputeras Chinese Indians Others Total
Degrees
Honours - - - --(No class)
IJonours 9 (25 .71 %) 24 (68.57%) 2 (5.71 %) - 35 (100%) CJass I (0.63%) (3.60%) (1.23%) (1.54%)
Honours Class - - - - -II (No divis~on)
Honours Oass 314 (48.31 %) 289 (44.46%) 38 (5.85%) 9 (1.38%) 650 (100%) II (upper) (22.05%) (43 .33%) (23 .31 %) (39.13%) (28.5S%) (upper)
Honours 995 (68.24%) 343 (23.53%) 107 (7.34%) 13 (0.89%) 1458 (100%) Class II (69.87%) (51.42%) (65.64%) (56.52%) (64.03%) (lower)
~
6 (8.33%) 9 (!_2.50Cljo) 72 (100%) Honours 57 (79.17%) -Class III (4.00%) (0:90%) (5.52%) (3.16%)
Pass Degree 49 (79.03%) 5 (8.06%) 7 (11.29%) 1 (1.61 %) 62 (100%) (3.44%) (0.75%) (4.29%) (4.35%) (2.72%)
TOTAL 1424 (62.54%) 667 (29.29%) 163 (7.16%) 23 (1.01 %) 2277 (100%) (100%) (100%) (100%) (100%) (100%)
TABLE 8-1 (Arts degrees only)*
• (Degrees included are Arts, Islamic Studies, Economic and Social Sciences)
Distribution of opportunities in tertiary education in Malaysia: A review of the fifth Malaysia Plan 43
Class of Bumiputeras Chinese Indians Others Total Degrees
Honours 139 (87.42%) 14 (8.81 %) 6 (3.77%) - 159 (100%) (No class) (12.62%) (2.17%) (4.48%) (8.33%)
Honours 9 (12.68%) 56 (78.87%) 3 (4.23%) 3 (4.23%) 71 (100%) Class I (0.82%) (8.68%) (2.24%) (10.71 %) (3.72)
Honours Class II - - - - -(No Division)
Honours 129 (26.54%) 321 (66.05%) 30 (6.17%) 6 (1.23%) 486 (100%) Class II (upper) (11.72%) (49.77%) (22.39%) (21.43%) (25.47%)
Honours 501 (63.26%) 215 (27.15%) 64 (8.08%) 12 (1.52%) 792 (100) Class II (lower) (45.05%) (33.33%) (47.76%) (42.86%) (41.51 %)
Honours 289 (81.41%) 30 (8.45%) 30 (8.45%) 6 (1.69%) 355 (100%) Class III (26.25%) (4.65%) (22.39%) (21.43%) (18.61 %)
Pass 34 (75.56%) 9 (20.00%) 1 (2.22%) 1 (2.22%) 45 (100%) Degree (3.09%) (1.40%) (0.75%) (3.57%) (2.36%)
TOTAL 1101 (57.70%) 645 (33.81 %) 134 (7.02%) 28 (1.47%) 1908 (100%) (100%) (100%) (100%) (100%) (100%)
1
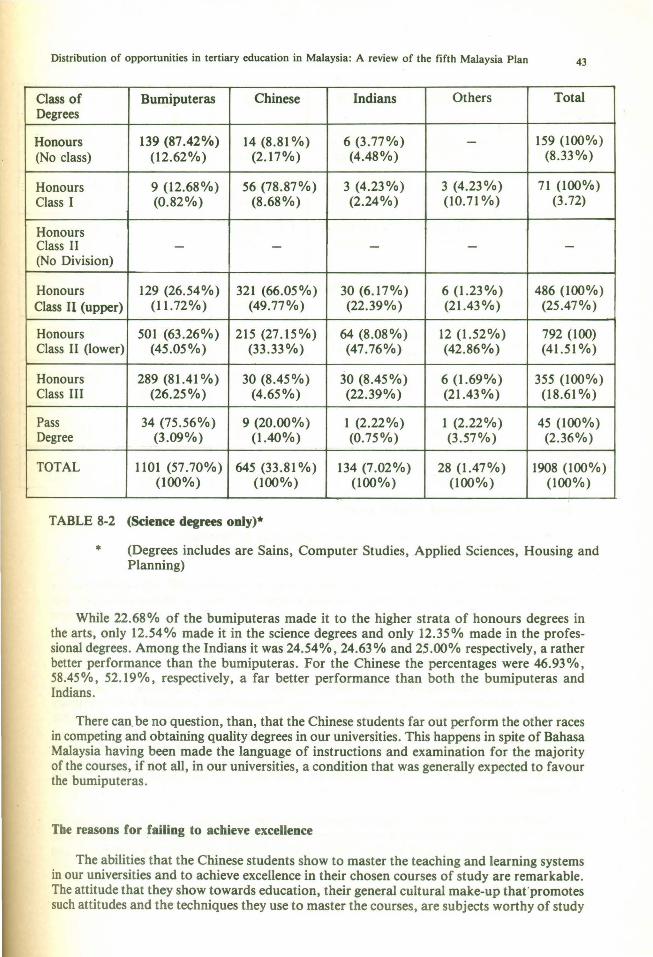
TABLE 8-2 (Science degrees only)*
* (Degrees includes are Sains, Computer Studies, Applied Sciences, Housing and Planning)
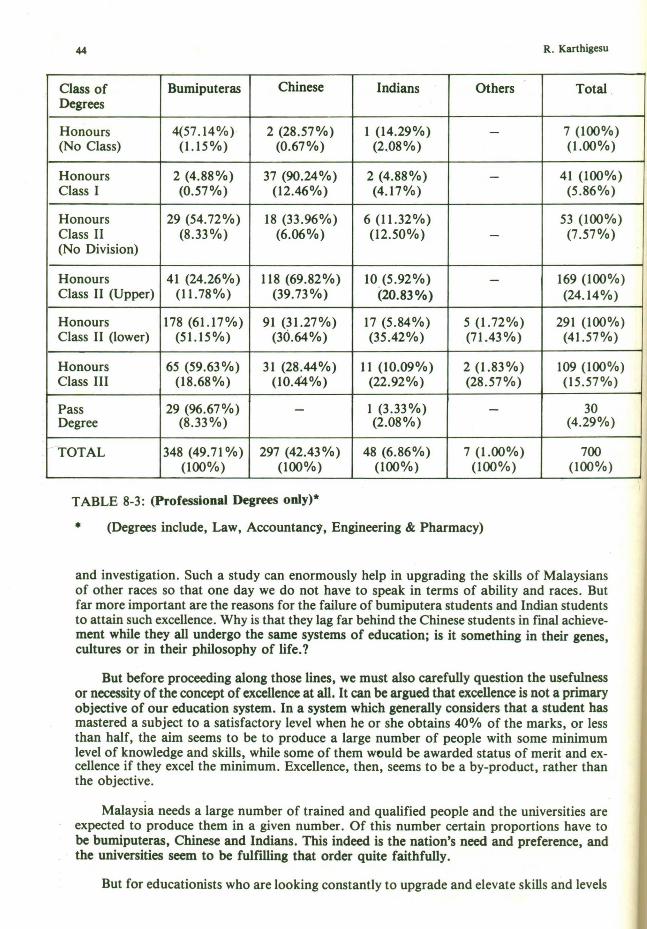
While 22.68% of the bumiputeras made it to the higher strata of honours degrees in the arts, only 12.54% made it in the science degrees and only 12.35% made in the professional degrees. Among the Indians it was 24.54%, 24.63% and 25.00% respectively, a rather better performance than the bumiputeras. For the Chinese the percentages were 46.93%, 58.45%, 52.19%, respectively, a far better performance than both the bumiputeras and Indians.
There can. be no question, than, that the Chinese students far out perform the other races in competing and obtaining quality degrees in our universities. This happens in spite of Bahasa Malaysia having been made the language of instructions and examination for the majority of the courses, if not all, in our universities, a condition that was generally expected to favour the bumiputeras.
The reasons for failing to achieve excellence
The abilities that the Chinese students show to master the teaching and learning systems in our universities and to achieve excellence in their chosen courses of study are remarkable. The attitude that they show towards education, their general cultural make-up that' promotes such attitudes and the techniques they use to master the courses, are subjects worthy of study
44 R. Karthigesu
Class of Bumiputeras Chinese Indians Others Total . Degrees
Honours 4(57.I4%) 2 (28.57%) I (I4.29%) - 7 (100%) (No Class) (l.I5%) (0.67%) (2,08%) (1.00%)
Honours 2 (4.88%) 37 (90.24%) 2 (4.88%) - 4I (100%) Class I (0.57%) (12.46%) (4.I7%) (5.86%)
Honours 29 (54.72%) I8 (33.96%) 6 (11.32%) 53 (IOO%) Class II (8.33%) (6.06%) (12.50%) - (7.57%) (No Division)
Honours 4I (24.26%) II8 (69.82%) I0(5.92%) - I69 (100%) Class II (Upper) (I1.78%) (39.73%) (20.83%) (24.I4%)
Honours 178 (61.17%) 9I (31.27%) I7 (5.84%) 5 (1.72%) 29I (100%) Class II (lower) (51.15%) (30.64%) (35.42%) (71.43%) (41.57%)
Honours 65 (59.63%) 3I (28.44%) II (10.09%) 2 (1.83%) I09 (100%) Class III (18.68%) (10.4~%) (22.92%) (28.57%) (15.57%)
Pass 29 (%.67%) - I (3.33%) - 30 Degree (8.33%) (2.08%) (4.29%)
TOTAL 348 (49.7I %) 297 (42.43%) 48 (6.86%) 7 (1.00%) 700 (100%) (100%) (100%) (100%) (100%)
TABLE 8-3: (Professional Degrees only)*
• (Degrees include, Law, Accountancy, Engineering & Pharmacy)
and investigation. Such a study can enormously help in upgrading the skills of Malaysians of other races so that one day we do not have to speak in terms of ability and races. But far more important are the reasons for the failure of bumiputera students and Indian students to attain such excellence. Why is that they lag far behind the Chinese students in fmal achievement while they all undergo the same systems of education; is it something in their genes, cultures or in their philosophy of life.?
But before proceeding along those lines, we must also carefully question the usefulness or necessity of the concept of excellence at all. It can be argued that excellence is not a primary objective of our education system. In a system which generally considers that a student has mastered a subject to a satisfactory level when he or she obtains 40% of the marks, or less than half, the aim seems to be to produce a large number of people with some minimum level of knowledge and skills, while some of them would be awarded status of merit and excellence if they excel the minimum. Excellence, then, seems to be a by-product, rather than the objective.
Malaysia needs a large number of trained and qualified people and the universities are expected to produce them in a given number. Of this number certain proportions have to be bumiputeras, Chinese and Indians. This indeed is the nation's need and preference, and the universities seem to be fulfilling that order quite faithfully.
But for educationists who are looking constantly to upgrade and elevate skills and levels
Distribution of opportunities in tertiary education in Malaysia: A review of the fifth Malaysia Plan 45
of knowledge that they teach in their fields, the questions of excellence is a pertinent one. Excellence determines the higher reaches of knowledge and ability, and lifts their average levels.
So, excellence and the reasons for achieving it or failing to do so, are certainly matters of concern, even if some would consider them to be merely academic.
Although, in order to determine the reasons for the bumiputeras and Indians failing to achieve excellence, have to be researched carefully by educationists and other social scientist, some educationist have offered a few educated opinions on the basis of observation and experience over a number of years over which they have taught students at university levels, and they are worth considering here.
Firstly, weaknesses are found even at university entry points where bumiputera students and ~ndian students generally have weaker STPM results than the Chinese. One can presumably contmue to trace these weaknesess to post-secondary, secondary, primary and down to preprimary levels . Beyond that economic and cultural reasons could also be included. Reasons can further be traced to urban, rural and plantation living. It is tempting to conch,1de at this level of generalisation that the roots of weaknesses are cultural, economical and enviromental, although only systematic research can pin down those reasons .
Secondly, some of the cultural traits, namely timidity, deference to authority (therefore to the teacher) etc, persist with the bumiputeras and Indians (and no doubt these are reinforced more firmly in a rural environment rather than in an urban one), into their university lives and inhibit them from stepping forward to ask questions frorn their teachers and to clarify doubt and thereby enhance knowledge.
Thirdly, the bumiputeras and Indians lack the techniques of mastering knowledge. Their ability at time management is poor and therefore there is a lot of wastage of time. They lack the technique to distinguish between material (given during lectures) that are important for
· · ~~wnws ngu-·agem an:swenng ex-amination questions.
Fourthly, the bumiputeras (and this probably applies more to them than their Indian counterparts) lack the mastery of the English language. At the least for now, to master any subject in tertiary education, be it in the arts or, more so, in the sciences, a good grasp of the English Language is inevitable. Most of our knowledge is stored in the form of books, tapes, microfilm or film and are in English.
Translations of texts in Bahasa Malaysia, although in invaluable help to impart instructions, are inadequate to enhance the student's knowledge through self reading. And then there are the additional material, the general knowledge books, journals and magazines which are also mostly in English. By neglecting English the bumiputera students fail to possess a key element on our higher education system in our universities, not withstanding the fact that Bahasa Malaysia is our main teaching medium.
Quite separately, two reasons have been offered in terms of mitigating circumtances for the poor performance of bumiputera students. The first of those is that the best of bumiputera students are plucked out and sent to overseas institutions leaving the next best to fill the enrolment of local unviersities. If this is true, -this can be only be confirmed if their performances are evaluated and compared with local bumiputera students. But there are reasons that point out to the fact that this may indeed be a myth. First, even if the best of the bumiputeras are sent to overseas institutions, this applies largely to science students, not to those who are pursuing the arts subjects. Therefore the performance of bumiputera students in the arts degrees (Table 8-1) cannot be ameliorated by this fact. Second, it is not also true that the best of the non-bumiputera students, assuming they are generally from the middle and upper income families, are also sent to overseas institutions, if this is so than it would negate the
46 R. Karthigesu
argument that the second best bumiputera students are competing with the best non-bumiputera students within the local universities.
The second of those mitigating circumstances is that the best of bumiputera students from the arts stream are directed to the science stream even at the secondary school levels. This causes many of them to lose their excellence and perform only moderately or poorly in the science streams. The thruth of this can only be evaluated by the Ministry of Education, which presumably keeps track of those students who have been thus streamed.
These reasons for the poor performance ofthe Bumiputera and Indian students are relevant enough on a generalised level but need further systematic research in order to substantiate them. Here they are only offered to promote thinking along those lines and to promote the intellectual curiosity of educationists and other social scientists who may be concerned.
Conclusion
The NEP education policy obviously is a compromise between achieving educational excell.ence based on merit and the need to redistribute educational opportunities to all races and economic classes in an equitable manner. But in doing so there is also the need to count the social costs of that policy and to find a balance between those two aspects. We can, for example, question whether the statiscally controlled admission into tertiary education in local institutions, prevent the production of more better quality graduates. If the admission policy gives more emphasis for merit rather than racial equity, will it produce more graduates of higher quality who can serve our economic and other national nees better.
Of course, policy formulation in this areas has many dilemmas. The policy makers constantly weigh the various needs and make decisions one way or the other. But in a dynamic and developing society, this prilicy will have to reevaluate from time and course corrections will have to be made.
The Fifth Malaysia Plan claims that "the education systems has been the major vehicle in promoting integration among all the Malaysians, irrespective of ethnic, cultural and religious backgrounds" (Fifth Malaysia Plan, Ibid: 6). This is eminently true in the case of primary and secondary education. But in tertiary education, where the competition is keen for places that are limited, there is probably a growing feeling among the non-bumiputera communities that they are losing out, denied places locally and are forced to go overseas at their own expenses to acquire qualitfications for jobs at home. Furthermore they are also "apt to feel that their educational opportunities are denied even when they have excellent qualifications to acquire them. These frustrations should be reckoned with and our education policy should become enlightened enough to be flexible at the tertiary levels so that more people with merit are accommodated so that valuable human resources are not wasted.
In the future and ultimately, as Malaysia progresses into a more developed and stable society, the answer would be found in redressing in inequities along lines of economic classess, rather than racial ones.
Notes
1The population percentages stand, in 1985, at Bumiputeras 60.06%, Chinese 30.92%, Indians 8.38% and others 0.65% (Fifth Malaysia Plan figures)
Vrhe information in this table has been compiled from the Convocation Souvenirs of the various universities. Some inaccuracies in classifying students into ehtnic categories on the basis of their names are readily admitted. It is believed that these innaccuracies do not affect the general trend of the results of the analysis, even if they would alter the figures marginally.
Distribution of opportunities in tertiary education in Malaysia: A review of the fifth Malaysia Plan 47
3The division of higher and lower strate of honours degrees is not a formal one. However this has a practical significance. For example the Class I and Class II (Upper) degrees are the preferred degrees to admit students into post-graduate degrees in all universities.
Bibliography
Government of Malaysia, Fifth Malaysia Plan, Kuala Lumpur. Government Printers, 1986.
RIHED. Higher Education in Malaysia, Singapore; Singapore National Printer, 1984.