058-2008: academic business intelligence system ... business intelligence system development using...
TRANSCRIPT
1
Paper 058-2008
ACADEMIC BUSINESS INTELLIGENCE
SYSTEM DEVELOPMENT USING SAS® TOOLS
Azman Ta’a, Universiti Utara Malaysia, Kedah, Malaysia
Muhamad Shahbani Abu Bakar, Universiti Utara Malaysia, Kedah, Malaysia
Abdul Razak Saleh, Universiti Utara Malaysia, Kedah, Malaysia
ABSTRACT Managing an organization requires access to information in order to monitor the organization activities and assess its performance. Indeed, the increasing demand for information plus the growing data volumes and customer populations can pose problems to the organization. A way to tackle these issues can be found in Business Intelligence (BI) solutions, which provide organizations with timely and integrated information that is crucial to the understanding of the business environment and customer needs. These solutions, usually in the form of BI systems allow the organizations to gather, store, access and analyze corporate data sources for business planning and decision-making. Academic institutions, an example of these organizations, require information too for planning their academic resources and achieving academic excellence. For that reason, this article describes a study that was aimed at defining and developing data warehouse (DW) for academic domain in a public university in Malaysia. A dimensional model (DM) of the DW in Student Affairs subject area was also defined. Then, a prototype of a BI application based on the proposed DW model was developed and linked to the university’s information portal. SAS ETL and SAS Enterprise Guide were utilized successfully in developing the prototype.
INTRODUCTION Nowadays, both large and small organizations create millions records of data on all aspects of their business. However, these data are locked and most of the time not fully accessible. As a result, the management team has access to only a small fraction of the information that is available in the organizations. To solve this problem, many companies have chosen to deploy BI systems based on data warehousing technology. BI involves extracting, storing and analyzing data from a wide range of sources, and transforming it into meaningful knowledge that enables better decision making.
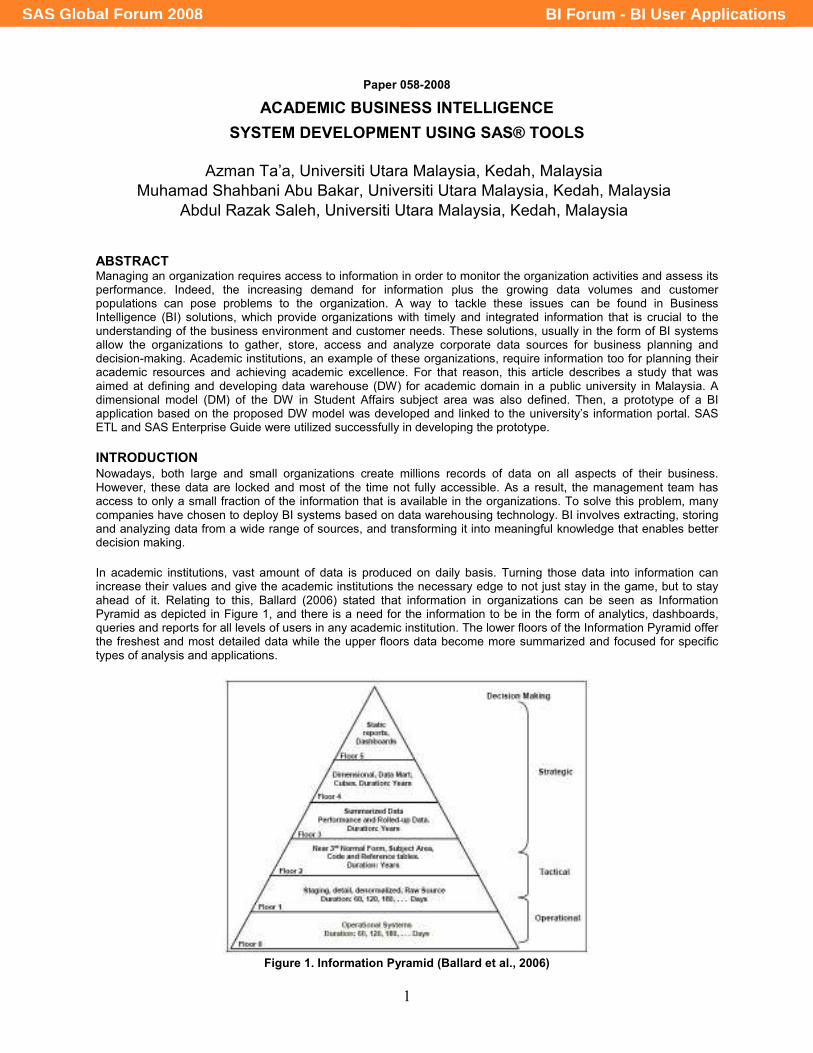
In academic institutions, vast amount of data is produced on daily basis. Turning those data into information can increase their values and give the academic institutions the necessary edge to not just stay in the game, but to stay ahead of it. Relating to this, Ballard (2006) stated that information in organizations can be seen as Information Pyramid as depicted in Figure 1, and there is a need for the information to be in the form of analytics, dashboards, queries and reports for all levels of users in any academic institution. The lower floors of the Information Pyramid offer the freshest and most detailed data while the upper floors data become more summarized and focused for specific types of analysis and applications.
Figure 1. Information Pyramid (Ballard et al., 2006)
BI Forum - BI User ApplicationsSAS Global Forum 2008
2
Decision making by academic management lays the groundwork for lower levels to develop policies and procedures for various academic activities. However, the potential academic strategy of these activities depends on the quality of the decisions and, in turn, on the quality of the data used by them. Some inputs are judgmental, others are from transactional systems, while others are from external sources, but every source collected must have a level of quality appropriate for the decisions making. The competitive forces prevailing in the world of academic institutional today require the Public of Higher Learning Institutions (PHLIs) to operate as efficiently and productively as possible in order to maintain and enhance students’ management, human resources, teaching, researching, marketing, financing and strategic planning. This is the motivation of the study described in this article.
The main contents of this article are dedicated to explaining the processes involved in developing a BI system prototype by utilizing SAS® tools. Before such section is presented, the next section starts with a brief discussion on some core business processes in academic institutions.
INFORMATION REQUIREMENTS IN ACADEMIC DOMAIN PHLIs are organizations that administer academic businesses. All the business activities are implemented towards achieving academic excellence. Pertaining to that goal, PHLI requires quality information from information systems which could support the necessary PHLIs business processes. In general, there are five (5) main business processes in academic domain as defined by the Malaysian Ministry of Higher Education (MOHE)
1; namely i) Student Affairs ii)
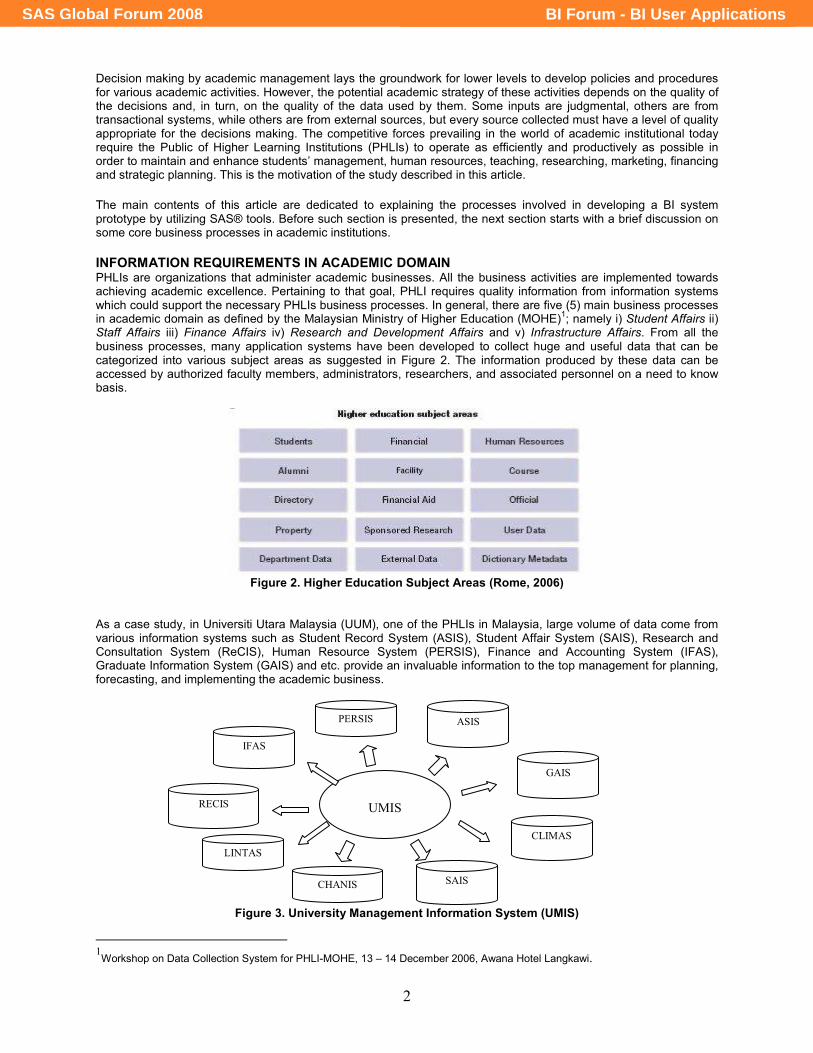
Staff Affairs iii) Finance Affairs iv) Research and Development Affairs and v) Infrastructure Affairs. From all the business processes, many application systems have been developed to collect huge and useful data that can be categorized into various subject areas as suggested in Figure 2. The information produced by these data can be accessed by authorized faculty members, administrators, researchers, and associated personnel on a need to know basis.
Figure 2. Higher Education Subject Areas (Rome, 2006)
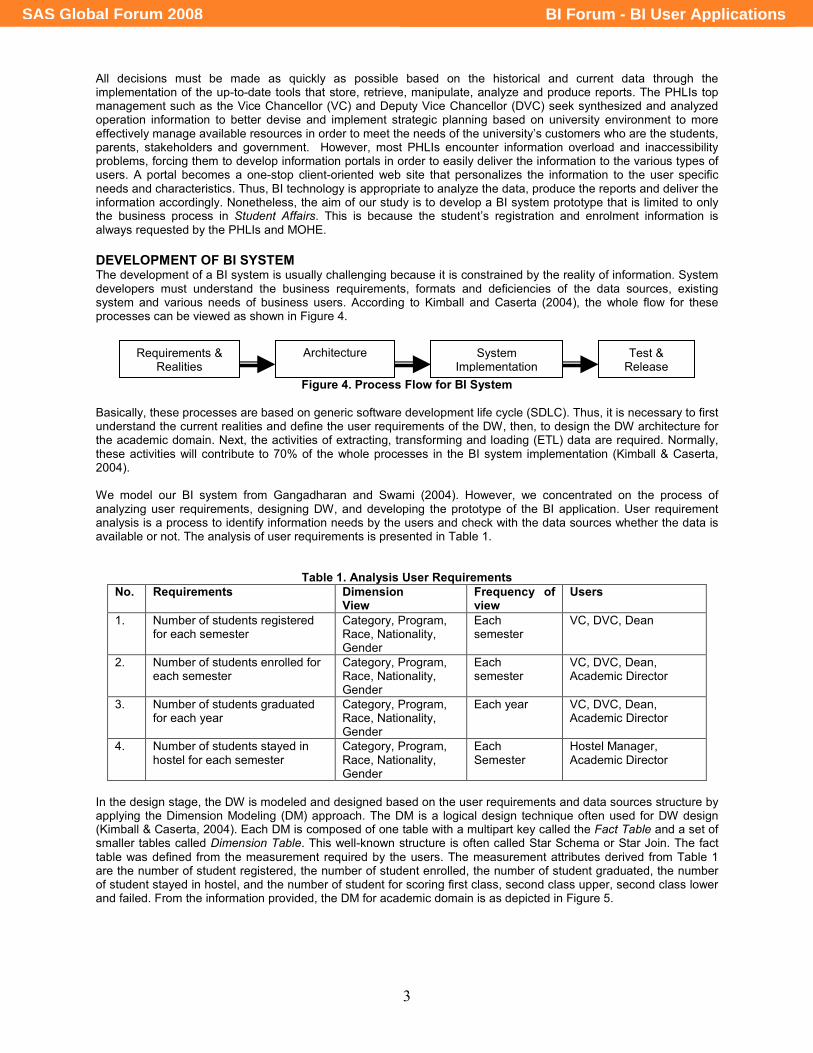
As a case study, in Universiti Utara Malaysia (UUM), one of the PHLIs in Malaysia, large volume of data come from various information systems such as Student Record System (ASIS), Student Affair System (SAIS), Research and Consultation System (ReCIS), Human Resource System (PERSIS), Finance and Accounting System (IFAS), Graduate Information System (GAIS) and etc. provide an invaluable information to the top management for planning, forecasting, and implementing the academic business.
Figure 3. University Management Information System (UMIS)
1Workshop on Data Collection System for PHLI-MOHE, 13 – 14 December 2006, Awana Hotel Langkawi.
UMIS
ASIS PERSIS
IFAS
SAIS
GAIS
RECIS
LINTAS
CHANIS
CLIMAS
BI Forum - BI User ApplicationsSAS Global Forum 2008
3
All decisions must be made as quickly as possible based on the historical and current data through the implementation of the up-to-date tools that store, retrieve, manipulate, analyze and produce reports. The PHLIs top management such as the Vice Chancellor (VC) and Deputy Vice Chancellor (DVC) seek synthesized and analyzed operation information to better devise and implement strategic planning based on university environment to more effectively manage available resources in order to meet the needs of the university’s customers who are the students, parents, stakeholders and government. However, most PHLIs encounter information overload and inaccessibility problems, forcing them to develop information portals in order to easily deliver the information to the various types of users. A portal becomes a one-stop client-oriented web site that personalizes the information to the user specific needs and characteristics. Thus, BI technology is appropriate to analyze the data, produce the reports and deliver the information accordingly. Nonetheless, the aim of our study is to develop a BI system prototype that is limited to only the business process in Student Affairs. This is because the student’s registration and enrolment information is always requested by the PHLIs and MOHE.
DEVELOPMENT OF BI SYSTEM The development of a BI system is usually challenging because it is constrained by the reality of information. System developers must understand the business requirements, formats and deficiencies of the data sources, existing system and various needs of business users. According to Kimball and Caserta (2004), the whole flow for these processes can be viewed as shown in Figure 4.
Figure 4. Process Flow for BI System
Basically, these processes are based on generic software development life cycle (SDLC). Thus, it is necessary to first understand the current realities and define the user requirements of the DW, then, to design the DW architecture for the academic domain. Next, the activities of extracting, transforming and loading (ETL) data are required. Normally, these activities will contribute to 70% of the whole processes in the BI system implementation (Kimball & Caserta, 2004). We model our BI system from Gangadharan and Swami (2004). However, we concentrated on the process of analyzing user requirements, designing DW, and developing the prototype of the BI application. User requirement analysis is a process to identify information needs by the users and check with the data sources whether the data is available or not. The analysis of user requirements is presented in Table 1.
Table 1. Analysis User Requirements
No. Requirements Dimension View
Frequency of view
Users
1. Number of students registered for each semester
Category, Program, Race, Nationality, Gender
Each semester
VC, DVC, Dean
2. Number of students enrolled for each semester
Category, Program, Race, Nationality, Gender
Each semester
VC, DVC, Dean, Academic Director
3. Number of students graduated for each year
Category, Program, Race, Nationality, Gender
Each year VC, DVC, Dean, Academic Director
4. Number of students stayed in hostel for each semester
Category, Program, Race, Nationality, Gender
Each Semester
Hostel Manager, Academic Director
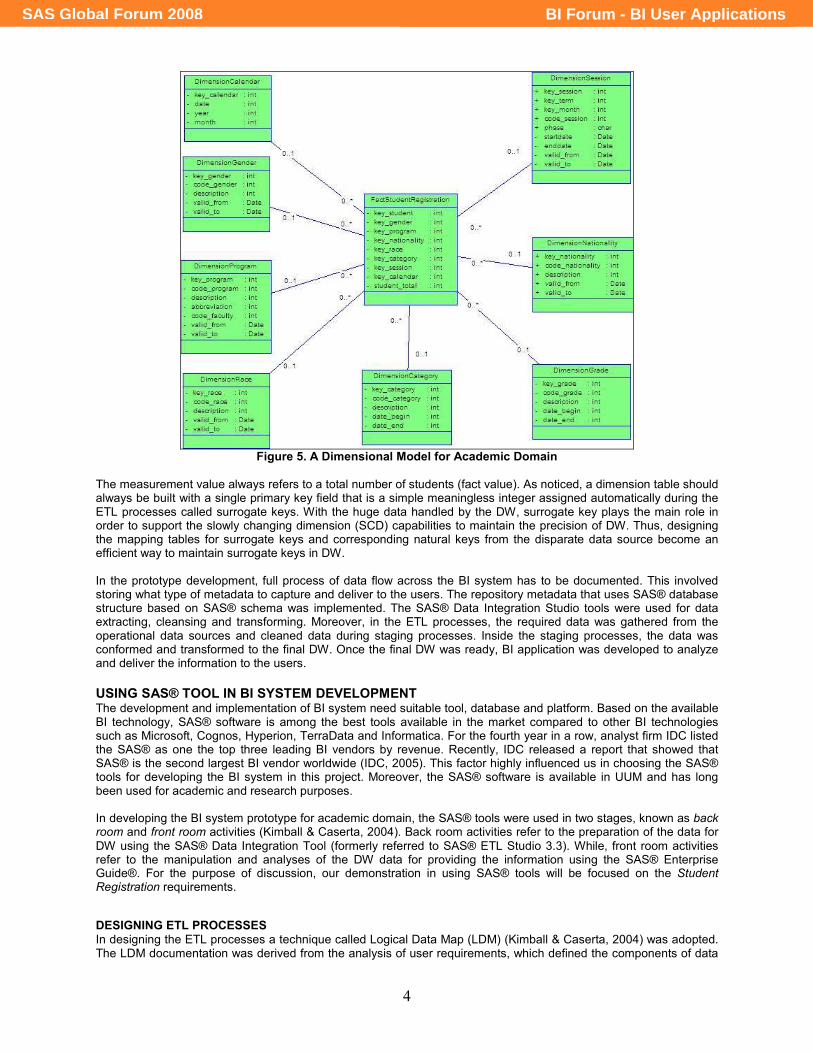
In the design stage, the DW is modeled and designed based on the user requirements and data sources structure by applying the Dimension Modeling (DM) approach. The DM is a logical design technique often used for DW design (Kimball & Caserta, 2004). Each DM is composed of one table with a multipart key called the Fact Table and a set of smaller tables called Dimension Table. This well-known structure is often called Star Schema or Star Join. The fact table was defined from the measurement required by the users. The measurement attributes derived from Table 1 are the number of student registered, the number of student enrolled, the number of student graduated, the number of student stayed in hostel, and the number of student for scoring first class, second class upper, second class lower and failed. From the information provided, the DM for academic domain is as depicted in Figure 5.
Requirements & Realities
Architecture System Implementation
Test & Release
BI Forum - BI User ApplicationsSAS Global Forum 2008
4
Figure 5. A Dimensional Model for Academic Domain
The measurement value always refers to a total number of students (fact value). As noticed, a dimension table should always be built with a single primary key field that is a simple meaningless integer assigned automatically during the ETL processes called surrogate keys. With the huge data handled by the DW, surrogate key plays the main role in order to support the slowly changing dimension (SCD) capabilities to maintain the precision of DW. Thus, designing the mapping tables for surrogate keys and corresponding natural keys from the disparate data source become an efficient way to maintain surrogate keys in DW. In the prototype development, full process of data flow across the BI system has to be documented. This involved storing what type of metadata to capture and deliver to the users. The repository metadata that uses SAS® database structure based on SAS® schema was implemented. The SAS® Data Integration Studio tools were used for data extracting, cleansing and transforming. Moreover, in the ETL processes, the required data was gathered from the operational data sources and cleaned data during staging processes. Inside the staging processes, the data was conformed and transformed to the final DW. Once the final DW was ready, BI application was developed to analyze and deliver the information to the users.
USING SAS® TOOL IN BI SYSTEM DEVELOPMENT The development and implementation of BI system need suitable tool, database and platform. Based on the available BI technology, SAS® software is among the best tools available in the market compared to other BI technologies such as Microsoft, Cognos, Hyperion, TerraData and Informatica. For the fourth year in a row, analyst firm IDC listed the SAS® as one the top three leading BI vendors by revenue. Recently, IDC released a report that showed that SAS® is the second largest BI vendor worldwide (IDC, 2005). This factor highly influenced us in choosing the SAS® tools for developing the BI system in this project. Moreover, the SAS® software is available in UUM and has long been used for academic and research purposes. In developing the BI system prototype for academic domain, the SAS® tools were used in two stages, known as back room and front room activities (Kimball & Caserta, 2004). Back room activities refer to the preparation of the data for DW using the SAS® Data Integration Tool (formerly referred to SAS® ETL Studio 3.3). While, front room activities refer to the manipulation and analyses of the DW data for providing the information using the SAS® Enterprise Guide®. For the purpose of discussion, our demonstration in using SAS® tools will be focused on the Student Registration requirements.
DESIGNING ETL PROCESSES In designing the ETL processes a technique called Logical Data Map (LDM) (Kimball & Caserta, 2004) was adopted. The LDM documentation was derived from the analysis of user requirements, which defined the components of data
BI Forum - BI User ApplicationsSAS Global Forum 2008
5
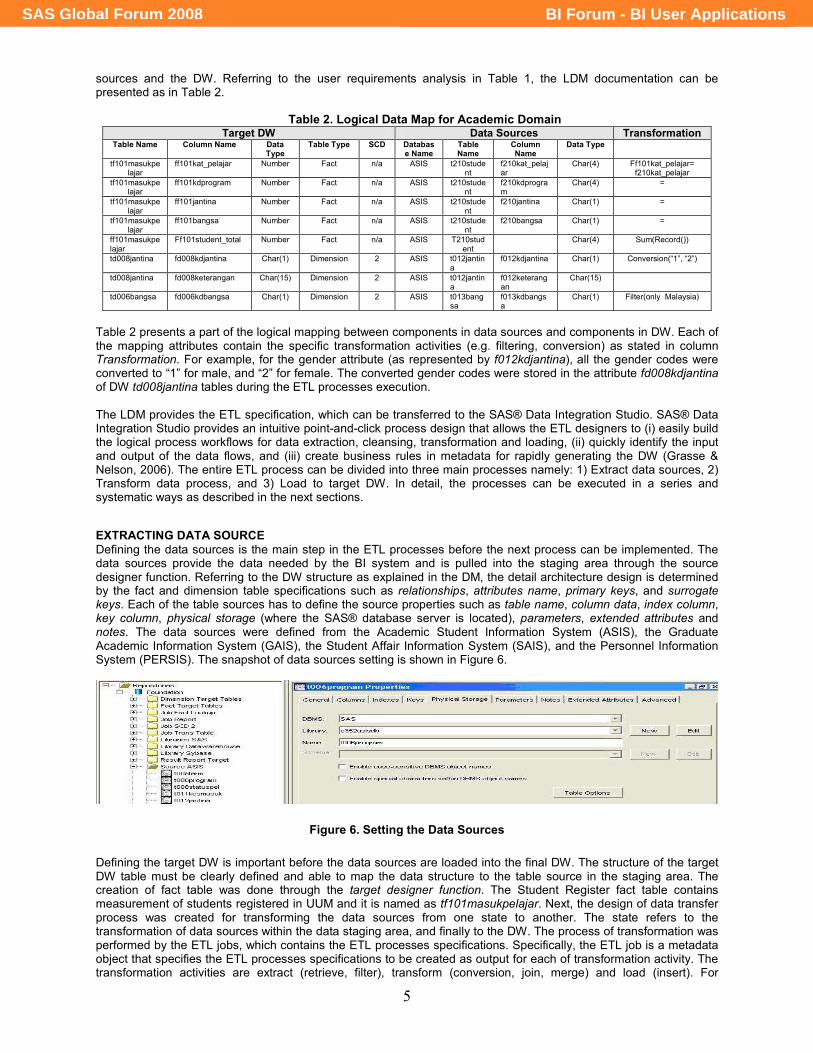
sources and the DW. Referring to the user requirements analysis in Table 1, the LDM documentation can be presented as in Table 2.
Table 2. Logical Data Map for Academic Domain
Target DW Data Sources Transformation Table Name Column Name Data
Type Table Type SCD Databas
e Name Table Name
Column Name
Data Type
tf101masukpelajar
ff101kat_pelajar Number Fact n/a ASIS t210student
f210kat_pelajar
Char(4) Ff101kat_pelajar= f210kat_pelajar
tf101masukpelajar
ff101kdprogram Number Fact n/a ASIS t210student
f210kdprogram
Char(4) =
tf101masukpelajar
ff101jantina Number Fact n/a ASIS t210student
f210jantina Char(1) =
tf101masukpelajar
ff101bangsa Number Fact n/a ASIS t210student
f210bangsa Char(1) =
ff101masukpelajar
Ff101student_total Number Fact n/a ASIS T210student
Char(4) Sum(Record())
td008jantina fd008kdjantina Char(1) Dimension 2 ASIS t012jantina
f012kdjantina Char(1) Conversion(“1”, “2”)
td008jantina fd008keterangan Char(15) Dimension 2 ASIS t012jantina
f012keterangan
Char(15)
td006bangsa fd006kdbangsa Char(1) Dimension 2 ASIS t013bangsa
f013kdbangsa
Char(1) Filter(only Malaysia)
Table 2 presents a part of the logical mapping between components in data sources and components in DW. Each of the mapping attributes contain the specific transformation activities (e.g. filtering, conversion) as stated in column Transformation. For example, for the gender attribute (as represented by f012kdjantina), all the gender codes were converted to “1” for male, and “2” for female. The converted gender codes were stored in the attribute fd008kdjantina of DW td008jantina tables during the ETL processes execution.
The LDM provides the ETL specification, which can be transferred to the SAS® Data Integration Studio. SAS® Data Integration Studio provides an intuitive point-and-click process design that allows the ETL designers to (i) easily build the logical process workflows for data extraction, cleansing, transformation and loading, (ii) quickly identify the input and output of the data flows, and (iii) create business rules in metadata for rapidly generating the DW (Grasse & Nelson, 2006). The entire ETL process can be divided into three main processes namely: 1) Extract data sources, 2) Transform data process, and 3) Load to target DW. In detail, the processes can be executed in a series and systematic ways as described in the next sections.
EXTRACTING DATA SOURCE Defining the data sources is the main step in the ETL processes before the next process can be implemented. The data sources provide the data needed by the BI system and is pulled into the staging area through the source designer function. Referring to the DW structure as explained in the DM, the detail architecture design is determined by the fact and dimension table specifications such as relationships, attributes name, primary keys, and surrogate keys. Each of the table sources has to define the source properties such as table name, column data, index column, key column, physical storage (where the SAS® database server is located), parameters, extended attributes and notes. The data sources were defined from the Academic Student Information System (ASIS), the Graduate Academic Information System (GAIS), the Student Affair Information System (SAIS), and the Personnel Information System (PERSIS). The snapshot of data sources setting is shown in Figure 6.
Figure 6. Setting the Data Sources
Defining the target DW is important before the data sources are loaded into the final DW. The structure of the target DW table must be clearly defined and able to map the data structure to the table source in the staging area. The creation of fact table was done through the target designer function. The Student Register fact table contains measurement of students registered in UUM and it is named as tf101masukpelajar. Next, the design of data transfer process was created for transforming the data sources from one state to another. The state refers to the transformation of data sources within the data staging area, and finally to the DW. The process of transformation was performed by the ETL jobs, which contains the ETL processes specifications. Specifically, the ETL job is a metadata object that specifies the ETL processes specifications to be created as output for each of transformation activity. The transformation activities are extract (retrieve, filter), transform (conversion, join, merge) and load (insert). For
BI Forum - BI User ApplicationsSAS Global Forum 2008
6
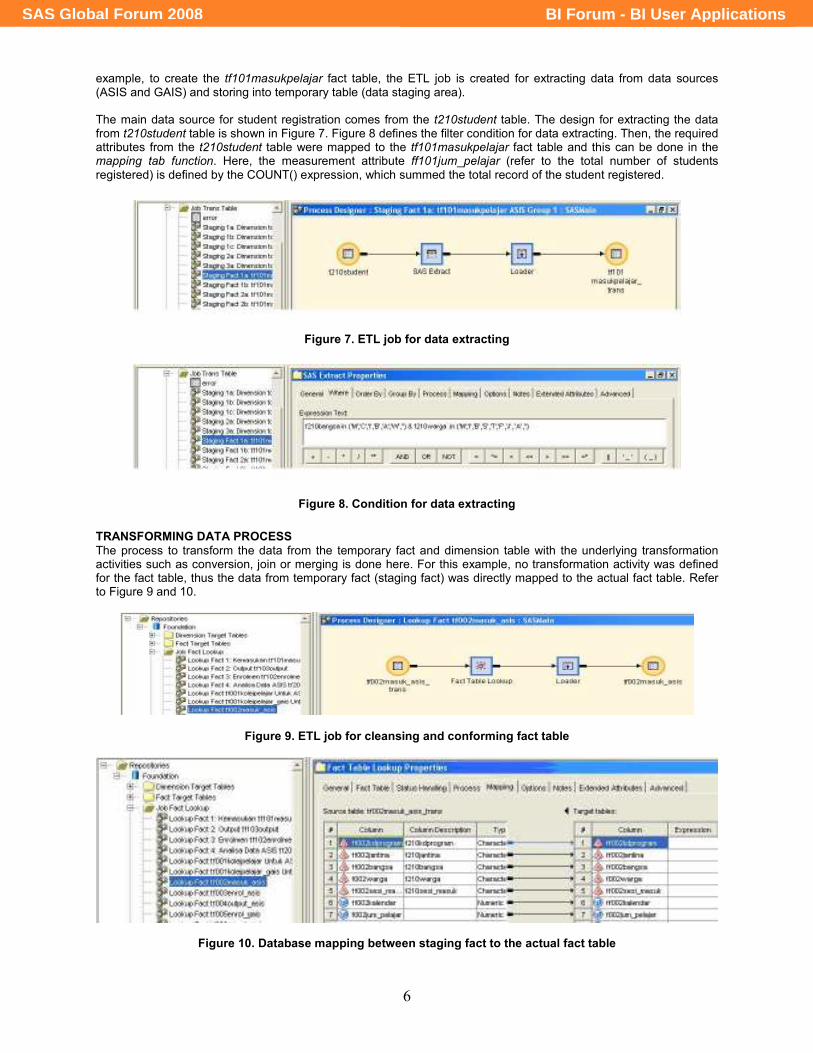
example, to create the tf101masukpelajar fact table, the ETL job is created for extracting data from data sources (ASIS and GAIS) and storing into temporary table (data staging area). The main data source for student registration comes from the t210student table. The design for extracting the data from t210student table is shown in Figure 7. Figure 8 defines the filter condition for data extracting. Then, the required attributes from the t210student table were mapped to the tf101masukpelajar fact table and this can be done in the mapping tab function. Here, the measurement attribute ff101jum_pelajar (refer to the total number of students registered) is defined by the COUNT() expression, which summed the total record of the student registered.
Figure 7. ETL job for data extracting
Figure 8. Condition for data extracting
TRANSFORMING DATA PROCESS The process to transform the data from the temporary fact and dimension table with the underlying transformation activities such as conversion, join or merging is done here. For this example, no transformation activity was defined for the fact table, thus the data from temporary fact (staging fact) was directly mapped to the actual fact table. Refer to Figure 9 and 10.
Figure 9. ETL job for cleansing and conforming fact table
Figure 10. Database mapping between staging fact to the actual fact table
BI Forum - BI User ApplicationsSAS Global Forum 2008
7
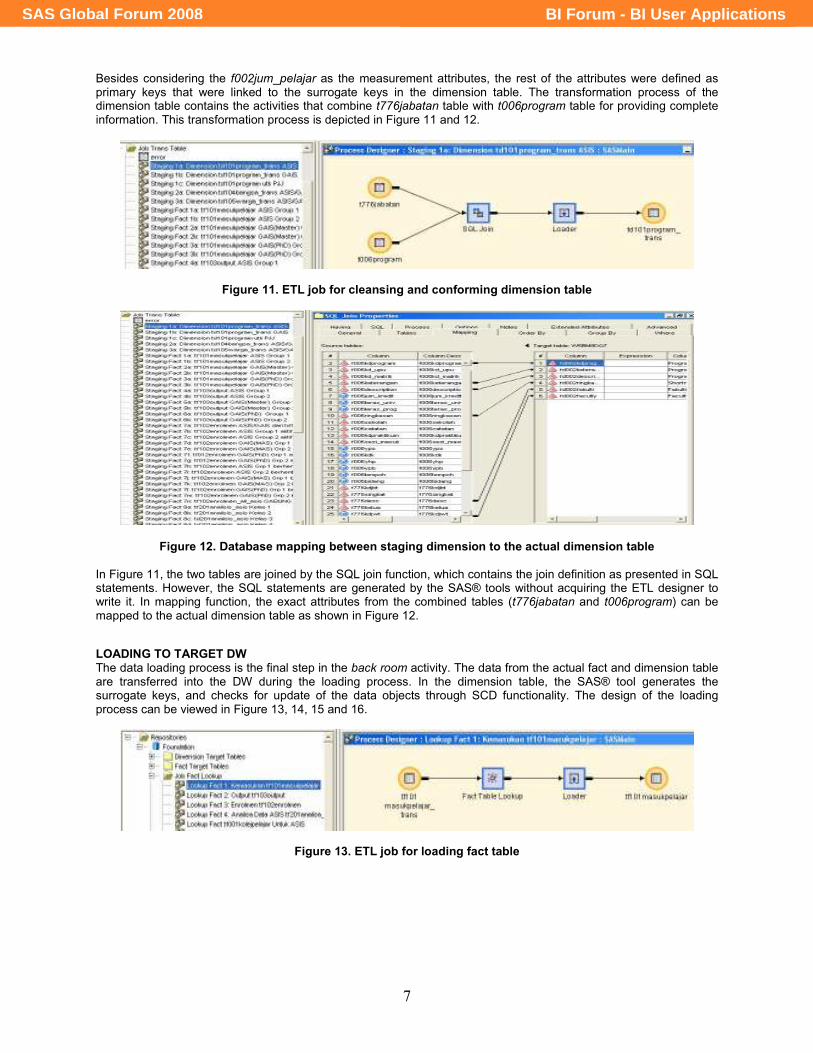
Besides considering the f002jum_pelajar as the measurement attributes, the rest of the attributes were defined as primary keys that were linked to the surrogate keys in the dimension table. The transformation process of the dimension table contains the activities that combine t776jabatan table with t006program table for providing complete information. This transformation process is depicted in Figure 11 and 12.
Figure 11. ETL job for cleansing and conforming dimension table
Figure 12. Database mapping between staging dimension to the actual dimension table In Figure 11, the two tables are joined by the SQL join function, which contains the join definition as presented in SQL statements. However, the SQL statements are generated by the SAS® tools without acquiring the ETL designer to write it. In mapping function, the exact attributes from the combined tables (t776jabatan and t006program) can be mapped to the actual dimension table as shown in Figure 12.
LOADING TO TARGET DW The data loading process is the final step in the back room activity. The data from the actual fact and dimension table are transferred into the DW during the loading process. In the dimension table, the SAS® tool generates the surrogate keys, and checks for update of the data objects through SCD functionality. The design of the loading process can be viewed in Figure 13, 14, 15 and 16.
Figure 13. ETL job for loading fact table
BI Forum - BI User ApplicationsSAS Global Forum 2008

8
Figure 14. Database mapping for loading fact table to DW
Figure 15. ETL job for loading dimension table
Figure 16. Database mapping for loading dimension table to DW The data stored in the DW (i.e. tf101masukpelajar as fact table and td002program as dimension table) was ready to be analyzed and manipulated by the BI application for information delivery. The SAS® Enterprise Guide® was used to develop the information deliverable for the BI system.
DESIGNING THE BI APPLICATION Many tools are available to support decision-making process. These are simple query and reporting tools, online analytical processing (OLAP) and data mining, business performance management (BPM), and information delivery (e.g. desktop application, dashboards, intranets, portals). Sometimes, the variety of reports is classified as simple known standard reports and complex known analytic applications (Thornthwaite & Mundy, 2006). In this project, the simple reporting is developed as defined in Table 3.
BI Forum - BI User ApplicationsSAS Global Forum 2008
9
Table 3. User requirements for student registration
No. Reports
1 2 3 4
Student registered for academic session July 2006/2007 by category, gender, nationality, program and race. Foreign student registered for academic session July 2006/2007 by category, gender, nationality, program and race. Student registered for year 2000 – 2006 by category, gender, nationality, program and race. Foreign student registered for year 2000 - 2006 by category, gender, nationality, program and race.
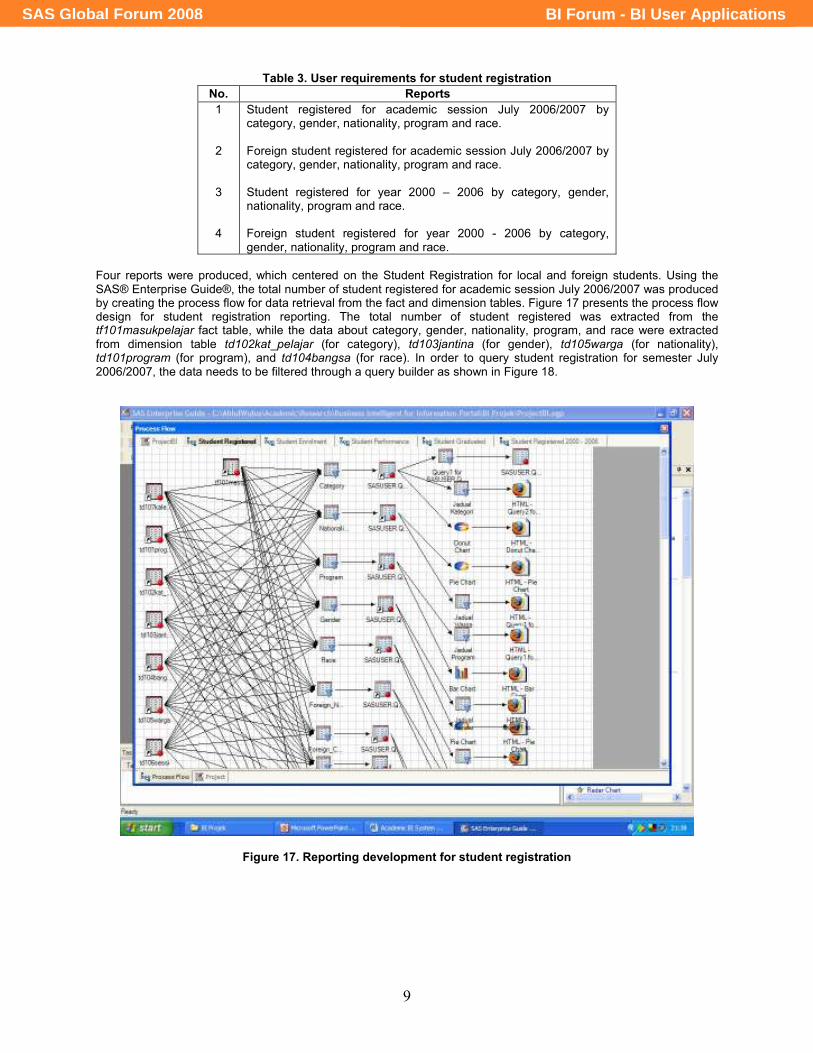
Four reports were produced, which centered on the Student Registration for local and foreign students. Using the SAS® Enterprise Guide®, the total number of student registered for academic session July 2006/2007 was produced by creating the process flow for data retrieval from the fact and dimension tables. Figure 17 presents the process flow design for student registration reporting. The total number of student registered was extracted from the tf101masukpelajar fact table, while the data about category, gender, nationality, program, and race were extracted from dimension table td102kat_pelajar (for category), td103jantina (for gender), td105warga (for nationality), td101program (for program), and td104bangsa (for race). In order to query student registration for semester July 2006/2007, the data needs to be filtered through a query builder as shown in Figure 18.
Figure 17. Reporting development for student registration
BI Forum - BI User ApplicationsSAS Global Forum 2008

10
Figure 18. Query builder for data filtering
In Figure 18, the Student Registration records were filtered for selecting the July 2006/2007 records which comprised of the relationships between dimension and fact tables as shown in Figure 19.
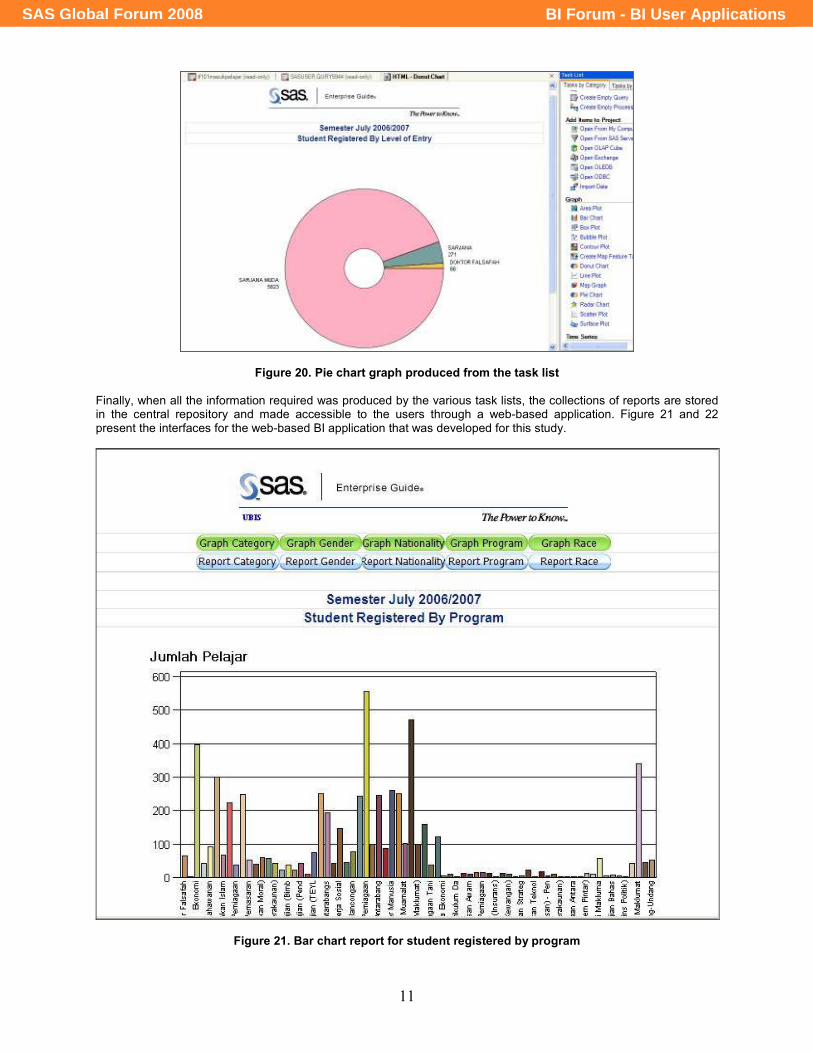
Figure 19. Relationship between fact and dimension tables The relation between fact and dimension tables are established between the primary key in fact table and surrogate key as defined in the dimension table. Other activities in query builder such as select and sort, group filter, and parameter setting can be performed as required. When the data is loaded into the DW from the query builder executions, type of selected reports are produced by selecting the task list in the right pane of SAS® Enterprise Guide®. To produce the report that is presented in graph, select the task list (e.g. pie chart) and execute the process flow. The pie chart graph report can be generated as shown in Figure 20.
BI Forum - BI User ApplicationsSAS Global Forum 2008
11
Figure 20. Pie chart graph produced from the task list
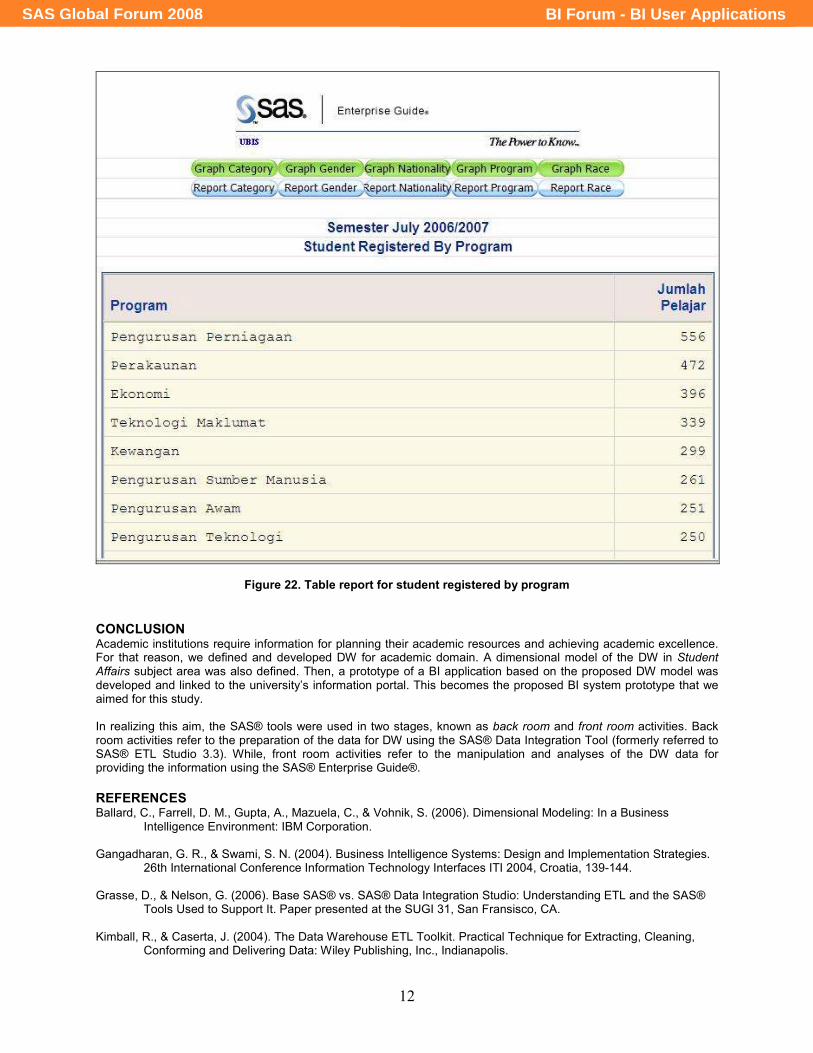
Finally, when all the information required was produced by the various task lists, the collections of reports are stored in the central repository and made accessible to the users through a web-based application. Figure 21 and 22 present the interfaces for the web-based BI application that was developed for this study.
Figure 21. Bar chart report for student registered by program
BI Forum - BI User ApplicationsSAS Global Forum 2008
12
Figure 22. Table report for student registered by program
CONCLUSION Academic institutions require information for planning their academic resources and achieving academic excellence. For that reason, we defined and developed DW for academic domain. A dimensional model of the DW in Student Affairs subject area was also defined. Then, a prototype of a BI application based on the proposed DW model was developed and linked to the university’s information portal. This becomes the proposed BI system prototype that we aimed for this study. In realizing this aim, the SAS® tools were used in two stages, known as back room and front room activities. Back room activities refer to the preparation of the data for DW using the SAS® Data Integration Tool (formerly referred to SAS® ETL Studio 3.3). While, front room activities refer to the manipulation and analyses of the DW data for providing the information using the SAS® Enterprise Guide®.
REFERENCES Ballard, C., Farrell, D. M., Gupta, A., Mazuela, C., & Vohnik, S. (2006). Dimensional Modeling: In a Business
Intelligence Environment: IBM Corporation. Gangadharan, G. R., & Swami, S. N. (2004). Business Intelligence Systems: Design and Implementation Strategies.
26th International Conference Information Technology Interfaces ITI 2004, Croatia, 139-144. Grasse, D., & Nelson, G. (2006). Base SAS® vs. SAS® Data Integration Studio: Understanding ETL and the SAS®
Tools Used to Support It. Paper presented at the SUGI 31, San Fransisco, CA. Kimball, R., & Caserta, J. (2004). The Data Warehouse ETL Toolkit. Practical Technique for Extracting, Cleaning,
Conforming and Delivering Data: Wiley Publishing, Inc., Indianapolis.
BI Forum - BI User ApplicationsSAS Global Forum 2008
13
Rome, J. (2002). Development of Data Warehouse. Retrieved 11 July, 2007, from http://www.okairp.org/archive/F05_RomeNACUBOArticle.pdf
Thornthwaite, W., & Mundy, J. (2006). Standard Reports: Basics for Business Users - Here's how to plan, prioritize
and design standard BI application reports. Retrieved September 20, 2007, from http://www.intelligententerprise.com/ showArticle.jhtml?articleID=177103011
CONTACT INFORMATION
Your comments and questions are valued and encouraged. Contact the authors:
Azman Ta’a : [email protected]
Muhamad Shahbani Abu Bakar : [email protected]
Abdul Razak Saleh : [email protected]
College of Arts and Sciences
Universiti Utara Malaysia
06010 UUM Sintok
Kedah Darulaman
Malaysia
+604-9284600, +604-9284791, +604-9286916 http://www.uum.edu.my/
SAS and all other SAS Institute Inc. product or service names are registered trademarks or trademarks of SAS Institute Inc. in the USA and other countries. ® indicates USA registration.
Other brand and product names are trademarks of their respective companies.
BI Forum - BI User ApplicationsSAS Global Forum 2008