malaysia · 1.1 perangkaan utama industri getah, 2000-2010 principal statistics of rubber industry,...
TRANSCRIPT
PERANGKAAN GETAH TAHUNANANNUAL RUBBER STATISTICS
MALAYSIA
2010
JABATAN PERANGKAAN MALAYSIADEPARTMENT OF STATISTICS, MALAYSIA
i
KATA PENGANTAR
Laporan ini membentangkan statistik berkaitan data yang diperoleh daripada Banci Estet
Getah Tahunan yang dijalankan pada tahun 2010 bagi tahun rujukan 2009.
Maklumat berkenaan ciri-ciri estet getah di Malaysia seperti bilangan estet, keluasan,
pengeluaran, hasil, struktur guna tenaga, gaji & upah, nilai harta dan perbelanjaan modal
merupakan antara data penting yang dipersembahkan di dalam laporan ini.
Penerbitan ini juga mengandungi maklumat sekunder yang berkaitan dengan kebun kecil,
eksport dan import, penggunaan domestik dan perangkaan getah negara-negara terpilih
yang sumbernya diperoleh daripada agensi-agensi seperti Pihak Berkuasa Kemajuan
Pekebun Kecil Perusahaan Getah (RISDA), Lembaga Kemajuan Tanah Persekutuan (FELDA),
Lembaga Penyatuan Pemulihan Tanah Persekutuan (FELCRA), Lembaga Getah Malaysia
(LGM), International Rubber Study Group (IRSG) dan agensi-agensi lain yang berkaitan.
Jabatan ini merakamkan penghargaan kepada semua pihak yang terlibat di atas kerjasama
yang telah diberikan dalam menjayakan laporan ini. Sebarang ulasan dan cadangan ke arah
menambah baik penerbitan ini pada masa hadapan amatlah dihargai.
DATO’ HAJAH WAN RAMLAH BT. WAN ABD. RAOF
Ketua Perangkawan Malaysia
Mei 2011
ii
PREFACE
This report presents statistics on data obtained from the Annual Census of Rubber Estates
conducted in 2010 for reference year 2009.
Information on the characteristics of rubber estates in Malaysia such as the number of
estates, size, production, yield, employment structure, salaries & wages, value of assets and
capital expenditure are some of the important data presented in this report.
This publication also contains secondary information on smallholdings, exports and imports,
domestic consumption and rubber statistics of selected countries, which were sourced from
agencies such as the Rubber Industry Smallholders Development Authority (RISDA), Federal
Land Development Authority (FELDA), Federal Land Consolidation and Rehabilitation
Authority (FELCRA), Malaysian Rubber Board (MRB), International Rubber Study Group
(IRSG) and other related agencies.
The Department would like to express appreciation to all those involved for their kind
co-operation in making this publication a success. All comments and suggestions towards
improving this publication in future would be greatly appreciated.
DATO’ HAJAH WAN RAMLAH BT. WAN ABD. RAOF
Chief Statistician, Malaysia
May 2011
iii
KANDUNGAN CONTENTS
Muka surat
Page Kata pengantar Preface Kandungan Contents
i
iii
Penemuan utama Main findings
1
No. Jadual Table No.
SEKSYEN 1 SECTION 1
PERANGKAAN UTAMA INDUSTRI GETAH PRINCIPAL STATISTICS OF RUBBER INDUSTRY
1.1 Perangkaan utama industri getah, 2000-2010 Principal statistics of rubber industry, 2000-2010
11
1.2
1.3
Perangkaan utama industri getah, Januari-Disember 2009 Principal statistics of rubber industry, January-December 2009 Keluasan bertanam dan pengeluaran getah mengikut kawasan, 2009 Planted area and production of rubber by region, 2009
12
13
SEKSYEN 2 SECTION 2
PERANGKAAN UTAMA ESTET GETAH PRINCIPAL STATISTICS OF RUBBER ESTATES
2.1
Perangkaan utama bagi estet getah, 2000-2010 Principal statistics of rubber estates, 2000-2010
15
2.2
Perangkaan utama estet getah mengikut negeri, 2009 Principal statistics of rubber estates by state, 2009
16
2.3
Perangkaan utama estet getah mengikut taraf sah, 2009 Principal statistics of rubber estates by legal status, 2009
17
2.4
Perangkaan utama estet getah mengikut hak milik, 2009 Principal statistics of rubber estates by ownership, 2009
18
iv
2.5
Perangkaan utama estet getah mengikut kumpulan saiz keluasan bertanam, 2009 Principal statistics of rubber estates by planted area size group, 2009
19
SEKSYEN 3 SECTION 3
KELUASAN ESTET ESTATES AREA
3.1
Keluasan bertanam getah di estet mengikut negeri, 2000-2010 Rubber planted area on estates by state, 2000-2010
21
3.2
Keluasan tanaman di estet seperti pada 31 Disember, 2000-2010 Crops area on estates as at 31 December, 2000-2010
22
3.3 Keluasan tanaman di estet mengikut negeri seperti pada 31 Disember 2009 Crops area on estates by state as at 31 December 2009
23
3.4
Keluasan tanaman di estet mengikut hak milik seperti pada 31 Disember 2009 Crops area on estates by ownership as at 31 December 2009
24
3.5
3.6
3.7
Keluasan tanaman di estet mengikut kumpulan saiz keluasan bertanam getah seperti pada 31 Disember 2009 Crops area on estates by rubber planted area size group as at 31 December 2009 Keluasan bertanam getah mengikut kumpulan umur dan negeri, 2009 Rubber planted area by age group and state, 2009 Pengurangan dan penambahan kawasan getah sepanjang 2009 Decrease and increase of rubber area during the year 2009
25
26
27
SEKSYEN 4 SECTION 4
PENGELUARAN DAN HASIL ESTET PRODUCTION AND YIELD ON ESTATES
4.1
Pengeluaran getah di estet mengikut negeri, 2000-2010 Rubber production on estates by state, 2000-2010
29
4.2 Pengeluaran getah di estet mengikut kumpulan saiz keluasan bertanam, 2009 Rubber production on estates by planted area size group, 2009
30
v
4.3 Pengeluaran getah di estet mengikut kumpulan saiz keluasan bertanam dan negeri, 2009 Rubber production on estates by planted area size group and state, 2009
31
4.4
Pengeluaran getah di estet mengikut kumpulan saiz hasil dan negeri, 2009 Rubber production on estates by yield size group and state, 2009
32
SEKSYEN 5 SECTION 5
BILANGAN ORANG YANG DIAMBIL BEKERJA DI ESTET NUMBER OF PERSONS ENGAGED ON ESTATES
5.1
Jumlah bilangan pekerja bergaji di estet mengikut kategori pekerja, 2000-2010 Total number of employees on estates by category of workers, 2000-2010
33
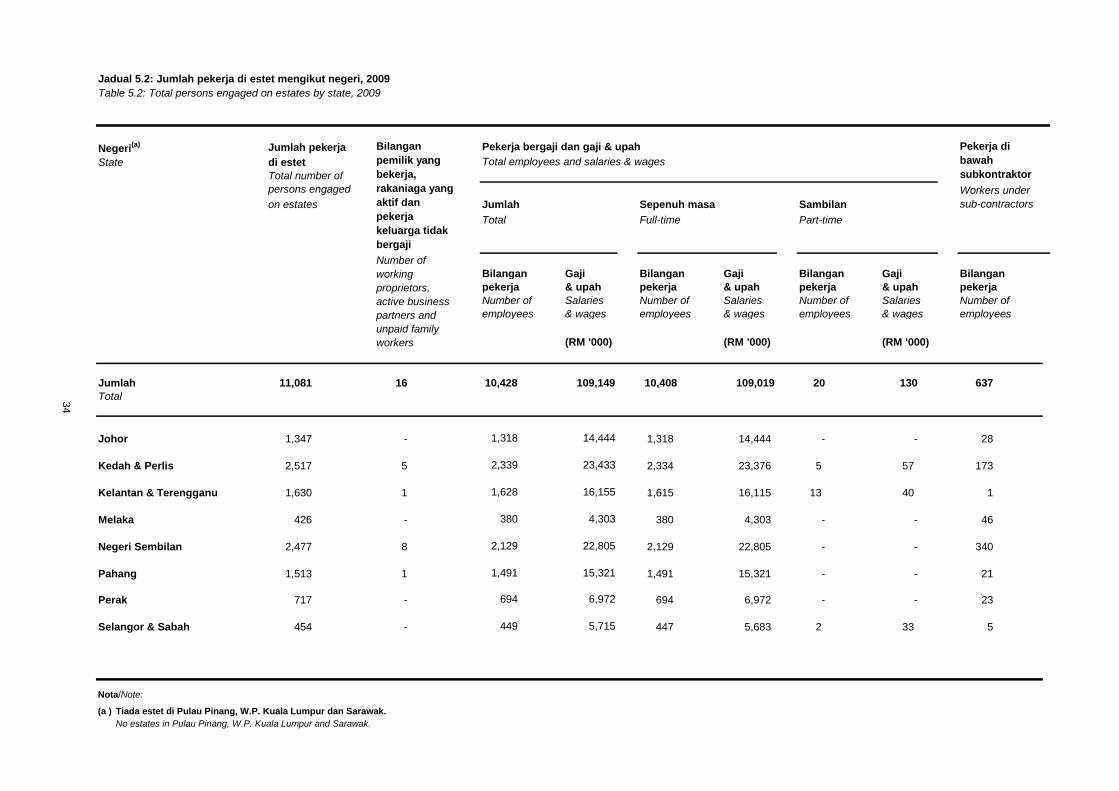
5.2
Jumlah pekerja di estet mengikut negeri, 2009 Total persons engaged on estates by state, 2009
34
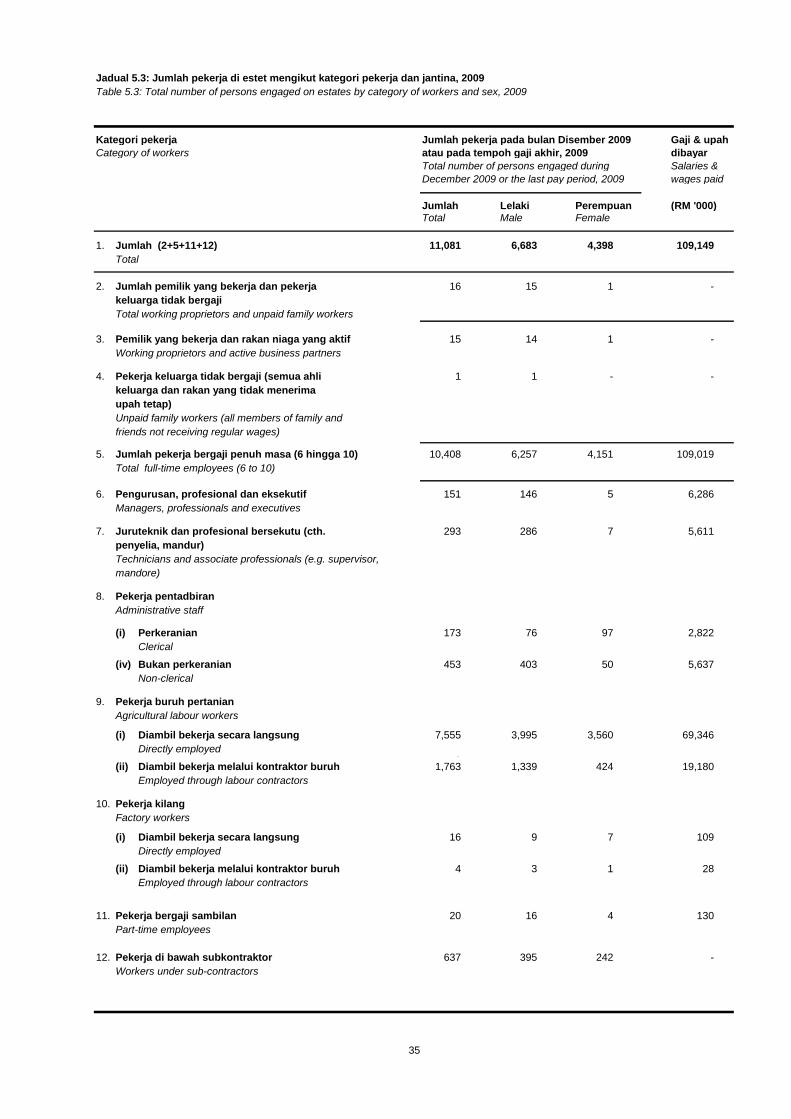
5.3
Jumlah pekerja di estet mengikut kategori pekerja dan jantina, 2009 Total number of persons engaged on estates by category of workers and sex, 2009
35
5.4
Jumlah pekerja di estet mengikut kumpulan saiz keluasan bertanam, 2009 Total number of persons engaged on estates by planted area size group, 2009
36
SEKSYEN 6 SECTION 6
PERBELANJAAN MENANAM, MODAL DAN MENYELENGGARA HARTA DI ESTET
PLANTING, CAPITAL AND ASSETS MAINTENANCE EXPENDITURE ON ESTATES
6.1
Perbelanjaan modal dan nilai aset di estet, 2009 Capital expenditure and value of assets on estates, 2009
37
SEKSYEN 7 SECTION 7
KEBUN KECIL GETAH RUBBER SMALLHOLDINGS
7.1
Keluasan bertanam getah di kebun kecil, 2000-2010 Rubber planted area on smallholdings, 2000-2010
39
vi
7.2 Keluasan bertanam getah di kebun kecil mengikut kawasan/negeri, 2009 Rubber planted area on smallholdings by region/state, 2009
40
7.3
Keluasan tanam baru dan tanam semula getah di kebun kecil, 2000-2010 Newly planted and replanted rubber areas in smallholdings, 2000-2010
41
7.4
Pengeluaran getah di bawah Rancangan FELDA mengikut negeri dan bulan, 2009 Production of rubber under FELDA Schemes by state and month, 2009
42
SEKSYEN 8 SECTION 8
EKSPORT & IMPORT EXPORTS & IMPORTS
8.1
Ringkasan eksport dan import getah, 2000-2010 Summary of exports and imports of rubber, 2000-2010
43
8.2
Eksport mengikut jenis getah dan negara yang dituju, 2009 Exports by type of rubber and country of destination, 2009
44
8.3
Eksport mengikut jenis getah, 2000-2010 Exports by type of rubber, 2000-2010
45
8.4 Eksport getah mengikut negara yang dituju, 2006-2010 Exports of rubber by country of destination, 2006-2010
46
8.5
Eksport susu getah mengikut negara yang dituju, 2006-2010 Exports of latex by country of destination, 2006-2010
47
8.6
Eksport susu getah mengikut jenis, 2000-2010 Exports of latex by type, 2000-2010
48
8.7 Eksport Getah Mutu Malaysia (G.M.M.) mengikut gred, 2000-2010 Exports of Standard Malaysian Rubber (S.M.R.) by grade, 2000-2010
49
8.8 Import getah mengikut jenis dan negara asal, 2009 Imports of rubber by type and country of origin, 2009
50
8.9
Import mengikut jenis getah, 2000-2010 Imports by type of rubber, 2000-2010
51
8.10
Import getah mengikut negara asal, 2006-2010 Imports of rubber by country of origin, 2006-2010
52
vii
SEKSYEN 9 SECTION 9
PENGGUNAAN DOMESTIK GETAH ASLI DOMESTIC CONSUMPTION OF NATURAL RUBBER
9.1
Penggunaan domestik getah asli mengikut industri/keluaran barangan akhir, 2000-2010 Domestic consumption of natural rubber by industry/end product, 2000-2010
53
9.2 Penggunaan domestik bulanan getah asli mengikut industri/keluaran barangan akhir, 2009 Monthly domestic consumption of natural rubber by industry/end product, 2009
54
SEKSYEN 10 SECTION 10
STOK STOCKS
10.1
Stok getah di estet dan pelesen, 2000-2010 Stocks of rubber held by estates and licensees, 2000-2010
55
10.2
Stok getah pada akhir bulan di estet dan pelesen, 2009 Stocks of rubber held at the end of the month by estates and licensees, 2009
56
SEKSYEN 11 SECTION 11
HARGA PRICES
11.1
Purata tahunan harga harian gred terpilih Getah Asap Berbunga (G.A.B.), 2000-2010: Kuala Lumpur, London dan New York Annual average daily prices for selected grades of Ribbed Smoked Sheets (R.S.S.), 2000-2010: Kuala Lumpur, London and New York
57
11.2
Purata bulanan harga harian gred terpilih Getah Mutu Malaysia (G.M.M.), 2009: Kuala Lumpur, London dan New York Monthly average daily prices for selected grades of Standard Malaysian Rubber (S.M.R.), 2009: Kuala Lumpur, London and New York
58
11.3
Harga purata Getah Mutu Malaysia mengikut gred terpilih, 2005-2010 Average prices of Standard Malaysian Rubber by selected grades, 2005-2010
59
viii
SEKSYEN 12 SECTION 12
PERANGKAAN DUNIA (GETAH ASLI DAN TIRUAN) WORLD STATISTICS (NATURAL AND SYNTHETIC RUBBER)
12.1
Keluasan bertanam getah di beberapa negara utama Rubber planted area in major countries
61
12.2
Anggaran pengeluaran, penggunaan dan stok getah asli dan getah tiruan dunia, 2000-2010 Estimated world production, consumption and stock of natural and synthetic rubber, 2000-2010
62
12.3
Pengeluaran getah asli di negara pengeluar utama, 2000-2010 Production of natural rubber in major producing countries, 2000-2010
63
12.4 Eksport kasar getah asli mengikut negara pengeluar utama, 2003-2010 Gross exports of natural rubber by major producing countries, 2003-2010
64
12.5 Import kasar getah asli mengikut negara pengguna utama, 2003-2010 Gross imports of natural rubber by major consuming countries, 2003-2010
65
12.6
Penggunaan getah asli di negara pengguna utama, 2003-2010 Consumption of natural rubber in major consuming countries, 2003-2010
66
12.7
Stok getah asli di negara pengeluar dan pengguna utama seperti pada 31 Disember, 2003-2009 Stocks of natural rubber in major producing and consuming countries as at 31 December, 2003-2010
67
12.8 Penggunaan susu getah asli di negara pengguna utama, 2003-2010 Consumption of natural rubber latex in major consuming countries, 2003-2010
68
12.9
Pengeluaran getah tiruan mengikut negara pengeluar utama, 2000-2010 Production of synthetic rubber by major producing countries, 2000-2010
69
12.10 Eksport kasar bagi getah tiruan mengikut negara pengeluar utama, 2003-2009 Gross exports of synthetic rubber by major producing countries, 2003-2009
70
ix
12.11 Import kasar getah tiruan mengikut negara pengguna utama, 2003-2010 Gross imports of synthetic rubber by major consuming countries, 2003-2010
71
12.12
Penggunaan getah tiruan mengikut negara pengguna utama, 2003-2010 Consumption of synthetic rubber in major consuming countries, 2003-2010
72
12.13
Stok getah tiruan yang dilaporkan seperti pada 31 Disember, 2003-2010 Stocks of synthetic rubber as reported as at 31 December, 2003-2010
73
Nota teknikal Technical notes
75
Lampiran Appendix
Senarai agensi sebagai sumber data sekunder, 2009 dan 2010 List of agencies as sources of secondary data, 2009 and 2010
93

PENEMUAN UTAMAMAIN FINDINGS
1
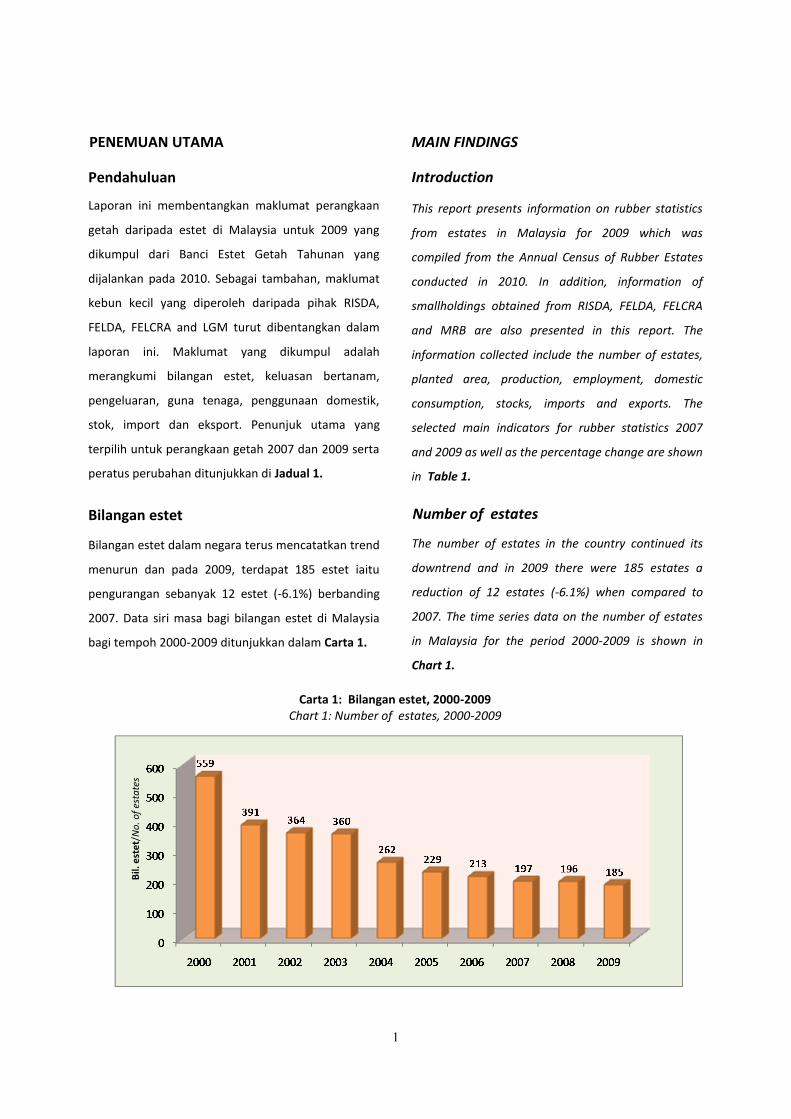
Bilangan estet dalam negara terus mencatatkan trend
menurun dan pada 2009, terdapat 185 estet iaitu
pengurangan sebanyak 12 estet (-6.1%) berbanding
2007. Data siri masa bagi bilangan estet di Malaysia
bagi tempoh 2000-2009 ditunjukkan dalam Carta 1.
The number of estates in the country continued its
downtrend and in 2009 there were 185 estates a
reduction of 12 estates (-6.1%) when compared to
2007. The time series data on the number of estates
in Malaysia for the period 2000-2009 is shown in
Chart 1.
Bilangan estet Number of estates
Carta 1: Bilangan estet, 2000-2009 Chart 1: Number of estates, 2000-2009
This report presents information on rubber statistics
from estates in Malaysia for 2009 which was
compiled from the Annual Census of Rubber Estates
conducted in 2010. In addition, information of
smallholdings obtained from RISDA, FELDA, FELCRA
and MRB are also presented in this report. The
information collected include the number of estates,
planted area, production, employment, domestic
consumption, stocks, imports and exports. The
selected main indicators for rubber statistics 2007
and 2009 as well as the percentage change are shown
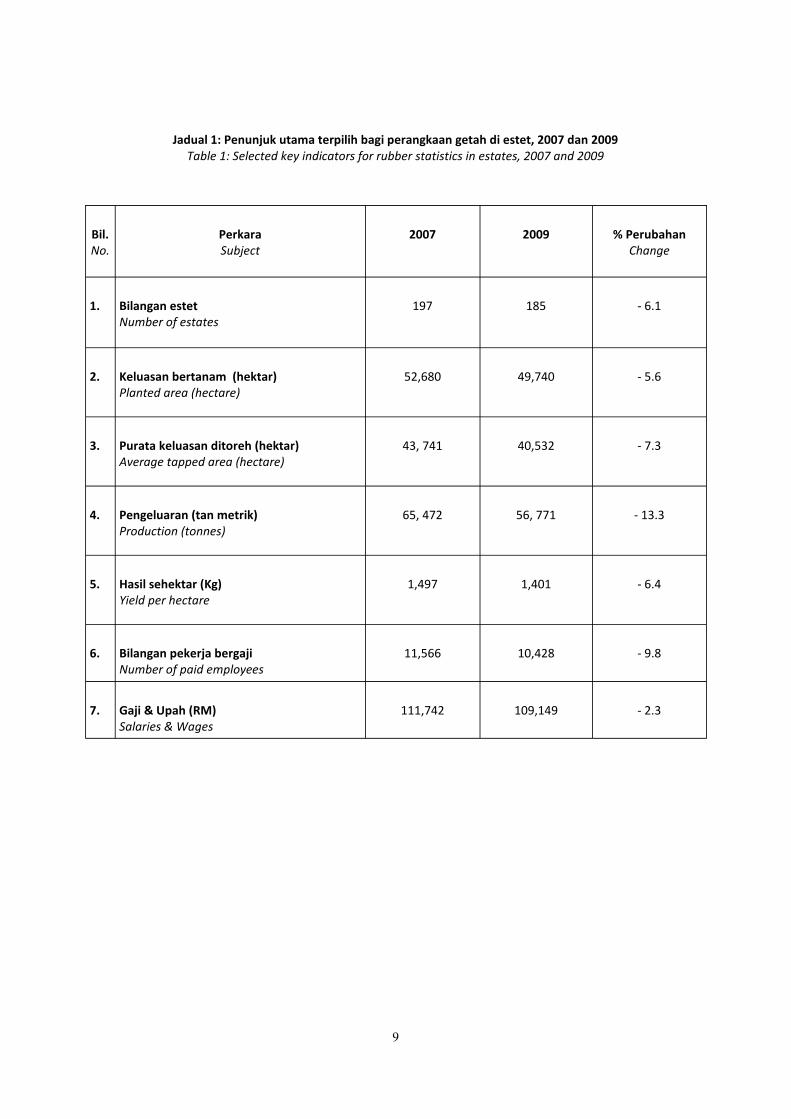
in Table 1.
Introduction
MAIN FINDINGS
Laporan ini membentangkan maklumat perangkaan
getah daripada estet di Malaysia untuk 2009 yang
dikumpul dari Banci Estet Getah Tahunan yang
dijalankan pada 2010. Sebagai tambahan, maklumat
kebun kecil yang diperoleh daripada pihak RISDA,
FELDA, FELCRA and LGM turut dibentangkan dalam
laporan ini. Maklumat yang dikumpul adalah
merangkumi bilangan estet, keluasan bertanam,
pengeluaran, guna tenaga, penggunaan domestik,
stok, import dan eksport. Penunjuk utama yang
terpilih untuk perangkaan getah 2007 dan 2009 serta
peratus perubahan ditunjukkan di Jadual 1.
PENEMUAN UTAMA
Pendahuluan
Bil.
est
et/
No
. of
esta
tes
2
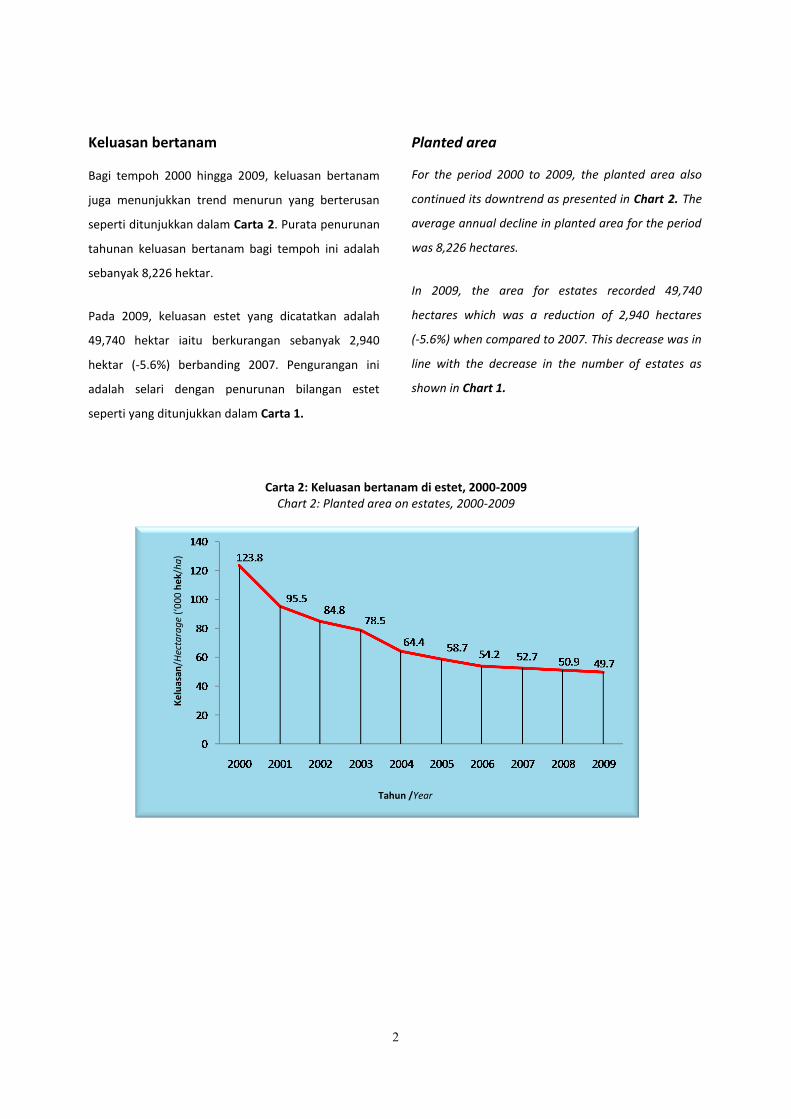
Carta 2: Keluasan bertanam di estet, 2000-2009 Chart 2: Planted area on estates, 2000-2009
Ke
luas
an/H
ecta
rag
e (‘
00
0 h
ek/
ha
)
Planted area
For the period 2000 to 2009, the planted area also
continued its downtrend as presented in Chart 2. The
average annual decline in planted area for the period
was 8,226 hectares.
In 2009, the area for estates recorded 49,740
hectares which was a reduction of 2,940 hectares
(-5.6%) when compared to 2007. This decrease was in
line with the decrease in the number of estates as
shown in Chart 1.
Keluasan bertanam
Bagi tempoh 2000 hingga 2009, keluasan bertanam
juga menunjukkan trend menurun yang berterusan
seperti ditunjukkan dalam Carta 2. Purata penurunan
tahunan keluasan bertanam bagi tempoh ini adalah
sebanyak 8,226 hektar.
Pada 2009, keluasan estet yang dicatatkan adalah
49,740 hektar iaitu berkurangan sebanyak 2,940
hektar (-5.6%) berbanding 2007. Pengurangan ini
adalah selari dengan penurunan bilangan estet
seperti yang ditunjukkan dalam Carta 1.
Tahun /Year
3
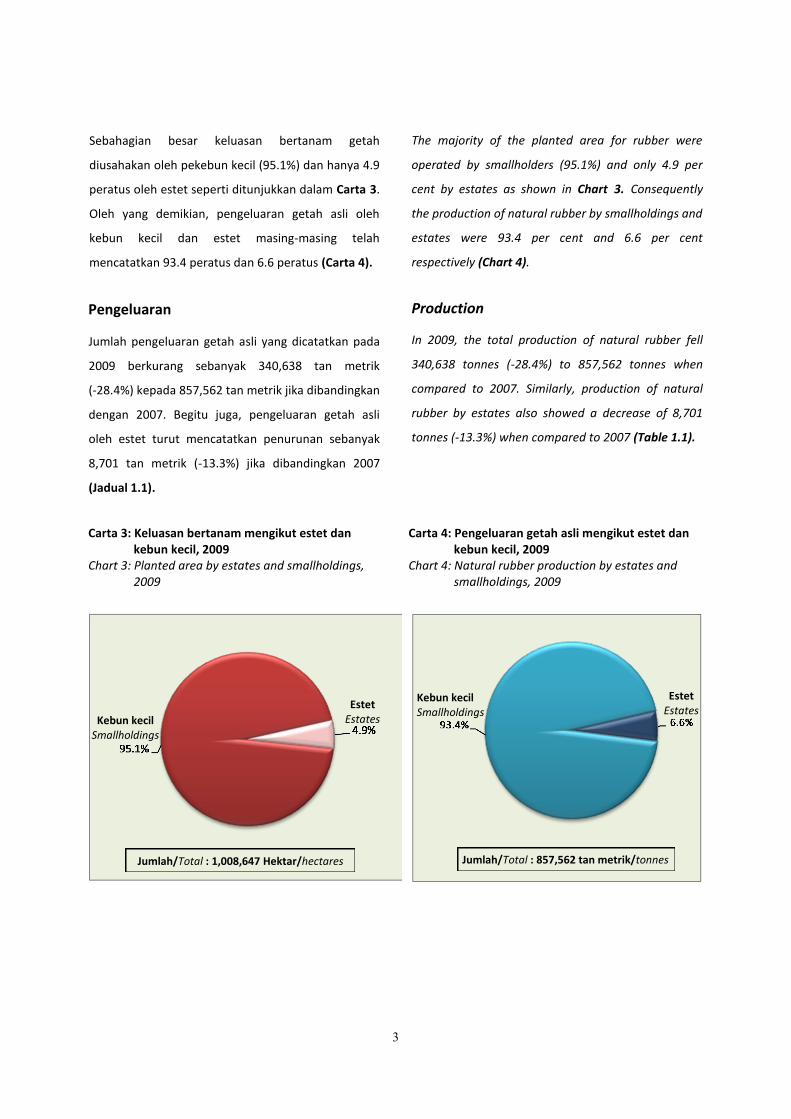
Carta 4: Pengeluaran getah asli mengikut estet dan kebun kecil, 2009 Chart 4: Natural rubber production by estates and smallholdings, 2009
The majority of the planted area for rubber were
operated by smallholders (95.1%) and only 4.9 per
cent by estates as shown in Chart 3. Consequently
the production of natural rubber by smallholdings and
estates were 93.4 per cent and 6.6 per cent
respectively (Chart 4).
Sebahagian besar keluasan bertanam getah
diusahakan oleh pekebun kecil (95.1%) dan hanya 4.9
peratus oleh estet seperti ditunjukkan dalam Carta 3.
Oleh yang demikian, pengeluaran getah asli oleh
kebun kecil dan estet masing-masing telah
mencatatkan 93.4 peratus dan 6.6 peratus (Carta 4).
Kebun kecil Smallholdings
Kebun kecil Smallholdings
Estet Estates
Estet Estates
Carta 3: Keluasan bertanam mengikut estet dan kebun kecil, 2009 Chart 3: Planted area by estates and smallholdings, 2009
In 2009, the total production of natural rubber fell
340,638 tonnes (-28.4%) to 857,562 tonnes when
compared to 2007. Similarly, production of natural
rubber by estates also showed a decrease of 8,701
tonnes (-13.3%) when compared to 2007 (Table 1.1).
Production
Jumlah pengeluaran getah asli yang dicatatkan pada
2009 berkurang sebanyak 340,638 tan metrik
(-28.4%) kepada 857,562 tan metrik jika dibandingkan
dengan 2007. Begitu juga, pengeluaran getah asli
oleh estet turut mencatatkan penurunan sebanyak
8,701 tan metrik (-13.3%) jika dibandingkan 2007
(Jadual 1.1).
Jumlah/Total : 857,562 tan metrik/tonnes
Pengeluaran
Jumlah/Total : 1,008,647 Hektar/hectares
4
Employment Guna tenaga
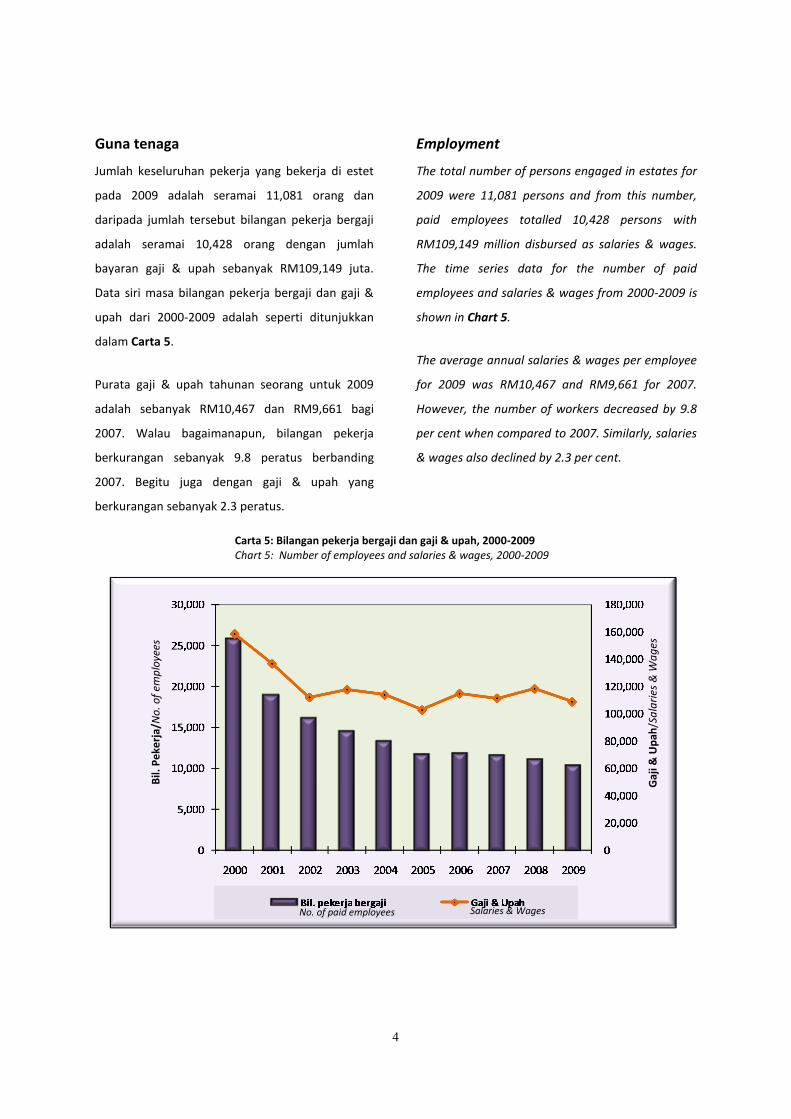
Jumlah keseluruhan pekerja yang bekerja di estet
pada 2009 adalah seramai 11,081 orang dan
daripada jumlah tersebut bilangan pekerja bergaji
adalah seramai 10,428 orang dengan jumlah
bayaran gaji & upah sebanyak RM109,149 juta.
Data siri masa bilangan pekerja bergaji dan gaji &
upah dari 2000-2009 adalah seperti ditunjukkan
dalam Carta 5.
Purata gaji & upah tahunan seorang untuk 2009
adalah sebanyak RM10,467 dan RM9,661 bagi
2007. Walau bagaimanapun, bilangan pekerja
berkurangan sebanyak 9.8 peratus berbanding
2007. Begitu juga dengan gaji & upah yang
berkurangan sebanyak 2.3 peratus.
The total number of persons engaged in estates for
2009 were 11,081 persons and from this number,
paid employees totalled 10,428 persons with
RM109,149 million disbursed as salaries & wages.
The time series data for the number of paid
employees and salaries & wages from 2000-2009 is
shown in Chart 5.
The average annual salaries & wages per employee
for 2009 was RM10,467 and RM9,661 for 2007.
However, the number of workers decreased by 9.8
per cent when compared to 2007. Similarly, salaries
& wages also declined by 2.3 per cent.
Carta 5: Bilangan pekerja bergaji dan gaji & upah, 2000-2009 Chart 5: Number of employees and salaries & wages, 2000-2009
No. of paid employees Salaries & Wages
Gaj
i & U
pah
/Sa
lari
es &
Wa
ges
Bil.
Pe
kerj
a/N
o. o
f em
plo
yees
5
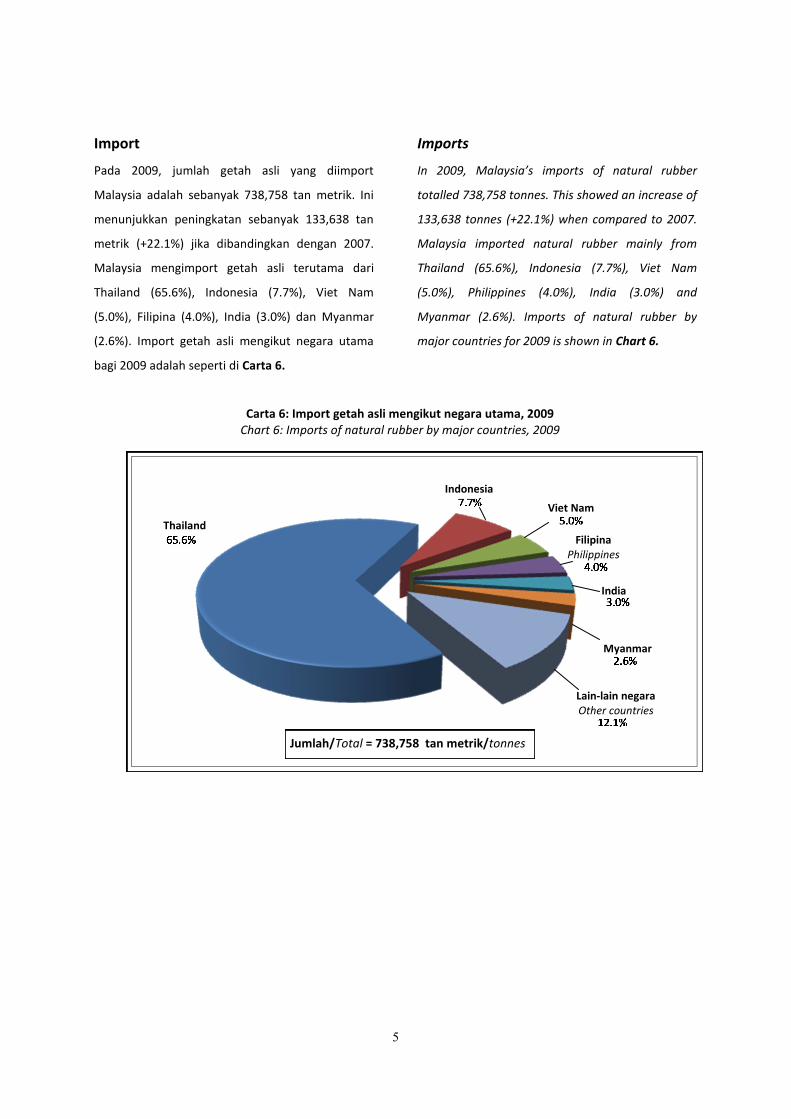
Carta 6: Import getah asli mengikut negara utama, 2009 Chart 6: Imports of natural rubber by major countries, 2009
Imports
In 2009, Malaysia’s imports of natural rubber
totalled 738,758 tonnes. This showed an increase of
133,638 tonnes (+22.1%) when compared to 2007.
Malaysia imported natural rubber mainly from
Thailand (65.6%), Indonesia (7.7%), Viet Nam
(5.0%), Philippines (4.0%), India (3.0%) and
Myanmar (2.6%). Imports of natural rubber by
major countries for 2009 is shown in Chart 6.
Import
Pada 2009, jumlah getah asli yang diimport
Malaysia adalah sebanyak 738,758 tan metrik. Ini
menunjukkan peningkatan sebanyak 133,638 tan
metrik (+22.1%) jika dibandingkan dengan 2007.
Malaysia mengimport getah asli terutama dari
Thailand (65.6%), Indonesia (7.7%), Viet Nam
(5.0%), Filipina (4.0%), India (3.0%) dan Myanmar
(2.6%). Import getah asli mengikut negara utama
bagi 2009 adalah seperti di Carta 6.
Jumlah/Total = 738,758 tan metrik/tonnes
Thailand
Indonesia
Viet Nam
Filipina Philippines
Lain-lain negara Other countries
Myanmar
India
6
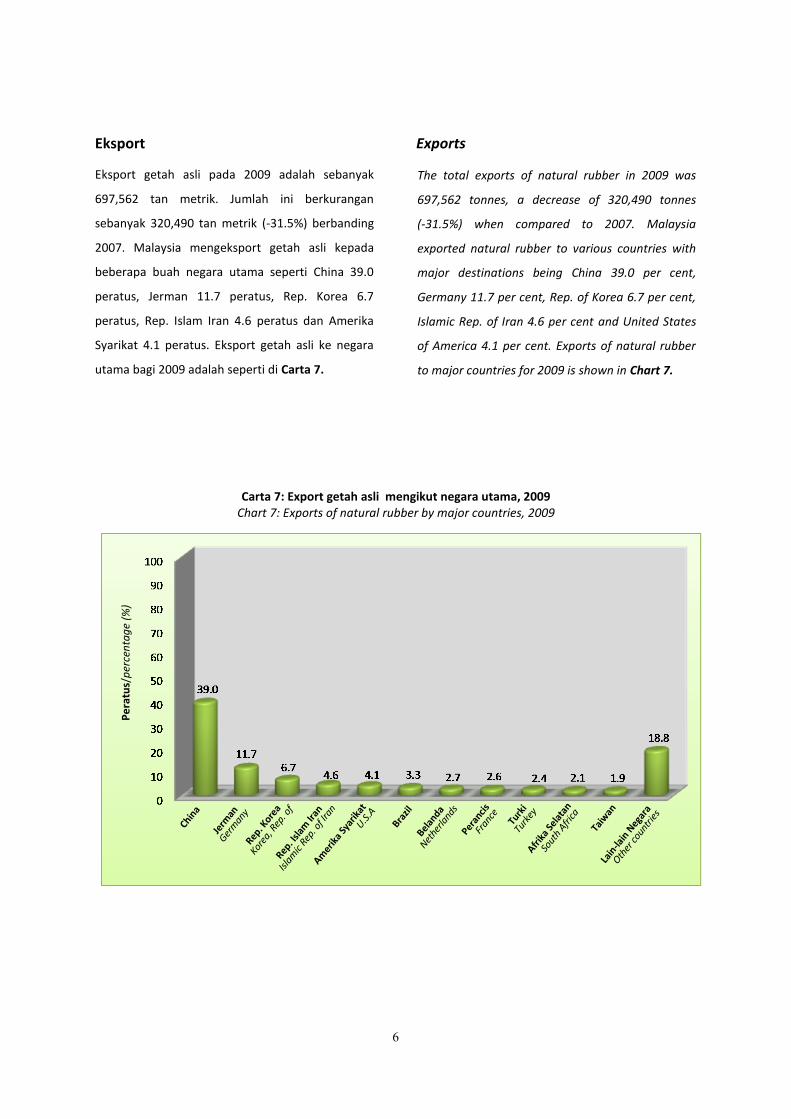
Eksport
Eksport getah asli pada 2009 adalah sebanyak
697,562 tan metrik. Jumlah ini berkurangan
sebanyak 320,490 tan metrik (-31.5%) berbanding
2007. Malaysia mengeksport getah asli kepada
beberapa buah negara utama seperti China 39.0
peratus, Jerman 11.7 peratus, Rep. Korea 6.7
peratus, Rep. Islam Iran 4.6 peratus dan Amerika
Syarikat 4.1 peratus. Eksport getah asli ke negara
utama bagi 2009 adalah seperti di Carta 7.
Exports
The total exports of natural rubber in 2009 was
697,562 tonnes, a decrease of 320,490 tonnes
(-31.5%) when compared to 2007. Malaysia
exported natural rubber to various countries with
major destinations being China 39.0 per cent,
Germany 11.7 per cent, Rep. of Korea 6.7 per cent,
Islamic Rep. of Iran 4.6 per cent and United States
of America 4.1 per cent. Exports of natural rubber
to major countries for 2009 is shown in Chart 7.
Carta 7: Export getah asli mengikut negara utama, 2009 Chart 7: Exports of natural rubber by major countries, 2009
Pe
ratu
s/p
erce
nta
ge
(%)
Taiw
an
Rep
. Isla
m Ir
an
Islam
ic Rep
. of I
ran
Je
rman
Ger
man
y
Chin
a
Rep
. Kore
a
Kore
a, R
ep. o
f
Am
erik
a Sy
arik
at
U.S
.A
Bra
zil
Bel
anda
Nethe
rland
s P
eran
cis
F
ranc
e
Tu
rki
T
urke
y Afr
ika
Sela
tan
S
outh
Afri
ca
L
ain-la
in N
egar
a
Oth
er co
untr
ies
7
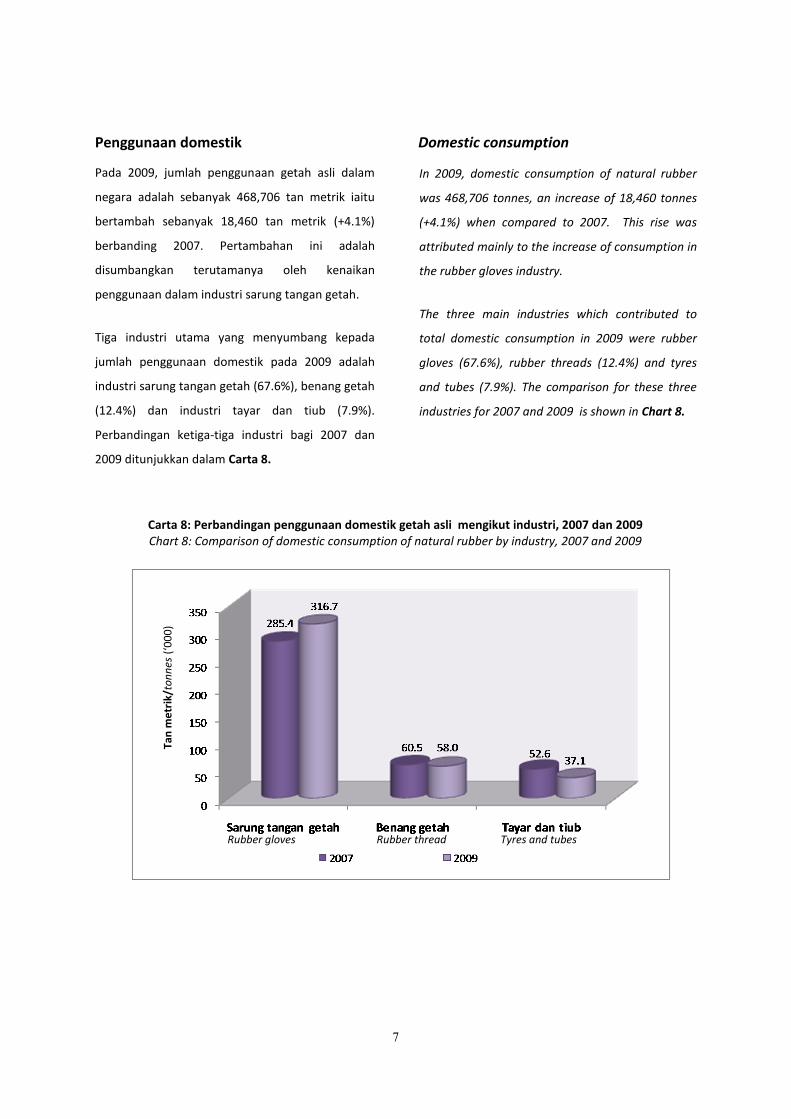
Pada 2009, jumlah penggunaan getah asli dalam
negara adalah sebanyak 468,706 tan metrik iaitu
bertambah sebanyak 18,460 tan metrik (+4.1%)
berbanding 2007. Pertambahan ini adalah
disumbangkan terutamanya oleh kenaikan
penggunaan dalam industri sarung tangan getah.
Tiga industri utama yang menyumbang kepada
jumlah penggunaan domestik pada 2009 adalah
industri sarung tangan getah (67.6%), benang getah
(12.4%) dan industri tayar dan tiub (7.9%).
Perbandingan ketiga-tiga industri bagi 2007 dan
2009 ditunjukkan dalam Carta 8.
Penggunaan domestik Domestic consumption
In 2009, domestic consumption of natural rubber
was 468,706 tonnes, an increase of 18,460 tonnes
(+4.1%) when compared to 2007. This rise was
attributed mainly to the increase of consumption in
the rubber gloves industry.
The three main industries which contributed to
total domestic consumption in 2009 were rubber
gloves (67.6%), rubber threads (12.4%) and tyres
and tubes (7.9%). The comparison for these three
industries for 2007 and 2009 is shown in Chart 8.
Carta 8: Perbandingan penggunaan domestik getah asli mengikut industri, 2007 dan 2009 Chart 8: Comparison of domestic consumption of natural rubber by industry, 2007 and 2009
Rubber thread Rubber gloves Tyres and tubes
Tan
me
trik
/to
nn
es (
‘00
0)
8
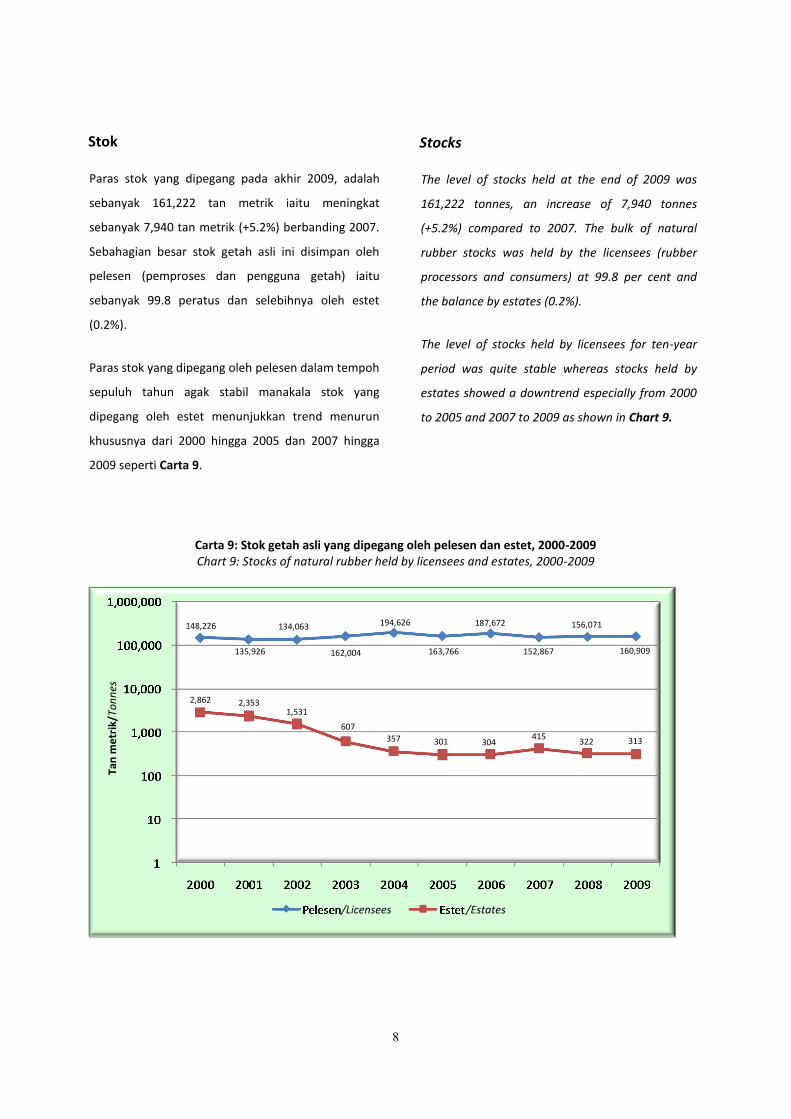
Stocks
The level of stocks held at the end of 2009 was
161,222 tonnes, an increase of 7,940 tonnes
(+5.2%) compared to 2007. The bulk of natural
rubber stocks was held by the licensees (rubber
processors and consumers) at 99.8 per cent and
the balance by estates (0.2%).
The level of stocks held by licensees for ten-year
period was quite stable whereas stocks held by
estates showed a downtrend especially from 2000
to 2005 and 2007 to 2009 as shown in Chart 9.
Stok
Paras stok yang dipegang pada akhir 2009, adalah
sebanyak 161,222 tan metrik iaitu meningkat
sebanyak 7,940 tan metrik (+5.2%) berbanding 2007.
Sebahagian besar stok getah asli ini disimpan oleh
pelesen (pemproses dan pengguna getah) iaitu
sebanyak 99.8 peratus dan selebihnya oleh estet
(0.2%).
Paras stok yang dipegang oleh pelesen dalam tempoh
sepuluh tahun agak stabil manakala stok yang
dipegang oleh estet menunjukkan trend menurun
khususnya dari 2000 hingga 2005 dan 2007 hingga
2009 seperti Carta 9.
Carta 9: Stok getah asli yang dipegang oleh pelesen dan estet, 2000-2009 Chart 9: Stocks of natural rubber held by licensees and estates, 2000-2009
/Licensees /Estates
Tan
me
trik
/To
nn
es
415 313 301
607
357 304 322
1,531 2,353 2,862
135,926
148,226 134,063
162,004
194,626
163,766 152,867
187,672 156,071
160,909
9
Jadual 1: Penunjuk utama terpilih bagi perangkaan getah di estet, 2007 dan 2009 Table 1: Selected key indicators for rubber statistics in estates, 2007 and 2009
Bil. No.
Perkara Subject
2007
2009
% Perubahan
Change
1.
Bilangan estet Number of estates
197
185
- 6.1
2.
Keluasan bertanam (hektar) Planted area (hectare)
52,680
49,740
- 5.6
3.
Purata keluasan ditoreh (hektar) Average tapped area (hectare)
43, 741
40,532
- 7.3
4.
Pengeluaran (tan metrik) Production (tonnes)
65, 472
56, 771
- 13.3
5.
Hasil sehektar (Kg) Yield per hectare
1,497
1,401
- 6.4
6.
Bilangan pekerja bergaji Number of paid employees
11,566
10,428
- 9.8
7.
Gaji & Upah (RM) Salaries & Wages
111,742
109,149
- 2.3
JADUAL
TABLES
SEKSYEN 1: PERANGKAAN UTAMA INDUSTRI GETAH
SECTION 1: PRINCIPAL STATISTICS OF RUBBER INDUSTRY
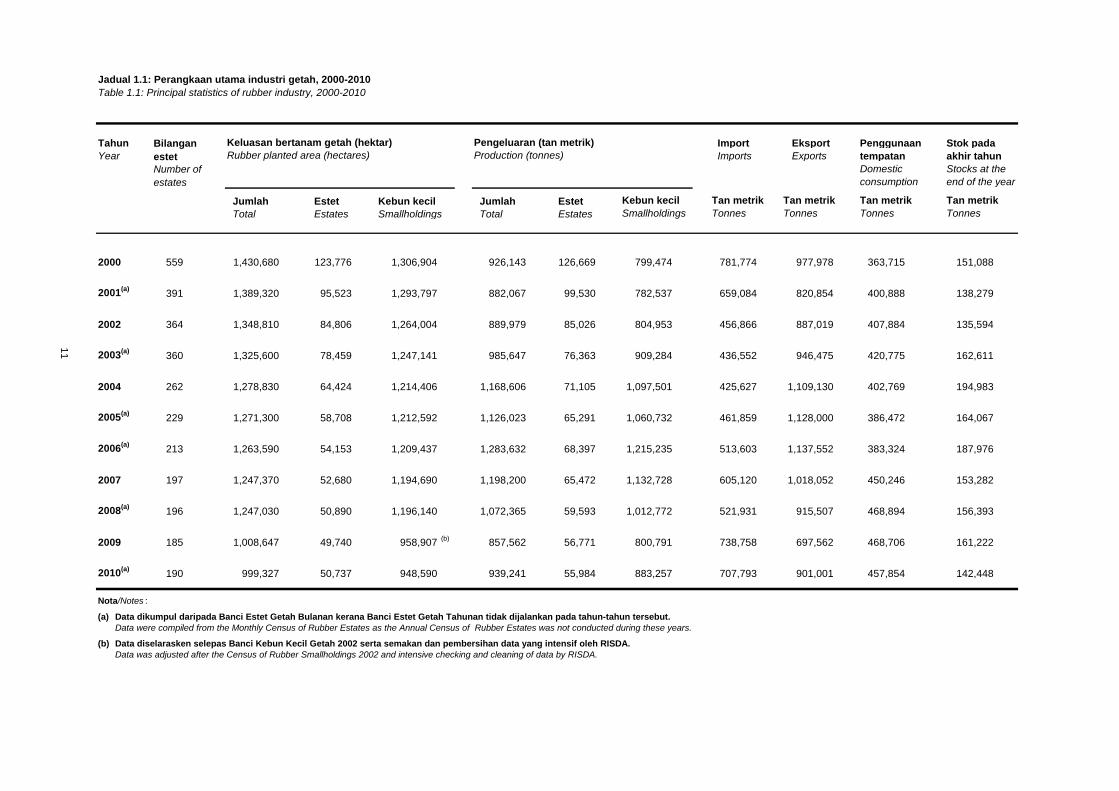
Jadual 1.1: Perangkaan utama industri getah, 2000-2010
Table 1.1: Principal statistics of rubber industry, 2000-2010
Tahun Import Eksport Penggunaan Stok pada
Year Imports Exports tempatan akhir tahun
Domestic Stocks at the
consumption end of the year
Jumlah Estet Kebun kecil Jumlah Estet Kebun kecil Tan metrik Tan metrik Tan metrik Tan metrik
Total Estates Smallholdings Total Estates Smallholdings Tonnes Tonnes Tonnes Tonnes
559 1,430,680 123,776 1,306,904 926,143 126,669 799,474 781,774 977,978 363,715 151,088
2001(a)
391 1,389,320 95,523 1,293,797 882,067 99,530 782,537 659,084 820,854 400,888 138,279
364 1,348,810 84,806 1,264,004 889,979 85,026 804,953 456,866 887,019 407,884 135,594
2003(a)
360 1,325,600 78,459 1,247,141 985,647 76,363 909,284 436,552 946,475 420,775 162,611
262 1,278,830 64,424 1,214,406 1,168,606 71,105 1,097,501 425,627 1,109,130 402,769 194,983
2005(a)
229 1,271,300 58,708 1,212,592 1,126,023 65,291 1,060,732 461,859 1,128,000 386,472 164,067
2006(a)
213 1,263,590 54,153 1,209,437 1,283,632 68,397 1,215,235 513,603 1,137,552 383,324 187,976
2007 197 1,247,370 52,680 1,194,690 1,198,200 65,472 1,132,728 605,120 1,018,052 450,246 153,282
2008(a)
196 1,247,030 50,890 1,196,140 1,072,365 59,593 1,012,772 521,931 915,507 468,894 156,393
2009 185 1,008,647 49,740 958,907(b)
857,562 56,771 800,791 738,758 697,562 468,706 161,222
2010(a)
190 999,327 50,737 948,590 939,241 55,984 883,257 707,793 901,001 457,854 142,448
Nota/Notes :
(a)
Data were compiled from the Monthly Census of Rubber Estates as the Annual Census of Rubber Estates was not conducted during these years.
(b) Data diselarasken selepas Banci Kebun Kecil Getah 2002 serta semakan dan pembersihan data yang intensif oleh RISDA.
Data was adjusted after the Census of Rubber Smallholdings 2002 and intensive checking and cleaning of data by RISDA.
11
Number of
estates
Data dikumpul daripada Banci Estet Getah Bulanan kerana Banci Estet Getah Tahunan tidak dijalankan pada tahun-tahun tersebut.
Bilangan
estet
Keluasan bertanam getah (hektar) Pengeluaran (tan metrik)
Rubber planted area (hectares) Production (tonnes)
2004
2002
2000
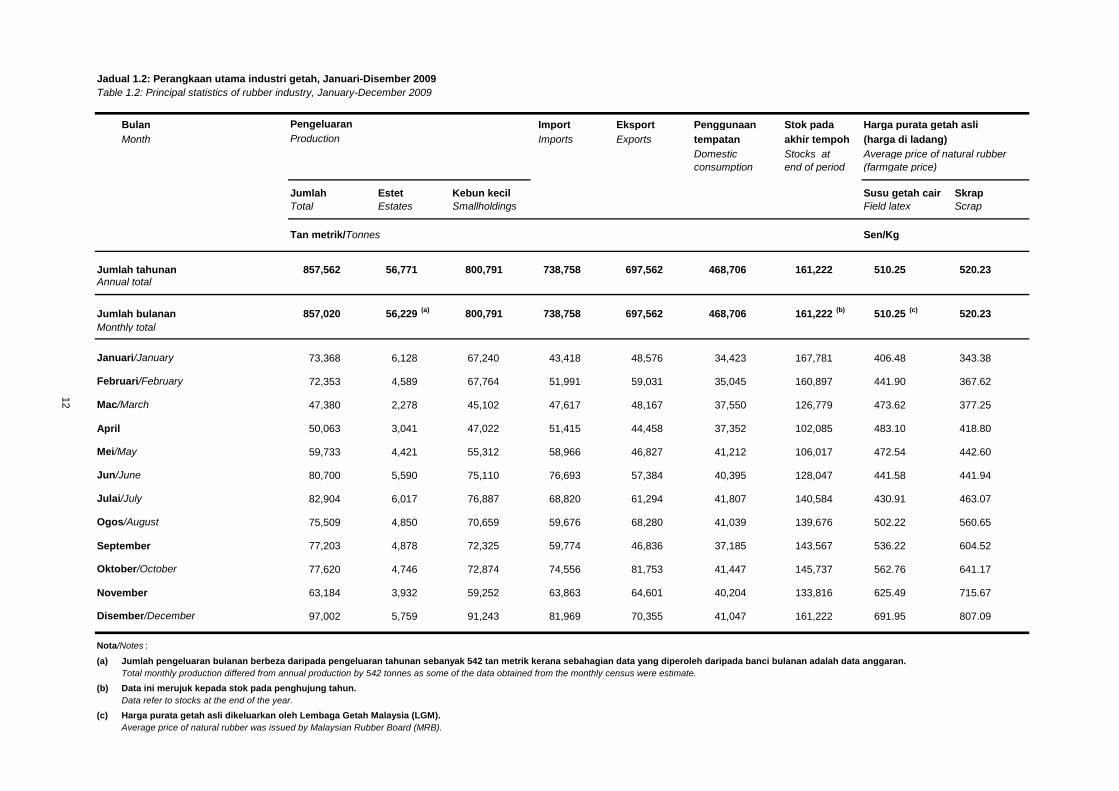
Jadual 1.2: Perangkaan utama industri getah, Januari-Disember 2009
Table 1.2: Principal statistics of rubber industry, January-December 2009
Bulan Import Eksport Penggunaan Stok pada Harga purata getah asli
Month Imports Exports tempatan akhir tempoh (harga di ladang)
Domestic Stocks at Average price of natural rubber
consumption end of period (farmgate price)
Jumlah Estet Kebun kecil Susu getah cair Skrap
Total Estates Smallholdings Field latex Scrap
857,562 56,771 800,791 738,758 697,562 468,706 161,222 510.25 520.23Annual total
Jumlah bulanan 857,020 56,229(a)
800,791 738,758 697,562 468,706 161,222(b)
510.25(c)
520.23
Monthly total
Januari/January 73,368 6,128 67,240 43,418 48,576 34,423 167,781 406.48 343.38
Februari/February 72,353 4,589 67,764 51,991 59,031 35,045 160,897 441.90 367.62
Mac/March 47,380 2,278 45,102 47,617 48,167 37,550 126,779 473.62 377.25
April 50,063 3,041 47,022 51,415 44,458 37,352 102,085 483.10 418.80
Mei/May 59,733 4,421 55,312 58,966 46,827 41,212 106,017 472.54 442.60
Jun/June 80,700 5,590 75,110 76,693 57,384 40,395 128,047 441.58 441.94
Julai/July 82,904 6,017 76,887 68,820 61,294 41,807 140,584 430.91 463.07
Ogos/August 75,509 4,850 70,659 59,676 68,280 41,039 139,676 502.22 560.65
September 77,203 4,878 72,325 59,774 46,836 37,185 143,567 536.22 604.52
Oktober/October 77,620 4,746 72,874 74,556 81,753 41,447 145,737 562.76 641.17
November 63,184 3,932 59,252 63,863 64,601 40,204 133,816 625.49 715.67
Disember/December 97,002 5,759 91,243 81,969 70,355 41,047 161,222 691.95 807.09
Nota/Notes :
(a)
Total monthly production differed from annual production by 542 tonnes as some of the data obtained from the monthly census were estimate.
(b) Data ini merujuk kepada stok pada penghujung tahun.
Data refer to stocks at the end of the year.
(c) Harga purata getah asli dikeluarkan oleh Lembaga Getah Malaysia (LGM).
Average price of natural rubber was issued by Malaysian Rubber Board (MRB).
12
Sen/Kg
Jumlah tahunan
Pengeluaran
Production
Tan metrik/Tonnes
Jumlah pengeluaran bulanan berbeza daripada pengeluaran tahunan sebanyak 542 tan metrik kerana sebahagian data yang diperoleh daripada banci bulanan adalah data anggaran.
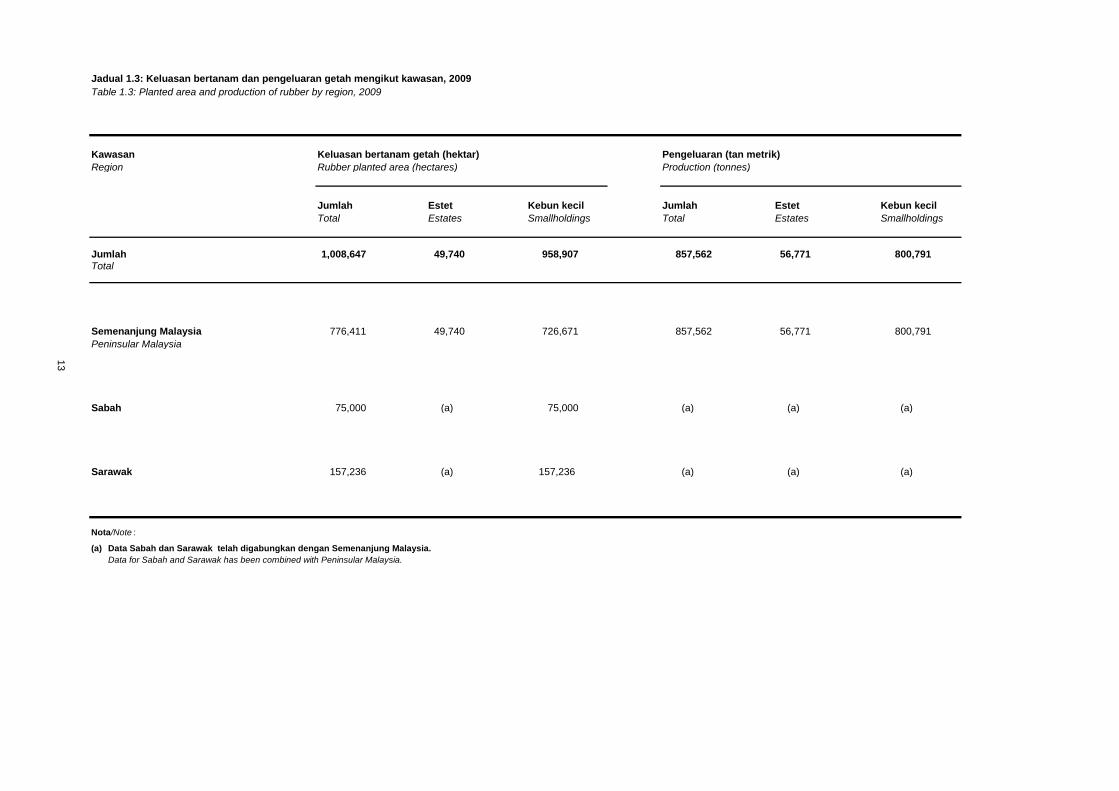
Jadual 1.3: Keluasan bertanam dan pengeluaran getah mengikut kawasan, 2009
Table 1.3: Planted area and production of rubber by region, 2009
Kawasan Keluasan bertanam getah (hektar) Pengeluaran (tan metrik)
Region Rubber planted area (hectares) Production (tonnes)
Jumlah Estet Kebun kecil Jumlah Estet Kebun kecil
Total Estates Smallholdings Total Estates Smallholdings
Jumlah 1,008,647 49,740 958,907 857,562 56,771 800,791
Total
Semenanjung Malaysia 776,411 49,740 726,671 857,562 56,771 800,791
Peninsular Malaysia
Sabah 75,000 (a) 75,000 (a) (a) (a)
Sarawak 157,236 (a) 157,236 (a) (a) (a)
Nota/Note :
(a) Data Sabah dan Sarawak telah digabungkan dengan Semenanjung Malaysia.
Data for Sabah and Sarawak has been combined with Peninsular Malaysia.
13
SEKSYEN 2: PERANGKAAN UTAMA ESTET GETAH
SECTION 2: PRINCIPAL STATISTICS OF RUBBER ESTATES
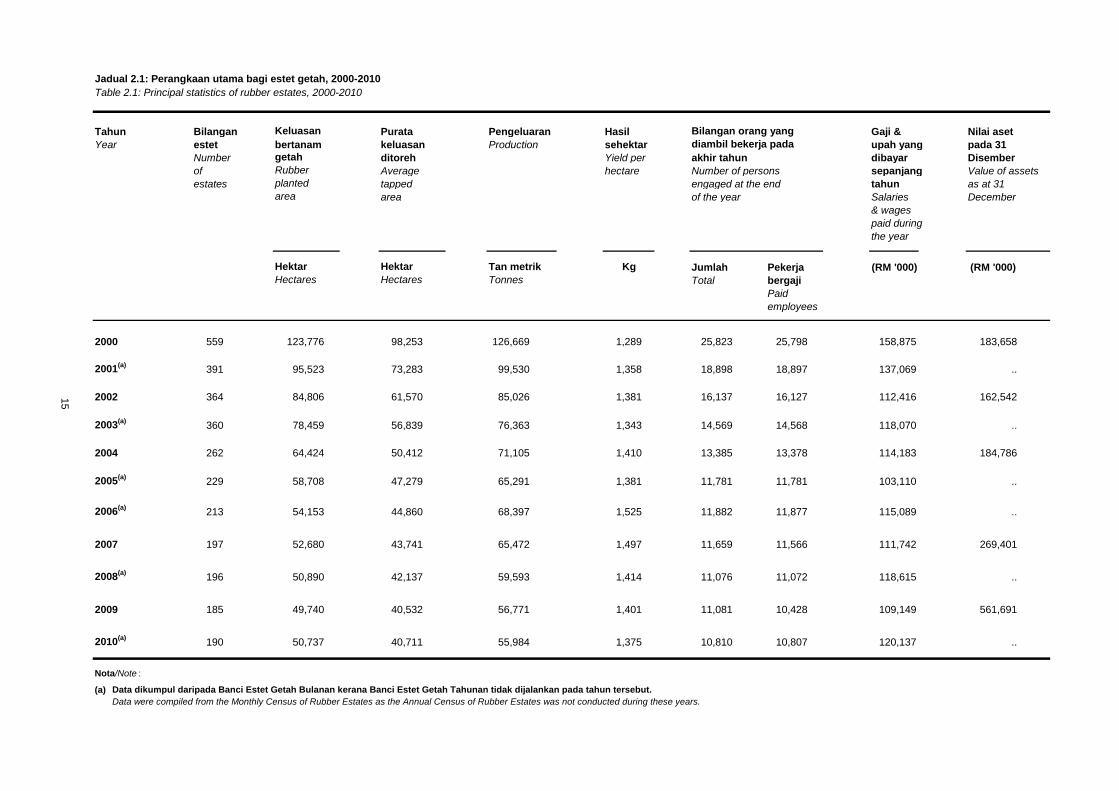
Jadual 2.1: Perangkaan utama bagi estet getah, 2000-2010
Table 2.1: Principal statistics of rubber estates, 2000-2010
Tahun Bilangan Keluasan Purata Pengeluaran Hasil Gaji & Nilai aset
Year estet bertanam keluasan Production sehektar upah yang pada 31
Number getah ditoreh Yield per akhir tahun dibayar Disember
of Rubber Average hectare Number of persons sepanjang Value of assets
estates planted tapped engaged at the end tahun as at 31
area area of the year Salaries December
& wages
paid during
the year
Hektar Hektar Jumlah Pekerja (RM '000) (RM '000)
Hectares Hectares Total bergaji
Paid
employees
559 123,776 98,253 126,669 1,289 25,823 25,798 158,875 183,658
2001(a)
391 95,523 73,283 99,530 1,358 18,898 18,897 137,069 ..
364 84,806 61,570 85,026 1,381 16,137 16,127 112,416 162,542
2003(a)
360 78,459 56,839 76,363 1,343 14,569 14,568 118,070 ..
262 64,424 50,412 71,105 1,410 13,385 13,378 114,183 184,786
2005(a)
229 58,708 47,279 65,291 1,381 11,781 11,781 103,110 ..
2006(a)
213 54,153 44,860 68,397 1,525 11,882 11,877 115,089 ..
197 52,680 43,741 65,472 1,497 11,659 11,566 111,742 269,401
2008(a)
196 50,890 42,137 59,593 1,414 11,076 11,072 118,615 ..
185 49,740 40,532 56,771 1,401 11,081 10,428 109,149 561,691
2010(a)
190 50,737 40,711 55,984 1,375 10,810 10,807 120,137 ..
Nota/Note :
(a)
Data were compiled from the Monthly Census of Rubber Estates as the Annual Census of Rubber Estates was not conducted during these years.
Tan metrik
Tonnes
2004
2002
2000
Kg
15
Data dikumpul daripada Banci Estet Getah Bulanan kerana Banci Estet Getah Tahunan tidak dijalankan pada tahun tersebut.
2009
2007
Bilangan orang yang
diambil bekerja pada
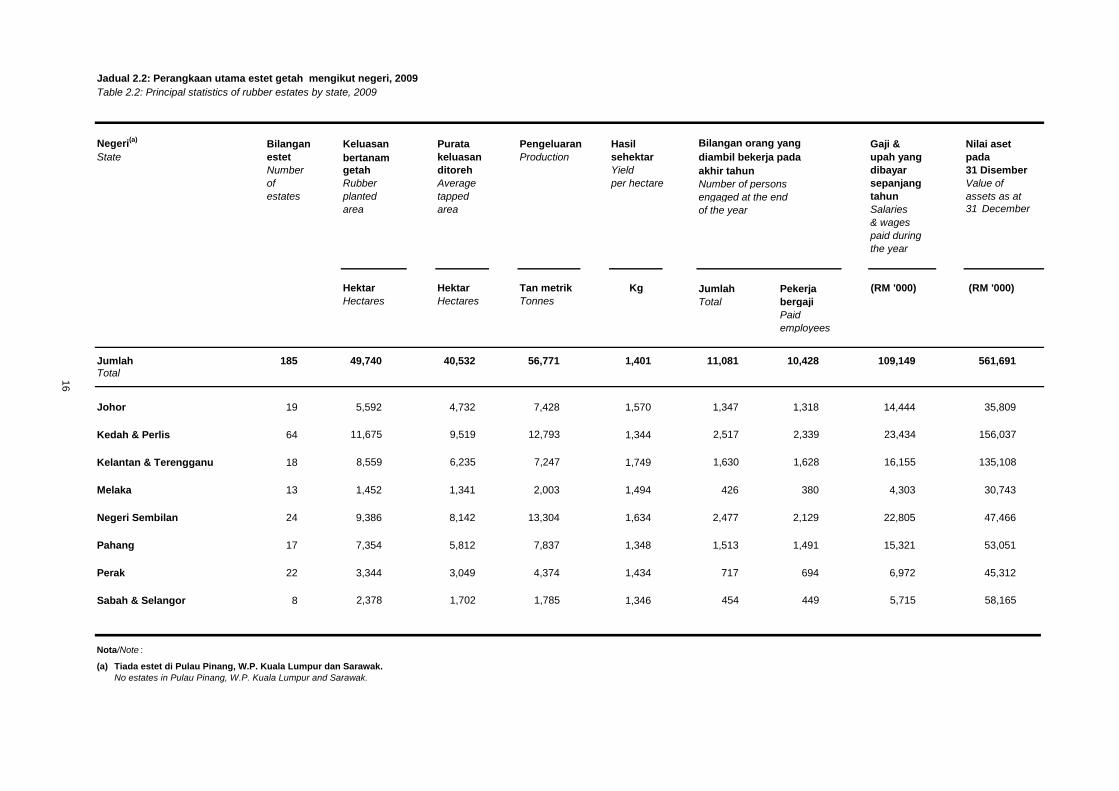
Jadual 2.2: Perangkaan utama estet getah mengikut negeri, 2009
Table 2.2: Principal statistics of rubber estates by state, 2009
Negeri(a)
Bilangan Keluasan Purata Pengeluaran Hasil Gaji & Nilai aset
State estet bertanam keluasan Production sehektar upah yang pada
Number getah ditoreh Yield akhir tahun dibayar 31 Disember
of Rubber Average per hectare Number of persons sepanjang Value of
estates planted tapped engaged at the end tahun assets as at
area area of the year Salaries 31 December
& wages
paid during
the year
Hektar Hektar Tan metrik Jumlah Pekerja (RM '000) (RM '000)
Hectares Hectares Tonnes Total bergaji
Paid
employees
Jumlah 185 49,740 40,532 56,771 1,401 11,081 10,428 109,149 561,691Total
Johor 19 5,592 4,732 7,428 1,570 1,347 1,318 14,444 35,809
Kedah & Perlis 64 11,675 9,519 12,793 1,344 2,517 2,339 23,434 156,037
Kelantan & Terengganu 18 8,559 6,235 7,247 1,749 1,630 1,628 16,155 135,108
Melaka 13 1,452 1,341 2,003 1,494 426 380 4,303 30,743
Negeri Sembilan 24 9,386 8,142 13,304 1,634 2,477 2,129 22,805 47,466
Pahang 17 7,354 5,812 7,837 1,348 1,513 1,491 15,321 53,051
Perak 22 3,344 3,049 4,374 1,434 717 694 6,972 45,312
Sabah & Selangor 8 2,378 1,702 1,785 1,346 454 449 5,715 58,165
Nota/Note :
(a) Tiada estet di Pulau Pinang, W.P. Kuala Lumpur dan Sarawak.
No estates in Pulau Pinang, W.P. Kuala Lumpur and Sarawak.
Bilangan orang yang
diambil bekerja pada
16
Kg
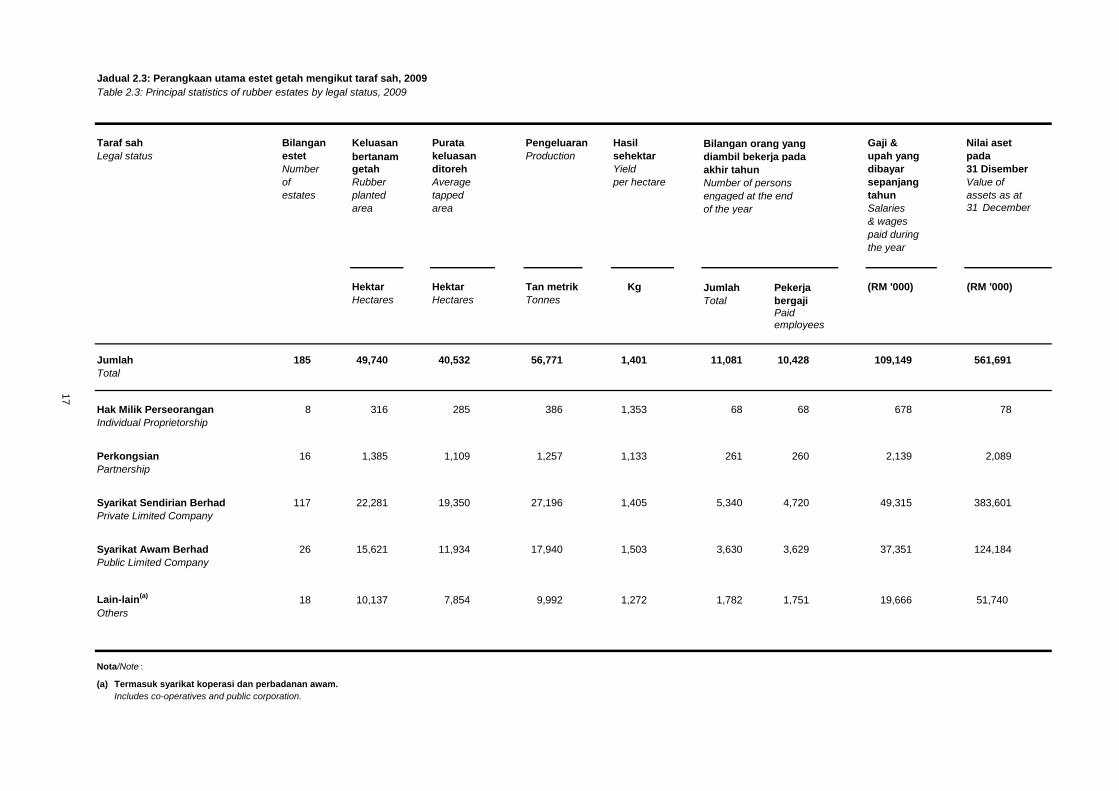
Jadual 2.3: Perangkaan utama estet getah mengikut taraf sah, 2009
Table 2.3: Principal statistics of rubber estates by legal status, 2009
Taraf sah Bilangan Keluasan Purata Pengeluaran Hasil Bilangan orang yang Gaji & Nilai aset
Legal status estet bertanam keluasan Production sehektar diambil bekerja pada upah yang pada
Number getah ditoreh Yield akhir tahun dibayar 31 Disember
of Rubber Average per hectare Number of persons sepanjang Value of
estates planted tapped engaged at the end tahun assets as at
area area of the year Salaries 31 December
& wages
paid during
the year
Hektar Hektar Tan metrik Kg Jumlah Pekerja (RM '000) (RM '000)
Hectares Hectares Tonnes Total bergajiPaidemployees
Jumlah 185 49,740 40,532 56,771 1,401 11,081 10,428 109,149 561,691
Total
Hak Milik Perseorangan 8 316 285 386 1,353 68 68 678 78
Individual Proprietorship
Perkongsian 16 1,385 1,109 1,257 1,133 261 260 2,139 2,089
Partnership
Syarikat Sendirian Berhad 117 22,281 19,350 27,196 1,405 5,340 4,720 49,315 383,601
Private Limited Company
Syarikat Awam Berhad 26 15,621 11,934 17,940 1,503 3,630 3,629 37,351 124,184
Public Limited Company
Lain-lain(a)
18 10,137 7,854 9,992 1,272 1,782 1,751 19,666 51,740
Others
Nota/Note :
(a) Termasuk syarikat koperasi dan perbadanan awam.
Includes co-operatives and public corporation.
17
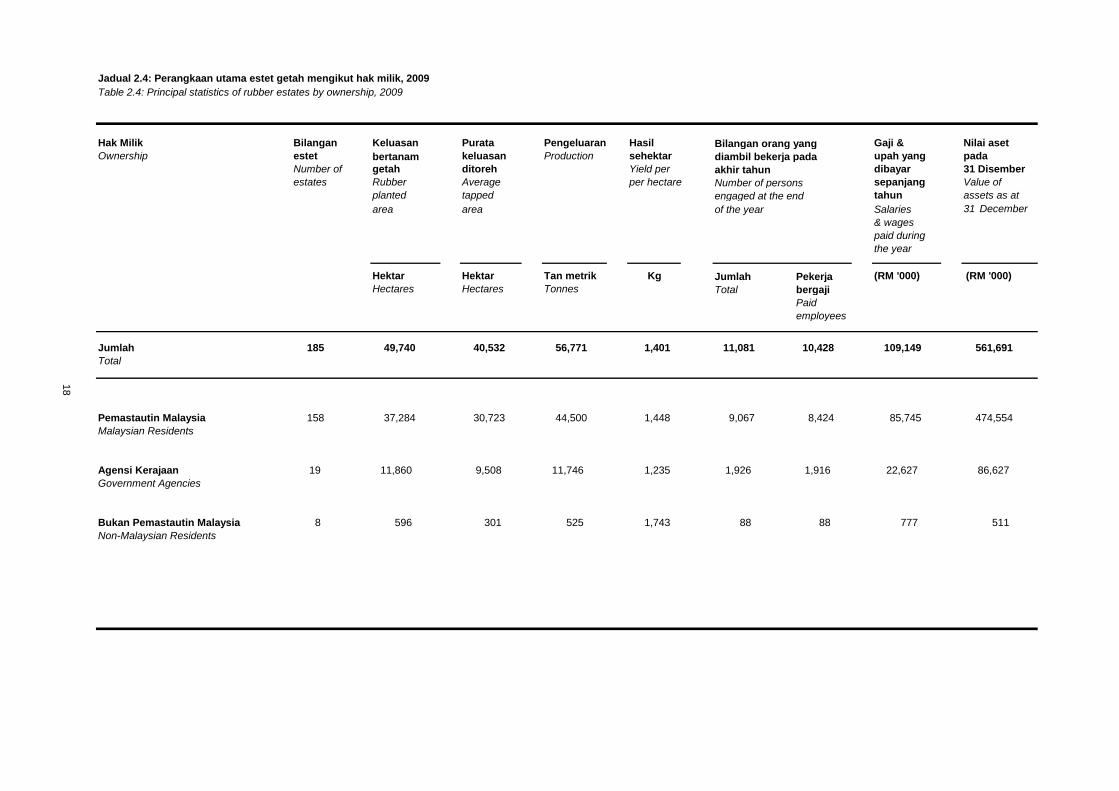
Jadual 2.4: Perangkaan utama estet getah mengikut hak milik, 2009
Table 2.4: Principal statistics of rubber estates by ownership, 2009
Hak Milik Bilangan Keluasan Purata Pengeluaran Hasil Bilangan orang yang Gaji & Nilai aset
Ownership estet bertanam keluasan Production sehektar diambil bekerja pada upah yang pada
Number of getah ditoreh Yield per akhir tahun dibayar 31 Disember
estates Rubber Average per hectare Number of persons sepanjang Value of
planted tapped engaged at the end tahun assets as at
area area of the year Salaries 31 December
& wages
paid during
the year
Hektar Hektar Tan metrik Jumlah Pekerja (RM '000) (RM '000)
Hectares Hectares Tonnes Total bergaji
Paid
employees
Jumlah 185 49,740 40,532 56,771 1,401 11,081 10,428 109,149 561,691
Total
Pemastautin Malaysia 158 37,284 30,723 44,500 1,448 9,067 8,424 85,745 474,554
Malaysian Residents
Agensi Kerajaan 19 11,860 9,508 11,746 1,235 1,926 1,916 22,627 86,627
Government Agencies
Bukan Pemastautin Malaysia 8 596 301 525 1,743 88 88 777 511
Non-Malaysian Residents
18
Kg
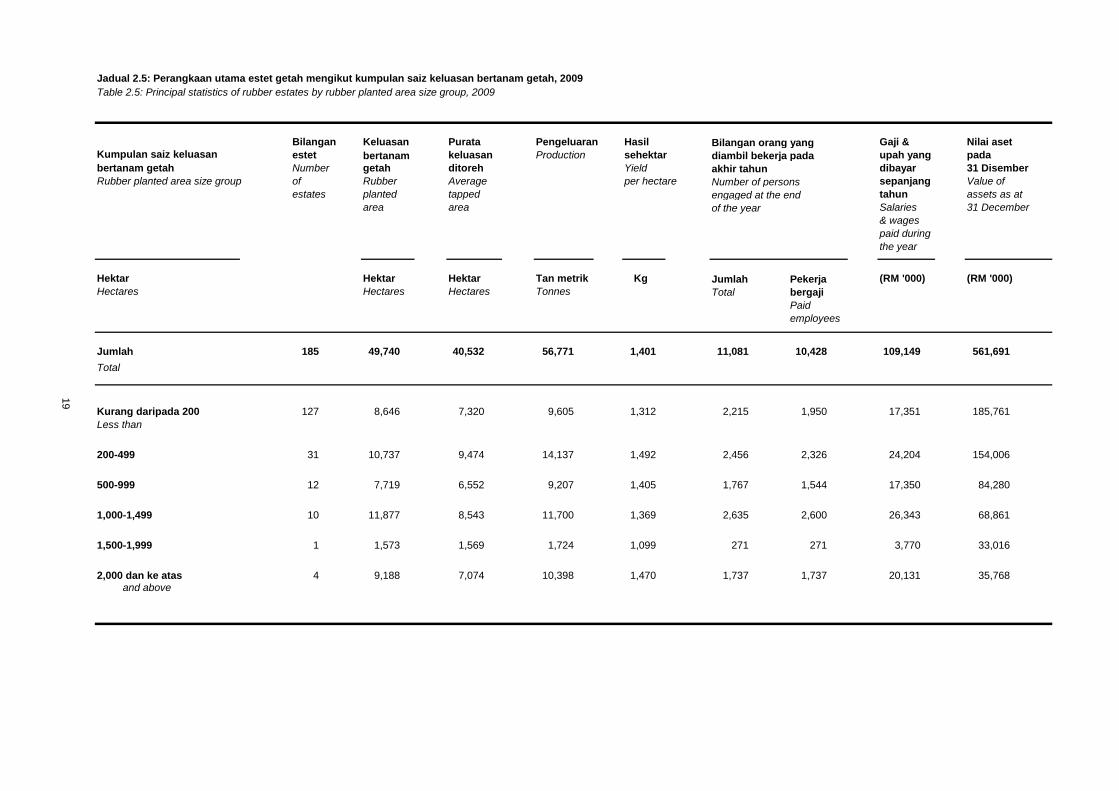
Jadual 2.5: Perangkaan utama estet getah mengikut kumpulan saiz keluasan bertanam getah, 2009
Table 2.5: Principal statistics of rubber estates by rubber planted area size group, 2009
Bilangan Keluasan Purata Pengeluaran Hasil Bilangan orang yang Gaji & Nilai aset
estet bertanam keluasan Production sehektar diambil bekerja pada upah yang pada
Number getah ditoreh Yield akhir tahun dibayar 31 Disember
Rubber planted area size group of Rubber Average per hectare Number of persons sepanjang Value of
estates planted tapped engaged at the end tahun assets as at
area area of the year Salaries 31 December
& wages
paid during
the year
Hektar Hektar Hektar Tan metrik Kg Jumlah Pekerja (RM '000) (RM '000)
Hectares Hectares Hectares Tonnes Total bergaji
Paid
employees
Jumlah 185 49,740 40,532 56,771 1,401 11,081 10,428 109,149 561,691
Total
Kurang daripada 200 127 8,646 7,320 9,605 1,312 2,215 1,950 17,351 185,761
Less than
200-499 31 10,737 9,474 14,137 1,492 2,456 2,326 24,204 154,006
500-999 12 7,719 6,552 9,207 1,405 1,767 1,544 17,350 84,280
1,000-1,499 10 11,877 8,543 11,700 1,369 2,635 2,600 26,343 68,861
1,500-1,999 1 1,573 1,569 1,724 1,099 271 271 3,770 33,016
2,000 dan ke atas 4 9,188 7,074 10,398 1,470 1,737 1,737 20,131 35,768 and above
19
Kumpulan saiz keluasan
bertanam getah
SECTION 3: ESTATES AREA
SEKSYEN 3: KELUASAN ESTET
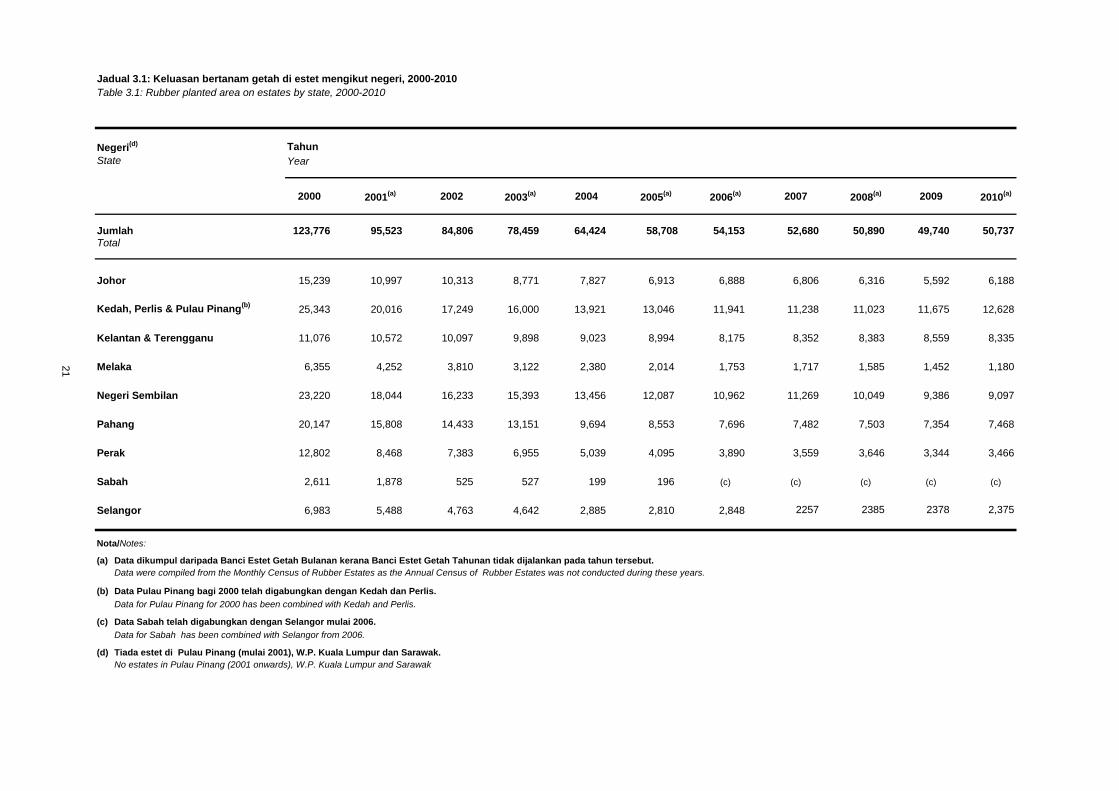
Jadual 3.1: Keluasan bertanam getah di estet mengikut negeri, 2000-2010
Table 3.1: Rubber planted area on estates by state, 2000-2010
Negeri(d) Tahun
Year
2000 2001(a) 2002 2003
(a) 2004 2005(a)
2006(a) 2007 2008
(a) 2009 2010(a)
Jumlah 123,776 95,523 84,806 78,459 64,424 58,708 54,153 52,680 50,890 49,740 50,737Total
Johor 15,239 10,997 10,313 8,771 7,827 6,913 6,888 6,806 6,316 5,592 6,188
Kedah, Perlis & Pulau Pinang(b)
25,343 20,016 17,249 16,000 13,921 13,046 11,941 11,238 11,023 11,675 12,628
Kelantan & Terengganu 11,076 10,572 10,097 9,898 9,023 8,994 8,175 8,352 8,383 8,559 8,335
Melaka 6,355 4,252 3,810 3,122 2,380 2,014 1,753 1,717 1,585 1,452 1,180
Negeri Sembilan 23,220 18,044 16,233 15,393 13,456 12,087 10,962 11,269 10,049 9,386 9,097
Pahang 20,147 15,808 14,433 13,151 9,694 8,553 7,696 7,482 7,503 7,354 7,468
Perak 12,802 8,468 7,383 6,955 5,039 4,095 3,890 3,559 3,646 3,344 3,466
Sabah 2,611 1,878 525 527 199 196 (c) (c) (c) (c) (c)
Selangor 6,983 5,488 4,763 4,642 2,885 2,810 2,848 2257 2385 2378 2,375
Nota/Notes:
(a) Data dikumpul daripada Banci Estet Getah Bulanan kerana Banci Estet Getah Tahunan tidak dijalankan pada tahun tersebut.
Data were compiled from the Monthly Census of Rubber Estates as the Annual Census of Rubber Estates was not conducted during these years.
(b) Data Pulau Pinang bagi 2000 telah digabungkan dengan Kedah dan Perlis.
Data for Pulau Pinang for 2000 has been combined with Kedah and Perlis.
(c) Data Sabah telah digabungkan dengan Selangor mulai 2006.
Data for Sabah has been combined with Selangor from 2006.
(d) Tiada estet di Pulau Pinang (mulai 2001), W.P. Kuala Lumpur dan Sarawak.
No estates in Pulau Pinang (2001 onwards), W.P. Kuala Lumpur and Sarawak
State
21
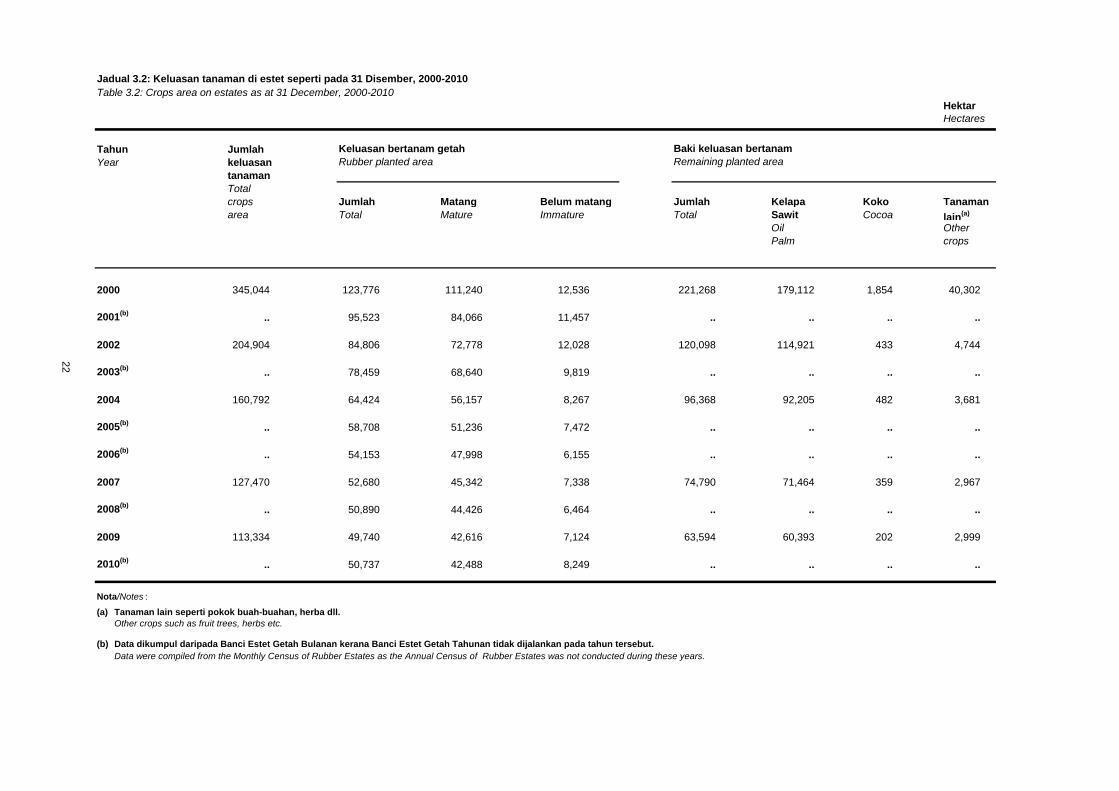
Jadual 3.2: Keluasan tanaman di estet seperti pada 31 Disember, 2000-2010
Table 3.2: Crops area on estates as at 31 December, 2000-2010
Hektar
Hectares
Tahun Jumlah Baki keluasan bertanam
Year keluasan Remaining planted area
tanaman
Total
crops Jumlah Matang Belum matang Jumlah Kelapa Koko Tanaman
area Total Mature Immature Total Sawit Cocoa lain(a)
Oil Other
Palm crops
345,044 123,776 111,240 12,536 221,268 179,112 1,854 40,302
2001(b)
.. 95,523 84,066 11,457 .. .. .. ..
204,904 84,806 72,778 12,028 120,098 114,921 433 4,744
2003(b)
.. 78,459 68,640 9,819 .. .. .. ..
160,792 64,424 56,157 8,267 96,368 92,205 482 3,681
2005(b)
.. 58,708 51,236 7,472 .. .. .. ..
2006(b)
.. 54,153 47,998 6,155 .. .. .. ..
127,470 52,680 45,342 7,338 74,790 71,464 359 2,967
2008(b)
.. 50,890 44,426 6,464 .. .. .. ..
113,334 49,740 42,616 7,124 63,594 60,393 202 2,999
2010(b)
.. 50,737 42,488 8,249 .. .. .. ..
Nota/Notes :
(a) Tanaman lain seperti pokok buah-buahan, herba dll.
Other crops such as fruit trees, herbs etc.
(b)
Data were compiled from the Monthly Census of Rubber Estates as the Annual Census of Rubber Estates was not conducted during these years.
22
Data dikumpul daripada Banci Estet Getah Bulanan kerana Banci Estet Getah Tahunan tidak dijalankan pada tahun tersebut.
Keluasan bertanam getah
Rubber planted area
2000
2002
2004
2007
2009
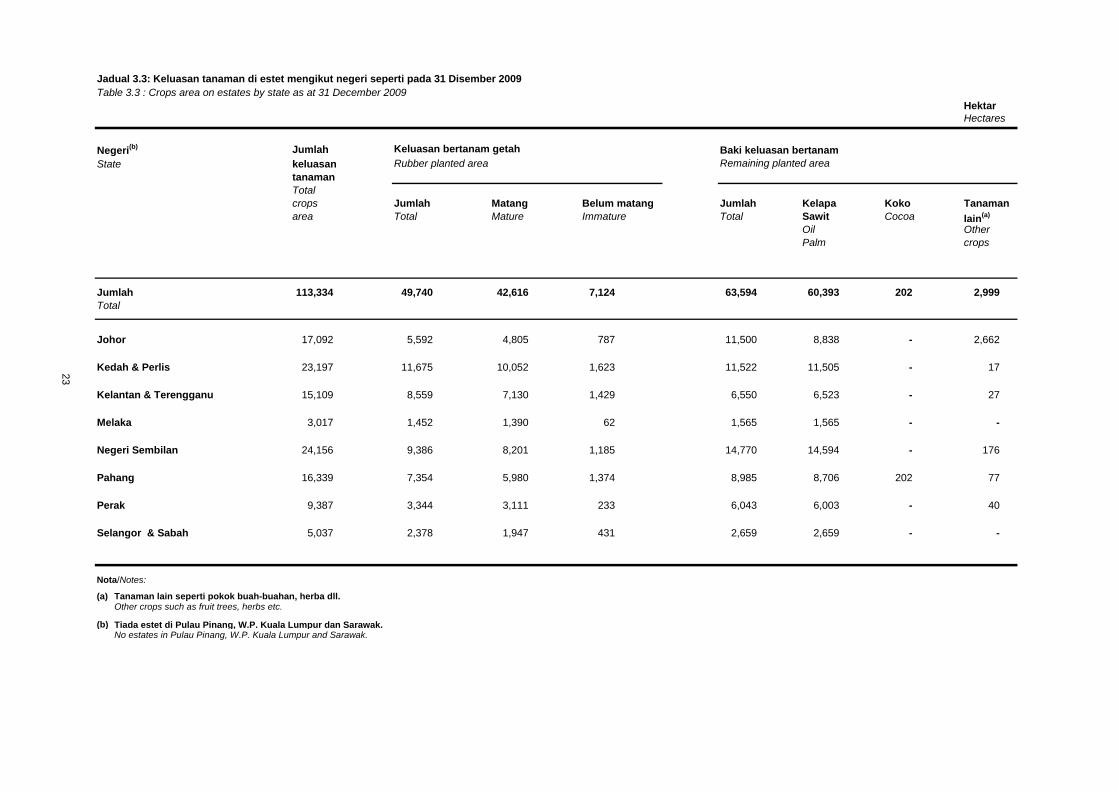
Jadual 3.3: Keluasan tanaman di estet mengikut negeri seperti pada 31 Disember 2009
Table 3.3 : Crops area on estates by state as at 31 December 2009
Hektar
Hectares
Negeri(b) Jumlah Baki keluasan bertanam
State keluasan Remaining planted area
tanaman
Total
crops Jumlah Matang Belum matang Jumlah Kelapa Koko Tanaman
area Total Mature Immature Total Sawit Cocoa lain(a)
Oil Other
Palm crops
Jumlah 113,334 49,740 42,616 7,124 63,594 60,393 202 2,999
Total
Johor 17,092 5,592 4,805 787 11,500 8,838 - 2,662
Kedah & Perlis 23,197 11,675 10,052 1,623 11,522 11,505 - 17
Kelantan & Terengganu 15,109 8,559 7,130 1,429 6,550 6,523 - 27
Melaka 3,017 1,452 1,390 62 1,565 1,565 - -
Negeri Sembilan 24,156 9,386 8,201 1,185 14,770 14,594 - 176
Pahang 16,339 7,354 5,980 1,374 8,985 8,706 202 77
Perak 9,387 3,344 3,111 233 6,043 6,003 - 40
Selangor & Sabah 5,037 2,378 1,947 431 2,659 2,659 - -
Nota/Notes:
(a) Tanaman lain seperti pokok buah-buahan, herba dll.Other crops such as fruit trees, herbs etc.
(b) Tiada estet di Pulau Pinang, W.P. Kuala Lumpur dan Sarawak.No estates in Pulau Pinang, W.P. Kuala Lumpur and Sarawak.
23
Keluasan bertanam getah
Rubber planted area
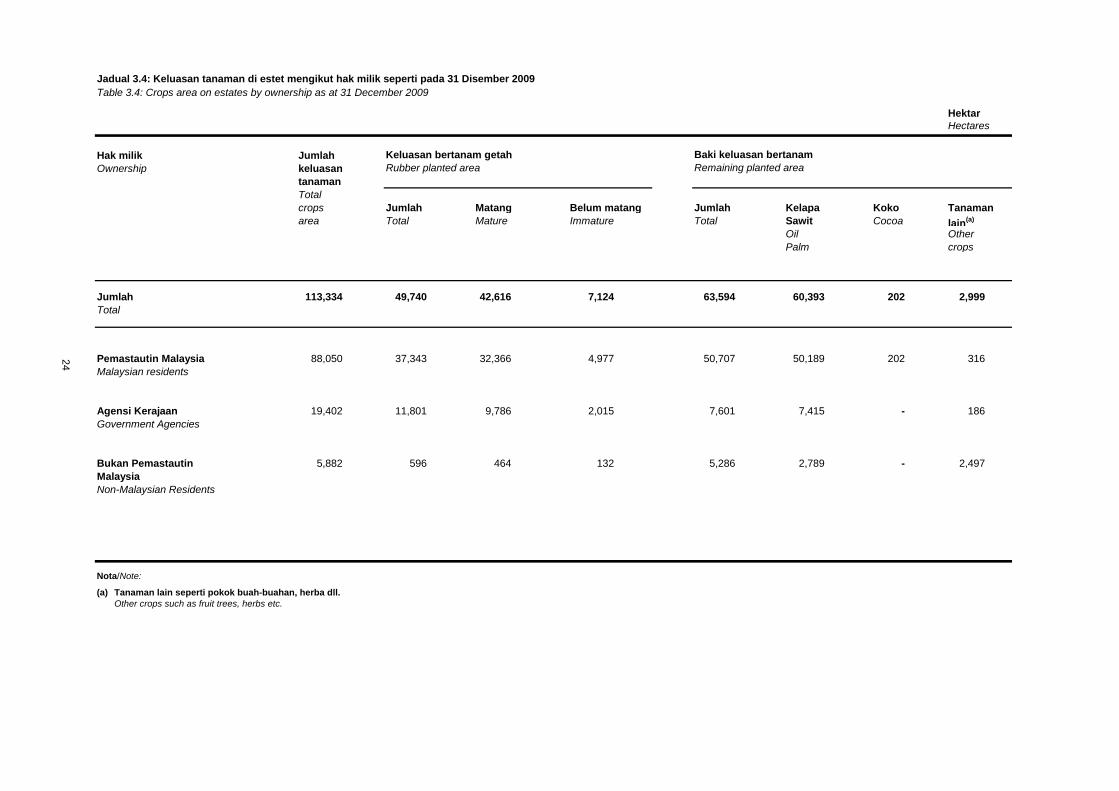
Jadual 3.4: Keluasan tanaman di estet mengikut hak milik seperti pada 31 Disember 2009
Table 3.4: Crops area on estates by ownership as at 31 December 2009
Hektar
Hectares
Hak milik Jumlah Baki keluasan bertanam
Ownership keluasan Remaining planted area
tanaman
Total
crops Jumlah Matang Belum matang Jumlah Kelapa Koko Tanaman
area Total Mature Immature Total Sawit Cocoa lain(a)
Oil Other
Palm crops
Jumlah 113,334 49,740 42,616 7,124 63,594 60,393 202 2,999
Total
Pemastautin Malaysia 88,050 37,343 32,366 4,977 50,707 50,189 202 316
Malaysian residents
Agensi Kerajaan 19,402 11,801 9,786 2,015 7,601 7,415 - 186
Government Agencies
Bukan Pemastautin 5,882 596 464 132 5,286 2,789 - 2,497
Malaysia
Non-Malaysian Residents
Nota/Note:
(a) Tanaman lain seperti pokok buah-buahan, herba dll.
Other crops such as fruit trees, herbs etc.
24
Keluasan bertanam getah
Rubber planted area
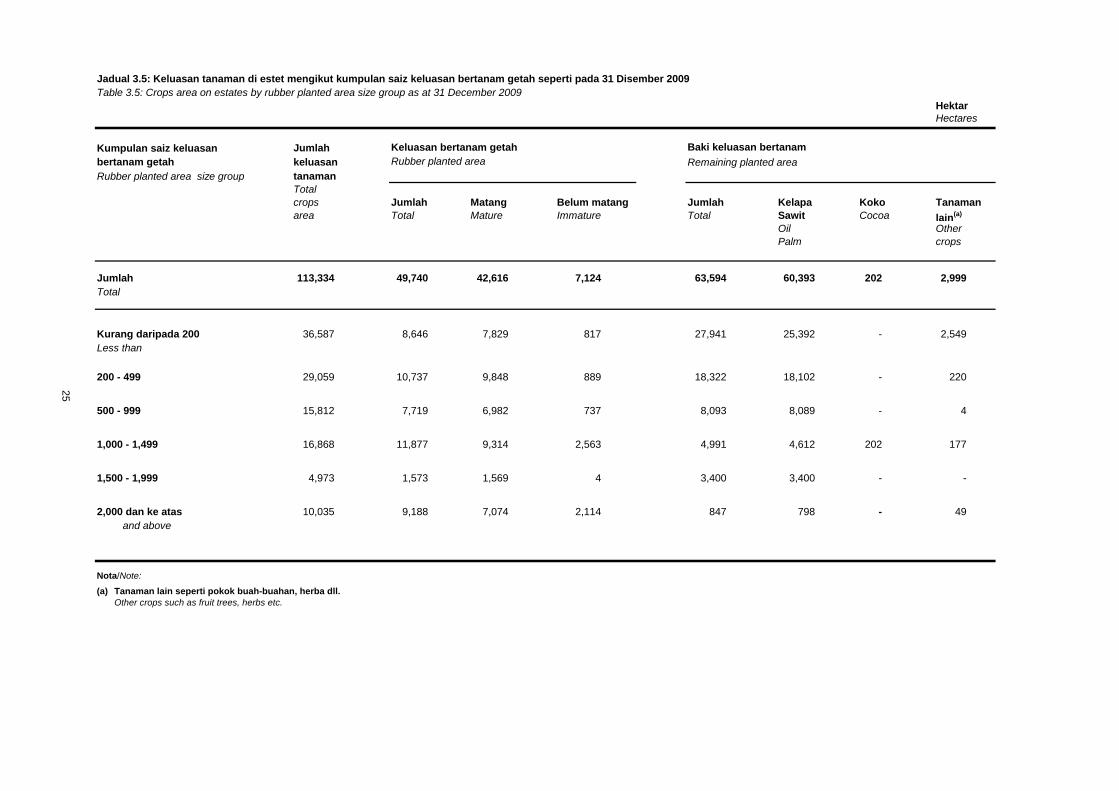
Jadual 3.5: Keluasan tanaman di estet mengikut kumpulan saiz keluasan bertanam getah seperti pada 31 Disember 2009
Table 3.5: Crops area on estates by rubber planted area size group as at 31 December 2009
Hektar
Hectares
Jumlah Baki keluasan bertanam
keluasan Remaining planted area
tanaman
Total
crops Jumlah Matang Belum matang Jumlah Kelapa Koko Tanaman
area Total Mature Immature Total Sawit Cocoa lain(a)
Oil Other
Palm crops
Jumlah 113,334 49,740 42,616 7,124 63,594 60,393 202 2,999
Total
Kurang daripada 200 36,587 8,646 7,829 817 27,941 25,392 - 2,549
Less than
200 - 499 29,059 10,737 9,848 889 18,322 18,102 - 220
500 - 999 15,812 7,719 6,982 737 8,093 8,089 - 4
1,000 - 1,499 16,868 11,877 9,314 2,563 4,991 4,612 202 177
1,500 - 1,999 4,973 1,573 1,569 4 3,400 3,400 - -
2,000 dan ke atas 10,035 9,188 7,074 2,114 847 798 - 49
and above
Nota/Note:
(a) Tanaman lain seperti pokok buah-buahan, herba dll.
Other crops such as fruit trees, herbs etc.
25
Keluasan bertanam getah
Rubber planted area
Kumpulan saiz keluasan
bertanam getah
Rubber planted area size group
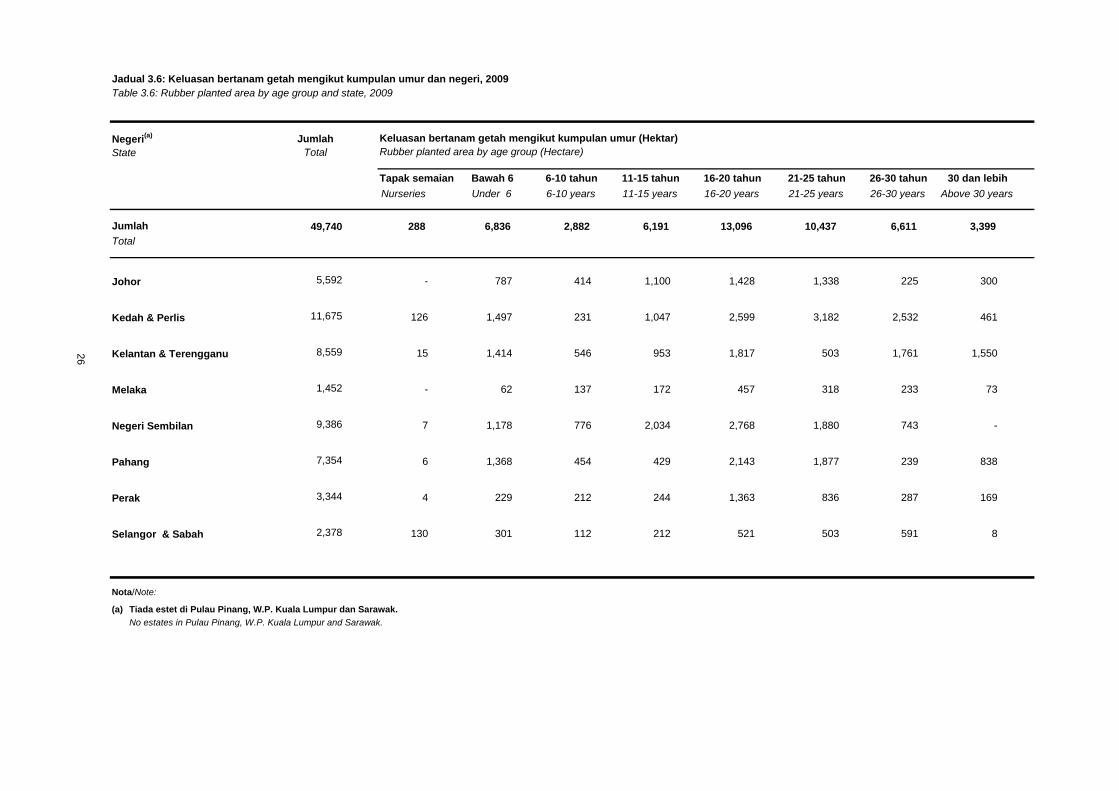
Jadual 3.6: Keluasan bertanam getah mengikut kumpulan umur dan negeri, 2009
Table 3.6: Rubber planted area by age group and state, 2009
Jumlah
Total
Tapak semaian Bawah 6 6-10 tahun 11-15 tahun 16-20 tahun 21-25 tahun 26-30 tahun 30 dan lebih
Nurseries Under 6 6-10 years 11-15 years 16-20 years 21-25 years 26-30 years Above 30 years
49,740 288 6,836 2,882 6,191 13,096 10,437 6,611 3,399
Johor 5,592 - 787 414 1,100 1,428 1,338 225 300
Kedah & Perlis 11,675 126 1,497 231 1,047 2,599 3,182 2,532 461
Kelantan & Terengganu 8,559 15 1,414 546 953 1,817 503 1,761 1,550
Melaka 1,452 - 62 137 172 457 318 233 73
Negeri Sembilan 9,386 7 1,178 776 2,034 2,768 1,880 743 -
Pahang 7,354 6 1,368 454 429 2,143 1,877 239 838
Perak 3,344 4 229 212 244 1,363 836 287 169
Selangor & Sabah 2,378 130 301 112 212 521 503 591 8
Nota/Note:
(a) Tiada estet di Pulau Pinang, W.P. Kuala Lumpur dan Sarawak.
No estates in Pulau Pinang, W.P. Kuala Lumpur and Sarawak.
Total
Keluasan bertanam getah mengikut kumpulan umur (Hektar)
Rubber planted area by age group (Hectare)
Jumlah
Negeri(a)
State
26
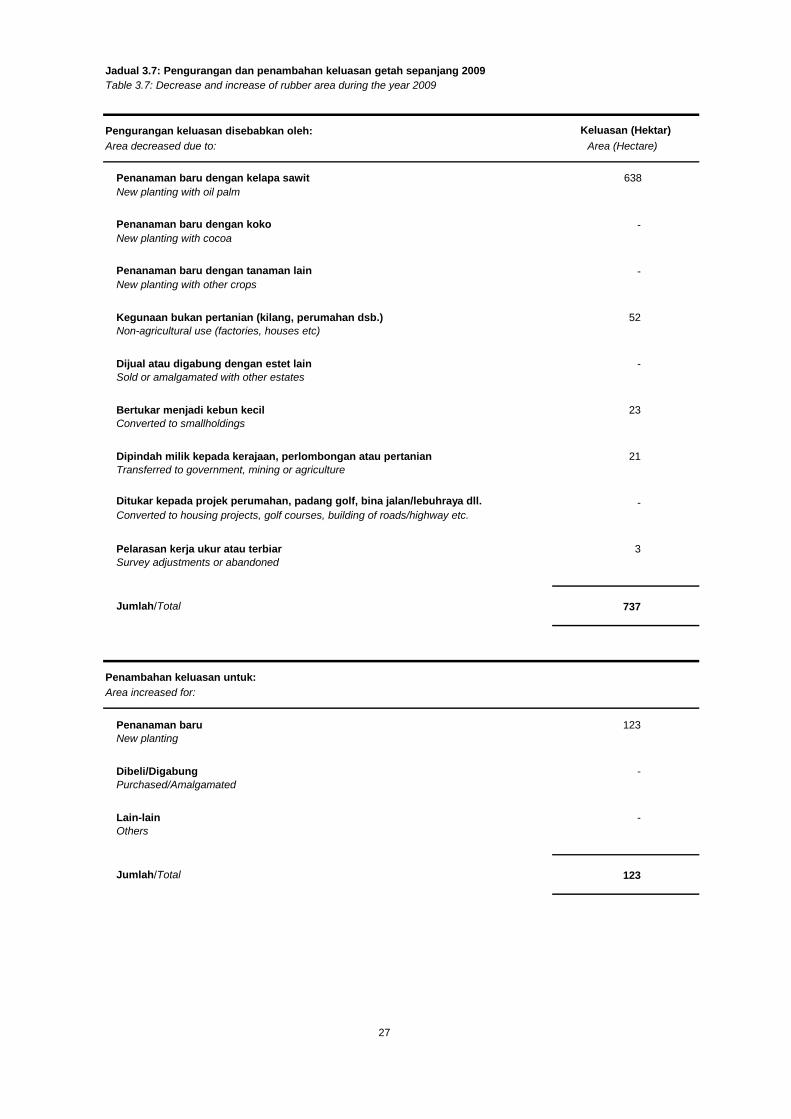
Pengurangan keluasan disebabkan oleh:
Area decreased due to:
Penanaman baru dengan kelapa sawit 638
New planting with oil palm
Penanaman baru dengan koko -
New planting with cocoa
Penanaman baru dengan tanaman lain -
New planting with other crops
Kegunaan bukan pertanian (kilang, perumahan dsb.) 52
Non-agricultural use (factories, houses etc)
Dijual atau digabung dengan estet lain -
Sold or amalgamated with other estates
Bertukar menjadi kebun kecil 23
Converted to smallholdings
Dipindah milik kepada kerajaan, perlombongan atau pertanian 21
Transferred to government, mining or agriculture
Ditukar kepada projek perumahan, padang golf, bina jalan/lebuhraya dll. -
Converted to housing projects, golf courses, building of roads/highway etc.
Pelarasan kerja ukur atau terbiar 3
Survey adjustments or abandoned
Jumlah/Total 737
Penambahan keluasan untuk:
Area increased for:
Penanaman baru 123
New planting
Dibeli/Digabung -
Purchased/Amalgamated
Lain-lain -
Others
Jumlah/Total 123
27
Jadual 3.7: Pengurangan dan penambahan keluasan getah sepanjang 2009
Table 3.7: Decrease and increase of rubber area during the year 2009
Keluasan (Hektar)
Area (Hectare)
SEKSYEN 4: PENGELUARAN DAN HASIL ESTET
SECTION 4: PRODUCTION AND YIELD ON ESTATES

Jadual 4.1: Pengeluaran getah di estet mengikut negeri, 2000-2010
Table 4.1: Rubber production on estates by state, 2000-2010
Tan metrikTonnes
Negeri(d)
State
2000 2001(a) 2002 2003
(a) 2004 2005(a)
2006(a) 2007 2008
(a) 2009 2010(a)
Jumlah 126,669 99,530 85,026 76,363 71,105 65,291 68,397 65,472 59,593 56,771 55,984
Total
Johor 17,542 13,002 11,143 10,781 9,788 9,132 8,894 8,967 8,027 7,428 6,886
Kedah, Perlis & Pulau Pinang(b)
29,388 23,916 20,970 17,514 14,910 13,968 14,650 12,270 11,036 12,793 12,472
Kelantan & Terengganu 8,529 8,529 9,379 7,698 9,128 7,448 8,165 7,993 8,071 7,248 6,900
Melaka 7,688 3,883 2,706 2,855 2,202 2,061 2,079 1,894 1,945 2,003 1,785
Negeri Sembilan 25,333 20,703 16,422 15,396 15,876 15,479 17,227 19,482 15,179 13,304 13,710
Pahang 16,583 13,246 12,499 10,614 9,654 8,747 9,251 8,264 8,340 7,837 8,363
Perak 14,700 10,624 8,515 8,374 6,705 5,364 5,545 4,961 5,177 4,374 4,170
Sabah 1,337 851 272 177 147 114 (c) (c) (c) (c) (c)
Selangor 5,569 4,776 3,120 2,954 2,695 2,978 2,586 1,641 1,818 1,784 1,698
Nota/Notes :
(a)
Data were compiled from the Monthly Census of Rubber Estates as the Annual Census of Rubber Estates was not conducted during these years.
(b) Data Pulau Pinang bagi 2000 telah digabungkan dengan Kedah dan Perlis.
Data for Pulau Pinang for 2000 has been combined with Kedah and Perlis.
(c) Data Sabah telah digabungkan dengan Selangor mulai 2006.
Data for Sabah has been combined with Selangor from 2006.
(d) Tiada estet di Pulau Pinang (mulai 2001), W.P. Kuala Lumpur dan Sarawak.
No estates in Pulau Pinang (2001 onwards), W.P. Kuala Lumpur and Sarawak
Tahun
Year
Data dikumpul daripada Banci Estet Getah Bulanan kerana Banci Estet Getah Tahunan tidak dijalankan pada tahun-tahun tersebut.
29
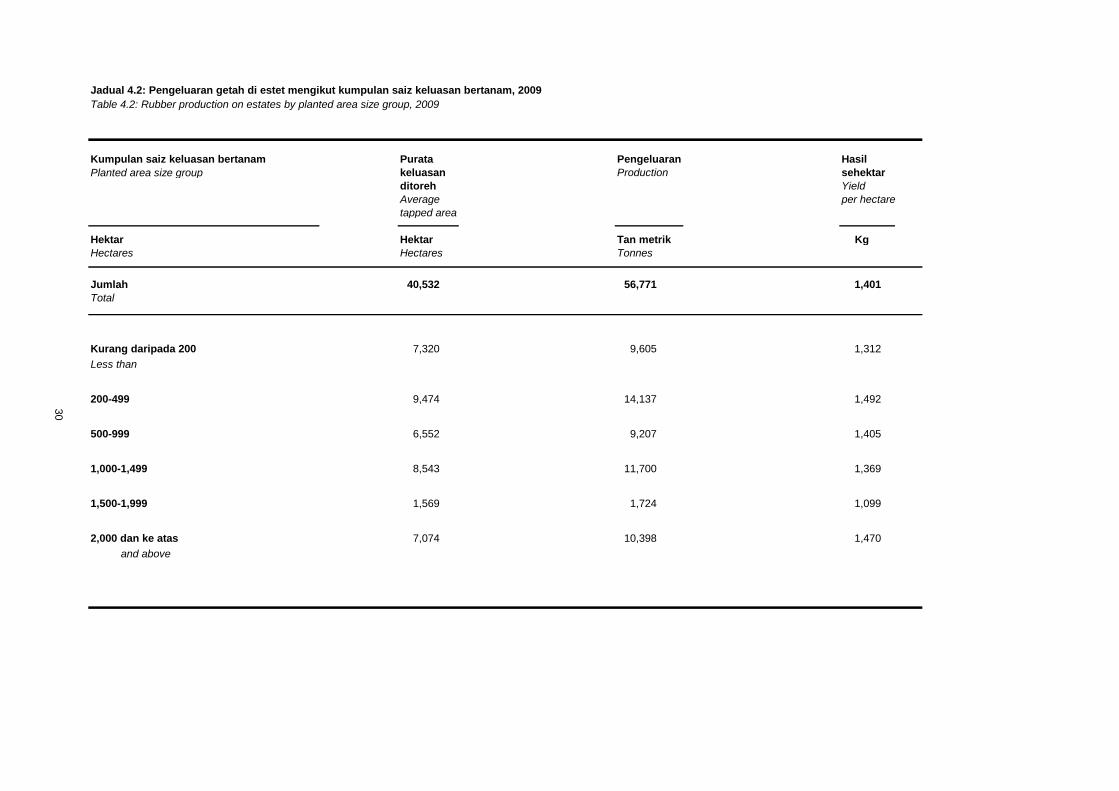
Jadual 4.2: Pengeluaran getah di estet mengikut kumpulan saiz keluasan bertanam, 2009
Table 4.2: Rubber production on estates by planted area size group, 2009
Kumpulan saiz keluasan bertanam Purata Pengeluaran Hasil
Planted area size group keluasan Production sehektar
ditoreh Yield
Average per hectare
tapped area
Hektar Hektar Tan metrik Kg
Hectares Hectares Tonnes
Jumlah 40,532 56,771 1,401
Total
Kurang daripada 200 7,320 9,605 1,312
Less than
200-499 9,474 14,137 1,492
500-999 6,552 9,207 1,405
1,000-1,499 8,543 11,700 1,369
1,500-1,999 1,569 1,724 1,099
2,000 dan ke atas 7,074 10,398 1,470
and above
30
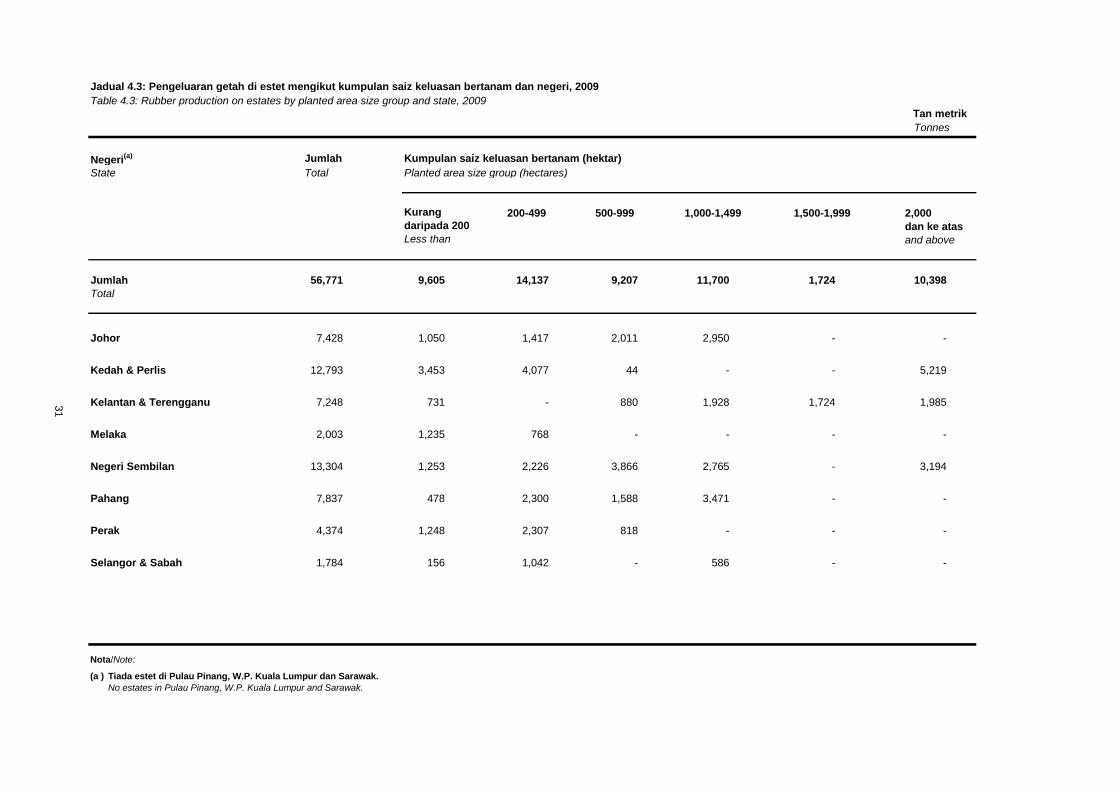
Jadual 4.3: Pengeluaran getah di estet mengikut kumpulan saiz keluasan bertanam dan negeri, 2009
Table 4.3: Rubber production on estates by planted area size group and state, 2009
Tonnes
Negeri(a) Jumlah Kumpulan saiz keluasan bertanam (hektar)
State Total Planted area size group (hectares)
Kurang 200-499 500-999 1,000-1,499 1,500-1,999 2,000daripada 200 dan ke atasLess than and above
Jumlah 56,771 9,605 14,137 9,207 11,700 1,724 10,398
Total
Johor 7,428 1,050 1,417 2,011 2,950 - -
Kedah & Perlis 12,793 3,453 4,077 44 - - 5,219
Kelantan & Terengganu 7,248 731 - 880 1,928 1,724 1,985
Melaka 2,003 1,235 768 - - - -
Negeri Sembilan 13,304 1,253 2,226 3,866 2,765 - 3,194
Pahang 7,837 478 2,300 1,588 3,471 - -
Perak 4,374 1,248 2,307 818 - - -
Selangor & Sabah 1,784 156 1,042 - 586 - -
Nota/Note:
(a ) Tiada estet di Pulau Pinang, W.P. Kuala Lumpur dan Sarawak.
No estates in Pulau Pinang, W.P. Kuala Lumpur and Sarawak.
31
Tan metrik
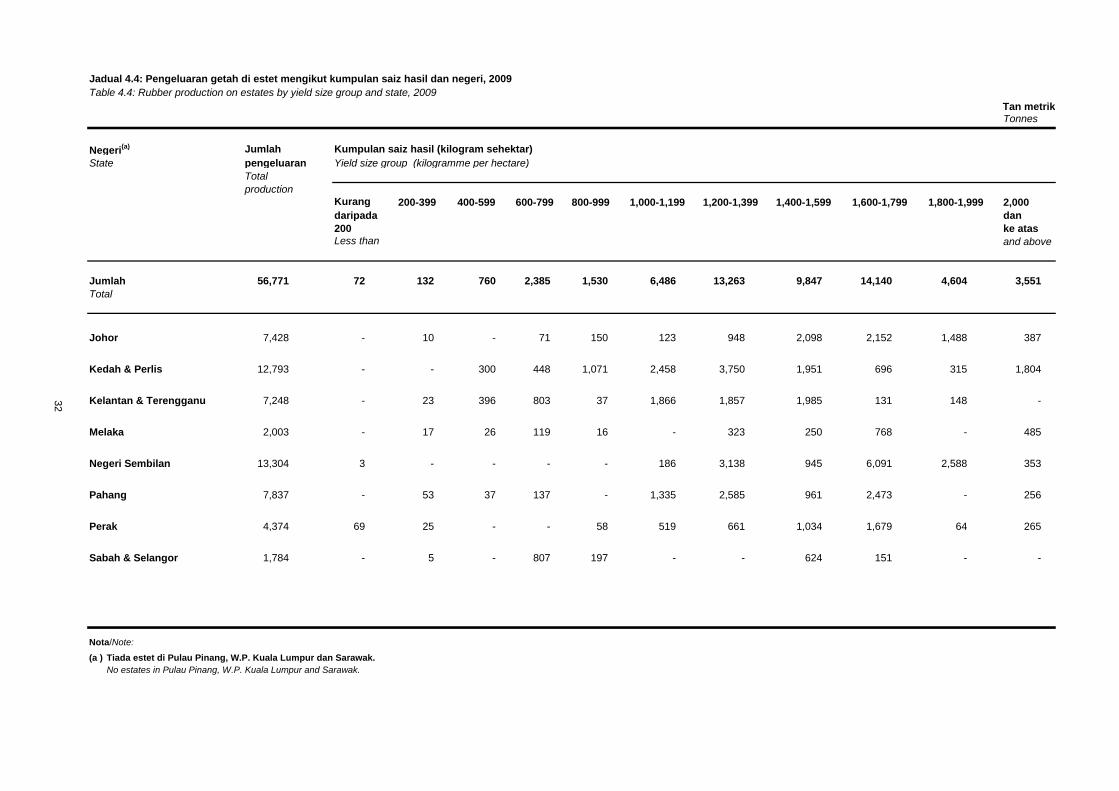
Jadual 4.4: Pengeluaran getah di estet mengikut kumpulan saiz hasil dan negeri, 2009
Table 4.4: Rubber production on estates by yield size group and state, 2009
Tonnes
Negeri(a) Jumlah Kumpulan saiz hasil (kilogram sehektar)
State pengeluaran Yield size group (kilogramme per hectare)
Total
production
Kurang 200-399 400-599 600-799 800-999 1,000-1,199 1,200-1,399 1,400-1,599 1,600-1,799 1,800-1,999 2,000
daripada dan
200 ke atas
Less than and above
Jumlah 56,771 72 132 760 2,385 1,530 6,486 13,263 9,847 14,140 4,604 3,551
Total
Johor 7,428 - 10 - 71 150 123 948 2,098 2,152 1,488 387
Kedah & Perlis 12,793 - - 300 448 1,071 2,458 3,750 1,951 696 315 1,804
Kelantan & Terengganu 7,248 - 23 396 803 37 1,866 1,857 1,985 131 148 -
Melaka 2,003 - 17 26 119 16 - 323 250 768 - 485
Negeri Sembilan 13,304 3 - - - - 186 3,138 945 6,091 2,588 353
Pahang 7,837 - 53 37 137 - 1,335 2,585 961 2,473 - 256
Perak 4,374 69 25 - - 58 519 661 1,034 1,679 64 265
Sabah & Selangor 1,784 - 5 - 807 197 - - 624 151 - -
Nota/Note:
(a ) Tiada estet di Pulau Pinang, W.P. Kuala Lumpur dan Sarawak.
No estates in Pulau Pinang, W.P. Kuala Lumpur and Sarawak.
32
Tan metrik
SECTION 5: NUMBER OF PERSONS ENGAGED ON ESTATES
SEKSYEN 5: BILANGAN ORANG YANG DIAMBIL BEKERJA DI ESTET
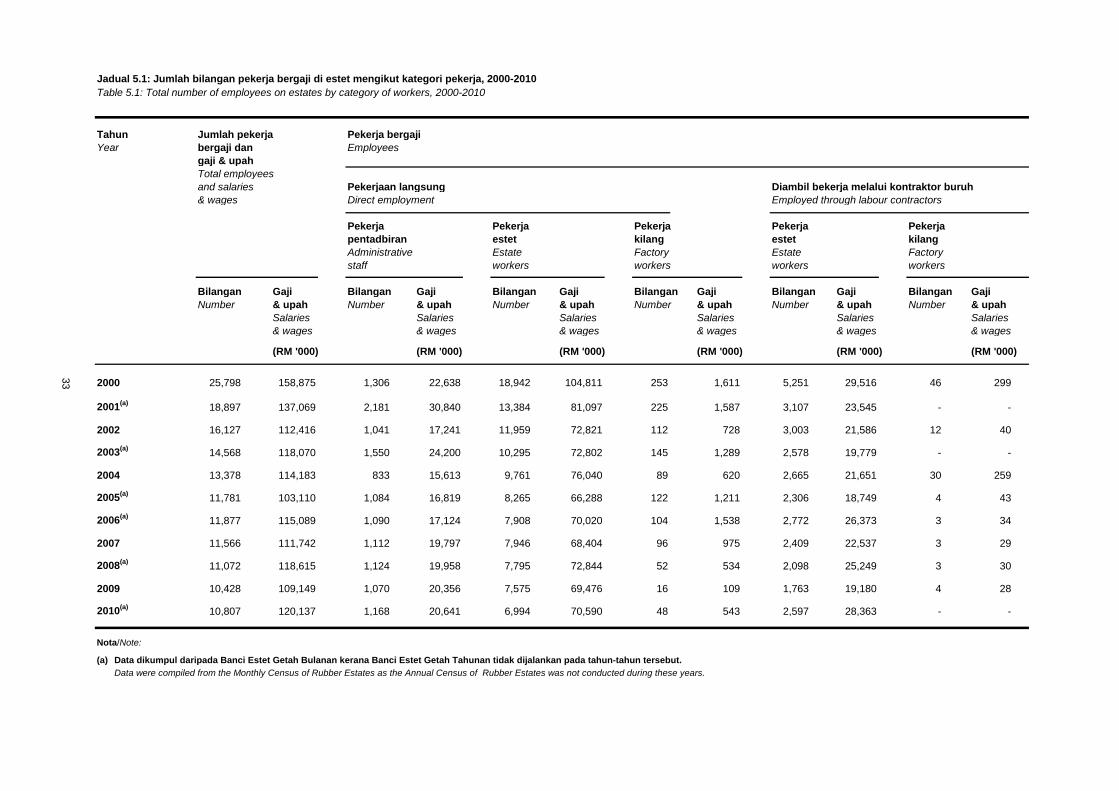
Jadual 5.1: Jumlah bilangan pekerja bergaji di estet mengikut kategori pekerja, 2000-2010
Table 5.1: Total number of employees on estates by category of workers, 2000-2010
Tahun Jumlah pekerja Pekerja bergaji
Year bergaji dan Employees
gaji & upah
Total employees
and salaries Pekerjaan langsung Diambil bekerja melalui kontraktor buruh
& wages Direct employment Employed through labour contractors
Pekerja Pekerja Pekerja Pekerja Pekerja
pentadbiran estet kilang estet kilang
Administrative Estate Factory Estate Factory
staff workers workers workers workers
Bilangan Gaji Bilangan Gaji Bilangan Gaji Bilangan Gaji Bilangan Gaji Bilangan Gaji
Number & upah Number & upah Number & upah Number & upah Number & upah Number & upah
Salaries Salaries Salaries Salaries Salaries Salaries
& wages & wages & wages & wages & wages & wages
(RM '000) (RM '000) (RM '000) (RM '000) (RM '000) (RM '000)
25,798 158,875 1,306 22,638 18,942 104,811 253 1,611 5,251 29,516 46 299
2001(a)
18,897 137,069 2,181 30,840 13,384 81,097 225 1,587 3,107 23,545 - -
16,127 112,416 1,041 17,241 11,959 72,821 112 728 3,003 21,586 12 40
2003(a)
14,568 118,070 1,550 24,200 10,295 72,802 145 1,289 2,578 19,779 - -
13,378 114,183 833 15,613 9,761 76,040 89 620 2,665 21,651 30 259
2005(a)
11,781 103,110 1,084 16,819 8,265 66,288 122 1,211 2,306 18,749 4 43
2006(a)
11,877 115,089 1,090 17,124 7,908 70,020 104 1,538 2,772 26,373 3 34
11,566 111,742 1,112 19,797 7,946 68,404 96 975 2,409 22,537 3 29
2008(a)
11,072 118,615 1,124 19,958 7,795 72,844 52 534 2,098 25,249 3 30
10,428 109,149 1,070 20,356 7,575 69,476 16 109 1,763 19,180 4 28
2010(a)
10,807 120,137 1,168 20,641 6,994 70,590 48 543 2,597 28,363 - -
Nota/Note:
(a)
Data were compiled from the Monthly Census of Rubber Estates as the Annual Census of Rubber Estates was not conducted during these years.
33
2009
2007
2004
2002
2000
Data dikumpul daripada Banci Estet Getah Bulanan kerana Banci Estet Getah Tahunan tidak dijalankan pada tahun-tahun tersebut.
Jadual 5.2: Jumlah pekerja di estet mengikut negeri, 2009
Table 5.2: Total persons engaged on estates by state, 2009
Negeri(a) Jumlah pekerja
State di estet
Total number of
persons engaged
on estates Jumlah Sepenuh masa Sambilan
Total Full-time Part-time
Bilangan Gaji Bilangan Gaji Bilangan Gaji Bilangan
pekerja & upah pekerja & upah pekerja & upah pekerja
Number of Salaries Number of Salaries Number of Salaries Number of
employees & wages employees & wages employees & wages employees
(RM '000) (RM '000) (RM '000)
Jumlah 11,081 16 10,428 109,149 10,408 109,019 20 130 637
Total
Johor 1,347 - 1,318 14,444 1,318 14,444 - - 28
Kedah & Perlis 2,517 5 2,339 23,433 2,334 23,376 5 57 173
Kelantan & Terengganu 1,630 1 1,628 16,155 1,615 16,115 13 40 1
Melaka 426 - 380 4,303 380 4,303 - - 46
Negeri Sembilan 2,477 8 2,129 22,805 2,129 22,805 - - 340
Pahang 1,513 1 1,491 15,321 1,491 15,321 - - 21
Perak 717 - 694 6,972 694 6,972 - - 23
Selangor & Sabah 454 - 449 5,715 447 5,683 2 33 5
Nota/Note:
(a ) Tiada estet di Pulau Pinang, W.P. Kuala Lumpur dan Sarawak.
No estates in Pulau Pinang, W.P. Kuala Lumpur and Sarawak.
Workers under
sub-contractors
34
Bilangan
pemilik yang
bekerja,
rakaniaga yang
aktif dan
pekerja
keluarga tidak
bergaji
Number of
working
proprietors,
active business
partners and
unpaid family
workers
Pekerja di
bawah
subkontraktor
Pekerja bergaji dan gaji & upah
Total employees and salaries & wages
Jadual 5.3: Jumlah pekerja di estet mengikut kategori pekerja dan jantina, 2009
Table 5.3: Total number of persons engaged on estates by category of workers and sex, 2009
Kategori pekerja Jumlah pekerja pada bulan Disember 2009 Gaji & upah
Category of workers atau pada tempoh gaji akhir, 2009 dibayar
Total number of persons engaged during Salaries &
December 2009 or the last pay period, 2009 wages paid
Jumlah Lelaki Perempuan (RM '000)Total Male Female
1. Jumlah (2+5+11+12) 11,081 6,683 4,398 109,149
Total
2. Jumlah pemilik yang bekerja dan pekerja 16 15 1 -
keluarga tidak bergaji
Total working proprietors and unpaid family workers
3. Pemilik yang bekerja dan rakan niaga yang aktif 15 14 1 -
Working proprietors and active business partners
4. Pekerja keluarga tidak bergaji (semua ahli 1 1 - -
keluarga dan rakan yang tidak menerima
upah tetap)
Unpaid family workers (all members of family and
friends not receiving regular wages)
5. Jumlah pekerja bergaji penuh masa (6 hingga 10) 10,408 6,257 4,151 109,019
Total full-time employees (6 to 10)
6. Pengurusan, profesional dan eksekutif 151 146 5 6,286
Managers, professionals and executives
7. Juruteknik dan profesional bersekutu (cth. 293 286 7 5,611
penyelia, mandur)
Technicians and associate professionals (e.g. supervisor,
mandore)
8. Pekerja pentadbiran
Administrative staff
(i) Perkeranian 173 76 97 2,822
Clerical 0
(iv) Bukan perkeranian 453 403 50 5,637
Non-clerical
9. Pekerja buruh pertanian
Agricultural labour workers
(i) Diambil bekerja secara langsung 7,555 3,995 3,560 69,346
Directly employed 0
(ii) Diambil bekerja melalui kontraktor buruh 1,763 1,339 424 19,180
Employed through labour contractors
10. Pekerja kilang
Factory workers
(i) Diambil bekerja secara langsung 16 9 7 109
Directly employed 0
(ii) Diambil bekerja melalui kontraktor buruh 4 3 1 28
Employed through labour contractors
11. Pekerja bergaji sambilan 20 16 4 130
Part-time employees
12. Pekerja di bawah subkontraktor 637 395 242 -
Workers under sub-contractors
35
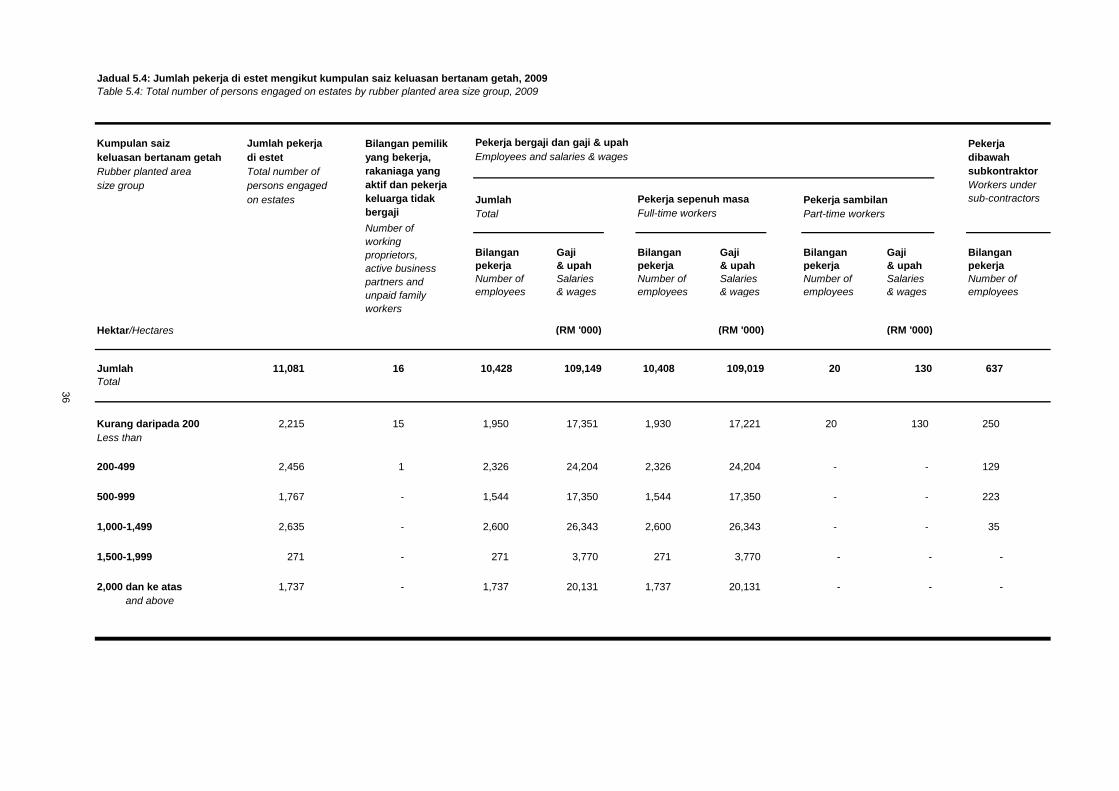
Jadual 5.4: Jumlah pekerja di estet mengikut kumpulan saiz keluasan bertanam getah, 2009
Table 5.4: Total number of persons engaged on estates by rubber planted area size group, 2009
Kumpulan saiz Jumlah pekerja
keluasan bertanam getah di estet
Rubber planted area Total number of
size group persons engaged
on estates Jumlah Pekerja sambilan
Total Part-time workers
Bilangan Gaji Bilangan Gaji Bilangan Gaji Bilangan
pekerja & upah pekerja & upah pekerja & upah pekerja
Number of Salaries Number of Salaries Number of Salaries Number of
employees & wages employees & wages employees & wages employees
Hektar/Hectares (RM '000) (RM '000) (RM '000)
Jumlah 11,081 16 10,428 109,149 10,408 109,019 20 130 637
Total
Kurang daripada 200 2,215 15 1,950 17,351 1,930 17,221 20 130 250
Less than
200-499 2,456 1 2,326 24,204 2,326 24,204 - - 129
500-999 1,767 - 1,544 17,350 1,544 17,350 - - 223
1,000-1,499 2,635 - 2,600 26,343 2,600 26,343 - - 35
1,500-1,999 271 - 271 3,770 271 3,770 - - -
2,000 dan ke atas 1,737 - 1,737 20,131 1,737 20,131 - - -
and above
Workers under
sub-contractors
Number of
working
proprietors,
active business
partners and
unpaid family
workers
36
Pekerja bergaji dan gaji & upah
Employees and salaries & wages
Pekerja sepenuh masa
Full-time workers
Bilangan pemilik
yang bekerja,
rakaniaga yang
aktif dan pekerja
keluarga tidak
bergaji
Pekerja
dibawah
subkontraktor
SEKSYEN 6: PERBELANJAAN MENANAM, MODAL DAN
MENYELENGGARA HARTA DI ESTET
SECTION 6: PLANTING, CAPITAL AND ASSETS
MAINTENANCE EXPENDITURE ON ESTATES
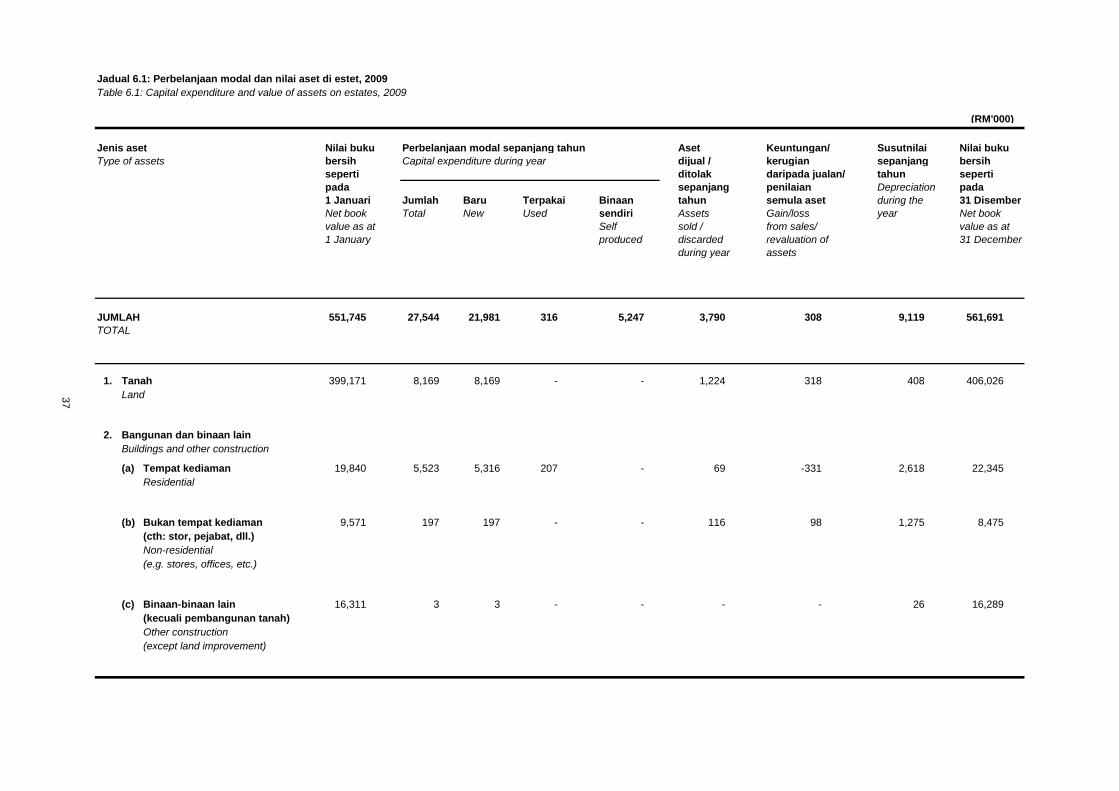
Jadual 6.1: Perbelanjaan modal dan nilai aset di estet, 2009
Table 6.1: Capital expenditure and value of assets on estates, 2009
(RM'000)
Jenis aset Nilai buku Perbelanjaan modal sepanjang tahun Aset Keuntungan/ Susutnilai Nilai buku
Type of assets bersih Capital expenditure during year dijual / kerugian sepanjang bersih
seperti ditolak daripada jualan/ tahun seperti
pada sepanjang penilaian Depreciation pada
1 Januari Jumlah Baru Terpakai Binaan tahun semula aset during the 31 Disember
Net book Total New Used sendiri Assets Gain/loss year Net book
value as at Self sold / from sales/ value as at
1 January produced discarded revaluation of 31 December
during year assets
JUMLAH 551,745 27,544 21,981 316 5,247 3,790 308 9,119 561,691
TOTAL
1. Tanah 399,171 8,169 8,169 - - 1,224 318 408 406,026
Land
2. Bangunan dan binaan lain
Buildings and other construction
(a) Tempat kediaman 19,840 5,523 5,316 207 - 69 -331 2,618 22,345
Residential
(b) Bukan tempat kediaman 9,571 197 197 - - 116 98 1,275 8,475
(cth: stor, pejabat, dll.)
Non-residential
(e.g. stores, offices, etc.)
(c) Binaan-binaan lain 16,311 3 3 - - - - 26 16,289
(kecuali pembangunan tanah)
Other construction
(except land improvement)
37
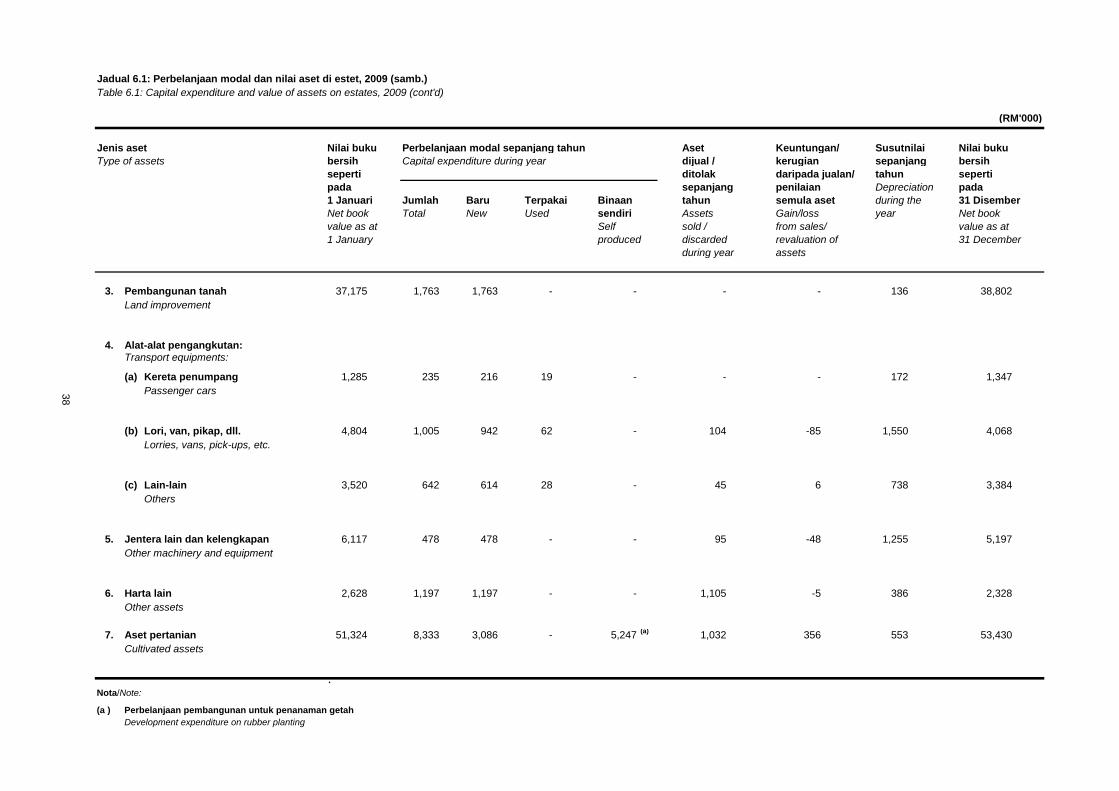
Jadual 6.1: Perbelanjaan modal dan nilai aset di estet, 2009 (samb.)
Table 6.1: Capital expenditure and value of assets on estates, 2009 (cont'd)
(RM'000)
Jenis aset Nilai buku Perbelanjaan modal sepanjang tahun Aset Keuntungan/ Susutnilai Nilai buku
Type of assets bersih Capital expenditure during year dijual / kerugian sepanjang bersih
seperti ditolak daripada jualan/ tahun seperti
pada sepanjang penilaian Depreciation pada
1 Januari Jumlah Baru Terpakai Binaan tahun semula aset during the 31 Disember
Net book Total New Used sendiri Assets Gain/loss year Net book
value as at Self sold / from sales/ value as at
1 January produced discarded revaluation of 31 December
during year assets
3. Pembangunan tanah 37,175 1,763 1,763 - - - - 136 38,802
Land improvement
4. Alat-alat pengangkutan:Transport equipments:
(a) Kereta penumpang 1,285 235 216 19 - - - 172 1,347
Passenger cars
(b) Lori, van, pikap, dll. 4,804 1,005 942 62 - 104 -85 1,550 4,068
Lorries, vans, pick-ups, etc.
(c) Lain-lain 3,520 642 614 28 - 45 6 738 3,384
Others
5. Jentera lain dan kelengkapan 6,117 478 478 - - 95 -48 1,255 5,197
Other machinery and equipment
6. Harta lain 2,628 1,197 1,197 - - 1,105 -5 386 2,328
Other assets
7. Aset pertanian 51,324 8,333 3,086 - 5,247(a)
1,032 356 553 53,430
Cultivated assets
.Nota/Note:
(a ) Perbelanjaan pembangunan untuk penanaman getah
Development expenditure on rubber planting
38

SEKSYEN 7: KEBUN KECIL GETAH
SECTION 7: RUBBER SMALLHOLDINGS
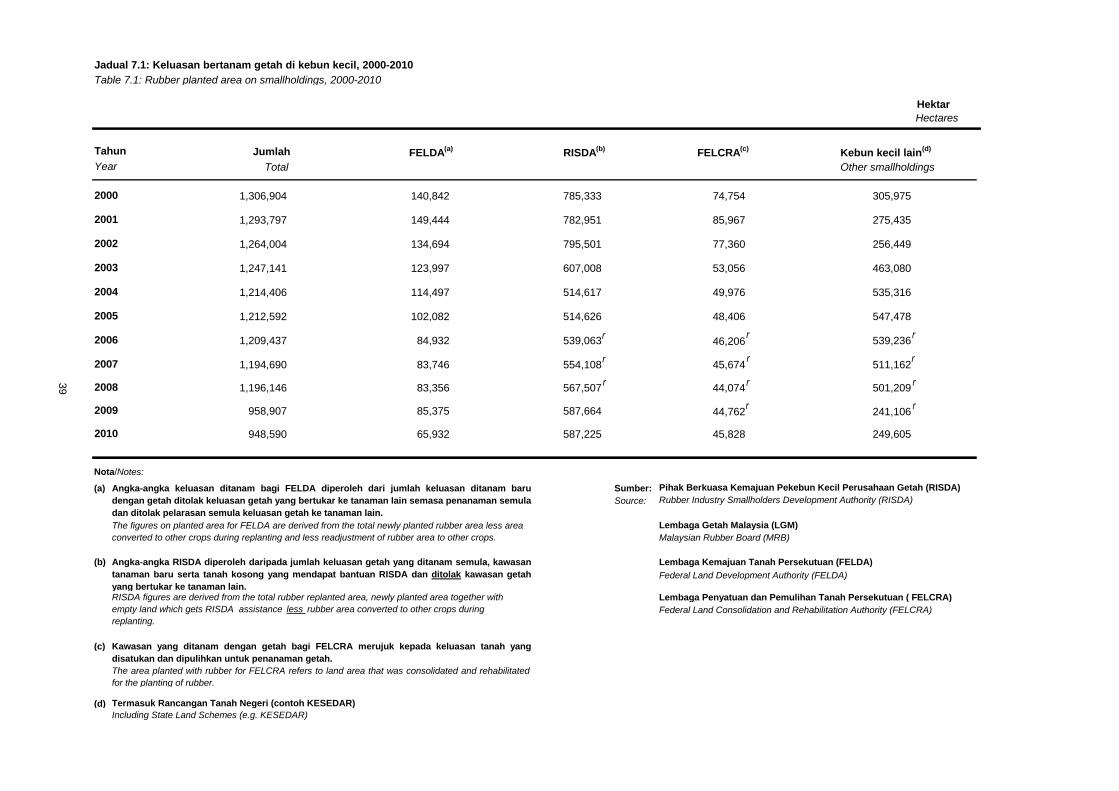
Jadual 7.1: Keluasan bertanam getah di kebun kecil, 2000-2010
Table 7.1: Rubber planted area on smallholdings, 2000-2010
Hektar
Hectares
Jumlah FELDA(a)
RISDA(b)
FELCRA(c)
Kebun kecil lain(d)
Total Other smallholdings
1,306,904 140,842 785,333 74,754 305,975
1,293,797 149,444 782,951 85,967 275,435
1,264,004 134,694 795,501 77,360 256,449
1,247,141 123,997 607,008 53,056 463,080
1,214,406 114,497 514,617 49,976 535,316
1,212,592 102,082 514,626 48,406 547,478
1,209,437 84,932 539,063 46,206 539,236
1,194,690 83,746 554,108 45,674 511,162
1,196,146 83,356 567,507 44,074 501,209
958,907 85,375 587,664 44,762 241,106
948,590 65,932 587,225 45,828 249,605
Nota/Notes:
(a) Sumber:
Source: Rubber Industry Smallholders Development Authority (RISDA)
Lembaga Getah Malaysia (LGM)
Malaysian Rubber Board (MRB)
(b) Lembaga Kemajuan Tanah Persekutuan (FELDA)
Federal Land Development Authority (FELDA)
Federal Land Consolidation and Rehabilitation Authority (FELCRA)
(c)
(d) Termasuk Rancangan Tanah Negeri (contoh KESEDAR)
Including State Land Schemes (e.g. KESEDAR)
39
Angka-angka keluasan ditanam bagi FELDA diperoleh dari jumlah keluasan ditanam baru
dengan getah ditolak keluasan getah yang bertukar ke tanaman lain semasa penanaman semula
dan ditolak pelarasan semula keluasan getah ke tanaman lain.
Angka-angka RISDA diperoleh daripada jumlah keluasan getah yang ditanam semula, kawasan
tanaman baru serta tanah kosong yang mendapat bantuan RISDA dan ditolak kawasan getah
yang bertukar ke tanaman lain.
Kawasan yang ditanam dengan getah bagi FELCRA merujuk kepada keluasan tanah yang
disatukan dan dipulihkan untuk penanaman getah.
The area planted with rubber for FELCRA refers to land area that was consolidated and rehabilitated
for the planting of rubber.
2010
2009
2008
2007
2006
Pihak Berkuasa Kemajuan Pekebun Kecil Perusahaan Getah (RISDA)
The figures on planted area for FELDA are derived from the total newly planted rubber area less area
converted to other crops during replanting and less readjustment of rubber area to other crops.
Lembaga Penyatuan dan Pemulihan Tanah Persekutuan ( FELCRA)
2005
2004
RISDA figures are derived from the total rubber replanted area, newly planted area together with
empty land which gets RISDA assistance less rubber area converted to other crops during
replanting.
2003
2002
2001
2000
Tahun
Year
r
r
r
r
r
r
r
r
r
r
r
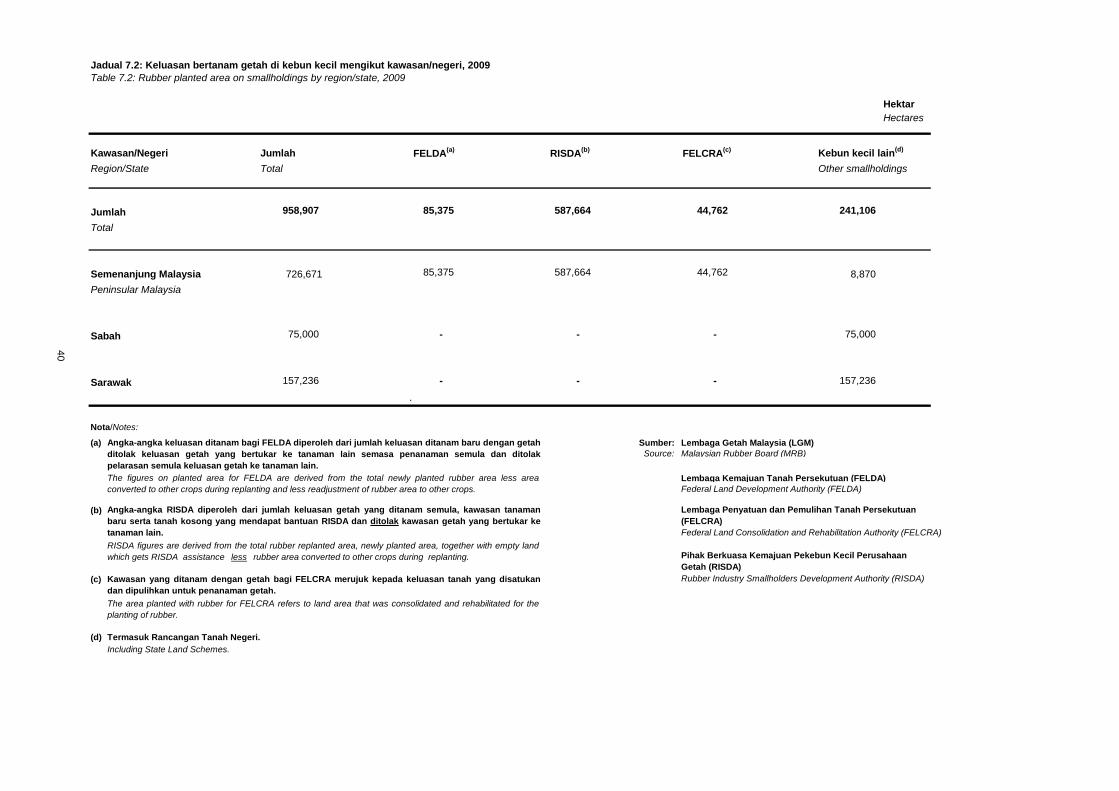
Jadual 7.2: Keluasan bertanam getah di kebun kecil mengikut kawasan/negeri, 2009
Table 7.2: Rubber planted area on smallholdings by region/state, 2009
Hektar
Hectares
Kawasan/Negeri Jumlah FELDA(a)
RISDA(b)
FELCRA(c)
Region/State Total Other smallholdings
Jumlah 958,907 85,375 587,664 44,762 241,106
Total
Semenanjung Malaysia 726,671 85,375 587,664 44,762 8,870
Peninsular Malaysia
Sabah 75,000 - - - 75,000
Sarawak 157,236 - - - 157,236
.
Nota/Notes:
(a) Sumber: Lembaga Getah Malaysia (LGM)
Source: Malaysian Rubber Board (MRB)
Lembaga Kemajuan Tanah Persekutuan (FELDA)
Federal Land Development Authority (FELDA)
(b)
Federal Land Consolidation and Rehabilitation Authority (FELCRA)
(c) Rubber Industry Smallholders Development Authority (RISDA)
(d) Termasuk Rancangan Tanah Negeri.
Including State Land Schemes.
Pihak Berkuasa Kemajuan Pekebun Kecil Perusahaan
Getah (RISDA)
Kawasan yang ditanam dengan getah bagi FELCRA merujuk kepada keluasan tanah yang disatukan
dan dipulihkan untuk penanaman getah.
The area planted with rubber for FELCRA refers to land area that was consolidated and rehabilitated for the
planting of rubber.
40
Kebun kecil lain(d)
Angka-angka keluasan ditanam bagi FELDA diperoleh dari jumlah keluasan ditanam baru dengan getah
ditolak keluasan getah yang bertukar ke tanaman lain semasa penanaman semula dan ditolak
pelarasan semula keluasan getah ke tanaman lain.
The figures on planted area for FELDA are derived from the total newly planted rubber area less area
converted to other crops during replanting and less readjustment of rubber area to other crops.
Angka-angka RISDA diperoleh dari jumlah keluasan getah yang ditanam semula, kawasan tanaman
baru serta tanah kosong yang mendapat bantuan RISDA dan ditolak kawasan getah yang bertukar ke
tanaman lain.
Lembaga Penyatuan dan Pemulihan Tanah Persekutuan
(FELCRA)
RISDA figures are derived from the total rubber replanted area, newly planted area, together with empty land
which gets RISDA assistance less rubber area converted to other crops during replanting.
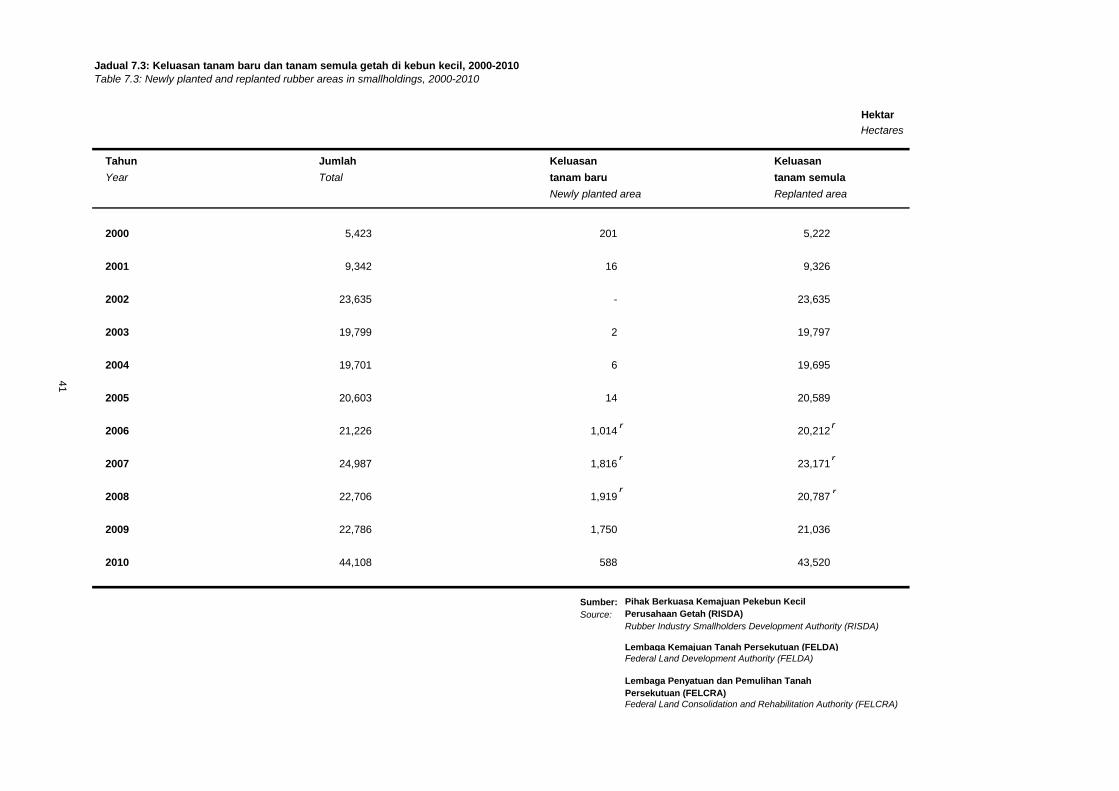
Jadual 7.3: Keluasan tanam baru dan tanam semula getah di kebun kecil, 2000-2010
Table 7.3: Newly planted and replanted rubber areas in smallholdings, 2000-2010
Hektar
Hectares
Tahun Jumlah Keluasan Keluasan
Year Total tanam baru tanam semula
Newly planted area Replanted area
2000 5,423 201 5,222
2001 9,342 16 9,326
2002 23,635 - 23,635
2003 19,799 2 19,797
2004 19,701 6 19,695
2005 20,603 14 20,589
2006 21,226 1,014 20,212
2007 24,987 1,816 23,171
2008 22,706 1,919 20,787
2009 22,786 1,750 21,036
2010 44,108 588 43,520
Sumber:
Source:
Rubber Industry Smallholders Development Authority (RISDA)
Lembaga Kemajuan Tanah Persekutuan (FELDA)
Federal Land Development Authority (FELDA)
Federal Land Consolidation and Rehabilitation Authority (FELCRA)
Lembaga Penyatuan dan Pemulihan Tanah
Persekutuan (FELCRA)
Pihak Berkuasa Kemajuan Pekebun Kecil
Perusahaan Getah (RISDA)
41
r
r
r
r
rr
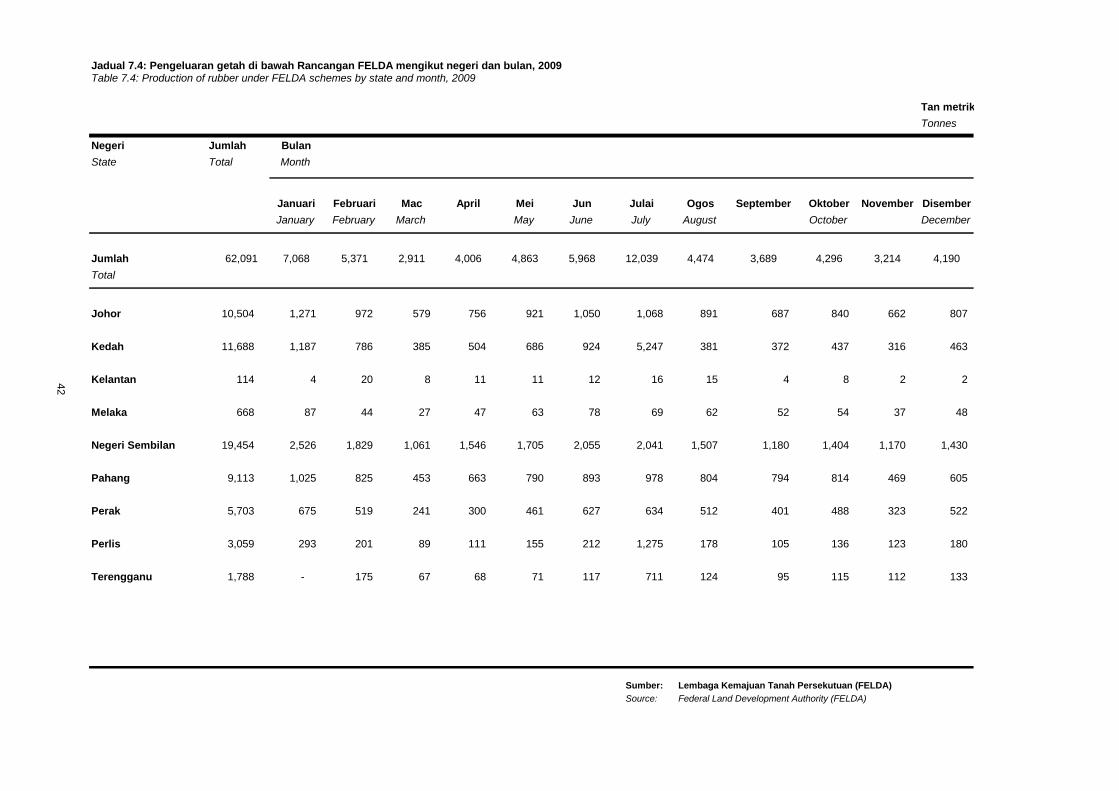
Jadual 7.4: Pengeluaran getah di bawah Rancangan FELDA mengikut negeri dan bulan, 2009Table 7.4: Production of rubber under FELDA schemes by state and month, 2009
Tan metrik
Tonnes
Negeri Jumlah Bulan
State Total Month
Januari Februari Mac April Mei Jun Julai Ogos September Oktober November Disember
January February March May June July August October December
Jumlah 62,091 7,068 5,371 2,911 4,006 4,863 5,968 12,039 4,474 3,689 4,296 3,214 4,190
Total
Johor 10,504 1,271 972 579 756 921 1,050 1,068 891 687 840 662 807
Kedah 11,688 1,187 786 385 504 686 924 5,247 381 372 437 316 463
Kelantan 114 4 20 8 11 11 12 16 15 4 8 2 2
Melaka 668 87 44 27 47 63 78 69 62 52 54 37 48
Negeri Sembilan 19,454 2,526 1,829 1,061 1,546 1,705 2,055 2,041 1,507 1,180 1,404 1,170 1,430
Pahang 9,113 1,025 825 453 663 790 893 978 804 794 814 469 605
Perak 5,703 675 519 241 300 461 627 634 512 401 488 323 522
Perlis 3,059 293 201 89 111 155 212 1,275 178 105 136 123 180
Terengganu 1,788 - 175 67 68 71 117 711 124 95 115 112 133
Sumber: Lembaga Kemajuan Tanah Persekutuan (FELDA)
Source: Federal Land Development Authority (FELDA)
42
SEKSYEN 8: EKSPORT & IMPORT
SECTION 8: EXPORTS & IMPORTS
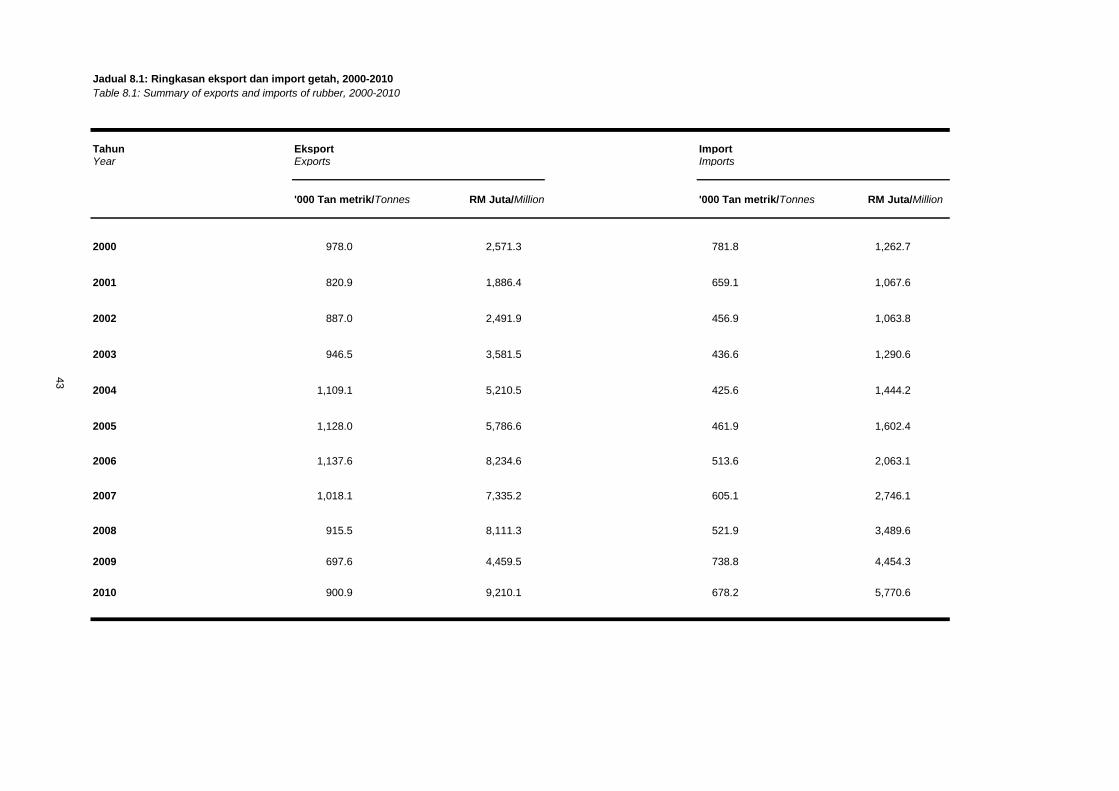
Jadual 8.1: Ringkasan eksport dan import getah, 2000-2010
Table 8.1: Summary of exports and imports of rubber, 2000-2010
Tahun Eksport ImportYear Exports Imports
'000 Tan metrik/Tonnes RM Juta/Million '000 Tan metrik/Tonnes RM Juta/Million
2000 978.0 2,571.3 781.8 1,262.7
2001 820.9 1,886.4 659.1 1,067.6
2002 887.0 2,491.9 456.9 1,063.8
2003 946.5 3,581.5 436.6 1,290.6
2004 1,109.1 5,210.5 425.6 1,444.2
2005 1,128.0 5,786.6 461.9 1,602.4
2006 1,137.6 8,234.6 513.6 2,063.1
2007 1,018.1 7,335.2 605.1 2,746.1
2008 915.5 8,111.3 521.9 3,489.6
2009 697.6 4,459.5 738.8 4,454.3
2010 900.9 9,210.1 678.2 5,770.6
43
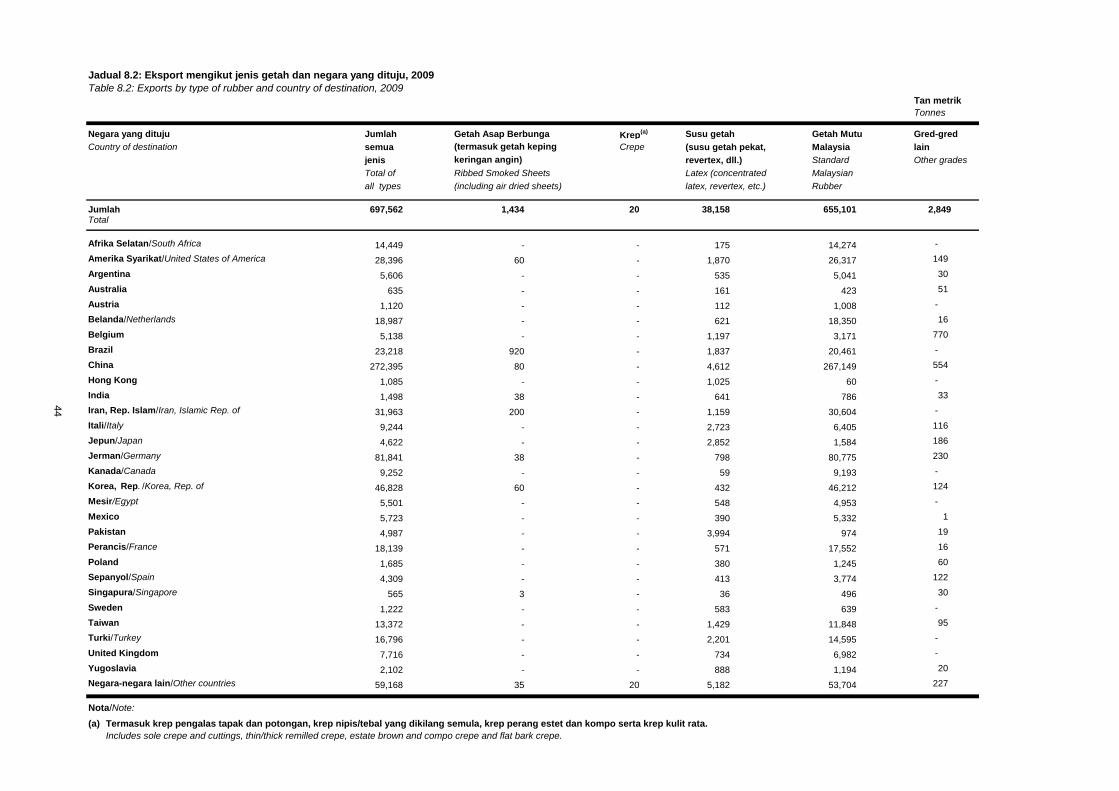
Jadual 8.2: Eksport mengikut jenis getah dan negara yang dituju, 2009
Table 8.2: Exports by type of rubber and country of destination, 2009Tan metrik
Tonnes
Negara yang dituju Jumlah Getah Asap Berbunga Krep(a) Susu getah Getah Mutu Gred-gred
Country of destination semua (termasuk getah keping Crepe (susu getah pekat, Malaysia lain
jenis keringan angin) revertex, dll.) Standard Other grades
Total of Ribbed Smoked Sheets Latex (concentrated Malaysian
all types (including air dried sheets) latex, revertex, etc.) Rubber
Jumlah 697,562 1,434 20 38,158 655,101 2,849Total
Afrika Selatan/South Africa 14,449 - - 175 14,274 -
Amerika Syarikat/United States of America 28,396 60 - 1,870 26,317 149
Argentina 5,606 - - 535 5,041 30
Australia 635 - - 161 423 51
Austria 1,120 - - 112 1,008 -
Belanda/Netherlands 18,987 - - 621 18,350 16
Belgium 5,138 - - 1,197 3,171 770
Brazil 23,218 920 - 1,837 20,461 -
China 272,395 80 - 4,612 267,149 554
Hong Kong 1,085 - - 1,025 60 -
India 1,498 38 - 641 786 33
Iran, Rep. Islam/Iran, Islamic Rep. of 31,963 200 - 1,159 30,604 -
Itali/Italy 9,244 - - 2,723 6,405 116
Jepun/Japan 4,622 - - 2,852 1,584 186
Jerman/Germany 81,841 38 - 798 80,775 230
Kanada/Canada 9,252 - - 59 9,193 -
Korea, Rep. /Korea, Rep. of 46,828 60 - 432 46,212 124
Mesir/Egypt 5,501 - - 548 4,953 -
Mexico 5,723 - - 390 5,332 1
Pakistan 4,987 - - 3,994 974 19
Perancis/France 18,139 - - 571 17,552 16
Poland 1,685 - - 380 1,245 60
Sepanyol/Spain 4,309 - - 413 3,774 122
Singapura/Singapore 565 3 - 36 496 30
Sweden 1,222 - - 583 639 -
Taiwan 13,372 - - 1,429 11,848 95
Turki/Turkey 16,796 - - 2,201 14,595 -
United Kingdom 7,716 - - 734 6,982 -
Yugoslavia 2,102 - - 888 1,194 20
Negara-negara lain/Other countries 59,168 35 20 5,182 53,704 227
Nota/Note:
(a)
Includes sole crepe and cuttings, thin/thick remilled crepe, estate brown and compo crepe and flat bark crepe.
44
Termasuk krep pengalas tapak dan potongan, krep nipis/tebal yang dikilang semula, krep perang estet dan kompo serta krep kulit rata.
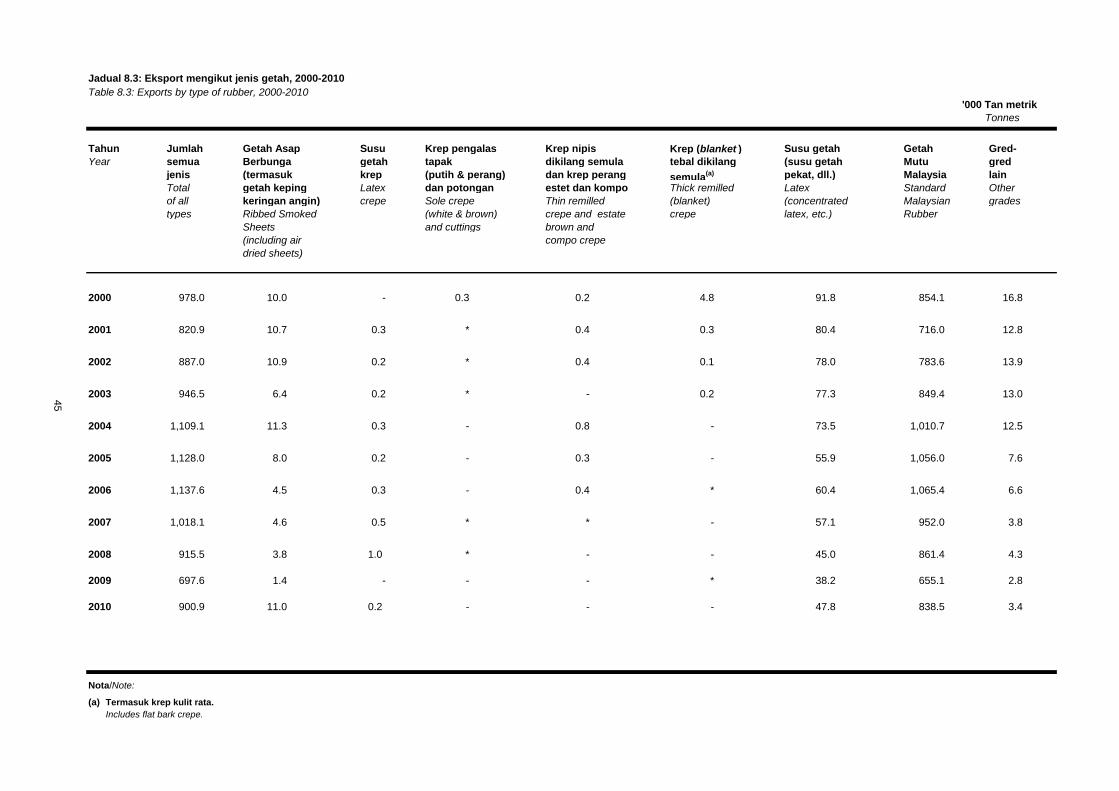
Jadual 8.3: Eksport mengikut jenis getah, 2000-2010
Table 8.3: Exports by type of rubber, 2000-2010
'000 Tan metrik
Tonnes
Tahun Jumlah Getah Asap Susu Krep pengalas Krep nipis Krep (blanket ) Susu getah Getah Gred-
Year semua Berbunga getah tapak dikilang semula tebal dikilang (susu getah Mutu gred
jenis (termasuk krep (putih & perang) dan krep perang semula(a) pekat, dll.) Malaysia lain
Total getah keping Latex dan potongan estet dan kompo Thick remilled Latex Standard Other
of all keringan angin) crepe Sole crepe Thin remilled (blanket) (concentrated Malaysian grades
types Ribbed Smoked (white & brown) crepe and estate crepe latex, etc.) Rubber
Sheets and cuttings brown and
(including air compo crepe
dried sheets)
978.0 10.0 - 0.3 0.2 4.8 91.8 854.1 16.8
820.9 10.7 0.3 * 0.4 0.3 80.4 716.0 12.8
887.0 10.9 0.2 * 0.4 0.1 78.0 783.6 13.9
946.5 6.4 0.2 * - 0.2 77.3 849.4 13.0
1,109.1 11.3 0.3 - 0.8 - 73.5 1,010.7 12.5
1,128.0 8.0 0.2 - 0.3 - 55.9 1,056.0 7.6
1,137.6 4.5 0.3 - 0.4 * 60.4 1,065.4 6.6
1,018.1 4.6 0.5 * * - 57.1 952.0 3.8
915.5 3.8 1.0 * - - 45.0 861.4 4.3
697.6 1.4 - - - * 38.2 655.1 2.8
900.9 11.0 0.2 - - - 47.8 838.5 3.4
Nota/Note:
(a) Termasuk krep kulit rata.
Includes flat bark crepe.
45
2010
2009
2008
2007
2006
2005
2004
2003
2002
2001
2000
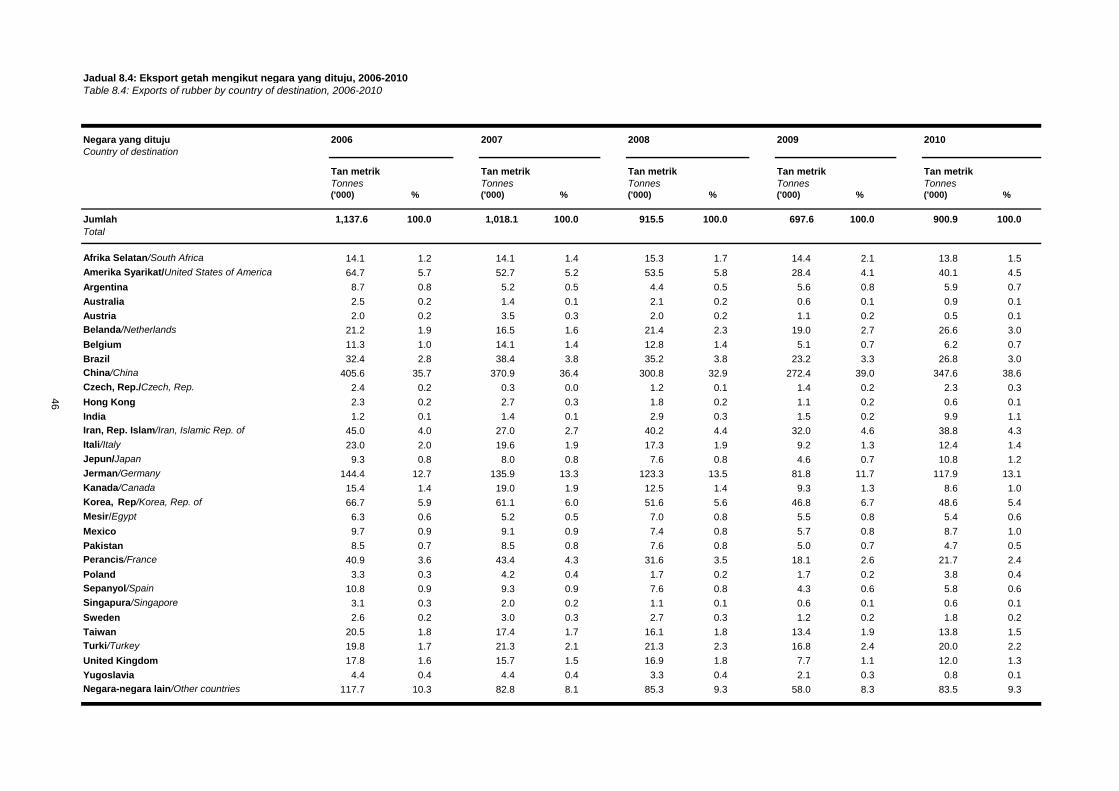
Jadual 8.4: Eksport getah mengikut negara yang dituju, 2006-2010
Table 8.4: Exports of rubber by country of destination, 2006-2010
Negara yang dituju 2006 2007 2008 2009 2010
Country of destination
Tan metrik Tan metrik Tan metrik Tan metrik Tan metrik
Tonnes Tonnes Tonnes Tonnes Tonnes('000) % ('000) % ('000) % ('000) % ('000) %
Jumlah 1,137.6 100.0 1,018.1 100.0 915.5 100.0 697.6 100.0 900.9 100.0
Total
Afrika Selatan/South Africa 14.1 1.2 14.1 1.4 15.3 1.7 14.4 2.1 13.8 1.5
Amerika Syarikat/United States of America 64.7 5.7 52.7 5.2 53.5 5.8 28.4 4.1 40.1 4.5
Argentina 8.7 0.8 5.2 0.5 4.4 0.5 5.6 0.8 5.9 0.7
Australia 2.5 0.2 1.4 0.1 2.1 0.2 0.6 0.1 0.9 0.1
Austria 2.0 0.2 3.5 0.3 2.0 0.2 1.1 0.2 0.5 0.1
Belanda/Netherlands 21.2 1.9 16.5 1.6 21.4 2.3 19.0 2.7 26.6 3.0
Belgium 11.3 1.0 14.1 1.4 12.8 1.4 5.1 0.7 6.2 0.7
Brazil 32.4 2.8 38.4 3.8 35.2 3.8 23.2 3.3 26.8 3.0
China/China 405.6 35.7 370.9 36.4 300.8 32.9 272.4 39.0 347.6 38.6
Czech, Rep./Czech, Rep. 2.4 0.2 0.3 0.0 1.2 0.1 1.4 0.2 2.3 0.3
Hong Kong 2.3 0.2 2.7 0.3 1.8 0.2 1.1 0.2 0.6 0.1
India 1.2 0.1 1.4 0.1 2.9 0.3 1.5 0.2 9.9 1.1
Iran, Rep. Islam/Iran, Islamic Rep. of 45.0 4.0 27.0 2.7 40.2 4.4 32.0 4.6 38.8 4.3
Itali/Italy 23.0 2.0 19.6 1.9 17.3 1.9 9.2 1.3 12.4 1.4
Jepun/Japan 9.3 0.8 8.0 0.8 7.6 0.8 4.6 0.7 10.8 1.2
Jerman/Germany 144.4 12.7 135.9 13.3 123.3 13.5 81.8 11.7 117.9 13.1
Kanada/Canada 15.4 1.4 19.0 1.9 12.5 1.4 9.3 1.3 8.6 1.0
Korea, Rep/Korea, Rep. of 66.7 5.9 61.1 6.0 51.6 5.6 46.8 6.7 48.6 5.4
Mesir/Egypt 6.3 0.6 5.2 0.5 7.0 0.8 5.5 0.8 5.4 0.6
Mexico 9.7 0.9 9.1 0.9 7.4 0.8 5.7 0.8 8.7 1.0
Pakistan 8.5 0.7 8.5 0.8 7.6 0.8 5.0 0.7 4.7 0.5
Perancis/France 40.9 3.6 43.4 4.3 31.6 3.5 18.1 2.6 21.7 2.4
Poland 3.3 0.3 4.2 0.4 1.7 0.2 1.7 0.2 3.8 0.4
Sepanyol/Spain 10.8 0.9 9.3 0.9 7.6 0.8 4.3 0.6 5.8 0.6
Singapura/Singapore 3.1 0.3 2.0 0.2 1.1 0.1 0.6 0.1 0.6 0.1
Sweden 2.6 0.2 3.0 0.3 2.7 0.3 1.2 0.2 1.8 0.2
Taiwan 20.5 1.8 17.4 1.7 16.1 1.8 13.4 1.9 13.8 1.5
Turki/Turkey 19.8 1.7 21.3 2.1 21.3 2.3 16.8 2.4 20.0 2.2
United Kingdom 17.8 1.6 15.7 1.5 16.9 1.8 7.7 1.1 12.0 1.3
Yugoslavia 4.4 0.4 4.4 0.4 3.3 0.4 2.1 0.3 0.8 0.1
Negara-negara lain/Other countries 117.7 10.3 82.8 8.1 85.3 9.3 58.0 8.3 83.5 9.3
46
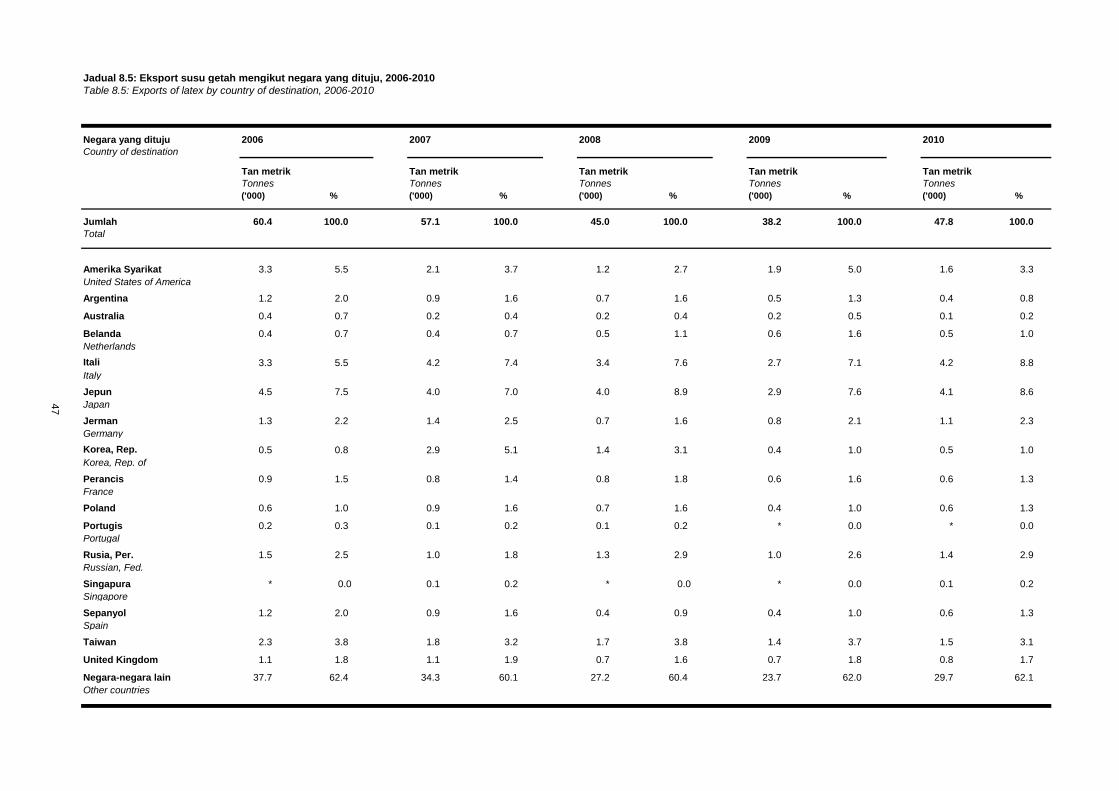
Jadual 8.5: Eksport susu getah mengikut negara yang dituju, 2006-2010
Table 8.5: Exports of latex by country of destination, 2006-2010
Negara yang dituju 2006 2007 2008 2009 2010
Country of destination
Tan metrik Tan metrik Tan metrik Tan metrik Tan metrik
Tonnes Tonnes Tonnes Tonnes Tonnes
('000) % ('000) % ('000) % ('000) % ('000) %
Jumlah 60.4 100.0 57.1 100.0 45.0 100.0 38.2 100.0 47.8 100.0
Total
Amerika Syarikat 3.3 5.5 2.1 3.7 1.2 2.7 1.9 5.0 1.6 3.3
United States of America
Argentina 1.2 2.0 0.9 1.6 0.7 1.6 0.5 1.3 0.4 0.8
Australia 0.4 0.7 0.2 0.4 0.2 0.4 0.2 0.5 0.1 0.2
Belanda 0.4 0.7 0.4 0.7 0.5 1.1 0.6 1.6 0.5 1.0
Netherlands
Itali 3.3 5.5 4.2 7.4 3.4 7.6 2.7 7.1 4.2 8.8
Italy
Jepun 4.5 7.5 4.0 7.0 4.0 8.9 2.9 7.6 4.1 8.6
Japan
Jerman 1.3 2.2 1.4 2.5 0.7 1.6 0.8 2.1 1.1 2.3
Germany
Korea, Rep. 0.5 0.8 2.9 5.1 1.4 3.1 0.4 1.0 0.5 1.0
Korea, Rep. of
Perancis 0.9 1.5 0.8 1.4 0.8 1.8 0.6 1.6 0.6 1.3
France
Poland 0.6 1.0 0.9 1.6 0.7 1.6 0.4 1.0 0.6 1.3
Portugis 0.2 0.3 0.1 0.2 0.1 0.2 * 0.0 * 0.0
Portugal
Rusia, Per. 1.5 2.5 1.0 1.8 1.3 2.9 1.0 2.6 1.4 2.9
Russian, Fed.
Singapura * 0.0 0.1 0.2 * 0.0 * 0.0 0.1 0.2
Singapore
Sepanyol 1.2 2.0 0.9 1.6 0.4 0.9 0.4 1.0 0.6 1.3
Spain
Taiwan 2.3 3.8 1.8 3.2 1.7 3.8 1.4 3.7 1.5 3.1
United Kingdom 1.1 1.8 1.1 1.9 0.7 1.6 0.7 1.8 0.8 1.7
Negara-negara lain 37.7 62.4 34.3 60.1 27.2 60.4 23.7 62.0 29.7 62.1
Other countries
47
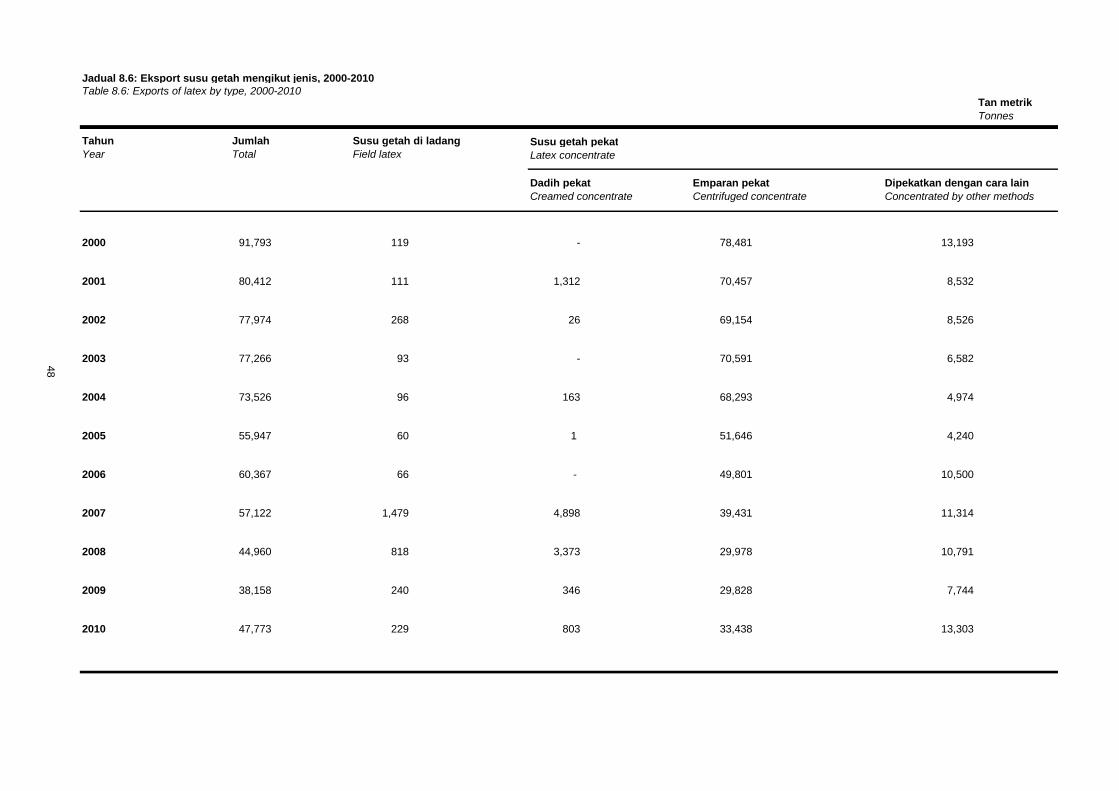
Jadual 8.6: Eksport susu getah mengikut jenis, 2000-2010
Table 8.6: Exports of latex by type, 2000-2010Tan metrik
Tonnes
Tahun Jumlah Susu getah di ladang Susu getah pekatYear Total Field latex Latex concentrate
Dadih pekat Emparan pekat Dipekatkan dengan cara lain
Creamed concentrate Centrifuged concentrate Concentrated by other methods
2000 91,793 119 - 78,481 13,193
2001 80,412 111 1,312 70,457 8,532
2002 77,974 268 26 69,154 8,526
2003 77,266 93 - 70,591 6,582
2004 73,526 96 163 68,293 4,974
2005 55,947 60 1 51,646 4,240
2006 60,367 66 - 49,801 10,500
2007 57,122 1,479 4,898 39,431 11,314
2008 44,960 818 3,373 29,978 10,791
2009 38,158 240 346 29,828 7,744
2010 47,773 229 803 33,438 13,303
48
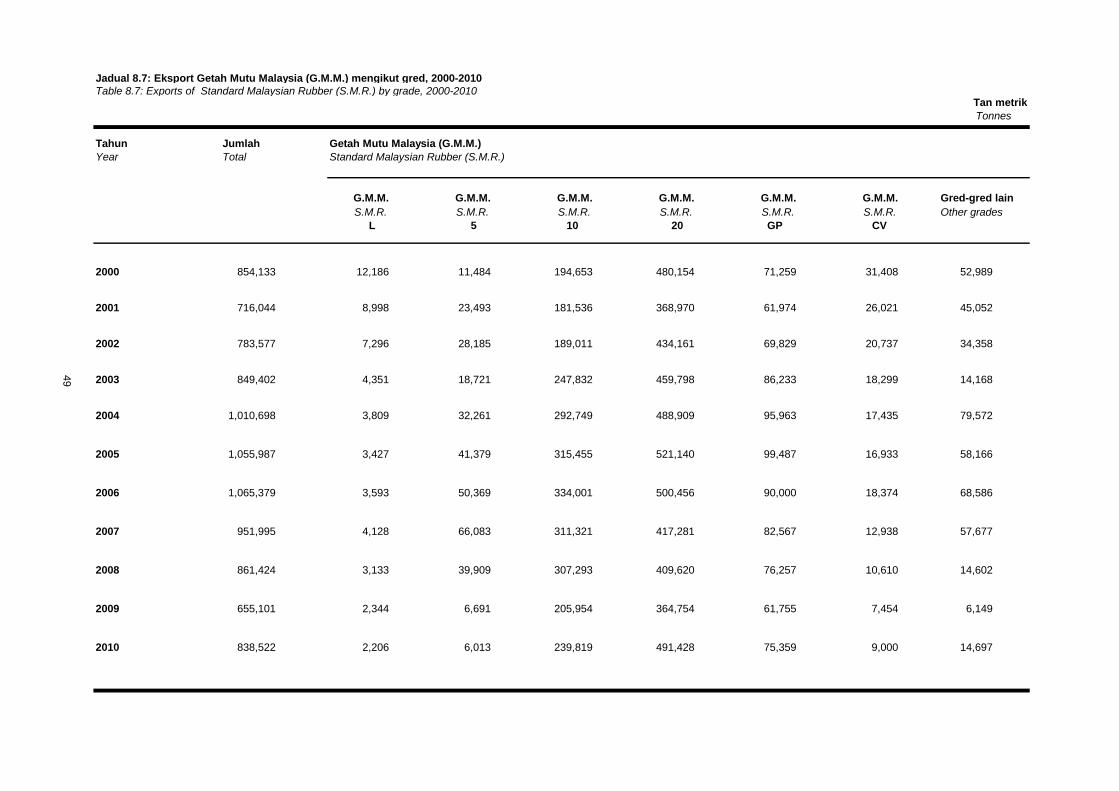
Jadual 8.7: Eksport Getah Mutu Malaysia (G.M.M.) mengikut gred, 2000-2010
Table 8.7: Exports of Standard Malaysian Rubber (S.M.R.) by grade, 2000-2010
Tonnes
Tahun Jumlah Getah Mutu Malaysia (G.M.M.)
Year Total Standard Malaysian Rubber (S.M.R.)
G.M.M. G.M.M. G.M.M. G.M.M. G.M.M. G.M.M. Gred-gred lain
S.M.R. S.M.R. S.M.R. S.M.R. S.M.R. S.M.R. Other grades
L 5 10 20 GP CV
2000 854,133 12,186 11,484 194,653 480,154 71,259 31,408 52,989
2001 716,044 8,998 23,493 181,536 368,970 61,974 26,021 45,052
2002 783,577 7,296 28,185 189,011 434,161 69,829 20,737 34,358
2003 849,402 4,351 18,721 247,832 459,798 86,233 18,299 14,168
2004 1,010,698 3,809 32,261 292,749 488,909 95,963 17,435 79,572
2005 1,055,987 3,427 41,379 315,455 521,140 99,487 16,933 58,166
2006 1,065,379 3,593 50,369 334,001 500,456 90,000 18,374 68,586
2007 951,995 4,128 66,083 311,321 417,281 82,567 12,938 57,677
2008 861,424 3,133 39,909 307,293 409,620 76,257 10,610 14,602
2009 655,101 2,344 6,691 205,954 364,754 61,755 7,454 6,149
2010 838,522 2,206 6,013 239,819 491,428 75,359 9,000 14,697
49
Tan metrik
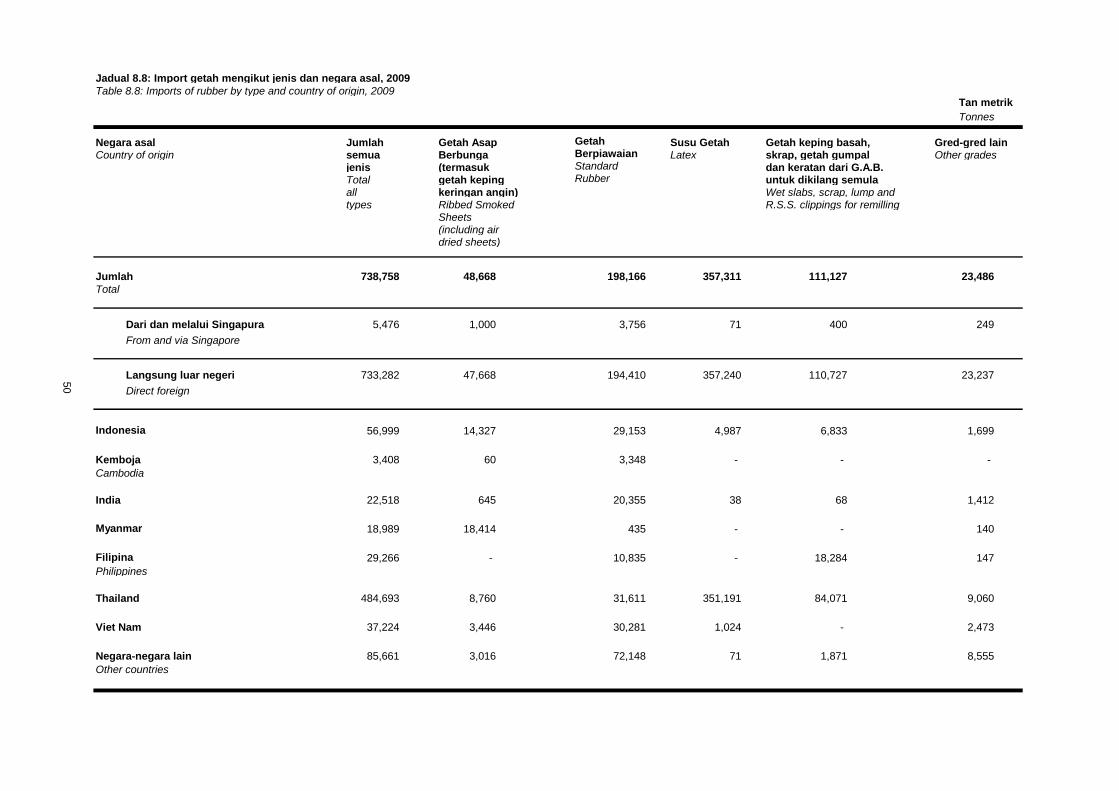
Jadual 8.8: Import getah mengikut jenis dan negara asal, 2009
Table 8.8: Imports of rubber by type and country of origin, 2009 Tan metrik
Tonnes
Negara asal Jumlah Getah Asap Getah Susu Getah Getah keping basah, Gred-gred lainCountry of origin semua Berbunga Berpiawaian Latex skrap, getah gumpal Other grades
jenis (termasuk Standard dan keratan dari G.A.B.Total getah keping Rubber untuk dikilang semulaall keringan angin) Wet slabs, scrap, lump andtypes Ribbed Smoked R.S.S. clippings for remilling
Sheets(including airdried sheets)
Jumlah 738,758 48,668 198,166 357,311 111,127 23,486
Total
Dari dan melalui Singapura 5,476 1,000 3,756 71 400 249
From and via Singapore
Langsung luar negeri 733,282 47,668 194,410 357,240 110,727 23,237
Direct foreign
Indonesia 56,999 14,327 29,153 4,987 6,833 1,699
Kemboja 3,408 60 3,348 - - -
Cambodia
India 22,518 645 20,355 38 68 1,412
Myanmar 18,989 18,414 435 - - 140
Filipina 29,266 - 10,835 - 18,284 147
Philippines
Thailand 484,693 8,760 31,611 351,191 84,071 9,060
Viet Nam 37,224 3,446 30,281 1,024 - 2,473
Negara-negara lain 85,661 3,016 72,148 71 1,871 8,555
Other countries
50
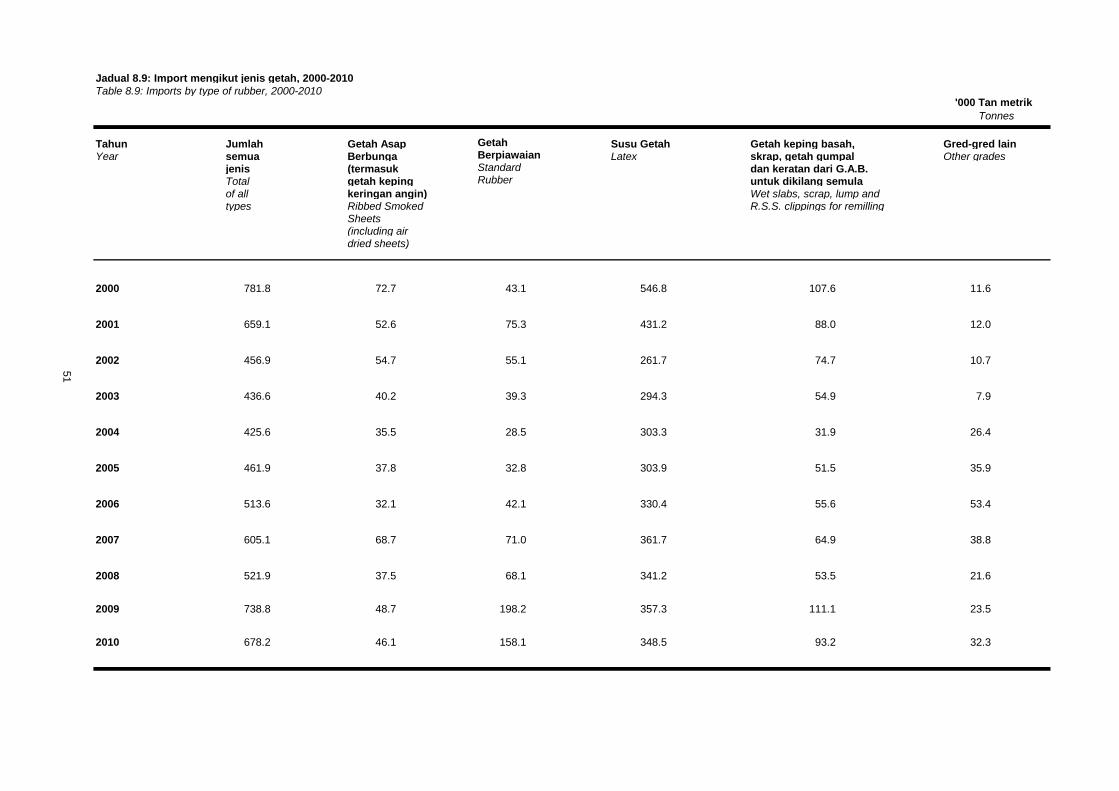
Jadual 8.9: Import mengikut jenis getah, 2000-2010
Table 8.9: Imports by type of rubber, 2000-2010
Tonnes
Tahun Jumlah Getah Asap Getah Susu Getah Getah keping basah, Gred-gred lainYear semua Berbunga Berpiawaian Latex skrap, getah gumpal Other grades
jenis (termasuk Standard dan keratan dari G.A.B.Total getah keping Rubber untuk dikilang semulaof all keringan angin) Wet slabs, scrap, lump andtypes Ribbed Smoked R.S.S. clippings for remilling
Sheets(including airdried sheets)
2000 781.8 72.7 43.1 546.8 107.6 11.6
2001 659.1 52.6 75.3 431.2 88.0 12.0
2002 456.9 54.7 55.1 261.7 74.7 10.7
2003 436.6 40.2 39.3 294.3 54.9 7.9
2004 425.6 35.5 28.5 303.3 31.9 26.4
2005 461.9 37.8 32.8 303.9 51.5 35.9
2006 513.6 32.1 42.1 330.4 55.6 53.4
2007 605.1 68.7 71.0 361.7 64.9 38.8
2008 521.9 37.5 68.1 341.2 53.5 21.6
2009 738.8 48.7 198.2 357.3 111.1 23.5
2010 678.2 46.1 158.1 348.5 93.2 32.3
51
'000 Tan metrik
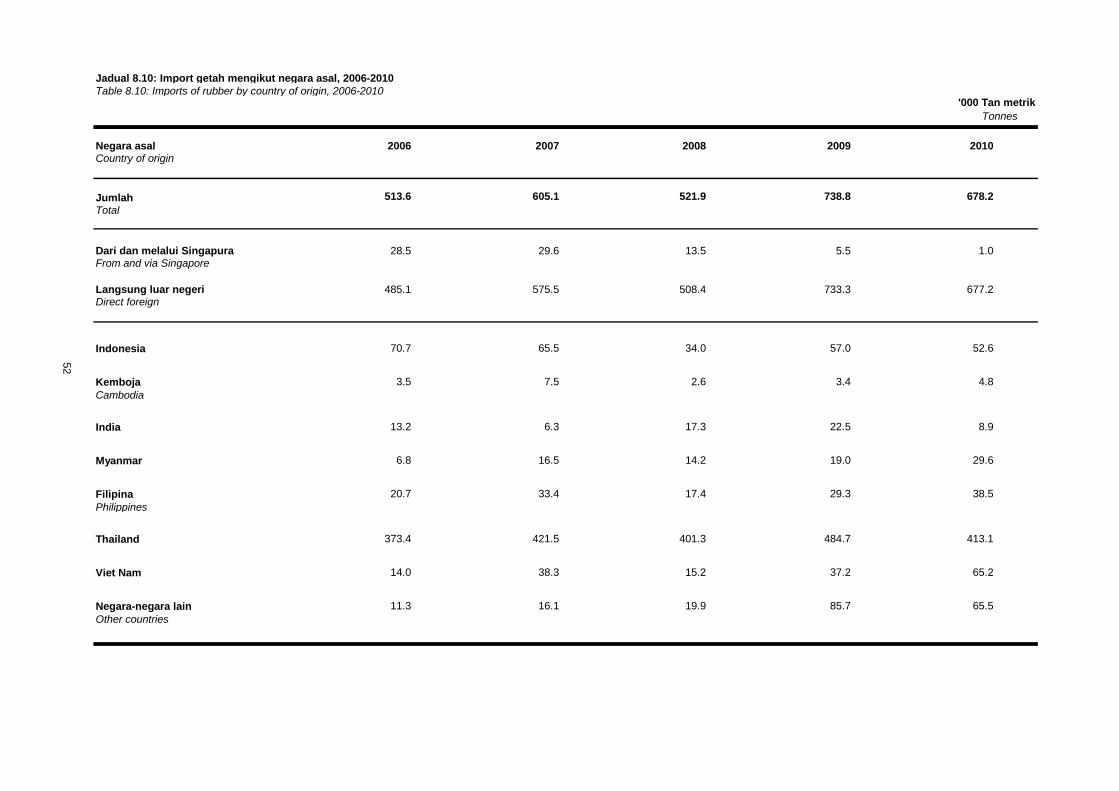
Jadual 8.10: Import getah mengikut negara asal, 2006-2010
Table 8.10: Imports of rubber by country of origin, 2006-2010
Negara asal 2006 2007 2008 2009 2010Country of origin
Jumlah 513.6 605.1 521.9 738.8 678.2
Total
Dari dan melalui Singapura 28.5 29.6 13.5 5.5 1.0From and via Singapore
Langsung luar negeri 485.1 575.5 508.4 733.3 677.2Direct foreign
Indonesia 70.7 65.5 34.0 57.0 52.6
Kemboja 3.5 7.5 2.6 3.4 4.8
Cambodia
India 13.2 6.3 17.3 22.5 8.9
Myanmar 6.8 16.5 14.2 19.0 29.6
Filipina 20.7 33.4 17.4 29.3 38.5
Philippines
Thailand 373.4 421.5 401.3 484.7 413.1
Viet Nam 14.0 38.3 15.2 37.2 65.2
Negara-negara lain 11.3 16.1 19.9 85.7 65.5
Other countries
52
'000 Tan metrik
Tonnes
SEKSYEN 9: PENGGUNAAN DOMESTIK GETAH ASLI
SECTION 9: DOMESTIC CONSUMPTION OF NATURAL RUBBER
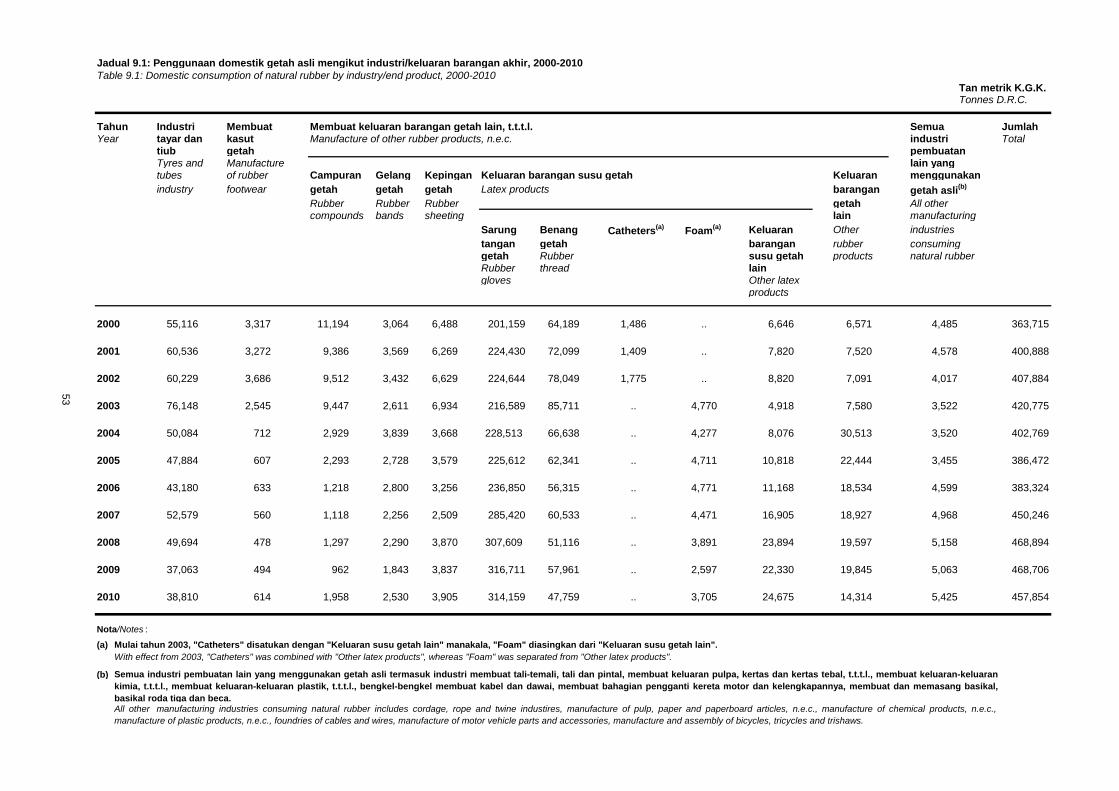
Jadual 9.1: Penggunaan domestik getah asli mengikut industri/keluaran barangan akhir, 2000-2010
Table 9.1: Domestic consumption of natural rubber by industry/end product, 2000-2010
Tan metrik K.G.K.
Tahun Industri Membuat Membuat keluaran barangan getah lain, t.t.t.l. Semua JumlahYear tayar dan kasut Manufacture of other rubber products, n.e.c. industri Total
tiub getah pembuatanTyres and Manufacture lain yangtubes of rubber Campuran Gelang Kepingan Keluaran barangan susu getah Keluaran menggunakan
industry footwear getah getah getah Latex products barangan getah asli(b)
Rubber Rubber Rubber getah All othercompounds bands sheeting lain manufacturing
Sarung Benang Catheters(a)
Foam(a) Keluaran Other industries
tangan getah barangan rubber consuminggetah Rubber susu getah products natural rubberRubber thread lain
gloves Other latexproducts
55,116 3,317 11,194 3,064 6,488 201,159 64,189 1,486 .. 6,646 6,571 4,485 363,715
60,536 3,272 9,386 3,569 6,269 224,430 72,099 1,409 .. 7,820 7,520 4,578 400,888
60,229 3,686 9,512 3,432 6,629 224,644 78,049 1,775 .. 8,820 7,091 4,017 407,884
76,148 2,545 9,447 2,611 6,934 216,589 85,711 .. 4,770 4,918 7,580 3,522 420,775
50,084 712 2,929 3,839 3,668 228,513 66,638 .. 4,277 8,076 30,513 3,520 402,769
47,884 607 2,293 2,728 3,579 225,612 62,341 .. 4,711 10,818 22,444 3,455 386,472
43,180 633 1,218 2,800 3,256 236,850 56,315 .. 4,771 11,168 18,534 4,599 383,324
52,579 560 1,118 2,256 2,509 285,420 60,533 .. 4,471 16,905 18,927 4,968 450,246
49,694 478 1,297 2,290 3,870 307,609 51,116 .. 3,891 23,894 19,597 5,158 468,894
37,063 494 962 1,843 3,837 316,711 57,961 .. 2,597 22,330 19,845 5,063 468,706
38,810 614 1,958 2,530 3,905 314,159 47,759 .. 3,705 24,675 14,314 5,425 457,854
Nota/Notes :
(a) Mulai tahun 2003, "Catheters" disatukan dengan "Keluaran susu getah lain" manakala, "Foam" diasingkan dari "Keluaran susu getah lain".
With effect from 2003, "Catheters" was combined with "Other latex products", whereas "Foam" was separated from "Other latex products".
(b)
53
2003
2002
2001
2000
2008
2007
2006
2005
Tonnes D.R.C.
Semua industri pembuatan lain yang menggunakan getah asli termasuk industri membuat tali-temali, tali dan pintal, membuat keluaran pulpa, kertas dan kertas tebal, t.t.t.l., membuat keluaran-keluaran
kimia, t.t.t.l., membuat keluaran-keluaran plastik, t.t.t.l., bengkel-bengkel membuat kabel dan dawai, membuat bahagian pengganti kereta motor dan kelengkapannya, membuat dan memasang basikal,
basikal roda tiga dan beca.All other manufacturing industries consuming natural rubber includes cordage, rope and twine industires, manufacture of pulp, paper and paperboard articles, n.e.c., manufacture of chemical products, n.e.c.,
manufacture of plastic products, n.e.c., foundries of cables and wires, manufacture of motor vehicle parts and accessories, manufacture and assembly of bicycles, tricycles and trishaws.
2010
2009
2004
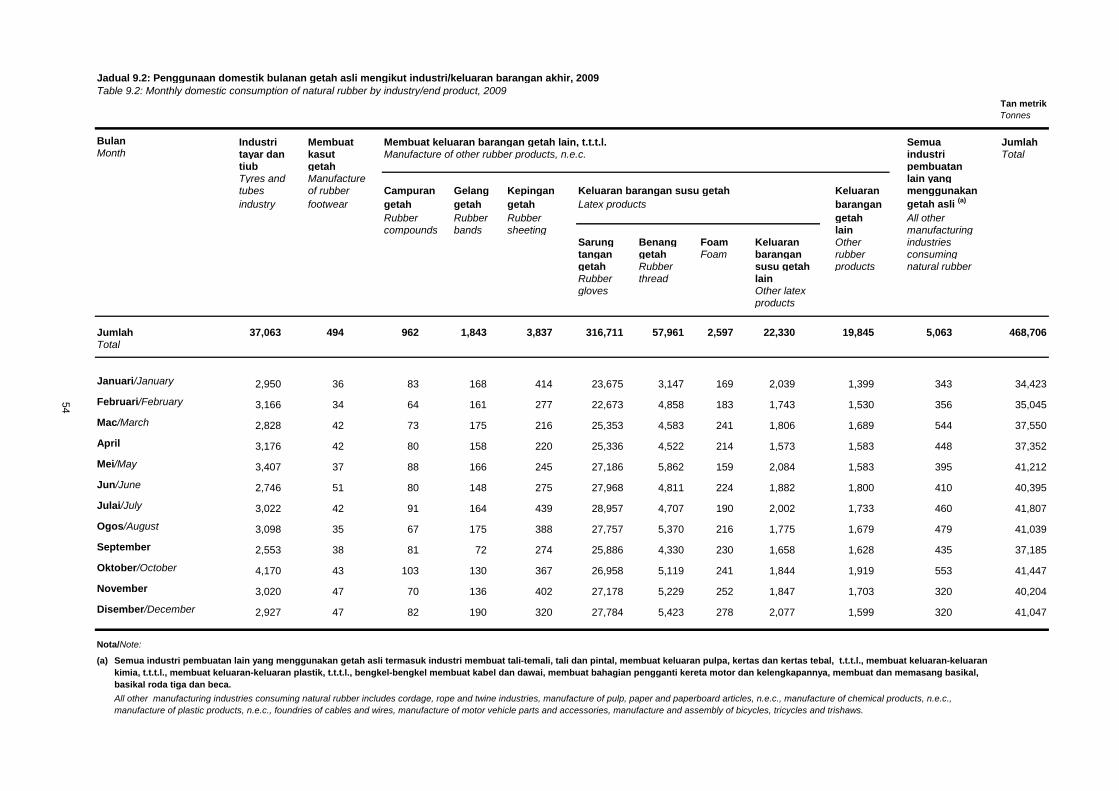
Jadual 9.2: Penggunaan domestik bulanan getah asli mengikut industri/keluaran barangan akhir, 2009
Table 9.2: Monthly domestic consumption of natural rubber by industry/end product, 2009
Tan metrik
Bulan Industri Membuat Membuat keluaran barangan getah lain, t.t.t.l. Semua JumlahMonth tayar dan kasut Manufacture of other rubber products, n.e.c. industri Total
tiub getah pembuatanTyres and Manufacture lain yangtubes of rubber Campuran Gelang Kepingan Keluaran barangan susu getah Keluaran menggunakan
industry footwear getah getah getah Latex products barangan getah asli (a)
Rubber Rubber Rubber getah All othercompounds bands sheeting lain manufacturing
Sarung Benang Foam Keluaran Other industriestangan getah Foam barangan rubber consuminggetah Rubber susu getah products natural rubber
Rubber thread laingloves Other latex
products
Jumlah 37,063 494 962 1,843 3,837 316,711 57,961 2,597 22,330 19,845 5,063 468,706Total
Januari/January 2,950 36 83 168 414 23,675 3,147 169 2,039 1,399 343 34,423
Februari/February 3,166 34 64 161 277 22,673 4,858 183 1,743 1,530 356 35,045
Mac/March 2,828 42 73 175 216 25,353 4,583 241 1,806 1,689 544 37,550
April 3,176 42 80 158 220 25,336 4,522 214 1,573 1,583 448 37,352
Mei/May 3,407 37 88 166 245 27,186 5,862 159 2,084 1,583 395 41,212
Jun/June 2,746 51 80 148 275 27,968 4,811 224 1,882 1,800 410 40,395
Julai/July 3,022 42 91 164 439 28,957 4,707 190 2,002 1,733 460 41,807
Ogos/August 3,098 35 67 175 388 27,757 5,370 216 1,775 1,679 479 41,039
September 2,553 38 81 72 274 25,886 4,330 230 1,658 1,628 435 37,185
Oktober/October 4,170 43 103 130 367 26,958 5,119 241 1,844 1,919 553 41,447
November 3,020 47 70 136 402 27,178 5,229 252 1,847 1,703 320 40,204
Disember/December 2,927 47 82 190 320 27,784 5,423 278 2,077 1,599 320 41,047
Nota/Note:
(a)
54
Tonnes
Semua industri pembuatan lain yang menggunakan getah asli termasuk industri membuat tali-temali, tali dan pintal, membuat keluaran pulpa, kertas dan kertas tebal, t.t.t.l., membuat keluaran-keluaran
kimia, t.t.t.l., membuat keluaran-keluaran plastik, t.t.t.l., bengkel-bengkel membuat kabel dan dawai, membuat bahagian pengganti kereta motor dan kelengkapannya, membuat dan memasang basikal,
basikal roda tiga dan beca.
All other manufacturing industries consuming natural rubber includes cordage, rope and twine industries, manufacture of pulp, paper and paperboard articles, n.e.c., manufacture of chemical products, n.e.c.,
manufacture of plastic products, n.e.c., foundries of cables and wires, manufacture of motor vehicle parts and accessories, manufacture and assembly of bicycles, tricycles and trishaws.
SEKSYEN 10: STOK
SECTION 10: STOCKS
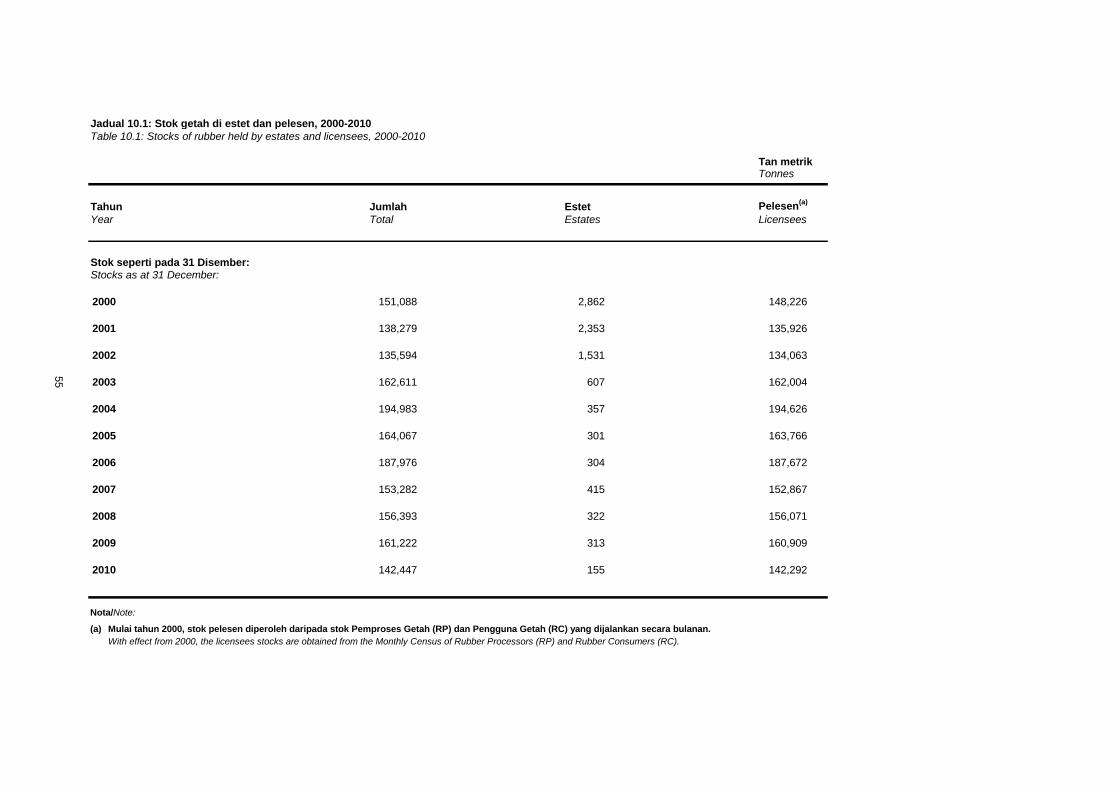
Jadual 10.1: Stok getah di estet dan pelesen, 2000-2010
Table 10.1: Stocks of rubber held by estates and licensees, 2000-2010
Tan metrik
Tahun Jumlah Estet Pelesen(a)
Year Total Estates Licensees
Stok seperti pada 31 Disember:Stocks as at 31 December:
151,088 2,862 148,226
138,279 2,353 135,926
135,594 1,531 134,063
162,611 607 162,004
194,983 357 194,626
164,067 301 163,766
187,976 304 187,672
153,282 415 152,867
156,393 322 156,071
161,222 313 160,909
142,447 155 142,292
Nota/Note:
(a) Mulai tahun 2000, stok pelesen diperoleh daripada stok Pemproses Getah (RP) dan Pengguna Getah (RC) yang dijalankan secara bulanan.
With effect from 2000, the licensees stocks are obtained from the Monthly Census of Rubber Processors (RP) and Rubber Consumers (RC).
Tonnes
2000
2010
2009
2008
2007
2006
2005
2004
2003
2002
2001
55
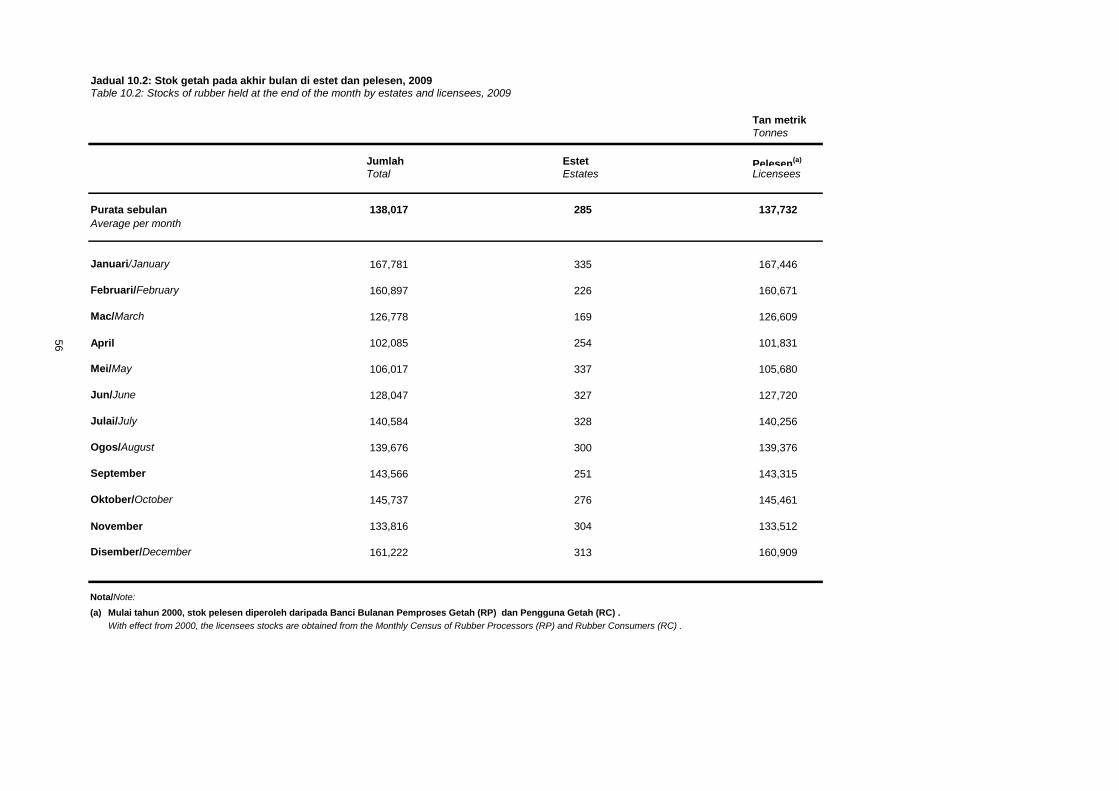
Jadual 10.2: Stok getah pada akhir bulan di estet dan pelesen, 2009Table 10.2: Stocks of rubber held at the end of the month by estates and licensees, 2009
Tan metrik
Tonnes
Jumlah Estet Pelesen(a)
Total Estates Licensees
Purata sebulan 138,017 285 137,732
Average per month
Januari/January 167,781 335 167,446
Februari/February 160,897 226 160,671
Mac/March 126,778 169 126,609
April 102,085 254 101,831
Mei/May 106,017 337 105,680
Jun/June 128,047 327 127,720
Julai/July 140,584 328 140,256
Ogos/August 139,676 300 139,376
September 143,566 251 143,315
Oktober/October 145,737 276 145,461
November 133,816 304 133,512
Disember/December 161,222 313 160,909
Nota/Note:
(a) Mulai tahun 2000, stok pelesen diperoleh daripada Banci Bulanan Pemproses Getah (RP) dan Pengguna Getah (RC) .
With effect from 2000, the licensees stocks are obtained from the Monthly Census of Rubber Processors (RP) and Rubber Consumers (RC) .
56
SEKSYEN 11: HARGA
SECTION 11: PRICES
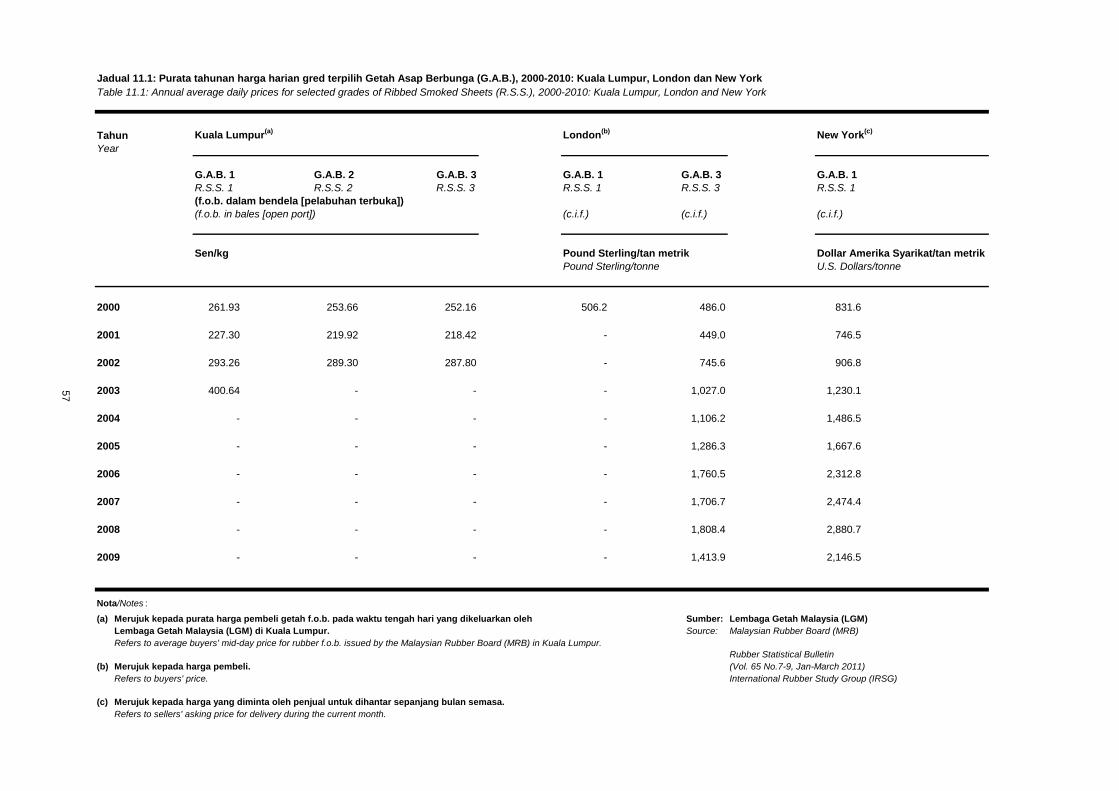
Jadual 11.1: Purata tahunan harga harian gred terpilih Getah Asap Berbunga (G.A.B.), 2000-2010: Kuala Lumpur, London dan New York
Table 11.1: Annual average daily prices for selected grades of Ribbed Smoked Sheets (R.S.S.), 2000-2010: Kuala Lumpur, London and New York
Tahun Kuala Lumpur(a)
London(b)
New York(c)
Year
G.A.B. 1 G.A.B. 2 G.A.B. 3 G.A.B. 1 G.A.B. 3 G.A.B. 1
R.S.S. 1 R.S.S. 2 R.S.S. 3 R.S.S. 1 R.S.S. 3 R.S.S. 1
(f.o.b. dalam bendela [pelabuhan terbuka])
(f.o.b. in bales [open port]) (c.i.f.) (c.i.f.) (c.i.f.)
Sen/kg Pound Sterling/tan metrik Dollar Amerika Syarikat/tan metrik
Pound Sterling/tonne U.S. Dollars/tonne
261.93 253.66 252.16 506.2 486.0 831.6
227.30 219.92 218.42 - 449.0 746.5
293.26 289.30 287.80 - 745.6 906.8
400.64 - - - 1,027.0 1,230.1
- - - - 1,106.2 1,486.5
- - - - 1,286.3 1,667.6
- - - - 1,760.5 2,312.8
- - - - 1,706.7 2,474.4
- - - - 1,808.4 2,880.7
- - - - 1,413.9 2,146.5
Nota/Notes :
(a) Merujuk kepada purata harga pembeli getah f.o.b. pada waktu tengah hari yang dikeluarkan oleh Sumber: Lembaga Getah Malaysia (LGM)
Lembaga Getah Malaysia (LGM) di Kuala Lumpur. Source: Malaysian Rubber Board (MRB)
Refers to average buyers' mid-day price for rubber f.o.b. issued by the Malaysian Rubber Board (MRB) in Kuala Lumpur.
Rubber Statistical Bulletin
(b) Merujuk kepada harga pembeli. (Vol. 65 No.7-9, Jan-March 2011)
Refers to buyers' price. International Rubber Study Group (IRSG)
(c) Merujuk kepada harga yang diminta oleh penjual untuk dihantar sepanjang bulan semasa.
Refers to sellers' asking price for delivery during the current month.
2002
2001
2000
57
2009
2008
2007
2006
2005
2004
2003
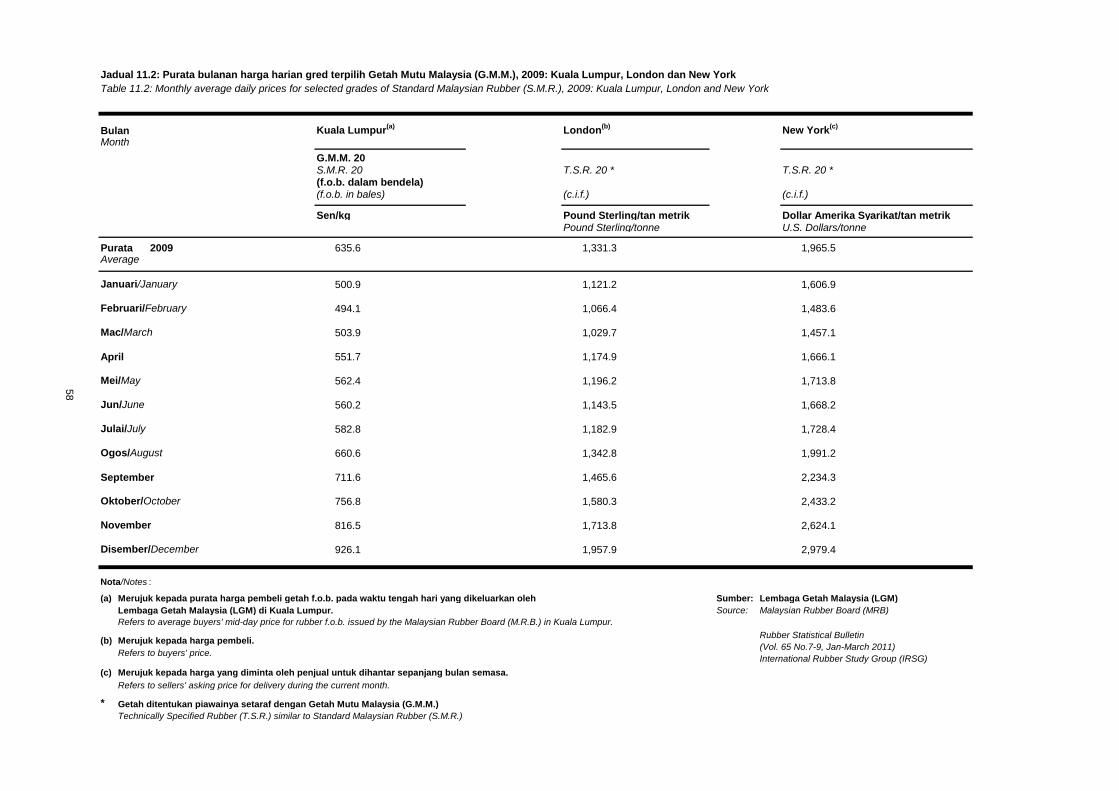
Jadual 11.2: Purata bulanan harga harian gred terpilih Getah Mutu Malaysia (G.M.M.), 2009: Kuala Lumpur, London dan New York
Table 11.2: Monthly average daily prices for selected grades of Standard Malaysian Rubber (S.M.R.), 2009: Kuala Lumpur, London and New York
Bulan Kuala Lumpur(a)
London(b)
New York(c)
Month
G.M.M. 20S.M.R. 20 T.S.R. 20 * T.S.R. 20 *(f.o.b. dalam bendela)(f.o.b. in bales) (c.i.f.) (c.i.f.)
Sen/kg Pound Sterling/tan metrik Dollar Amerika Syarikat/tan metrikPound Sterling/tonne U.S. Dollars/tonne
Purata 2009 635.6 1,331.3 1,965.5Average
Januari/January 500.9 1,121.2 1,606.9
Februari/February 494.1 1,066.4 1,483.6
Mac/March 503.9 1,029.7 1,457.1
April 551.7 1,174.9 1,666.1
Mei/May 562.4 1,196.2 1,713.8
Jun/June 560.2 1,143.5 1,668.2
Julai/July 582.8 1,182.9 1,728.4
Ogos/August 660.6 1,342.8 1,991.2
September 711.6 1,465.6 2,234.3
Oktober/October 756.8 1,580.3 2,433.2
November 816.5 1,713.8 2,624.1
Disember/December 926.1 1,957.9 2,979.4
Nota/Notes :
(a) Merujuk kepada purata harga pembeli getah f.o.b. pada waktu tengah hari yang dikeluarkan oleh Sumber: Lembaga Getah Malaysia (LGM)
Lembaga Getah Malaysia (LGM) di Kuala Lumpur. Source: Malaysian Rubber Board (MRB)
Refers to average buyers' mid-day price for rubber f.o.b. issued by the Malaysian Rubber Board (M.R.B.) in Kuala Lumpur.
(b) Merujuk kepada harga pembeli.
Refers to buyers' price.
(c) Merujuk kepada harga yang diminta oleh penjual untuk dihantar sepanjang bulan semasa.
Refers to sellers' asking price for delivery during the current month.
* Getah ditentukan piawainya setaraf dengan Getah Mutu Malaysia (G.M.M.)
Technically Specified Rubber (T.S.R.) similar to Standard Malaysian Rubber (S.M.R.)
58
Rubber Statistical Bulletin
(Vol. 65 No.7-9, Jan-March 2011)
International Rubber Study Group (IRSG)
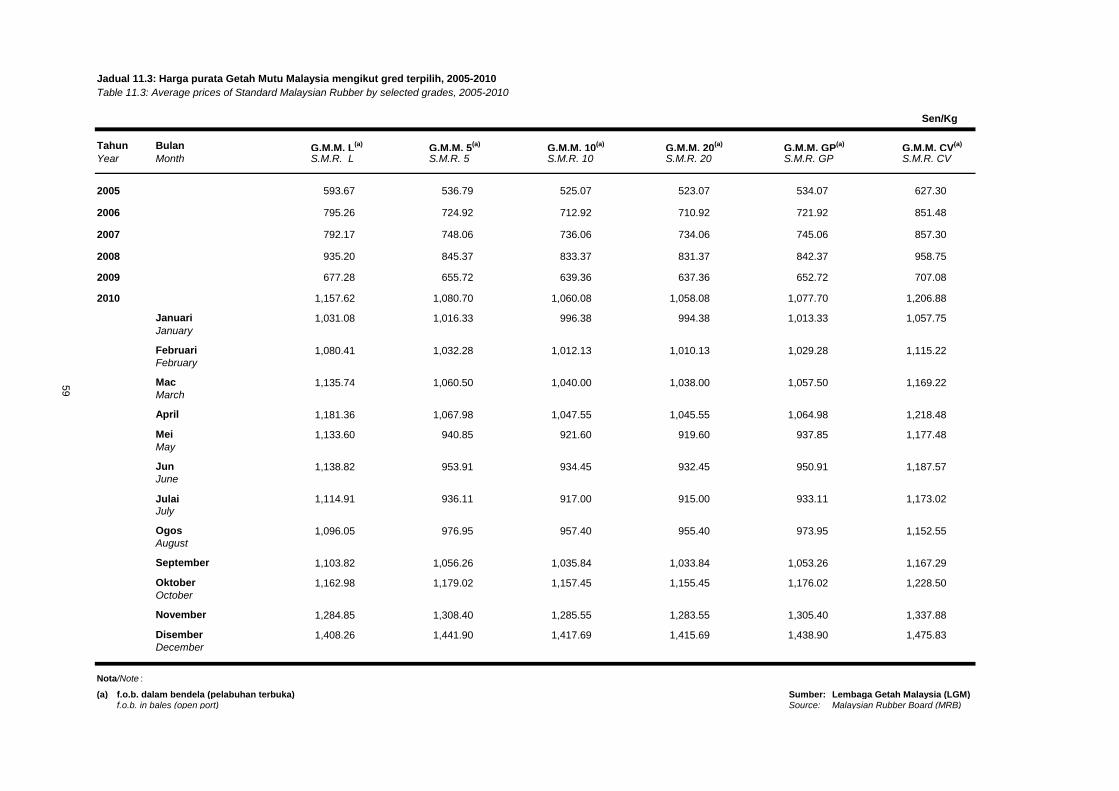
Jadual 11.3: Harga purata Getah Mutu Malaysia mengikut gred terpilih, 2005-2010
Table 11.3: Average prices of Standard Malaysian Rubber by selected grades, 2005-2010
Tahun Bulan G.M.M. L(a)
G.M.M. 5(a)
G.M.M. 10(a)
G.M.M. 20(a)
G.M.M. GP(a)
G.M.M. CV(a)
Year Month S.M.R. L S.M.R. 5 S.M.R. 10 S.M.R. 20 S.M.R. GP S.M.R. CV
593.67 536.79 525.07 523.07 534.07 627.30
795.26 724.92 712.92 710.92 721.92 851.48
792.17 748.06 736.06 734.06 745.06 857.30
935.20 845.37 833.37 831.37 842.37 958.75
677.28 655.72 639.36 637.36 652.72 707.08
1,157.62 1,080.70 1,060.08 1,058.08 1,077.70 1,206.88
Januari 1,031.08 1,016.33 996.38 994.38 1,013.33 1,057.75
January
Februari 1,080.41 1,032.28 1,012.13 1,010.13 1,029.28 1,115.22February
Mac 1,135.74 1,060.50 1,040.00 1,038.00 1,057.50 1,169.22March
April 1,181.36 1,067.98 1,047.55 1,045.55 1,064.98 1,218.48
Mei 1,133.60 940.85 921.60 919.60 937.85 1,177.48May
Jun 1,138.82 953.91 934.45 932.45 950.91 1,187.57June
Julai 1,114.91 936.11 917.00 915.00 933.11 1,173.02July
Ogos 1,096.05 976.95 957.40 955.40 973.95 1,152.55August
September 1,103.82 1,056.26 1,035.84 1,033.84 1,053.26 1,167.29
Oktober 1,162.98 1,179.02 1,157.45 1,155.45 1,176.02 1,228.50October
November 1,284.85 1,308.40 1,285.55 1,283.55 1,305.40 1,337.88
Disember 1,408.26 1,441.90 1,417.69 1,415.69 1,438.90 1,475.83December
Nota/Note :
(a) f.o.b. dalam bendela (pelabuhan terbuka) Sumber: Lembaga Getah Malaysia (LGM)
f.o.b. in bales (open port) Source: Malaysian Rubber Board (MRB)
Sen/Kg
59
2010
2009
2008
2007
2006
2005
SEKSYEN 12: PERANGKAAN DUNIA
(GETAH ASLI DAN TIRUAN)
SECTION 12: WORLD STATISTICS
(NATURAL AND SYNTHETIC RUBBER)
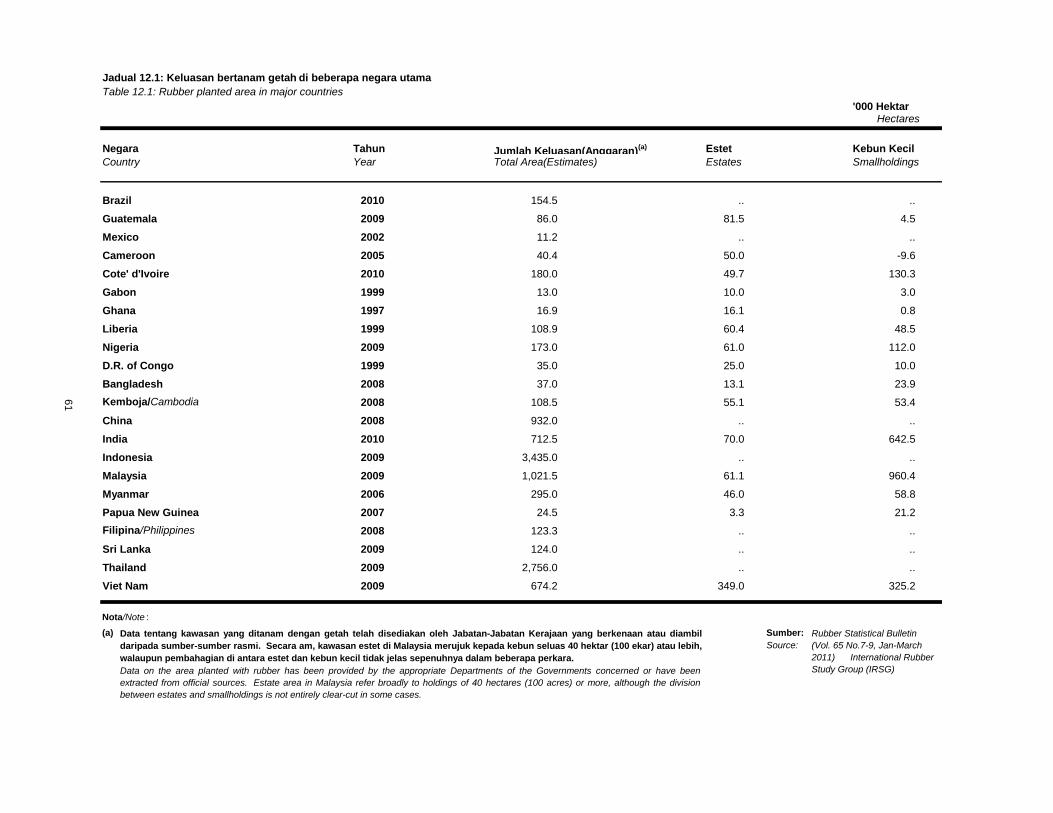
Jadual 12.1: Keluasan bertanam getah di beberapa negara utama
Table 12.1: Rubber planted area in major countries
'000 Hektar Hectares
Negara Tahun Jumlah Keluasan(Anggaran)(a) Estet Kebun Kecil
Country Year Total Area(Estimates) Estates Smallholdings
Brazil 2010 154.5 .. ..
Guatemala 2009 86.0 81.5 4.5
Mexico 2002 11.2 .. ..
Cameroon 2005 40.4 50.0 -9.6
Cote' d'Ivoire 2010 180.0 49.7 130.3
Gabon 1999 13.0 10.0 3.0
Ghana 1997 16.9 16.1 0.8
Liberia 1999 108.9 60.4 48.5
Nigeria 2009 173.0 61.0 112.0
D.R. of Congo 1999 35.0 25.0 10.0
Bangladesh 2008 37.0 13.1 23.9
Kemboja/Cambodia 2008 108.5 55.1 53.4
China 2008 932.0 .. ..
India 2010 712.5 70.0 642.5
Indonesia 2009 3,435.0 .. ..
Malaysia 2009 1,021.5 61.1 960.4
Myanmar 2006 295.0 46.0 58.8
Papua New Guinea 2007 24.5 3.3 21.2
Filipina/Philippines 2008 123.3 .. ..
Sri Lanka 2009 124.0 .. ..
Thailand 2009 2,756.0 .. ..
Viet Nam 2009 674.2 349.0 325.2
Nota/Note :
(a) Sumber:
Source:
61
Data tentang kawasan yang ditanam dengan getah telah disediakan oleh Jabatan-Jabatan Kerajaan yang berkenaan atau diambil
daripada sumber-sumber rasmi. Secara am, kawasan estet di Malaysia merujuk kepada kebun seluas 40 hektar (100 ekar) atau lebih,
walaupun pembahagian di antara estet dan kebun kecil tidak jelas sepenuhnya dalam beberapa perkara.
Data on the area planted with rubber has been provided by the appropriate Departments of the Governments concerned or have been
extracted from official sources. Estate area in Malaysia refer broadly to holdings of 40 hectares (100 acres) or more, although the division
between estates and smallholdings is not entirely clear-cut in some cases.
Rubber Statistical Bulletin
(Vol. 65 No.7-9, Jan-March
2011) International Rubber
Study Group (IRSG)
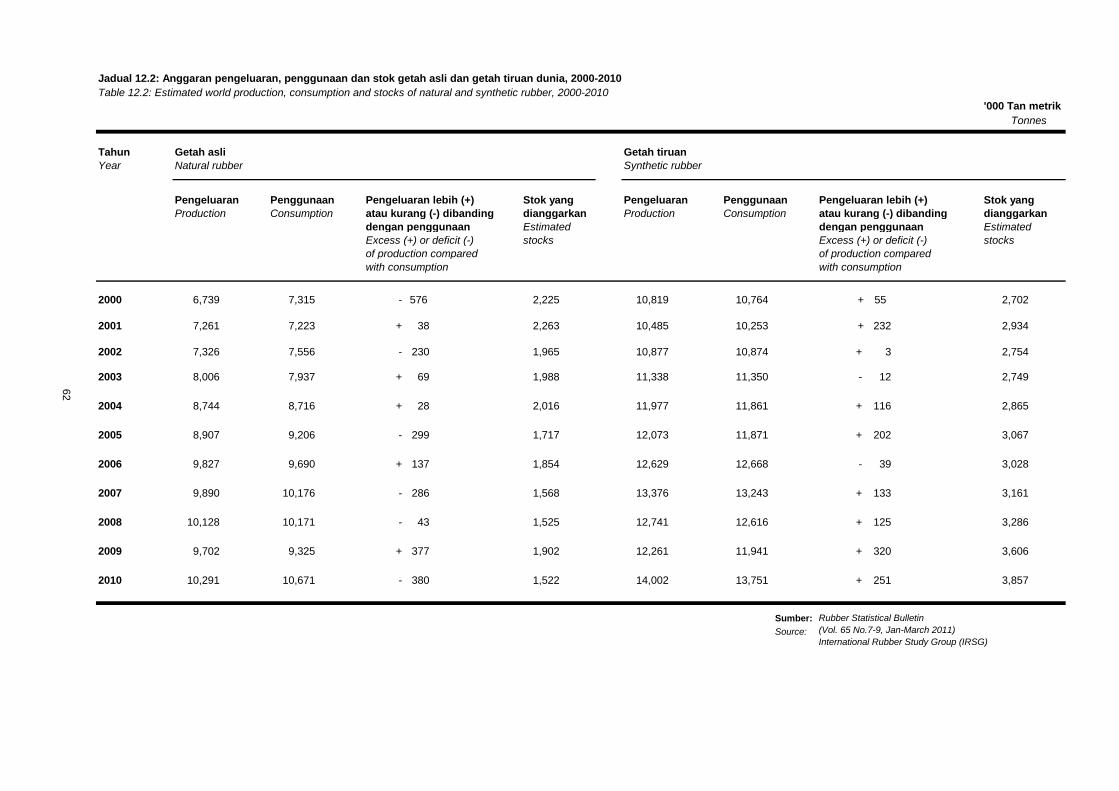
Jadual 12.2: Anggaran pengeluaran, penggunaan dan stok getah asli dan getah tiruan dunia, 2000-2010
Table 12.2: Estimated world production, consumption and stocks of natural and synthetic rubber, 2000-2010
'000 Tan metrik
Tonnes
Tahun Getah asli Getah tiruan
Year Natural rubber Synthetic rubber
Pengeluaran Penggunaan Pengeluaran lebih (+) Stok yang Pengeluaran Penggunaan Pengeluaran lebih (+) Stok yang
Production Consumption atau kurang (-) dibanding dianggarkan Production Consumption atau kurang (-) dibanding dianggarkan
dengan penggunaan Estimated dengan penggunaan Estimated
Excess (+) or deficit (-) stocks Excess (+) or deficit (-) stocks
of production compared of production compared
with consumption with consumption
2000 6,739 7,315 - 576 2,225 10,819 10,764 + 55 2,702
2001 7,261 7,223 + 38 2,263 10,485 10,253 + 232 2,934
2002 7,326 7,556 - 230 1,965 10,877 10,874 + 3 2,754
2003 8,006 7,937 + 69 1,988 11,338 11,350 - 12 2,749
2004 8,744 8,716 + 28 2,016 11,977 11,861 + 116 2,865
2005 8,907 9,206 - 299 1,717 12,073 11,871 + 202 3,067
2006 9,827 9,690 + 137 1,854 12,629 12,668 - 39 3,028
2007 9,890 10,176 - 286 1,568 13,376 13,243 + 133 3,161
2008 10,128 10,171 - 43 1,525 12,741 12,616 + 125 3,286
2009 9,702 9,325 + 377 1,902 12,261 11,941 + 320 3,606
2010 10,291 10,671 - 380 1,522 14,002 13,751 + 251 3,857
Sumber:
Source:
62
Rubber Statistical Bulletin
(Vol. 65 No.7-9, Jan-March 2011)
International Rubber Study Group (IRSG)
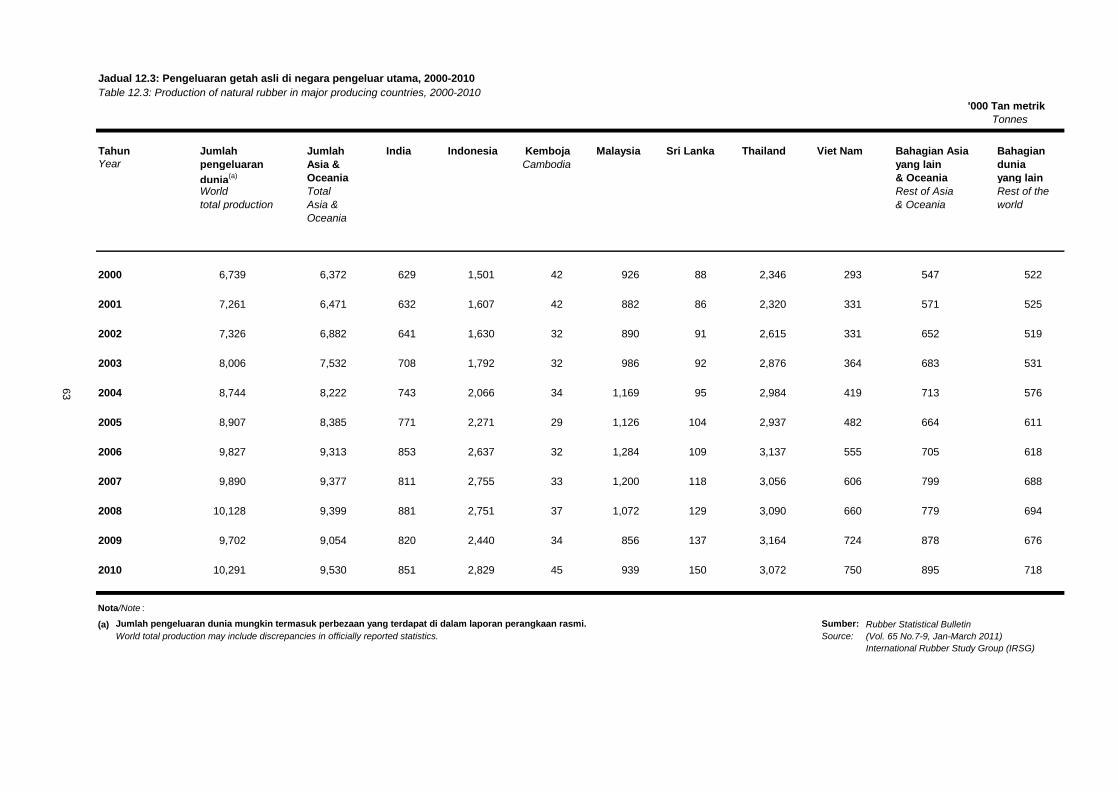
Jadual 12.3: Pengeluaran getah asli di negara pengeluar utama, 2000-2010
Table 12.3: Production of natural rubber in major producing countries, 2000-2010
'000 Tan metrik
Tonnes
Tahun Jumlah Jumlah India Indonesia Kemboja Malaysia Sri Lanka Thailand Viet Nam Bahagian Asia Bahagian
pengeluaran Asia & Cambodia yang lain dunia
dunia(a) Oceania & Oceania yang lain
World Total Rest of Asia Rest of the
total production Asia & & Oceania world
Oceania
6,739 6,372 629 1,501 42 926 88 2,346 293 547 522
7,261 6,471 632 1,607 42 882 86 2,320 331 571 525
7,326 6,882 641 1,630 32 890 91 2,615 331 652 519
8,006 7,532 708 1,792 32 986 92 2,876 364 683 531
8,744 8,222 743 2,066 34 1,169 95 2,984 419 713 576
8,907 8,385 771 2,271 29 1,126 104 2,937 482 664 611
9,827 9,313 853 2,637 32 1,284 109 3,137 555 705 618
9,890 9,377 811 2,755 33 1,200 118 3,056 606 799 688
10,128 9,399 881 2,751 37 1,072 129 3,090 660 779 694
9,702 9,054 820 2,440 34 856 137 3,164 724 878 676
10,291 9,530 851 2,829 45 939 150 3,072 750 895 718
Nota/Note :
(a) Jumlah pengeluaran dunia mungkin termasuk perbezaan yang terdapat di dalam laporan perangkaan rasmi. Sumber:
World total production may include discrepancies in officially reported statistics. Source:
63
Rubber Statistical Bulletin
(Vol. 65 No.7-9, Jan-March 2011)
International Rubber Study Group (IRSG)
Year
2010
2009
2008
2007
2006
2005
2004
2003
2002
2001
2000
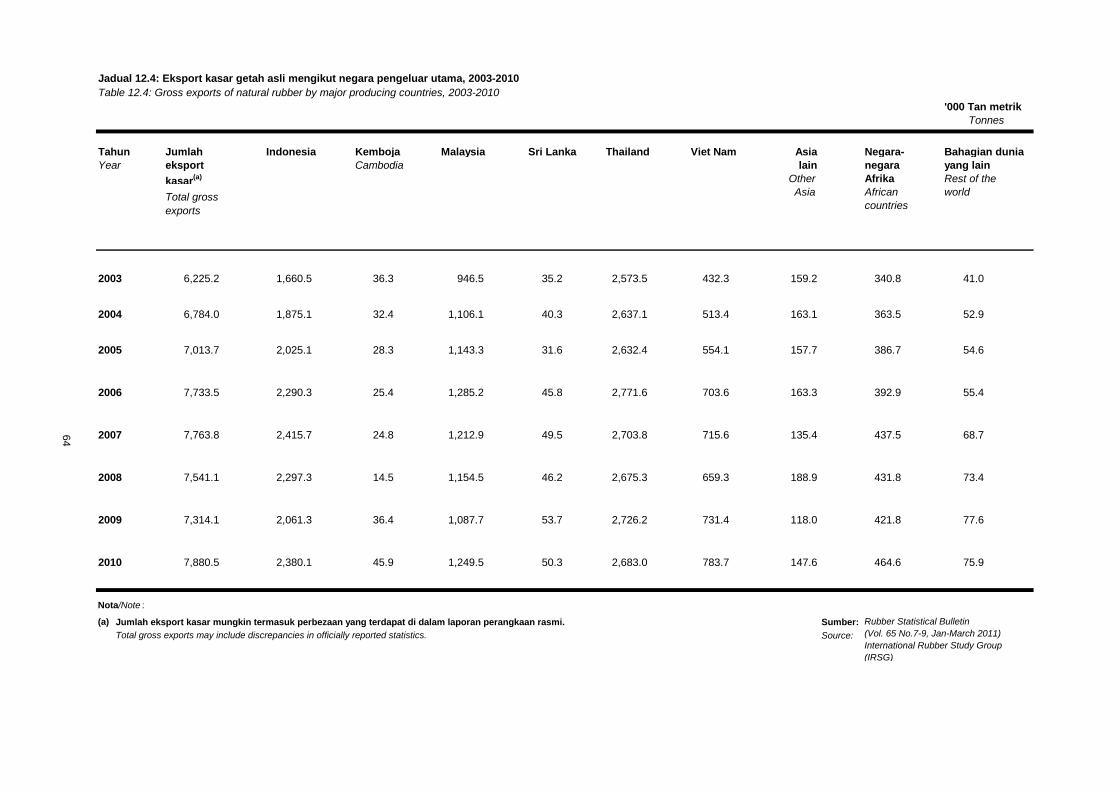
Jadual 12.4: Eksport kasar getah asli mengikut negara pengeluar utama, 2003-2010
Table 12.4: Gross exports of natural rubber by major producing countries, 2003-2010
'000 Tan metrik
Tonnes
Tahun Jumlah Indonesia Kemboja Malaysia Sri Lanka Thailand Viet Nam Asia Negara- Bahagian dunia
Year eksport Cambodia lain negara yang lain
kasar(a) Other Afrika Rest of the
Asia African world
countries
6,225.2 1,660.5 36.3 946.5 35.2 2,573.5 432.3 159.2 340.8 41.0
6,784.0 1,875.1 32.4 1,106.1 40.3 2,637.1 513.4 163.1 363.5 52.9
7,013.7 2,025.1 28.3 1,143.3 31.6 2,632.4 554.1 157.7 386.7 54.6
7,733.5 2,290.3 25.4 1,285.2 45.8 2,771.6 703.6 163.3 392.9 55.4
7,763.8 2,415.7 24.8 1,212.9 49.5 2,703.8 715.6 135.4 437.5 68.7
7,541.1 2,297.3 14.5 1,154.5 46.2 2,675.3 659.3 188.9 431.8 73.4
7,314.1 2,061.3 36.4 1,087.7 53.7 2,726.2 731.4 118.0 421.8 77.6
7,880.5 2,380.1 45.9 1,249.5 50.3 2,683.0 783.7 147.6 464.6 75.9
Nota/Note :
(a) Jumlah eksport kasar mungkin termasuk perbezaan yang terdapat di dalam laporan perangkaan rasmi. Sumber:
Total gross exports may include discrepancies in officially reported statistics. Source:
Rubber Statistical Bulletin
(Vol. 65 No.7-9, Jan-March 2011)
International Rubber Study Group
(IRSG)
2003
2008
2007
2010
2009
2006
2005
2004
64
Total gross
exports
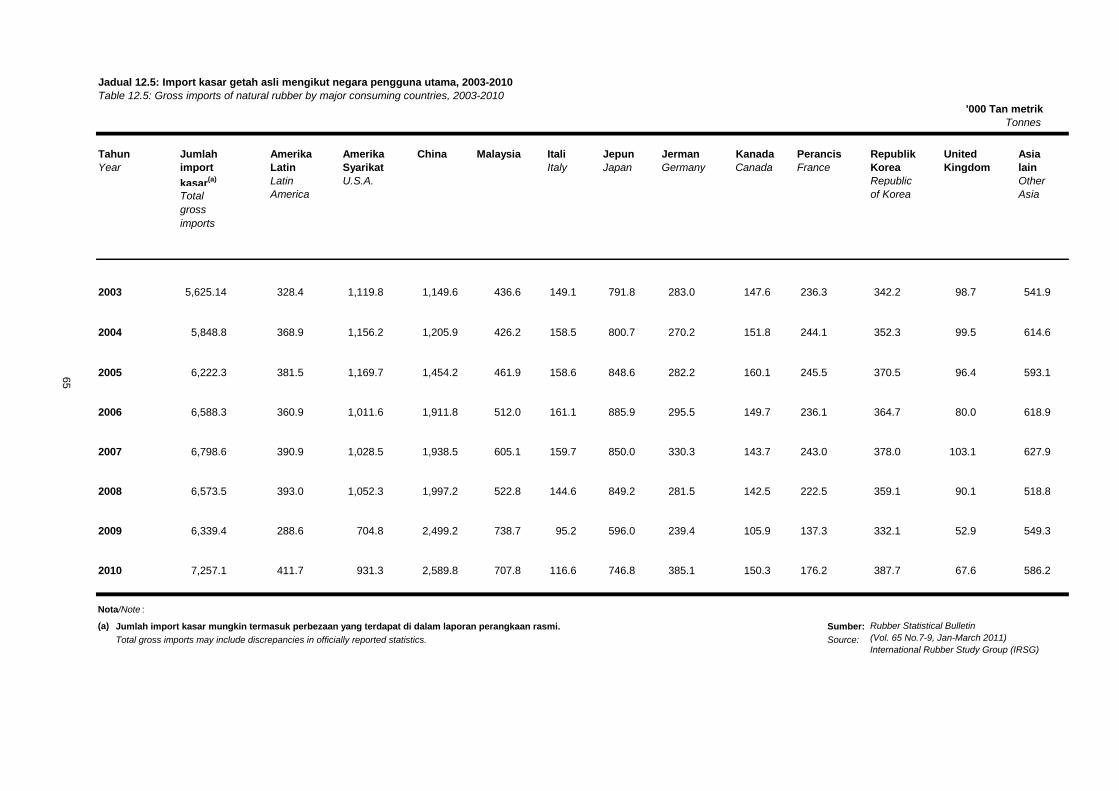
Jadual 12.5: Import kasar getah asli mengikut negara pengguna utama, 2003-2010
Table 12.5: Gross imports of natural rubber by major consuming countries, 2003-2010
'000 Tan metrik
Tonnes
Tahun Jumlah Amerika Amerika China Malaysia Itali Jepun Jerman Kanada Perancis Republik United Asia
Year import Latin Syarikat Italy Japan Germany Canada France Korea Kingdom lain
kasar(a) Latin U.S.A. Republic Other
America of Korea Asia
5,625.14 328.4 1,119.8 1,149.6 436.6 149.1 791.8 283.0 147.6 236.3 342.2 98.7 541.9
5,848.8 368.9 1,156.2 1,205.9 426.2 158.5 800.7 270.2 151.8 244.1 352.3 99.5 614.6
6,222.3 381.5 1,169.7 1,454.2 461.9 158.6 848.6 282.2 160.1 245.5 370.5 96.4 593.1
6,588.3 360.9 1,011.6 1,911.8 512.0 161.1 885.9 295.5 149.7 236.1 364.7 80.0 618.9
6,798.6 390.9 1,028.5 1,938.5 605.1 159.7 850.0 330.3 143.7 243.0 378.0 103.1 627.9
6,573.5 393.0 1,052.3 1,997.2 522.8 144.6 849.2 281.5 142.5 222.5 359.1 90.1 518.8
6,339.4 288.6 704.8 2,499.2 738.7 95.2 596.0 239.4 105.9 137.3 332.1 52.9 549.3
7,257.1 411.7 931.3 2,589.8 707.8 116.6 746.8 385.1 150.3 176.2 387.7 67.6 586.2
Nota/Note :
(a) Jumlah import kasar mungkin termasuk perbezaan yang terdapat di dalam laporan perangkaan rasmi. Sumber:
Total gross imports may include discrepancies in officially reported statistics. Source:
Rubber Statistical Bulletin
(Vol. 65 No.7-9, Jan-March 2011)
International Rubber Study Group (IRSG)
2010
2009
2008
2003
65
Total
gross
imports
2007
2006
2005
2004
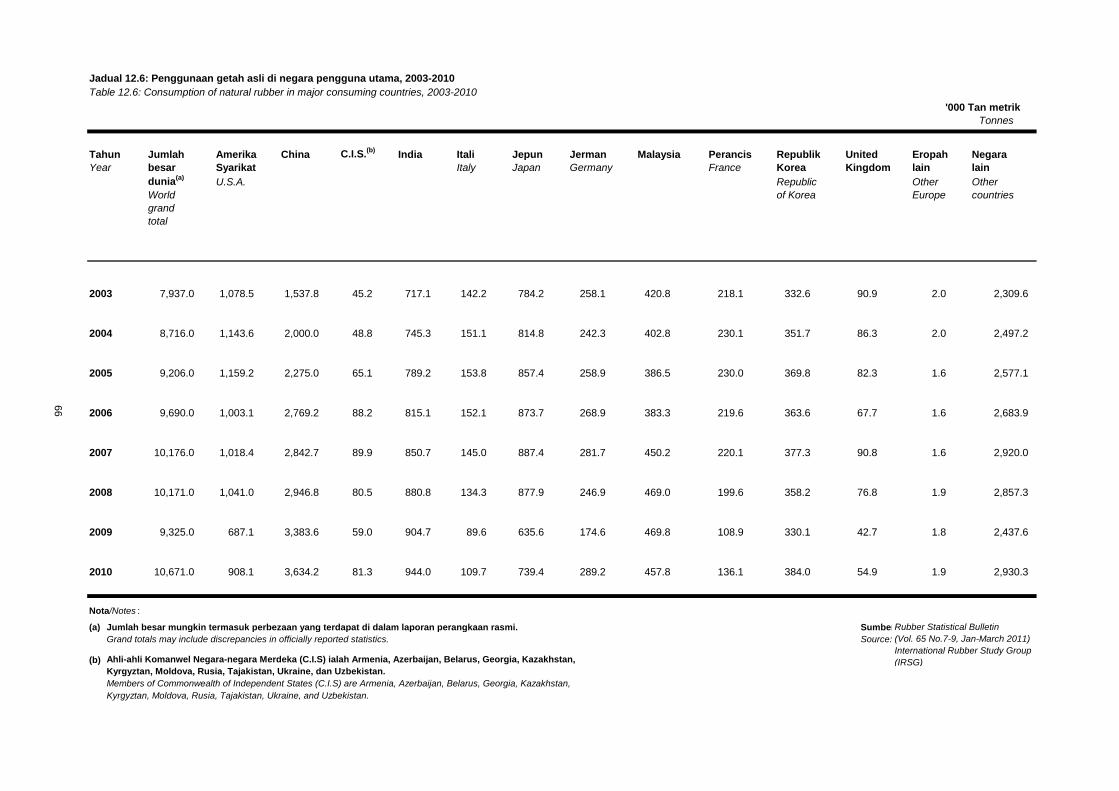
Jadual 12.6: Penggunaan getah asli di negara pengguna utama, 2003-2010
Table 12.6: Consumption of natural rubber in major consuming countries, 2003-2010
'000 Tan metrik
Tonnes
Tahun Jumlah Amerika China C.I.S.(b)
India Itali Jepun Jerman Malaysia Perancis Republik United Eropah Negara
Year besar Syarikat Italy Japan Germany France Korea Kingdom lain lain
dunia(a)
U.S.A. Republic Other Other
World of Korea Europe countries
grand
total
7,937.0 1,078.5 1,537.8 45.2 717.1 142.2 784.2 258.1 420.8 218.1 332.6 90.9 2.0 2,309.6
8,716.0 1,143.6 2,000.0 48.8 745.3 151.1 814.8 242.3 402.8 230.1 351.7 86.3 2.0 2,497.2
9,206.0 1,159.2 2,275.0 65.1 789.2 153.8 857.4 258.9 386.5 230.0 369.8 82.3 1.6 2,577.1
9,690.0 1,003.1 2,769.2 88.2 815.1 152.1 873.7 268.9 383.3 219.6 363.6 67.7 1.6 2,683.9
10,176.0 1,018.4 2,842.7 89.9 850.7 145.0 887.4 281.7 450.2 220.1 377.3 90.8 1.6 2,920.0
10,171.0 1,041.0 2,946.8 80.5 880.8 134.3 877.9 246.9 469.0 199.6 358.2 76.8 1.9 2,857.3
9,325.0 687.1 3,383.6 59.0 904.7 89.6 635.6 174.6 469.8 108.9 330.1 42.7 1.8 2,437.6
10,671.0 908.1 3,634.2 81.3 944.0 109.7 739.4 289.2 457.8 136.1 384.0 54.9 1.9 2,930.3
Nota/Notes :
(a) Jumlah besar mungkin termasuk perbezaan yang terdapat di dalam laporan perangkaan rasmi. Sumber:
Grand totals may include discrepancies in officially reported statistics. Source:
(b)
Members of Commonwealth of Independent States (C.I.S) are Armenia, Azerbaijan, Belarus, Georgia, Kazakhstan,
Kyrgyztan, Moldova, Rusia, Tajakistan, Ukraine, and Uzbekistan.
2006
2005
2004
2003
Rubber Statistical Bulletin
(Vol. 65 No.7-9, Jan-March 2011)
International Rubber Study Group
(IRSG)
66
Ahli-ahli Komanwel Negara-negara Merdeka (C.I.S) ialah Armenia, Azerbaijan, Belarus, Georgia, Kazakhstan,
Kyrgyztan, Moldova, Rusia, Tajakistan, Ukraine, dan Uzbekistan.
2010
2009
2008
2007
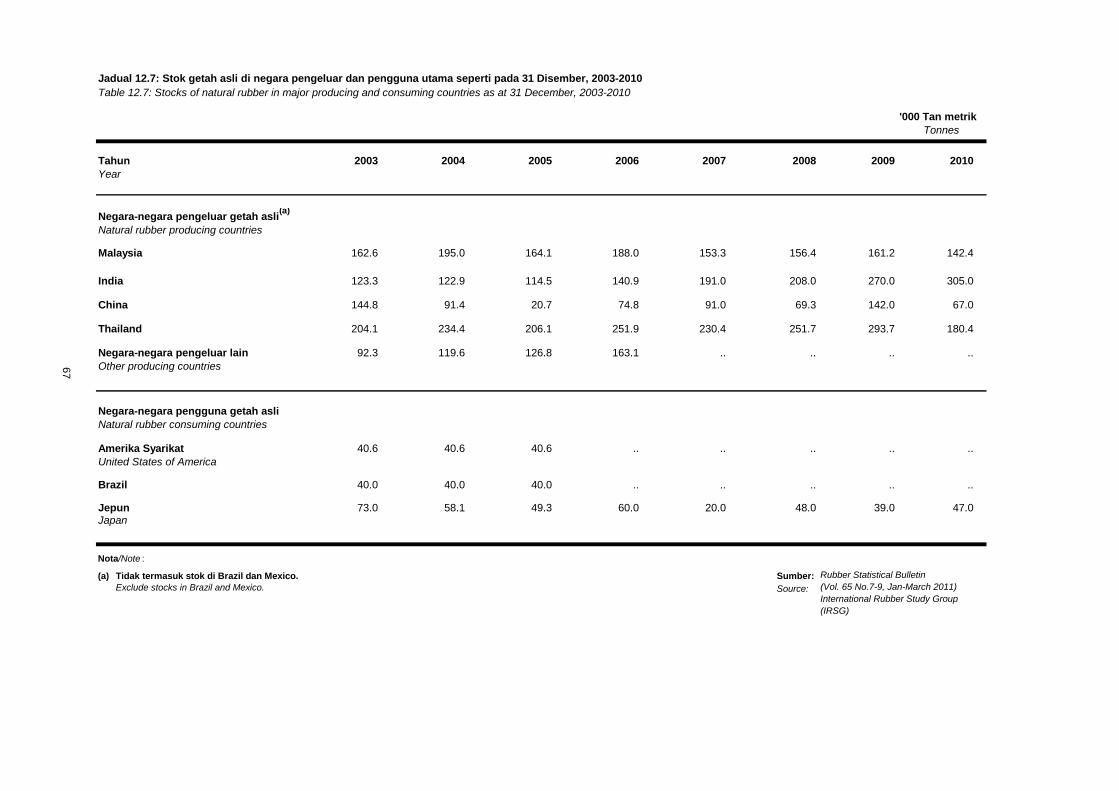
Jadual 12.7: Stok getah asli di negara pengeluar dan pengguna utama seperti pada 31 Disember, 2003-2010
Table 12.7: Stocks of natural rubber in major producing and consuming countries as at 31 December, 2003-2010
'000 Tan metrik
Tonnes
Tahun 2003 2004 2005 2006 2007 2008 2009 2010
Year
Negara-negara pengeluar getah asli(a)
Natural rubber producing countries
Malaysia 162.6 195.0 164.1 188.0 153.3 156.4 161.2 142.4
India 123.3 122.9 114.5 140.9 191.0 208.0 270.0 305.0
China 144.8 91.4 20.7 74.8 91.0 69.3 142.0 67.0
Thailand 204.1 234.4 206.1 251.9 230.4 251.7 293.7 180.4
Negara-negara pengeluar lain 92.3 119.6 126.8 163.1 .. .. .. ..
Other producing countries
Negara-negara pengguna getah asli
Natural rubber consuming countries
Amerika Syarikat 40.6 40.6 40.6 .. .. .. .. ..
United States of America
Brazil 40.0 40.0 40.0 .. .. .. .. ..
Jepun 73.0 58.1 49.3 60.0 20.0 48.0 39.0 47.0Japan
Nota/Note :
(a) Tidak termasuk stok di Brazil dan Mexico. Sumber:
Exclude stocks in Brazil and Mexico. Source:
67
Rubber Statistical Bulletin
(Vol. 65 No.7-9, Jan-March 2011)
International Rubber Study Group
(IRSG)
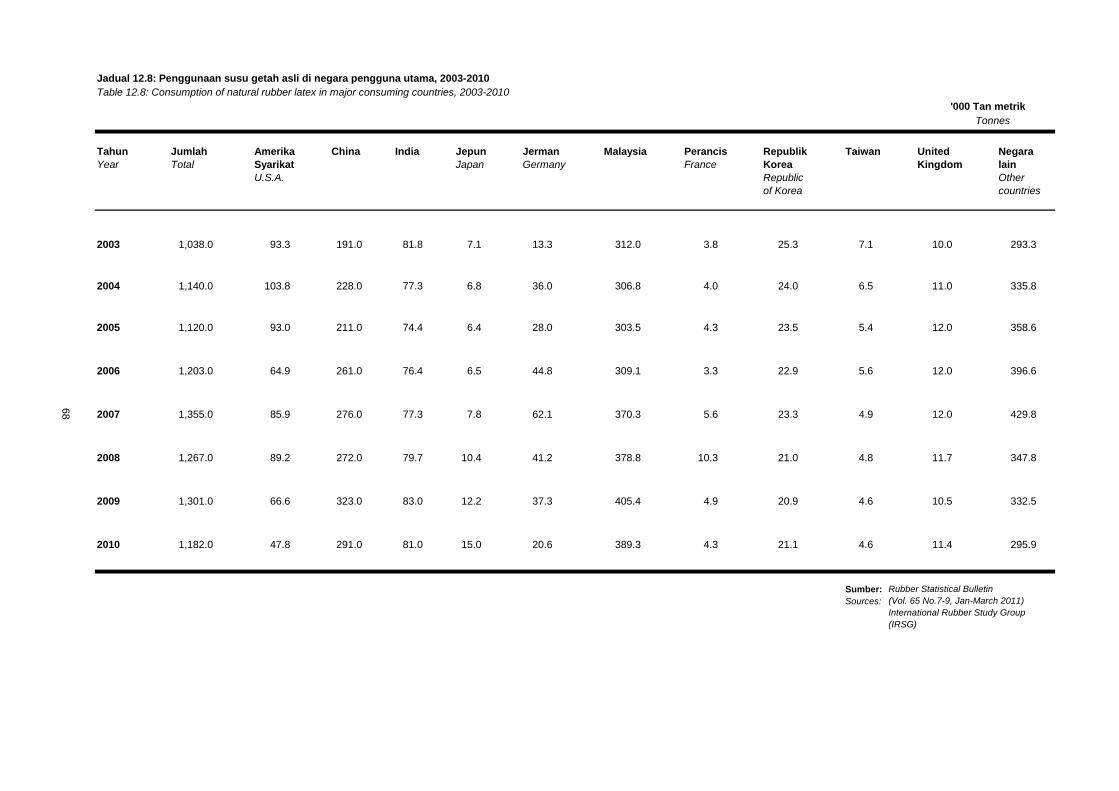
Jadual 12.8: Penggunaan susu getah asli di negara pengguna utama, 2003-2010
Table 12.8: Consumption of natural rubber latex in major consuming countries, 2003-2010
'000 Tan metrik
Tonnes
Tahun Jumlah Amerika China India Jepun Jerman Malaysia Perancis Republik Taiwan United Negara
Year Total Syarikat Japan Germany France Korea Kingdom lain
U.S.A. Republic Other
of Korea countries
2003 1,038.0 93.3 191.0 81.8 7.1 13.3 312.0 3.8 25.3 7.1 10.0 293.3
2004 1,140.0 103.8 228.0 77.3 6.8 36.0 306.8 4.0 24.0 6.5 11.0 335.8
2005 1,120.0 93.0 211.0 74.4 6.4 28.0 303.5 4.3 23.5 5.4 12.0 358.6
2006 1,203.0 64.9 261.0 76.4 6.5 44.8 309.1 3.3 22.9 5.6 12.0 396.6
2007 1,355.0 85.9 276.0 77.3 7.8 62.1 370.3 5.6 23.3 4.9 12.0 429.8
2008 1,267.0 89.2 272.0 79.7 10.4 41.2 378.8 10.3 21.0 4.8 11.7 347.8
2009 1,301.0 66.6 323.0 83.0 12.2 37.3 405.4 4.9 20.9 4.6 10.5 332.5
2010 1,182.0 47.8 291.0 81.0 15.0 20.6 389.3 4.3 21.1 4.6 11.4 295.9
Sumber:
Sources:
68
Rubber Statistical Bulletin
(Vol. 65 No.7-9, Jan-March 2011)
International Rubber Study Group
(IRSG)
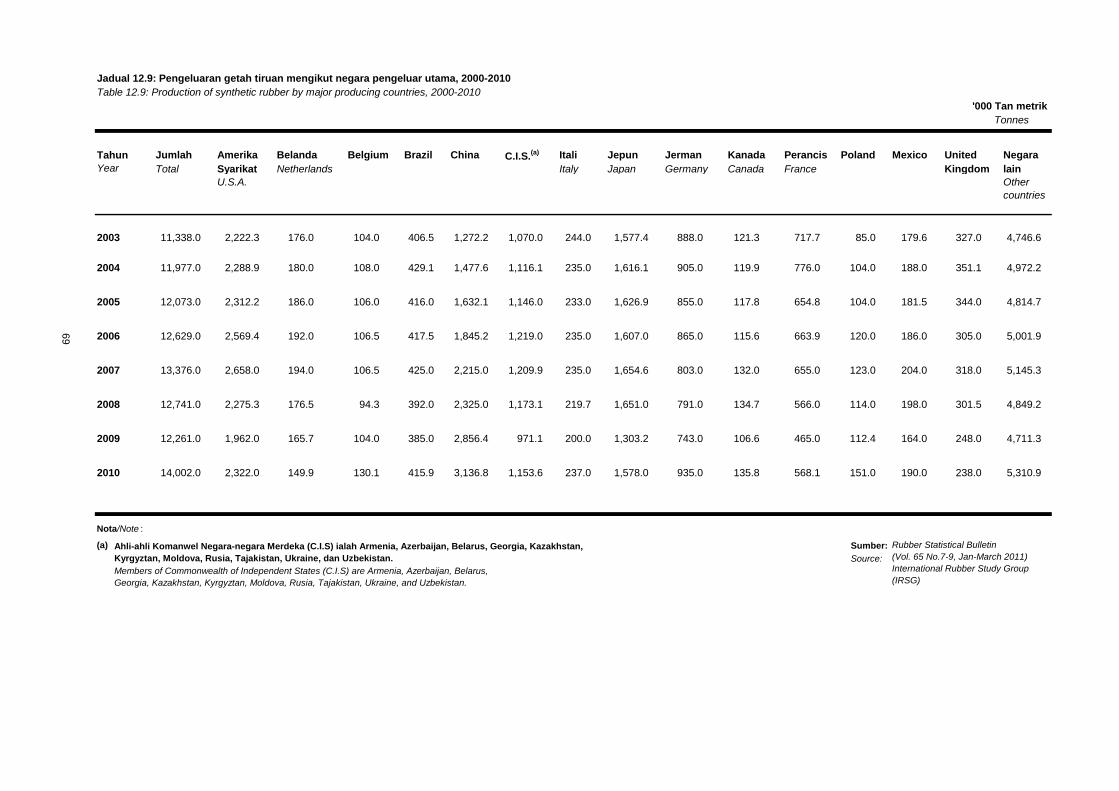
Jadual 12.9: Pengeluaran getah tiruan mengikut negara pengeluar utama, 2000-2010
Table 12.9: Production of synthetic rubber by major producing countries, 2000-2010
'000 Tan metrik
Tonnes
Tahun Jumlah Amerika Belanda Belgium Brazil China C.I.S.(a) Itali Jepun Jerman Kanada Perancis Poland Mexico United Negara
Year Total Syarikat Netherlands Italy Japan Germany Canada France Kingdom lain
U.S.A. Other
countries
11,338.0 2,222.3 176.0 104.0 406.5 1,272.2 1,070.0 244.0 1,577.4 888.0 121.3 717.7 85.0 179.6 327.0 4,746.6
11,977.0 2,288.9 180.0 108.0 429.1 1,477.6 1,116.1 235.0 1,616.1 905.0 119.9 776.0 104.0 188.0 351.1 4,972.2
12,073.0 2,312.2 186.0 106.0 416.0 1,632.1 1,146.0 233.0 1,626.9 855.0 117.8 654.8 104.0 181.5 344.0 4,814.7
12,629.0 2,569.4 192.0 106.5 417.5 1,845.2 1,219.0 235.0 1,607.0 865.0 115.6 663.9 120.0 186.0 305.0 5,001.9
13,376.0 2,658.0 194.0 106.5 425.0 2,215.0 1,209.9 235.0 1,654.6 803.0 132.0 655.0 123.0 204.0 318.0 5,145.3
12,741.0 2,275.3 176.5 94.3 392.0 2,325.0 1,173.1 219.7 1,651.0 791.0 134.7 566.0 114.0 198.0 301.5 4,849.2
12,261.0 1,962.0 165.7 104.0 385.0 2,856.4 971.1 200.0 1,303.2 743.0 106.6 465.0 112.4 164.0 248.0 4,711.3
14,002.0 2,322.0 149.9 130.1 415.9 3,136.8 1,153.6 237.0 1,578.0 935.0 135.8 568.1 151.0 190.0 238.0 5,310.9
Nota/Note :
(a) Sumber:
Source:
Rubber Statistical Bulletin
(Vol. 65 No.7-9, Jan-March 2011)
International Rubber Study Group
(IRSG)
Ahli-ahli Komanwel Negara-negara Merdeka (C.I.S) ialah Armenia, Azerbaijan, Belarus, Georgia, Kazakhstan,
Kyrgyztan, Moldova, Rusia, Tajakistan, Ukraine, dan Uzbekistan.
2010
2009
69
Members of Commonwealth of Independent States (C.I.S) are Armenia, Azerbaijan, Belarus,
Georgia, Kazakhstan, Kyrgyztan, Moldova, Rusia, Tajakistan, Ukraine, and Uzbekistan.
2008
2007
2006
2005
2004
2003
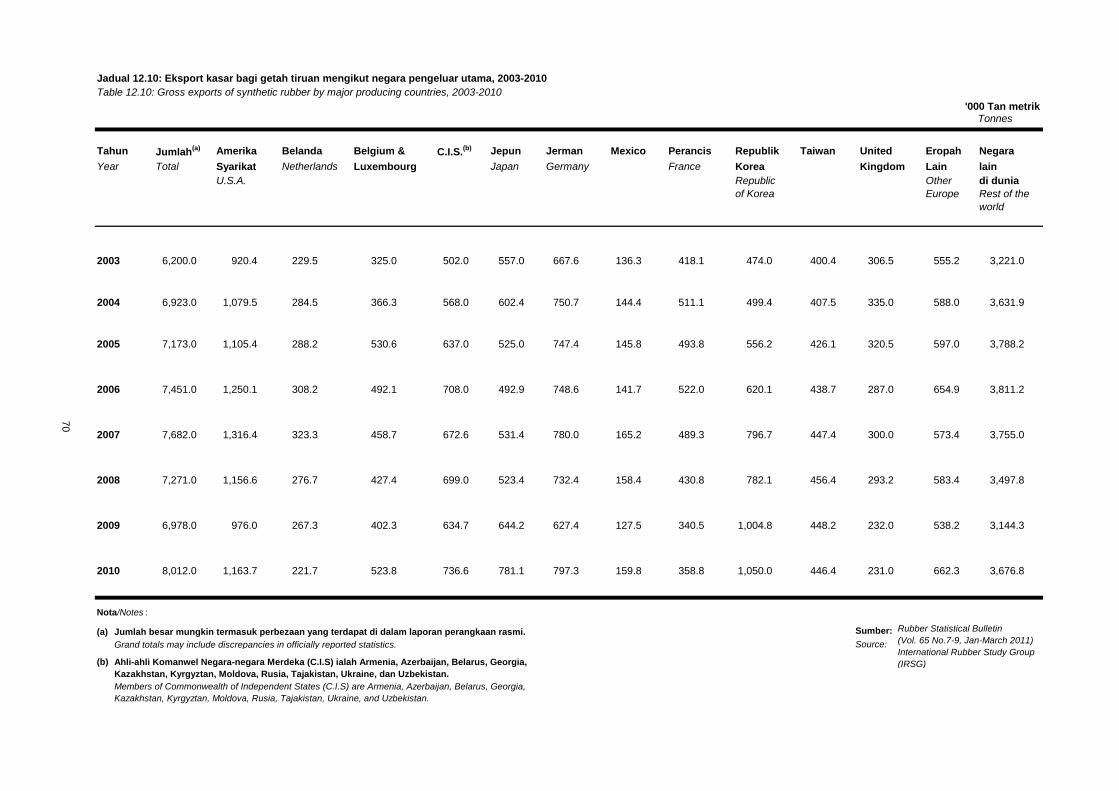
Jadual 12.10: Eksport kasar bagi getah tiruan mengikut negara pengeluar utama, 2003-2010
Table 12.10: Gross exports of synthetic rubber by major producing countries, 2003-2010
'000 Tan metrik
Tahun Jumlah(a) Amerika Belanda Belgium & C.I.S.
(b) Jepun Jerman Mexico Perancis Republik Taiwan United Eropah Negara
Year Total Syarikat Netherlands Luxembourg Japan Germany France Korea Kingdom Lain lain
U.S.A. Republic Other di dunia
of Korea Europe Rest of the
world
6,200.0 920.4 229.5 325.0 502.0 557.0 667.6 136.3 418.1 474.0 400.4 306.5 555.2 3,221.0
6,923.0 1,079.5 284.5 366.3 568.0 602.4 750.7 144.4 511.1 499.4 407.5 335.0 588.0 3,631.9
7,173.0 1,105.4 288.2 530.6 637.0 525.0 747.4 145.8 493.8 556.2 426.1 320.5 597.0 3,788.2
7,451.0 1,250.1 308.2 492.1 708.0 492.9 748.6 141.7 522.0 620.1 438.7 287.0 654.9 3,811.2
7,682.0 1,316.4 323.3 458.7 672.6 531.4 780.0 165.2 489.3 796.7 447.4 300.0 573.4 3,755.0
7,271.0 1,156.6 276.7 427.4 699.0 523.4 732.4 158.4 430.8 782.1 456.4 293.2 583.4 3,497.8
6,978.0 976.0 267.3 402.3 634.7 644.2 627.4 127.5 340.5 1,004.8 448.2 232.0 538.2 3,144.3
8,012.0 1,163.7 221.7 523.8 736.6 781.1 797.3 159.8 358.8 1,050.0 446.4 231.0 662.3 3,676.8
Nota/Notes :
(a) Jumlah besar mungkin termasuk perbezaan yang terdapat di dalam laporan perangkaan rasmi. Sumber:
Grand totals may include discrepancies in officially reported statistics. Source:
(b)
2007
Tonnes
Rubber Statistical Bulletin
(Vol. 65 No.7-9, Jan-March 2011)
International Rubber Study Group
(IRSG)
70
Members of Commonwealth of Independent States (C.I.S) are Armenia, Azerbaijan, Belarus, Georgia,
Kazakhstan, Kyrgyztan, Moldova, Rusia, Tajakistan, Ukraine, and Uzbekistan.
Ahli-ahli Komanwel Negara-negara Merdeka (C.I.S) ialah Armenia, Azerbaijan, Belarus, Georgia,
Kazakhstan, Kyrgyztan, Moldova, Rusia, Tajakistan, Ukraine, dan Uzbekistan.
2010
2009
2003
2008
2006
2005
2004
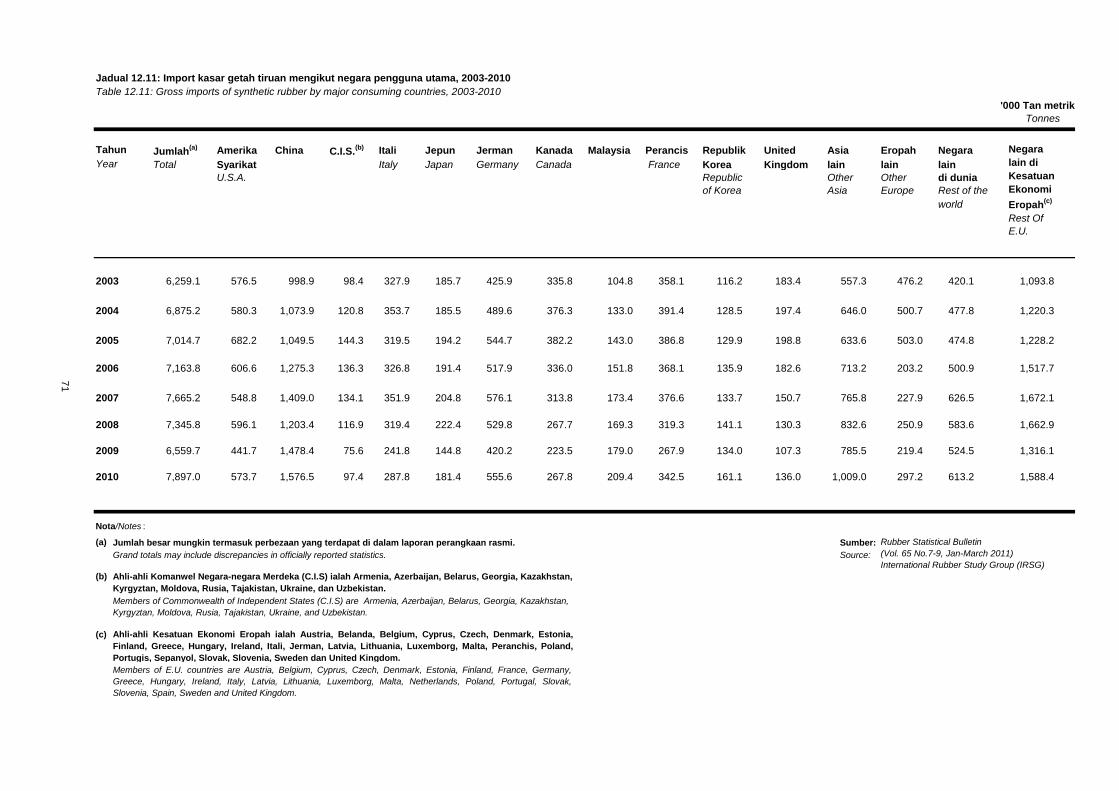
Jadual 12.11: Import kasar getah tiruan mengikut negara pengguna utama, 2003-2010
Table 12.11: Gross imports of synthetic rubber by major consuming countries, 2003-2010
'000 Tan metrik
Tonnes
Jumlah(a) Amerika China C.I.S.
(b) Itali Jepun Jerman Kanada Malaysia Perancis Republik United Asia Eropah Negara
Total Syarikat Italy Japan Germany Canada France Korea Kingdom lain lain lain
U.S.A. Republic Other Other di dunia
of Korea Asia Europe Rest of the
world
Rest Of
E.U.
6,259.1 576.5 998.9 98.4 327.9 185.7 425.9 335.8 104.8 358.1 116.2 183.4 557.3 476.2 420.1 1,093.8
6,875.2 580.3 1,073.9 120.8 353.7 185.5 489.6 376.3 133.0 391.4 128.5 197.4 646.0 500.7 477.8 1,220.3
7,014.7 682.2 1,049.5 144.3 319.5 194.2 544.7 382.2 143.0 386.8 129.9 198.8 633.6 503.0 474.8 1,228.2
7,163.8 606.6 1,275.3 136.3 326.8 191.4 517.9 336.0 151.8 368.1 135.9 182.6 713.2 203.2 500.9 1,517.7
7,665.2 548.8 1,409.0 134.1 351.9 204.8 576.1 313.8 173.4 376.6 133.7 150.7 765.8 227.9 626.5 1,672.1
7,345.8 596.1 1,203.4 116.9 319.4 222.4 529.8 267.7 169.3 319.3 141.1 130.3 832.6 250.9 583.6 1,662.9
6,559.7 441.7 1,478.4 75.6 241.8 144.8 420.2 223.5 179.0 267.9 134.0 107.3 785.5 219.4 524.5 1,316.1
7,897.0 573.7 1,576.5 97.4 287.8 181.4 555.6 267.8 209.4 342.5 161.1 136.0 1,009.0 297.2 613.2 1,588.4
Nota/Notes :
(a) Jumlah besar mungkin termasuk perbezaan yang terdapat di dalam laporan perangkaan rasmi. Sumber:
Grand totals may include discrepancies in officially reported statistics. Source:
(b)
(c)
71
Ahli-ahli Kesatuan Ekonomi Eropah ialah Austria, Belanda, Belgium, Cyprus, Czech, Denmark, Estonia,
Finland, Greece, Hungary, Ireland, Itali, Jerman, Latvia, Lithuania, Luxemborg, Malta, Peranchis, Poland,
Portugis, Sepanyol, Slovak, Slovenia, Sweden dan United Kingdom.
Members of E.U. countries are Austria, Belgium, Cyprus, Czech, Denmark, Estonia, Finland, France, Germany,
Greece, Hungary, Ireland, Italy, Latvia, Lithuania, Luxemborg, Malta, Netherlands, Poland, Portugal, Slovak,
Slovenia, Spain, Sweden and United Kingdom.
Negara
lain di
Kesatuan
Ekonomi
Eropah(c)
2007
2006
2005
2004
2003
Tahun
Year
Rubber Statistical Bulletin
(Vol. 65 No.7-9, Jan-March 2011)
International Rubber Study Group (IRSG)
Members of Commonwealth of Independent States (C.I.S) are Armenia, Azerbaijan, Belarus, Georgia, Kazakhstan,
Kyrgyztan, Moldova, Rusia, Tajakistan, Ukraine, and Uzbekistan.
Ahli-ahli Komanwel Negara-negara Merdeka (C.I.S) ialah Armenia, Azerbaijan, Belarus, Georgia, Kazakhstan,
Kyrgyztan, Moldova, Rusia, Tajakistan, Ukraine, dan Uzbekistan.
2010
2009
2008
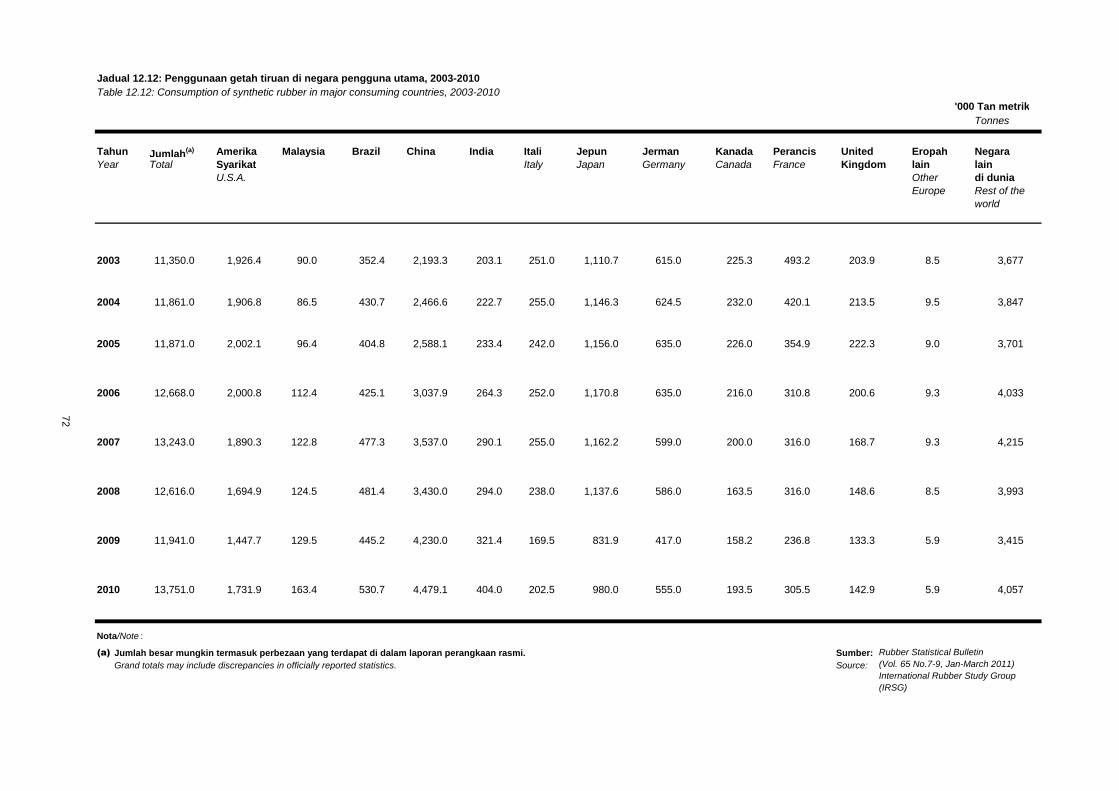
Jadual 12.12: Penggunaan getah tiruan di negara pengguna utama, 2003-2010
Table 12.12: Consumption of synthetic rubber in major consuming countries, 2003-2010
Tonnes
Tahun Jumlah(a) Amerika Malaysia Brazil China India Itali Jepun Jerman Kanada Perancis United Eropah Negara
Year Total Syarikat Italy Japan Germany Canada France Kingdom lain lain
U.S.A. Other di dunia
Europe Rest of the
world
11,350.0 1,926.4 90.0 352.4 2,193.3 203.1 251.0 1,110.7 615.0 225.3 493.2 203.9 8.5 3,677
11,861.0 1,906.8 86.5 430.7 2,466.6 222.7 255.0 1,146.3 624.5 232.0 420.1 213.5 9.5 3,847
11,871.0 2,002.1 96.4 404.8 2,588.1 233.4 242.0 1,156.0 635.0 226.0 354.9 222.3 9.0 3,701
12,668.0 2,000.8 112.4 425.1 3,037.9 264.3 252.0 1,170.8 635.0 216.0 310.8 200.6 9.3 4,033
13,243.0 1,890.3 122.8 477.3 3,537.0 290.1 255.0 1,162.2 599.0 200.0 316.0 168.7 9.3 4,215
12,616.0 1,694.9 124.5 481.4 3,430.0 294.0 238.0 1,137.6 586.0 163.5 316.0 148.6 8.5 3,993
11,941.0 1,447.7 129.5 445.2 4,230.0 321.4 169.5 831.9 417.0 158.2 236.8 133.3 5.9 3,415
13,751.0 1,731.9 163.4 530.7 4,479.1 404.0 202.5 980.0 555.0 193.5 305.5 142.9 5.9 4,057
Nota/Note :
(a) Jumlah besar mungkin termasuk perbezaan yang terdapat di dalam laporan perangkaan rasmi. Sumber:
Grand totals may include discrepancies in officially reported statistics. Source:
2007
2006
2005
2004
2003
'000 Tan metrik
72
Rubber Statistical Bulletin
(Vol. 65 No.7-9, Jan-March 2011)
International Rubber Study Group
(IRSG)
2010
2009
2008
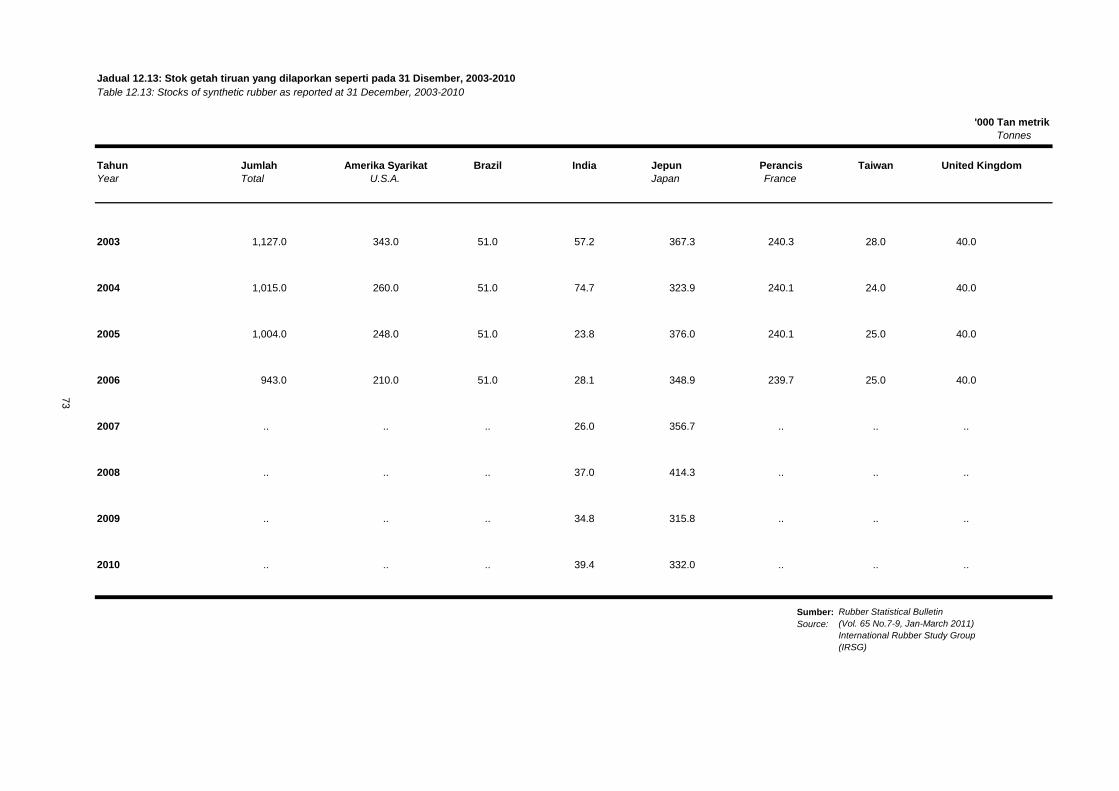
Jadual 12.13: Stok getah tiruan yang dilaporkan seperti pada 31 Disember, 2003-2010
Table 12.13: Stocks of synthetic rubber as reported at 31 December, 2003-2010
'000 Tan metrik
Tonnes
Tahun Jumlah Amerika Syarikat Brazil India Jepun Perancis Taiwan
Year Total U.S.A. Japan France
2003 1,127.0 343.0 51.0 57.2 367.3 240.3 28.0 40.0
2004 1,015.0 260.0 51.0 74.7 323.9 240.1 24.0 40.0
2005 1,004.0 248.0 51.0 23.8 376.0 240.1 25.0 40.0
2006 943.0 210.0 51.0 28.1 348.9 239.7 25.0 40.0
2007 .. .. .. 26.0 356.7 .. .. ..
2008 .. .. .. 37.0 414.3 .. .. ..
2009 .. .. .. 34.8 315.8 .. .. ..
2010 .. .. .. 39.4 332.0 .. .. ..
Sumber:
Source:
73
United Kingdom
Rubber Statistical Bulletin
(Vol. 65 No.7-9, Jan-March 2011)
International Rubber Study Group
(IRSG)

NOTA TEKNIKALTECHNICAL NOTES
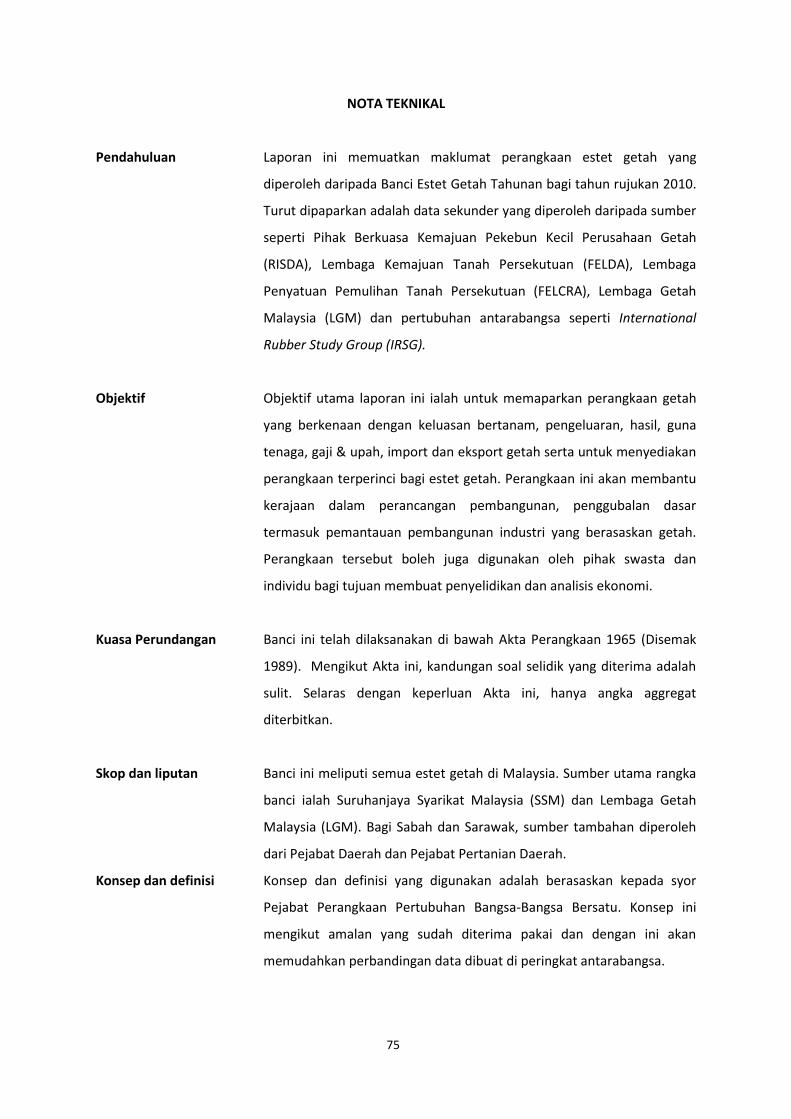
75
NOTA TEKNIKAL
Pendahuluan Laporan ini memuatkan maklumat perangkaan estet getah yang
diperoleh daripada Banci Estet Getah Tahunan bagi tahun rujukan 2010.
Turut dipaparkan adalah data sekunder yang diperoleh daripada sumber
seperti Pihak Berkuasa Kemajuan Pekebun Kecil Perusahaan Getah
(RISDA), Lembaga Kemajuan Tanah Persekutuan (FELDA), Lembaga
Penyatuan Pemulihan Tanah Persekutuan (FELCRA), Lembaga Getah
Malaysia (LGM) dan pertubuhan antarabangsa seperti International
Rubber Study Group (IRSG).
Objektif Objektif utama laporan ini ialah untuk memaparkan perangkaan getah
yang berkenaan dengan keluasan bertanam, pengeluaran, hasil, guna
tenaga, gaji & upah, import dan eksport getah serta untuk menyediakan
perangkaan terperinci bagi estet getah. Perangkaan ini akan membantu
kerajaan dalam perancangan pembangunan, penggubalan dasar
termasuk pemantauan pembangunan industri yang berasaskan getah.
Perangkaan tersebut boleh juga digunakan oleh pihak swasta dan
individu bagi tujuan membuat penyelidikan dan analisis ekonomi.
Kuasa Perundangan Banci ini telah dilaksanakan di bawah Akta Perangkaan 1965 (Disemak
1989). Mengikut Akta ini, kandungan soal selidik yang diterima adalah
sulit. Selaras dengan keperluan Akta ini, hanya angka aggregat
diterbitkan.
Skop dan liputan Banci ini meliputi semua estet getah di Malaysia. Sumber utama rangka
banci ialah Suruhanjaya Syarikat Malaysia (SSM) dan Lembaga Getah
Malaysia (LGM). Bagi Sabah dan Sarawak, sumber tambahan diperoleh
dari Pejabat Daerah dan Pejabat Pertanian Daerah.
Konsep dan definisi Konsep dan definisi yang digunakan adalah berasaskan kepada syor
Pejabat Perangkaan Pertubuhan Bangsa-Bangsa Bersatu. Konsep ini
mengikut amalan yang sudah diterima pakai dan dengan ini akan
memudahkan perbandingan data dibuat di peringkat antarabangsa.
76
i. Estet getah ditakrifkan sebagai:
a. semua kawasan, bersambungan atau berpecah-pecah dengan
keluasan tidak kurang daripada 40.47 hektar (100 ekar), ditanam
dengan getah atau di mana penanaman getah dibenarkan dan di
bawah satu hak milik yang sah; atau
b. mana-mana keluasan tanaman getah yang telah pun wujud
dalam estet kelapa, koko atau kelapa sawit.
ii. Kebun kecil getah ditakrifkan sebagai yang meliputi semua kawasan,
bersambungan atau berpecah-pecah, berjumlah kurang daripada
40.47 hektar (100 ekar), ditanam dengan getah atau di mana
penanaman getah dibenarkan dan di bawah satu hak milik yang sah.
Kebun kecil getah terdiri daripada tersusun dan tidak tersusun.
Kebun kecil yang tersusun meliputi kawasan di bawah rancangan
kerajaan seperti berikut :-
a. Lembaga Kemajuan Tanah Persekutuan (FELDA);
b. Pihak Berkuasa Kemajuan Pekebun Kecil Perusahaan Getah
(RISDA);
c. Lembaga Penyatuan dan Pemulihan Tanah Negara (FELCRA);
d. Rancangan tanah Kerajaan Persekutuan yang lain; dan
e. Rancangan tanah Kerajaan Negeri.
Tahun rujukan Tahun rujukan bagi Banci ini adalah tahun takwim 2009. Walau
bagaimanapun bagi estet yang tahun kewangannya berbeza dengan
tahun takwim, iaitu kurang daripada enam bulan, angka tahun
kewangan diterima pakai sebagai mewakili tahun takwim.
Metodologi Banci dilaksanakan secara mel dengan menggunakan borang soal selidik.
Responden diberi tempoh satu bulan untuk melengkapkan dan
mengembalikan borang soal selidik tersebut kepada Jabatan ini. Selepas
itu, kerja luar dijalankan bagi mendapatkan borang lengkap daripada
pertubuhan yang tidak memberi jawapan.
77
Taraf sah Taraf sah sesebuah pertubuhan ditakrifkan seperti berikut:-
i. Hak milik perseorangan merujuk kepada perniagaan yang dimiliki
oleh orang perseorangan semata-mata untuk mendapatkan
keuntungan. Pemilik mempunyai hak mutlak untuk mengendalikan
urusan pertubuhannya.
ii. Perkongsian merujuk kepada sekumpulan individu yang bersetuju
untuk mengkontrak dan menjalankan perniagaan dengan matlamat
untuk mendapat keuntungan. Perniagaan tersebut diuruskan oleh
mereka atau salah seorang daripada mereka yang bertindak
mewakili semua pihak. Perkongsian perniagaan ini hendaklah
mengandungi sekurang-kurangnya dua orang dan tidak melebihi had
maksima dua puluh orang.
iii. Syarikat Sendirian Berhad merupakan sebuah perbadanan swasta
yang ditubuhkan untuk menjalankan perniagaan dengan matlamat
mencari keuntungan. Sahamnya dipegang secara tertutup oleh
pemegang-pemegang saham yang mempunyai kawalan terhadap
operasi syarikat. Ia didaftarkan dengan tanggungan berhad.
Sesebuah syarikat sendirian berhad mempunyai Memorandum dan
Artikel Persatuan sendiri, yang antara lain:
a. menghadkan hak untuk memindahkan sahamnya;
b. menghadkan bilangan pemegang sahamnya di antara dua
hingga lima puluh orang (tidak termasuk pekerja syarikat itu dan
bekas pekerja yang masih menjadi ahli);
c. melarang sebarang pelawaan kepada orang ramai untuk
membeli apa-apa saham atau debentur syarikat itu; dan
d. melarang sebarang pelawaan kepada orang ramai supaya
menyimpan wang di syarikat itu bagi sesuatu tempoh yang
ditetapkan ataupun untuk dibayar bila dituntut, sama ada
dengan mendapat faedah atau tidak.
iv. Syarikat Awam Berhad juga merupakan sebuah perbadanan swasta
yang ditubuhkan, dengan tanggungan berhad, oleh sekurang-
kurangnya dua orang untuk menjalankan perniagaan dengan tujuan
78
mencari keuntungan. Saham syarikat awam berhad ini dipegang
secara terbuka dan bagi sesebuah syarikat yang disenaraikan di
Bursa Saham, sahamnya boleh bertukar milik secara bebas. Syarikat
tersebut dianggap sebagai entiti yang sah dan ditubuhkan mengikut
Memorandum dan Artikel Persatuan.
v. Koperasi merujuk kepada sesebuah persatuan sukarela yang
bilangan ahlinya tidak terhad dan didaftarkan di bawah Akta
Koperasi 1993. Kumpulan wang yang ada ialah milik bersama untuk
memenuhi keperluan ahli-ahlinya.
vi. Perbadanan awam merujuk kepada sebuah perbadanan yang
ditubuhkan di bawah Akta Parlimen atau Dewan Perundangan
Negeri.
vii. Pertubuhan persendirian tidak mencari keuntungan merujuk
kepada syarikat tanpa saham yang ditubuhkan dengan tanggungan
berhad. Kebanyakan syarikat ini terdiri daripada pertubuhan
kebajikan, keagamaan, pendidikan, kesihatan, kebudayaan, rekreasi
dan pertubuhan lain yang memberikan perkhidmatan sosial dan
kemasyarakatan kepada isi rumah. Perkhidmatan diberikan secara
percuma atau pada harga yang tidak melebihi kos perkhidmatan.
Sebarang keuntungan yang diperoleh dilabur semula ke dalam
pertubuhan berkenaan.
viii. Lain-Lain merujuk kepada semua pertubuhan lain yang tidak
termasuk dalam mana-mana kategori yang tersebut di atas.
Hak milik Hak milik sesebuah estet dikelaskan mengikut taraf pemastautin
pemilik/pemilik-pemilik modal berbayar terbesar (melebihi 50%) dan
bukannya mengikut taraf kewarganegaraan mereka. Dalam kes di mana
setiap pihak (Pemastautin Malaysia dan bukan pemastautin Malaysia)
memegang bilangan saham yang sama dalam perniagaan berkenaan
maka pertubuhan tersebut dikelaskan di bawah ‘Hak milik bersama’.
79
Pemastautin Malaysia ditakrifkan sebagai orang, syarikat atau institusi
yang tinggal atau terletak di dalam Malaysia tidak kurang daripada 1
tahun. Bukan pemastautin Malaysia pula ialah orang, syarikat atau
institusi yang tinggal atau terletak di luar Malaysia kurang daripada 1
tahun.
Keluasan bertanam Keluasan bertanam dengan getah (matang dan/atau belum matang) dan
tidak terbiar selama-lamanya.
Keluasan matang Keluasan getah yang telah ditoreh atau yang dianggap sebagai sudah
boleh ditoreh oleh pemilik estet atau individu yang mengemukakan soal
selidik.
Keluasan belum Keluasan getah yang dianggap belum boleh ditoreh oleh pemilik estet
atau individu yang mengemukakan soal selidik.
Keluasan tanam baru Ia merujuk kepada getah yang ditanam di atas tanah yang dahulunya
tidak ditanam dengan getah.
Keluasan tanam Ia merujuk kepada getah yang ditanam semula di atas tanah yang
dahulunya ditanam dengan getah.
Purata keluasan Ia adalah purata keluasan di bawah getah matang yang telah ditoreh
termasuk kawasan yang "direhatkan" di bawah sistem giliran torehan.
Pengeluaran Pengeluaran getah asli merujuk kepada kandungan getah kering (KGK)
bagi susu getah cair, getah keping dan skrap (getah buku dan getah kulit)
yang dihasilkan oleh estet dan pekebun kecil.
Hasil Hasil diperoleh dengan membahagikan jumlah pengeluaran untuk tahun
berkenaan dengan purata luas hektar yang ditoreh sepanjang tahun.
Import dan eksport Data import dan eksport dikumpul oleh Jabatan daripada borang
pengikraran import dan eksport yang diperoleh daripada Jabatan
Kastam Diraja Malaysia dan Lembaga-Lembaga Zon Bebas. Angka
semula
matang
ditoreh
80
perdagangan luar negeri Malaysia tidak termasuk perdagangan antara
kawasan iaitu antara Semenanjung Malaysia, Sabah dan Sarawak.
i. Import adalah sesuatu barang yang dibawa masuk ke dalam negara,
sama ada secara terus atau disimpan di gudang-gudang yang
dikawal. Barang-barang tersebut adalah sama ada untuk kegunaan
sendiri, diproses, digunakan dalam perkilangan ataupun untuk
dieksport semula ke negara lain. Pengkelasan import ini diistilahkan
juga sebagai ‘import umum’. Di dalam laporan ini, import dikelaskan
mengikut negara asal barang tersebut, iaitu negara di mana barang
berkenaan terakhir dibuat sebelum ianya diimportkan ke dalam
kawasan pendaftaran.
ii. Eksport adalah sesuatu barang (keluaran atau buatan tempatan
atau diimport untuk dieksport semula) yang dibawa keluar dari
negara. Di dalam laporan ini, eksport dikelaskan mengikut negara
dituju, iaitu negara di mana barang-barang berkenaan dijangka akan
digunakan, sejauh mana ia boleh ditentukan pada masa ianya
dieksport. Bagi barang yang dihantar berdasarkan "Optional bill of
lading”, pelabuhan pertama yang diikrarkan dianggap sebagai
negara yang dituju. Sekiranya maklumat negara yang dituju bagi
barang-barang yang dieksport melalui Singapura tidak
diketahui/diperoleh, eksport sedemikian diambilkira sebagai eksport
ke Singapura, iaitu di bawah kategori yang sama seperti barang-
barang yang digunakan di Singapura. Eksport termasuk eksport
semula. Pengkelasan eksport ini diistilahkan juga sebagai ‘eksport
umum’.
Penggunaan domestik Ia merujuk kepada penggunaan domestik getah asli seperti susu getah
pekat, Getah Mutu Malaysia (G.M.M.), Getah Asap Berbunga (G.A.B.)
dan sebagainya oleh pertubuhan pembuatan di Malaysia untuk
mengeluarkan barangan seperti tayar dan tiub, kasut getah, sarung
tangan getah, benang getah, getah campuran dan lain-lain.
81
Stok Ia adalah stok getah yang dimiliki oleh sesebuah pertubuhan tidak kira di
mana stok tersebut ditempatkan iaitu sama ada di dalam atau di luar
kilang. Ia termasuk stok getah yang belum/sedang/telah diproses.
Harga Data harga getah diperoleh daripada sumber-sumber berikut:-
i. Lembaga Getah Malaysia (LGM)
Purata harga pembeli waktu tengahari untuk getah “F.O.B.” di Kuala
Lumpur.
ii. Kumpulan Kajian Getah Antarabangsa (IRSG)
Harga pembeli untuk London dan harga yang diminta oleh penjual
bagi penghantaran sepanjang bulan semasa untuk New York.
Harga purata Harga purata dikira dengan mencampurkan harga getah harian dan
membahagikan jumlah harga tersebut dengan bilangan hari berniaga
dalam sesuatu bulan/tahun.
Perangkaan dunia Selain daripada data getah Malaysia, data yang dipersembahkan juga
meliputi (getah asli dan tiruan) perangkaan getah dunia yang
diperoleh dari “Rubber Statistical Bulletin" yang diterbitkan oleh
International Rubber Study Group (IRSG).
Guna tenaga Jumlah orang yang diambil bekerja dalam sesebuah estet getah
ditakrifkan sebagai jumlah bilangan orang yang diambil bekerja dalam
bulan Disember atau dalam tempoh pembayaran gaji terakhir bagi satu-
satu tahun rujukan. Bilangan orang yang bekerja termasuk semua
pemilik yang bekerja dan rakan niaga yang aktif, pekerja keluarga tidak
bergaji dan pekerja bergaji seperti yang ditakrifkan di para berikut.
Turut termasuk adalah pekerja sambilan yang terdapat di dalam daftar
gaji dan pekerja yang mogok, berpiket dan bercuti jangka pendek (cuti
sakit, cuti rehat atau cuti kecemasan). Mereka yang tidak diambilkira
ialah mereka yang dalam cuti berpanjangan.
82
i. Pemilik yang bekerja dan rakan niaga yang aktif merujuk kepada
semua pemilik perseorangan dan rakan niaga, sambilan atau
sepenuh masa, yang bekerja dengan aktif dalam pertubuhan
tersebut. Justeru itu, ia tidak termasuk rakan niaga yang tidak aktif.
ii. Pekerja keluarga tidak bergaji merujuk kepada semua ahli isi rumah
pemilik pertubuhan yang melaksanakan kerja tertentu (sepenuh
masa atau sambilan) dan bekerja sekurang-kurangnya satu pertiga
daripada waktu bekerja biasa tanpa mendapat bayaran secara tetap,
sama ada dalam bentuk wang tunai atau mata benda bagi kerja yang
dilakukan. Biasanya pekerja berkenaan mendapat makanan, tempat
tinggal dan bantuan lain sebagai sebahagian daripada ahli isi rumah
pemilik tersebut dan terus menikmatinya sama ada ia bekerja atau
tidak di estet berkenaan.
iii. Pekerja bergaji sepenuh masa ditakrifkan sebagai semua pekerja
bergaji yang bekerja sekurang-kurangnya 6 jam sehari dan sekurang-
kurangnya 20 hari sebulan.
iv. Pekerja bergaji sambilan ditakrifkan sebagai semua pekerja bergaji
yang bekerja kurang daripada 6 jam sehari dan/atau kurang
daripada 20 hari sebulan.
Gaji & upah yang Ia merujuk kepada emolumen kasar yang dibayar kepada pekerja
sepanjang tahun rujukan termasuk gaji, upah, bonus, komisen, bayaran
lebih masa, bayaran pampas an dan elaun lain sebelum ditolak
sumbangan pekerja kepada Kumpulan Wang Simpanan Pekerja (KWSP),
Pertubuhan Keselamatan Sosial (PERKESO) atau sumbangan lain. Tidak
termasuk elaun kepada pemilik yang bekerja, rakan niaga yang aktif dan
pekerja keluarga tidak bergaji.
Harta Harta meliputi semua barangan, baru atau terpakai yang
mempunyai hayat produktif lebih daripada setahun (seperti tanah,
bangunan, jentera dan alat kelengkapan, termasuk kelengkapan
pengangkutan). Nilai yang dilaporkan adalah nilai seperti pada
dibayar
83
penghujung tahun dan ia mengikut buku akaun unit yang melapor. Ia
termasuk perolehan baru sepanjang tahun berkenaan tetapi tidak
termasuk harta yang dilupuskan pada tahun tersebut. Ianya adalah nilai
bersih setelah ditolak susut nilai.
Pembundaran Jumlah bagi komponen-komponen mungkin berbeza dengan jumlah
besar di dalam jadual-jadual penerbitan disebabkan oleh pembundaran
angka.
Unit Pengukuran a. Timbangan
1 tonne = 1,000 kilogram (0.98421 tan)
1 kilogram = 2.20462 paun
b. Keluasan
1 hektar = 2.4711 ekar
1 ekar = 0.404678 hektar
Simbol Simbol berikut telah digunakan dalam penerbitan ini :-
RM = Ringgit Malaysia
Kg = Kilogram
r = Disemak
- = tiada
.. = tidak diperoleh
* = Kurang daripada 50 tan metrik
84
TECHNICAL NOTES
Introduction This report provides information on rubber estates canvassed from the
Annual Census of Rubber Estates for reference year 2010. It also contains
secondary data obtained from sources such as the, Malaysian Rubber
Board (MRB), Rubber Industry Smallholders Development Authority
(RISDA), Federal Land Development Authority (FELDA), Federal Land
Consolidation and Rehabilitation Authority (FELCRA) and International
agencies such as the International Rubber Study Group (IRSG).
Objective The main objective of this report is to provide statistics on rubber with
regards to hectareage planted, production, yield, employment, salaries
& wages, imports and exports of rubber as well as detailed statistics on
rubber estates. These statistics will assist the government in
development planning, formulation of policies as well as monitor the
development of rubber based industries. The data can also be used by
the private sector and individuals for research and economic analysis.
Legal authority The census was conducted under the Statistics Act 1965 (Revised 1989).
Under the Act, the contents of individual returns will be kept
confidential. In conformity with the requirements of this Act, only
aggregated figures are published.
Scope and coverage The census covered all rubber estates in Malaysia. The main sources of
the census frame were the Companies Commission of Malaysia (CCM)
and the Malaysian Rubber Board (MRB). For Sabah and Sarawak,
additional information was obtained from District Offices and District
Agriculture Offices.
Concepts and Concepts and definitions used are based on the recommendations of the
Statistical Office of the United Nations, thereby facilitating international
comparability of data.
i. A rubber estate is defined as:
a. all areas, contiguous or non-contiguous, aggregating not less
definitions
85
than 40.47 hectares (100 acres), planted with rubber or on which
the planting of rubber is permitted and is under a single legal
ownership; or
b. any area planted with rubber in a coconut, cocoa or oil palm
estate.
ii. A rubber smallholding is defined as all areas, contiguous or non-
contiguous, aggregating less than 40.47 hectares (100 acres),
planted with rubber or on which the planting of rubber is permitted
and is under a single legal ownership. Smallholdings can be
organized or unorganized. Organized smallholdings include those
under various government schemes such as follows :-
a. Federal Land Development Authority (FELDA);
b. Rubber Industry Smallholders Development Authority (RISDA);
c. Federal Land Consolidation and Rehabilitation Authority
(FELCRA);
d. Other Federal Government land schemes; and
e. State Government land schemes.
Reference year The reference period for the survey is the calendar year 2009. However,
for establishments whose accounting year differed by less than six
months from the calendar year, the accounting or financial figures were
accepted as representative of the data for the calendar year.
Methodology The census was primarily conducted by mail inquiry using a
questionnaire. Respondents were given one month to complete and
return the questionnaire to the Department, after which field
enumeration was undertaken to obtain completed reports from the non-
response establishments.
Legal status The legal status of an establishment has been defined as follows:
i. Individual proprietorship refers to a business, owned and operated
by one person for his own profit. The owner has the exclusive right to
control the operations of the establishment.
86
ii. Partnership refers to a group of individuals who agree to contract
and to carry on a business with the objective of making a profit. The
business is managed by all or any one acting for all parties. A trading
partnership must comprise at least two members and should not
exceed a maximum of twenty members.
iii. Private Limited Company is a private corporation established to
undertake a business with the objective of making a profit. The
shares are closely held by shareholders of the corporation who has
control over its operation. It is registered with limited liability.
A private limited company has its Memorandum and Articles of
Association, which among others:
a. restricts the right to transfer its shares;
b. limits the number of its shareholders between two to fifty (not
including employees of the company and past employees who
are currently members);
c. prohibits any invitation to the public to subscribe for any share
or debenture of the company; and
d. prohibits any invitation to the public to deposit money with the
company for fixed periods or payable at call with or without
interest.
iv. Public Limited Company is also a private corporation established,
with limited liability, by a minimum of two persons to operate the
business with the objective of making a profit. The shares in a public
limited company are openly held and in the case of a company listed
on the Stock Exchange, the shares are freely transferable. The
company is regarded as a legal entity and is constituted by the
Memorandum and Articles of Association.
v. Co-operative refers to a voluntary association with an unrestricted
number of members and registered under the Co-operatives Act
1993. Funds are collectively owned to meet the needs of the
members.
87
vi. Public corporation refers to a corporation set up under a special Act
of Parliament or by the State Legislature.
vii. Private non-profit making organisation is a non-stock company set
up with limited liability. It comprises mainly welfare, religious,
educational, health, cultural, recreational and other organisations
providing social and community services to households. These
services are provided free of charge or at prices, which do not
necessarily or fully cover the cost of providing such services. Any
profit made is re-invested in the organization.
viii. Others refer to all other establishments, which do not fall under any
of the categories mentioned above.
Ownership The ownership of an estate is classified by the residential status of the
owner(s) of the majority (more than 50%) of the paid-up capital and not
by their citizenship status. In instances where each party (Malaysian
residents and non-Malaysian residents) held equal shares in the
business, the establishments were classified under ‘Joint ownership’.
A Malaysian resident is defined as a person, a company or an institution
that lives or is located in Malaysia for a period not less than a year. A
non-Malaysian resident is a person, a company or an institution that
lives or is located outside Malaysia for a period less than a year.
Planted area The area planted with rubber (mature and/or immature) and which has
not been abandoned permanently.
Matured area The area of rubber which is either being tapped or which is considered
tappable by the estate owner or individual submitting the return.
Immatured area The rubber area which is considered by the estate owner or individual
submitting the return to be not yet tappable.
88
Newly planted area This refers to rubber planted on land previously not planted with rubber.
Replanted area This refers to rubber replanted on land previously planted with rubber.
Average tapped area This is the average area under mature rubber that has been tapped
including areas "rested" under rotational systems.
Production Production of natural rubber refers to the dry rubber content (DRC) of
field latex, rubber sheets and scrap (lump and bark) produced by estates
and smallholders.
Yield The yield is derived by dividing the total production for the year by the
average hectareage tapped during the year.
Imports and exports The data on imports and exports are compiled by the Department of
Statistics from declaration forms sourced from the Malaysian Royal
Customs Department and Free Zone Authorities. External trade data for
Malaysia do not include inter-regional trade between Peninsular
Malaysia, Sabah dan Sarawak.
i. Imports are goods brought into the country either directly or into
bonded warehouses, whether or not such goods are for
consumption, to be processed, used in manufacturing or for
subsequent re-export to other countries. This categorisation of
imports is also termed as ‘general imports’. In this report, imports
are classified according to the country of origin of the goods, that is,
the country where the goods are given the final form before they are
imported into the registration area.
ii. Exports are goods (locally produced or manufactured or imported for
subsequent re-exports) taken out of the country. In this report,
exports are classified according to the country of destination, that is,
the country where it is expected that the goods will be consumed
insofar as this can be ascertained at the time of export. In the case
of goods shipped on an "Optional bill of lading", the country of
89
destination refers to that of the first port declared. If the information
regarding the country of destination of goods exported via Singapore
is not known/available, such exports are included under the value of
exports to Singapore, that is, under the same category as goods
consumed in Singapore. Exports include re-exports. This
categorisation of exports is also termed as ‘general exports’.
Domestic consumption This refers to the usage of natural rubber such as latex concentrate,
Standard Malaysian Rubber (S.M.R.), Ribbed Smoked Sheet (R.S.S.), etc.
by manufacturing establishments in Malaysia to produce products such
as tyres and tubes, rubber footwear, rubber gloves, rubber threads and
others.
Stocks This refers to stocks of rubber owned by establishments regardless
where it is located i.e. inside or outside the factory. They include stocks
of unprocessed/in process/ processed rubber.
Prices Data on prices are obtained from the following sources:
i. Malaysian Rubber Board (MRB)
Average buyers' mid-day prices for rubber “F.O.B.” in Kuala Lumpur.
ii. International Rubber Study Group (IRSG)
Buyers' prices for London and sellers' asking prices for delivery
during the current month for New York.
Average price The average price is derived by adding the daily rubber prices and
dividing the total prices by number of trading days during a reference
month/year.
World statistics Other than data for Malaysia, the data presented in this report also
include rubber statistics of the world which was obtained from the
“Rubber Statistical Bulletin” published by the International Rubber
Study Group (IRSG).
(natural and
synthetic rubber)
90
Employment Employment in an establishment is defined as the total number of
persons employed during December or the last pay period of the
reference year. The number of persons engaged include all working
proprietors and active business partners, unpaid family workers and
employees as defined in paragraphs i. to iv. Included are part-time
workers in the payroll and persons on strike, picket and short-term leave
(sick, vacation or emergency leave) excluding workers on indefinite
leave.
i. Working proprietors and active business partners refer to all
individual proprietors and partners, part-time or full-time, who are
actively engaged in the work of the establishment. It therefore
excludes silent and inactive partners.
ii. Unpaid family workers is defined as all persons (full-time or part-
time) of the household of any of the owners of the establishment
who perform a specified job and work for a minimum of one third of
the normal working time of the establishment, but do not receive
regular payment either in cash or in kind for the work done. Such
workers generally receive food, shelter and other support as part of
the household of an owner but these provisions would continue
whether they worked in the establishment or not.
iii. Full-time employees is defined as all paid workers who work for at
least 6 hours a day and for at least 20 days a month.
iv. Part-time employees include all paid workers who work for less than
6 hours a day and/or less than 20 days a month.
Salaries & wages paid This refers to gross emoluments paid to employees during the reference
year, inclusive of salaries, wages, bonuses, commission, overtime pay,
dismissal pay and other allowances before deduction of employees’
contribution to Employees Provident Fund (EPF) Social Security Schemes
(SOCSO) or any other deduction. Allowances to working proprietors,
working partners and unpaid family workers are not included.
91
Assets Assets cover all goods, new or used, that have a normal economic life of
more than one year (e.g. land, building, machinery and equipment,
including transport equipment). The value reported is as at the end of
the year and is according to the books of accounts of the reporting unit.
It includes additions during the year and excludes assets disposed off
during the year. It is net of depreciation.
Rounding The sum of the components may not add up to the totals in the tables
presented in this publication due to rounding.
Units of measurement a. Weight
1 tonne = 1,000 kilogrammes (0.98421 ton)
1 kilogramme = 2.20462 pounds
b. Area
1 hectare = 2.4711 acres
1 acre = 0.404678 hectare
Symbols The following symbols have been used in this publication:-
RM = Ringgit Malaysia
Kg = Kilogramme
r = Revised
- = Nil
.. = Not available
* = Less than 50 tonne
LAMPIRANAPPENDIX
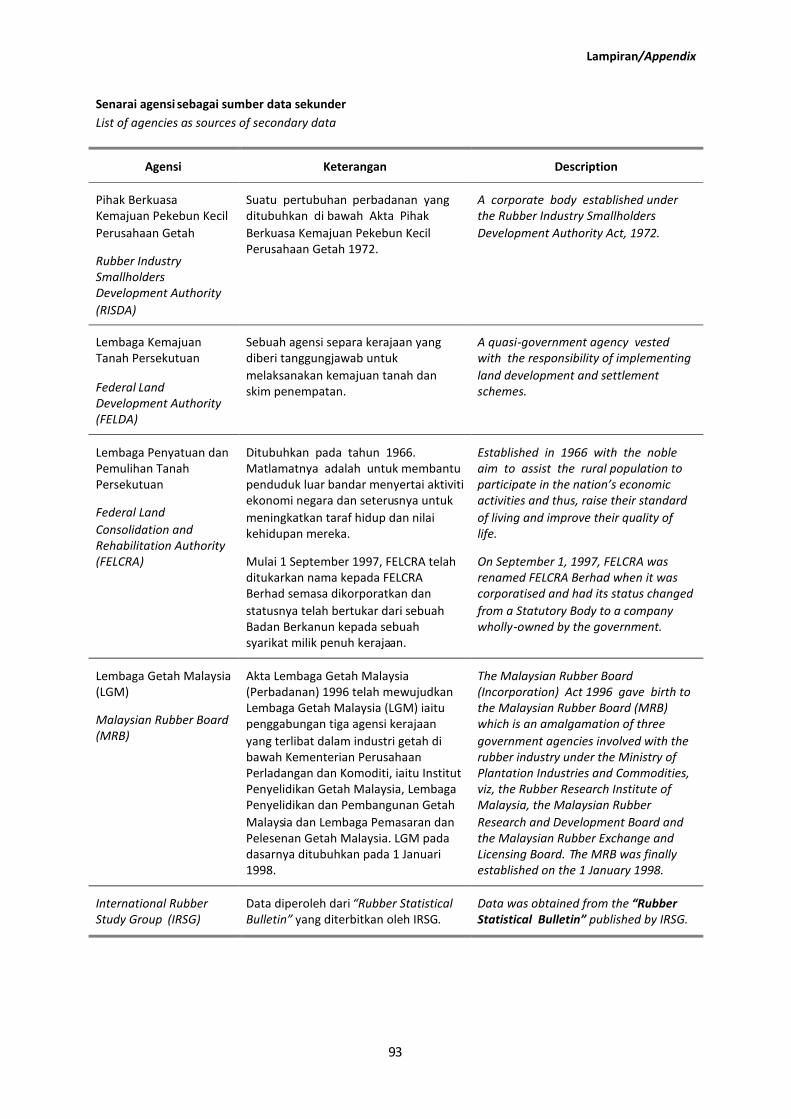
Lampiran/Appendix
93
Senarai agensi sebagai sumber data sekunderList of agencies as sources of secondary data
Agensi Keterangan Description
Pihak BerkuasaKemajuan Pekebun KecilPerusahaan Getah
Rubber IndustrySmallholdersDevelopment Authority(RISDA)
Suatu pertubuhan perbadanan yangditubuhkan di bawah Akta PihakBerkuasa Kemajuan Pekebun KecilPerusahaan Getah 1972.
A corporate body established underthe Rubber Industry SmallholdersDevelopment Authority Act, 1972.
Lembaga KemajuanTanah Persekutuan
Federal LandDevelopment Authority(FELDA)
Sebuah agensi separa kerajaan yangdiberi tanggungjawab untukmelaksanakan kemajuan tanah danskim penempatan.
A quasi-government agency vestedwith the responsibility of implementingland development and settlementschemes.
Lembaga Penyatuan danPemulihan TanahPersekutuan
Federal LandConsolidation andRehabilitation Authority(FELCRA)
Ditubuhkan pada tahun 1966.Matlamatnya adalah untuk membantupenduduk luar bandar menyertai aktivitiekonomi negara dan seterusnya untukmeningkatkan taraf hidup dan nilaikehidupan mereka.
Mulai 1 September 1997, FELCRA telahditukarkan nama kepada FELCRABerhad semasa dikorporatkan danstatusnya telah bertukar dari sebuahBadan Berkanun kepada sebuahsyarikat milik penuh kerajaan.
Established in 1966 with the nobleaim to assist the rural population toparticipate in the nation’s economicactivities and thus, raise their standardof living and improve their quality oflife.
On September 1, 1997, FELCRA wasrenamed FELCRA Berhad when it wascorporatised and had its status changedfrom a Statutory Body to a companywholly-owned by the government.
Lembaga Getah Malaysia(LGM)
Malaysian Rubber Board(MRB)
Akta Lembaga Getah Malaysia(Perbadanan) 1996 telah mewujudkanLembaga Getah Malaysia (LGM) iaitupenggabungan tiga agensi kerajaanyang terlibat dalam industri getah dibawah Kementerian PerusahaanPerladangan dan Komoditi, iaitu InstitutPenyelidikan Getah Malaysia, LembagaPenyelidikan dan Pembangunan GetahMalaysia dan Lembaga Pemasaran danPelesenan Getah Malaysia. LGM padadasarnya ditubuhkan pada 1 Januari1998.
The Malaysian Rubber Board(Incorporation) Act 1996 gave birth tothe Malaysian Rubber Board (MRB)which is an amalgamation of threegovernment agencies involved with therubber industry under the Ministry ofPlantation Industries and Commodities,viz, the Rubber Research Institute ofMalaysia, the Malaysian RubberResearch and Development Board andthe Malaysian Rubber Exchange andLicensing Board. The MRB was finallyestablished on the 1 January 1998.
International RubberStudy Group (IRSG)
Data diperoleh dari “Rubber StatisticalBulletin” yang diterbitkan oleh IRSG.
Data was obtained from the “RubberStatistical Bulletin” published by IRSG.