telekom malaysia berhad · 2013-06-28 · - final dividend: 14.25 sen gross or rm382m net of tax...
TRANSCRIPT
TELEKOM MALAYSIA BERHAD
FY 2008 RESULTS
24 February 2009
• Key 2008 Highlights 3
• Performance Improvement Programme 4
• HSBB update 6
2FY 2008 Results Briefing
� Dato’ Zamzamzairani Mohd Isa
• Financial Performance 7
• Costs 10
• Revenue by Products / Line Of Business (LOB) 11• Physical numbers 13
• Capex 18
• Balance sheet 19
� Datuk Bazlan Osman
• Key Takeaways 20
• Capital Management 21
� Dato’ Zamzamzairani Mohd Isa
Contents
Slide
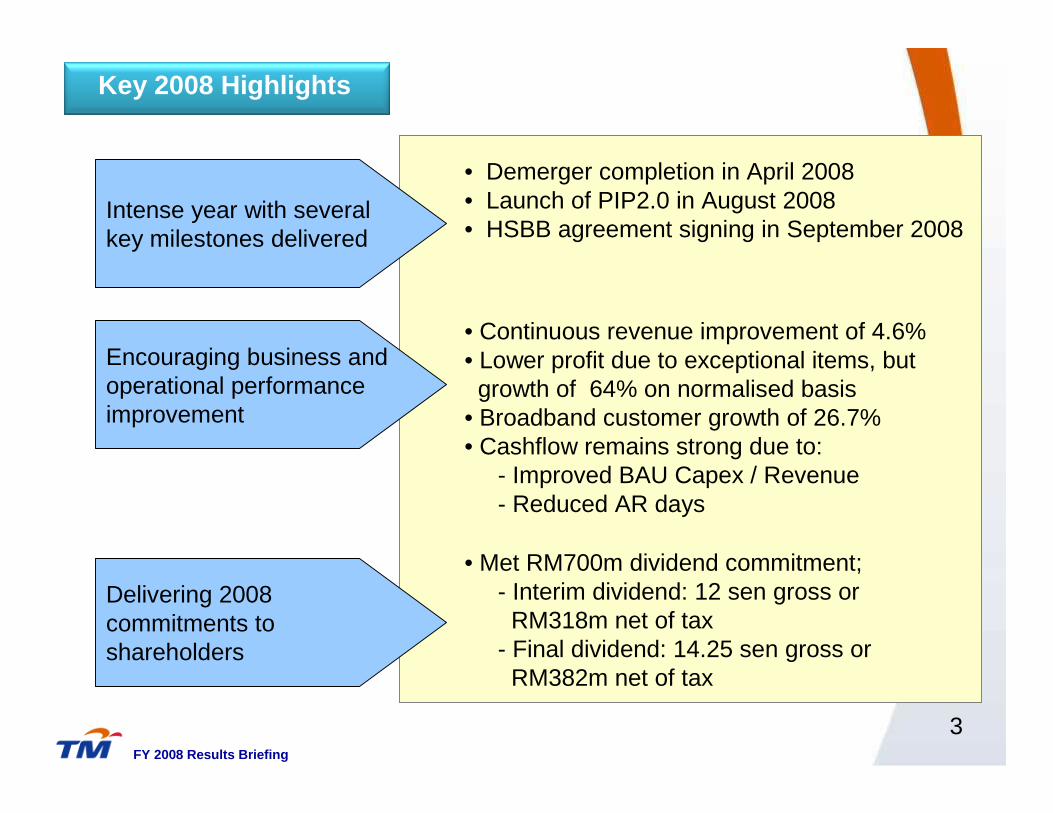
• Demerger completion in April 2008• Launch of PIP2.0 in August 2008• HSBB agreement signing in September 2008
• Met RM700m dividend commitment; - Interim dividend: 12 sen gross or
RM318m net of tax- Final dividend: 14.25 sen gross or
RM382m net of tax
Encouraging business and operational performance improvement
Intense year with several key milestones delivered
Delivering 2008 commitments to shareholders
Key 2008 Highlights
3FY 2008 Results Briefing
• Continuous revenue improvement of 4.6%• Lower profit due to exceptional items, but
growth of 64% on normalised basis• Broadband customer growth of 26.7%• Cashflow remains strong due to:
- Improved BAU Capex / Revenue - Reduced AR days
4FY 2008 Results Briefing
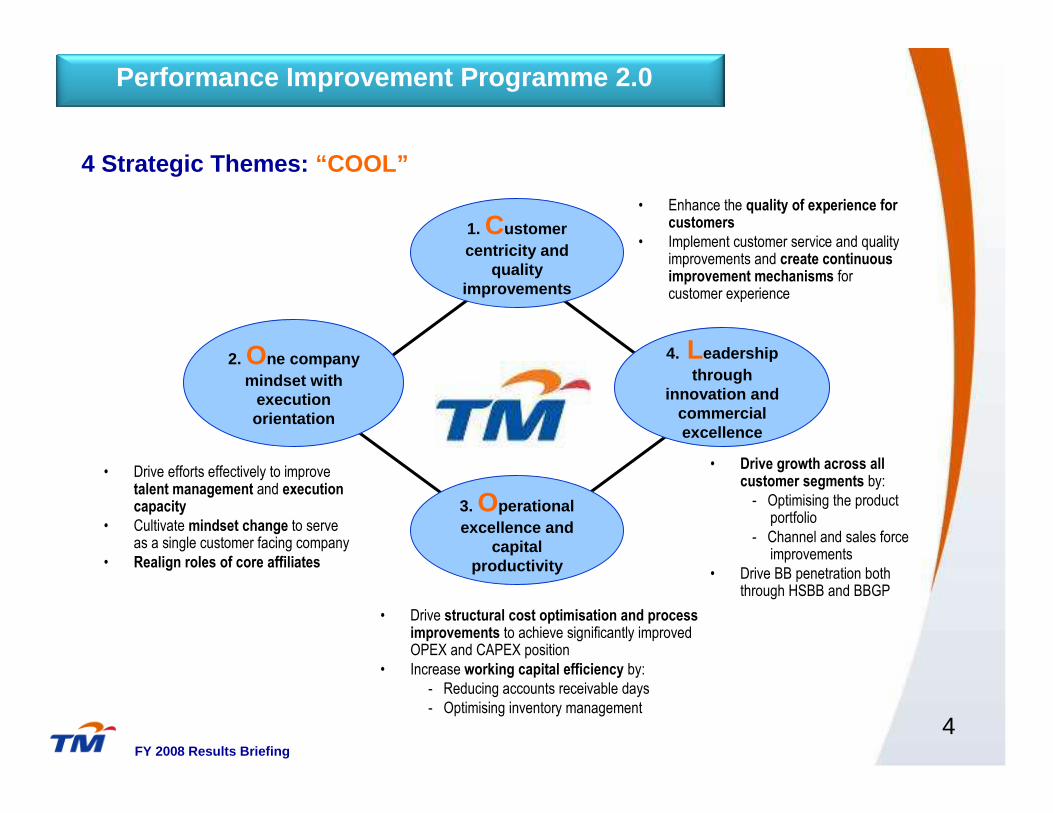
Performance Improvement Programme 2.0
• Enhance the quality of experience for customers
• Implement customer service and quality improvements and create continuous improvement mechanisms for customer experience
• Drive growth across all customer segments by:
- Optimising the product portfolio
- Channel and sales force improvements
• Drive BB penetration both through HSBB and BBGP
• Drive efforts effectively to improve talent management and execution capacity
• Cultivate mindset change to serve as a single customer facing company
• Realign roles of core affiliates
• Drive structural cost optimisation and process improvements to achieve significantly improved OPEX and CAPEX position
• Increase working capital efficiency by:
- Reducing accounts receivable days
- Optimising inventory management
2. One company mindset with
execution orientation
3. Operational excellence and
capital productivity
1. Customer centricity and
quality improvements
4. Leadership through
innovation and commercial excellence
4 Strategic Themes: “COOL”
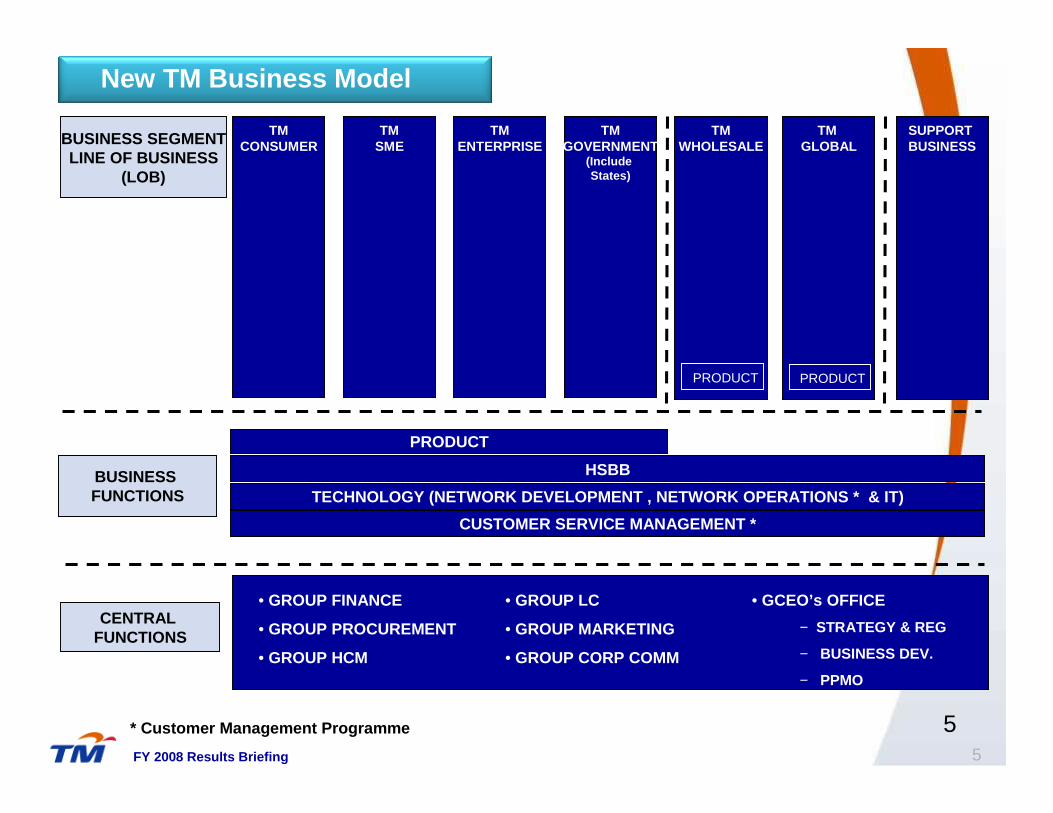
CENTRAL FUNCTIONS
• GROUP FINANCE
• GROUP PROCUREMENT
• GROUP HCM
• GROUP LC
• GROUP MARKETING
• GROUP CORP COMM
• GCEO’s OFFICE
− STRATEGY & REG
− BUSINESS DEV.
− PPMO
TMCONSUMER
TMSME
TMENTERPRISE
TMGOVERNMENT
(Include States)
TMWHOLESALE
TM GLOBALBUSINESS SEGMENT
LINE OF BUSINESS(LOB)
BUSINESS FUNCTIONS
SUPPORT BUSINESS
PRODUCT
HSBB
CUSTOMER SERVICE MANAGEMENT *
TECHNOLOGY (NETWORK DEVELOPMENT , NETWORK OPERATION S * & IT)
* Customer Management Programme
5
PRODUCT PRODUCT
New TM Business Model
FY 2008 Results Briefing
5
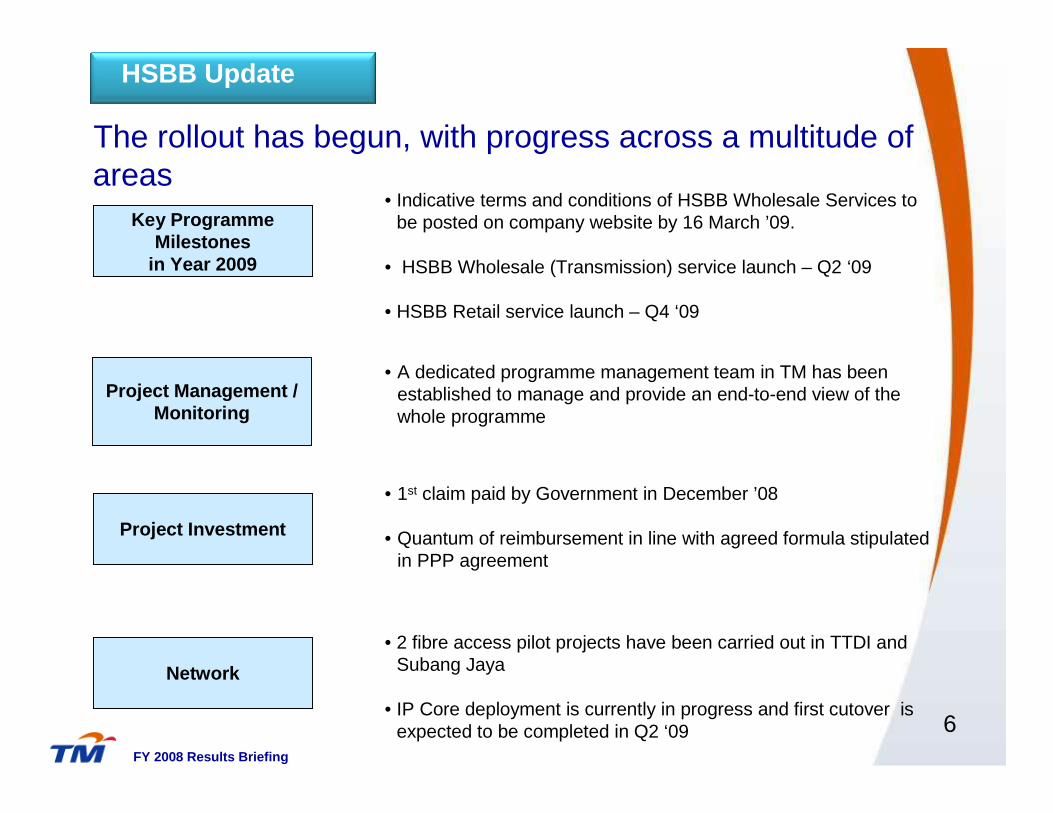
The rollout has begun, with progress across a multitude of areas
Key ProgrammeMilestones
in Year 2009
Project Investment
Network
• Indicative terms and conditions of HSBB Wholesale Services to be posted on company website by 16 March ’09.
• HSBB Wholesale (Transmission) service launch – Q2 ‘09
• HSBB Retail service launch – Q4 ‘09
• 1st claim paid by Government in December ’08
• Quantum of reimbursement in line with agreed formula stipulated in PPP agreement
• 2 fibre access pilot projects have been carried out in TTDI and Subang Jaya
• IP Core deployment is currently in progress and first cutover is expected to be completed in Q2 ‘09
Project Management / Monitoring
• A dedicated programme management team in TM has been established to manage and provide an end-to-end view of the whole programme
HSBB Update
6FY 2008 Results Briefing
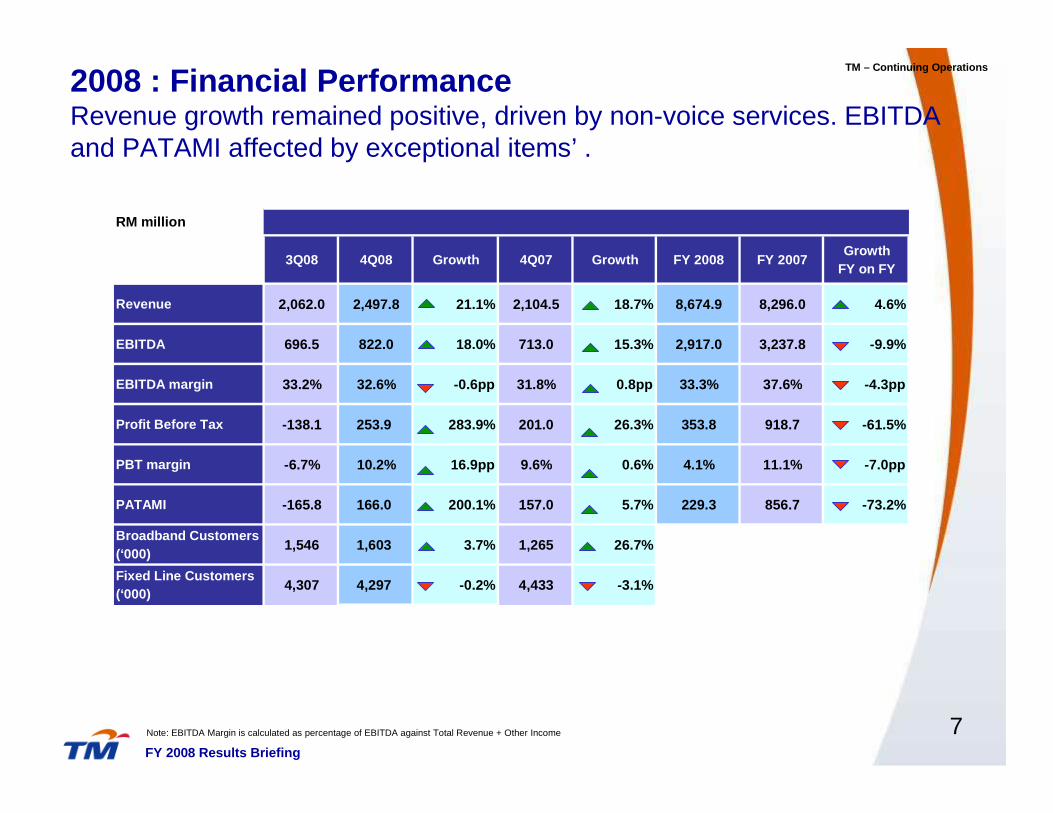
RM million
3Q08 4Q08 Growth 4Q07 Growth FY 2008 FY 2007Growth
FY on FY
Revenue 2,062.0 2,497.8 21.1% 2,104.5 18.7% 8,674.9 8,296.0 4.6%
EBITDA 696.5 822.0 18.0% 713.0 15.3% 2,917.0 3,237.8 -9.9%
EBITDA margin 33.2% 32.6% -0.6pp 31.8% 0.8pp 33.3% 37.6% -4.3pp
Profit Before Tax -138.1 253.9 283.9% 201.0 26.3% 353.8 918.7 -61.5%
PBT margin -6.7% 10.2% 16.9pp 9.6% 0.6% 4.1% 11.1% -7.0pp
PATAMI -165.8 166.0 200.1% 157.0 5.7% 229.3 856.7 -73.2%
Broadband Customers (‘000)
1,546 1,603 3.7% 1,265 26.7%
Fixed Line Customers (‘000)
4,307 4,297 -0.2% 4,433 -3.1%
2008 : Financial Performance Revenue growth remained positive, driven by non-voice services. EBITDA and PATAMI affected by exceptional items’ .
7Note: EBITDA Margin is calculated as percentage of EBITDA against Total Revenue + Other Income
TM – Continuing Operations
FY 2008 Results Briefing
8
TM – Continuing Operations
FY 2008 Results Briefing
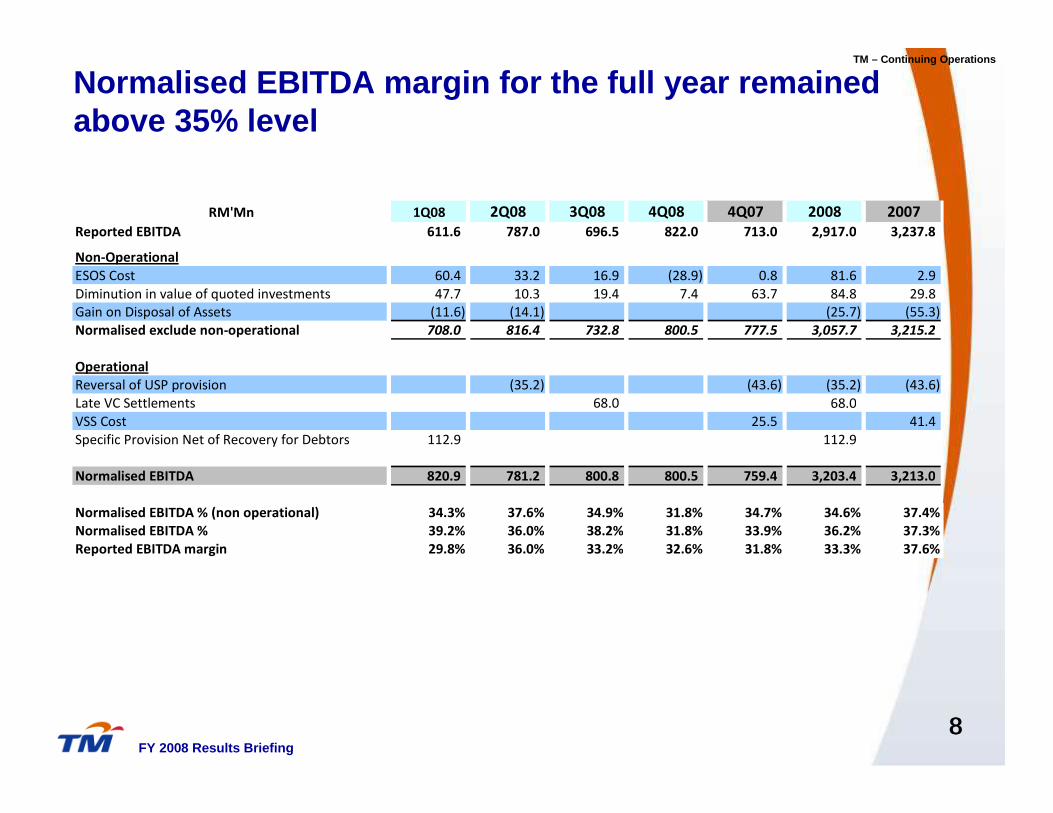
Normalised EBITDA margin for the full year remained above 35% level
8
RM'Mn 1Q08 2Q08 3Q08 4Q08 4Q07 2008 2007
Reported EBITDA 611.6 787.0 696.5 822.0 713.0 2,917.0 3,237.8
Non-Operational
ESOS Cost 60.4 33.2 16.9 (28.9) 0.8 81.6 2.9
Diminution in value of quoted investments 47.7 10.3 19.4 7.4 63.7 84.8 29.8
Gain on Disposal of Assets (11.6) (14.1) (25.7) (55.3)
Normalised exclude non-operational 708.0 816.4 732.8 800.5 777.5 3,057.7 3,215.2
Operational
Reversal of USP provision (35.2) (43.6) (35.2) (43.6)
Late VC Settlements 68.0 68.0
VSS Cost 25.5 41.4
Specific Provision Net of Recovery for Debtors 112.9 112.9
Normalised EBITDA 820.9 781.2 800.8 800.5 759.4 3,203.4 3,213.0
Normalised EBITDA % (non operational) 34.3% 37.6% 34.9% 31.8% 34.7% 34.6% 37.4%
Normalised EBITDA % 39.2% 36.0% 38.2% 31.8% 33.9% 36.2% 37.3%
Reported EBITDA margin 29.8% 36.0% 33.2% 32.6% 31.8% 33.3% 37.6%

9
Normalised PATAMI indicates strong underlying business performance
TM – Continuing Operations
FY 2008 Results Briefing
RM'Mn 1Q08 2Q08 3Q08 4Q08 4Q07 2008 2007
Reported PATAMI 114.4 114.7 (165.8) 166.0 157.0 229.3 856.7
Non-Operational
ESOS Cost 60.4 33.2 16.9 (28.9) 0.8 81.6 2.9
Diminution in value of quoted investments 47.7 10.3 19.4 7.4 63.7 84.8 29.8
FX Loss/(Gain) on Loans (118.8) 74.9 195.7 18.2 (110.1) 170.0 (262.4)
Gain on Disposal of Assets (11.6) (14.1) (25.7) (46.0)
Loss on termination of financial swaps 66.1 15.9 82.0
Deconsolidation of Sotelgui 88.8 88.8
Disposal of TNL Malawi (9.3)
Minority Interest (0.2) (0.1) (0.2) (0.4) (0.9)
Normalised PATAMI 158.0 234.8 154.8 162.4 111.4 709.9 571.7
Operational
Reversal of USP provision (35.2) (43.6) (35.2) (43.6)
Late VC Settlements 68.0 68.0
VSS cost 25.5 41.4
Fixed Assets Written Off/Impairment 16.6 49.8
Specific Provision Net of Recovery for Debtors 112.9 112.9
Prior Year Tax Provision (51.9) (28.7) (28.6) (53.9) (109.2) (192.1)
Impact of Tax (29.4) 9.2 (17.7) 4.9 (37.9) 5.0
Normalised PATAMI 241.5 156.8 176.4 133.8 60.9 708.5 432.2

Costs as a % of Revenue
10
Cost affected by exceptional items
92.6
8,035.4
2,098.9
24.2
1,539.0
17.7
370.9
4.3
196.4
2.3
422.6
4.9
1,527.8
17.6
1,879.9
21.7
8,674.9
FY 2008
93.9
1,936.0
533.6
25.9
318.4
15.4
80.2
3.9
4.1
0.2
89.3
4.3
382.4
18.5
527.0
25.6
2,062.0
3Q 2008
89.2
2,228.4
529.6
21.2
555.4
22.2
92.9
3.7
69.6
2.8
98.2
3.9
337.4
13.5
545.3
21.8
2,497.8
4Q 2008
91.696.8Total (% of Revenue)
7,598.32,037.0Total (RM mil)
2,311.4589.5RM mil.
27.928.0Depreciation & Amortisation %
1,125.6330.1RM mil.
13.615.7Other Operating Costs %
387.6127.2RM mil.
4.76.0Marketing Expenses %
263.845.9RM mil.
3.22.2Bad & Doubtful Debts %
455.2170.4RM mil.
5.58.1Supplies & Materials %
1,420.1355.4RM mil.
17.116.9Manpower %
1,634.6418.4RM mil.
19.719.9Direct Costs %
8,296.0 2,104.5Revenue (RM mil)
FY 20074Q 2007 YoY Review• Higher Other Operating
Costs mainly due to higher maintenance (MERS 999), rental, utilities and diminution in value of quoted investment.
• Manpower cost stable except for special ESOS provision (RM81.6mn)
• Direct cost increased due to higher international and interconnect outpayment(RM158.3mn)
• Depreciation lower mainly due to sale and leaseback of 4 buildings
Note: Cost for 4Q 2007 and FY 2007 exclude Measat Impairment
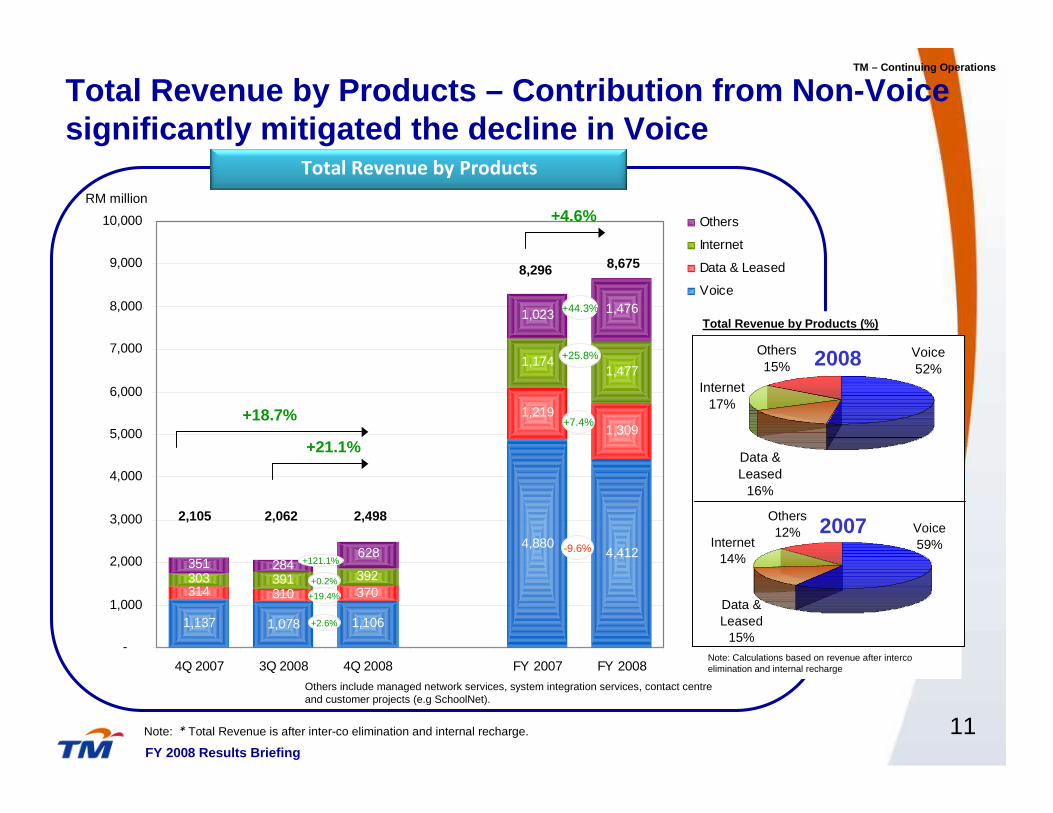
1,137 1,078 1,106
4,412
314 310
1,2191,309
303 391 392
1,1741,477
351 284
1,023 1,476
4,880
370
628
-
1,000
2,000
3,000
4,000
5,000
6,000
7,000
8,000
9,000
10,000
4Q 2007 3Q 2008 4Q 2008 FY 2007 FY 2008
Others
Internet
Data & Leased
Voice
Total Revenue by Products – Contribution from Non-Vo ice significantly mitigated the decline in Voice
Note: * Total Revenue is after inter-co elimination and internal recharge.
Total Revenue by Products
11
2,105 2,062 2,498
8,296 8,675
+18.7%
+4.6%
+21.1%
+44.3%
+25.8%
-9.6%+121.1%
+0.2%
+19.4%
+2.6%
RM million
+7.4%
TM – Continuing Operations
Others include managed network services, system integration services, contact centre and customer projects (e.g SchoolNet).
FY 2008 Results Briefing
2008
2007
Data & Leased
16%
Internet17%
Others15%
Voice52%
Data & Leased
15%
Internet14%
Others12% Voice
59%
Total Revenue by Products (%)
Note: Calculations based on revenue after intercoelimination and internal recharge
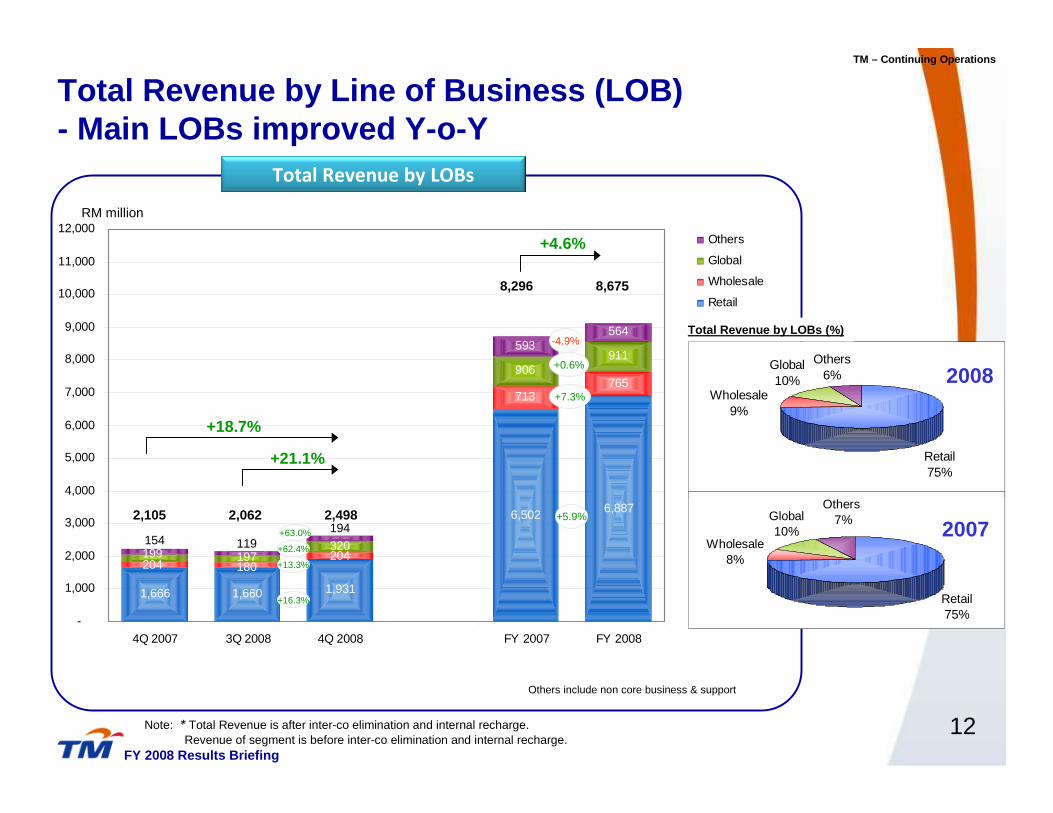
1,666 1,660 1,931
6,887
713765
320
906911
593564
6,502
180204204197199
194154 119
-
1,000
2,000
3,000
4,000
5,000
6,000
7,000
8,000
9,000
10,000
11,000
12,000
4Q 2007 3Q 2008 4Q 2008 FY 2007 FY 2008
Others
Global
Wholesale
Retail
Total Revenue by Line of Business (LOB) - Main LOBs improved Y-o-Y
Note: * Total Revenue is after inter-co elimination and internal recharge. Revenue of segment is before inter-co elimination and internal recharge.
Total Revenue by LOBs
12
+5.9%
+7.3%
+0.6%
-4.9%
+63.0%
+62.4%
+13.3%
+16.3%
RM million
TM – Continuing Operations
Others include non core business & support
2,105 2,062 2,498
8,296 8,675
+18.7%
+4.6%
+21.1%
FY 2008 Results Briefing
Retail75%
Global10%
Others6%
Wholesale9%
2008
Wholesale8%
Global10%
Others 7%
Retail75%
2007
Total Revenue by LOBs (%)
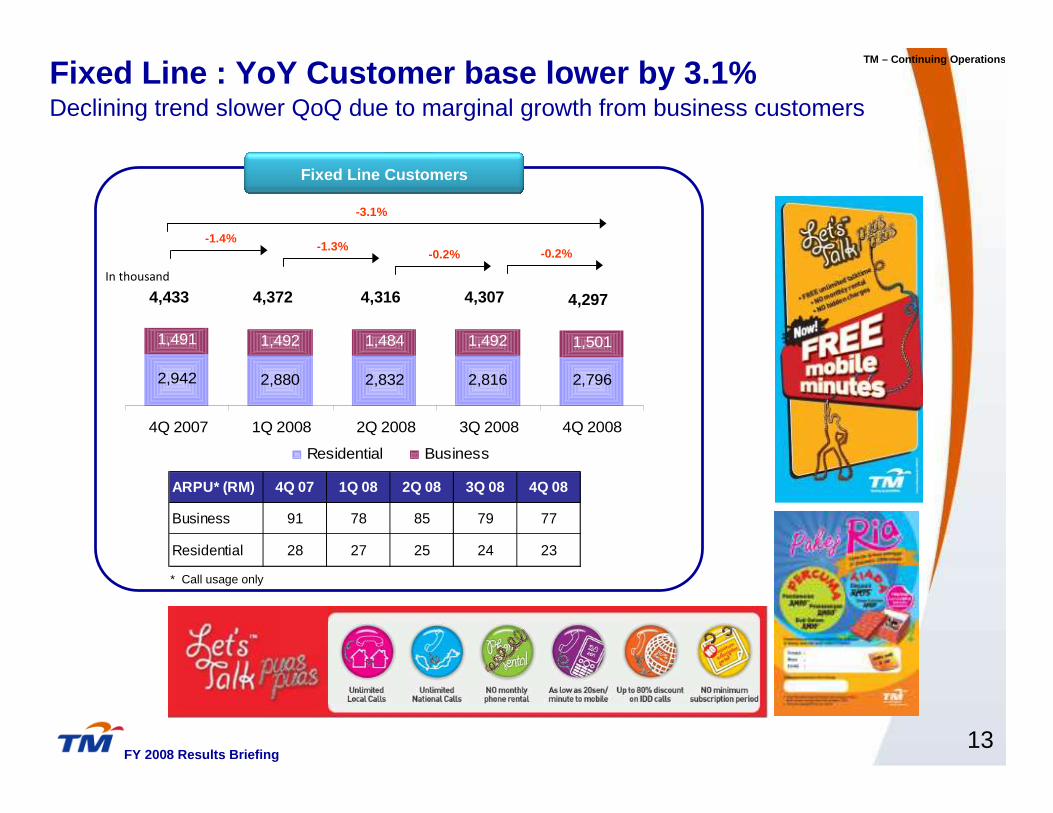
2,942 2,880 2,832 2,816 2,796
1,491 1,492 1,484 1,492 1,501
4Q 2007 1Q 2008 2Q 2008 3Q 2008 4Q 2008
Residential Business
In thousand
4,316 4,2974,433 4,372
13
Fixed Line Customers
* Call usage only
4,307
-0.2%-1.4%
-1.3%-0.2%
TM – Continuing Operations
Fixed Line : YoY Customer base lower by 3.1%Declining trend slower QoQ due to marginal growth from business customers
-3.1%
FY 2008 Results Briefing
ARPU* (RM) 4Q 07 1Q 08 2Q 08 3Q 08 4Q 08
Business 91 78 85 79 77
Residential 28 27 25 24 23
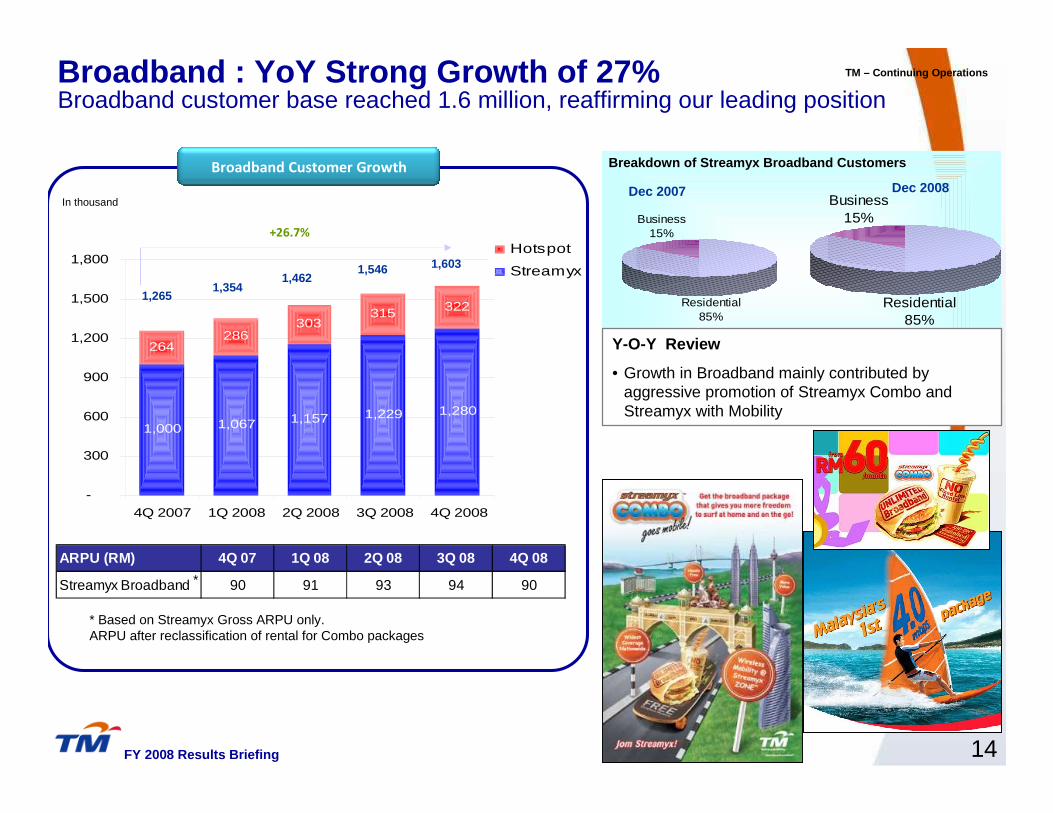
Broadband : YoY Strong Growth of 27%
14
1,000 1,067 1,157 1,229 1,280
264286
303315 322
-
300
600
900
1,200
1,500
1,800
4Q 2007 1Q 2008 2Q 2008 3Q 2008 4Q 2008
Hotspot
Streamyx
In thousand
1,603
1,2651,354
1,462
+26.7%
1,546
* Based on Streamyx Gross ARPU only.ARPU after reclassification of rental for Combo packages
*
Breakdown of Streamyx Broadband Customers
Dec 2007 Dec 2008Business
15%
Residential85%
Y-O-Y Review
• Growth in Broadband mainly contributed by aggressive promotion of Streamyx Combo and Streamyx with Mobility
TM – Continuing Operations
Business15%
Residential85%
Broadband Customer Growth
FY 2008 Results Briefing
ARPU (RM) 4Q 07 1Q 08 2Q 08 3Q 08 4Q 08
Streamyx Broadband 90 91 93 94 90
Broadband customer base reached 1.6 million, reaffirming our leading position
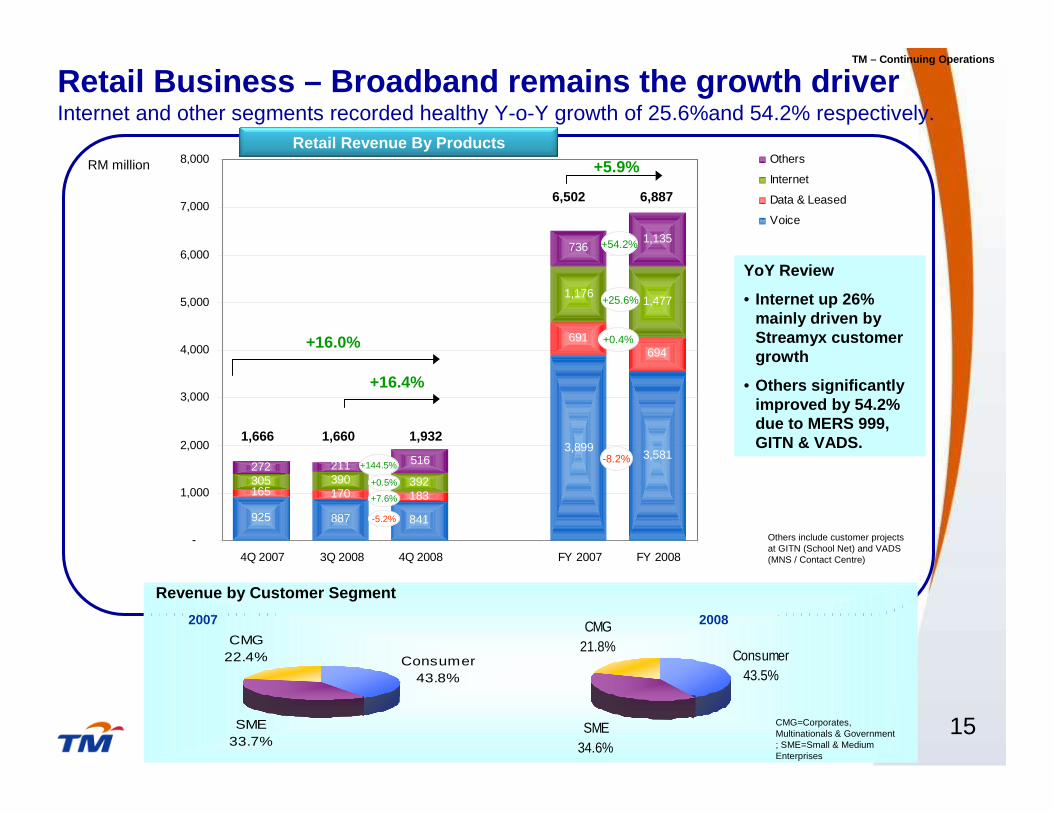
925 887 841
3,581
165 170 183
691694
305 390 392
1,1761,477
272 211
7361,135
3,899516
-
1,000
2,000
3,000
4,000
5,000
6,000
7,000
8,000
4Q 2007 3Q 2008 4Q 2008 FY 2007 FY 2008
Others
Internet
Data & Leased
Voice
1,666 1,660 1,932
6,502 6,887
+16.0%
+5.9%
+16.4%
-8.2%
+0.4%
+25.6%
+54.2%
+144.5%
+0.5%
+7.6%
-5.2%
RM million
Retail Business – Broadband remains the growth drive r Internet and other segments recorded healthy Y-o-Y growth of 25.6%and 54.2% respectively.
15
Retail Revenue By Products
YoY Review
• Internet up 26% mainly driven by Streamyx customer growth
• Others significantly improved by 54.2% due to MERS 999, GITN & VADS.
Revenue by Customer Segment
20082007
CMG=Corporates, Multinationals & Government ; SME=Small & Medium Enterprises
CMG21.8%
SME34.6%
Consumer43.5%
CMG22.4% Consumer
43.8%
SME33.7%
TM – Continuing Operations
Others include customer projects at GITN (School Net) and VADS (MNS / Contact Centre)
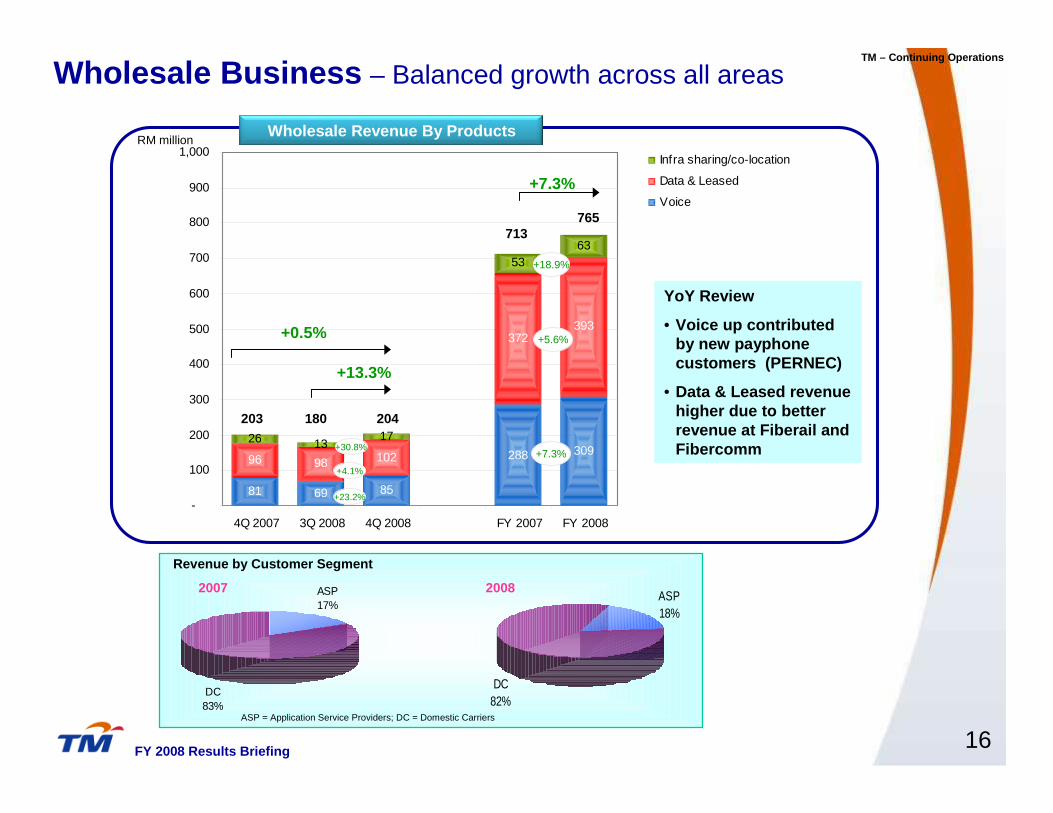
81 69 85
30996 98 102
372393
26 1317
5363
288
-
100
200
300
400
500
600
700
800
900
1,000
4Q 2007 3Q 2008 4Q 2008 FY 2007 FY 2008
Infra sharing/co-location
Data & Leased
Voice
16
RM millionWholesale Revenue By Products
16
Wholesale Business – Balanced growth across all areas
203 180 204
713765
+7.3%
+13.3%
+5.6%
+18.9%
+30.8%
+4.1%
+23.2%
+0.5%
+7.3%
ASP17%
DC83%
Revenue by Customer Segment
ASP = Application Service Providers; DC = Domestic Carriers
DC82%
ASP18%
20082007
TM – Continuing Operations
FY 2008 Results Briefing
YoY Review
• Voice up contributed by new payphone customers (PERNEC)
• Data & Leased revenue higher due to better revenue at Fiberail and Fibercomm
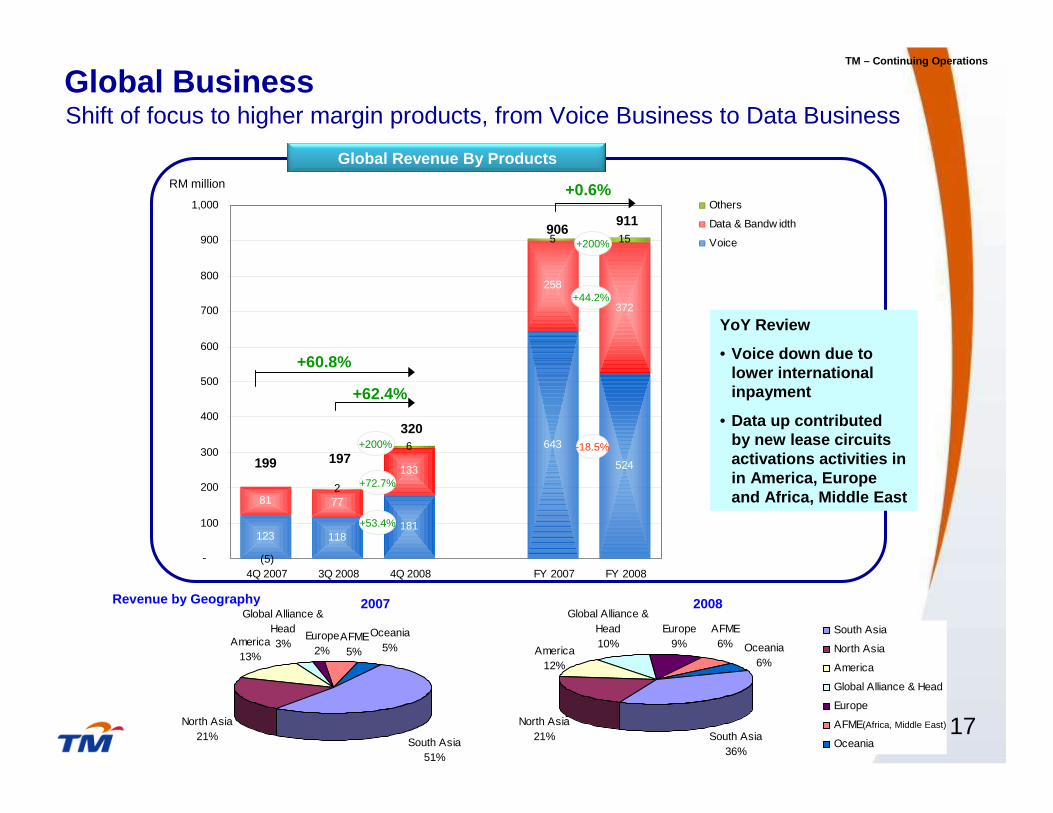
123 118181
524
81 77
133
258
372
(5)
2
6
5 15
643
-
100
200
300
400
500
600
700
800
900
1,000
4Q 2007 3Q 2008 4Q 2008 FY 2007 FY 2008
Others
Data & Bandw idth
Voice
Global Business
17
199 197
320
906911
+60.8%
+0.6%
+62.4%
-18.5%
+44.2%
+200%
RM million
Global Revenue By Products
Revenue by Geography 20082007
TM – Continuing Operations
+200%
+72.7%
+53.4%
North Asia21%
Oceania6%
AFME6%
Europe9%
South Asia36%
Global Alliance & Head10%
America 12%
South Asia
North Asia
America
Global Alliance & Head
Europe
AFME
Oceania
America 13%
Global Alliance & Head3%
South Asia51%
Europe2%
AFME5%
Oceania5%
North Asia21%
(Africa, Middle East)
Shift of focus to higher margin products, from Voice Business to Data Business
YoY Review
• Voice down due to lower international inpayment
• Data up contributed by new lease circuits activations activities in in America, Europe and Africa, Middle East
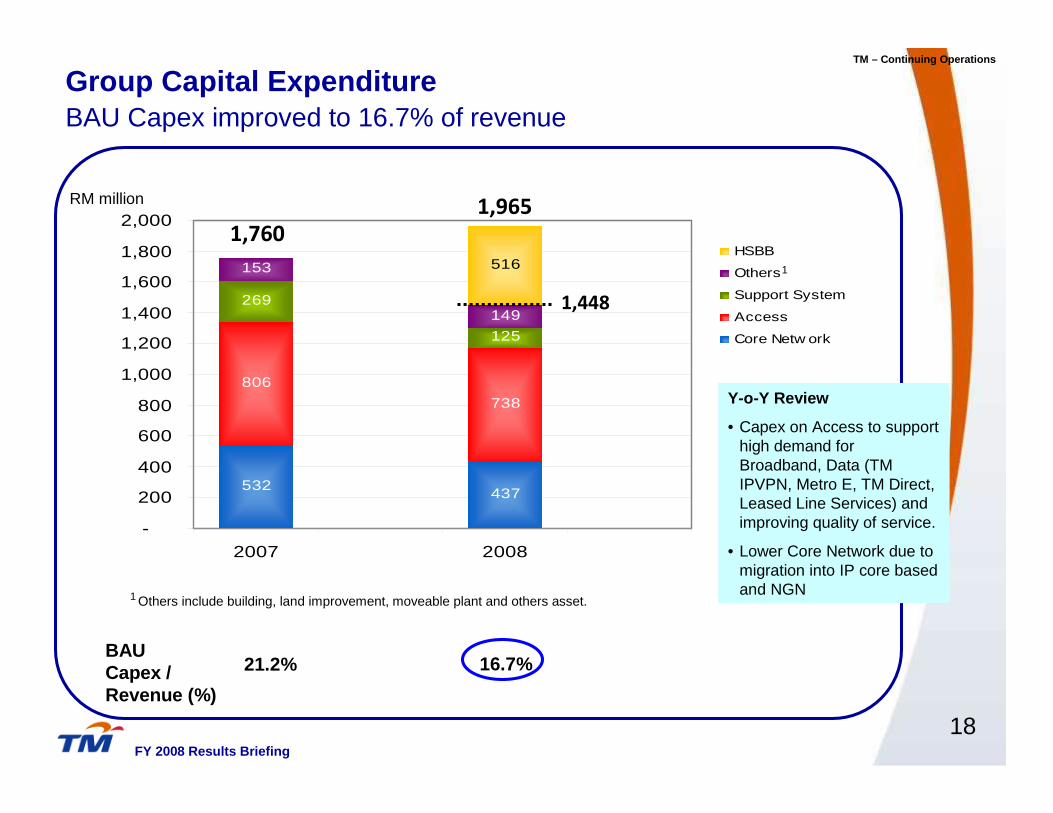
532437
806
738
269
125
153
149
516
-
200
400
600
800
1,000
1,200
1,400
1,600
1,800
2,000
2007 2008
HSBB
Others
Support System
Access
Core Netw ork
Group Capital Expenditure
18
Others include building, land improvement, moveable plant and others asset.
RM million
1
1
1,760
1,965
BAU Capex improved to 16.7% of revenue
Y-o-Y Review
• Capex on Access to support high demand for Broadband, Data (TM IPVPN, Metro E, TM Direct, Leased Line Services) and improving quality of service.
• Lower Core Network due to migration into IP core based and NGN
TM – Continuing Operations
BAU Capex /Revenue (%)
21.2%
FY 2008 Results Briefing
16.7%
1,448
10,248.1
226.5
8,587.3
6,965.1
1,362.0
260.2.
19,061.9
9,412.4
2,127.9
763.4
4,025.0
2,095.2
400.9
3,471.3
2,812.6
34.9
-
623.8
5,941.1
11,772.1
1,348.7
19,061.9
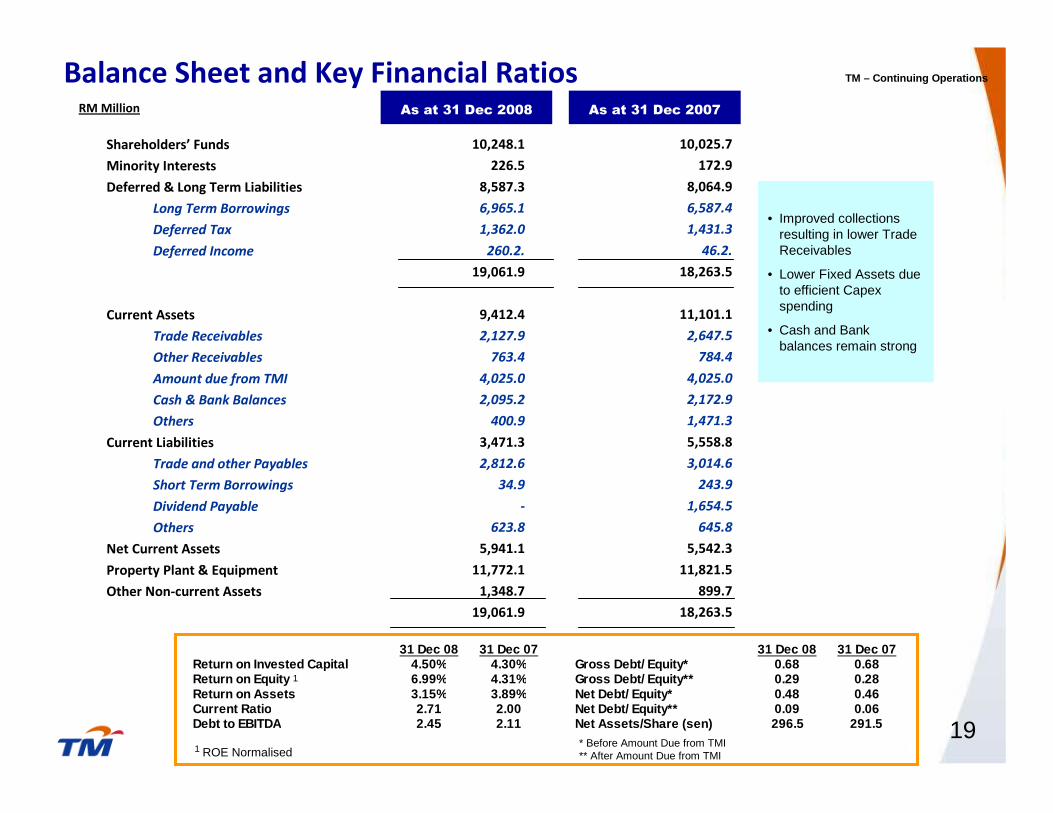
31 Dec 08 31 Dec 07 31 Dec 08 31 Dec 07Return on Invested Capital 4.50% 4.30% Gross Debt/ Equity* 0.68 0.68Return on Equity 6.99% 4.31% Gross Debt/ Equity** 0.29 0.28Return on Assets 3.15% 3.89% Net Debt/ Equity* 0.48 0.46Current Ratio 2.71 2.00 Net Debt/ Equity** 0.09 0.06Debt to EBITDA 2.45 2.11 Net Assets/Share (sen) 296.5 291.5
10,025.7
172.9
8,064.9
6,587.4
1,431.3
46.2.
18,263.5
11,101.1
2,647.5
784.4
4,025.0
2,172.9
1,471.3
5,558.8
3,014.6
243.9
1,654.5
645.8
5,542.3
11,821.5
899.7
18,263.5
Balance Sheet and Key Financial Ratios
Shareholders’ Funds
Minority Interests
Deferred & Long Term Liabilities
Long Term Borrowings
Deferred Tax
Deferred Income
Current Assets
Trade Receivables
Other Receivables
Amount due from TMI
Cash & Bank Balances
Others
Current Liabilities
Trade and other Payables
Short Term Borrowings
Dividend Payable
Others
Net Current Assets
Property Plant & Equipment
Other Non-current Assets
RM Million As at 31 Dec 2007As at 31 Dec 2008
* Before Amount Due from TMI** After Amount Due from TMI
19
• Improved collections resulting in lower Trade Receivables
• Lower Fixed Assets due to efficient Capexspending
• Cash and Bank balances remain strong
TM – Continuing Operations
1
1 ROE Normalised
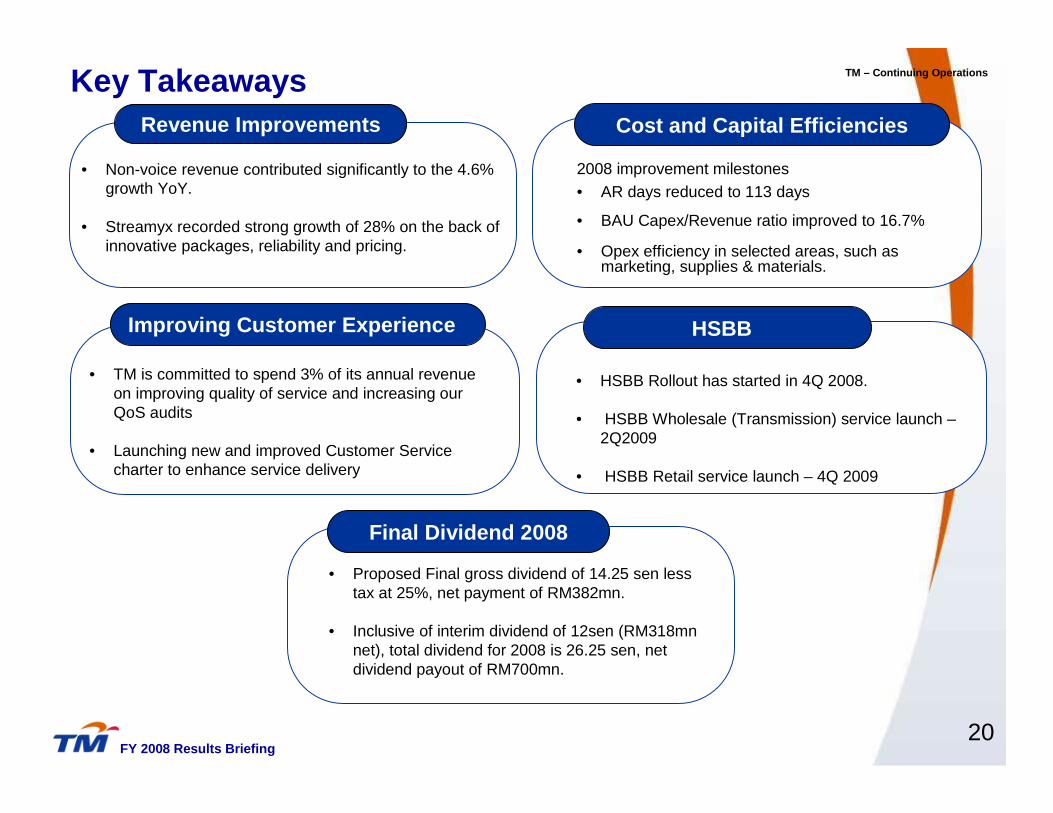
Improving Customer Experience
Cost and Capital Efficiencies
Final Dividend 2008
• Proposed Final gross dividend of 14.25 sen less tax at 25%, net payment of RM382mn.
• Inclusive of interim dividend of 12sen (RM318mn net), total dividend for 2008 is 26.25 sen, net dividend payout of RM700mn.
2008 improvement milestones• AR days reduced to 113 days
• BAU Capex/Revenue ratio improved to 16.7%
• Opex efficiency in selected areas, such as marketing, supplies & materials.
• TM is committed to spend 3% of its annual revenue on improving quality of service and increasing our QoS audits
• Launching new and improved Customer Service charter to enhance service delivery
Key Takeaways
20
Revenue Improvements
• Non-voice revenue contributed significantly to the 4.6% growth YoY.
• Streamyx recorded strong growth of 28% on the back of innovative packages, reliability and pricing.
TM – Continuing Operations
HSBB
FY 2008 Results Briefing
• HSBB Rollout has started in 4Q 2008.
• HSBB Wholesale (Transmission) service launch –2Q2009
• HSBB Retail service launch – 4Q 2009
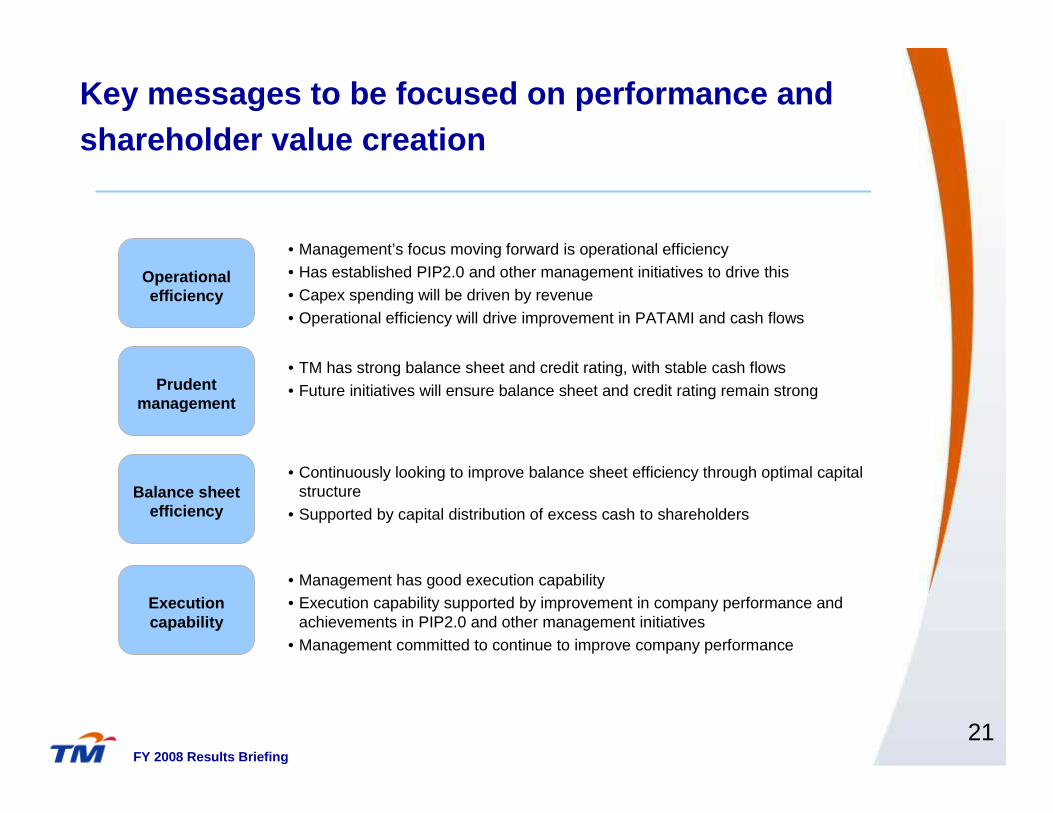
Key messages to be focused on performance and shareholder value creation
Operational efficiency
• Management has good execution capability• Execution capability supported by improvement in company performance and
achievements in PIP2.0 and other management initiatives• Management committed to continue to improve company performance
Prudent management
Balance sheet efficiency
Execution capability
• Management’s focus moving forward is operational efficiency• Has established PIP2.0 and other management initiatives to drive this• Capex spending will be driven by revenue• Operational efficiency will drive improvement in PATAMI and cash flows
• TM has strong balance sheet and credit rating, with stable cash flows• Future initiatives will ensure balance sheet and credit rating remain strong
• Continuously looking to improve balance sheet efficiency through optimal capital structure
• Supported by capital distribution of excess cash to shareholders
FY 2008 Results Briefing
21

Capital management approach guided by 3 main principles
Exercise prudent approach to managing capital struc ture
Strive to optimise performance
A
B
Create value for shareholders
C
Guiding principles
FY 2008 Results Briefing
22
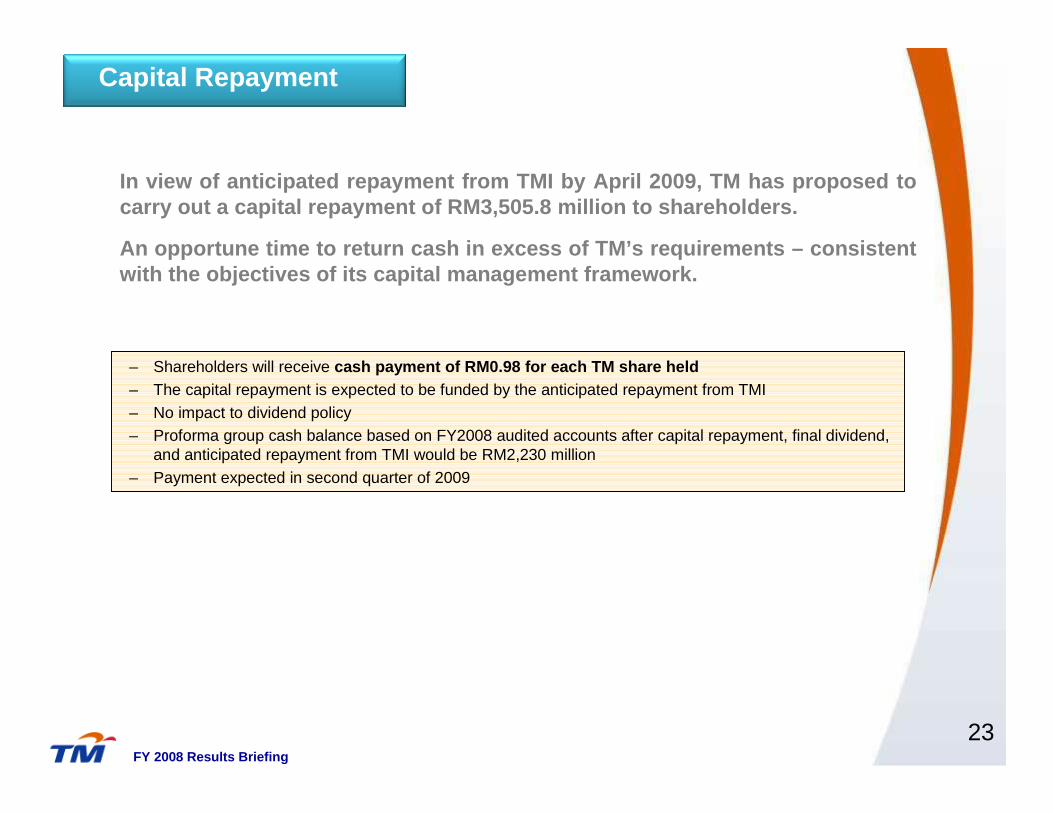
– Shareholders will receive cash payment of RM0.98 for each TM share held– The capital repayment is expected to be funded by the anticipated repayment from TMI– No impact to dividend policy– Proforma group cash balance based on FY2008 audited accounts after capital repayment, final dividend,
and anticipated repayment from TMI would be RM2,230 million– Payment expected in second quarter of 2009
In view of anticipated repayment from TMI by April 2 009, TM has proposed to carry out a capital repayment of RM3,505.8 million t o shareholders.
An opportune time to return cash in excess of TM’s requirements – consistent with the objectives of its capital management frame work.
FY 2008 Results Briefing
Capital Repayment
23
This presentation is not and does not constitute an offer, invitation, solicitation or recommendation to subscribe for, or purchase, any securities and neither this presentation nor anything contained in it shall form the basis of, or be relied on in connection with any contract or commitment or investment decision.
This presentation has been prepared solely for use at this presentation. By your continued attendance at this presentation, you are deemed to have agreed and confirmed to Telekom Malaysia Berhad (the “Company”) that: (a) you agree not to trade in any securities of the Company or its respective affiliates until the public disclosure of the information contained herein; and (b) you agree to maintain absolute confidentiality regarding the information disclosed in this presentation until the public disclosure of such information, or unless you have been otherwise notified by the Company.
Reliance should not be placed on the information or opinions contained in this presentation or on its completeness. This presentation does not take into consideration the investment objectives, financial situation or particular needs of any particular investor. No representation or warranty, express or implied, is made as to the fairness, accuracy, completeness or correctness of the information, opinions and conclusions contained in this presentation. None of the Company and its affiliates and related bodies corporate, and their respective officers, directors, employees and agents disclaim any liability (including, without limitation, any liability arising from fault or negligence) for any loss arising from any use of this presentation or its contents or otherwise arising in connection with it.
This presentation contains projections and “forward-looking statements” relating to the Company’s business and the sectors in which the Company operates. These forward-looking statements include statements relating to the Company’s performance. These statements reflect the current views of the Company with respect to future events and are subject to certain risks, uncertainties and assumptions. It is important to note that actual results could differ materially from those anticipated in these forward looking statements. The Company does not undertake to inform you of any matters or information which may come to light or be brought to the Company’s attention after the date hereof.
The forecasts and other forward-looking statements set out in this presentation are based on a number of estimates and assumptions that are subject to business, economic and competitive uncertainties and contingencies, with respect to future business decisions, which are subject to change and in many cases outside the control of the Company. The directors and officers of the Company believe that they have prepared the forecasts with due care and attention and consider all best estimates and assumptions when taken as a whole to be reasonable at the time of preparing the presentation. However, the Company’s forecasts presented in this presentation may vary from actual financial results, and these variations may be material and, accordingly, neither the Company nor its directors or officers can give any assurance that the forecast performance in the forecasts or any forward-looking statement contained in this presentation will be achieved. Details of the forecasts and the assumptions on which they are based are set out in the presentation.
This presentation may not be copied or otherwise reproduced without the written consent of the Company.
Disclaimer
25FY 2008 Results Briefing