pembentukan modal tetap kasar gross fixed capital … · penerbitan ini julung kali dikeluarkan...
TRANSCRIPT
MALAYSIA
PEMBENTUKAN MODAL TETAP KASAR GROSS FIXED CAPITAL FORMATION
JABATAN PERANGKAAN MALAYSIA DEPARTMENT OF STATISTICS, MALAYSIA

i
KATA PENGANTAR
Penerbitan ini julung kali dikeluarkan oleh Jabatan Perangkaan Malaysia bagi
menyediakan data Pembentukan Modal Tetap Kasar (PMTK) dengan ciri-ciri
terperinci. Siri masa yang dibentangkan adalah bagi tempoh 2005-2012. Data ini
menjadi rujukan penting bagi menunjukkan potensi pertumbuhan ekonomi
Malaysia.
Menyedari kepentingan data PMTK dalam merangka dasar strategik, Jabatan
mengambil langkah untuk menerbitkan PMTK secara tahunan mengikut jenis
aktiviti ekonomi, jenis aset dan sektor awam & swasta. Penyusunan anggaran ini
adalah berdasarkan saranan Sistem Akaun Negara 1993 dan 2008 oleh
Pertubuhan Bangsa-Bangsa Bersatu.
Ringkasan penemuan dan jadual perangkaan dibentangkan pada bahagian
pertama dan kedua penerbitan ini. Nota teknikal, metodologi dan sumber data
turut disediakan bagi memudahkan pemahaman yang lebih mendalam mengenai
perangkaan ini.
Saya ingin merakamkan setinggi-tinggi penghargaan kepada semua pihak yang
terlibat dalam menjayakan penerbitan ini. Sebarang cadangan dan pandangan ke
arah menambah baik penerbitan ini pada masa hadapan amatlah dihargai.
Dr. Hj. Abdul Rahman bin Hasan Ketua Perangkawan Malaysia Jun 2013
ii
PREFACE
This publication is the first attempt by the Department of Statistics, Malaysia to
provide data on Gross Fixed Capital Formation (GFCF) by detailed characteristics.
The time series presented is for the period of 2005-2012. These data serve as an
essential reference to indicate the potential growth of the Malaysia's economy.
In recognising the importance of GFCF data in formulating strategic policies, the
Department endeavoured to publish GFCF annually by kind of economic activities,
type of assets and public & private sectors. The compilation of these estimates is
based on the recommendations of System of National Accounts 1993 and 2008 of
the United Nations.
The summary of findings and statistical tables are presented in the first and
second parts of this publication. The technical notes, methodology and data
sources are also provided to facilitate greater understanding of these statistics.
I would like to express my sincere appreciation to all parties concerned in
materialising this publication. All comments and suggestions towards improving
future publications would be greatly appreciated.
Dr. Hj. Abdul Rahman bin Hasan Chief Statistician Malaysia June 2013
iii
KANDUNGAN
CONTENTS
Muka Surat Page
i - ii iii - vi 1 - 7 1
3 5 6
9 - 31
9
10 11
12
Kata Pengantar Preface
Kandungan Contents
Ringkasan Penemuan Summary Findings
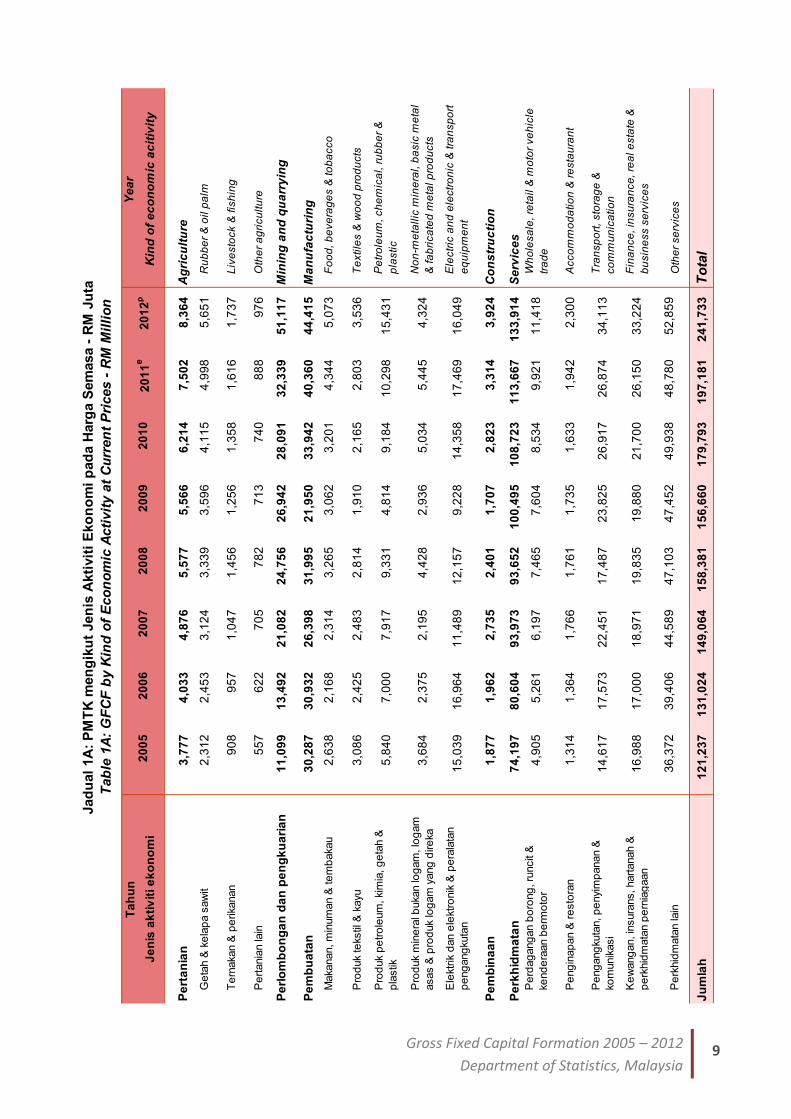
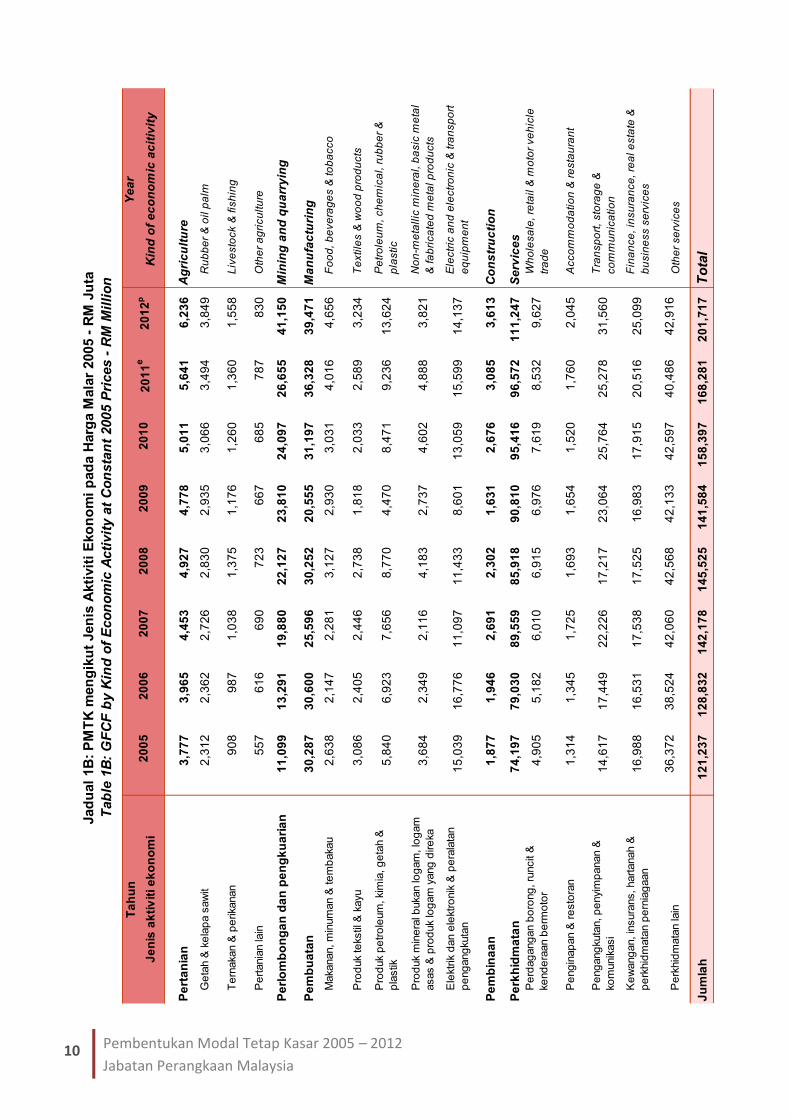
Prestasi Pembentukan Modal Tetap Kasar Performance of Gross Fixed Capital Formation PMTK mengikut Jenis Aktiviti Ekonomi GFCF by Kind of Economic Activity PMTK mengikut Jenis Aset GFCF by Type of Assets PMTK mengikut Sektor GFCF by Sector Jadual Tables PMTK mengikut Jenis Aktiviti Ekonomi pada Harga Semasa - RM Juta GFCF by Kind of Economic Activity at Current Prices - RM Million PMTK mengikut Jenis Aktiviti Ekonomi pada Harga Malar 2005 - RM Juta GFCF by Kind of Economic Activity at Constant 2005 Prices - RM Million
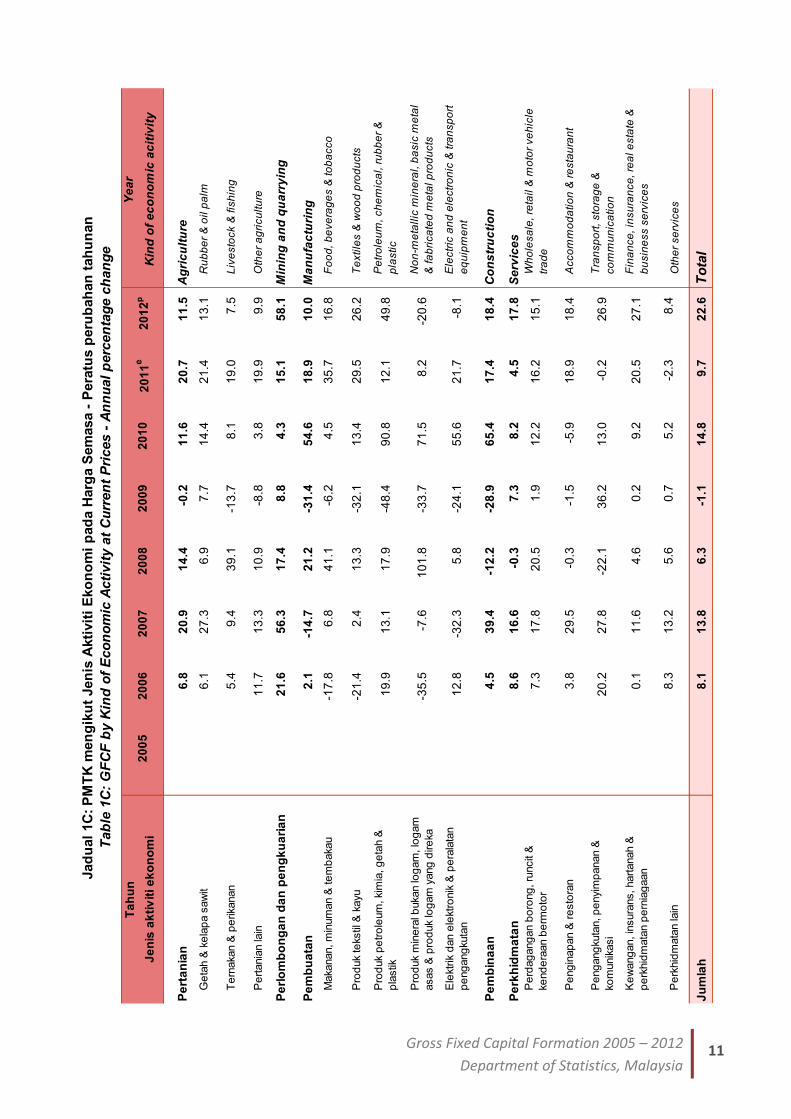
PMTK mengikut Jenis Aktiviti Ekonomi pada Harga Semasa - Peratus perubahan tahunan GFCF by Kind of Economic Activity at Current Prices - Annual percentage change
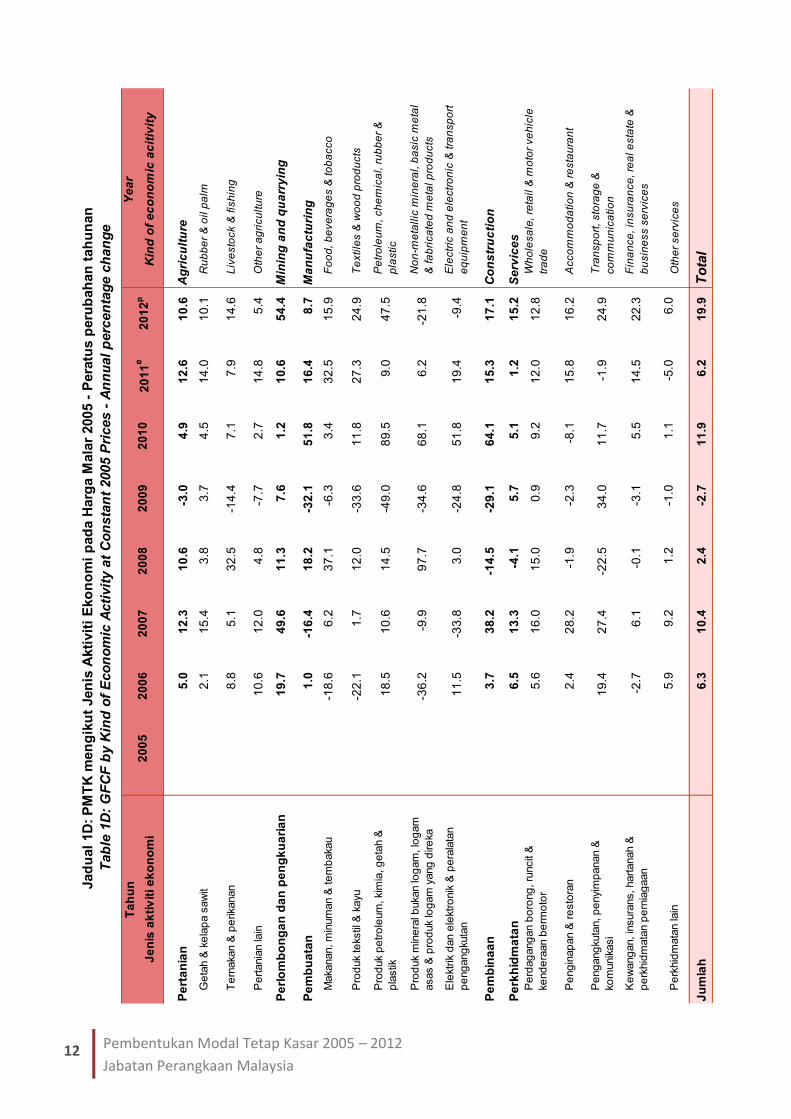
PMTK mengikut Jenis Aktiviti Ekonomi pada Harga Malar 2005 - Peratus perubahan tahunan GFCF by Kind of Economic Activity at Constant 2005 Prices - Annual percentage change
KANDUNGAN CONTENTS
iv
Muka Surat Page
13
14 15
16
17 18
19
20 21
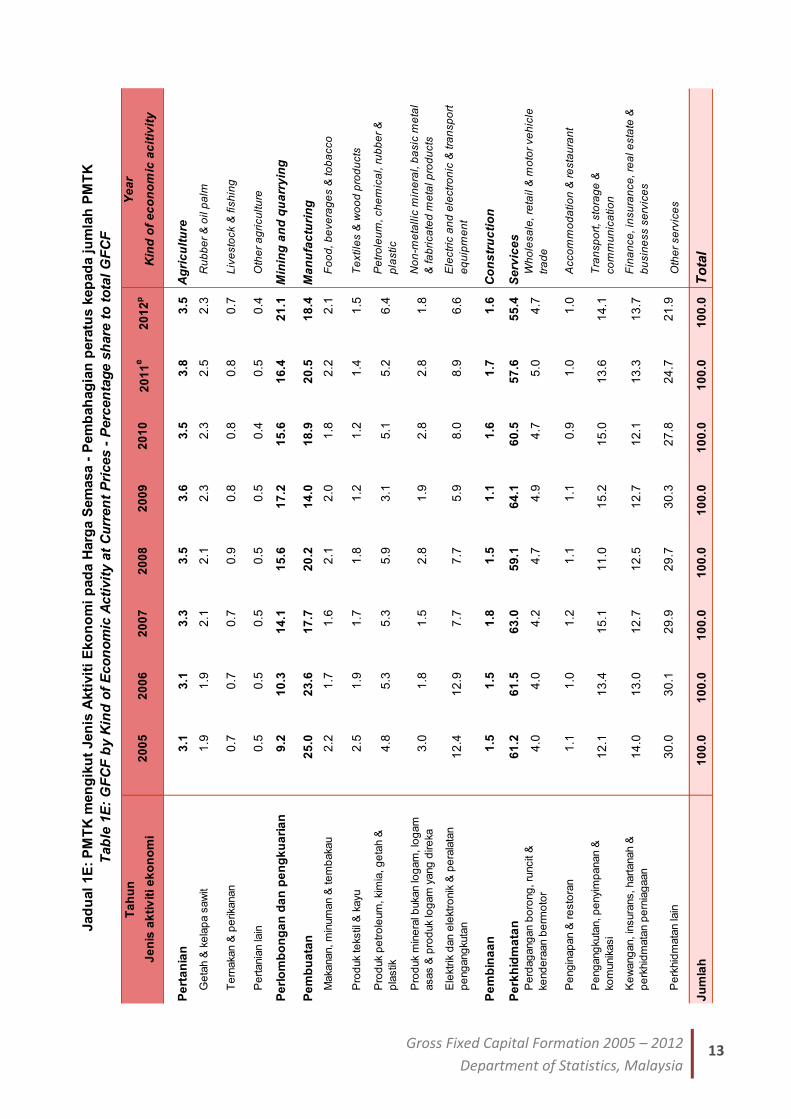
PMTK mengikut Jenis Aktiviti Ekonomi pada Harga Semasa - Pembahagian peratus kepada jumlah PMTK GFCF by Kind of Economic Activity at Current Prices - Percentage share to total GFCF
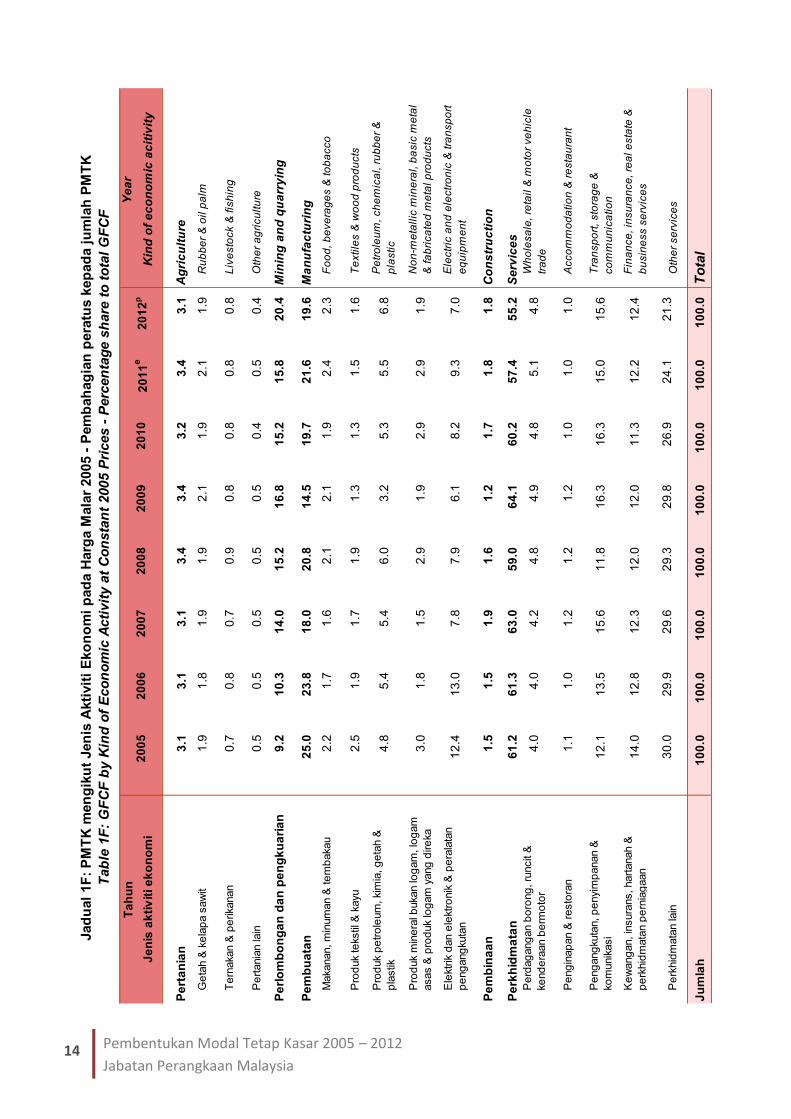
PMTK mengikut Jenis Aktiviti Ekonomi pada Harga Malar 2005 - Pembahagian peratus kepada jumlah PMTK GFCF by Kind of Economic Activity at Constant 2005 Prices - Percentage share to total GFCF
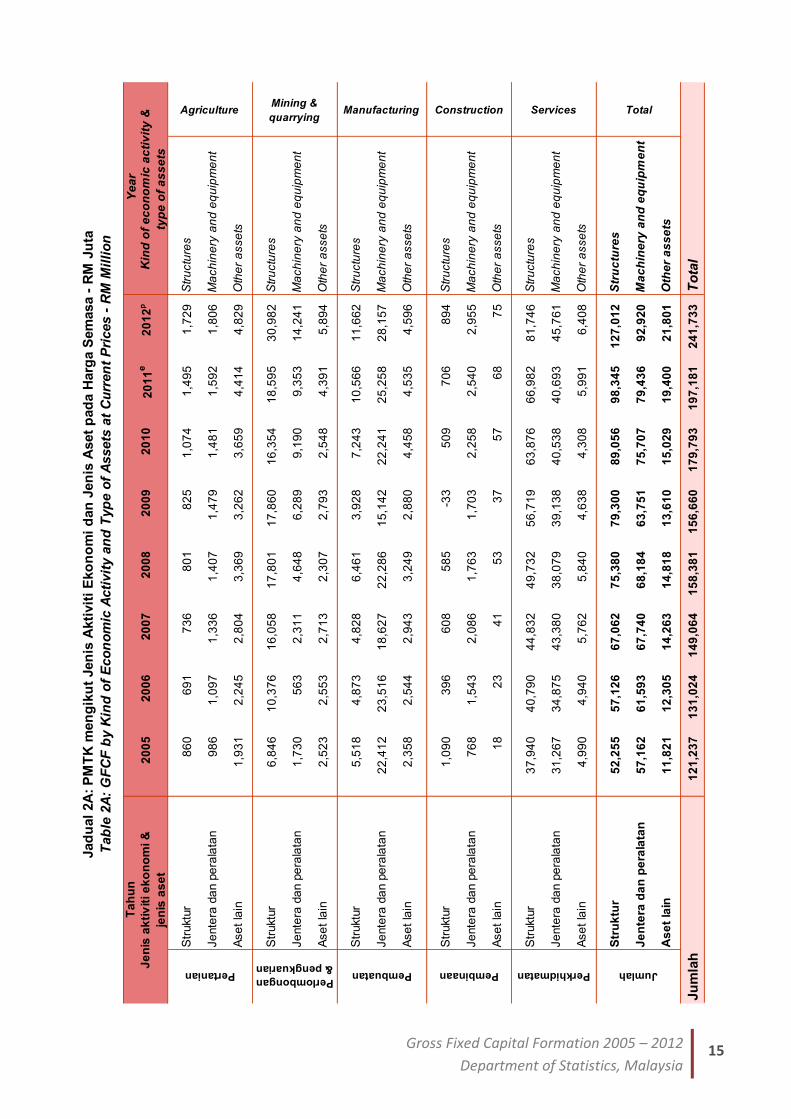
PMTK mengikut Jenis Aktiviti Ekonomi dan Jenis Aset pada Harga Semasa - RM Juta GFCF by Kind of Economic Activity and Type of Assets at Current Prices - RM Million
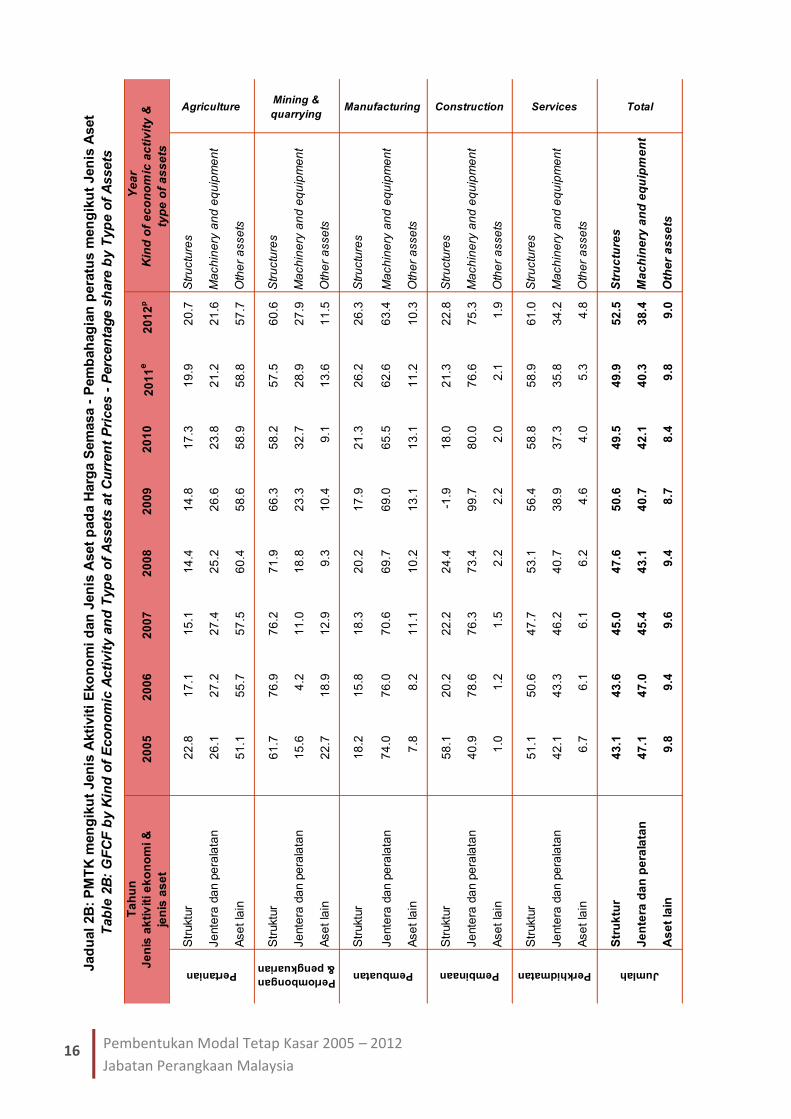
PMTK mengikut Jenis Aktiviti Ekonomi dan Jenis Aset pada Harga Semasa - Pembahagian peratus mengikut Jenis Aset GFCF by Kind of Economic Activity and Type of Assets at Current Prices - Percentage share by Type of Assets
PMTK mengikut Sektor dan Jenis Aktiviti Ekonomi pada Harga Semasa - RM Juta GFCF by Sector and Kind of Economic Activity at Current Prices - RM Million
PMTK mengikut Sektor dan Jenis Aktiviti Ekonomi pada Harga Malar 2005 - RM Juta GFCF by Sector and Kind of Economic Activity at Constant 2005 Prices - RM Million
PMTK mengikut Sektor dan Jenis Aktiviti Ekonomi pada Harga Semasa - Peratus perubahan tahunan GFCF by Sector and Kind of Economic Activity at Current Prices - Annual percentage change
PMTK mengikut Sektor dan Jenis Aktiviti Ekonomi pada Harga Malar 2005 - Peratus perubahan tahunan GFCF by Sector and Kind of Economic Activity at Constant 2005 Prices - Annual percentage change
PMTK mengikut Sektor dan Jenis Aktiviti Ekonomi pada Harga Semasa - Pembahagian peratus kepada jumlah PMTK GFCF by Sector and Kind of Economic Activity at Current Prices - Percentage share to total GFCF
v
KANDUNGAN
CONTENTS
Muka Surat Page
22
23 24 25 26 27 28 29
29 30
PMTK mengikut Sektor dan Jenis Aktiviti Ekonomi pada Harga Malar 2005 - Pembahagian peratus kepada jumlah PMTK GFCF by Sector and Kind of Economic Activity at Constant 2005 Prices - Percentage share to total GFCF PMTK mengikut Jenis Aktiviti Ekonomi dan Sektor pada Harga Semasa - Pembahagian peratus kepada Jenis Aktiviti Ekonomi
GFCF by Kind of Economic Activity and Sector at Current Prices - Percentage share to Kind of Economic Activity
PMTK mengikut Jenis Aktiviti Ekonomi dan Sektor pada Harga Malar 2005 - Pembahagian peratus kepada Jenis Aktiviti Ekonomi GFCF by Kind of Economic Activity and Sector at Constant 2005 Prices - Percentage share to Kind of Economic Activity
PMTK Sektor Swasta mengikut Jenis Aktiviti Ekonomi dan Jenis Aset pada Harga Semasa - RM Juta
Private Sector GFCF by Kind of Economic Activity and Type of Assets at Current Prices - RM Million
PMTK Sektor Awam mengikut Jenis Aktiviti Ekonomi dan Jenis Aset pada Harga Semasa - RM Juta Public Sector GFCF by Kind of Economic Activity and Type of Assets at Current Prices - RM Million
PMTK Sektor Swasta mengikut Jenis Aktiviti Ekonomi dan Jenis Aset pada Harga Semasa - Pembahagian peratus mengikut Jenis Aset Private Sector GFCF by Kind of Economic Activity and Type of Assets at Current Prices - Percentage share by Type of Assets
PMTK Sektor Awam mengikut Jenis Aktiviti Ekonomi dan Jenis Aset pada Harga Semasa - Pembahagian peratus mengikut Jenis Aset
Public Sector GFCF by Kind of Economic Activity and Type of Assets at Current Prices - Percentage share by Type of Assets
PMTK mengikut Jenis Aset Terperinci pada Harga Semasa - RM Juta
GFCF by Type of Detailed Assets at Current Prices - RM Million
PMTK mengikut Jenis Aset Terperinci pada Harga Malar 2005 - RM Juta
GFCF by Type of Detailed Assets at Constant 2005 Prices - RM Million
PMTK mengikut Jenis Aset Terperinci pada Harga Semasa - Peratus perubahan tahunan GFCF by Type of Detailed Assets at Current Prices - Annual percentage change
KANDUNGAN CONTENTS
vi
Muka Surat Page
30
31
31
33-48
49-54 49 51 54
PMTK mengikut Jenis Aset Terperinci pada Harga Malar 2005 - Peratus perubahan tahunan GFCF by Type of Detailed Assets at Constant 2005 Prices - Annual percentage change
PMTK mengikut Jenis Aset Terperinci pada Harga Semasa - Pembahagian peratus kepada jumlah PMTK GFCF by Type of Detailed Assets at Current Prices - Percentage share to total GFCF
PMTK mengikut Jenis Aset Terperinci pada Harga Malar 2005 - Pembahagian peratus kepada jumlah PMTK
GFCF by Type of Detailed Assets at Constant 2005 Prices - Percentage share to total GFCF
Nota Teknikal Technical Notes Metodologi & Sumber Data Methodology & Data Sources Metodologi Methodology
Sumber Data Data Sources
Simbol & Singkatan Symbols & Abbreviations
RINGKASAN PENEMUAN
SUMMARY FINDINGS

RINGKASAN PENEMUAN SUMMARY FINDINGS
1 Gross Fixed Capital Formation 2005 – 2012
Department of Statistics, Malaysia
PENGENALAN INTRODUCTION
PERFORMANCE OF GROSS FIXED CAPITAL FORMATION
PRESTASI PEMBENTUKAN MODAL TETAP KASAR
This report provides information on
Gross Fixed Capital Formation (GFCF)
which is used as a proxy of investment.
The data is presented by kind of
economic activities, by type of assets
and public & private sectors for year
2005 to 2012. Data were compiled at
current prices and constant 2005
prices.
Laporan ini memberikan maklumat
mengenai Pembentukan Modal Tetap
Kasar (PMTK) yang digunakan sebagai
proksi pelaburan. Data dibentangkan
mengikut jenis aktiviti ekonomi, jenis aset
dan sektor awam & swasta bagi tahun
2005 hingga 2012. Penyusunan data
adalah pada harga semasa dan harga
malar 2005.
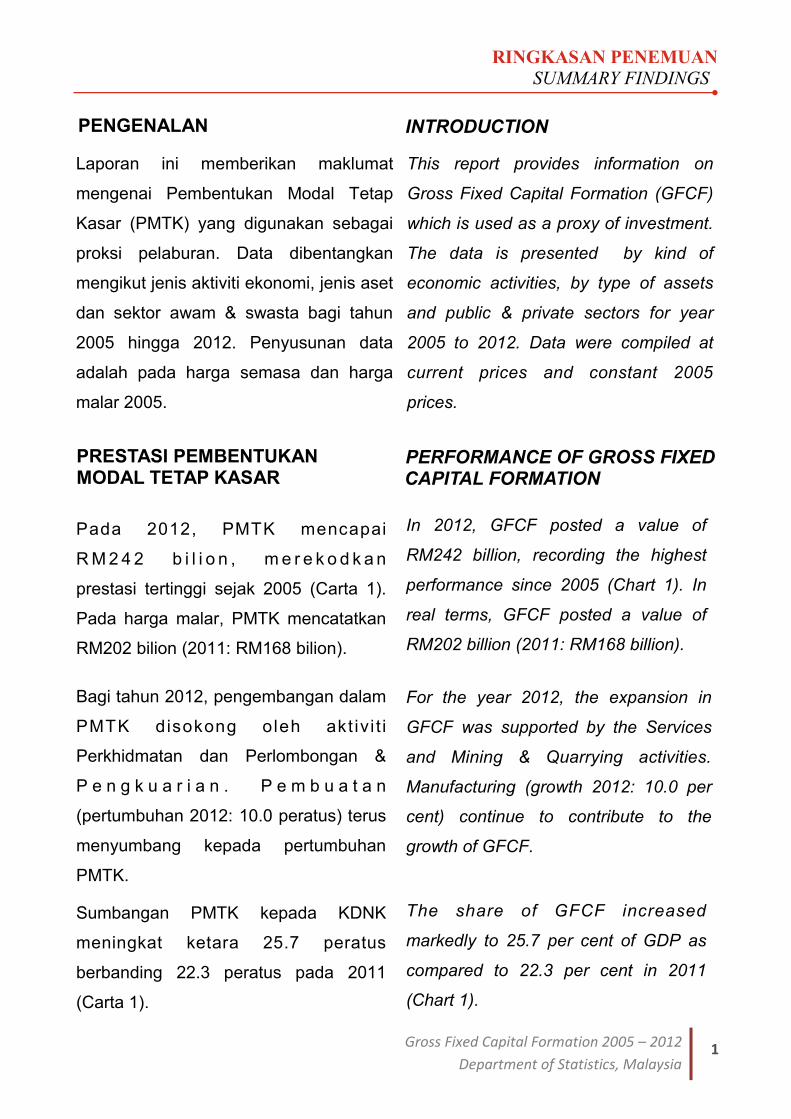
Pada 2012, PMTK mencapai
R M 2 4 2 b i l i o n , m e r e k o d k a n
prestasi tertinggi sejak 2005 (Carta 1).
Pada harga malar, PMTK mencatatkan
RM202 bilion (2011: RM168 bilion).
Bagi tahun 2012, pengembangan dalam
PMTK disokong oleh akt ivi t i
Perkhidmatan dan Perlombongan &
P e n g k u a r i a n . P e m b u a t a n
(pertumbuhan 2012: 10.0 peratus) terus
menyumbang kepada pertumbuhan
PMTK.
Sumbangan PMTK kepada KDNK
meningkat ketara 25.7 peratus
berbanding 22.3 peratus pada 2011
(Carta 1).
In 2012, GFCF posted a value of
RM242 billion, recording the highest
performance since 2005 (Chart 1). In
real terms, GFCF posted a value of
RM202 billion (2011: RM168 billion).
For the year 2012, the expansion in
GFCF was supported by the Services
and Mining & Quarrying activities.
Manufacturing (growth 2012: 10.0 per
cent) continue to contribute to the
growth of GFCF.
The share of GFCF increased
markedly to 25.7 per cent of GDP as
compared to 22.3 per cent in 2011
(Chart 1).
2
RINGKASAN PENEMUAN SUMMARY FINDINGS
Pembentukan Modal Tetap Kasar 2005 – 2012
Jabatan Perangkaan Malaysia
121.2 131.0149.1 158.4 156.7 179.8
197.2
241.7
543.6
596.8
665.3
769.9
712.9
797.3
884.5
941.2
-
200
400
600
800
1,000
2005 2006 2007 2008 2009 2010 2011 2012
RM BilionBillion
22.3% 22.0% 22.4% 20.6% 22.0% 22.5% 22.3% 25.7%
Carta 1/ Chart 1: KDNK dan PMTK pada Harga Semasa, 2005 – 2012
GDP and GFCF at Current Prices, 2005 – 2012
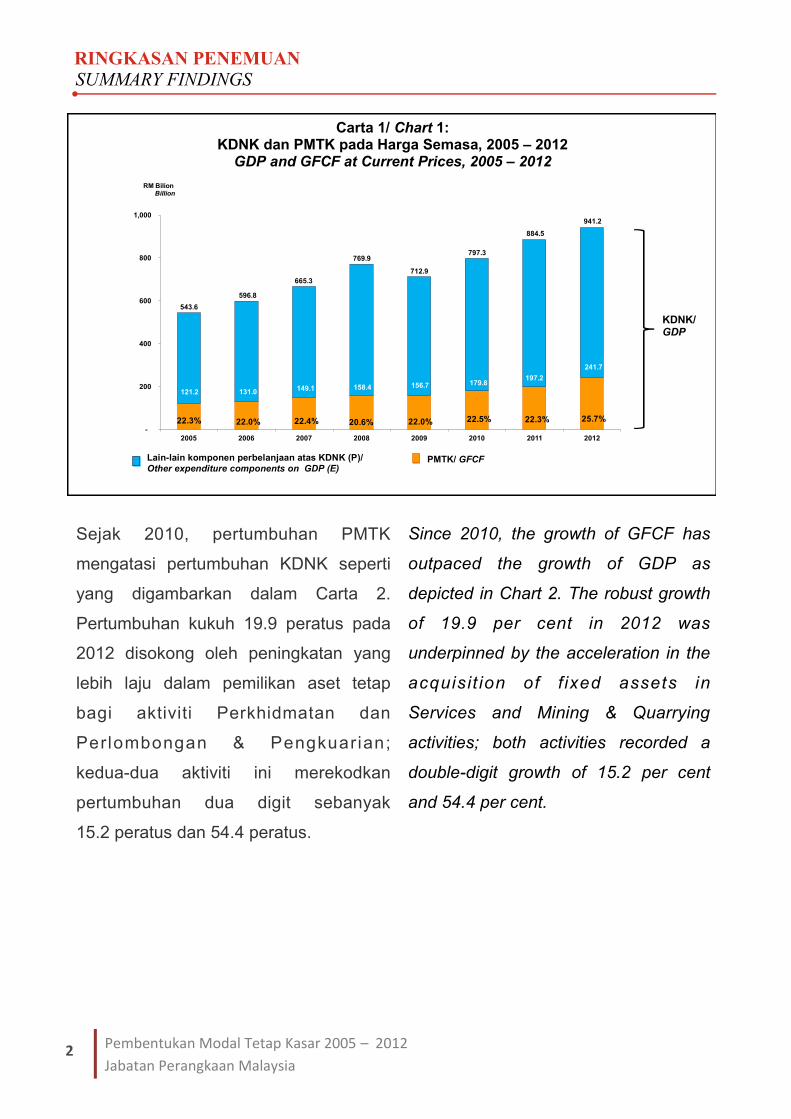
Sejak 2010, pertumbuhan PMTK
mengatasi pertumbuhan KDNK seperti
yang digambarkan dalam Carta 2.
Pertumbuhan kukuh 19.9 peratus pada
2012 disokong oleh peningkatan yang
lebih laju dalam pemilikan aset tetap
bagi aktiviti Perkhidmatan dan
Perlombongan & Pengkuarian;
kedua-dua aktiviti ini merekodkan
pertumbuhan dua digit sebanyak
15.2 peratus dan 54.4 peratus.
Since 2010, the growth of GFCF has
outpaced the growth of GDP as
depicted in Chart 2. The robust growth
of 19.9 per cent in 2012 was
underpinned by the acceleration in the
acquisit ion of f ixed assets in
Services and Mining & Quarrying
activities; both activities recorded a
double-digit growth of 15.2 per cent
and 54.4 per cent.
121.2 131.0149.1 158.4 156.7 179.8
197.2
241.7
543.6
596.8
665.3
769.9
712.9
797.3
884.5
941.2
-
200
400
600
800
1,000
2005 2006 2007 2008 2009 2010 2011 2012
RM BilionBillion
LAIN-LAIN KOMPONEN PERBELANJAAN KDNK (P)/ OTHER EXPENDITURE COMPONENTS OF GDP (E) PMTK/ GFCF
22.3% 22.0% 22.4% 20.6% 22.0% 22.5% 22.3%25.7%
Lain-lain komponen perbelanjaan atas KDNK (P)/
Other expenditure components on GDP (E)
121.2 131.0149.1 158.4 156.7 179.8
197.2
241.7
543.6
596.8
665.3
769.9
712.9
797.3
884.5
941.2
-
200
400
600
800
1,000
2005 2006 2007 2008 2009 2010 2011 2012
RM BilionBillion
LAIN-LAIN KOMPONEN PERBELANJAAN KDNK (P)/ OTHER EXPENDITURE COMPONENTS OF GDP (E) PMTK/ GFCF
22.3% 22.0% 22.4% 20.6% 22.0% 22.5% 22.3%25.7%
PMTK/ GFCF
KDNK/ GDP
RINGKASAN PENEMUAN SUMMARY FINDINGS
3 Gross Fixed Capital Formation 2005 – 2012
Department of Statistics, Malaysia
5.6 6.34.8
-1.5
7.45.1
5.6
6.3
10.4
2.4
-2.7
11.9
6.2
19.9
-5
0
5
10
15
20
25
2006 2007 2008 2009 2010 2011 2012
%
KDNK/ GDP PMTK/ GFCF
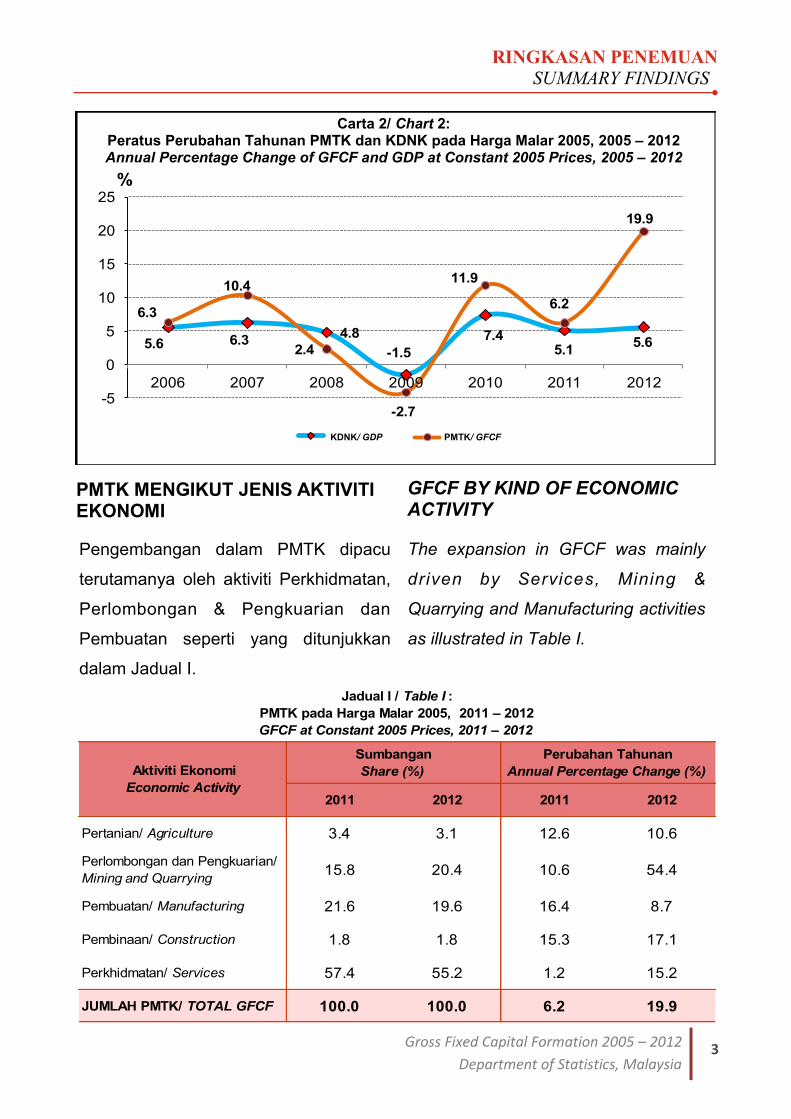
GFCF BY KIND OF ECONOMIC ACTIVITY
PMTK MENGIKUT JENIS AKTIVITI EKONOMI
The expansion in GFCF was mainly
driven by Services, Mining &
Quarrying and Manufacturing activities
as illustrated in Table I.
Pengembangan dalam PMTK dipacu
terutamanya oleh aktiviti Perkhidmatan,
Perlombongan & Pengkuarian dan
Pembuatan seperti yang ditunjukkan
dalam Jadual I.
Carta 2/ Chart 2: Peratus Perubahan Tahunan PMTK dan KDNK pada Harga Malar 2005, 2005 – 2012 Annual Percentage Change of GFCF and GDP at Constant 2005 Prices, 2005 – 2012
2011 2012 2011 2012
Pertanian/ Agriculture 3.4 3.1 12.6 10.6
Perlombongan dan Pengkuarian/
Mining and Quarrying15.8 20.4 10.6 54.4
Pembuatan/ Manufacturing 21.6 19.6 16.4 8.7
Pembinaan/ Construction 1.8 1.8 15.3 17.1
Perkhidmatan/ Services 57.4 55.2 1.2 15.2
JUMLAH PMTK/ TOTAL GFCF 100.0 100.0 6.2 19.9
Sumbangan
Share (%)
Perubahan Tahunan
Annual Percentage Change (%) Aktiviti Ekonomi
Economic Activity
Jadual I / Table I :
PMTK pada Harga Malar 2005, 2011 – 2012
GFCF at Constant 2005 Prices, 2011 – 2012
5.6 6.34.8
-1.5
7.45.1
5.6
6.3
10.4
2.4
-2.7
11.9
6.2
19.9
-5
0
5
10
15
20
25
2006 2007 2008 2009 2010 2011 2012
%
KDNK/ GDP PMTK/ GFCFKDNK/ GDP
5.6 6.34.8
-1.5
7.45.1
5.6
6.3
10.4
2.4
-2.7
11.9
6.2
19.9
-5
0
5
10
15
20
25
2006 2007 2008 2009 2010 2011 2012
%
KDNK/ GDP PMTK/ GFCFPMTK/ GFCF
4
RINGKASAN PENEMUAN SUMMARY FINDINGS
Pembentukan Modal Tetap Kasar 2005 – 2012
Jabatan Perangkaan Malaysia
Services activity with a share of
55.2 per cent to GFCF rose sharply to
15.2 per cent against 1.2 per cent
in 2011. Transport, Storage &
Communication; Finance, Insurance,
Real Estate & Business Services and
Other Services sub-activities have
propelled the strong growth in
Services activity.
M e a n w h i l e , o i l a n d g a s
activities have boosted the Mining &
Quarrying activity to record an
exceptional growth of 54.4 per cent
as compared to 10.6 per cent in 2011.
In terms of contribution to GFCF, this
activity continued to expand by
posting 20.4 per cent of share during
2012.
The main catalyst of GFCF in
Manufacturing activity was Petroleum,
Chemical, Rubber and Plastic products
which grew by 47.5 per cent.
The GFCF in Agriculture and
Construction activities continued to
register a double-digit growth of
10.6 per cent and 17.1 per cent in
2012.
A k t i v i t i P e r k h i d m a t a n y a n g
menyumbang 55.2 peratus kepada
PMTK meningkat ketara kepada
15.2 peratus berbanding 1.2 peratus
pada 2011. Pertumbuhan kukuh dalam
a k t i v i t i P e r k h i d m a t a n t e l a h
disumbangkan oleh sub aktivit i
Pengangkutan, Penyimpanan &
Komunikasi; Kewangan, Insurans,
Hartanah & Perkhidmatan Perniagaan
dan Lain-lain Perkhidmatan.
Sementara itu, aktiviti minyak dan gas
t e l a h m e n i n g k a t k a n a k t i v i t i
Perlombongan & Pengkuarian dengan
merekodkan pertumbuhan luar biasa
54.4 peratus berbanding 10.6 peratus
pada 2011. Dari segi sumbangan
kepada PMTK, aktiviti ini terus
berkembang dengan sumbangan
2 0 . 4 p e r a t u s p a d a 2 0 1 2 .
Pemangkin utama PMTK bagi aktiviti
Pembuatan adalah produk Petroleum,
Kimia, Getah dan Plastik yang
tumbuh sebanyak 47.5 peratus.
PMTK dalam aktiviti Pertanian dan
Pembinaan te rus menca ta tkan
pertumbuhan dua digit sebanyak
10.6 peratus dan 17.1 peratus pada
2012.
RINGKASAN PENEMUAN SUMMARY FINDINGS
5 Gross Fixed Capital Formation 2005 – 2012
Department of Statistics, Malaysia
Peralatan ICT dan lain-lain jentera & peralatan/ ICT equipment and other machinery & equipment
46.9%
13.5%
27.1%
1.5%9.4%
1.6%
45.0%
12.9%
28.6%
1.7% 9.7%
2.1%
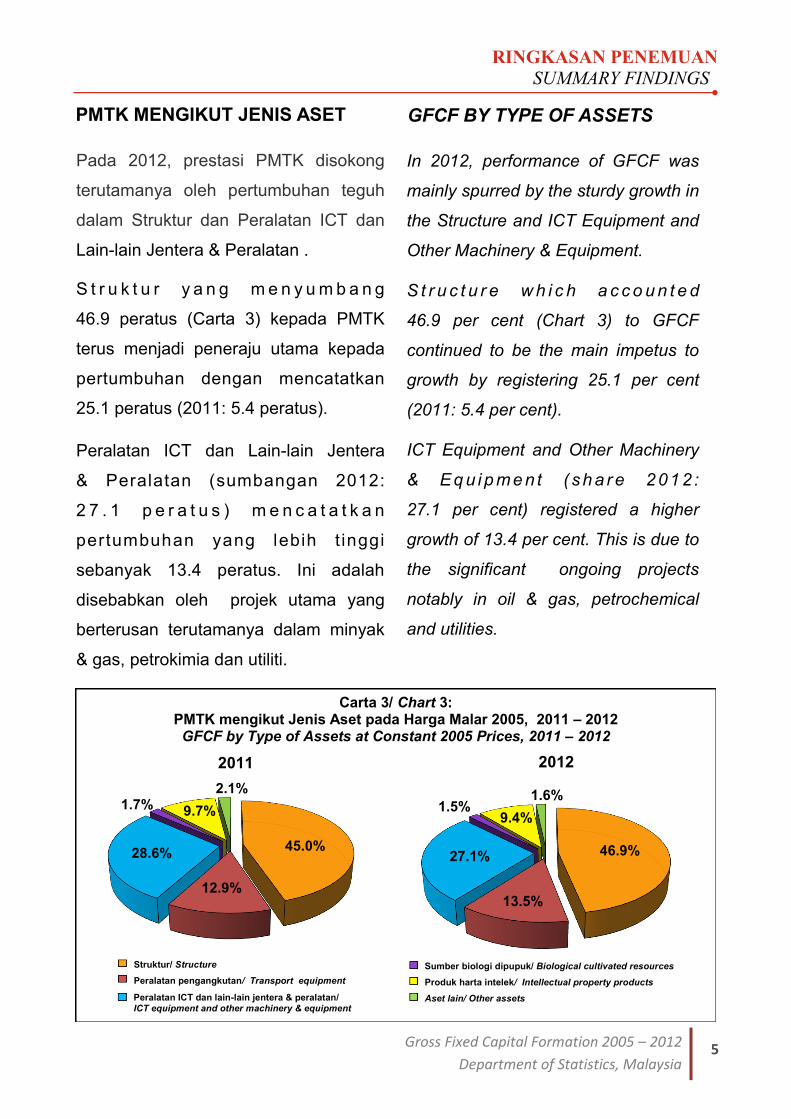
PMTK MENGIKUT JENIS ASET GFCF BY TYPE OF ASSETS
Pada 2012, prestasi PMTK disokong
terutamanya oleh pertumbuhan teguh
dalam Struktur dan Peralatan ICT dan
Lain-lain Jentera & Peralatan .
S t r u k t u r y a n g m e n y u m b a n g
46.9 peratus (Carta 3) kepada PMTK
terus menjadi peneraju utama kepada
pertumbuhan dengan mencatatkan
25.1 peratus (2011: 5.4 peratus).
Peralatan ICT dan Lain-lain Jentera
& Peralatan (sumbangan 2012:
2 7 . 1 p e r a t u s ) m e n c a t a t k a n
pertumbuhan yang lebih t inggi
sebanyak 13.4 peratus. Ini adalah
disebabkan oleh projek utama yang
berterusan terutamanya dalam minyak
& gas, petrokimia dan utiliti.
In 2012, performance of GFCF was
mainly spurred by the sturdy growth in
the Structure and ICT Equipment and
Other Machinery & Equipment.
S t r u c t u r e w h i c h a c c o u n t e d
46.9 per cent (Chart 3) to GFCF
continued to be the main impetus to
growth by registering 25.1 per cent
(2011: 5.4 per cent).
ICT Equipment and Other Machinery
& Eq u i p me n t ( sh a r e 2 01 2 :
27.1 per cent) registered a higher
growth of 13.4 per cent. This is due to
the significant ongoing projects
notably in oil & gas, petrochemical
and utilities.
Carta 3/ Chart 3: PMTK mengikut Jenis Aset pada Harga Malar 2005, 2011 – 2012
GFCF by Type of Assets at Constant 2005 Prices, 2011 – 2012
2011 2012
46.9%
13.5%
27.1%
1.5% 9.4%
1.6%
Struktur/ Structure
Peralatan Pengangkutan/ Transport Equipment
Peralatan ICT dan Jentera & peralatan lain/ ICT Equipment and Other Machinery & Equipment
Sumber Biologi Dipupuk/ Biological Cultivated Resources
Produk Harta Intelek/ Intellectual Property Products
Aset Lain/ Other Assets
Struktur/ Structure Peralatan pengangkutan/ Transport equipment
46.9%
13.5%
27.1%
1.5% 9.4%
1.6%
Struktur/ Structure
Peralatan Pengangkutan/ Transport Equipment
Peralatan ICT dan Jentera & peralatan lain/ ICT Equipment and Other Machinery & Equipment
Sumber Biologi Dipupuk/ Biological Cultivated
Resources
46.9%
13.5%
27.1%
1.5% 9.4%
1.6%
Struktur/ Structure
Peralatan Pengangkutan/ Transport Equipment
Peralatan ICT dan Jentera & peralatan lain/ ICT Equipment and Other Machinery & Equipment
Sumber Biologi Dipupuk/ Biological Cultivated Resources
Produk Harta Intelek/ Intellectual Property Products
Aset Lain/ Other Assets
Sumber biologi dipupuk/ Biological cultivated resources Produk harta intelek/ Intellectual property products Aset lain/ Other assets
6
RINGKASAN PENEMUAN SUMMARY FINDINGS
Pembentukan Modal Tetap Kasar 2005 – 2012
Jabatan Perangkaan Malaysia
-
10.0
20.0
30.0
40.0
50.0
60.0
2011 2012
57.0 57.9
43.0 42.1
%
Sektor Swasta/ Private Sector Sektor Awam/ Public SectorSektor swasta/ Private sector
-
10.0
20.0
30.0
40.0
50.0
60.0
2011 2012
57.0 57.9
43.0 42.1
%
Sektor Swasta/ Private Sector Sektor Awam/ Public SectorSektor awam/ Public sector
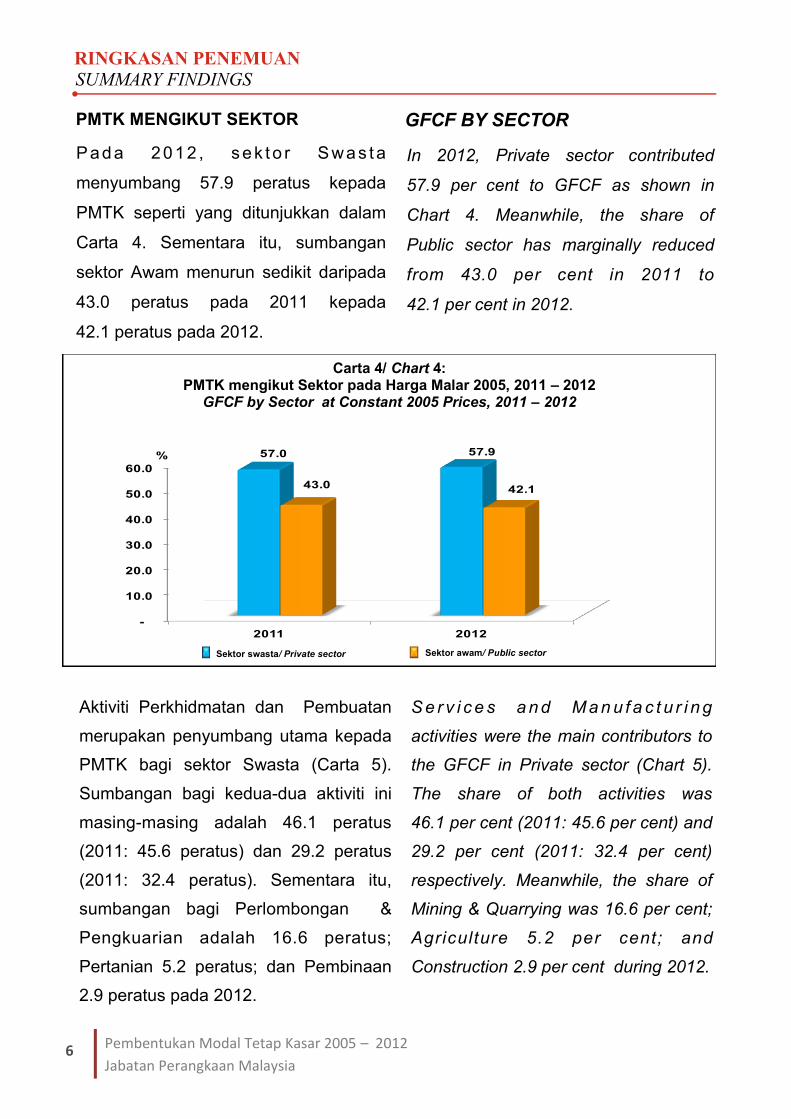
Pada 2012 , sek to r Swas ta
menyumbang 57.9 peratus kepada
PMTK seperti yang ditunjukkan dalam
Carta 4. Sementara itu, sumbangan
sektor Awam menurun sedikit daripada
43.0 peratus pada 2011 kepada
42.1 peratus pada 2012.
In 2012, Private sector contributed
57.9 per cent to GFCF as shown in
Chart 4. Meanwhile, the share of
Public sector has marginally reduced
from 43.0 per cent in 2011 to
42.1 per cent in 2012.
GFCF BY SECTOR PMTK MENGIKUT SEKTOR
Carta 4/ Chart 4: PMTK mengikut Sektor pada Harga Malar 2005, 2011 – 2012
GFCF by Sector at Constant 2005 Prices, 2011 – 2012
-
10.0
20.0
30.0
40.0
50.0
60.0
2011 2012
57.0 57.9
43.0 42.1
%
Sektor Swasta/ Private Sector Sektor Awam/ Public Sector
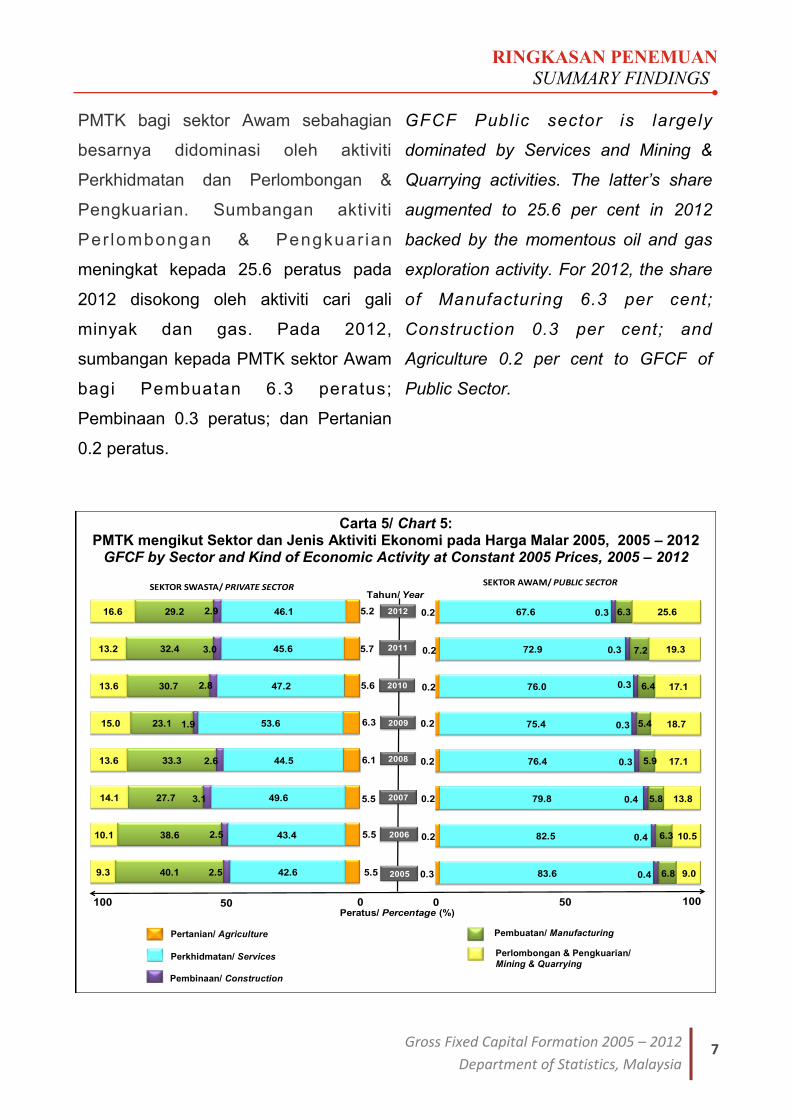
Aktiviti Perkhidmatan dan Pembuatan
merupakan penyumbang utama kepada
PMTK bagi sektor Swasta (Carta 5).
Sumbangan bagi kedua-dua aktiviti ini
masing-masing adalah 46.1 peratus
(2011: 45.6 peratus) dan 29.2 peratus
(2011: 32.4 peratus). Sementara itu,
sumbangan bagi Perlombongan &
Pengkuarian adalah 16.6 peratus;
Pertanian 5.2 peratus; dan Pembinaan
2.9 peratus pada 2012.
S e r v i c e s a n d M a n u f a c t u r i n g
activities were the main contributors to
the GFCF in Private sector (Chart 5).
The share of both activities was
46.1 per cent (2011: 45.6 per cent) and
29.2 per cent (2011: 32.4 per cent)
respectively. Meanwhile, the share of
Mining & Quarrying was 16.6 per cent;
Agriculture 5.2 per cent; and
Construction 2.9 per cent during 2012.
RINGKASAN PENEMUAN SUMMARY FINDINGS
7 Gross Fixed Capital Formation 2005 – 2012
Department of Statistics, Malaysia
0.3
0.2
0.2
0.2
0.2
0.2
0.2
0.2
83.6
82.5
79.8
76.4
75.4
76.0
72.9
67.6
0.4
0.4
0.4
0.3
0.3
0.3
0.3
0.3
6.8
6.3
5.8
5.9
5.4
6.4
7.2
6.3
9.0
10.5
13.8
17.1
18.7
17.1
19.3
25.6
SEKTOR AWAM/ PUBLIC SECTOR
9.3
10.1
14.1
13.6
15.0
13.6
13.2
16.6
40.1
38.6
27.7
33.3
23.1
30.7
32.4
29.2
2.5
2.5
3.1
2.6
1.9
2.8
3.0
2.9
42.6
43.4
49.6
44.5
53.6
47.2
45.6
46.1
5.5
5.5
5.5
6.1
6.3
5.6
5.7
5.2
SEKTOR SWASTA/ PRIVATE SECTOR
50100
2012
2011
2010
2009
2008
2007
2006
2005
Peratus/ Percentage (%)50 100
Tahun/ Year
00
GFCF Public sector is largely
dominated by Services and Mining &
Quarrying activities. The latter’s share
augmented to 25.6 per cent in 2012
backed by the momentous oil and gas
exploration activity. For 2012, the share
of Manufacturing 6.3 per cent;
Construction 0.3 per cent; and
Agriculture 0.2 per cent to GFCF of
Public Sector.
PMTK bagi sektor Awam sebahagian
besarnya didominasi oleh aktiviti
Perkhidmatan dan Perlombongan &
Pengkuarian. Sumbangan aktiviti
Per lombongan & Pengkuar ian
meningkat kepada 25.6 peratus pada
2012 disokong oleh aktiviti cari gali
minyak dan gas. Pada 2012,
sumbangan kepada PMTK sektor Awam
bagi Pembuatan 6.3 peratus;
Pembinaan 0.3 peratus; dan Pertanian
0.2 peratus.
Carta 5/ Chart 5: PMTK mengikut Sektor dan Jenis Aktiviti Ekonomi pada Harga Malar 2005, 2005 – 2012
GFCF by Sector and Kind of Economic Activity at Constant 2005 Prices, 2005 – 2012
5.5
5.5
5.5
6.1
6.3
5.6
5.7
5.2
42.6
43.4
49.6
44.5
53.6
47.2
45.6
46.1
2.5
2.5
3.1
2.6
1.9
2.8
3.0
2.9
40.1
38.6
27.7
33.3
23.1
30.7
32.4
29.2
9.3
10.1
14.1
13.6
15.0
13.6
13.2
16.6
SEKTOR SWASTA/ PRIVATE SECTOR
Pertanian/ Agriculture
Perkhidmatan/ Services
Pembinaan/ Construction
Pembuatan/ Manufacturing
Perlombongan & Pengkuarian/ Mining & Quarrying
5.5
5.5
5.5
6.1
6.3
5.6
5.7
5.2
42.6
43.4
49.6
44.5
53.6
47.2
45.6
46.1
2.5
2.5
3.1
2.6
1.9
2.8
3.0
2.9
40.1
38.6
27.7
33.3
23.1
30.7
32.4
29.2
9.3
10.1
14.1
13.6
15.0
13.6
13.2
16.6
SEKTOR SWASTA/ PRIVATE SECTOR
Pertanian/ Agriculture
Perkhidmatan/ Services
Pembinaan/ Construction
Pembuatan/ Manufacturing
Perlombongan & Pengkuarian/ Mining & Quarrying
Pertanian/ Agriculture
Perkhidmatan/ Services
Pembinaan/ Construction
Pembuatan/ Manufacturing
Perlombongan & Pengkuarian/ Mining & Quarrying

8 Pembentukan Modal Tetap Kasar 2005 – 2012
Jabatan Perangkaan Malaysia
Muka surat ini sengaja dibiarkan kosong
This page is deliberately left blank
JADUAL
TABLES

9 Gross Fixed Capital Formation 2005 – 2012
Department of Statistics, Malaysia
Pe
rta
nia
n3
,77
74
,03
34
,87
65
,57
75
,56
66
,21
47
,50
28
,36
4A
gri
cu
ltu
re
Ge
tah &
ke
lap
a s
aw
it2
,31
22
,45
33
,12
43
,33
93
,59
64
,11
54
,99
85
,65
1R
ub
be
r &
oil p
alm
Te
rnakan &
pe
rikanan
90
89
57
1,0
47
1,4
56
1,2
56
1,3
58
1,6
16
1,7
37
Liv
esto
ck &
fis
hin
g
Pe
rtania
n lain
55
76
22
70
57
82
71
37
40
88
89
76
Oth
er
ag
ricu
ltu
re
Pe
rlo
mb
on
ga
n d
an
pe
ng
ku
ari
an
11
,09
91
3,4
92
21
,08
22
4,7
56
26
,94
22
8,0
91
32
,33
95
1,1
17
Min
ing
an
d q
ua
rry
ing
Pe
mb
ua
tan
30
,28
73
0,9
32
26
,39
83
1,9
95
21
,95
03
3,9
42
40
,36
04
4,4
15
Ma
nu
fac
turi
ng
Makanan, m
inum
an &
te
mb
akau
2,6
38
2,1
68
2,3
14
3,2
65
3,0
62
3,2
01
4,3
44
5,0
73
Fo
od
, b
eve
rag
es &
to
ba
cco
Pro
duk te
kstil &
kayu
3,0
86
2,4
25
2,4
83
2,8
14
1,9
10
2,1
65
2,8
03
3,5
36
Te
xtile
s &
wo
od
pro
du
cts
Pro
duk p
etr
ole
um
, kim
ia, g
eta
h &
pla
stik
5,8
40
7,0
00
7,9
17
9,3
31
4,8
14
9,1
84
10
,29
81
5,4
31
Pe
tro
leu
m, ch
em
ica
l, r
ub
be
r &
pla
stic
pro
du
cts
Pro
duk m
ine
ral b
ukan lo
gam
, lo
gam
asas &
pro
duk lo
gam
yang
dire
ka
3,6
84
2,3
75
2,1
95
4,4
28
2,9
36
5,0
34
5,4
45
4,3
24
No
n-m
eta
llic
min
era
l, b
asic
me
tal
& fa
bri
ca
ted
me
tal p
rod
ucts
Ele
ktr
ik d
an e
lektr
onik
& p
era
lata
n
pe
ng
ang
kuta
n1
5,0
39
16
,96
41
1,4
89
12
,15
79
,22
81
4,3
58
17
,46
91
6,0
49
Ele
ctr
ic a
nd
ele
ctr
on
ic &
tra
nsp
ort
eq
uip
me
nt
Pe
mb
ina
an
1,8
77
1,9
62
2,7
35
2,4
01
1,7
07
2,8
23
3,3
14
3,9
24
Co
ns
tru
cti
on
Pe
rkh
idm
ata
n7
4,1
97
80
,60
49
3,9
73
93
,65
21
00
,49
51
08
,72
31
13
,66
71
33
,91
4S
erv
ice
s
Pe
rdag
ang
an b
oro
ng
, ru
ncit &
ke
nd
era
an b
erm
oto
r4
,90
55
,26
16
,19
77
,46
57
,60
48
,53
49
,92
11
1,4
18
Wh
ole
sa
le, re
tail &
mo
tor
ve
hic
le
tra
de
Pe
ng
inap
an &
re
sto
ran
1,3
14
1,3
64
1,7
66
1,7
61
1,7
35
1,6
33
1,9
42
2,3
00
Acco
mm
od
atio
n &
re
sta
ura
nt
Pe
ng
ang
kuta
n, p
enyim
panan &
ko
munik
asi
14
,61
71
7,5
73
22
,45
11
7,4
87
23
,82
52
6,9
17
26
,87
43
4,1
13
Tra
nsp
ort
, sto
rag
e &
co
mm
un
ica
tio
n
Ke
wang
an, in
sura
ns, hart
anah &
pe
rkhid
mata
n p
ern
iag
aan
16
,98
81
7,0
00
18
,97
11
9,8
35
19
,88
02
1,7
00
26
,15
03
3,2
24
Fin
an
ce
, in
su
ran
ce
, re
al e
sta
te &
bu
sin
ess s
erv
ice
s
Pe
rkhid
mata
n lain
36
,37
23
9,4
06
44
,58
94
7,1
03
47
,45
24
9,9
38
48
,78
05
2,8
59
Oth
er
se
rvic
es
Ju
mla
h1
21
,23
71
31
,02
41
49
,06
41
58
,38
11
56
,66
01
79
,79
31
97
,18
12
41
,73
3T
ota
l
Jad
ual
1A
: P
MT
K m
en
gik
ut
Jen
is A
kti
vit
i E
ko
no
mi
pad
a H
arg
a S
em
asa -
RM
Ju
ta
Tab
le 1
A:
GF
CF
by K
ind
of
Eco
no
mic
Acti
vit
y a
t C
urr
en
t P
rices -
RM
Mil
lio
n
Ta
hu
n2
00
52
00
62
00
72
00
82
00
92
01
02
01
1e
20
12
p Y
ea
r
Je
nis
ak
tiv
iti e
ko
no
mi
Kin
d o
f e
co
no
mic
ac
itiv
ity
10 Pembentukan Modal Tetap Kasar 2005 – 2012
Jabatan Perangkaan Malaysia
Pe
rta
nia
n3
,77
73
,96
54
,45
34
,92
74
,77
85
,01
15
,64
16
,23
6A
gri
cu
ltu
re
Ge
tah &
ke
lap
a s
aw
it2
,31
22
,36
22
,72
62
,83
02
,93
53
,06
63
,49
43
,84
9R
ub
be
r &
oil p
alm
Te
rnakan &
pe
rikanan
90
89
87
1,0
38
1,3
75
1,1
76
1,2
60
1,3
60
1,5
58
Liv
esto
ck &
fis
hin
g
Pe
rtania
n lain
55
76
16
69
07
23
66
76
85
78
78
30
Oth
er
ag
ricu
ltu
re
Pe
rlo
mb
on
ga
n d
an
pe
ng
ku
ari
an
11
,09
91
3,2
91
19
,88
02
2,1
27
23
,81
02
4,0
97
26
,65
54
1,1
50
Min
ing
an
d q
ua
rry
ing
Pe
mb
ua
tan
30
,28
73
0,6
00
25
,59
63
0,2
52
20
,55
53
1,1
97
36
,32
83
9,4
71
Ma
nu
fac
turi
ng
Makanan, m
inum
an &
te
mb
akau
2,6
38
2,1
47
2,2
81
3,1
27
2,9
30
3,0
31
4,0
16
4,6
56
Fo
od
, b
eve
rag
es &
to
ba
cco
Pro
duk te
kstil &
kayu
3,0
86
2,4
05
2,4
46
2,7
38
1,8
18
2,0
33
2,5
89
3,2
34
Te
xtile
s &
wo
od
pro
du
cts
Pro
duk p
etr
ole
um
, kim
ia, g
eta
h &
pla
stik
5,8
40
6,9
23
7,6
56
8,7
70
4,4
70
8,4
71
9,2
36
13
,62
4P
etr
ole
um
, ch
em
ica
l, r
ub
be
r &
pla
stic
pro
du
cts
Pro
duk m
ine
ral b
ukan lo
gam
, lo
gam
asas &
pro
duk lo
gam
yang
dire
ka
3,6
84
2,3
49
2,1
16
4,1
83
2,7
37
4,6
02
4,8
88
3,8
21
No
n-m
eta
llic
min
era
l, b
asic
me
tal
& fa
bri
ca
ted
me
tal p
rod
ucts
Ele
ktr
ik d
an e
lektr
onik
& p
era
lata
n
pe
ng
ang
kuta
n1
5,0
39
16
,77
61
1,0
97
11
,43
38
,60
11
3,0
59
15
,59
91
4,1
37
Ele
ctr
ic a
nd
ele
ctr
on
ic &
tra
nsp
ort
eq
uip
me
nt
Pe
mb
ina
an
1,8
77
1,9
46
2,6
91
2,3
02
1,6
31
2,6
76
3,0
85
3,6
13
Co
ns
tru
cti
on
Pe
rkh
idm
ata
n7
4,1
97
79
,03
08
9,5
59
85
,91
89
0,8
10
95
,41
69
6,5
72
11
1,2
47
Se
rvic
es
Pe
rdag
ang
an b
oro
ng
, ru
ncit &
ke
nd
era
an b
erm
oto
r4
,90
55
,18
26
,01
06
,91
56
,97
67
,61
98
,53
29
,62
7W
ho
lesa
le, re
tail &
mo
tor
ve
hic
le
tra
de
Pe
ng
inap
an &
re
sto
ran
1,3
14
1,3
45
1,7
25
1,6
93
1,6
54
1,5
20
1,7
60
2,0
45
Acco
mm
od
atio
n &
re
sta
ura
nt
Pe
ng
ang
kuta
n, p
enyim
panan &
ko
munik
asi
14
,61
71
7,4
49
22
,22
61
7,2
17
23
,06
42
5,7
64
25
,27
83
1,5
60
Tra
nsp
ort
, sto
rag
e &
co
mm
un
ica
tio
n
Ke
wang
an, in
sura
ns, hart
anah &
pe
rkhid
mata
n p
ern
iag
aan
16
,98
81
6,5
31
17
,53
81
7,5
25
16
,98
31
7,9
15
20
,51
62
5,0
99
Fin
an
ce
, in
su
ran
ce
, re
al e
sta
te &
bu
sin
ess s
erv
ice
s
Pe
rkhid
mata
n lain
36
,37
23
8,5
24
42
,06
04
2,5
68
42
,13
34
2,5
97
40
,48
64
2,9
16
Oth
er
se
rvic
es
Ju
mla
h1
21
,23
71
28
,83
21
42
,17
81
45
,52
51
41
,58
41
58
,39
71
68
,28
12
01
,71
7T
ota
l
Jad
ual
1B
: P
MT
K m
en
gik
ut
Jen
is A
kti
vit
i E
ko
no
mi
pad
a H
arg
a M
ala
r 2005 -
RM
Ju
ta
Tab
le 1
B:
GF
CF
by K
ind
of
Eco
no
mic
Acti
vit
y a
t C
on
sta
nt
2005 P
rices -
RM
Mil
lio
n
Ta
hu
n2
00
52
00
62
00
72
00
82
00
92
01
02
01
1e
20
12
p Y
ea
r
Je
nis
ak
tiv
iti e
ko
no
mi
Kin
d o
f e
co
no
mic
ac
itiv
ity
11 Gross Fixed Capital Formation 2005 – 2012
Department of Statistics, Malaysia
Pe
rta
nia
n6
.82
0.9
14
.4-0
.21
1.6
20
.71
1.5
Ag
ric
ult
ure
Ge
tah &
ke
lap
a s
aw
it6
.12
7.3
6.9
7.7
14
.42
1.4
13
.1R
ub
be
r &
oil p
alm
Te
rnakan &
pe
rikanan
5.4
9.4
39
.1-1
3.7
8.1
19
.07
.5L
ive
sto
ck &
fis
hin
g
Pe
rtania
n lain
11
.71
3.3
10
.9-8
.83
.81
9.9
9.9
Oth
er
ag
ricu
ltu
re
Pe
rlo
mb
on
ga
n d
an
pe
ng
ku
ari
an
21
.65
6.3
17
.48
.84
.31
5.1
58
.1M
inin
g a
nd
qu
arr
yin
g
Pe
mb
ua
tan
2.1
-14
.72
1.2
-31
.45
4.6
18
.91
0.0
Ma
nu
fac
turi
ng
Makanan, m
inum
an &
te
mb
akau
-17
.86
.84
1.1
-6.2
4.5
35
.71
6.8
Fo
od
, b
eve
rag
es &
to
ba
cco
Pro
duk te
kstil &
kayu
-21
.42
.41
3.3
-32
.11
3.4
29
.52
6.2
Te
xtile
s &
wo
od
pro
du
cts
Pro
duk p
etr
ole
um
, kim
ia, g
eta
h &
pla
stik
19
.91
3.1
17
.9-4
8.4
90
.81
2.1
49
.8P
etr
ole
um
, ch
em
ica
l, r
ub
be
r &
pla
stic
pro
du
cts
Pro
duk m
ine
ral b
ukan lo
gam
, lo
gam
asas &
pro
duk lo
gam
yang
dire
ka
-35
.5-7
.61
01
.8-3
3.7
71
.58
.2-2
0.6
No
n-m
eta
llic
min
era
l, b
asic
me
tal
& fa
bri
ca
ted
me
tal p
rod
ucts
Ele
ktr
ik d
an e
lektr
onik
& p
era
lata
n
pe
ng
ang
kuta
n1
2.8
-32
.35
.8-2
4.1
55
.62
1.7
-8.1
Ele
ctr
ic a
nd
ele
ctr
on
ic &
tra
nsp
ort
eq
uip
me
nt
Pe
mb
ina
an
4.5
39
.4-1
2.2
-28
.96
5.4
17
.41
8.4
Co
ns
tru
cti
on
Pe
rkh
idm
ata
n8
.61
6.6
-0.3
7.3
8.2
4.5
17
.8S
erv
ice
s
Pe
rdag
ang
an b
oro
ng
, ru
ncit &
ke
nd
era
an b
erm
oto
r7
.31
7.8
20
.51
.91
2.2
16
.21
5.1
Wh
ole
sa
le, re
tail &
mo
tor
ve
hic
le
tra
de
Pe
ng
inap
an &
re
sto
ran
3.8
29
.5-0
.3-1
.5-5
.91
8.9
18
.4A
cco
mm
od
atio
n &
re
sta
ura
nt
Pe
ng
ang
kuta
n, p
enyim
panan &
ko
munik
asi
20
.22
7.8
-22
.13
6.2
13
.0-0
.22
6.9
Tra
nsp
ort
, sto
rag
e &
co
mm
un
ica
tio
n
Ke
wang
an, in
sura
ns, hart
anah &
pe
rkhid
mata
n p
ern
iag
aan
0.1
11
.64
.60
.29
.22
0.5
27
.1F
ina
nce
, in
su
ran
ce
, re
al e
sta
te &
bu
sin
ess s
erv
ice
s
Pe
rkhid
mata
n lain
8.3
13
.25
.60
.75
.2-2
.38
.4 O
the
r se
rvic
es
Ju
mla
h8
.11
3.8
6.3
-1.1
14
.89
.72
2.6
To
tal
Jad
ual
1C
: P
MT
K m
en
gik
ut
Jen
is A
kti
vit
i E
ko
no
mi
pad
a H
arg
a S
em
asa -
Pera
tus p
eru
bah
an
tah
un
an
Tab
le 1
C:
GF
CF
by K
ind
of
Eco
no
mic
Acti
vit
y a
t C
urr
en
t P
rices -
An
nu
al
perc
en
tag
e c
han
ge
Ta
hu
n2
00
52
00
62
00
72
00
82
00
92
01
02
01
1e
20
12
p Y
ea
r
Je
nis
ak
tiv
iti e
ko
no
mi
Kin
d o
f e
co
no
mic
ac
itiv
ity
12 Pembentukan Modal Tetap Kasar 2005 – 2012
Jabatan Perangkaan Malaysia
Pe
rta
nia
n5
.01
2.3
10
.6-3
.04
.91
2.6
10
.6A
gri
cu
ltu
re
Ge
tah &
ke
lap
a s
aw
it2
.11
5.4
3.8
3.7
4.5
14
.01
0.1
Ru
bb
er
& o
il p
alm
Te
rnakan &
pe
rikanan
8.8
5.1
32
.5-1
4.4
7.1
7.9
14
.6L
ive
sto
ck &
fis
hin
g
Pe
rtania
n lain
10
.61
2.0
4.8
-7.7
2.7
14
.85
.4O
the
r a
gri
cu
ltu
re
Pe
rlo
mb
on
ga
n d
an
pe
ng
ku
ari
an
19
.74
9.6
11
.37
.61
.21
0.6
54
.4M
inin
g a
nd
qu
arr
yin
g
Pe
mb
ua
tan
1.0
-16
.41
8.2
-32
.15
1.8
16
.48
.7M
an
ufa
ctu
rin
g
Makanan, m
inum
an &
te
mb
akau
-18
.66
.23
7.1
-6.3
3.4
32
.51
5.9
Fo
od
, b
eve
rag
es &
to
ba
cco
Pro
duk te
kstil &
kayu
-22
.11
.71
2.0
-33
.61
1.8
27
.32
4.9
Te
xtile
s &
wo
od
pro
du
cts
Pro
duk p
etr
ole
um
, kim
ia, g
eta
h &
pla
stik
18
.51
0.6
14
.5-4
9.0
89
.59
.04
7.5
Pe
tro
leu
m, ch
em
ica
l, r
ub
be
r &
pla
stic
pro
du
cts
Pro
duk m
ine
ral b
ukan lo
gam
, lo
gam
asas &
pro
duk lo
gam
yang
dire
ka
-36
.2-9
.99
7.7
-34
.66
8.1
6.2
-21
.8N
on
-me
tallic
min
era
l, b
asic
me
tal
& fa
bri
ca
ted
me
tal p
rod
ucts
Ele
ktr
ik d
an e
lektr
onik
& p
era
lata
n
pe
ng
ang
kuta
n1
1.5
-33
.83
.0-2
4.8
51
.81
9.4
-9.4
Ele
ctr
ic a
nd
ele
ctr
on
ic &
tra
nsp
ort
eq
uip
me
nt
Pe
mb
ina
an
3.7
38
.2-1
4.5
-29
.16
4.1
15
.31
7.1
Co
ns
tru
cti
on
Pe
rkh
idm
ata
n6
.51
3.3
-4.1
5.7
5.1
1.2
15
.2S
erv
ice
s
Pe
rdag
ang
an b
oro
ng
, ru
ncit &
ke
nd
era
an b
erm
oto
r5
.61
6.0
15
.00
.99
.21
2.0
12
.8W
ho
lesa
le, re
tail &
mo
tor
ve
hic
le
tra
de
Pe
ng
inap
an &
re
sto
ran
2.4
28
.2-1
.9-2
.3-8
.11
5.8
16
.2A
cco
mm
od
atio
n &
re
sta
ura
nt
Pe
ng
ang
kuta
n, p
enyim
panan &
ko
munik
asi
19
.42
7.4
-22
.53
4.0
11
.7-1
.92
4.9
Tra
nsp
ort
, sto
rag
e &
co
mm
un
ica
tio
n
Ke
wang
an, in
sura
ns, hart
anah &
pe
rkhid
mata
n p
ern
iag
aan
-2.7
6.1
-0.1
-3.1
5.5
14
.52
2.3
Fin
an
ce
, in
su
ran
ce
, re
al e
sta
te &
bu
sin
ess s
erv
ice
s
Pe
rkhid
mata
n lain
5.9
9.2
1.2
-1.0
1.1
-5.0
6.0
Oth
er
se
rvic
es
Ju
mla
h6
.31
0.4
2.4
-2.7
11
.96
.21
9.9
To
tal
Jad
ual
1D
: P
MT
K m
en
gik
ut
Jen
is A
kti
vit
i E
ko
no
mi
pad
a H
arg
a M
ala
r 2005 -
Pera
tus p
eru
bah
an
tah
un
an
Tab
le 1
D:
GF
CF
by K
ind
of
Eco
no
mic
Acti
vit
y a
t C
on
sta
nt
2005 P
rices -
An
nu
al
perc
en
tag
e c
han
ge
Ta
hu
n2
00
52
00
62
00
72
00
82
00
92
01
02
01
1e
20
12
p Y
ea
r
Je
nis
ak
tiv
iti e
ko
no
mi
Kin
d o
f e
co
no
mic
ac
itiv
ity
13 Gross Fixed Capital Formation 2005 – 2012
Department of Statistics, Malaysia
Pe
rta
nia
n3
.13
.13
.33
.53
.63
.53
.83
.5A
gri
cu
ltu
re
Ge
tah &
ke
lap
a s
aw
it1
.91
.92
.12
.12
.32
.32
.52
.3R
ub
be
r &
oil p
alm
Te
rnakan &
pe
rikanan
0.7
0.7
0.7
0.9
0.8
0.8
0.8
0.7
Liv
esto
ck &
fis
hin
g
Pe
rtania
n lain
0.5
0.5
0.5
0.5
0.5
0.4
0.5
0.4
Oth
er
ag
ricu
ltu
re
Pe
rlo
mb
on
ga
n d
an
pe
ng
ku
ari
an
9.2
10
.31
4.1
15
.61
7.2
15
.61
6.4
21
.1M
inin
g a
nd
qu
arr
yin
g
Pe
mb
ua
tan
25
.02
3.6
17
.72
0.2
14
.01
8.9
20
.51
8.4
Ma
nu
fac
turi
ng
Makanan, m
inum
an &
te
mb
akau
2.2
1.7
1.6
2.1
2.0
1.8
2.2
2.1
Fo
od
, b
eve
rag
es &
to
ba
cco
Pro
duk te
kstil &
kayu
2.5
1.9
1.7
1.8
1.2
1.2
1.4
1.5
Te
xtile
s &
wo
od
pro
du
cts
Pro
duk p
etr
ole
um
, kim
ia, g
eta
h &
pla
stik
4.8
5.3
5.3
5.9
3.1
5.1
5.2
6.4
Pe
tro
leu
m, ch
em
ica
l, r
ub
be
r &
pla
stic
pro
du
cts
Pro
duk m
ine
ral b
ukan lo
gam
, lo
gam
asas &
pro
duk lo
gam
yang
dire
ka
3.0
1.8
1.5
2.8
1.9
2.8
2.8
1.8
No
n-m
eta
llic
min
era
l, b
asic
me
tal
& fa
bri
ca
ted
me
tal p
rod
ucts
Ele
ktr
ik d
an e
lektr
onik
& p
era
lata
n
pe
ng
ang
kuta
n1
2.4
12
.97
.77
.75
.98
.08
.96
.6E
lectr
ic a
nd
ele
ctr
on
ic &
tra
nsp
ort
eq
uip
me
nt
Pe
mb
ina
an
1.5
1.5
1.8
1.5
1.1
1.6
1.7
1.6
Co
ns
tru
cti
on
Pe
rkh
idm
ata
n6
1.2
61
.56
3.0
59
.16
4.1
60
.55
7.6
55
.4S
erv
ice
s
Pe
rdag
ang
an b
oro
ng
, ru
ncit &
ke
nd
era
an b
erm
oto
r4
.04
.04
.24
.74
.94
.75
.04
.7W
ho
lesa
le, re
tail &
mo
tor
ve
hic
le
tra
de
Pe
ng
inap
an &
re
sto
ran
1.1
1.0
1.2
1.1
1.1
0.9
1.0
1.0
Acco
mm
od
atio
n &
re
sta
ura
nt
Pe
ng
ang
kuta
n, p
enyim
panan &
ko
munik
asi
12
.11
3.4
15
.11
1.0
15
.21
5.0
13
.61
4.1
Tra
nsp
ort
, sto
rag
e &
co
mm
un
ica
tio
n
Ke
wang
an, in
sura
ns, hart
anah &
pe
rkhid
mata
n p
ern
iag
aan
14
.01
3.0
12
.71
2.5
12
.71
2.1
13
.31
3.7
Fin
an
ce
, in
su
ran
ce
, re
al e
sta
te &
bu
sin
ess s
erv
ice
s
Pe
rkhid
mata
n lain
30
.03
0.1
29
.92
9.7
30
.32
7.8
24
.72
1.9
Oth
er
se
rvic
es
Ju
mla
h1
00
.01
00
.01
00
.01
00
.01
00
.01
00
.01
00
.01
00
.0T
ota
l
Jad
ual
1E
: P
MT
K m
en
gik
ut
Jen
is A
kti
vit
i E
ko
no
mi
pad
a H
arg
a S
em
asa -
Pem
bah
ag
ian
pera
tus k
ep
ad
a j
um
lah
PM
TK
Tab
le 1
E:
GF
CF
by K
ind
of
Eco
no
mic
Acti
vit
y a
t C
urr
en
t P
rices -
Perc
en
tag
e s
hare
to
to
tal
GF
CF
Ta
hu
n2
00
52
00
62
00
72
00
82
00
92
01
02
01
1e
20
12
p Y
ea
r
Je
nis
ak
tiv
iti e
ko
no
mi
Kin
d o
f e
co
no
mic
ac
itiv
ity
14 Pembentukan Modal Tetap Kasar 2005 – 2012
Jabatan Perangkaan Malaysia
Pe
rta
nia
n3
.13
.13
.13
.43
.43
.23
.43
.1A
gri
cu
ltu
re
Ge
tah &
ke
lap
a s
aw
it1
.91
.81
.91
.92
.11
.92
.11
.9R
ub
be
r &
oil p
alm
Te
rnakan &
pe
rikanan
0.7
0.8
0.7
0.9
0.8
0.8
0.8
0.8
Liv
esto
ck &
fis
hin
g
Pe
rtania
n lain
0.5
0.5
0.5
0.5
0.5
0.4
0.5
0.4
Oth
er
ag
ricu
ltu
re
Pe
rlo
mb
on
ga
n d
an
pe
ng
ku
ari
an
9.2
10
.31
4.0
15
.21
6.8
15
.21
5.8
20
.4M
inin
g a
nd
qu
arr
yin
g
Pe
mb
ua
tan
25
.02
3.8
18
.02
0.8
14
.51
9.7
21
.61
9.6
Ma
nu
fac
turi
ng
Makanan, m
inum
an &
te
mb
akau
2.2
1.7
1.6
2.1
2.1
1.9
2.4
2.3
Fo
od
, b
eve
rag
es &
to
ba
cco
Pro
duk te
kstil &
kayu
2.5
1.9
1.7
1.9
1.3
1.3
1.5
1.6
Te
xtile
s &
wo
od
pro
du
cts
Pro
duk p
etr
ole
um
, kim
ia, g
eta
h &
pla
stik
4.8
5.4
5.4
6.0
3.2
5.3
5.5
6.8
Pe
tro
leu
m, ch
em
ica
l, r
ub
be
r &
pla
stic
pro
du
cts
Pro
duk m
ine
ral b
ukan lo
gam
, lo
gam
asas &
pro
duk lo
gam
yang
dire
ka
3.0
1.8
1.5
2.9
1.9
2.9
2.9
1.9
No
n-m
eta
llic
min
era
l, b
asic
me
tal
& fa
bri
ca
ted
me
tal p
rod
ucts
Ele
ktr
ik d
an e
lektr
onik
& p
era
lata
n
pe
ng
ang
kuta
n1
2.4
13
.07
.87
.96
.18
.29
.37
.0E
lectr
ic a
nd
ele
ctr
on
ic &
tra
nsp
ort
eq
uip
me
nt
Pe
mb
ina
an
1.5
1.5
1.9
1.6
1.2
1.7
1.8
1.8
Co
ns
tru
cti
on
Pe
rkh
idm
ata
n6
1.2
61
.36
3.0
59
.06
4.1
60
.25
7.4
55
.2S
erv
ice
s
Pe
rdag
ang
an b
oro
ng
, ru
ncit &
ke
nd
era
an b
erm
oto
r4
.04
.04
.24
.84
.94
.85
.14
.8W
ho
lesa
le, re
tail &
mo
tor
ve
hic
le
tra
de
Pe
ng
inap
an &
re
sto
ran
1.1
1.0
1.2
1.2
1.2
1.0
1.0
1.0
Acco
mm
od
atio
n &
re
sta
ura
nt
Pe
ng
ang
kuta
n, p
enyim
panan &
ko
munik
asi
12
.11
3.5
15
.61
1.8
16
.31
6.3
15
.01
5.6
Tra
nsp
ort
, sto
rag
e &
co
mm
un
ica
tio
n
Ke
wang
an, in
sura
ns, hart
anah &
pe
rkhid
mata
n p
ern
iag
aan
14
.01
2.8
12
.31
2.0
12
.01
1.3
12
.21
2.4
Fin
an
ce
, in
su
ran
ce
, re
al e
sta
te &
bu
sin
ess s
erv
ice
s
Pe
rkhid
mata
n lain
30
.02
9.9
29
.62
9.3
29
.82
6.9
24
.12
1.3
Oth
er
se
rvic
es
Ju
mla
h1
00
.01
00
.01
00
.01
00
.01
00
.01
00
.01
00
.01
00
.0
Je
nis
ak
tiv
iti e
ko
no
mi
Kin
d o
f e
co
no
mic
ac
itiv
ity
Jad
ual
1F
: P
MT
K m
en
gik
ut
Jen
is A
kti
vit
i E
ko
no
mi
pad
a H
arg
a M
ala
r 2005 -
Pem
bah
ag
ian
pera
tus k
ep
ad
a j
um
lah
PM
TK
Tab
le 1
F:
GF
CF
by K
ind
of
Eco
no
mic
Acti
vit
y a
t C
on
sta
nt
2005 P
rices -
Perc
en
tag
e s
hare
to
to
tal
GF
CF
Ta
hu
n2
00
52
00
62
00
72
00
82
00
9
To
tal
20
10
20
11
e2
01
2p
Ye
ar
15 Gross Fixed Capital Formation 2005 – 2012
Department of Statistics, Malaysia
Str
uktu
r8
60
69
17
36
80
18
25
1,0
74
1,4
95
1,7
29
Str
uctu
res
Je
nte
ra d
an p
era
lata
n9
86
1,0
97
1,3
36
1,4
07
1,4
79
1,4
81
1,5
92
1,8
06
Ma
ch
ine
ry a
nd
eq
uip
me
nt
Ase
t la
in1
,93
12
,24
52
,80
43
,36
93
,26
23
,65
94
,41
44
,82
9O
the
r a
sse
ts
Str
uktu
r6
,84
61
0,3
76
16
,05
81
7,8
01
17
,86
01
6,3
54
18
,59
53
0,9
82
Str
uctu
res
Je
nte
ra d
an p
era
lata
n1
,73
05
63
2,3
11
4,6
48
6,2
89
9,1
90
9,3
53
14
,24
1M
ach
ine
ry a
nd
eq
uip
me
nt
Ase
t la
in2
,52
32
,55
32
,71
32
,30
72
,79
32
,54
84
,39
15
,89
4O
the
r a
sse
ts
Str
uktu
r5
,51
84
,87
34
,82
86
,46
13
,92
87
,24
31
0,5
66
11
,66
2S
tru
ctu
res
Je
nte
ra d
an p
era
lata
n2
2,4
12
23
,51
61
8,6
27
22
,28
61
5,1
42
22
,24
12
5,2
58
28
,15
7M
ach
ine
ry a
nd
eq
uip
me
nt
Ase
t la
in2
,35
82
,54
42
,94
33
,24
92
,88
04
,45
84
,53
54
,59
6O
the
r a
sse
ts
Str
uktu
r1
,09
03
96
60
85
85
-33
50
97
06
89
4S
tru
ctu
res
Je
nte
ra d
an p
era
lata
n7
68
1,5
43
2,0
86
1,7
63
1,7
03
2,2
58
2,5
40
2,9
55
Ma
ch
ine
ry a
nd
eq
uip
me
nt
Ase
t la
in1
82
34
15
33
75
76
87
5O
the
r a
sse
ts
Str
uktu
r3
7,9
40
40
,79
04
4,8
32
49
,73
25
6,7
19
63
,87
66
6,9
82
81
,74
6S
tru
ctu
res
Je
nte
ra d
an p
era
lata
n3
1,2
67
34
,87
54
3,3
80
38
,07
93
9,1
38
40
,53
84
0,6
93
45
,76
1M
ach
ine
ry a
nd
eq
uip
me
nt
Ase
t la
in4
,99
04
,94
05
,76
25
,84
04
,63
84
,30
85
,99
16
,40
8O
the
r a
sse
ts
Str
uk
tur
52
,25
55
7,1
26
67
,06
27
5,3
80
79
,30
08
9,0
56
98
,34
51
27
,01
2S
tru
ctu
res
Je
nte
ra d
an
pe
rala
tan
57
,16
26
1,5
93
67
,74
06
8,1
84
63
,75
17
5,7
07
79
,43
69
2,9
20
Ma
ch
ine
ry a
nd
eq
uip
me
nt
As
et
lain
11
,82
11
2,3
05
14
,26
31
4,8
18
13
,61
01
5,0
29
19
,40
02
1,8
01
Oth
er
as
se
ts
12
1,2
37
13
1,0
24
14
9,0
64
15
8,3
81
15
6,6
60
17
9,7
93
19
7,1
81
24
1,7
33
Jad
ual
2A
: P
MT
K m
en
gik
ut
Jen
is A
kti
vit
i E
ko
no
mi
dan
Jen
is A
set
pad
a H
arg
a S
em
asa -
RM
Ju
ta
Tab
le 2
A:
GF
CF
by K
ind
of
Eco
no
mic
Acti
vit
y a
nd
Typ
e o
f A
ssets
at
Cu
rren
t P
rices -
RM
Mil
lio
n
Ta
hu
n
20
05
20
06
20
07
20
08
20
09
20
10
20
11
e2
01
2p
Ye
ar
J
en
is a
kti
vit
i e
ko
no
mi &
jen
is a
se
t
Kin
d o
f e
co
no
mic
ac
tiv
ity
&
typ
e o
f a
ss
ets
Pertanian
Agriculture
Perlombongan
& pengkuarian
Mining &
quarrying
Pembuatan
Manufacturing
Pembinaan
Construction
Perkhidmatan
Services
Jumlah
Total
Ju
mla
hT
ota
l
16 Pembentukan Modal Tetap Kasar 2005 – 2012
Jabatan Perangkaan Malaysia
Str
uktu
r2
2.8
17
.11
5.1
14
.41
4.8
17
.31
9.9
20
.7S
tru
ctu
res
Je
nte
ra d
an p
era
lata
n2
6.1
27
.22
7.4
25
.22
6.6
23
.82
1.2
21
.6M
ach
ine
ry a
nd
eq
uip
me
nt
Ase
t la
in5
1.1
55
.75
7.5
60
.45
8.6
58
.95
8.8
57
.7O
the
r a
sse
ts
Str
uktu
r6
1.7
76
.97
6.2
71
.96
6.3
58
.25
7.5
60
.6S
tru
ctu
res
Je
nte
ra d
an p
era
lata
n1
5.6
4.2
11
.01
8.8
23
.33
2.7
28
.92
7.9
Ma
ch
ine
ry a
nd
eq
uip
me
nt
Ase
t la
in2
2.7
18
.91
2.9
9.3
10
.49
.11
3.6
11
.5O
the
r a
sse
ts
Str
uktu
r1
8.2
15
.81
8.3
20
.21
7.9
21
.32
6.2
26
.3S
tru
ctu
res
Je
nte
ra d
an p
era
lata
n7
4.0
76
.07
0.6
69
.76
9.0
65
.56
2.6
63
.4M
ach
ine
ry a
nd
eq
uip
me
nt
Ase
t la
in7
.88
.21
1.1
10
.21
3.1
13
.11
1.2
10
.3O
the
r a
sse
ts
Str
uktu
r5
8.1
20
.22
2.2
24
.4-1
.91
8.0
21
.32
2.8
Str
uctu
res
Je
nte
ra d
an p
era
lata
n4
0.9
78
.67
6.3
73
.49
9.7
80
.07
6.6
75
.3M
ach
ine
ry a
nd
eq
uip
me
nt
Ase
t la
in1
.01
.21
.52
.22
.22
.02
.11
.9O
the
r a
sse
ts
Str
uktu
r5
1.1
50
.64
7.7
53
.15
6.4
58
.85
8.9
61
.0S
tru
ctu
res
Je
nte
ra d
an p
era
lata
n4
2.1
43
.34
6.2
40
.73
8.9
37
.33
5.8
34
.2M
ach
ine
ry a
nd
eq
uip
me
nt
Ase
t la
in6
.76
.16
.16
.24
.64
.05
.34
.8O
the
r a
sse
ts
Str
uk
tur
43
.14
3.6
45
.04
7.6
50
.64
9.5
49
.95
2.5
Str
uc
ture
s
Je
nte
ra d
an
pe
rala
tan
47
.14
7.0
45
.44
3.1
40
.74
2.1
40
.33
8.4
Ma
ch
ine
ry a
nd
eq
uip
me
nt
As
et
lain
9.8
9.4
9.6
9.4
8.7
8.4
9.8
9.0
Oth
er
as
se
ts
Jad
ual
2B
: P
MT
K m
en
gik
ut
Jen
is A
kti
vit
i E
ko
no
mi
dan
Jen
is A
set
pad
a H
arg
a S
em
asa -
Pem
bah
ag
ian
pera
tus m
en
gik
ut
Jen
is A
set
Tab
le 2
B:
GF
CF
by K
ind
of
Eco
no
mic
Acti
vit
y a
nd
Typ
e o
f A
ssets
at
Cu
rren
t P
rices -
Perc
en
tag
e s
hare
by T
yp
e o
f A
ssets
Ta
hu
n
20
05
20
06
20
07
20
08
20
09
20
10
20
11
e2
01
2p
Services
Ye
ar
J
en
is a
kti
vit
i e
ko
no
mi &
jen
is a
se
t
Kin
d o
f e
co
no
mic
ac
tiv
ity
&
typ
e o
f a
ss
ets
Pertanian
Agriculture
Perlombongan
& pengkuarian
Mining &
quarrying
Jumlah
Total
Pembuatan
Manufacturing
Pembinaan
Construction
Perkhidmatan
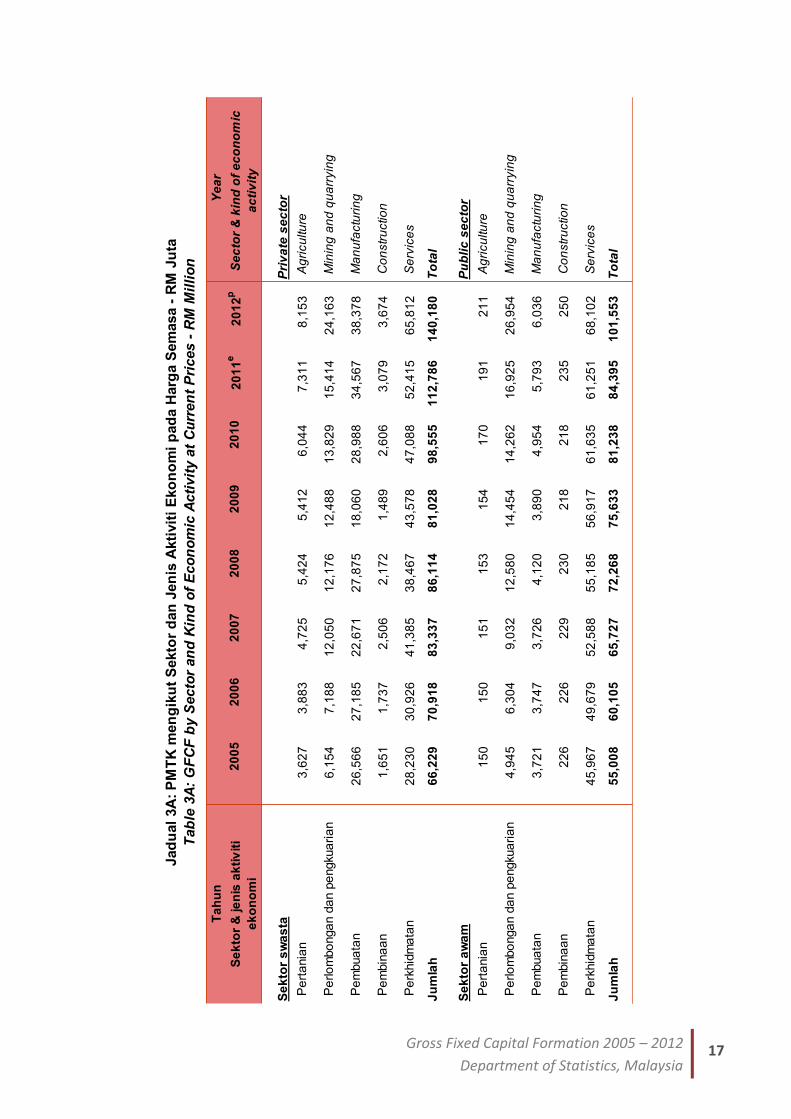
17 Gross Fixed Capital Formation 2005 – 2012
Department of Statistics, Malaysia
Se
kto
r s
wa
sta
Pri
va
te s
ec
tor
Pe
rta
nia
n3
,62
7
3,8
83
4
,72
5
5,4
24
5
,41
2
6,0
44
7
,31
1
8,1
53
A
gri
cu
ltu
re
Pe
rlo
mbo
nga
n d
an p
engkua
ria
n6
,15
4
7,1
88
1
2,0
50
12
,17
6
1
2,4
88
13
,82
9
1
5,4
14
24
,16
3
M
inin
g a
nd
qu
arr
yin
g
Pe
mbua
tan
26
,56
6
2
7,1
85
22
,67
1
2
7,8
75
18
,06
0
2
8,9
88
34
,56
7
3
8,3
78
Ma
nu
factu
rin
g
Pe
mbin
aa
n1
,65
1
1,7
37
2
,50
6
2,1
72
1
,48
9
2,6
06
3
,07
9
3,6
74
C
on
str
uctio
n
Pe
rkhid
ma
tan
28
,23
0
3
0,9
26
41
,38
5
3
8,4
67
43
,57
8
4
7,0
88
52
,41
5
6
5,8
12
Se
rvic
es
Ju
mla
h6
6,2
29
70
,91
8
8
3,3
37
86
,11
4
8
1,0
28
98
,55
5
1
12
,78
6
14
0,1
80
T
ota
l
Se
kto
r a
wa
mP
ub
lic
se
cto
r
Pe
rta
nia
n1
50
1
50
1
51
1
53
1
54
1
70
1
91
2
11
A
gri
cu
ltu
re
Pe
rlo
mbo
nga
n d
an p
engkua
ria
n4
,94
5
6,3
04
9
,03
2
12
,58
0
1
4,4
54
14
,26
2
1
6,9
25
26
,95
4
M
inin
g a
nd
qu
arr
yin
g
Pe
mbua
tan
3,7
21
3
,74
7
3,7
26
4
,12
0
3,8
90
4
,95
4
5,7
93
6
,03
6
Ma
nu
factu
rin
g
Pe
mbin
aa
n2
26
2
26
2
29
2
30
2
18
2
18
2
35
2
50
C
on
str
uctio
n
Pe
rkhid
ma
tan
45
,96
7
4
9,6
79
52
,58
8
5
5,1
85
56
,91
7
6
1,6
35
61
,25
1
6
8,1
02
Se
rvic
es
Ju
mla
h5
5,0
08
60
,10
5
6
5,7
27
72
,26
8
7
5,6
33
81
,23
8
8
4,3
95
10
1,5
53
T
ota
l
Se
kto
r &
je
nis
ak
tiv
iti
ek
on
om
i
Se
cto
r &
kin
d o
f e
co
no
mic
ac
tiv
ity
Jad
ual
3A
: P
MT
K m
en
gik
ut
Sekto
r d
an
Jen
is A
kti
vit
i E
ko
no
mi
pad
a H
arg
a S
em
asa -
RM
Ju
ta
Tab
le 3
A:
GF
CF
by S
ecto
r an
d K
ind
of
Eco
no
mic
Acti
vit
y a
t C
urr
en
t P
rices -
RM
Mil
lio
n
Ta
hu
n
20
05
20
06
20
07
20
08
20
09
20
10
20
11
e2
01
2p
Ye
ar
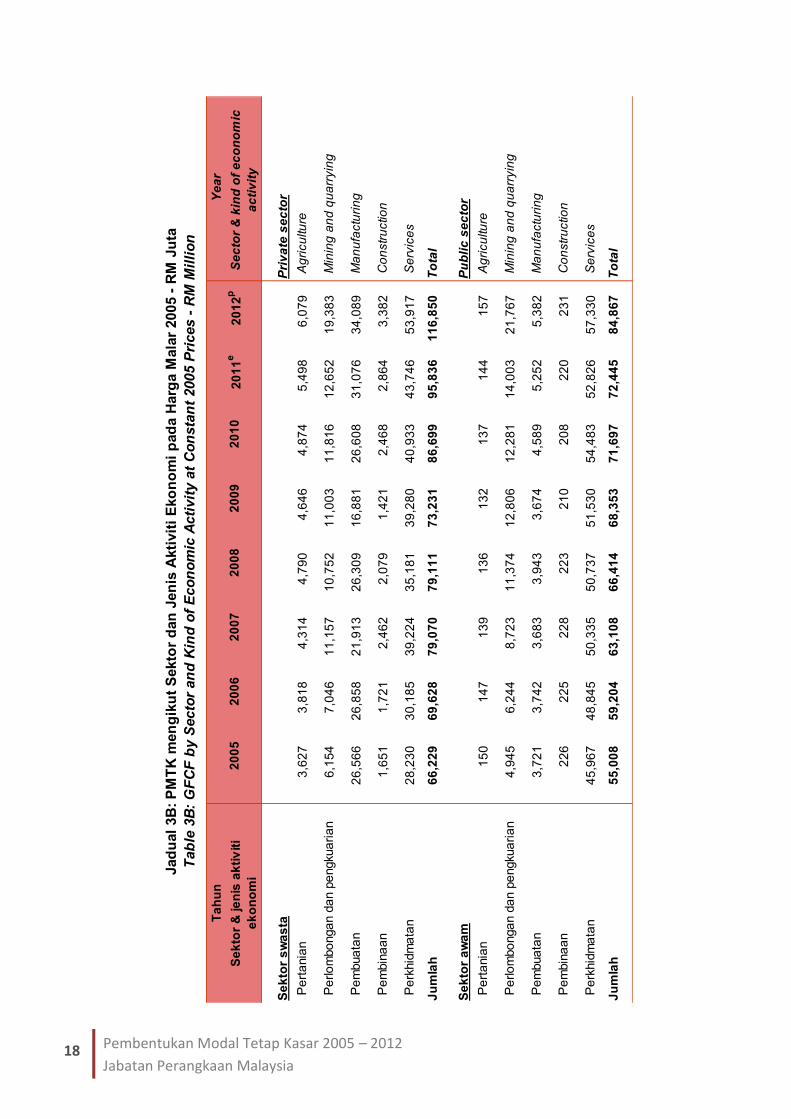
18 Pembentukan Modal Tetap Kasar 2005 – 2012
Jabatan Perangkaan Malaysia
Se
kto
r s
wa
sta
Pri
va
te s
ec
tor
Pe
rta
nia
n3
,62
7
3,8
18
4
,31
4
4,7
90
4
,64
6
4,8
74
5
,49
8
6,0
79
A
gri
cu
ltu
re
Pe
rlo
mbo
nga
n d
an p
engkua
ria
n6
,15
4
7,0
46
1
1,1
57
10
,75
2
1
1,0
03
11
,81
6
1
2,6
52
19
,38
3
M
inin
g a
nd
qu
arr
yin
g
Pe
mbua
tan
26
,56
6
2
6,8
58
21
,91
3
2
6,3
09
16
,88
1
2
6,6
08
31
,07
6
3
4,0
89
Ma
nu
factu
rin
g
Pe
mbin
aa
n1
,65
1
1,7
21
2
,46
2
2,0
79
1
,42
1
2,4
68
2
,86
4
3,3
82
C
on
str
uctio
n
Pe
rkhid
ma
tan
28
,23
0
3
0,1
85
39
,22
4
3
5,1
81
39
,28
0
4
0,9
33
43
,74
6
5
3,9
17
Se
rvic
es
Ju
mla
h6
6,2
29
69
,62
8
7
9,0
70
79
,11
1
7
3,2
31
86
,69
9
9
5,8
36
11
6,8
50
T
ota
l
Se
kto
r a
wa
mP
ub
lic
se
cto
r
Pe
rta
nia
n1
50
1
47
1
39
1
36
1
32
1
37
1
44
1
57
A
gri
cu
ltu
re
Pe
rlo
mbo
nga
n d
an p
engkua
ria
n4
,94
5
6,2
44
8
,72
3
11
,37
4
1
2,8
06
12
,28
1
1
4,0
03
21
,76
7
M
inin
g a
nd
qu
arr
yin
g
Pe
mbua
tan
3,7
21
3
,74
2
3,6
83
3
,94
3
3,6
74
4
,58
9
5,2
52
5
,38
2
Ma
nu
factu
rin
g
Pe
mbin
aa
n2
26
2
25
2
28
2
23
2
10
2
08
2
20
2
31
C
on
str
uctio
n
Pe
rkhid
ma
tan
45
,96
7
4
8,8
45
50
,33
5
5
0,7
37
51
,53
0
5
4,4
83
52
,82
6
5
7,3
30
Se
rvic
es
Ju
mla
h5
5,0
08
59
,20
4
6
3,1
08
66
,41
4
6
8,3
53
71
,69
7
7
2,4
45
84
,86
7
T
ota
l
20
10
20
11
e2
01
2p
Ye
ar
Se
kto
r &
je
nis
ak
tiv
iti
ek
on
om
i
Se
cto
r &
kin
d o
f e
co
no
mic
ac
tiv
ity
Ta
hu
n
20
05
20
06
20
07
20
08
20
09
Jad
ual
3B
: P
MT
K m
en
gik
ut
Sekto
r d
an
Jen
is A
kti
vit
i E
ko
no
mi
pad
a H
arg
a M
ala
r 2005 -
RM
Ju
ta
Tab
le 3
B:
GF
CF
by S
ecto
r an
d K
ind
of
Eco
no
mic
Acti
vit
y a
t C
on
sta
nt
2005 P
rices -
RM
Mil
lio
n
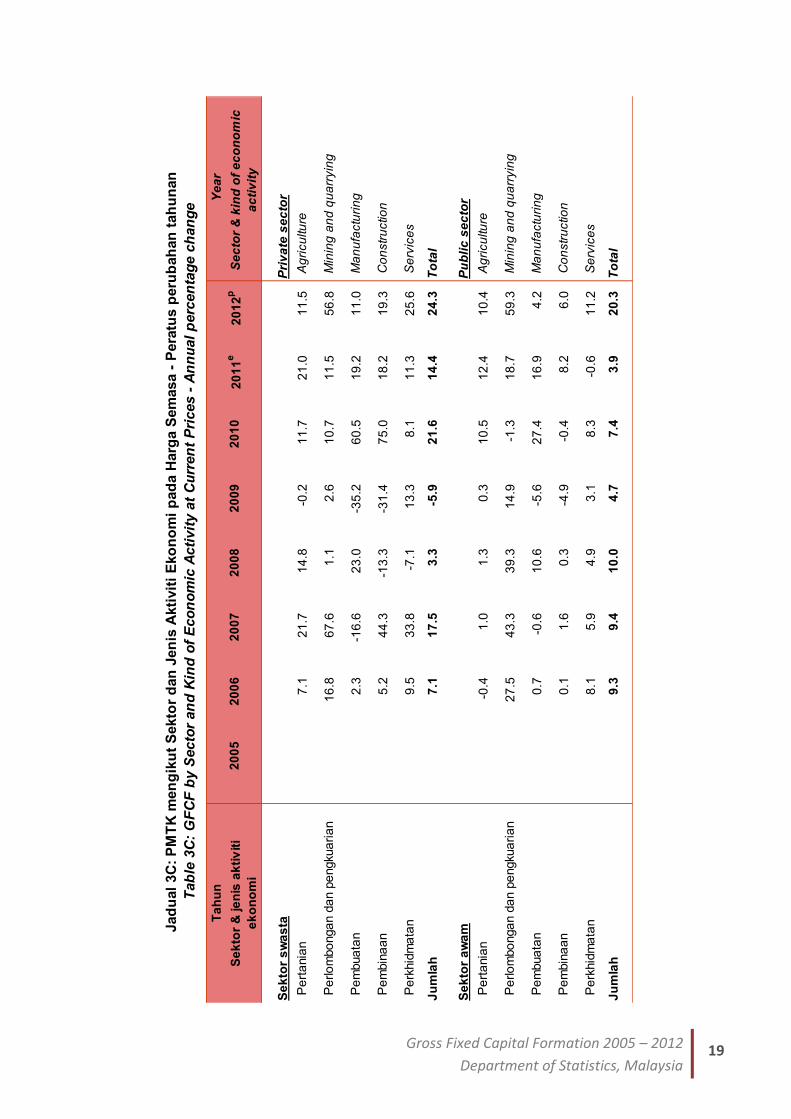
19 Gross Fixed Capital Formation 2005 – 2012
Department of Statistics, Malaysia
Se
kto
r s
wa
sta
Pri
va
te s
ec
tor
Pe
rta
nia
n7
.12
1.7
14
.8-0
.21
1.7
21
.01
1.5
Ag
ricu
ltu
re
Pe
rlo
mbo
nga
n d
an p
engkua
ria
n1
6.8
67
.61
.12
.61
0.7
11
.55
6.8
Min
ing
an
d q
ua
rryin
g
Pe
mbua
tan
2.3
-16
.62
3.0
-35
.26
0.5
19
.21
1.0
Ma
nu
factu
rin
g
Pe
mbin
aa
n5
.24
4.3
-13
.3-3
1.4
75
.01
8.2
19
.3C
on
str
uctio
n
Pe
rkhid
ma
tan
9.5
33
.8-7
.11
3.3
8.1
11
.32
5.6
Se
rvic
es
Ju
mla
h7
.11
7.5
3.3
-5.9
21
.61
4.4
24
.3T
ota
l
Se
kto
r a
wa
mP
ub
lic
se
cto
r
Pe
rta
nia
n-0
.41
.01
.30
.31
0.5
12
.41
0.4
Ag
ricu
ltu
re
Pe
rlo
mbo
nga
n d
an p
engkua
ria
n2
7.5
43
.33
9.3
14
.9-1
.31
8.7
59
.3M
inin
g a
nd
qu
arr
yin
g
Pe
mbua
tan
0.7
-0.6
10
.6-5
.62
7.4
16
.94
.2M
an
ufa
ctu
rin
g
Pe
mbin
aa
n0
.11
.60
.3-4
.9-0
.48
.26
.0C
on
str
uctio
n
Pe
rkhid
ma
tan
8.1
5.9
4.9
3.1
8.3
-0.6
11
.2S
erv
ice
s
Ju
mla
h9
.39
.41
0.0
4.7
7.4
3.9
20
.3T
ota
l
Jad
ual
3C
: P
MT
K m
en
gik
ut
Sekto
r d
an
Jen
is A
kti
vit
i E
ko
no
mi
pad
a H
arg
a S
em
asa -
Pera
tus p
eru
bah
an
tah
un
an
Tab
le 3
C:
GF
CF
by S
ecto
r an
d K
ind
of
Eco
no
mic
Acti
vit
y a
t C
urr
en
t P
rices -
An
nu
al
perc
en
tag
e c
han
ge
Ta
hu
n
20
05
20
06
20
07
20
08
20
09
20
10
20
11
e2
01
2p
Ye
ar
Se
kto
r &
je
nis
ak
tiv
iti
ek
on
om
i
Se
cto
r &
kin
d o
f e
co
no
mic
ac
tiv
ity
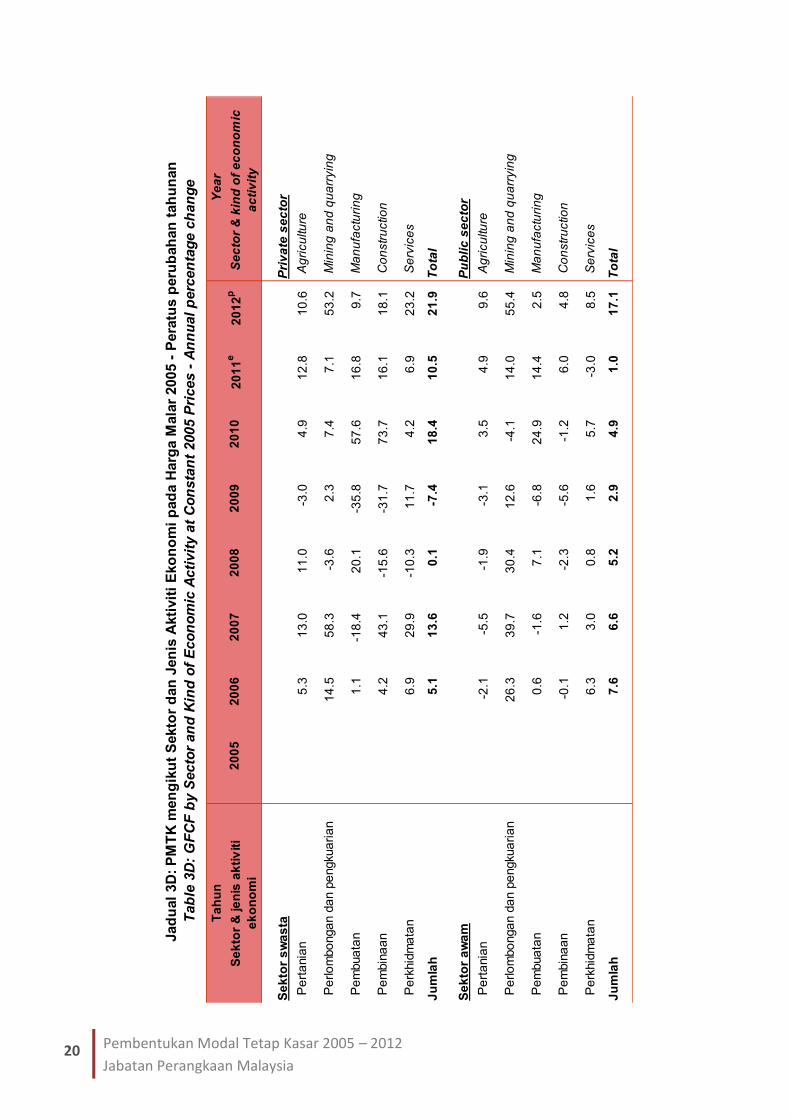
20 Pembentukan Modal Tetap Kasar 2005 – 2012
Jabatan Perangkaan Malaysia
Se
kto
r s
wa
sta
Pri
va
te s
ec
tor
Pe
rta
nia
n5
.31
3.0
11
.0-3
.04
.91
2.8
10
.6A
gri
cu
ltu
re
Pe
rlo
mbo
nga
n d
an p
engkua
ria
n1
4.5
58
.3-3
.62
.37
.47
.15
3.2
Min
ing
an
d q
ua
rryin
g
Pe
mbua
tan
1.1
-18
.42
0.1
-35
.85
7.6
16
.89
.7M
an
ufa
ctu
rin
g
Pe
mbin
aa
n4
.24
3.1
-15
.6-3
1.7
73
.71
6.1
18
.1C
on
str
uctio
n
Pe
rkhid
ma
tan
6.9
29
.9-1
0.3
11
.74
.26
.92
3.2
Se
rvic
es
Ju
mla
h5
.11
3.6
0.1
-7.4
18
.41
0.5
21
.9T
ota
l
Se
kto
r a
wa
mP
ub
lic
se
cto
r
Pe
rta
nia
n-2
.1-5
.5-1
.9-3
.13
.54
.99
.6A
gri
cu
ltu
re
Pe
rlo
mbo
nga
n d
an p
engkua
ria
n2
6.3
39
.73
0.4
12
.6-4
.11
4.0
55
.4M
inin
g a
nd
qu
arr
yin
g
Pe
mbua
tan
0.6
-1.6
7.1
-6.8
24
.91
4.4
2.5
Ma
nu
factu
rin
g
Pe
mbin
aa
n-0
.11
.2-2
.3-5
.6-1
.26
.04
.8C
on
str
uctio
n
Pe
rkhid
ma
tan
6.3
3.0
0.8
1.6
5.7
-3.0
8.5
Se
rvic
es
Ju
mla
h7
.66
.65
.22
.94
.91
.01
7.1
To
tal
20
10
20
11
e2
01
2p
Ye
ar
Se
kto
r &
je
nis
ak
tiv
iti
ek
on
om
i
Se
cto
r &
kin
d o
f e
co
no
mic
ac
tiv
ity
Ta
hu
n
20
05
20
06
20
07
20
08
20
09
Jad
ual
3D
: P
MT
K m
en
gik
ut
Sekto
r d
an
Jen
is A
kti
vit
i E
ko
no
mi
pad
a H
arg
a M
ala
r 2005 -
Pera
tus p
eru
bah
an
tah
un
an
Tab
le 3
D:
GF
CF
by S
ecto
r an
d K
ind
of
Eco
no
mic
Acti
vit
y a
t C
on
sta
nt
2005 P
rices -
An
nu
al
perc
en
tag
e c
han
ge
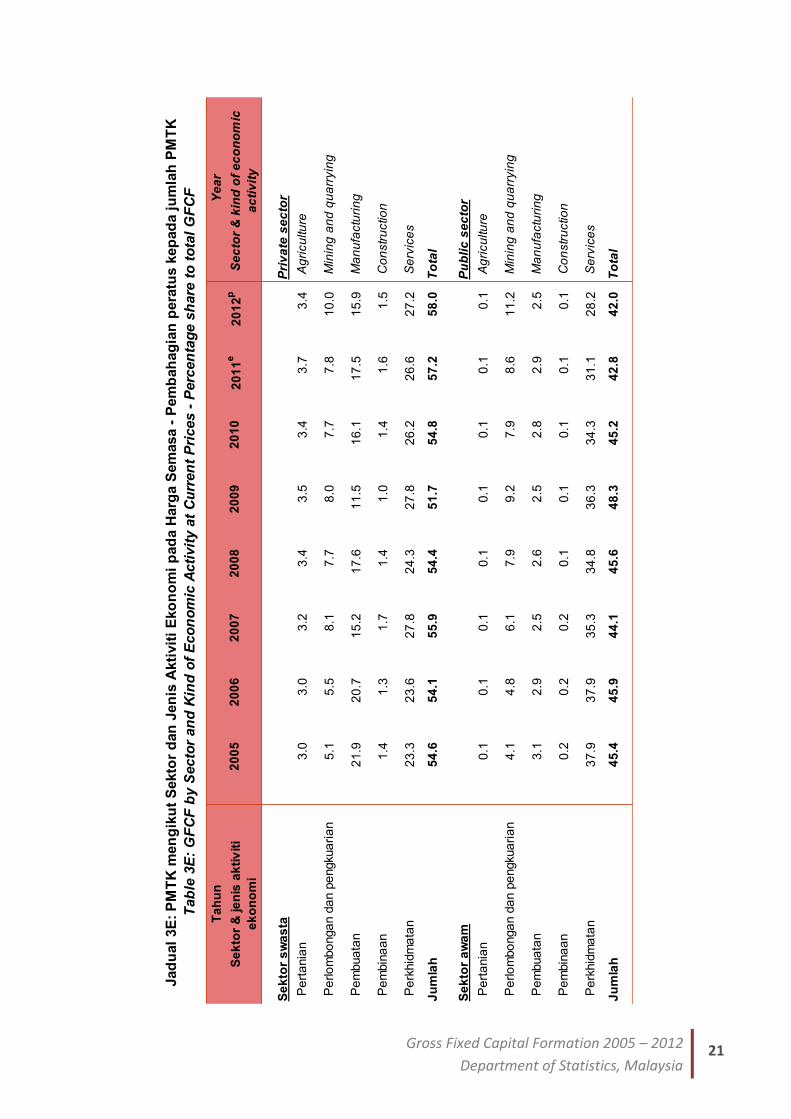
21 Gross Fixed Capital Formation 2005 – 2012
Department of Statistics, Malaysia
Se
kto
r s
wa
sta
Pri
va
te s
ec
tor
Pe
rta
nia
n3
.03
.03
.23
.43
.53
.43
.73
.4A
gri
cu
ltu
re
Pe
rlo
mbo
nga
n d
an p
engkua
ria
n5
.15
.58
.17
.78
.07
.77
.81
0.0
Min
ing
an
d q
ua
rryin
g
Pe
mbua
tan
21
.92
0.7
15
.21
7.6
11
.51
6.1
17
.51
5.9
Ma
nu
factu
rin
g
Pe
mbin
aa
n1
.41
.31
.71
.41
.01
.41
.61
.5C
on
str
uctio
n
Pe
rkhid
ma
tan
23
.32
3.6
27
.82
4.3
27
.82
6.2
26
.62
7.2
Se
rvic
es
Ju
mla
h5
4.6
54
.15
5.9
54
.45
1.7
54
.85
7.2
58
.0T
ota
l
Se
kto
r a
wa
mP
ub
lic
se
cto
r
Pe
rta
nia
n0
.10
.10
.10
.10
.10
.10
.10
.1A
gri
cu
ltu
re
Pe
rlo
mbo
nga
n d
an p
engkua
ria
n4
.14
.86
.17
.99
.27
.98
.61
1.2
Min
ing
an
d q
ua
rryin
g
Pe
mbua
tan
3.1
2.9
2.5
2.6
2.5
2.8
2.9
2.5
Ma
nu
factu
rin
g
Pe
mbin
aa
n0
.20
.20
.20
.10
.10
.10
.10
.1C
on
str
uctio
n
Pe
rkhid
ma
tan
37
.93
7.9
35
.33
4.8
36
.33
4.3
31
.12
8.2
Se
rvic
es
Ju
mla
h4
5.4
45
.94
4.1
45
.64
8.3
45
.24
2.8
42
.0T
ota
l
Jad
ual
3E
: P
MT
K m
en
gik
ut
Sekto
r d
an
Jen
is A
kti
vit
i E
ko
no
mi
pad
a H
arg
a S
em
asa -
Pem
bah
ag
ian
pera
tus k
ep
ad
a j
um
lah
PM
TK
Tab
le 3
E:
GF
CF
by S
ecto
r an
d K
ind
of
Eco
no
mic
Acti
vit
y a
t C
urr
en
t P
rices -
Perc
en
tag
e s
hare
to
to
tal
GF
CF
Ta
hu
n
20
05
20
06
20
07
20
08
20
09
20
10
20
11
e2
01
2p
Ye
ar
Se
kto
r &
je
nis
ak
tiv
iti
ek
on
om
i
Se
cto
r &
kin
d o
f e
co
no
mic
ac
tiv
ity
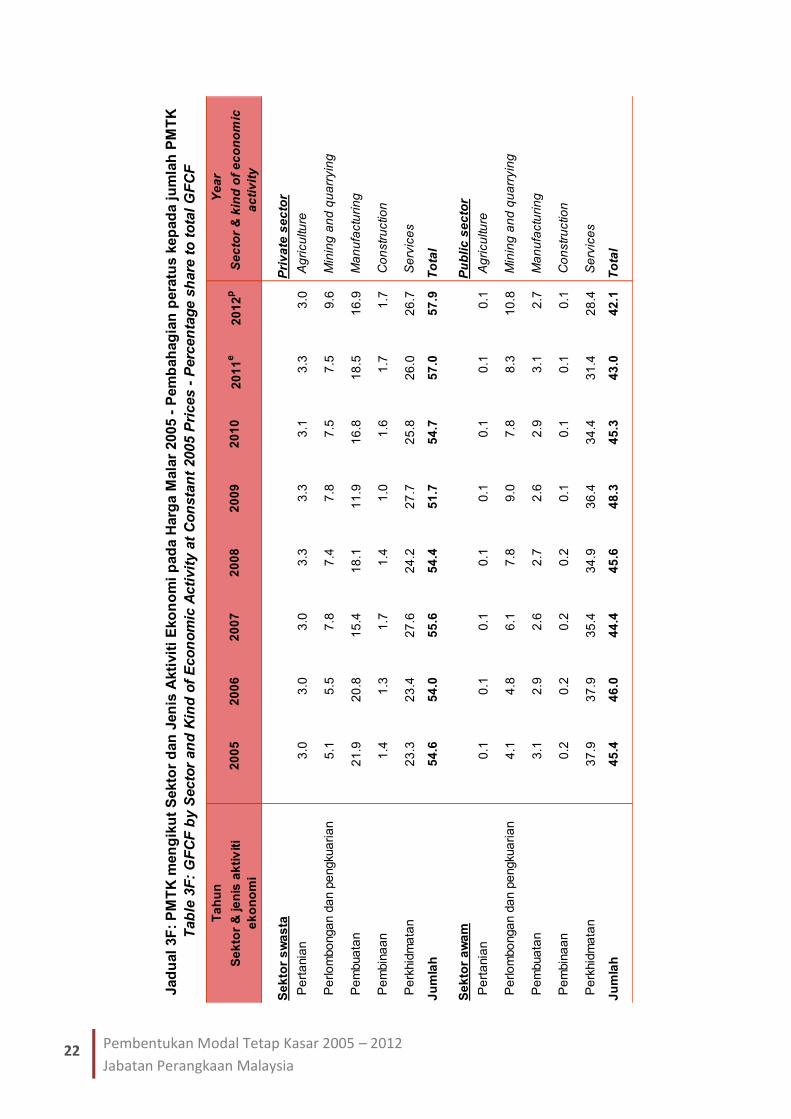
22 Pembentukan Modal Tetap Kasar 2005 – 2012
Jabatan Perangkaan Malaysia
Se
kto
r s
wa
sta
Pri
va
te s
ec
tor
Pe
rta
nia
n3
.03
.03
.03
.33
.33
.13
.33
.0A
gri
cu
ltu
re
Pe
rlo
mbo
nga
n d
an p
engkua
ria
n5
.15
.57
.87
.47
.87
.57
.59
.6M
inin
g a
nd
qu
arr
yin
g
Pe
mbua
tan
21
.92
0.8
15
.41
8.1
11
.91
6.8
18
.51
6.9
Ma
nu
factu
rin
g
Pe
mbin
aa
n1
.41
.31
.71
.41
.01
.61
.71
.7C
on
str
uctio
n
Pe
rkhid
ma
tan
23
.32
3.4
27
.62
4.2
27
.72
5.8
26
.02
6.7
Se
rvic
es
Ju
mla
h5
4.6
54
.05
5.6
54
.45
1.7
54
.75
7.0
57
.9T
ota
l
Se
kto
r a
wa
mP
ub
lic
se
cto
r
Pe
rta
nia
n0
.10
.10
.10
.10
.10
.10
.10
.1A
gri
cu
ltu
re
Pe
rlo
mbo
nga
n d
an p
engkua
ria
n4
.14
.86
.17
.89
.07
.88
.31
0.8
Min
ing
an
d q
ua
rryin
g
Pe
mbua
tan
3.1
2.9
2.6
2.7
2.6
2.9
3.1
2.7
Ma
nu
factu
rin
g
Pe
mbin
aa
n0
.20
.20
.20
.20
.10
.10
.10
.1C
on
str
uctio
n
Pe
rkhid
ma
tan
37
.93
7.9
35
.43
4.9
36
.43
4.4
31
.42
8.4
Se
rvic
es
Ju
mla
h4
5.4
46
.04
4.4
45
.64
8.3
45
.34
3.0
42
.1T
ota
l
Jad
ual
3F
: P
MT
K m
en
gik
ut
Sekto
r d
an
Jen
is A
kti
vit
i E
ko
no
mi
pad
a H
arg
a M
ala
r 2005 -
Pem
bah
ag
ian
pera
tus k
ep
ad
a j
um
lah
PM
TK
Tab
le 3
F:
GF
CF
by S
ecto
r an
d K
ind
of
Eco
no
mic
Acti
vit
y a
t C
on
sta
nt
2005 P
rices -
Perc
en
tag
e s
hare
to
to
tal
GF
CF
20
12
p
Ye
ar
Se
kto
r &
je
nis
ak
tiv
iti
ek
on
om
i
Se
cto
r &
kin
d o
f e
co
no
mic
ac
tiv
ity
Ta
hu
n
20
05
20
06
20
07
20
08
20
09
20
10
20
11
e
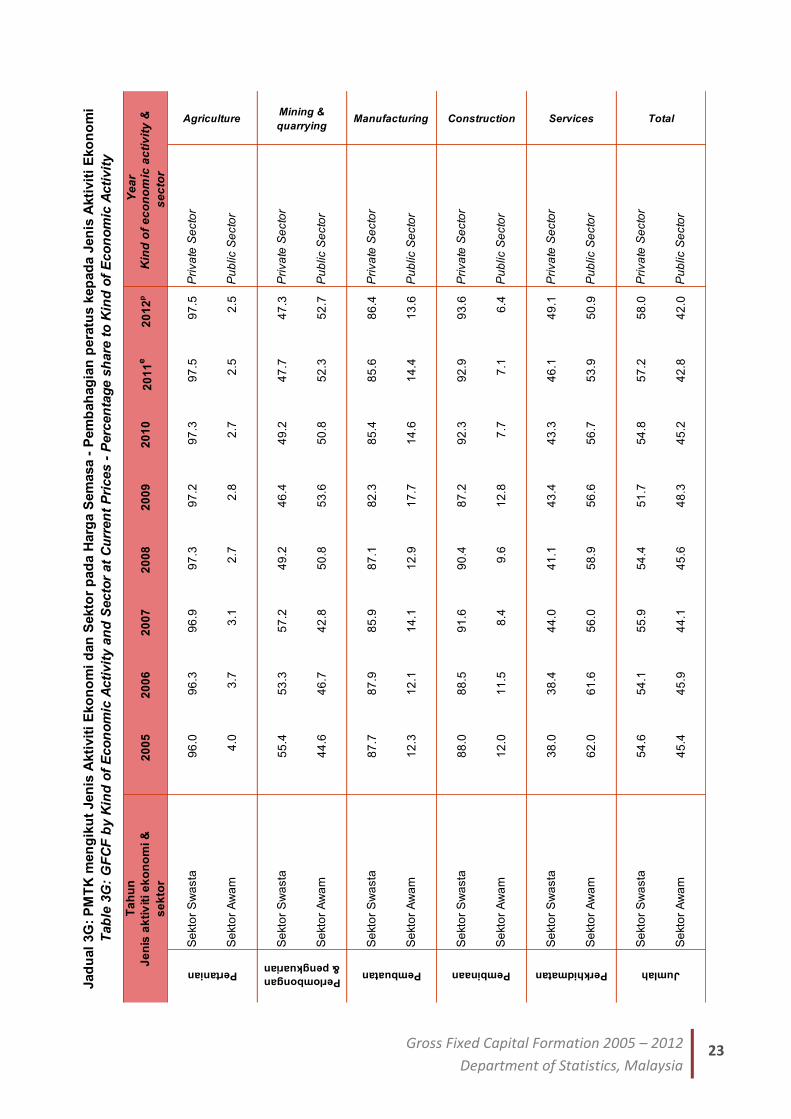
23 Gross Fixed Capital Formation 2005 – 2012
Department of Statistics, Malaysia
Se
kto
r S
wa
sta
96
.09
6.3
96
.99
7.3
97
.29
7.3
97
.59
7.5
Pri
va
te S
ecto
r
Se
kto
r A
wa
m4
.03
.73
.12
.72
.82
.72
.52
.5P
ub
lic S
ecto
r
Se
kto
r S
wa
sta
55
.45
3.3
57
.24
9.2
46
.44
9.2
47
.74
7.3
Pri
va
te S
ecto
r
Se
kto
r A
wa
m4
4.6
46
.74
2.8
50
.85
3.6
50
.85
2.3
52
.7P
ub
lic S
ecto
r
Se
kto
r S
wa
sta
87
.78
7.9
85
.98
7.1
82
.38
5.4
85
.68
6.4
Pri
va
te S
ecto
r
Se
kto
r A
wa
m1
2.3
12
.11
4.1
12
.91
7.7
14
.61
4.4
13
.6P
ub
lic S
ecto
r
Se
kto
r S
wa
sta
88
.08
8.5
91
.69
0.4
87
.29
2.3
92
.99
3.6
Pri
va
te S
ecto
r
Se
kto
r A
wa
m1
2.0
11
.58
.49
.61
2.8
7.7
7.1
6.4
Pu
blic S
ecto
r
Se
kto
r S
wa
sta
38
.03
8.4
44
.04
1.1
43
.44
3.3
46
.14
9.1
Pri
va
te S
ecto
r
Se
kto
r A
wa
m6
2.0
61
.65
6.0
58
.95
6.6
56
.75
3.9
50
.9P
ub
lic S
ecto
r
Se
kto
r S
wa
sta
54
.65
4.1
55
.95
4.4
51
.75
4.8
57
.25
8.0
Pri
va
te S
ecto
r
Se
kto
r A
wa
m4
5.4
45
.94
4.1
45
.64
8.3
45
.24
2.8
42
.0P
ub
lic S
ecto
r
Pertanian
Agriculture
Perkhidmatan
Services
Jumlah
Total
Perlombongan
& pengkuarian
Mining &
quarrying
Pembuatan
Manufacturing
Pembinaan
Construction
Jad
ual
3G
: P
MT
K m
en
gik
ut
Jen
is A
kti
vit
i E
ko
no
mi
dan
Sekto
r p
ad
a H
arg
a S
em
asa -
Pem
bah
ag
ian
pera
tus k
ep
ad
a J
en
is A
kti
vit
i E
ko
no
mi
Tab
le 3
G:
GF
CF
by K
ind
of
Eco
no
mic
Acti
vit
y a
nd
Secto
r at
Cu
rren
t P
rices -
Perc
en
tag
e s
hare
to
Kin
d o
f E
co
no
mic
Acti
vit
y
Ta
hu
n
20
05
20
06
20
07
20
08
20
09
20
10
20
11
e2
01
2p
Ye
ar
J
en
is a
kti
vit
i e
ko
no
mi &
se
kto
r
Kin
d o
f e
co
no
mic
ac
tiv
ity
&
se
cto
r
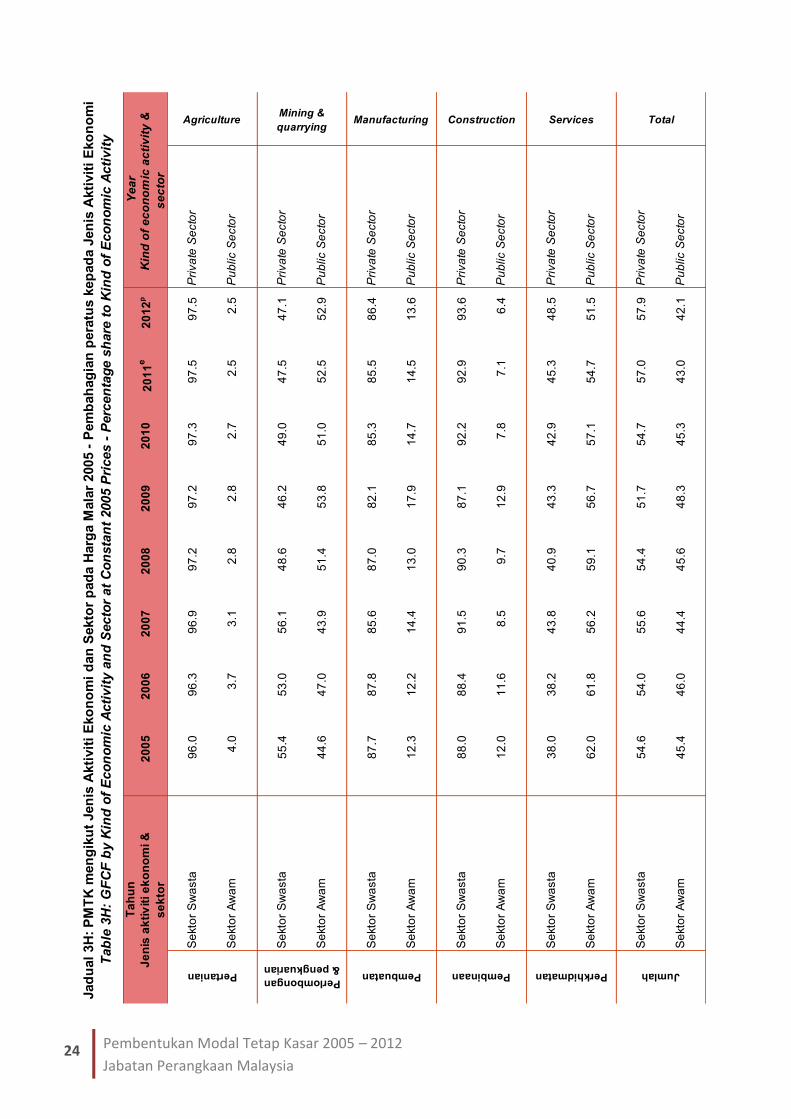
24 Pembentukan Modal Tetap Kasar 2005 – 2012
Jabatan Perangkaan Malaysia
Se
kto
r S
wa
sta
96
.09
6.3
96
.99
7.2
97
.29
7.3
97
.59
7.5
Pri
va
te S
ecto
r
Se
kto
r A
wa
m4
.03
.73
.12
.82
.82
.72
.52
.5P
ub
lic S
ecto
r
Se
kto
r S
wa
sta
55
.45
3.0
56
.14
8.6
46
.24
9.0
47
.54
7.1
Pri
va
te S
ecto
r
Se
kto
r A
wa
m4
4.6
47
.04
3.9
51
.45
3.8
51
.05
2.5
52
.9P
ub
lic S
ecto
r
Se
kto
r S
wa
sta
87
.78
7.8
85
.68
7.0
82
.18
5.3
85
.58
6.4
Pri
va
te S
ecto
r
Se
kto
r A
wa
m1
2.3
12
.21
4.4
13
.01
7.9
14
.71
4.5
13
.6P
ub
lic S
ecto
r
Se
kto
r S
wa
sta
88
.08
8.4
91
.59
0.3
87
.19
2.2
92
.99
3.6
Pri
va
te S
ecto
r
Se
kto
r A
wa
m1
2.0
11
.68
.59
.71
2.9
7.8
7.1
6.4
Pu
blic S
ecto
r
Se
kto
r S
wa
sta
38
.03
8.2
43
.84
0.9
43
.34
2.9
45
.34
8.5
Pri
va
te S
ecto
r
Se
kto
r A
wa
m6
2.0
61
.85
6.2
59
.15
6.7
57
.15
4.7
51
.5P
ub
lic S
ecto
r
Se
kto
r S
wa
sta
54
.65
4.0
55
.65
4.4
51
.75
4.7
57
.05
7.9
Pri
va
te S
ecto
r
Se
kto
r A
wa
m4
5.4
46
.04
4.4
45
.64
8.3
45
.34
3.0
42
.1P
ub
lic S
ecto
r
Jumlah
Total
Pembuatan
Manufacturing
Pembinaan
Construction
Perkhidmatan
Services Y
ea
r
Je
nis
ak
tiv
iti e
ko
no
mi &
se
kto
r
Kin
d o
f e
co
no
mic
ac
tiv
ity
&
se
cto
r
Pertanian
AgriculturePerlombongan
& pengkuarian
Mining &
quarrying
Jad
ual
3H
: P
MT
K m
en
gik
ut
Jen
is A
kti
vit
i E
ko
no
mi
dan
Sekto
r p
ad
a H
arg
a M
ala
r 2005 -
Pem
bah
ag
ian
pera
tus k
ep
ad
a J
en
is A
kti
vit
i E
ko
no
mi
Tab
le 3
H:
GF
CF
by K
ind
of
Eco
no
mic
Acti
vit
y a
nd
Secto
r at
Co
nsta
nt
2005 P
rices -
Perc
en
tag
e s
hare
to
Kin
d o
f E
co
no
mic
Acti
vit
y
Ta
hu
n
20
05
20
06
20
07
20
08
20
09
20
10
20
11
e2
01
2p
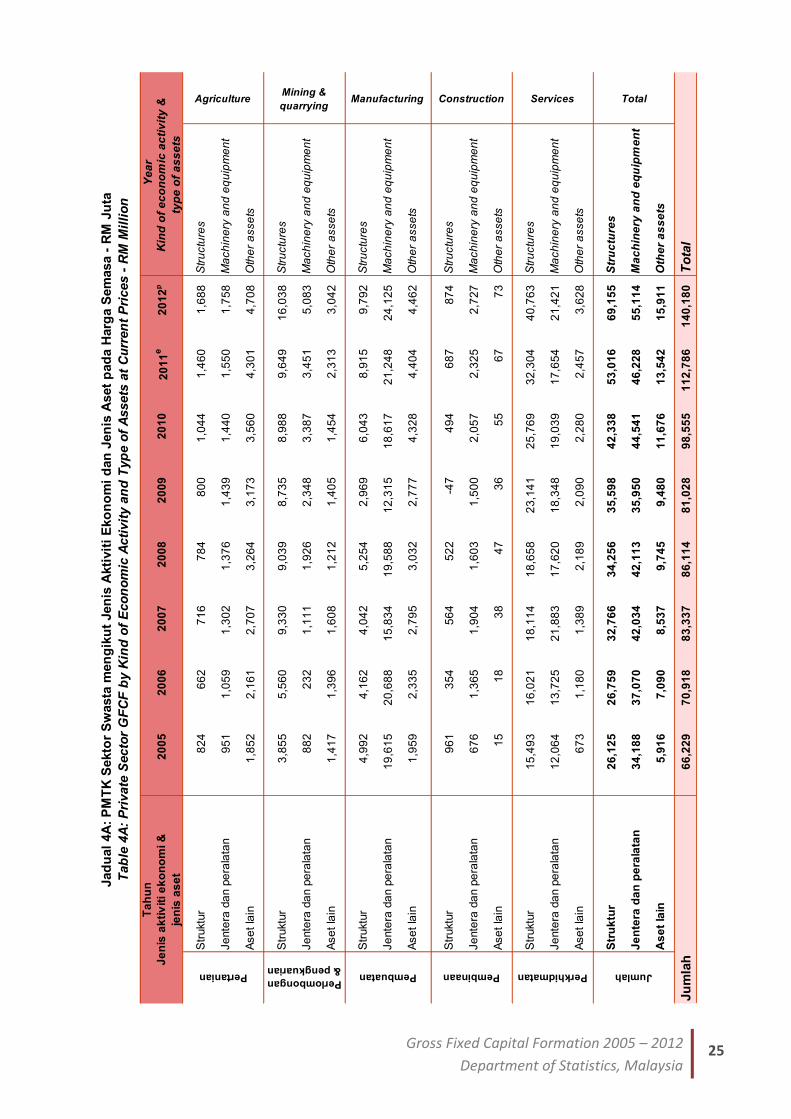
25 Gross Fixed Capital Formation 2005 – 2012
Department of Statistics, Malaysia
Str
uktu
r8
24
66
27
16
78
48
00
1,0
44
1,4
60
1,6
88
Str
uctu
res
Je
nte
ra d
an p
era
lata
n9
51
1,0
59
1,3
02
1,3
76
1,4
39
1,4
40
1,5
50
1,7
58
Ma
ch
ine
ry a
nd
eq
uip
me
nt
Ase
t la
in1
,85
22
,16
12
,70
73
,26
43
,17
33
,56
04
,30
14
,70
8O
the
r a
sse
ts
Str
uktu
r3
,85
55
,56
09
,33
09
,03
98
,73
58
,98
89
,64
91
6,0
38
Str
uctu
res
Je
nte
ra d
an p
era
lata
n8
82
23
21
,11
11
,92
62
,34
83
,38
73
,45
15
,08
3M
ach
ine
ry a
nd
eq
uip
me
nt
Ase
t la
in1
,41
71
,39
61
,60
81
,21
21
,40
51
,45
42
,31
33
,04
2O
the
r a
sse
ts
Str
uktu
r4
,99
24
,16
24
,04
25
,25
42
,96
96
,04
38
,91
59
,79
2S
tru
ctu
res
Je
nte
ra d
an p
era
lata
n1
9,6
15
20
,68
81
5,8
34
19
,58
81
2,3
15
18
,61
72
1,2
48
24
,12
5M
ach
ine
ry a
nd
eq
uip
me
nt
Ase
t la
in1
,95
92
,33
52
,79
53
,03
22
,77
74
,32
84
,40
44
,46
2O
the
r a
sse
ts
Str
uktu
r9
61
35
45
64
52
2-4
74
94
68
78
74
Str
uctu
res
Je
nte
ra d
an p
era
lata
n6
76
1,3
65
1,9
04
1,6
03
1,5
00
2,0
57
2,3
25
2,7
27
Ma
ch
ine
ry a
nd
eq
uip
me
nt
Ase
t la
in1
51
83
84
73
65
56
77
3O
the
r a
sse
ts
Str
uktu
r1
5,4
93
16
,02
11
8,1
14
18
,65
82
3,1
41
25
,76
93
2,3
04
40
,76
3S
tru
ctu
res
Je
nte
ra d
an p
era
lata
n1
2,0
64
13
,72
52
1,8
83
17
,62
01
8,3
48
19
,03
91
7,6
54
21
,42
1M
ach
ine
ry a
nd
eq
uip
me
nt
Ase
t la
in6
73
1,1
80
1,3
89
2,1
89
2,0
90
2,2
80
2,4
57
3,6
28
Oth
er
asse
ts
Str
uk
tur
26
,12
52
6,7
59
32
,76
63
4,2
56
35
,59
84
2,3
38
53
,01
66
9,1
55
Str
uc
ture
s
Je
nte
ra d
an
pe
rala
tan
34
,18
83
7,0
70
42
,03
44
2,1
13
35
,95
04
4,5
41
46
,22
85
5,1
14
Ma
ch
ine
ry a
nd
eq
uip
me
nt
As
et
lain
5,9
16
7,0
90
8,5
37
9,7
45
9,4
80
11
,67
61
3,5
42
15
,91
1O
the
r a
ss
ets
66
,22
97
0,9
18
83
,33
78
6,1
14
81
,02
89
8,5
55
11
2,7
86
14
0,1
80
20
12
p
Ye
ar
J
en
is a
kti
vit
i e
ko
no
mi &
jen
is a
se
t
Kin
d o
f e
co
no
mic
ac
tiv
ity
&
typ
e o
f a
ss
ets
Pertanian
AgricultureJad
ual
4A
: P
MT
K S
ekto
r S
wasta
men
gik
ut
Jen
is A
kti
vit
i E
ko
no
mi
dan
Jen
is A
set
pad
a H
arg
a S
em
asa -
RM
Ju
ta
Tab
le 4
A:
Pri
vate
Secto
r G
FC
F b
y K
ind
of
Eco
no
mic
Acti
vit
y a
nd
Typ
e o
f A
ssets
at
Cu
rren
t P
rices -
RM
Mil
lio
n
Ta
hu
n
20
05
20
06
20
07
20
08
20
09
20
10
20
11
e
Perkhidmatan
Services
Jumlah
Total
Ju
mla
hT
ota
l
Perlombongan
& pengkuarian
Mining &
quarrying
Pembuatan
Manufacturing
Pembinaan
Construction
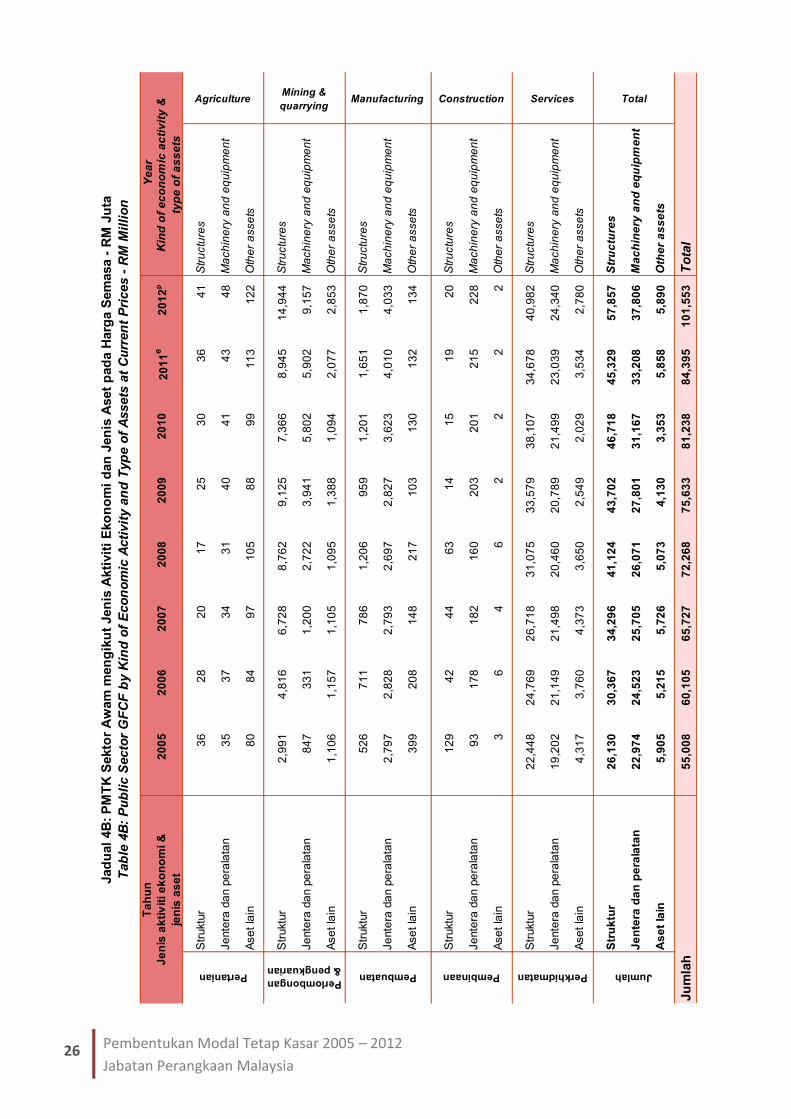
26 Pembentukan Modal Tetap Kasar 2005 – 2012
Jabatan Perangkaan Malaysia
Str
uktu
r3
62
82
01
72
53
03
64
1S
tru
ctu
res
Je
nte
ra d
an p
era
lata
n3
53
73
43
14
04
14
34
8M
ach
ine
ry a
nd
eq
uip
me
nt
Ase
t la
in8
08
49
71
05
88
99
11
31
22
Oth
er
asse
ts
Str
uktu
r2
,99
14
,81
66
,72
88
,76
29
,12
57
,36
68
,94
51
4,9
44
Str
uctu
res
Je
nte
ra d
an p
era
lata
n8
47
33
11
,20
02
,72
23
,94
15
,80
25
,90
29
,15
7M
ach
ine
ry a
nd
eq
uip
me
nt
Ase
t la
in1
,10
61
,15
71
,10
51
,09
51
,38
81
,09
42
,07
72
,85
3O
the
r a
sse
ts
Str
uktu
r5
26
71
17
86
1,2
06
95
91
,20
11
,65
11
,87
0S
tru
ctu
res
Je
nte
ra d
an p
era
lata
n2
,79
72
,82
82
,79
32
,69
72
,82
73
,62
34
,01
04
,03
3M
ach
ine
ry a
nd
eq
uip
me
nt
Ase
t la
in3
99
20
81
48
21
71
03
13
01
32
13
4O
the
r a
sse
ts
Str
uktu
r1
29
42
44
63
14
15
19
20
Str
uctu
res
Je
nte
ra d
an p
era
lata
n9
31
78
18
21
60
20
32
01
21
52
28
Ma
ch
ine
ry a
nd
eq
uip
me
nt
Ase
t la
in3
64
62
22
2O
the
r a
sse
ts
Str
uktu
r2
2,4
48
24
,76
92
6,7
18
31
,07
53
3,5
79
38
,10
73
4,6
78
40
,98
2S
tru
ctu
res
Je
nte
ra d
an p
era
lata
n1
9,2
02
21
,14
92
1,4
98
20
,46
02
0,7
89
21
,49
92
3,0
39
24
,34
0M
ach
ine
ry a
nd
eq
uip
me
nt
Ase
t la
in4
,31
73
,76
04
,37
33
,65
02
,54
92
,02
93
,53
42
,78
0O
the
r a
sse
ts
Str
uk
tur
26
,13
03
0,3
67
34
,29
64
1,1
24
43
,70
24
6,7
18
45
,32
95
7,8
57
Str
uc
ture
s
Je
nte
ra d
an
pe
rala
tan
22
,97
42
4,5
23
25
,70
52
6,0
71
27
,80
13
1,1
67
33
,20
83
7,8
06
Ma
ch
ine
ry a
nd
eq
uip
me
nt
As
et
lain
5,9
05
5,2
15
5,7
26
5,0
73
4,1
30
3,3
53
5,8
58
5,8
90
Oth
er
as
se
ts
55
,00
86
0,1
05
65
,72
77
2,2
68
75
,63
38
1,2
38
84
,39
51
01
,55
3
Perkhidmatan
Services
Jumlah
Total
Ju
mla
hT
ota
l
Perlombongan
& pengkuarian
Mining &
quarrying
Pembuatan
Manufacturing
Pembinaan
Construction
20
12
p
Ye
ar
J
en
is a
kti
vit
i e
ko
no
mi &
jen
is a
se
t
Kin
d o
f e
co
no
mic
ac
tiv
ity
&
typ
e o
f a
ss
ets
Pertanian
AgricultureJad
ual
4B
: P
MT
K S
ekto
r A
wam
men
gik
ut
Jen
is A
kti
vit
i E
ko
no
mi
dan
Jen
is A
set
pad
a H
arg
a S
em
asa -
RM
Ju
ta
Tab
le 4
B:
Pu
bli
c S
ecto
r G
FC
F b
y K
ind
of
Eco
no
mic
Acti
vit
y a
nd
Typ
e o
f A
ssets
at
Cu
rren
t P
rices -
RM
Mil
lio
n
Ta
hu
n
20
05
20
06
20
07
20
08
20
09
20
10
20
11
e
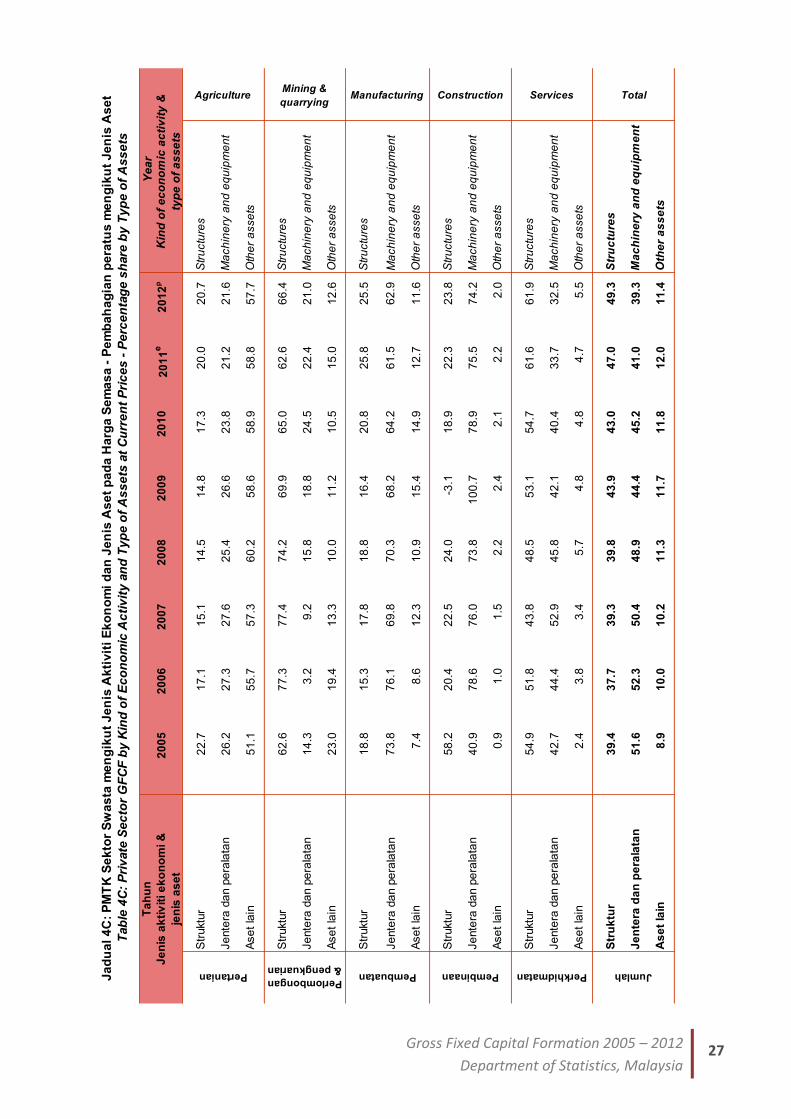
27 Gross Fixed Capital Formation 2005 – 2012
Department of Statistics, Malaysia
Str
uktu
r2
2.7
17
.11
5.1
14
.51
4.8
17
.32
0.0
20
.7S
tru
ctu
res
Je
nte
ra d
an p
era
lata
n2
6.2
27
.32
7.6
25
.42
6.6
23
.82
1.2
21
.6M
ach
ine
ry a
nd
eq
uip
me
nt
Ase
t la
in5
1.1
55
.75
7.3
60
.25
8.6
58
.95
8.8
57
.7O
the
r a
sse
ts
Str
uktu
r6
2.6
77
.37
7.4
74
.26
9.9
65
.06
2.6
66
.4S
tru
ctu
res
Je
nte
ra d
an p
era
lata
n1
4.3
3.2
9.2
15
.81
8.8
24
.52
2.4
21
.0M
ach
ine
ry a
nd
eq
uip
me
nt
Ase
t la
in2
3.0
19
.41
3.3
10
.01
1.2
10
.51
5.0
12
.6O
the
r a
sse
ts
Str
uktu
r1
8.8
15
.31
7.8
18
.81
6.4
20
.82
5.8
25
.5S
tru
ctu
res
Je
nte
ra d
an p
era
lata
n7
3.8
76
.16
9.8
70
.36
8.2
64
.26
1.5
62
.9M
ach
ine
ry a
nd
eq
uip
me
nt
Ase
t la
in7
.48
.61
2.3
10
.91
5.4
14
.91
2.7
11
.6O
the
r a
sse
ts
Str
uktu
r5
8.2
20
.42
2.5
24
.0-3
.11
8.9
22
.32
3.8
Str
uctu
res
Je
nte
ra d
an p
era
lata
n4
0.9
78
.67
6.0
73
.81
00
.77
8.9
75
.57
4.2
Ma
ch
ine
ry a
nd
eq
uip
me
nt
Ase
t la
in0
.91
.01
.52
.22
.42
.12
.22
.0O
the
r a
sse
ts
Str
uktu
r5
4.9
51
.84
3.8
48
.55
3.1
54
.76
1.6
61
.9S
tru
ctu
res
Je
nte
ra d
an p
era
lata
n4
2.7
44
.45
2.9
45
.84
2.1
40
.43
3.7
32
.5M
ach
ine
ry a
nd
eq
uip
me
nt
Ase
t la
in2
.43
.83
.45
.74
.84
.84
.75
.5O
the
r a
sse
ts
Str
uk
tur
39
.43
7.7
39
.33
9.8
43
.94
3.0
47
.04
9.3
Str
uc
ture
s
Je
nte
ra d
an
pe
rala
tan
51
.65
2.3
50
.44
8.9
44
.44
5.2
41
.03
9.3
Ma
ch
ine
ry a
nd
eq
uip
me
nt
As
et
lain
8.9
10
.01
0.2
11
.31
1.7
11
.81
2.0
11
.4O
the
r a
ss
ets
Ja
du
al
4C
: P
MT
K S
ek
tor
Sw
as
ta m
en
gik
ut
Je
nis
Ak
tiv
iti
Ek
on
om
i d
an
Je
nis
As
et
pa
da
Ha
rga
Se
ma
sa
- P
em
ba
ha
gia
n p
era
tus
me
ng
iku
t J
en
is A
se
t
Tab
le 4
C:
Pri
vate
Se
cto
r G
FC
F b
y K
ind
of
Ec
on
om
ic A
cti
vit
y a
nd
Ty
pe
of
As
se
ts a
t C
urr
en
t P
ric
es
- P
erc
en
tag
e s
hare
by
Ty
pe
of
As
se
ts
Ta
hu
n
20
05
20
06
20
07
20
08
20
09
20
10
20
11
e
Pembuatan
Manufacturing
Pembinaan
Construction
20
12
p
Ye
ar
J
en
is a
kti
vit
i e
ko
no
mi &
jen
is a
se
t
Kin
d o
f e
co
no
mic
ac
tiv
ity
&
typ
e o
f a
ss
ets
Pertanian
Agriculture
Perkhidmatan
Services
Jumlah
Total
Perlombongan
& pengkuarian
Mining &
quarrying
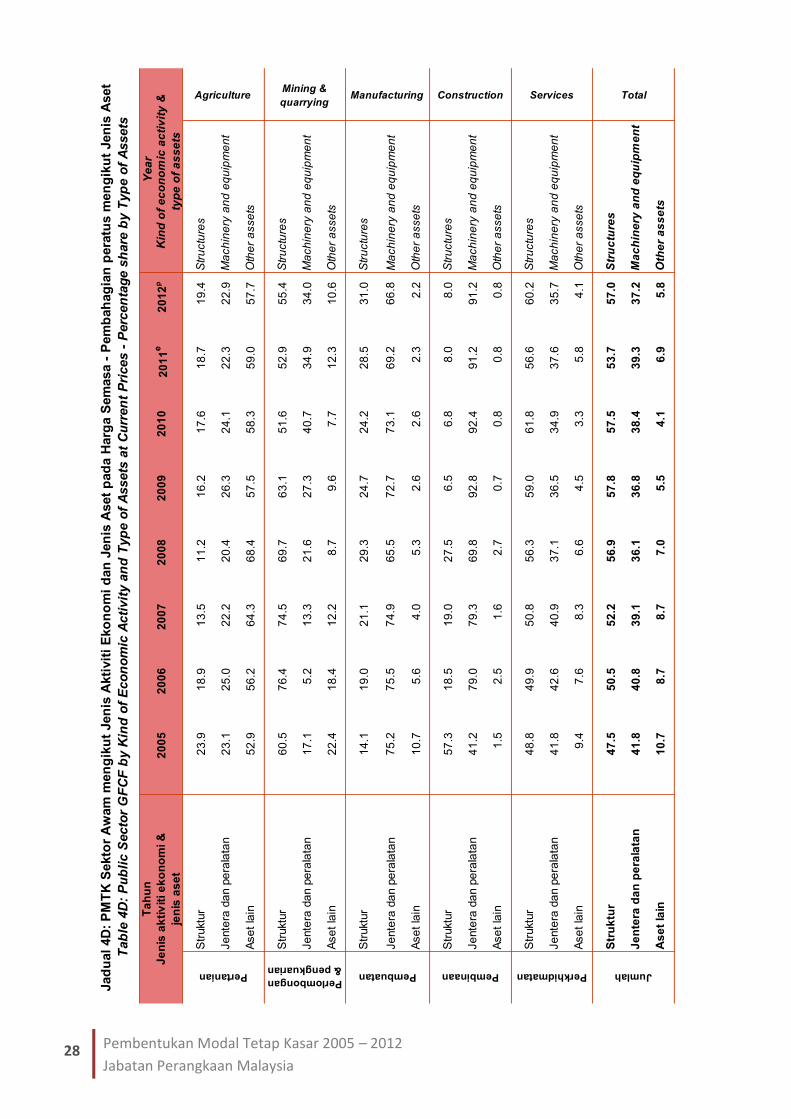
28 Pembentukan Modal Tetap Kasar 2005 – 2012
Jabatan Perangkaan Malaysia
Str
uktu
r2
3.9
18
.91
3.5
11
.21
6.2
17
.61
8.7
19
.4S
tru
ctu
res
Je
nte
ra d
an p
era
lata
n2
3.1
25
.02
2.2
20
.42
6.3
24
.12
2.3
22
.9M
ach
ine
ry a
nd
eq
uip
me
nt
Ase
t la
in5
2.9
56
.26
4.3
68
.45
7.5
58
.35
9.0
57
.7O
the
r a
sse
ts
Str
uktu
r6
0.5
76
.47
4.5
69
.76
3.1
51
.65
2.9
55
.4S
tru
ctu
res
Je
nte
ra d
an p
era
lata
n1
7.1
5.2
13
.32
1.6
27
.34
0.7
34
.93
4.0
Ma
ch
ine
ry a
nd
eq
uip
me
nt
Ase
t la
in2
2.4
18
.41
2.2
8.7
9.6
7.7
12
.31
0.6
Oth
er
asse
ts
Str
uktu
r1
4.1
19
.02
1.1
29
.32
4.7
24
.22
8.5
31
.0S
tru
ctu
res
Je
nte
ra d
an p
era
lata
n7
5.2
75
.57
4.9
65
.57
2.7
73
.16
9.2
66
.8M
ach
ine
ry a
nd
eq
uip
me
nt
Ase
t la
in1
0.7
5.6
4.0
5.3
2.6
2.6
2.3
2.2
Oth
er
asse
ts
Str
uktu
r5
7.3
18
.51
9.0
27
.56
.56
.88
.08
.0S
tru
ctu
res
Je
nte
ra d
an p
era
lata
n4
1.2
79
.07
9.3
69
.89
2.8
92
.49
1.2
91
.2M
ach
ine
ry a
nd
eq
uip
me
nt
Ase
t la
in1
.52
.51
.62
.70
.70
.80
.80
.8O
the
r a
sse
ts
Str
uktu
r4
8.8
49
.95
0.8
56
.35
9.0
61
.85
6.6
60
.2S
tru
ctu
res
Je
nte
ra d
an p
era
lata
n4
1.8
42
.64
0.9
37
.13
6.5
34
.93
7.6
35
.7M
ach
ine
ry a
nd
eq
uip
me
nt
Ase
t la
in9
.47
.68
.36
.64
.53
.35
.84
.1O
the
r a
sse
ts
Str
uk
tur
47
.55
0.5
52
.25
6.9
57
.85
7.5
53
.75
7.0
Str
uc
ture
s
Je
nte
ra d
an
pe
rala
tan
41
.84
0.8
39
.13
6.1
36
.83
8.4
39
.33
7.2
Ma
ch
ine
ry a
nd
eq
uip
me
nt
As
et
lain
10
.78
.78
.77
.05
.54
.16
.95
.8O
the
r a
ss
ets
Perkhidmatan
Services
Jumlah
TotalJad
ual
4D
: P
MT
K S
ekto
r A
wam
men
gik
ut
Jen
is A
kti
vit
i E
ko
no
mi
dan
Jen
is A
set
pad
a H
arg
a S
em
asa -
Pem
bah
ag
ian
pera
tus m
en
gik
ut
Jen
is A
set
Tab
le 4
D:
Pu
bli
c S
ecto
r G
FC
F b
y K
ind
of
Eco
no
mic
Acti
vit
y a
nd
Typ
e o
f A
ssets
at
Cu
rren
t P
rices -
Perc
en
tag
e s
hare
by T
yp
e o
f A
ssets
Perlombongan
& pengkuarian
Mining &
quarrying
Pembuatan
Manufacturing
Pembinaan
Construction
20
12
p
Ye
ar
J
en
is a
kti
vit
i e
ko
no
mi &
jen
is a
se
t
Kin
d o
f e
co
no
mic
ac
tiv
ity
&
typ
e o
f a
ss
ets
Pertanian
Agriculture
Ta
hu
n
20
05
20
06
20
07
20
08
20
09
20
10
20
11
e
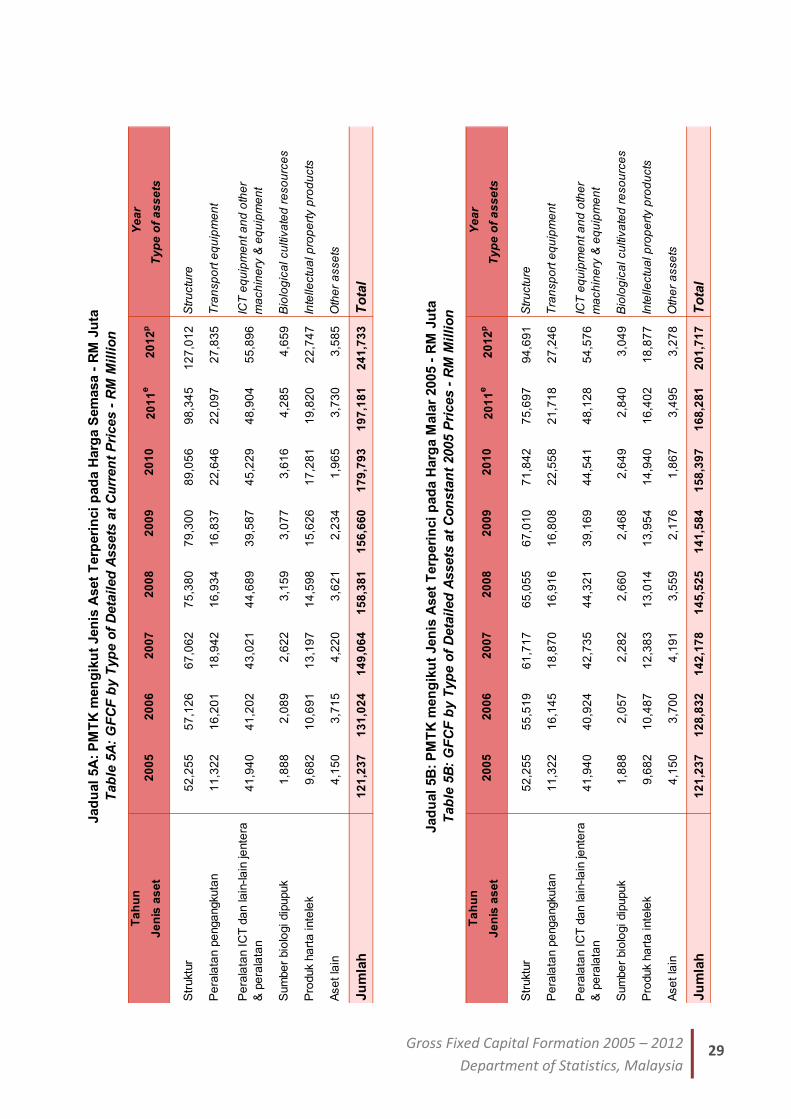
29 Gross Fixed Capital Formation 2005 – 2012
Department of Statistics, Malaysia
Str
uktu
r5
2,2
55
57
,12
66
7,0
62
75
,38
07
9,3
00
89
,05
69
8,3
45
12
7,0
12
Str
uctu
re
Pe
rala
tan p
enga
ngkuta
n1
1,3
22
16
,20
11
8,9
42
16
,93
41
6,8
37
22
,64
62
2,0
97
27
,83
5T
ran
sp
ort
eq
uip
me
nt
41
,94
04
1,2
02
43
,02
14
4,6
89
39
,58
74
5,2
29
48
,90
45
5,8
96
Sum
be
r bio
logi dip
upuk
1,8
88
2,0
89
2,6
22
3,1
59
3,0
77
3,6
16
4,2
85
4,6
59
Bio
log
ica
l cu
ltiv
ate
d r
eso
urc
es
Pro
duk h
art
a inte
lek
9,6
82
10
,69
11
3,1
97
14
,59
81
5,6
26
17
,28
11
9,8
20
22
,74
7In
telle
ctu
al p
rop
ert
y p
rod
ucts
Ase
t la
in4
,15
03
,71
54
,22
03
,62
12
,23
41
,96
53
,73
03
,58
5O
the
r a
sse
ts
12
1,2
37
13
1,0
24
14
9,0
64
15
8,3
81
15
6,6
60
17
9,7
93
19
7,1
81
24
1,7
33
Str
uktu
r5
2,2
55
55
,51
96
1,7
17
65
,05
56
7,0
10
71
,84
27
5,6
97
94
,69
1S
tru
ctu
re
Pe
rala
tan p
enga
ngkuta
n1
1,3
22
16
,14
51
8,8
70
16
,91
61
6,8
08
22
,55
82
1,7
18
27
,24
6T
ran
sp
ort
eq
uip
me
nt
41
,94
04
0,9
24
42
,73
54
4,3
21
39
,16
94
4,5
41
48
,12
85
4,5
76
Sum
be
r bio
logi dip
upuk
1,8
88
2,0
57
2,2
82
2,6
60
2,4
68
2,6
49
2,8
40
3,0
49
Bio
log
ica
l cu
ltiv
ate
d r
eso
urc
es
Pro
duk h
art
a inte
lek
9,6
82
10
,48
71
2,3
83
13
,01
41
3,9
54
14
,94
01
6,4
02
18
,87
7In
telle
ctu
al p
rop
ert
y p
rod
ucts
Ase
t la
in4
,15
03
,70
04
,19
13
,55
92
,17
61
,86
73
,49
53
,27
8O
the
r a
sse
ts
12
1,2
37
12
8,8
32
14
2,1
78
14
5,5
25
14
1,5
84
15
8,3
97
16
8,2
81
20
1,7
17
20
12
p Y
ea
r
Je
nis
as
et
Ty
pe
of
as
se
ts
Pe
rala
tan I
CT
da
n la
in-la
in je
nte
ra
& p
era
lata
n
ICT
eq
uip
me
nt a
nd
oth
er
ma
ch
ine
ry &
eq
uip
me
nt
Jad
ual
5A
: P
MT
K m
en
gik
ut
Jen
is A
set
Terp
eri
nci
pad
a H
arg
a S
em
asa -
RM
Ju
ta
Tab
le 5
A:
GF
CF
by T
yp
e o
f D
eta
iled
Assets
at
Cu
rren
t P
rices -
RM
Mil
lio
n
Ta
hu
n2
00
52
00
62
00
72
00
82
00
92
01
02
01
1e
20
11
e2
01
2p
Ye
ar
Je
nis
as
et
Ty
pe
of
as
se
ts
Pe
rala
tan I
CT
da
n la
in-la
in je
nte
ra
& p
era
lata
n
ICT
eq
uip
me
nt a
nd
oth
er
ma
ch
ine
ry &
eq
uip
me
nt
Ju
mla
hT
ota
l
Jad
ual
5B
: P
MT
K m
en
gik
ut
Jen
is A
set
Terp
eri
nci
pad
a H
arg
a M
ala
r 2005 -
RM
Ju
ta
Tab
le 5
B:
GF
CF
by T
yp
e o
f D
eta
iled
Assets
at
Co
nsta
nt
2005 P
rices -
RM
Mil
lio
n
Ta
hu
n2
00
52
00
62
00
72
00
82
00
92
01
0
Ju
mla
hT
ota
l
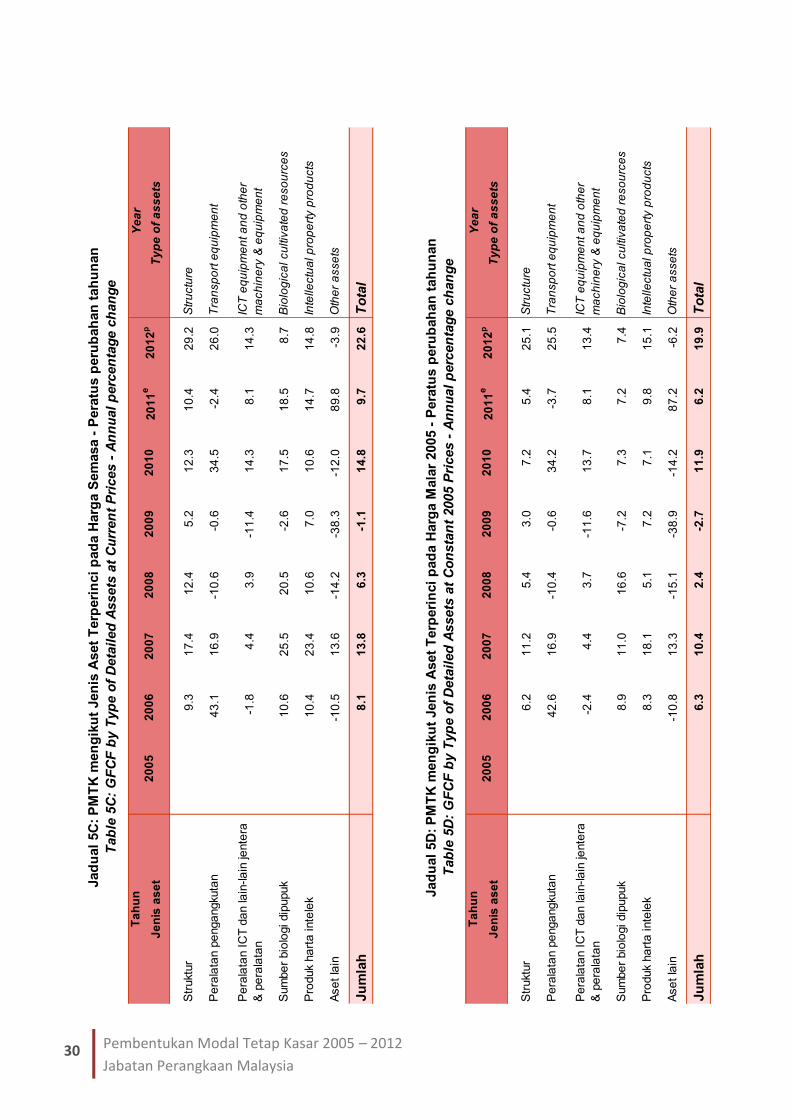
30 Pembentukan Modal Tetap Kasar 2005 – 2012
Jabatan Perangkaan Malaysia
Str
uktu
r9
.31
7.4
12
.45
.21
2.3
10
.42
9.2
Str
uctu
re
Pe
rala
tan p
enga
ngkuta
n4
3.1
16
.9-1
0.6
-0.6
34
.5-2
.42
6.0
Tra
nsp
ort
eq
uip
me
nt
-1.8
4.4
3.9
-11
.41
4.3
8.1
14
.3
Sum
be
r bio
logi dip
upuk
10
.62
5.5
20
.5-2
.61
7.5
18
.58
.7B
iolo
gic
al cu
ltiv
ate
d r
eso
urc
es
Pro
duk h
art
a inte
lek
10
.42
3.4
10
.67
.01
0.6
14
.71
4.8
Inte
lle
ctu
al p
rop
ert
y p
rod
ucts
Ase
t la
in-1
0.5
13
.6-1
4.2
-38
.3-1
2.0
89
.8-3
.9O
the
r a
sse
ts
8.1
13
.86
.3-1
.11
4.8
9.7
22
.6
Str
uktu
r6
.21
1.2
5.4
3.0
7.2
5.4
25
.1S
tru
ctu
re
Pe
rala
tan p
enga
ngkuta
n4
2.6
16
.9-1
0.4
-0.6
34
.2-3
.72
5.5
Tra
nsp
ort
eq
uip
me
nt
-2.4
4.4
3.7
-11
.61
3.7
8.1
13
.4
Sum
be
r bio
logi dip
upuk
8.9
11
.01
6.6
-7.2
7.3
7.2
7.4
Bio
log
ica
l cu
ltiv
ate
d r
eso
urc
es
Pro
duk h
art
a inte
lek
8.3
18
.15
.17
.27
.19
.81
5.1
Inte
lle
ctu
al p
rop
ert
y p
rod
ucts
Ase
t la
in-1
0.8
13
.3-1
5.1
-38
.9-1
4.2
87
.2-6
.2O
the
r a
sse
ts
6.3
10
.42
.4-2
.71
1.9
6.2
19
.9
Pe
rala
tan I
CT
da
n la
in-la
in je
nte
ra
& p
era
lata
n
ICT
eq
uip
me
nt a
nd
oth
er
ma
ch
ine
ry &
eq
uip
me
nt
Ju
mla
hT
ota
l
20
09
20
10
20
11
e2
01
2p
Ye
ar
Je
nis
as
et
Ty
pe
of
as
se
ts
Pe
rala
tan I
CT
da
n la
in-la
in je
nte
ra
& p
era
lata
n
ICT
eq
uip
me
nt a
nd
oth
er
ma
ch
ine
ry &
eq
uip
me
nt
Ju
mla
hT
ota
l
Jad
ual
5D
: P
MT
K m
en
gik
ut
Jen
is A
set
Terp
eri
nci
pad
a H
arg
a M
ala
r 2005 -
Pera
tus p
eru
bah
an
tah
un
an
Tab
le 5
D:
GF
CF
by T
yp
e o
f D
eta
iled
Assets
at
Co
nsta
nt
2005 P
rices -
An
nu
al
perc
en
tag
e c
han
ge
Ta
hu
n2
00
52
00
62
00
72
00
8
20
10
20
11
e2
01
2p
Ye
ar
Je
nis
as
et
Ty
pe
of
as
se
ts
Jad
ual
5C
: P
MT
K m
en
gik
ut
Jen
is A
set
Terp
eri
nci
pad
a H
arg
a S
em
asa -
Pera
tus p
eru
bah
an
tah
un
an
Tab
le 5
C:
GF
CF
by T
yp
e o
f D
eta
iled
Assets
at
Cu
rren
t P
rices -
An
nu
al
perc
en
tag
e c
han
ge
Ta
hu
n2
00
52
00
62
00
72
00
82
00
9
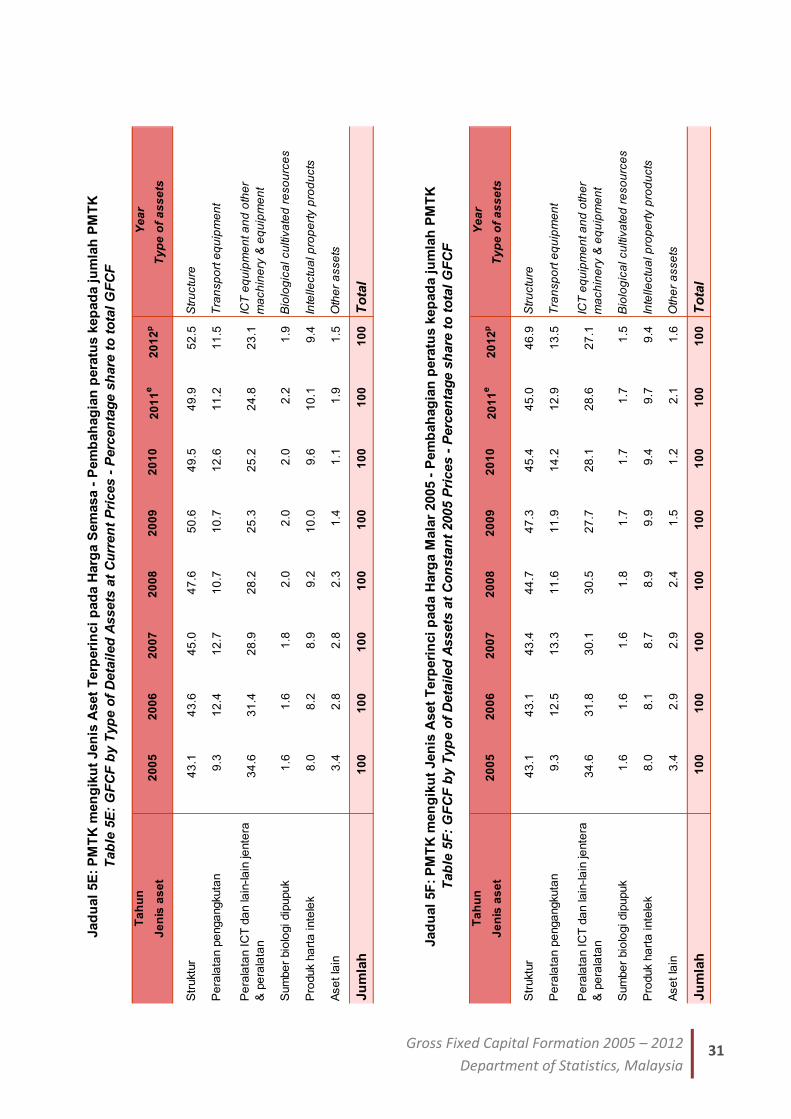
31 Gross Fixed Capital Formation 2005 – 2012
Department of Statistics, Malaysia
Str
uktu
r4
3.1
43
.64
5.0
47
.65
0.6
49
.54
9.9
52
.5S
tru
ctu
re
Pe
rala
tan p
enga
ngkuta
n9
.31
2.4
12
.71
0.7
10
.71
2.6
11
.21
1.5
Tra
nsp
ort
eq
uip
me
nt
34
.63
1.4
28
.92
8.2
25
.32
5.2
24
.82
3.1
Sum
be
r bio
logi dip
upuk
1.6
1.6
1.8
2.0
2.0
2.0
2.2
1.9
Bio
log
ica
l cu
ltiv
ate
d r
eso
urc
es
Pro
duk h
art
a inte
lek
8.0
8.2
8.9
9.2
10
.09
.61
0.1
9.4
Inte
lle
ctu
al p
rop
ert
y p
rod
ucts
Ase
t la
in3
.42
.82
.82
.31
.41
.11
.91
.5O
the
r a
sse
ts
10
01
00
10
01
00
10
01
00
10
01
00
Str
uktu
r4
3.1
43
.14
3.4
44
.74
7.3
45
.44
5.0
46
.9S
tru
ctu
re
Pe
rala
tan p
enga
ngkuta
n9
.31
2.5
13
.31
1.6
11
.91
4.2
12
.91
3.5
Tra
nsp
ort
eq
uip
me
nt
34
.63
1.8
30
.13
0.5
27
.72
8.1
28
.62
7.1
Sum
be
r bio
logi dip
upuk
1.6
1.6
1.6
1.8
1.7
1.7
1.7
1.5
Bio
log
ica
l cu
ltiv
ate
d r
eso
urc
es
Pro
duk h
art
a inte
lek
8.0
8.1
8.7
8.9
9.9
9.4
9.7
9.4
Inte
lle
ctu
al p
rop
ert
y p
rod
ucts
Ase
t la
in3
.42
.92
.92
.41
.51
.22
.11
.6O
the
r a
sse
ts
10
01
00
10
01
00
10
01
00
10
01
00
20
09
20
10
20
11
e2
01
2p
Ye
ar
Je
nis
as
et
Ty
pe
of
as
se
ts
Jad
ual
5E
: P
MT
K m
en
gik
ut
Jen
is A
set
Terp
eri
nci
pad
a H
arg
a S
em
asa -
Pem
bah
ag
ian
pera
tus k
ep
ad
a j
um
lah
PM
TK
Tab
le 5
E:
GF
CF
by T
yp
e o
f D
eta
iled
Assets
at
Cu
rren
t P
rices -
Perc
en
tag
e s
hare
to
to
tal
GF
CF
Ta
hu
n2
00
52
00
62
00
72
00
8
Pe
rala
tan I
CT
da
n la
in-la
in je
nte
ra
& p
era
lata
n
ICT
eq
uip
me
nt a
nd
oth
er
ma
ch
ine
ry &
eq
uip
me
nt
Ju
mla
hT
ota
l
Jad
ual
5F
: P
MT
K m
en
gik
ut
Jen
is A
set
Terp
eri
nci
pad
a H
arg
a M
ala
r 2005 -
Pem
bah
ag
ian
pera
tus k
ep
ad
a j
um
lah
PM
TK
Tab
le 5
F:
GF
CF
by T
yp
e o
f D
eta
iled
Assets
at
Co
nsta
nt
2005 P
rices -
Perc
en
tag
e s
hare
to
to
tal
GF
CF
Ta
hu
n2
00
52
00
62
00
72
00
8
Pe
rala
tan I
CT
da
n la
in-la
in je
nte
ra
& p
era
lata
n
ICT
eq
uip
me
nt a
nd
oth
er
ma
ch
ine
ry &
eq
uip
me
nt
Ju
mla
hT
ota
l
20
09
20
10
20
11
e2
01
2p
Ye
ar
Je
nis
as
et
Ty
pe
of
as
se
ts
32 Pembentukan Modal Tetap Kasar 2005 – 2012
Jabatan Perangkaan Malaysia
Muka surat ini sengaja dibiarkan kosong
This page is deliberately left blank
NOTA TEKNIKAL
TECHNICAL NOTES

NOTA TEKNIKAL TECHNICAL NOTES
33 Gross Fixed Capital Formation 2005 – 2012
Department of Statistics, Malaysia
PENGENALAN INTRODUCTION
Laporan ini memberikan maklumat
mengenai Pembentukan Modal Tetap
Kasar (PMTK) mengikut jenis aktiviti
ekonomi, jenis aset dan sektor awam &
swasta bagi tahun 2005 hingga 2012.
Anggaran ini telah disusun berdasarkan
konsep yang disarankan oleh Sistem
Akaun Negara 1993 dan 2008 (1993 &
2008 SNA), Pertubuhan Bangsa-
Bangsa Bersatu.
This report provides information on
Gross Fixed Capital Formation
(GFCF) by kind of economic activities,
by type of assets and public &
private sectors for year 2005 to 2012.
The estimation was compiled based
on the concepts recommended by
System of National Accounts 1993
and 2008 (1993 & 2008 SNA), United
Nations.
OBJECTIVE OBJEKTIF
Objektif utama penerbitan ini adalah
untuk menyed iakan mak lumat
mengenai PMTK mengikut jenis aktiviti
ekonomi, jenis aset dan sektor dari
tahun 2005-2012. Data ini digunakan
sebagai input untuk kerajaan dalam
perancangan pembangunan dan
penggubalan dasar serta memantau
program pelaburan. Data ini juga
digunakan oleh pengguna lain untuk
tujuan akademik dan perniagaan.
The main objective of this publication is
to provide information on GFCF by kind
of economic activities, by type of assets
and sectors from year 2005-2012. The
data will be used as an input for
government in development planning
and formulation of policies as well as
monitoring investment programmes.
The data is also used by other users for
academic and business purposes.
KONSEP DAN DEFINISI CONCEPTS AND DEFINITIONS
PMTK dalam penerbitan ini adalah
mematuhi definisi PMTK dalam Sistem
Akaun Negara.
The GFCF in this publication is
conformed to the definition of GFCF in
System of National Accounts.
34
NOTA TEKNIKAL TECHNICAL NOTES
Pembentukan Modal Tetap Kasar 2005 – 2012
Jabatan Perangkaan Malaysia
Pemerolehan termasuk pembelian aset
(baru atau terpakai) dan pembinaan
aset oleh pengeluar untuk kegunaan
mereka sendiri. Pelupusan termasuk
jualan aset untuk sekerap serta jualan
aset terpakai yang masih boleh
digunakan oleh pengeluar lain. PMTK
juga dikenali sebagai pelaburan dalam
aset tetap yang digunakan berulang
kali dalam proses pengeluaran bagi
tempoh lebih dari setahun.
Acquisitions include both purchases of
assets (new or used) and the
construction of assets by producers for
their own use. Disposals include sales
of assets for scrap as well as sales of
used assets in a working condition to
other producers. GFCF is also known
as investment in fixed assets that used
repeatedly in the processes of
production for more than one year.
PMTK diukur dengan jumlah nilai
perolehan aset tetap, ditolak pelupusan
aset tetap oleh residen dalam tempoh
perakaunan dengan tujuan ia
digunakan untuk proses Pengeluaran
ditambah perbelanjaan ke atas
perkhidmatan yang menambah nilai
kepada aset yang bukan dikeluarkan.
GFCF is measured by the total value
acquire, less disposal of fixed assets by
the residents during the accounting
period which intent to use for
production plus expenditure on services
that adds value to the non-produced
assets.
Bagi kes i s i rumah sebaga i
pengguna, semua perbelanjaan aset
tetap seperti peralatan pengangkutan
dan jentera & peralatan tidak dianggap
sebagai PMTK tetapi ia merupakan
penggunaan akhir.
In the case of households as
consumer, all expenditure of fixed
assets such as transport equipment
and machinery & equipment are not
considered as GFCF but final
consumption.
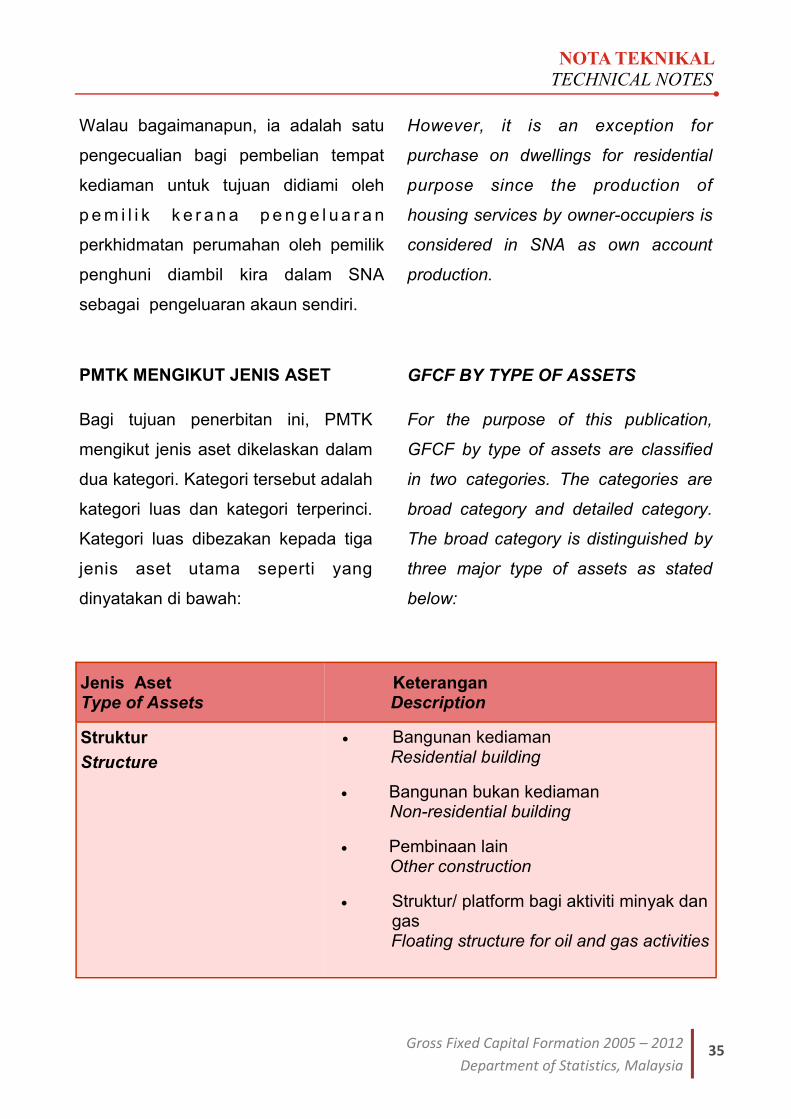
NOTA TEKNIKAL TECHNICAL NOTES
35 Gross Fixed Capital Formation 2005 – 2012
Department of Statistics, Malaysia
Walau bagaimanapun, ia adalah satu
pengecualian bagi pembelian tempat
kediaman untuk tujuan didiami oleh
p e m i l i k k e r a n a p e n g e l u a r a n
perkhidmatan perumahan oleh pemilik
penghuni diambil kira dalam SNA
sebagai pengeluaran akaun sendiri.
However, it is an exception for
purchase on dwellings for residential
purpose since the production of
housing services by owner-occupiers is
considered in SNA as own account
production.
PMTK MENGIKUT JENIS ASET
Bagi tujuan penerbitan ini, PMTK
mengikut jenis aset dikelaskan dalam
dua kategori. Kategori tersebut adalah
kategori luas dan kategori terperinci.
Kategori luas dibezakan kepada tiga
jenis aset utama seperti yang
dinyatakan di bawah:
GFCF BY TYPE OF ASSETS
For the purpose of this publication,
GFCF by type of assets are classified
in two categories. The categories are
broad category and detailed category.
The broad category is distinguished by
three major type of assets as stated
below:
Jenis Aset Type of Assets
Keterangan Description
Struktur
Structure
Bangunan kediaman Residential building
Bangunan bukan kediaman Non-residential building Pembinaan lain Other construction Struktur/ platform bagi aktiviti minyak dan
gas Floating structure for oil and gas activities
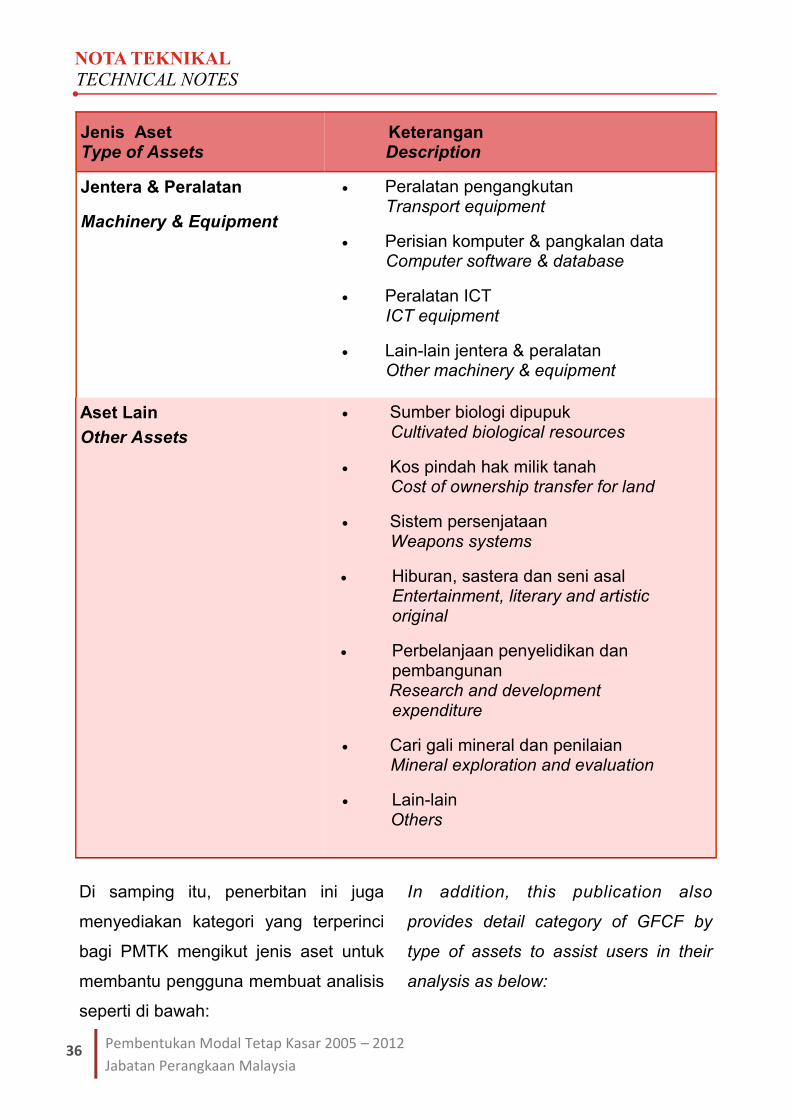
36
NOTA TEKNIKAL TECHNICAL NOTES
Pembentukan Modal Tetap Kasar 2005 – 2012
Jabatan Perangkaan Malaysia
Jenis Aset Type of Assets
Keterangan Description
Jentera & Peralatan Machinery & Equipment
Peralatan pengangkutan Transport equipment
Perisian komputer & pangkalan data Computer software & database
Peralatan ICT ICT equipment
Lain-lain jentera & peralatan Other machinery & equipment
Aset Lain
Other Assets
Sumber biologi dipupuk Cultivated biological resources
Kos pindah hak milik tanah Cost of ownership transfer for land
Sistem persenjataan Weapons systems
Hiburan, sastera dan seni asal Entertainment, literary and artistic original
Perbelanjaan penyelidikan dan
pembangunan Research and development
expenditure Cari gali mineral dan penilaian
Mineral exploration and evaluation
Lain-lain Others
Di samping itu, penerbitan ini juga
menyediakan kategori yang terperinci
bagi PMTK mengikut jenis aset untuk
membantu pengguna membuat analisis
seperti di bawah:
In addition, this publication also
provides detail category of GFCF by
type of assets to assist users in their
analysis as below:
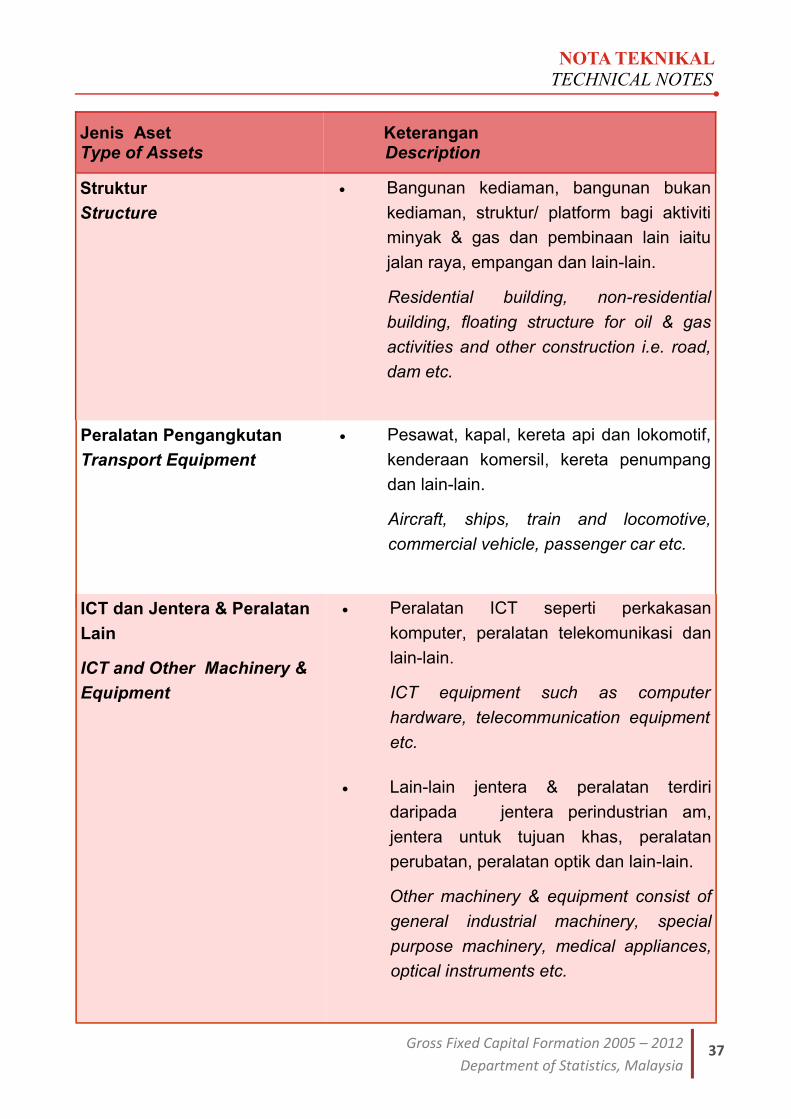
NOTA TEKNIKAL TECHNICAL NOTES
37 Gross Fixed Capital Formation 2005 – 2012
Department of Statistics, Malaysia
Jenis Aset Type of Assets
Keterangan Description
Struktur
Structure
Bangunan kediaman, bangunan bukan
kediaman, struktur/ platform bagi aktiviti
minyak & gas dan pembinaan lain iaitu
jalan raya, empangan dan lain-lain. Residential building, non-residential
building, floating structure for oil & gas
activities and other construction i.e. road,
dam etc.
Peralatan Pengangkutan
Transport Equipment
Pesawat, kapal, kereta api dan lokomotif,
kenderaan komersil, kereta penumpang
dan lain-lain.
Aircraft, ships, train and locomotive,
commercial vehicle, passenger car etc.
ICT dan Jentera & Peralatan
Lain ICT and Other Machinery &
Equipment
Peralatan ICT seperti perkakasan
komputer, peralatan telekomunikasi dan
lain-lain.
ICT equipment such as computer
hardware, telecommunication equipment
etc.
Lain-lain jentera & peralatan terdiri
daripada jentera perindustrian am,
jentera untuk tujuan khas, peralatan
perubatan, peralatan optik dan lain-lain.
Other machinery & equipment consist of
general industrial machinery, special
purpose machinery, medical appliances,
optical instruments etc.
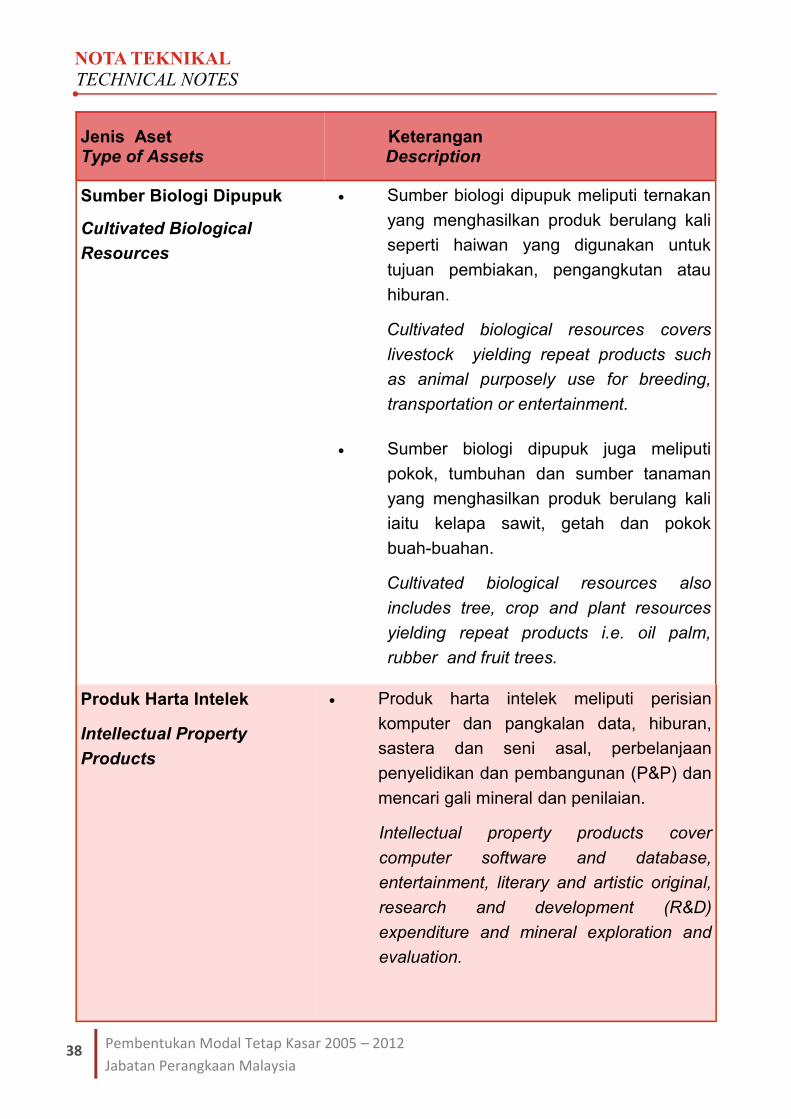
38
NOTA TEKNIKAL TECHNICAL NOTES
Pembentukan Modal Tetap Kasar 2005 – 2012
Jabatan Perangkaan Malaysia
Jenis Aset Type of Assets
Keterangan Description
Sumber Biologi Dipupuk Cultivated Biological
Resources
Sumber biologi dipupuk meliputi ternakan
yang menghasilkan produk berulang kali
seperti haiwan yang digunakan untuk
tujuan pembiakan, pengangkutan atau
hiburan. Cultivated biological resources covers
livestock yielding repeat products such
as animal purposely use for breeding,
transportation or entertainment.
Sumber biologi dipupuk juga meliputi
pokok, tumbuhan dan sumber tanaman
yang menghasilkan produk berulang kali
iaitu kelapa sawit, getah dan pokok
buah-buahan. Cultivated biological resources also
includes tree, crop and plant resources
yielding repeat products i.e. oil palm,
rubber and fruit trees.
Produk Harta Intelek Intellectual Property
Products
Produk harta intelek meliputi perisian
komputer dan pangkalan data, hiburan,
sastera dan seni asal, perbelanjaan
penyelidikan dan pembangunan (P&P) dan
mencari gali mineral dan penilaian.
Intellectual property products cover
computer software and database,
entertainment, literary and artistic original,
research and development (R&D)
expenditure and mineral exploration and
evaluation.
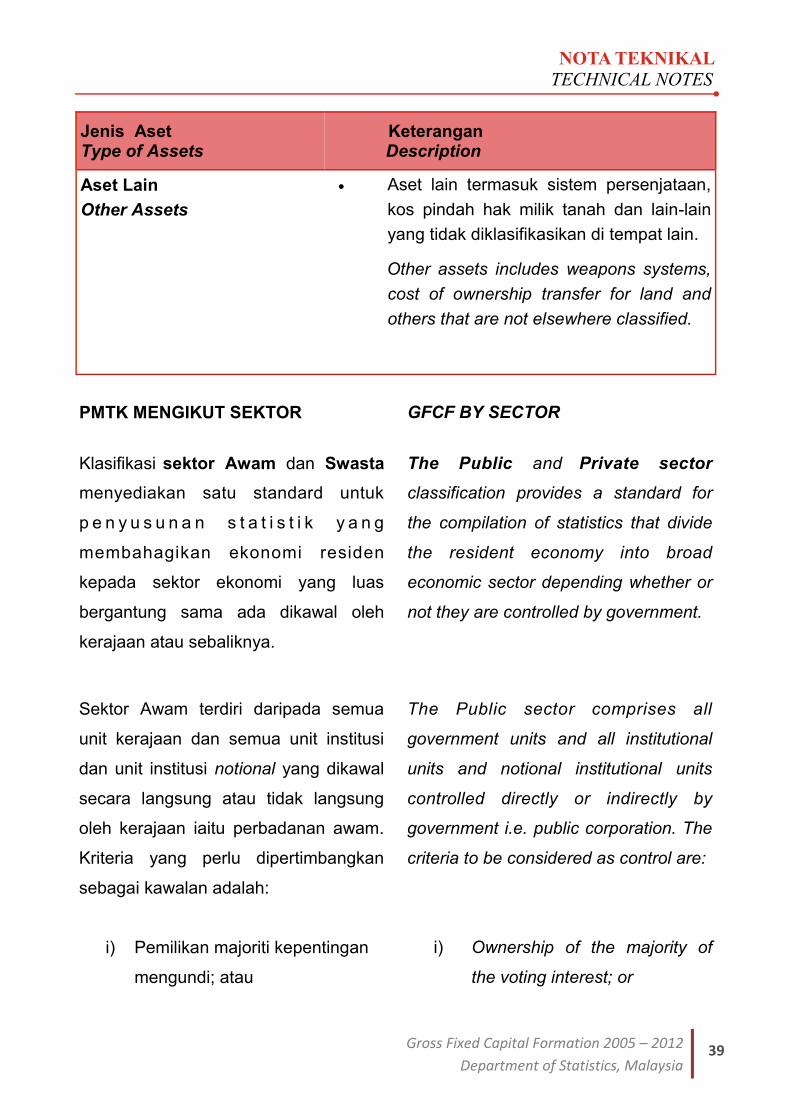
NOTA TEKNIKAL TECHNICAL NOTES
39 Gross Fixed Capital Formation 2005 – 2012
Department of Statistics, Malaysia
Jenis Aset Type of Assets
Keterangan Description
Aset Lain
Other Assets
Aset lain termasuk sistem persenjataan,
kos pindah hak milik tanah dan lain-lain
yang tidak diklasifikasikan di tempat lain. Other assets includes weapons systems,
cost of ownership transfer for land and
others that are not elsewhere classified.
Klasifikasi sektor Awam dan Swasta
menyediakan satu standard untuk
p e n y u s u n a n s t a t i s t i k y a n g
membahagikan ekonomi residen
kepada sektor ekonomi yang luas
bergantung sama ada dikawal oleh
kerajaan atau sebaliknya.
The Public and Private sector
classification provides a standard for
the compilation of statistics that divide
the resident economy into broad
economic sector depending whether or
not they are controlled by government.
PMTK MENGIKUT SEKTOR GFCF BY SECTOR
Sektor Awam terdiri daripada semua
unit kerajaan dan semua unit institusi
dan unit institusi notional yang dikawal
secara langsung atau tidak langsung
oleh kerajaan iaitu perbadanan awam.
Kriteria yang perlu dipertimbangkan
sebagai kawalan adalah:
The Public sector comprises all
government units and all institutional
units and notional institutional units
controlled directly or indirectly by
government i.e. public corporation. The
criteria to be considered as control are:
i) Pemilikan majoriti kepentingan
mengundi; atau
i) Ownership of the majority of
the voting interest; or
40
NOTA TEKNIKAL TECHNICAL NOTES
Pembentukan Modal Tetap Kasar 2005 – 2012
Jabatan Perangkaan Malaysia
ii) Kawalan ke atas lembaga atau
badan pentadbir lain; atau
iii) Kawalan dari segi pelantikan dan
pemecatan jawatan utama; atau
iv) Kawalan ke atas jawatankuasa
utama entiti; atau
v) Saham kencana dan opsyen;
atau
vi) Peraturan dan kawalan; atau
vii) Kawalan oleh pelanggan
utama; atau
viii) Kawalan disebabkan pinjaman
daripada kerajaan
ii) Control of the board or other
governing body; or
iii) Control of the appointment and
removal of key personnel; or
iv) Control of key committees of
the entity; or
v) Golden shares and options;
or
vi) Regulation and control; or
vii) Control by a dominant
customer; or
viii) Control attached to borrow from
the government
Sektor Swasta terdiri daripada semua
unit residen yang dikendalikan oleh
syarikat swasta kecuali yang dikawal
oleh kerajaan. Contoh sektor Swasta
ialah unit institusi isi rumah, NPISHs
dan perbadanan swasta. Jadual II
membezakan sektor Awam dan Swasta
mengikut institusi unit.
Private sector comprises all resident
units operated by private enterprises
except those controlled by government.
Example of Private sector are
household institution units, NPISHs and
pr ivate corporat ions. Table I I
distinguishes Public and Private sector
by institutional units.
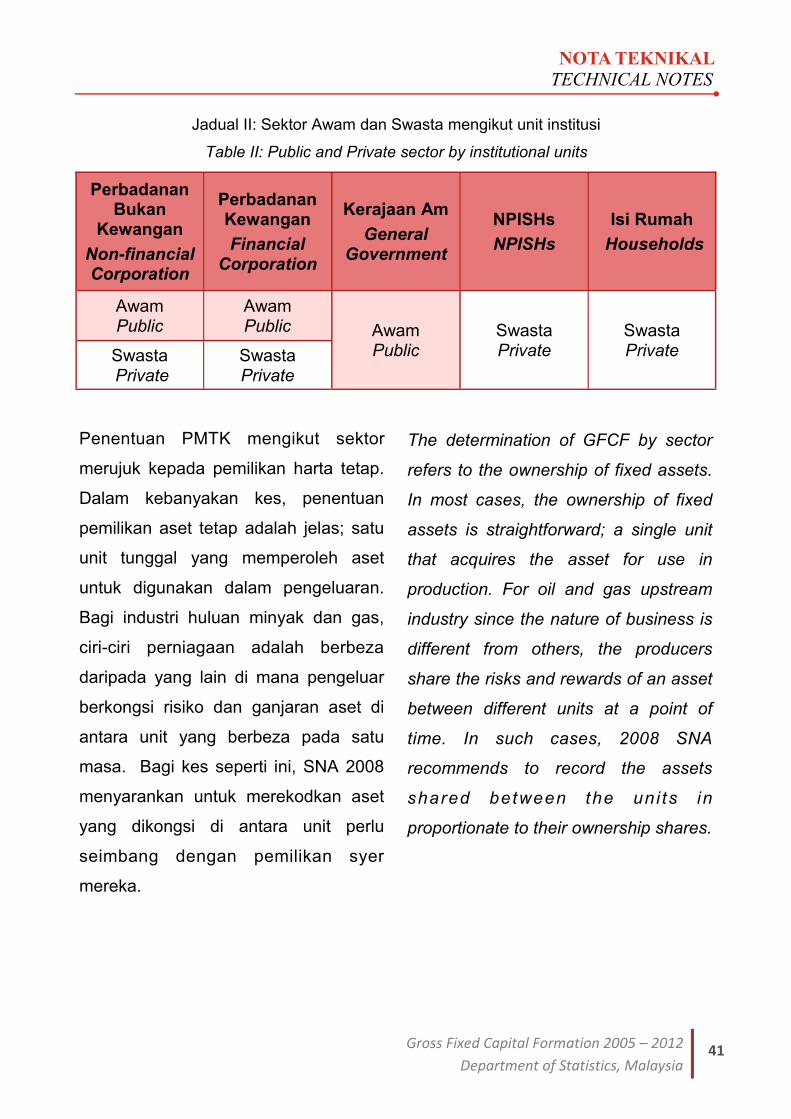
NOTA TEKNIKAL TECHNICAL NOTES
41 Gross Fixed Capital Formation 2005 – 2012
Department of Statistics, Malaysia
Penentuan PMTK mengikut sektor
merujuk kepada pemilikan harta tetap.
Dalam kebanyakan kes, penentuan
pemilikan aset tetap adalah jelas; satu
unit tunggal yang memperoleh aset
untuk digunakan dalam pengeluaran.
Bagi industri huluan minyak dan gas,
ciri-ciri perniagaan adalah berbeza
daripada yang lain di mana pengeluar
berkongsi risiko dan ganjaran aset di
antara unit yang berbeza pada satu
masa. Bagi kes seperti ini, SNA 2008
menyarankan untuk merekodkan aset
yang dikongsi di antara unit perlu
seimbang dengan pemilikan syer
mereka.
The determination of GFCF by sector
refers to the ownership of fixed assets.
In most cases, the ownership of fixed
assets is straightforward; a single unit
that acquires the asset for use in
production. For oil and gas upstream
industry since the nature of business is
different from others, the producers
share the risks and rewards of an asset
between different units at a point of
time. In such cases, 2008 SNA
recommends to record the assets
shared between the uni ts in
proportionate to their ownership shares.
Perbadanan Bukan
Kewangan Non-financial Corporation
Perbadanan Kewangan Financial
Corporation
Kerajaan Am General
Government
NPISHs NPISHs
Isi Rumah Households
Awam Public
Awam Public Awam
Public Swasta Private
Swasta Private Swasta
Private Swasta Private
Jadual II: Sektor Awam dan Swasta mengikut unit institusi
Table II: Public and Private sector by institutional units
42
NOTA TEKNIKAL TECHNICAL NOTES
Pembentukan Modal Tetap Kasar 2005 – 2012
Jabatan Perangkaan Malaysia
GFCF BY KIND OF ECONOMIC
ACTIVITY
PMTK MENGIKUT JENIS AKTIVITI
EKONOMI
Jenis aktiviti ekonomi merujuk
kepada kumpulan pertubuhan yang
terlibat dalam aktiviti utama yang sama.
Aktiviti utama pertubuhan adalah
kumpulan dalam industri berdasarkan
kepada Piawaian Klasifikasi Industri
Malaysia 2000 (MSIC 2000) yang selari
dengan Piawaian Klasifikasi Industri
Antarabangsa bagi Semua Aktiviti
Ekonomi (ISIC) Semakan 3. Bagi
penyusunan ini, semua unit kerajaan
disusun di bawah aktiviti Perkhidmatan.
Jadual III menunjukkan lima aktiviti
utama ekonomi mengikut sub aktiviti.
Kind of economic activity refers to
the group of establishments engaged in
the same or similar principal activity.
The principal activity of establishments
are grouped into industries according to
the Malaysia Standard Industrial
Classification 2000 (MSIC 2000) which
is aligned with the International
Standard Industrial Classification of All
Economic Activities (ISIC) Revision 3.
In this compilation, all government units
are grouped under Services activity.
Table III shows the five main economic
activities by sub-activities.
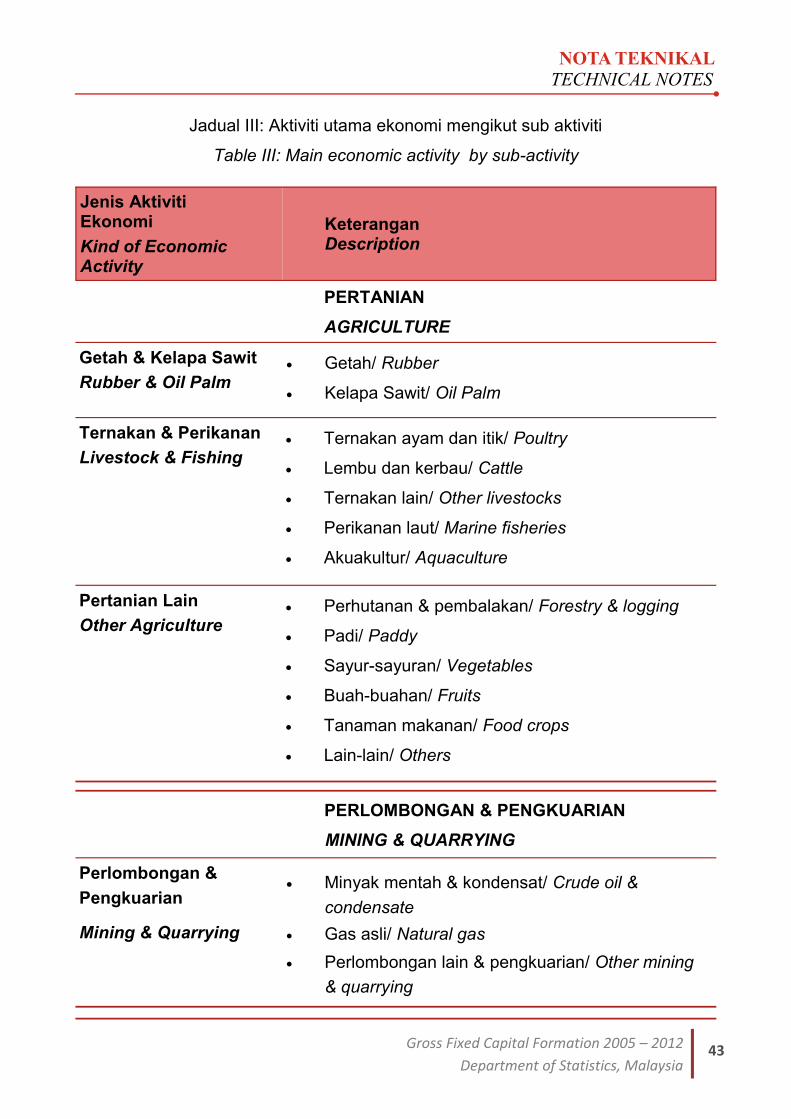
NOTA TEKNIKAL TECHNICAL NOTES
43 Gross Fixed Capital Formation 2005 – 2012
Department of Statistics, Malaysia
Jenis Aktiviti Ekonomi Kind of Economic Activity
Keterangan Description
PERTANIAN
AGRICULTURE
Getah & Kelapa Sawit
Rubber & Oil Palm
Getah/ Rubber Kelapa Sawit/ Oil Palm
Ternakan & Perikanan
Livestock & Fishing
Ternakan ayam dan itik/ Poultry Lembu dan kerbau/ Cattle Ternakan lain/ Other livestocks Perikanan laut/ Marine fisheries Akuakultur/ Aquaculture
Pertanian Lain
Other Agriculture
Perhutanan & pembalakan/ Forestry & logging Padi/ Paddy Sayur-sayuran/ Vegetables Buah-buahan/ Fruits Tanaman makanan/ Food crops Lain-lain/ Others
PERLOMBONGAN & PENGKUARIAN
MINING & QUARRYING
Perlombongan &
Pengkuarian Mining & Quarrying
Minyak mentah & kondensat/ Crude oil &
condensate Gas asli/ Natural gas Perlombongan lain & pengkuarian/ Other mining
& quarrying
Jadual III: Aktiviti utama ekonomi mengikut sub aktiviti
Table III: Main economic activity by sub-activity
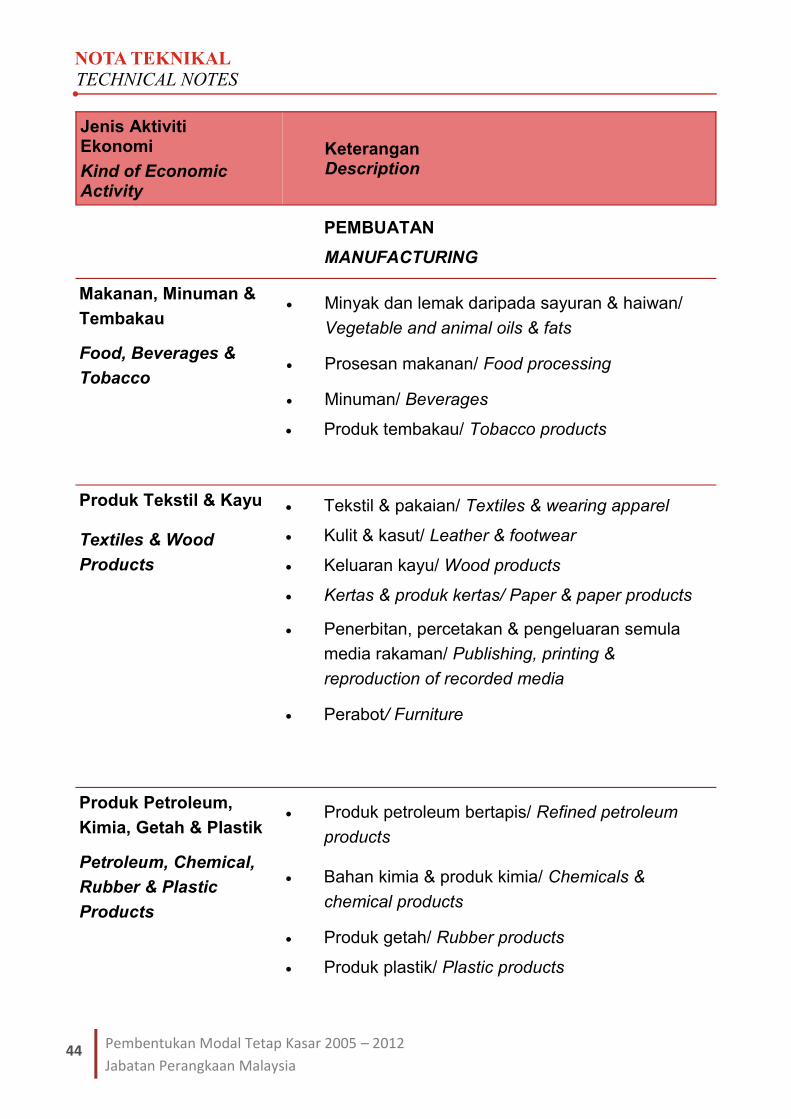
44
NOTA TEKNIKAL TECHNICAL NOTES
Pembentukan Modal Tetap Kasar 2005 – 2012
Jabatan Perangkaan Malaysia
Jenis Aktiviti Ekonomi Kind of Economic Activity
Keterangan Description
PEMBUATAN
MANUFACTURING
Makanan, Minuman &
Tembakau Food, Beverages &
Tobacco
Minyak dan lemak daripada sayuran & haiwan/
Vegetable and animal oils & fats
Prosesan makanan/ Food processing Minuman/ Beverages Produk tembakau/ Tobacco products
Produk Tekstil & Kayu
Textiles & Wood
Products
Tekstil & pakaian/ Textiles & wearing apparel Kulit & kasut/ Leather & footwear Keluaran kayu/ Wood products Kertas & produk kertas/ Paper & paper products Penerbitan, percetakan & pengeluaran semula
media rakaman/ Publishing, printing &
reproduction of recorded media
Perabot/ Furniture
Produk Petroleum,
Kimia, Getah & Plastik Petroleum, Chemical,
Rubber & Plastic
Products
Produk petroleum bertapis/ Refined petroleum
products
Bahan kimia & produk kimia/ Chemicals &
chemical products
Produk getah/ Rubber products Produk plastik/ Plastic products
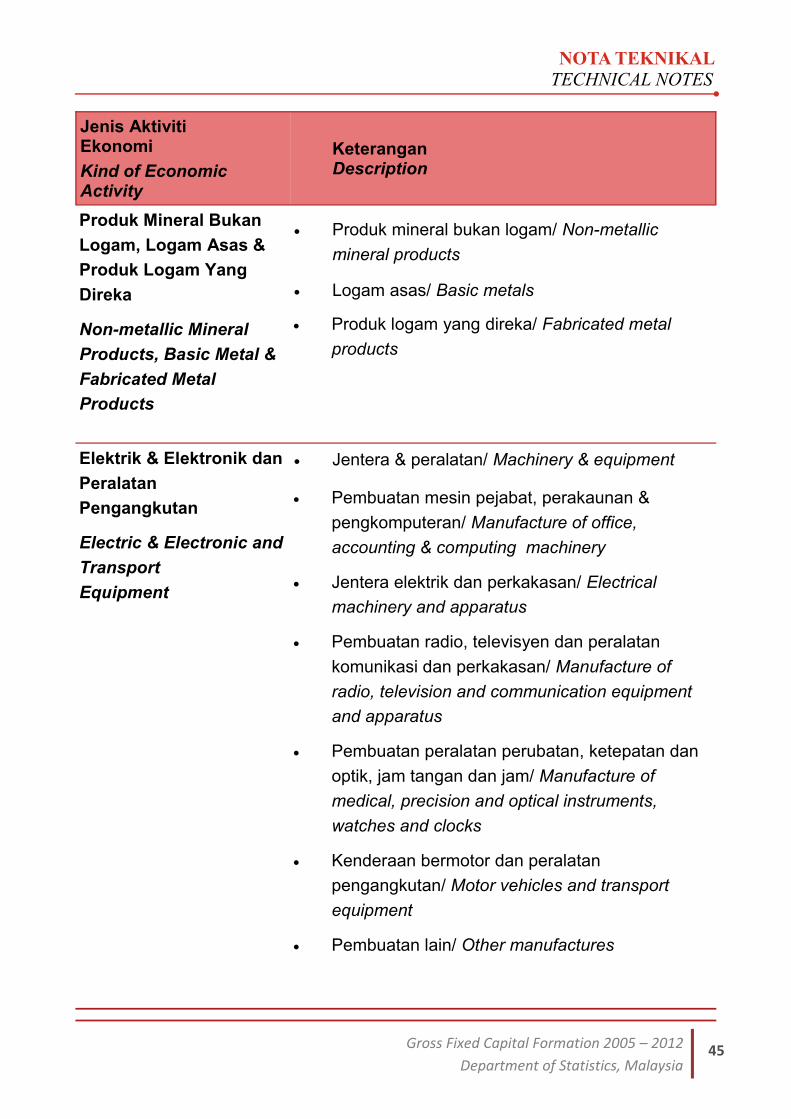
NOTA TEKNIKAL TECHNICAL NOTES
45 Gross Fixed Capital Formation 2005 – 2012
Department of Statistics, Malaysia
Jenis Aktiviti Ekonomi Kind of Economic Activity
Keterangan Description
Produk Mineral Bukan
Logam, Logam Asas &
Produk Logam Yang
Direka Non-metallic Mineral
Products, Basic Metal &
Fabricated Metal
Products
Produk mineral bukan logam/ Non-metallic
mineral products
Logam asas/ Basic metals Produk logam yang direka/ Fabricated metal
products
Elektrik & Elektronik dan
Peralatan
Pengangkutan Electric & Electronic and
Transport
Equipment
Jentera & peralatan/ Machinery & equipment Pembuatan mesin pejabat, perakaunan &
pengkomputeran/ Manufacture of office,
accounting & computing machinery Jentera elektrik dan perkakasan/ Electrical
machinery and apparatus Pembuatan radio, televisyen dan peralatan
komunikasi dan perkakasan/ Manufacture of
radio, television and communication equipment
and apparatus Pembuatan peralatan perubatan, ketepatan dan
optik, jam tangan dan jam/ Manufacture of
medical, precision and optical instruments,
watches and clocks Kenderaan bermotor dan peralatan
pengangkutan/ Motor vehicles and transport
equipment Pembuatan lain/ Other manufactures
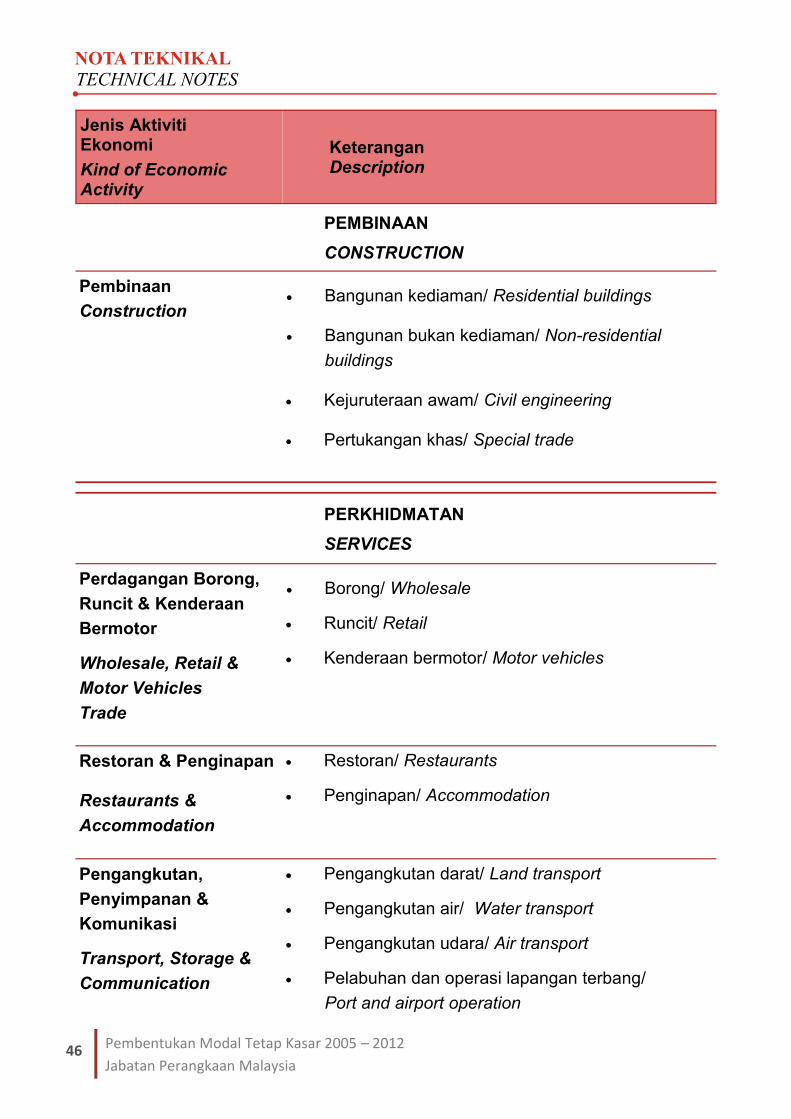
46
NOTA TEKNIKAL TECHNICAL NOTES
Pembentukan Modal Tetap Kasar 2005 – 2012
Jabatan Perangkaan Malaysia
Jenis Aktiviti Ekonomi Kind of Economic Activity
Keterangan Description
PEMBINAAN
CONSTRUCTION
Pembinaan
Construction
Bangunan kediaman/ Residential buildings
Bangunan bukan kediaman/ Non-residential
buildings
Kejuruteraan awam/ Civil engineering
Pertukangan khas/ Special trade
PERKHIDMATAN
SERVICES
Perdagangan Borong,
Runcit & Kenderaan
Bermotor Wholesale, Retail &
Motor Vehicles
Trade
Borong/ Wholesale Runcit/ Retail Kenderaan bermotor/ Motor vehicles
Restoran & Penginapan
Restaurants &
Accommodation
Restoran/ Restaurants Penginapan/ Accommodation
Pengangkutan,
Penyimpanan &
Komunikasi Transport, Storage &
Communication
Pengangkutan darat/ Land transport Pengangkutan air/ Water transport Pengangkutan udara/ Air transport Pelabuhan dan operasi lapangan terbang/
Port and airport operation
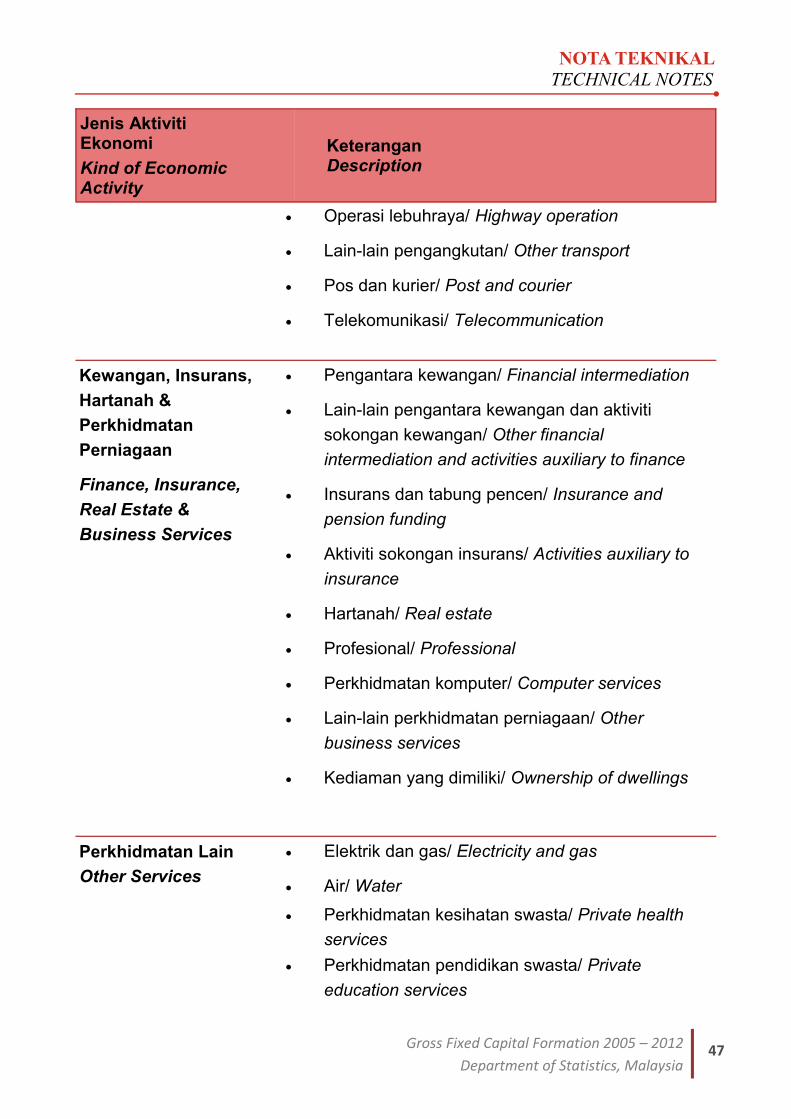
NOTA TEKNIKAL TECHNICAL NOTES
47 Gross Fixed Capital Formation 2005 – 2012
Department of Statistics, Malaysia
Operasi lebuhraya/ Highway operation Lain-lain pengangkutan/ Other transport Pos dan kurier/ Post and courier Telekomunikasi/ Telecommunication
Kewangan, Insurans,
Hartanah &
Perkhidmatan
Perniagaan Finance, Insurance,
Real Estate &
Business Services
Pengantara kewangan/ Financial intermediation Lain-lain pengantara kewangan dan aktiviti
sokongan kewangan/ Other financial
intermediation and activities auxiliary to finance Insurans dan tabung pencen/ Insurance and
pension funding Aktiviti sokongan insurans/ Activities auxiliary to
insurance Hartanah/ Real estate Profesional/ Professional Perkhidmatan komputer/ Computer services Lain-lain perkhidmatan perniagaan/ Other
business services Kediaman yang dimiliki/ Ownership of dwellings
Perkhidmatan Lain
Other Services
Elektrik dan gas/ Electricity and gas Air/ Water
Perkhidmatan kesihatan swasta/ Private health
services
Perkhidmatan pendidikan swasta/ Private
education services
Jenis Aktiviti Ekonomi Kind of Economic Activity
Keterangan Description
48
NOTA TEKNIKAL TECHNICAL NOTES
Pembentukan Modal Tetap Kasar 2005 – 2012
Jabatan Perangkaan Malaysia
Perkhidmatan swasta lain/ Other private
services Perkhidmatan kerajaan/ Government services Institusi bukan keuntungan yang berkhidmat
kepada isi rumah/ Non-profit institution
serving households Perkhidmatan domestik bagi isi rumah/
Domestic services of households
Jenis Aktiviti Ekonomi Kind of Economic Activity
Keterangan Description
METODOLOGI & SUMBER DATA
METHODOLOGY & DATA SOURCES

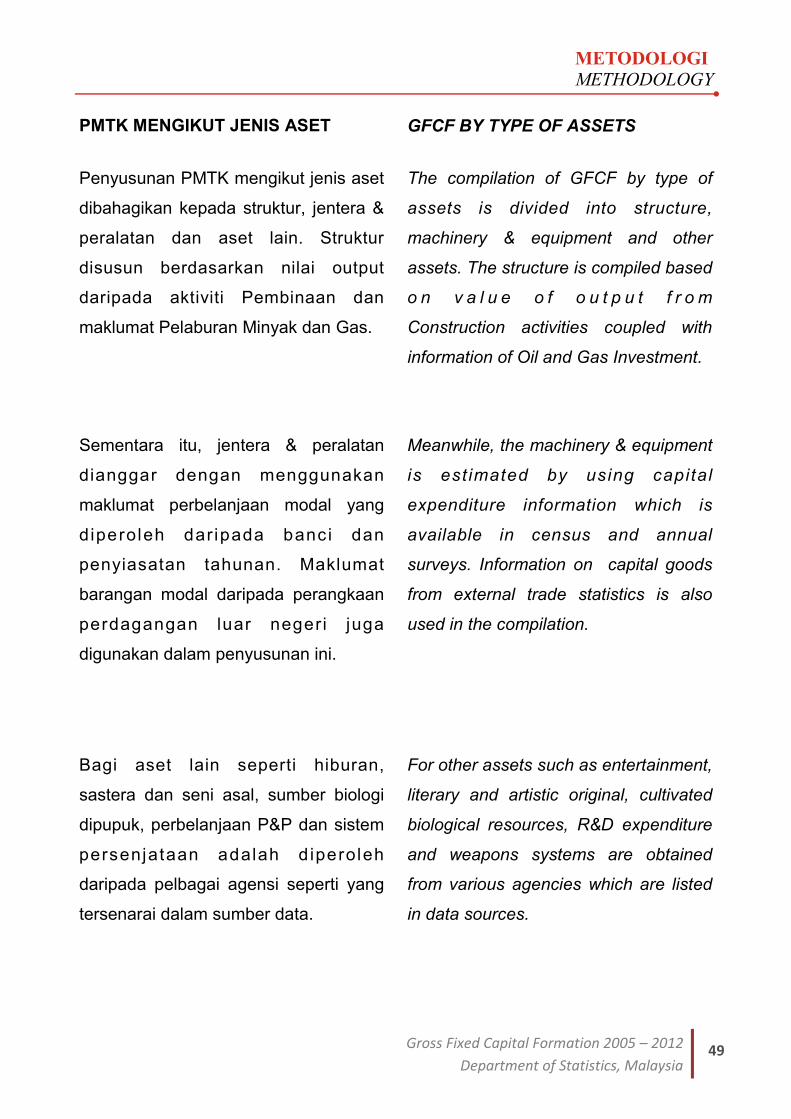
METODOLOGI METHODOLOGY
49 Gross Fixed Capital Formation 2005 – 2012
Department of Statistics, Malaysia
PMTK MENGIKUT JENIS ASET GFCF BY TYPE OF ASSETS
Penyusunan PMTK mengikut jenis aset
dibahagikan kepada struktur, jentera &
peralatan dan aset lain. Struktur
disusun berdasarkan nilai output
daripada aktiviti Pembinaan dan
maklumat Pelaburan Minyak dan Gas.
The compilation of GFCF by type of
assets is divided into structure,
machinery & equipment and other
assets. The structure is compiled based
o n v a l u e o f o u t p u t f r o m
Construction activities coupled with
information of Oil and Gas Investment.
Meanwhile, the machinery & equipment
is est imated by using capital
expenditure information which is
available in census and annual
surveys. Information on capital goods
from external trade statistics is also
used in the compilation.
For other assets such as entertainment,
literary and artistic original, cultivated
biological resources, R&D expenditure
and weapons systems are obtained
from various agencies which are listed
in data sources.
Sementara itu, jentera & peralatan
dianggar dengan menggunakan
maklumat perbelanjaan modal yang
diperoleh dar ipada banci dan
penyiasatan tahunan. Maklumat
barangan modal daripada perangkaan
perdagangan luar negeri juga
digunakan dalam penyusunan ini.
Bagi aset lain seperti hiburan,
sastera dan seni asal, sumber biologi
dipupuk, perbelanjaan P&P dan sistem
persenjataan adalah d iperoleh
daripada pelbagai agensi seperti yang
tersenarai dalam sumber data.
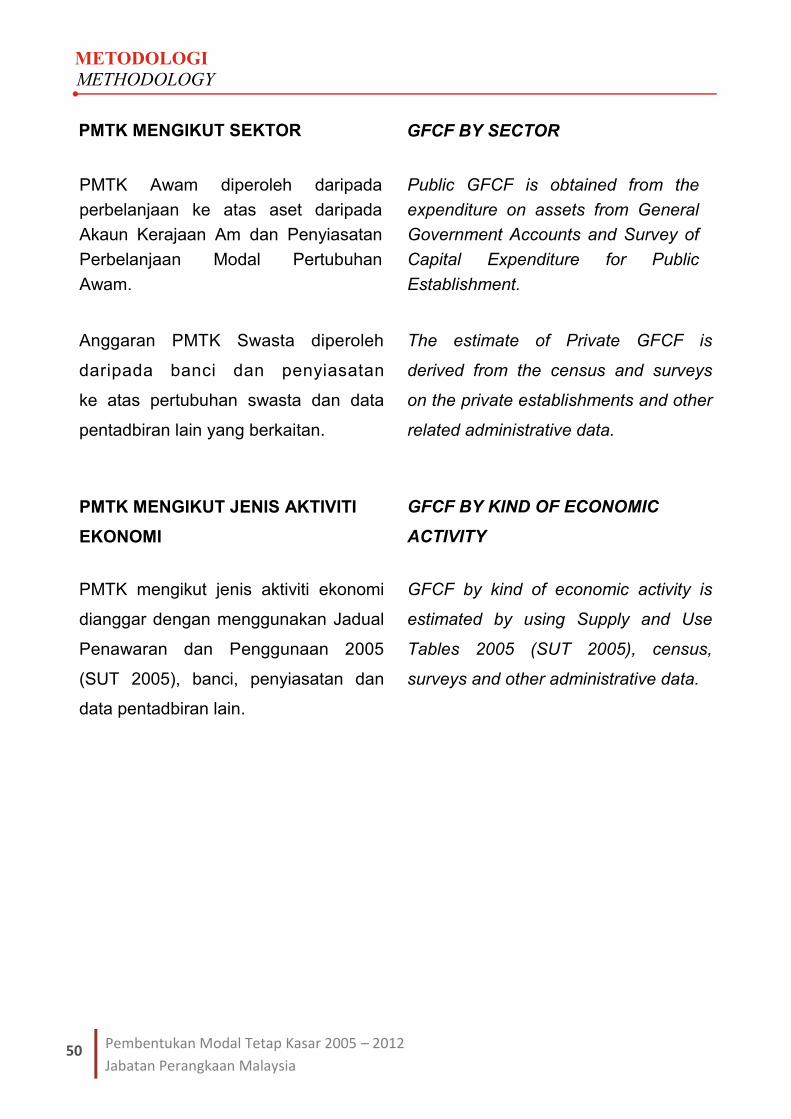
50
METODOLOGI METHODOLOGY
Pembentukan Modal Tetap Kasar 2005 – 2012
Jabatan Perangkaan Malaysia
Anggaran PMTK Swasta diperoleh
daripada banci dan penyiasatan
ke atas pertubuhan swasta dan data
pentadbiran lain yang berkaitan.
The estimate of Private GFCF is
derived from the census and surveys
on the private establishments and other
related administrative data.
PMTK mengikut jenis aktiviti ekonomi
dianggar dengan menggunakan Jadual
Penawaran dan Penggunaan 2005
(SUT 2005), banci, penyiasatan dan
data pentadbiran lain.
GFCF by kind of economic activity is
estimated by using Supply and Use
Tables 2005 (SUT 2005), census,
surveys and other administrative data.
PMTK MENGIKUT JENIS AKTIVITI
EKONOMI
GFCF BY KIND OF ECONOMIC
ACTIVITY
PMTK MENGIKUT SEKTOR GFCF BY SECTOR
PMTK Awam diperoleh daripada
perbelanjaan ke atas aset daripada
Akaun Kerajaan Am dan Penyiasatan
Perbelanjaan Modal Pertubuhan
Awam.
Public GFCF is obtained from the
expenditure on assets from General
Government Accounts and Survey of
Capital Expenditure for Public
Establishment.
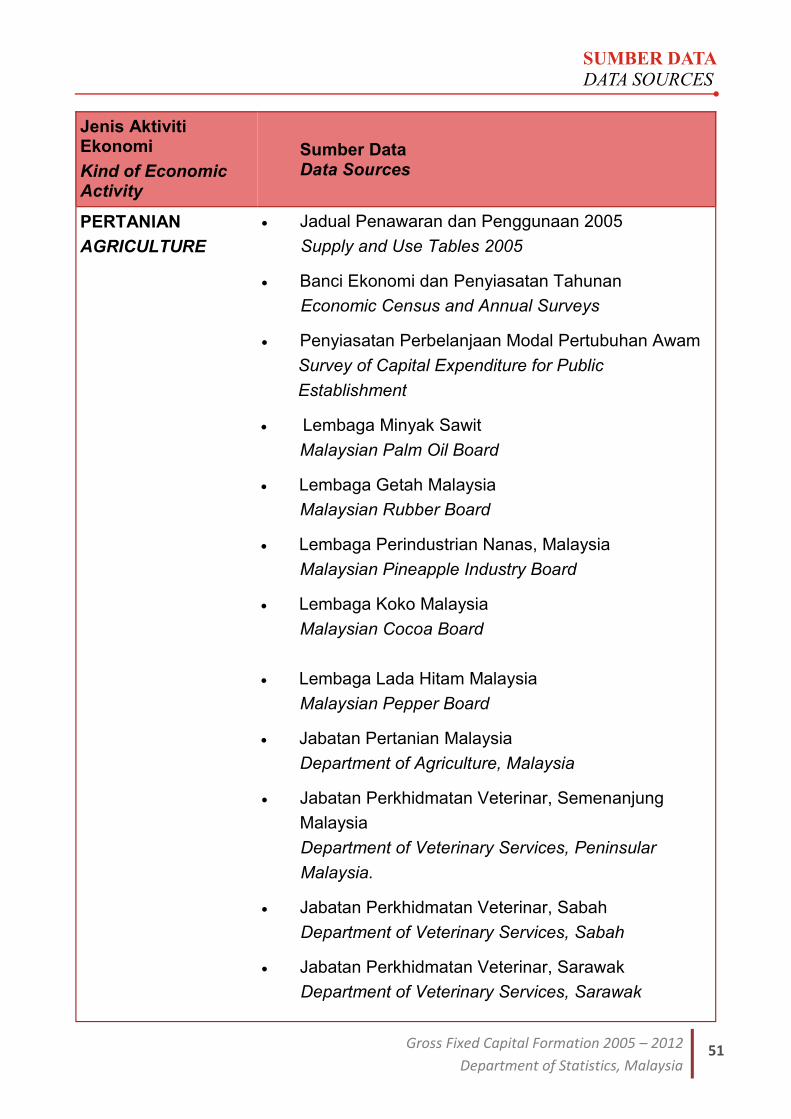
SUMBER DATA DATA SOURCES
51 Gross Fixed Capital Formation 2005 – 2012
Department of Statistics, Malaysia
Jenis Aktiviti Ekonomi Kind of Economic Activity
Sumber Data Data Sources
PERTANIAN
AGRICULTURE
Jadual Penawaran dan Penggunaan 2005
Supply and Use Tables 2005 Banci Ekonomi dan Penyiasatan Tahunan
Economic Census and Annual Surveys Penyiasatan Perbelanjaan Modal Pertubuhan Awam
Survey of Capital Expenditure for Public
Establishment Lembaga Minyak Sawit
Malaysian Palm Oil Board Lembaga Getah Malaysia
Malaysian Rubber Board Lembaga Perindustrian Nanas, Malaysia
Malaysian Pineapple Industry Board Lembaga Koko Malaysia
Malaysian Cocoa Board
Lembaga Lada Hitam Malaysia
Malaysian Pepper Board Jabatan Pertanian Malaysia
Department of Agriculture, Malaysia Jabatan Perkhidmatan Veterinar, Semenanjung
Malaysia
Department of Veterinary Services, Peninsular
Malaysia. Jabatan Perkhidmatan Veterinar, Sabah
Department of Veterinary Services, Sabah Jabatan Perkhidmatan Veterinar, Sarawak
Department of Veterinary Services, Sarawak
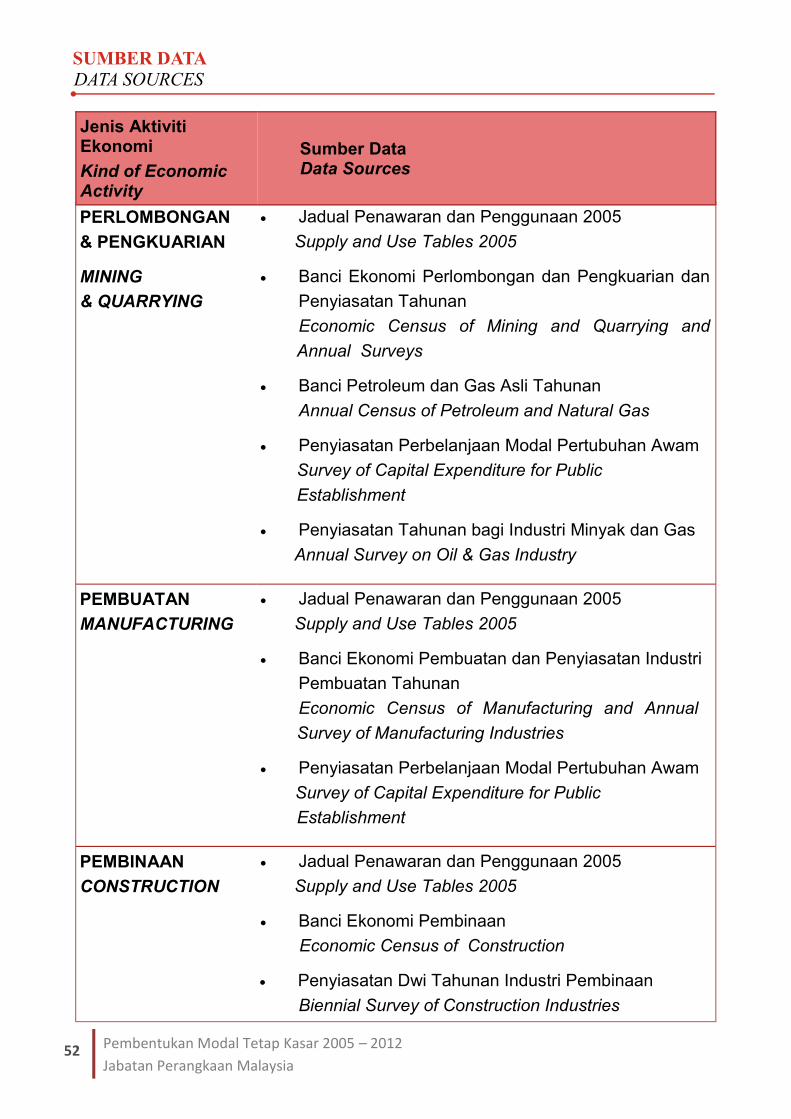
52
SUMBER DATA DATA SOURCES
Pembentukan Modal Tetap Kasar 2005 – 2012
Jabatan Perangkaan Malaysia
PERLOMBONGAN
& PENGKUARIAN MINING
& QUARRYING
Jadual Penawaran dan Penggunaan 2005
Supply and Use Tables 2005 Banci Ekonomi Perlombongan dan Pengkuarian dan
Penyiasatan Tahunan
Economic Census of Mining and Quarrying and
Annual Surveys Banci Petroleum dan Gas Asli Tahunan
Annual Census of Petroleum and Natural Gas Penyiasatan Perbelanjaan Modal Pertubuhan Awam
Survey of Capital Expenditure for Public
Establishment Penyiasatan Tahunan bagi Industri Minyak dan Gas
Annual Survey on Oil & Gas Industry
PEMBUATAN
MANUFACTURING
Jadual Penawaran dan Penggunaan 2005
Supply and Use Tables 2005 Banci Ekonomi Pembuatan dan Penyiasatan Industri
Pembuatan Tahunan
Economic Census of Manufacturing and Annual
Survey of Manufacturing Industries Penyiasatan Perbelanjaan Modal Pertubuhan Awam
Survey of Capital Expenditure for Public
Establishment
PEMBINAAN
CONSTRUCTION
Jadual Penawaran dan Penggunaan 2005
Supply and Use Tables 2005 Banci Ekonomi Pembinaan
Economic Census of Construction Penyiasatan Dwi Tahunan Industri Pembinaan
Biennial Survey of Construction Industries
Jenis Aktiviti Ekonomi Kind of Economic Activity
Sumber Data Data Sources
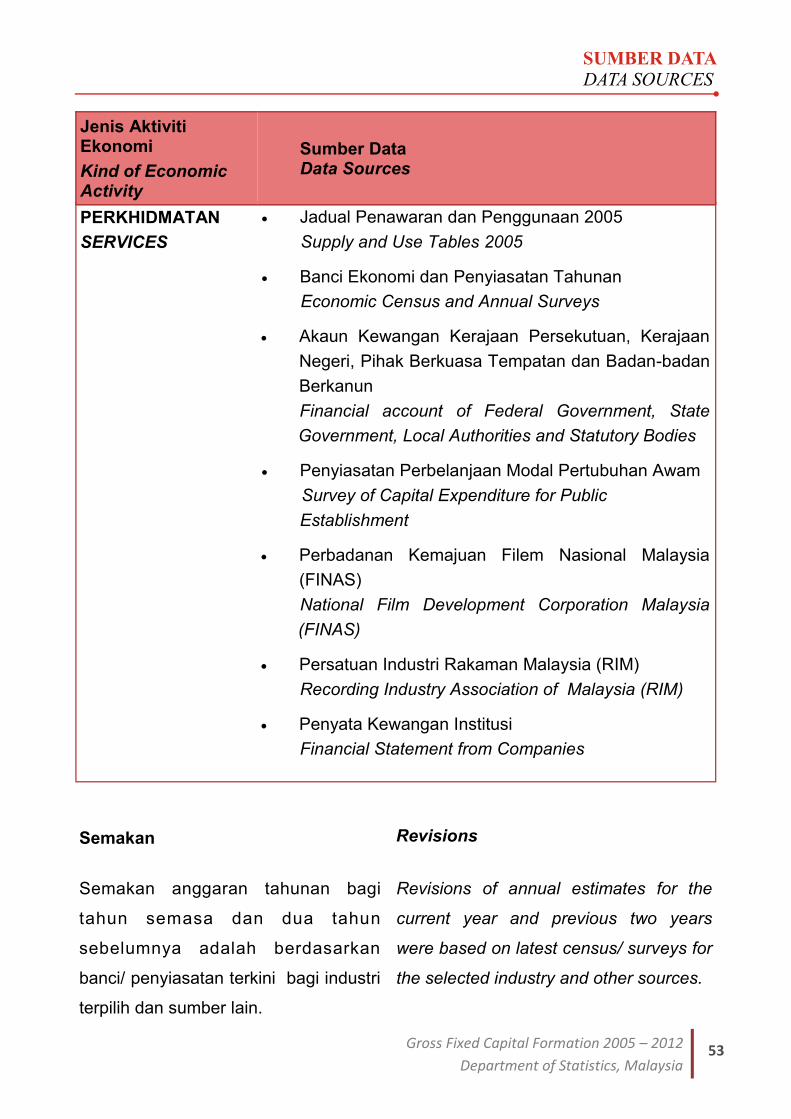
SUMBER DATA DATA SOURCES
53 Gross Fixed Capital Formation 2005 – 2012
Department of Statistics, Malaysia
PERKHIDMATAN
SERVICES
Jadual Penawaran dan Penggunaan 2005
Supply and Use Tables 2005 Banci Ekonomi dan Penyiasatan Tahunan
Economic Census and Annual Surveys Akaun Kewangan Kerajaan Persekutuan, Kerajaan
Negeri, Pihak Berkuasa Tempatan dan Badan-badan
Berkanun
Financial account of Federal Government, State
Government, Local Authorities and Statutory Bodies
Penyiasatan Perbelanjaan Modal Pertubuhan Awam
Survey of Capital Expenditure for Public
Establishment Perbadanan Kemajuan Filem Nasional Malaysia
(FINAS)
National Film Development Corporation Malaysia
(FINAS) Persatuan Industri Rakaman Malaysia (RIM)
Recording Industry Association of Malaysia (RIM) Penyata Kewangan Institusi
Financial Statement from Companies
Semakan anggaran tahunan bagi
tahun semasa dan dua tahun
sebelumnya adalah berdasarkan
banci/ penyiasatan terkini bagi industri
terpilih dan sumber lain.
Revisions of annual estimates for the
current year and previous two years
were based on latest census/ surveys for
the selected industry and other sources.
Semakan Revisions
Jenis Aktiviti Ekonomi Kind of Economic Activity
Sumber Data Data Sources
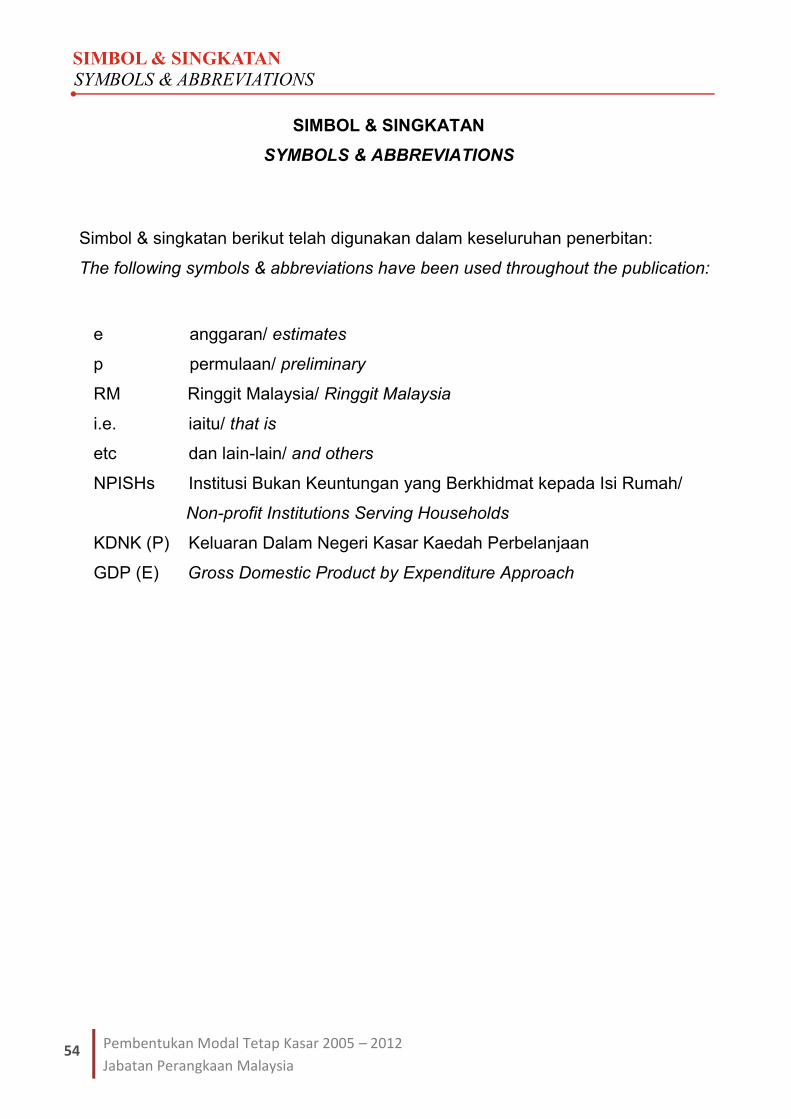
54
SIMBOL & SINGKATAN SYMBOLS & ABBREVIATIONS
Pembentukan Modal Tetap Kasar 2005 – 2012
Jabatan Perangkaan Malaysia
Simbol & singkatan berikut telah digunakan dalam keseluruhan penerbitan:
The following symbols & abbreviations have been used throughout the publication:
SIMBOL & SINGKATAN
SYMBOLS & ABBREVIATIONS
e anggaran/ estimates
p permulaan/ preliminary
RM Ringgit Malaysia/ Ringgit Malaysia
i.e. iaitu/ that is
etc dan lain-lain/ and others
NPISHs Institusi Bukan Keuntungan yang Berkhidmat kepada Isi Rumah/
Non-profit Institutions Serving Households
KDNK (P) Keluaran Dalam Negeri Kasar Kaedah Perbelanjaan
GDP (E) Gross Domestic Product by Expenditure Approach