report sebenar
TRANSCRIPT
8/2/2019 Report Sebenar
http://slidepdf.com/reader/full/report-sebenar 1/73
INDUSTRIAL TRAINING REPORT
SUNGAI HARMONI SDN BHD
Loji Pembersihan Air Sungai Selangor,
KM3, Jalan Bukit Badong,
45600 Bestari Jaya, Selangor
NAME : MOHAMAD HADI BIN TAIRIN
MATRIC NO.: KB07 111
PROGRAM : DIPLOMA OF CHEMICAL ENGINEERING
(PROCESS PLANT)
FACULTY OF CHEMICAL & NATURAL RESOURCE ENGINEERING
UNIVERSITY MALAYSIA PAHANG
JANUARY 2010-JUNE 2010
8/2/2019 Report Sebenar
http://slidepdf.com/reader/full/report-sebenar 2/73
I hereby acknowledge that this Industrial Training Report has been verified and it does
not contain any CONFIDENTAL information to be released to the public
Signature : …………………………………………………………………..
Official Stamp: …………………………………………………………………..
Date : …………………………………………………………………..

8/2/2019 Report Sebenar
http://slidepdf.com/reader/full/report-sebenar 3/73
APPRECIATION
Assalamualaikum,
Salawat and salutation worshiped to Prophet great reverence Muhammad SAW and
friends and fighters crusade in road once Allah SWT. Firstly, I wish to convey
thanksgiving to Allah SWT because with overflow and Allah award I can finish this
training report industry with successful.
In this opportunity, I this record wish a thousand thanks to Plant Manager SSP1, Tuan
Haji Zulfikri Bin Suboh have vested opportunity for me to carry training industry in this
firm. Do not forget to Encik Anuar Bin Sudin has given a little pep talk at the strating my
beginning were in this company. I also wish to say a lots of thanks to Puan Hafisah Binti
Ramli which account my Supervisor above her tired and perseverance in drafting and
arrange various roster and projects which need undertaken by me. May God only those
can reciprocate her noble service.
Are not left behind vote of thanks to line staff and staff in every department whether
which included directly or indirect above cooperation and treatment good and coaching
all of you in ensuring all works able to proceed smoothly.
Lastly, I want to apply forgiveness and apology to all of you if there is weakness and
mistake emerge from myself whether deliberately or accidentally as I were in this
company. I pray will all your welfare and always in simplify work during work in this
company.
8/2/2019 Report Sebenar
http://slidepdf.com/reader/full/report-sebenar 4/73
CHAPTER 1
INTRODUCTION
1.1 Corporate Profile
1.1.1 Introduction
1.1.2 Corporate Information
1.1.3 Corporate Statement
1.1.4 Corporate Structure
1.1.5 Award & Recognitions
1.2 Business Activity
1.2.1 Sungai Harmoni Operations
1.2.2 Taliworks Langkawi Operations
1.2.3 Engineering & Construction Division
1.2.4 Waste Management Division
1.2.5 Highway Division
1.3 Sungai Harmoni Phase 1
1.3.1 Organization chart
8/2/2019 Report Sebenar
http://slidepdf.com/reader/full/report-sebenar 5/73
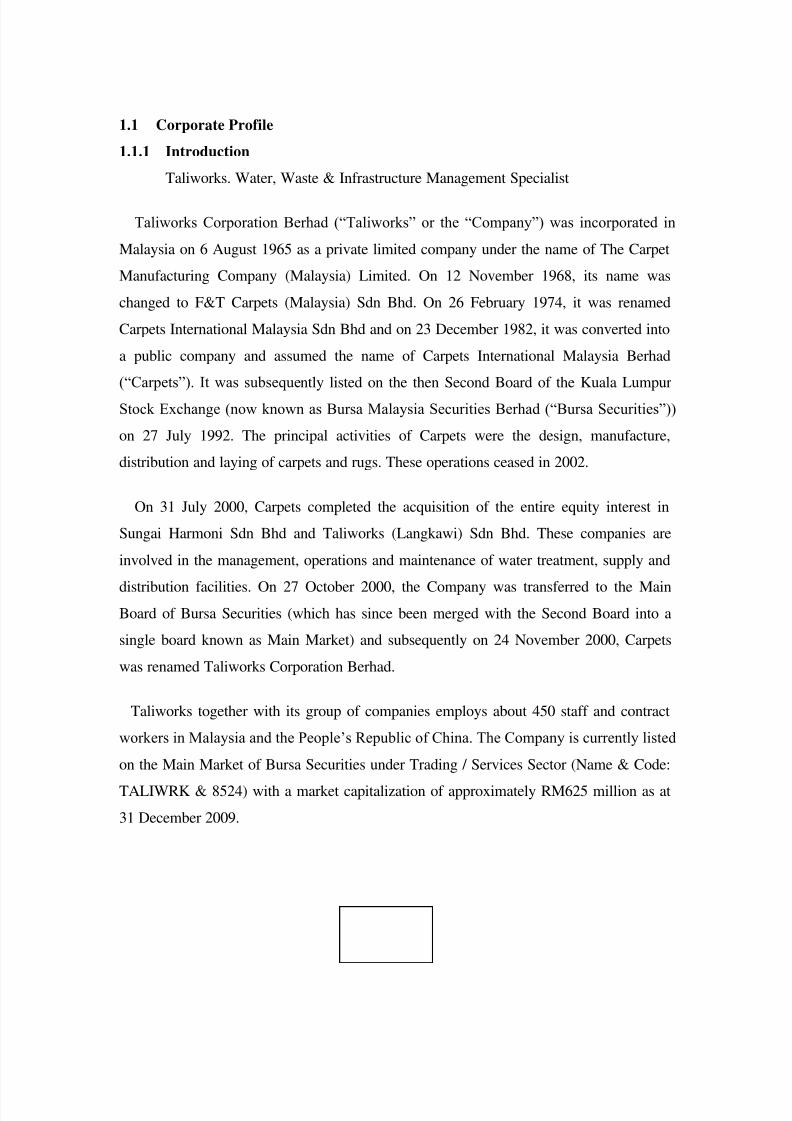
1.1 Corporate Profile
1.1.1 Introduction
Taliworks. Water, Waste & Infrastructure Management Specialist
Taliworks Corporation Berhad (“Taliworks” or the “Company”) was incorporated in
Malaysia on 6 August 1965 as a private limited company under the name of The Carpet
Manufacturing Company (Malaysia) Limited. On 12 November 1968, its name was
changed to F&T Carpets (Malaysia) Sdn Bhd. On 26 February 1974, it was renamed
Carpets International Malaysia Sdn Bhd and on 23 December 1982, it was converted into
a public company and assumed the name of Carpets International Malaysia Berhad
(“Carpets”). It was subsequently listed on the then Second Board of the Kuala Lumpur
Stock Exchange (now known as Bursa Malaysia Securities Berhad (“Bursa Securities”))
on 27 July 1992. The principal activities of Carpets were the design, manufacture,
distribution and laying of carpets and rugs. These operations ceased in 2002.
On 31 July 2000, Carpets completed the acquisition of the entire equity interest in
Sungai Harmoni Sdn Bhd and Taliworks (Langkawi) Sdn Bhd. These companies are
involved in the management, operations and maintenance of water treatment, supply and
distribution facilities. On 27 October 2000, the Company was transferred to the Main
Board of Bursa Securities (which has since been merged with the Second Board into a
single board known as Main Market) and subsequently on 24 November 2000, Carpets
was renamed Taliworks Corporation Berhad.
Taliworks together with its group of companies employs about 450 staff and contract
workers in Malaysia and the People‟s Republic of China. The Company is currently listed
on the Main Market of Bursa Securities under Trading / Services Sector (Name & Code:
TALIWRK & 8524) with a market capitalization of approximately RM625 million as at
31 December 2009.
8/2/2019 Report Sebenar
http://slidepdf.com/reader/full/report-sebenar 6/73
8/2/2019 Report Sebenar
http://slidepdf.com/reader/full/report-sebenar 7/73
Business background
Today, Taliworks, an established company involved in water and waste-related
businesses, has expanded its core expertise to include highway management, construction
and engineering, and wastewater research and technology.
Taliworks started out in the water management sector in 1987 as a pioneer in the
privatization of the water supply in Malaysia and today, the water business still leads as
the main core business activity of the Group. Since 2004, the Group has diversified its
business interests to include the waste management segment in China and toll operations
and highway management in Malaysia through a few strategic acquisitions.
Taliworks‟ core water business is in the privatized water supply sector which includes
an operation and maintenance contract (expiring in 2030) for the Sungai Selangor Water
Treatment Works Phase 1 (“SSP1”) that supplies to large parts of Selangor and Kuala
Lumpur and a concession (expiring in 2020) for the water supply and distribution system
in Langkawi, Kedah. The Group currently manages a total of 6 water treatment plants
with a combined capacity of 1,039.5 million liters per day.
In the waste management business sector, the Group holds a 21-year concession rights
for the operation and management of the Tianjin Panlou Life Waste Transfer Station and
its related assets in the city of Tianjin, China. The concession, held through a 90% owned
subsidiary, Tianjin-SWM (M) Environment Ltd, Co and expiring in 2025, grants rights to
this company to transport household waste deposited at the transfer station to the
municipal landfills and in return collect tipping fees from the local city council for
services provided.
Other than being involved in solid waste management, the Group is also engaged in the
wastewater sector through its indirect holding of a 56% stake in Puresino (Guanghan)
Water Co. Ltd which manages and operates the 50 million liters per day Guanghan San
Xin Dui wastewater treatment plant in Sichuan, China for a 30-year concession expiring
in 2033.
8/2/2019 Report Sebenar
http://slidepdf.com/reader/full/report-sebenar 8/73
In 2007, Taliworks acquired a 55% stake in a jointly controlled entity, Cerah Sama Sdn
Bhd (“Cerah Sama”). Cerah Sama is the holding company for Grand Saga Sdn Bhd that
owns and operates the Cheras - Kajang Highway concession until 2027. The acquisition
was made in collaboration with the South East Asian Strategic Assets Fund (“SEASAF”)
where Cerah Sama is positioned to be the flagship vehicle through which both parties will
engage in the business of developing and operating toll roads in Malaysia and the
ASEAN region.
Other than the above-mentioned businesses, the Group is also undertaking the
construction of the Padang Terap Water Supply Scheme in Kedah. It just completed the
Klang Valley Flood Mitigation-Package Sungai Damansara project in Selangor.
Currently, the water business in Malaysia accounts for the bulk of revenue and
profitability of the Group. Taliworks intends to increase its revenue contribution
significantly from overseas ventures to diversify its earnings base and geographical risk.
The Group remains focus on its core business activities whilst seeking to acquire further
strategic investments both domestically and in the foreign markets so as to re-position
itself as a formidable and respected service provider for public utilities and infrastructure
businesses in the region.
Today, the Group has business presence in Selangor, Kedah, Tianjin, Sichuan, Xiamen
and Shanghai.
8/2/2019 Report Sebenar
http://slidepdf.com/reader/full/report-sebenar 9/73
1.1.2 Corporate Information
Board Of Directors
Chairman Y. Bhg. Dato‟ Hj Abd Karim bin Munisar
Executive Deputy Chairman
Y. Bhg. Dato' Lim Chee Meng
Executive Director
Mr. Lim Yew Boon
Senior Independent Non Execuitve Director
Y. Bhg. Dato‟ Hj Mohd Sinon bin Mudakir
Independent Non Execuitve Director
YAM Tengku Putri Datin Paduka Arafiah bte Al-Marhum Sultan Salahuddin Abd.
Aziz Shah Al-Haj
Y. Bhg. Dato‟ Hj Abdul Karim @ Mohd Yusof B. Abdul Rahman
Encik Sulaiman bin Salleh
Non Independent Non Execuitve Director
Y. Bhg Dato' Wan Puteh Bin Wan Mohd SamanMr. Wong Yien Kim
Audit Committee
Chairman Y. Bhg. Dato‟ Hj Mohd Sinon bin Mudakir
Members
Encik Sulaiman bin SallehYAM Tengku Putri Datin Paduka Arafiah bte Al-Marhum Sultan
Salahuddin Abd.Aziz Shah Al-HajMr. Wong Yien Kim
8/2/2019 Report Sebenar
http://slidepdf.com/reader/full/report-sebenar 10/73
Nomination Committee
Chairman Encik Sulaiman bin Salleh
Members
YAM Tengku Putri Datin Paduka Arafiah bte Al-Marhum SultanSalahuddin Abd.Aziz Shah Al-Haj
Y. Bhg. Dato‟ Wan Puteh bin Wan Mohd Saman
Remuneration Committee Chairman Y. Bhg. Dato‟ Hj Abd Karim bin Munisar
Members
Y. Bhg. Dato‟ Wan Puteh bin Wan Mohd Saman Y. Bhg. Dato‟ Lim Chee Meng
Company Secretary Mr. Ng Yim Kong (LS 0009297)
Unit 07-02, Level 7, Menara Luxor
6B Persiaran Tropicana
47410 Petaling JayaSelangor Darul Ehsan
Tel : 603 7804 5929
Fax : 603 7805 2559
Registered Office Unit 07-02, Level 7, Menara Luxor
6B Persiaran Tropicana
47410 Petaling JayaSelangor Darul Ehsan
Tel : 603 7804 5929
Fax : 603 7805 2559
Principal Office 28, Jalan Wan Kadir 1
Taman Tun Dr. Ismail
60000 Kuala Lumpur
Tel : 03-7725 7110
Fax : 03-7725 7099
E-mail : [email protected]
Website : www.taliworks.com.my
8/2/2019 Report Sebenar
http://slidepdf.com/reader/full/report-sebenar 11/73
Share Registrars Symphony Share Registrars Sdn Bhd
(formerly known as Malaysian Share
Registration Services Sdn Bhd)
Level 6, Symphony HouseBlock D13, Pusat Dagangan Dana 1,
Jalan PJU 1A/4647301 Petaling Jaya.
Tel : 603 7841 8000
Fax : 603 7841 8008
Trustess HSBC (MALAYSIA) Trustee Berhad
Suite 9.01, 9th Floor
Wisma Hamzah-Kwong Hing
No 1, Leboh Ampang,59200 Kuala Lumpur
Tel : 603 2074 3200
Fax : 603 2078 0145
Main Auditors PricewaterhouseCoopers
Chartered Accountants
Level 10, 1 SentralJalan Travers
Kuala Lumpur Sentral50706 Kuala Lumpur
Tel : 603 2173 1188
Fax : 603 2173 1288
Main Bankers AmBank (M) Berhad
HSBC Bank Malaysia Berhad
Malayan Banking BerhadUnited Overseas Bank (Malaysia) Berhad
Stock Main Market,
Bursa Malaysia Securities BerhadName & Code: TALIWRK & 8524
Stock Sector: Trading / Services
Warrants
Main Market,
Bursa Malaysia Securities BerhadName & Code : TALIWRK-WA & 8524WA
Sector : Warrants / Loans
8/2/2019 Report Sebenar
http://slidepdf.com/reader/full/report-sebenar 12/73
1.1.3 Corporate Statement
Corporate Vision:
Our vision is to be the respected and exemplary leader in the provision of quality
drinking water in Malaysia and regionally.
Mission Statement:
We are committed to;
providing high quality drinking water to the customers and communities we
serve through a customer focused service
managing and preserving the environment in which we operate throughundertaking relevant water industry research
training and developing our human resources for career satisfaction leading to
customer-oriented service
Core Values:
We constantly strive for the “Pursuit of Quality and Excellence” philosophy as
our success depends on it.
We believe in maintaining long term relationship of respect, trust and
responsibility with our partners, associates, staff and customers.
We are committed to improving the quality of life for the communities we serve
trough the most professional, technologically advance and environmentally
friendly water management expertise available.

8/2/2019 Report Sebenar
http://slidepdf.com/reader/full/report-sebenar 13/73
1.1.4 Corporate Structure
Refer to the Figure 3
8/2/2019 Report Sebenar
http://slidepdf.com/reader/full/report-sebenar 14/73
1.1.5 Award & Recognitions
Accreditation
The Group has been accredited with the following high standards maintained for quality
management systems and competency of test and calibration laboratories. Among the
important accreditations are: -
MS ISO 9001: 2000 Quality Management Systems – Requirements for the Operation and
Maintenance of Water Treatment Plant for Sungai Selangor Water Treatment Works
Phase 1, since 2003.
MS ISO/IEC 17025: 2005 under Malaysia Laboratory Accreditation Scheme for Sungai
Selangor Water Treatment Works Phase 1 Laboratory, since 2004.
ISO 9001: 2000 under Provision of Highway Maintenance and Toll Collection, for
Grand Saga Sdn Bhd, since 2007.
MS ISO/IEC 17025: 2005 under Malaysia Laboratory Accreditation Scheme for Padang
Saga and Sungai Baru Laboratory in Langkawi water operations, since 2008.
ISO 9001: 2000 under SGS United Kingdom and Malaysia for Project Management of
Construction of Water Supply Schemes, Buildings, Civil Engineering, Mechanical and
Electrical Works under Turnkey and Conventional Contract, for the Engineering and
Construction Division of Taliworks, since 2008.
8/2/2019 Report Sebenar
http://slidepdf.com/reader/full/report-sebenar 15/73
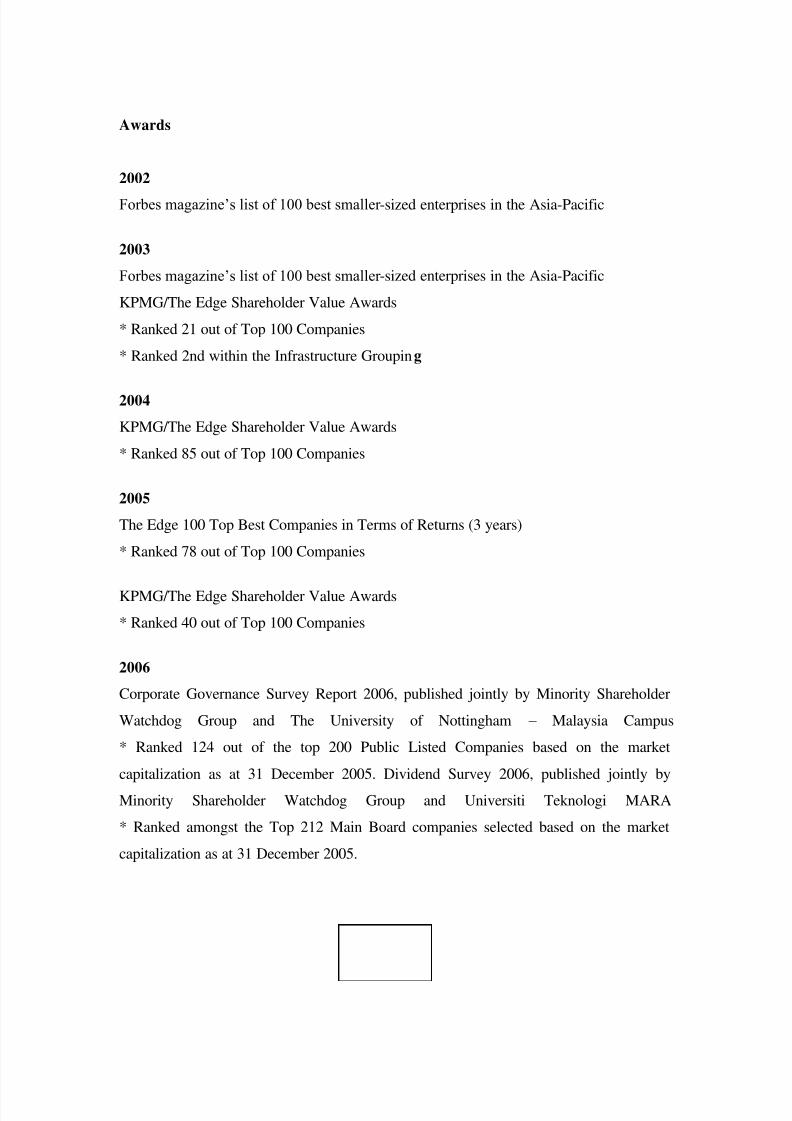
Awards
2002
Forbes magazine‟s list of 100 best smaller -sized enterprises in the Asia-Pacific
2003
Forbes magazine‟s list of 100 best smaller -sized enterprises in the Asia-Pacific
KPMG/The Edge Shareholder Value Awards
* Ranked 21 out of Top 100 Companies
* Ranked 2nd within the Infrastructure Grouping
2004
KPMG/The Edge Shareholder Value Awards
* Ranked 85 out of Top 100 Companies
2005
The Edge 100 Top Best Companies in Terms of Returns (3 years)
* Ranked 78 out of Top 100 Companies
KPMG/The Edge Shareholder Value Awards
* Ranked 40 out of Top 100 Companies
2006
Corporate Governance Survey Report 2006, published jointly by Minority Shareholder
Watchdog Group and The University of Nottingham – Malaysia Campus
* Ranked 124 out of the top 200 Public Listed Companies based on the market
capitalization as at 31 December 2005. Dividend Survey 2006, published jointly by
Minority Shareholder Watchdog Group and Universiti Teknologi MARA
* Ranked amongst the Top 212 Main Board companies selected based on the market
capitalization as at 31 December 2005.
8/2/2019 Report Sebenar
http://slidepdf.com/reader/full/report-sebenar 16/73
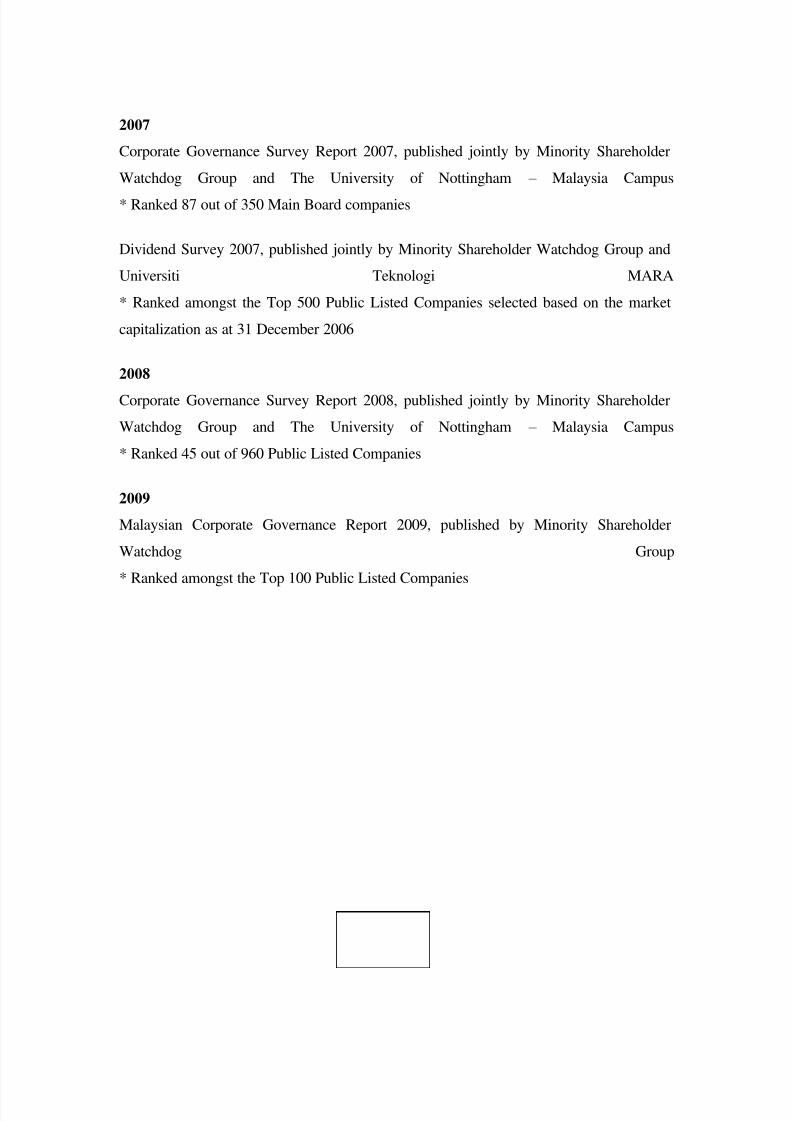
2007
Corporate Governance Survey Report 2007, published jointly by Minority Shareholder
Watchdog Group and The University of Nottingham – Malaysia Campus
* Ranked 87 out of 350 Main Board companies
Dividend Survey 2007, published jointly by Minority Shareholder Watchdog Group and
Universiti Teknologi MARA
* Ranked amongst the Top 500 Public Listed Companies selected based on the market
capitalization as at 31 December 2006
2008
Corporate Governance Survey Report 2008, published jointly by Minority Shareholder
Watchdog Group and The University of Nottingham – Malaysia Campus
* Ranked 45 out of 960 Public Listed Companies
2009
Malaysian Corporate Governance Report 2009, published by Minority Shareholder
Watchdog Group
* Ranked amongst the Top 100 Public Listed Companies
8/2/2019 Report Sebenar
http://slidepdf.com/reader/full/report-sebenar 17/73
1.2 Business Activity
1.2.1 Sungai Harmoni Operations
Management, operation and maintenance of the water treatment facilities under
Sungai Selangor Phase 1 (SSP 1) that currently supplies to large areas of Kuala Lumpur,
Petaling Jaya, Klang, Kuala Selangor, Kuang and Kundang.
SSP1 is one of the biggest Malaysia‟s water treatment plant (Nominal Design
Capacity of 950 MLD). Indeed, this was a milestone in achievements for Taliworks to be
entrusted with the responsibility of running this facility.
SSP1 was conferred with MS ISO 9001:2000 Quality Management Systems -
Requirements (OPERATION AND MAINTENANCE OF WATER TREATMENT
PLANT) accreditation on 21 March 2003. Before that, in October 2000, the SSP1
Laboratory was conferred with the Seal of Accreditation (ISO/IEC Guide 25) by
Department of Standards Malaysia under the National Laboratory Accreditation Scheme
(SAMM). The SSP1 Laboratory was subsequently elevated to the ISO 17025
accreditation in October 2002.
In line with the commitment to water quality excellence, Sungai Harmoni has
continued to carry out a comprehensive set of water quality testing of the treated water to
ensure compliance with water quality standards at all times. It has, on its own accord,
instituted a surveillance programme to monitor the raw water quality in the Sungai
Selangor catchments upstream of the intake on a quarterly basis; this is to be forewarned
of potential changes in the raw water quality that may require adjustments to the
treatment regime.
Backed by the most modern water treatment technology and computer-based telemetry
monitoring of process data, this facility produces treated water, that complies with the
quality standards of the Malaysian Ministry of Health and the World Health
Organization.
18
8/2/2019 Report Sebenar
http://slidepdf.com/reader/full/report-sebenar 18/73
1.2.2 Taliworks Langkawi Operations
Taliworks Langkawi operates and maintains the entire water supply and distribution
facilities in Pulau Langkawi, Kedah and the Sungai Baru water treatment plant in Perlis
for 25 years commencing from 1995. The operation covers the full spectrum of
management, operation and maintenance as well as production, distribution and billing
facilities.
Among facilities managed by Taliworks Langkawi is 517 km of water distribution
pipes of diameter 100mm and above and 38 km of submarine pipes from Sungai Baru,
Perlis to Langkawi Island, Kedah. Taliworks Langkawi also using a computerized
Geographical Information System (GIS) for more effective and systematic management
and operation of the water supply system.
Since the commencement of the privatization contract, Taliworks Langkawi managing
a consumer account base of more than 17,595 accounts. In a pro-active approach to
attend speedily to consumer complaints regarding pipe bursts and leaks and low pressures
etc., Taliworks Langkawi has installed a toll free line for consumers to lodge their
complaints.
Sungai Selangor Water Supply Scheme Phase 1
Refer to the Figure 4
Water Supply System in Langkawi Island.
Refer to the Figure 5.
19
8/2/2019 Report Sebenar
http://slidepdf.com/reader/full/report-sebenar 19/73
1.2.3 Engineering & Construction Division
The Group embarked on two projects since the previous year:
The design and construction of the water supply system for the Padang Terap
Water Supply Scheme, in Kedah, and
The Subang South Pond Project – a flood migration pond project to avert flash
floods caused by storm water from Sungai Damansara to its low lying river banks
at Shah Alam Selangor.
with a combined contract value of approximately RM170 million.
20
8/2/2019 Report Sebenar
http://slidepdf.com/reader/full/report-sebenar 20/73
1.2.4 Waste Management Division
The Group‟s maiden venture into China via a 90% stake in Tianjin - SWM (M)
Environment Co. Ltd, (“Tianjin-SWM”) back in 2004 has put the Group in good stead tofurther expand its presence in the vast waste management sector. Other than being
involved in solid waste management, the Group is also engaged in the wastewater sector
through its 56% stake in Puresino (Guanghan) Water Co. Ltd which manages and
operates the 50 MLD Guanghan San Xin Dui wastewater treatment plant in the province
of Sichuan
Tianjin-SWM (M) Environment Co. Ltd
Tianjin-SWM holds the concession rights to manage operate and maintain the Tianjin
Panlou Life Waste Transfer Station and its related assets for duration of 21 years ending
2025. The city of Tianjin is one of the locations chosen to host the recently concluded
2008 Olympics in China. The throughput at the Tianjin Panlou Transfer Station has been
encouraging and on the uptrend and for 2008, the company managed to process 353,000
tonnes (or 966 tonnes per day) of household waste compared to 324,000 tonnes (or 899
tonnes per day) a year ago.
Puresino (Guanghan) Water Co. Ltd
Last year was the full year in which Puresino (Guanghan) Water Co. Ltd (“Puresino
Guanghan”) operated the Guanghan San Xin Dui wastewater treatment plant since the
commercial operations started in September 2007. The company has a concession to
manage and operate the treatment plant until 2033. The plant treated 9.88 million m3 (or
an average of 27 MLD) of wastewater. This works out to be 54% of the designed
capacity and the company expects to raise the production to 10.7 million m3 (or an
average of 29 MLD) in 2009.
21

8/2/2019 Report Sebenar
http://slidepdf.com/reader/full/report-sebenar 21/73
1.2.5 Highway Division
The toll highway sector became part of the business activities of Taliworks when the
Company acquired a 55% strategic stake in Cerah Sama Sdn. Bhd. (“Cerah Sama”) in
late 2007 in collaboration with the South East Asian Strategic Assets Fund (“SEASAF”),
which holds 35%.
For more information, please visit Grand Saga Sdn Bhd's website at –
www.grandsaga.com.my
22

8/2/2019 Report Sebenar
http://slidepdf.com/reader/full/report-sebenar 22/73
1.3.1 Sungai Harmoni Phase 1
Refer to the Figure 6 for the organization chart.
23
8/2/2019 Report Sebenar
http://slidepdf.com/reader/full/report-sebenar 23/73
CHAPTER 2
TRAINING ACTIVITIES
2.1 Experiences during perform the industrial training
2.1.1 Summary of activities 2.1.2 Process flow of SSP1 Water Treatment Plant
2.1.3 Inlet works plant
2.1.4 Lamellar Pulsator Clarifier
2.2 Fluoride Dosing Control
2.2.1 Introduction
2.2.1 Procedure of Test
2.2.2 Result & Discussion
2.3 Raw Water Turbidity Test (check the travel time)
2.3.1 Introduction
2.3.1 Procedures of Test
2.3.2 Result & Discussion
2.4 Milk-Lime Concentration Test
2.4.1 Introduction
2.4.1 Procedures of Test
2.4.2 Result & Discussion
8/2/2019 Report Sebenar
http://slidepdf.com/reader/full/report-sebenar 24/73
2.5 Sludge Blanket Concentration Test
2.5.1 Introduction
2.5.1 Procedures of Test
2.5.2 Result & Discussion
2.6 Sludge Draw-off Test
2.6.1 Introduction
2.6.1 Procedures of Test
2.6.2 Result & Discussion
8/2/2019 Report Sebenar
http://slidepdf.com/reader/full/report-sebenar 25/73
2.1 Experiences during perform the industrial training
2.1.1 Summary of activities
As I is here, new there are a few things that had I study especially ways they run water
processing work. At first, I were given a little bit information on operation in every part,
used chemical material, types of equipment and machine and number staff which
included in every shift.
I also already in give several case-studies by my supervisor at here. Among them was
Sludge Blanket Concentration Test, Sludge Draw-Off Test, Fluoride Dosing Control
(calculate in g / min), Measure the Travel Time and Milk Lime Concentration test. From
each those projects given this, I can learn every important little bit of information which I
need to know and may be eliminated benefit on time future. This very important for one
man titled student. They should always keep curious feeling and always asking. Because
to me, here the student opportunity to know every little experience from old timer before
stepping to job nature.
I also often ask workers are here on problems which arose and way they control and
work something out those problems. This one best opportunity to me. I very grateful
above cooperation which gave by every staff work here. They so receptive in granting
view. This to me an advantage for me.
See the Figure 7 for the summary of activities.
26
8/2/2019 Report Sebenar
http://slidepdf.com/reader/full/report-sebenar 26/73
2.1.2 Process flow of SSP1 Water Treatment Plant
Aim of the plant.
Supply drinking water to the state of Selangor.
General view:
Aeration : Oxidation of iron and manganese.
Pre-Chlorination : Bacteriological control and oxidation.
Mixing Chamber : -pH adjustment : (Lime)
Coagulation (Alum Sulphate)
Flocculation (Polyelectrolyte)
Clarifiers : Have 6 pulsators.
Filtrations : 24 filters.
Treatment Principles:-
From the aerator, the raw water flows to a mixing/ distribution structures by gravity.
The water contains very fine colloidal or pseudocolloidal suspended solids which must be
agglomerated into a voluminous and heavy floc in order to enable settling.
The colloids are electrically charged at the interface, which prevents other particles from
coming close.
The action takes place in two stages after pH adjustment at the inlet of the mixing
chamber:
Coagulation: To remove the charges from the colloids in order to create
precipitation. Flocculation: To increase the volume and cohesion of the floc formed by
coagulation.
27
8/2/2019 Report Sebenar
http://slidepdf.com/reader/full/report-sebenar 27/73
Raw water analysis of Sungai Selangor River
Degremont Analysis 21 November 1988
Refer to the Table 1.
Flowrates
Capacity of the Lamellar Pulsator clarifier:-
i. Nominal stream inflow= 500 MLD, with raw water suspended solid up to
1000mg/L.
6 x 3472 m3 /h =20835 m
3 /h = 500 MLD.
ii. Peak stream inflow = 570 MLD, with raw water suspended solid up to 500
mg/L.
6 x 3958 m3 /h = 23750 m
3 /h = 570 MLD.
iii. Hydraulic capacity = 600 MLD.
6 x 4167 m3 /h = 25000 m3 /h = 600 MLD.
Mixing
In the mixing structure, after a first dissipation chamber, the water would flow through
the following structures in sequences:
One group of two chambers with a contact time of 15 + 15 seconds, for :
Injection of lime and recirculated filter washwater at the inlet of the first
chamber.
Injection of alum sulphate at the outlet of the second chamber 30 seconds
later.
One group of two chambers with a contact time of 15 + 55 seconds (upstream
from the distribution weirs) after injection of alum sulphate.
One of the outlet basins towards each of the 6 clarifiers, downstream from the
equal distribution weirs, in which the flocculation polyelectrolyte would be
injected.
28
8/2/2019 Report Sebenar
http://slidepdf.com/reader/full/report-sebenar 28/73
The first chamber in each group is equipped with an electric stirrer designed to
homogenize the raw water with the regents. These electric stirrers are featured by a
“Sabra” impeller design which saves energy while providing a perfect stirring effect with
a gradient above 300 second -1.
Coagulation
A metal salt, aluminium sulphate is used for this purpose.
The dose required depends on the nature of the water to be treated:
This is determined when the plant is started up by means of jar test.
The greater the loading of the water with colloidal matter, and in particular plantmatter, the more reagents will be needed for clarification.
The nature of the organic matter effects coagulation.
The pH of the medium is the key factor in determining coagulation and reagent
dose.
Flocculation
If the particles of metal hydroxides and colloidal matter are to flocculate, they must come
into contact with each other.
The likelihood of contact between particles increases proportionally to their concentration
in the water. This gave rise to the idea of increasing the concentration by retaining in the
liquid high percentages of sludge formed by the previous treatment. It is essential that the
old particles in contact with the liquid being treated should be in the same physical state
as those formed by the added reagents.
No attempt is made to make the sludge circulate in the Pulsator. The aim is simply to
maintain the sludge in the form of an expanding mass, through which the water is passed
intermittently from bottom to talk.
29
8/2/2019 Report Sebenar
http://slidepdf.com/reader/full/report-sebenar 29/73
8/2/2019 Report Sebenar
http://slidepdf.com/reader/full/report-sebenar 30/73
2.1.3 Inlet works plant
General
Raw water is pumped from the raw water pumping station to the inlet works at Bukit
Badong treatment plant in two 2100mm diameter pipelines. The inlet works comprise the
following:
- Pipework connecting to the raw water pumping mains, including a flow
control/isolating 2100mm diameter butterfly valve on the pipe to Stream B and a
valve cross-connection to Stream A.
- Aerator
- Aerator outlet
- Aerator overflow
- Aerator by-pass.
Inlet Pipework
The 2100mm diameter butterfly flow control/isolating valve on the pipe to Stream B and
the similar size cross-connection valve are power operated. The power supply is tapped
from distribution board, DB „B‟, located under the aerator structure. These valves areoperated locally from the actuators mounted onto the valves.
The 2100mm diameter inlet pipe to Stream B branches into two 1550mm diameter pipes
and these pipes discharge into the inlet chambers from which the raw water overflows
into the aerator over adjustable stainless steel weirs.
The aerator is provided with a 1800mm diameter by-pass pipe, controlled by a power-
operated butterfly valve with local control facility.
31
8/2/2019 Report Sebenar
http://slidepdf.com/reader/full/report-sebenar 31/73
Aerator
The aerator is cascading type with the following features:
- Height of aerator : 2.0 m
- Number of drops : 4.0
- Number of cascade steps : 500 sq.m
- Inlet weir level : 24 m LSD
- Outlet weir level : 22.23 m LSD
See the Figure 9 for the design of aerator.
The main function of aeration is to reduce iron contents in raw water though oxidization
process. The aerator is designed to create turbulence to provide for the maximum contact
between water and air. A 50 mm high lip is provided around the outside edge of each
tray, so that water falls into shallow pool.
Aerator outlet
The flow from the aerator passed over stainless steel weirs into the outlet chamber. From
this chamber, water is conveyed in two 1550mm diameter pipes to the chemical mixing
chamber. Each pipes includes a power-operated isolating and control butterfly valve and
a raw water flowmeter. Power supply for the valves is from DB „B‟ and for the flowmeter
is from the Instrument Panel at the sludge pump house. At the inlet of the outlet pipes is
the dosing point for pre-chlorine.
Aerator overflow
The aerator is designed for a hydraulic capacity of 570 MLD and provided with anoverflow. The overflow weir level is 22.6m LSD. The overflow is discharged into the
flood retention pond via 1800mm diameter RC pipes. The aerator is also equipped with a
300mm diameter drain pipe with manually-operated sluice valve.
32

8/2/2019 Report Sebenar
http://slidepdf.com/reader/full/report-sebenar 32/73
Aerator By-pass
The aerator is provided with an 1800mm diameter by-pass pipe, controlled by a power-
operated butterfly valve with local control facility. The power supply is from DB „B‟.
Quality Plan-SSP1 Water Treatment Plant
See the Figure 10 and Figure 11.
33
8/2/2019 Report Sebenar
http://slidepdf.com/reader/full/report-sebenar 33/73
2.1.4 Lamellar Pulsator Clarifier
Lamellar pulsator working principle
The PULSATOR is a sludge blanket clarifier consisting of a flat-bottomed tank with a
series of perforated pipes at its base to distribute the raw water uniformly over the entire
bottom of the clarifier. A further set of perforated channels are provided at the top of the
clarifier to collect the clarified water evenly and to prevent any velocity variation in the
various parts of the tank.
To provide an intermittent supply to the lower header, the raw water and reagents are
admitted and stored in the upper part of the vacuum chamber for a given period. The
hydraulic force thus created is then released, and the water and reagents are pulsed at a
high flowrate into the clarifier.
The principle consists of removing the air by suction from the vacuum chamber. As a
result, the water level rises gradually inside the vacuum chamber. When it reaches a level
between 0.60m and 1.00m above the clarifier water level, a contact suddenly opens an air
inlet valve. Atmospheric pressure is therefore immediately applied to the water stored in
the vacuum chamber, and the water rushes into the distribution pipes at high speed.
When the water level inside the vacuum chamber is approximately 20cm above that in
the clarifier, the air inlet valve is closed and the cycle is repeated once more. The sludge
blanket in the lower part of the clarifier is subjected to alternating vertical motions. It
expands during flushing, which is performed powerfully for a short time (5-10 seconds)
and then pulses down during suction time (which lasts 20-40 seconds) when the velocity
is low. The blanket gradually increases in volume because of the impurities contained in
the water and flocculation reagents. The level of the blanket therefore rises regularly, and
it overflows into the concentrations which are in fact zero flowrate zones. The sludge is
extracted from the concentrators at regular intervals at the rate such that the quantity of
suspended solids extracted corresponds to the quality entering the clarifier (raw water +
reagents).
34
8/2/2019 Report Sebenar
http://slidepdf.com/reader/full/report-sebenar 34/73
The clarifier has no mechanical sludge stirring system. It is the sludge blanket itself,
which is constantly in motion when production is taking place, which ensures:
The complete and rapid formation of the floc movement by contact with sludge
already formed.
The filtration of the floc.
Because of the height concentration in the sludge blanket, and its buffer action, faulty
adjustment of the treatment dosing rate or a sudden sharp variation in the pH of the raw
water have no immediate ill effect. In such cases, the turbidity of the clarified water
varies slowly, which gives the operator time to take appropriate action.
A set of hexagonal modules located in the upper part of the clarifiers prevents the floc
from being carried away into the clarified water. They are inclined at a 60o angle to
provide for the evacuation of the sludge.
Vacuum Chamber
The vacuum chamber is equipped with one float switch, two fans (1 operating one stand
by) and two pneumatically controlled valves. The choice of the operating fan is made a
changeover switch located on the Pulsator switchboard located in the vacuum house.
Both valves operate together.
The fan runs continuously as an extractor. When the valve is closed, air is sucked out of
the vacuum chamber, the pressure decreases, and the water level rises until it reaches the
preset level fixed on the level switch (about 80-100cm from static level). Then the valves
open and air is admitted into the chamber. The water level falls down to the low level
fixed on the level switch, where the valve close and the cycle start again.
See the Figure 12 for the design of Pulsator House.
35
8/2/2019 Report Sebenar
http://slidepdf.com/reader/full/report-sebenar 35/73
Sludge Draw-Off
Sludge draw-off is made through cylinder operated butterfly valves, located on pipes
leading from the bottom of the sludge hoppers in the clarifiers to sumps outside the tanks.
On auto mode each group of two valves (one on each side of the clarifier) is opened
during a preset time at regular intervals.
Opening time and interval between two openings are set on timers located in the general
pulsators control panel, according to the quality of raw water and chemicals used.
Opening will last about 30 seconds and the duration for interval will be from 10 to 30
minutes.
On semi-auto mode, the operator uses a push button located in the control panel to initiate
the opening of the group of two valves immediately which is due for desludging at the
end of the current intervals. The opening of the valves lasts for the same time as in “auto”
operation.
After that, the auto operation resumes unless the operator pushes the “semi auto” push
button again to open the next set of two valves.
On manual mode, the operator uses the manual control of the solenoid valves to open the
respective valve.
36
8/2/2019 Report Sebenar
http://slidepdf.com/reader/full/report-sebenar 36/73
Compressed Air Production Unit
Two compressors (9 kW) are installed. Each of them is followed by an air dryer (fan
power: 0.05 kW). The air storage tank common to both compressor is equipped with two
pressure switches.
The duty compressor is controlled by one of the pressure switches, set between 7 and 9
bars. The standby compressor is controlled by the other pressure switch, set between 6
and 9 bars.
The changeover of the duty / standby compressors takes places automatically every week.
The air dryer fan is controlled automatically, starting and stopping at the same time as its
associated compressor.
Lamellar Pulsator Clarifier
See the Table 2.
See the Figure 13 for the example design of the lamellar.
37

8/2/2019 Report Sebenar
http://slidepdf.com/reader/full/report-sebenar 37/73
8/2/2019 Report Sebenar
http://slidepdf.com/reader/full/report-sebenar 38/73
2.2.2 Procedure of Test
A. Procedure addition sodium silicofluoride into hopper
Generally in work procedures to increase fluoride to hopper were as follows:
1. Make sure Hopper which operates and which has to add by looking hopper or
heavy remainder. Make sure operation hopper run smoothly
2. If necessary added, managing dust extractor (make sure you fully clothed)
3. Take bags fluoride the respective and put in hopper the. Usually 2-5 bag
(according to need)
4. By using knife, open bag fluoride and pour fluoride into hopper (record heavy
hopper before and after fluoride added)
5. Record number bag fluoride are being used in FRM form / CP/02
Note: Make sure bags empty dumped into waste receiver prepared.
B. Procedure adding / reducing VSD value
To increase and reduce dose fluoride, operator would be increased or reduce VSD value
subjected in MCC panel
1. After getting directive from Controller / Shift Superintend, make sure fluoride
plant operating normal
2. In MCC panel, governing method VSD value is wanted by pressing button the
respective only.
3. Record VSD value in decision form.
39
8/2/2019 Report Sebenar
http://slidepdf.com/reader/full/report-sebenar 39/73
C. Operational process dry feeder
Objective:
This operation intend to carry out stirrer so that solution fluoride complete can produce
before in dosed.
Procedure:
1. Make sure be power supply and make sure hopper which is operating
2. In MMC panel make sure position auto / manual to place manual
3. Press green button to stirrer on, make sure signal flaring red color.
D. Procedure test gram / minute
Objective:
These tests carried out are to know how much real dosage fluoride on water treated.
Procedure:
1. Prepare equipment; Arbitrator, former deliberate and timers (stop watch)
2. Go to hopper involved to do test
3. In vortex tank take rate fluoride exited in time 1 minute. Repeat as much as 3
times and able average reading
Dose count fluoride:
ppm= (g/min x 24 x 60)(Filter. Flow (MLD) x 1000
40
8/2/2019 Report Sebenar
http://slidepdf.com/reader/full/report-sebenar 40/73
E. Safety equipment
Other than fully clothed, following equipment also must be worn when run sodium
silicofluoride
1. Face mask
2. Glove
3. Safety boots
Note: are advised ala mode work must be washed immediately when you go home.
See the Figure 14 for summary of the fluoride preparation process.
41
8/2/2019 Report Sebenar
http://slidepdf.com/reader/full/report-sebenar 41/73
2.2.3 Result & Discussion
Result
Stream A
Refer to the Table 3 for result of Fluoride Dosing Control for Stream A.
Discussion
Graph.
1. Graph for frequency (VSD) vs. flowrate (gram/minute).
Refer to Figure 15
2. Graph for:
a) Total fluoride powder flowrate (gram/minute) vs. ppm.
Refer to Figure 16.
b) Total fluoride powder flowrate (gram/minute) vs. Actual Fluoride.
Refer to Figure 17
42
8/2/2019 Report Sebenar
http://slidepdf.com/reader/full/report-sebenar 42/73
Result
Stream B
Refer to the Table 4 for result of Fluoride Dosing Control for Stream B.
1. Graph for frequency (VSD) vs. flowrate (gram/minute).
Refer to Figure 18
2. Graph for:
a. Total fluoride powder flowrate (gram/minute) vs. ppm.
Refer to Figure 19.
b. Total fluoride powder flowrate (gram/minute) vs. Actual Fluoride.
Refer to Figure 20.
Result
After service hopper number 2B & 3B
Refer to the Table 5 for the result.
1. Graph for frequency (VSD) vs. flowrate (gram/minute).
Refer to Figure 21.
3 Graph for:
a) Total fluoride powder flowrate (gram/minute) vs. ppm.
Refer to Figure 22.
b) Total fluoride powder flowrate (gram/minute) vs. Actual Fluoride
Refer to Figure 23
43
8/2/2019 Report Sebenar
http://slidepdf.com/reader/full/report-sebenar 43/73
2.3 Raw Water Turbidity Test (check the travel time)
2.3.1 Introduction
Objective:
1) To check the differences values of turbidity at aerator, Stream B and laboratory.
2) To calculate the travel time of raw water from aerator to laboratory.
Turbidity is a measurement of how cloudy water appears. Technically, it is a measure
of how much light passes through water, and it is caused by suspended solid particles that
scatter light. These particles may be microscopic plankton, stirred up sediment or organic
materials, eroded soil, clay, silt, sand, industrial waste, or sewage. Bottom sediment may
be stirred up by such actions as waves or currents, bottom-feeding fish, people
swimming, or wading, or storm runoff.
Clear water may appear cleaner than turbid water, but it is not necessarily healthier.
Water may be clear because it has too little dissolved oxygen, too much acidity or too
many contaminants to support aquatic life. Water that is turbid from plankton has both
the food and oxygen to support fish and plant life. However, high turbidity may be a
symptom of other water quality problems.
This is caused by suspended materials, such as organic material, bacteria, algae, clay,
mud, lime or rust. The first three types will consume chlorine; the last four types may
interfere with disinfection. The highest level of turbidity recommended by WHO is 5TU
which is approximately the density at which turbidity becomes visible within a drinking
glass. Low turbidity assists filtration; it is tested by pouring the water sample into a long
clear plastic tube and observing the depth at which it is just impossible to see through the
tube.
Industrial processes and food processing, require clear water. Turbid water can clog
machines and interfere with making food and beverages.
44
8/2/2019 Report Sebenar
http://slidepdf.com/reader/full/report-sebenar 44/73
2.3.2 Procedures of Test
(HACH 2100N Turbidimeter)
SHL.TPE.079
1. The sample tube is filled with the water to be tested.
2. The glass plunger is inserted in the tube.
3. The tube is placed in the instrument
4. The dial at the side of the instrument is turned until the field seen in the eyepiece
becomes uniform.
5. The value indicated on the dial is read and the turbidity content of the sample being
tested is determined directly from a chart furnished with the instrument
45
8/2/2019 Report Sebenar
http://slidepdf.com/reader/full/report-sebenar 45/73
2.3.3 Result & Discussion
A. For the test result, refer to the Table 6.
B. Discussion
a) Graph.
i. Aerator vs. Laboratory.
Refer to Figure 24
ii. Aerator vs. Stream B.
Refer to Figure 25
iii. Stream B vs. Lab.
Refer to Figure 26
iv. Percentages of (A-C) vs. Percentages of (A-E).
Refer to Figure 27
v. Percentages of (A-C) vs. Percentages of (C-E).
Refer to Figure 28
vi. Percentages of (A-E) vs. Percentages of (C-E).
Refer to Figure 29
46
8/2/2019 Report Sebenar
http://slidepdf.com/reader/full/report-sebenar 46/73
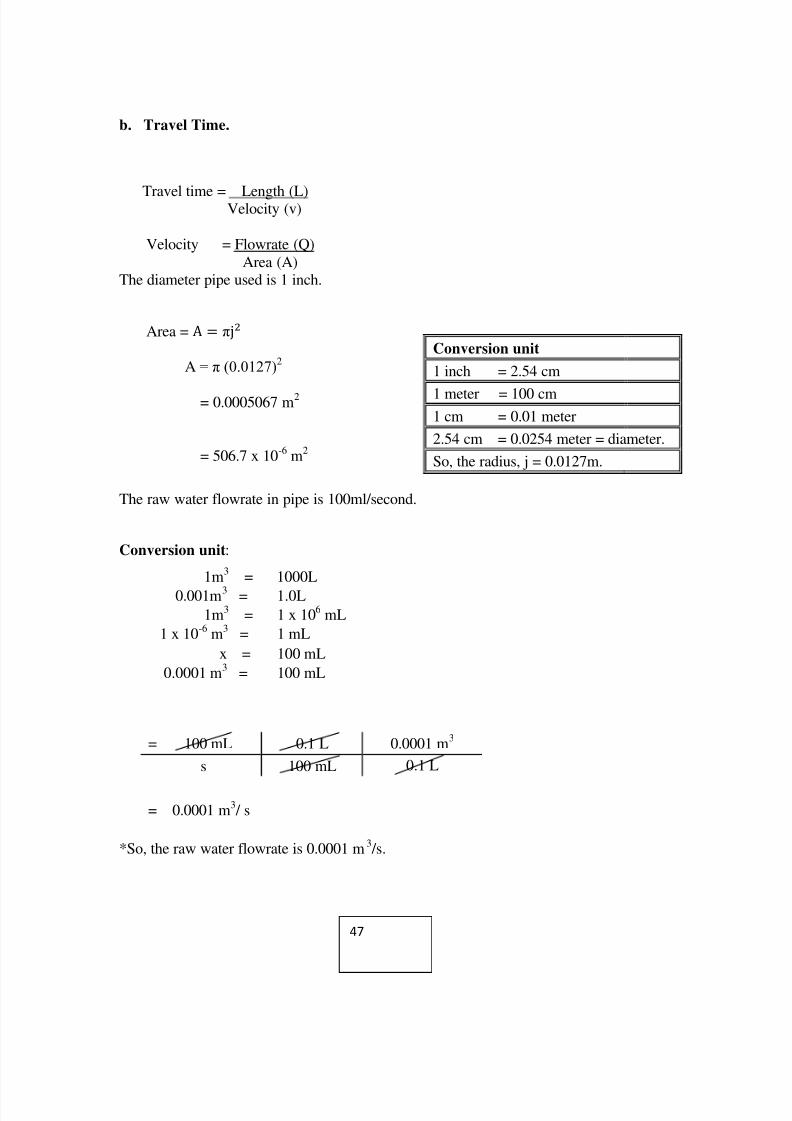
b. Travel Time.
Travel time = Length (L)Velocity (v)
Velocity = Flowrate (Q)
Area (A)The diameter pipe used is 1 inch.
Area =
A = (0.0127)2
= 0.0005067 m2
= 506.7 x 10⁻⁶ m2
The raw water flowrate in pipe is 100ml/second.
Conversion unit:
1m3
= 1000L
0.001m3 = 1.0L
1m3 = 1 x 10⁶ mL
1 x 10⁻⁶ m3 = 1 mL
x = 100 mL
0.0001 m3
= 100 mL
= 100 mL 0.1 L 0.0001 m3
s 100 mL 0.1 L
= 0.0001 m3 / s
*So, the raw water flowrate is 0.0001 m3 /s.
Conversion unit
1 inch = 2.54 cm
1 meter = 100 cm
1 cm = 0.01 meter
2.54 cm = 0.0254 meter = diameter.
So, the radius, j = 0.0127m.
47
8/2/2019 Report Sebenar
http://slidepdf.com/reader/full/report-sebenar 47/73
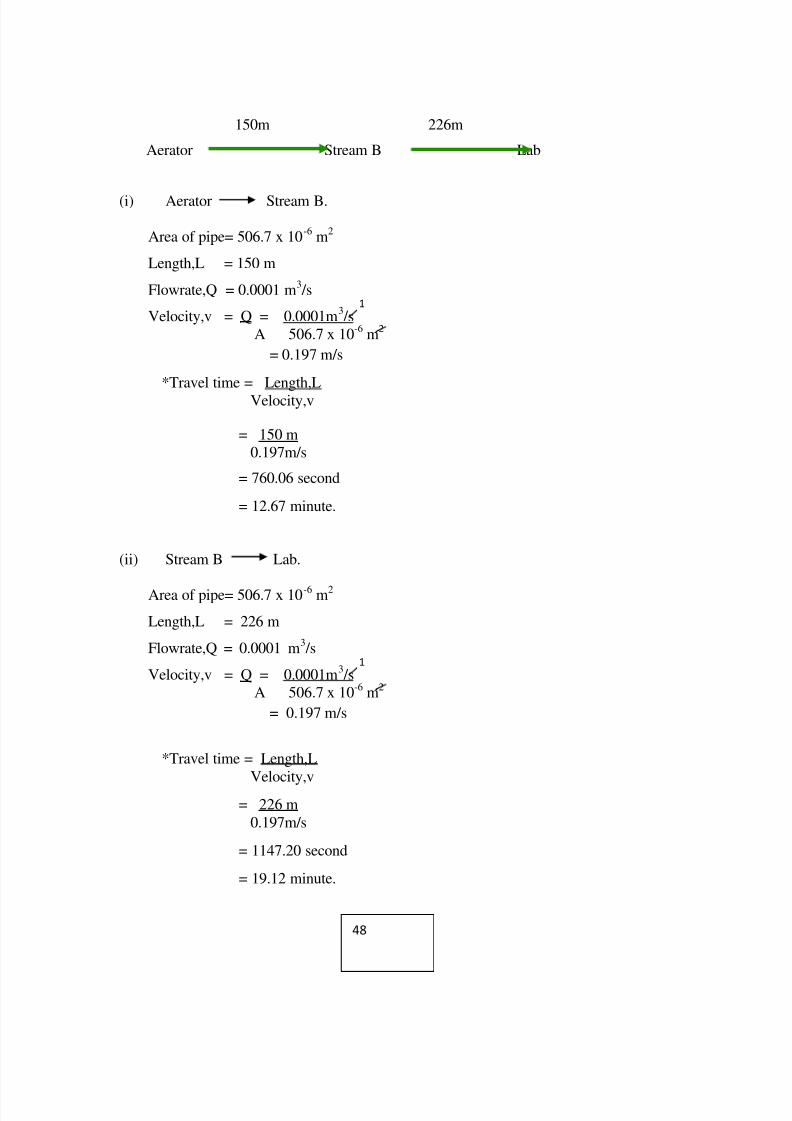
150m 226m
Aerator Stream B Lab
(i) Aerator Stream B.
Area of pipe= 506.7 x 10⁻⁶
m2
Length,L = 150 m
Flowrate,Q = 0.0001 m3 /s
Velocity,v = Q = 0.0001m3 /s
A 506.7 x 10⁻⁶
m2
= 0.197 m/s
*Travel time = Length,L
Velocity,v
= 150 m
0.197m/s
= 760.06 second
= 12.67 minute.
(ii) Stream B Lab.
Area of pipe= 506.7 x 10⁻⁶ m2
Length,L = 226 m
Flowrate,Q = 0.0001 m3 /s
Velocity,v = Q = 0.0001m3 /s
A 506.7 x 10⁻⁶ m2
= 0.197 m/s
*Travel time = Length,L
Velocity,v
= 226 m
0.197m/s
= 1147.20 second
= 19.12 minute.
1
1
48
8/2/2019 Report Sebenar
http://slidepdf.com/reader/full/report-sebenar 48/73
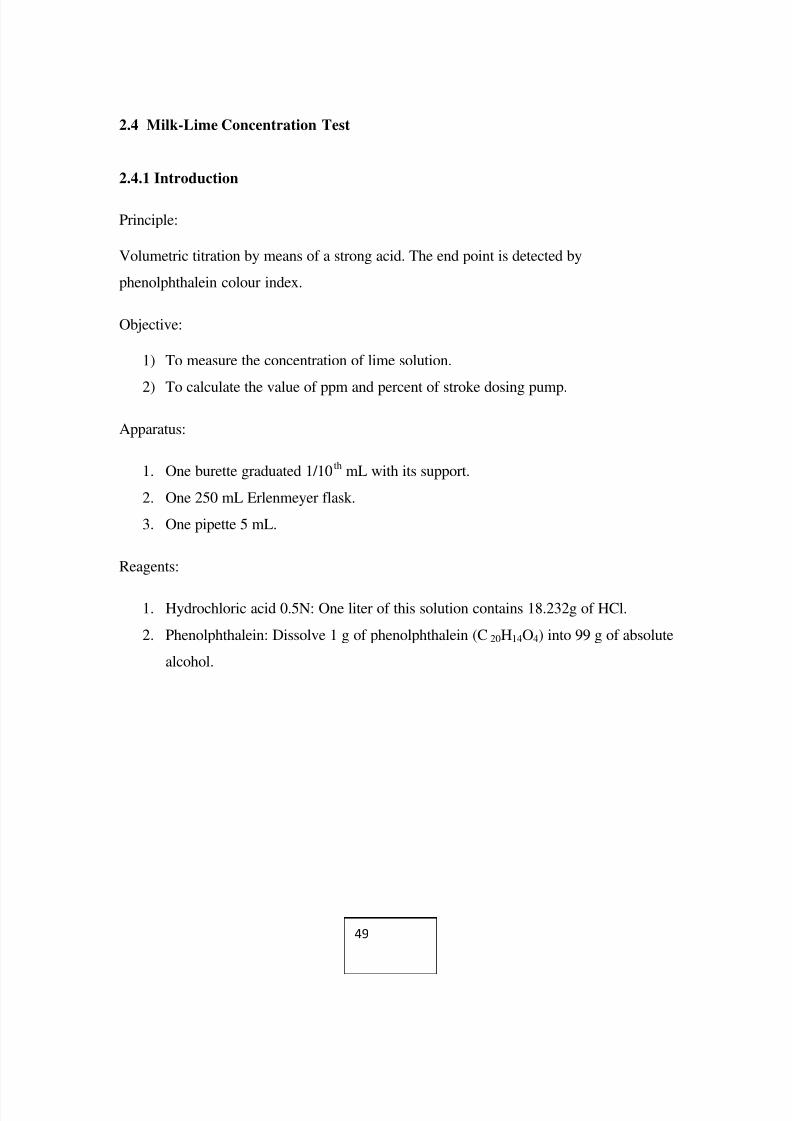
2.4 Milk-Lime Concentration Test
2.4.1 Introduction
Principle:
Volumetric titration by means of a strong acid. The end point is detected by
phenolphthalein colour index.
Objective:
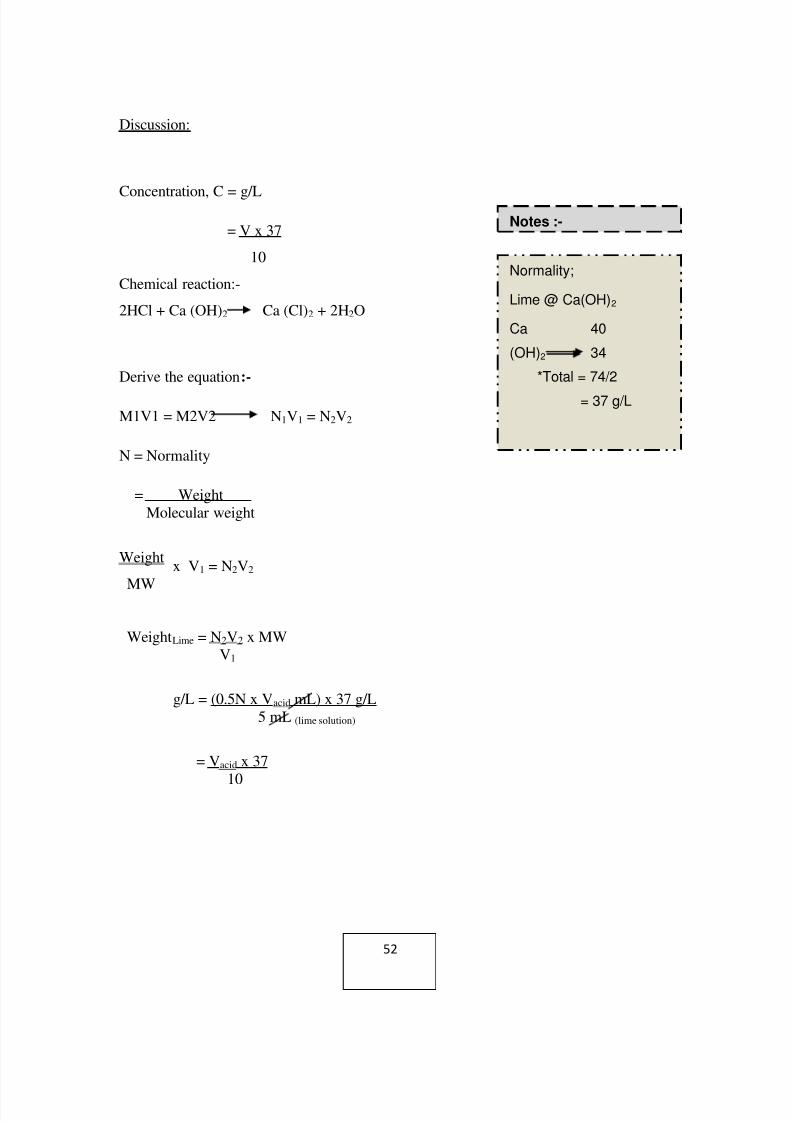
1) To measure the concentration of lime solution.
2) To calculate the value of ppm and percent of stroke dosing pump.
Apparatus:
1. One burette graduated 1/10th mL with its support.
2. One 250 mL Erlenmeyer flask.
3. One pipette 5 mL.
Reagents:
1. Hydrochloric acid 0.5N: One liter of this solution contains 18.232g of HCl.
2. Phenolphthalein: Dissolve 1 g of phenolphthalein (C20H14O4) into 99 g of absolute
alcohol.
49
8/2/2019 Report Sebenar
http://slidepdf.com/reader/full/report-sebenar 49/73
2.4.2 Procedures of Test
1) Shake vigorously the sample of milk of lime and transfer immediately 5 mL into
the Erlenmeyer flask.
2) 50 ml of distilled water was added and two drops of phenolphthalein solution. The
colour changes immediately to red.
3) The hydrochloric acid is added with the burette until the colour disappears
completely. After a few seconds the colour may appears again. A small quantityof hydrochloric acid is added to get a stable end point during 1 minute.
4) The volume, V of acid used was read in the burette.
50
8/2/2019 Report Sebenar
http://slidepdf.com/reader/full/report-sebenar 50/73
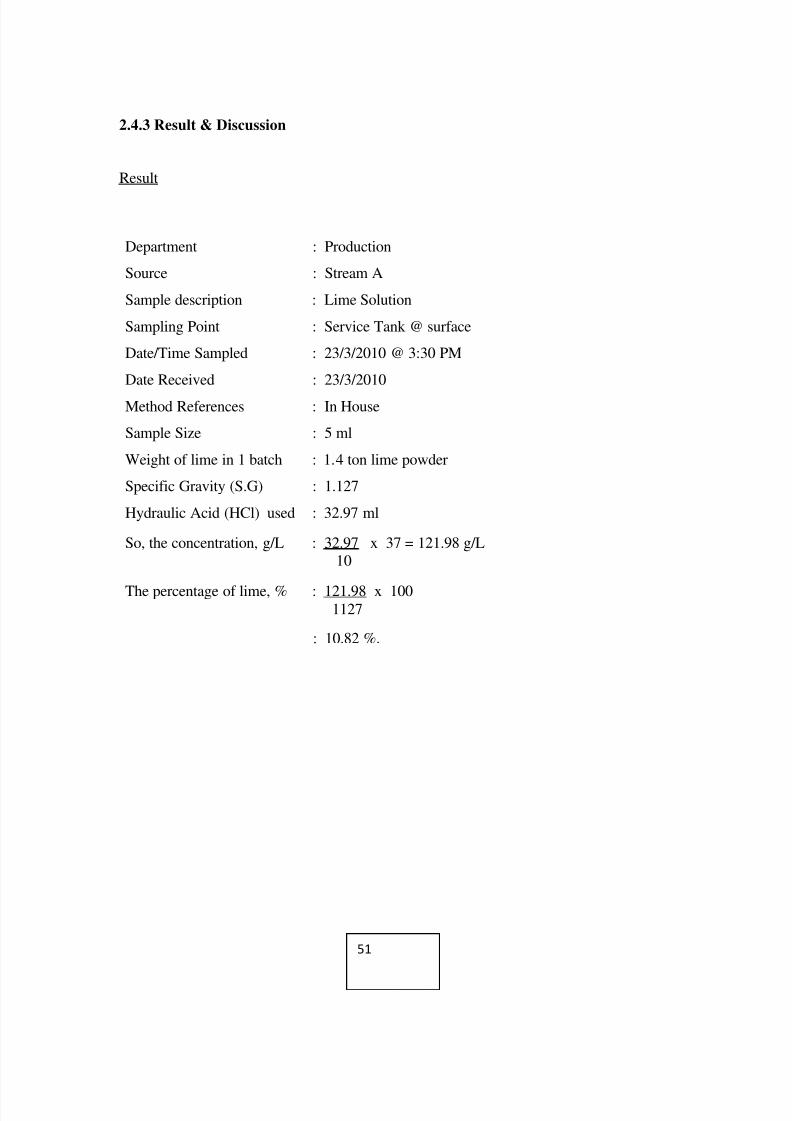
2.4.3 Result & Discussion
Result
Department : Production
Source : Stream A
Sample description : Lime Solution
Sampling Point : Service Tank @ surface
Date/Time Sampled : 23/3/2010 @ 3:30 PM
Date Received : 23/3/2010
Method References : In House
Sample Size : 5 ml
Weight of lime in 1 batch : 1.4 ton lime powder
Specific Gravity (S.G) : 1.127
Hydraulic Acid (HCl) used : 32.97 ml
So, the concentration, g/L : 32.97 x 37 = 121.98 g/L
10
The percentage of lime, % : 121.98 x 1001127
: 10.82 %.
51
8/2/2019 Report Sebenar
http://slidepdf.com/reader/full/report-sebenar 51/73
8/2/2019 Report Sebenar
http://slidepdf.com/reader/full/report-sebenar 52/73
2.5 Sludge Blanket Concentration Test
2.5.1 Introduction
Objective of test:
1. To calculate the difference concentration of sludge blanket formation.
2. To learn to accurate setting for pulsation rate.
3. To study about volume of suction.
Sludge blanket formation
Recommended that only 50% of maximum flowrate is treated to form the sludge
blanket.
The speed of sludge blanket formation depends on water and reagent doses needed
to perform clarification. (normally at 6 hours)
The sludge blanket may form in three hours with turbid raw water and large
quantities of reagents. Conversely the sludge blanket may take more than 24 hours to
form with relatively clear water with low amounts of reagents.
During the first few hours of operation, carry out and record the result of thefollowings checks at regulars intervals:
a) Raw water inflow
b) flush height
c) flush time
d) Suctions time.
After 3 hours operation, perform the check indicated above every hour, and begin to
check the sludge percentages of the sludge blanket.
53
8/2/2019 Report Sebenar
http://slidepdf.com/reader/full/report-sebenar 53/73
8/2/2019 Report Sebenar
http://slidepdf.com/reader/full/report-sebenar 54/73
Adjustment of pulsation in the light of measured concentration.
1. If the different concentration are between 4-6%. It‟s considered to be corrected.
2. If the readings are over than range above, adjust the pulsation rates.
3. The first step, adjust the flushing time. (reduce at 5 second)
4. If it‟s not enough, reduce the suction time. (Make sure the suction flow rate
< incoming flowrate).
5. When the result is not satisfied, increase the flush height until a maximum total
height (0.80m).
6. In case these action is not be effected to the result collected, clear and clean that
clarifier. This is last action which can solve the problem.
7. If the different concentration are corrected;
Extend the suction time up to maximum 45 second.
Extend the flush time (can‟t over than 10 second).
Wait in 3 hours before run the test to taking the reading for sludge blanket
concentration test result anytime after change the pulsation rates.
8. Generally, every modification of pulsation rate are depends on:
Raw water characteristic.
The higher amount of polymer used.
Always repeat the pulsation rate which demands to obtain the sludge blanket
homogenized and prevent the deposit from forming.
Return to the floc is light:-
Reduce the suction flowrate, long term the period of suction time and flushes
less vigorous.
55

8/2/2019 Report Sebenar
http://slidepdf.com/reader/full/report-sebenar 55/73
The rate can be determine as follows:
Measure the average flowrate during the pulsation, which is equal to the
evacuated volume, divide by the flush time and multiplied by 3600 seconds.
Add the flowrate being treated.
Divide by the surface area of the clarifier, after subtracting the surface area
of the concentrators.
The rate is normally 7 – 8 m/h for relatively clear water, but can rise to the 10 or
even 12 m/h for very turbid meter.
56
8/2/2019 Report Sebenar
http://slidepdf.com/reader/full/report-sebenar 56/73
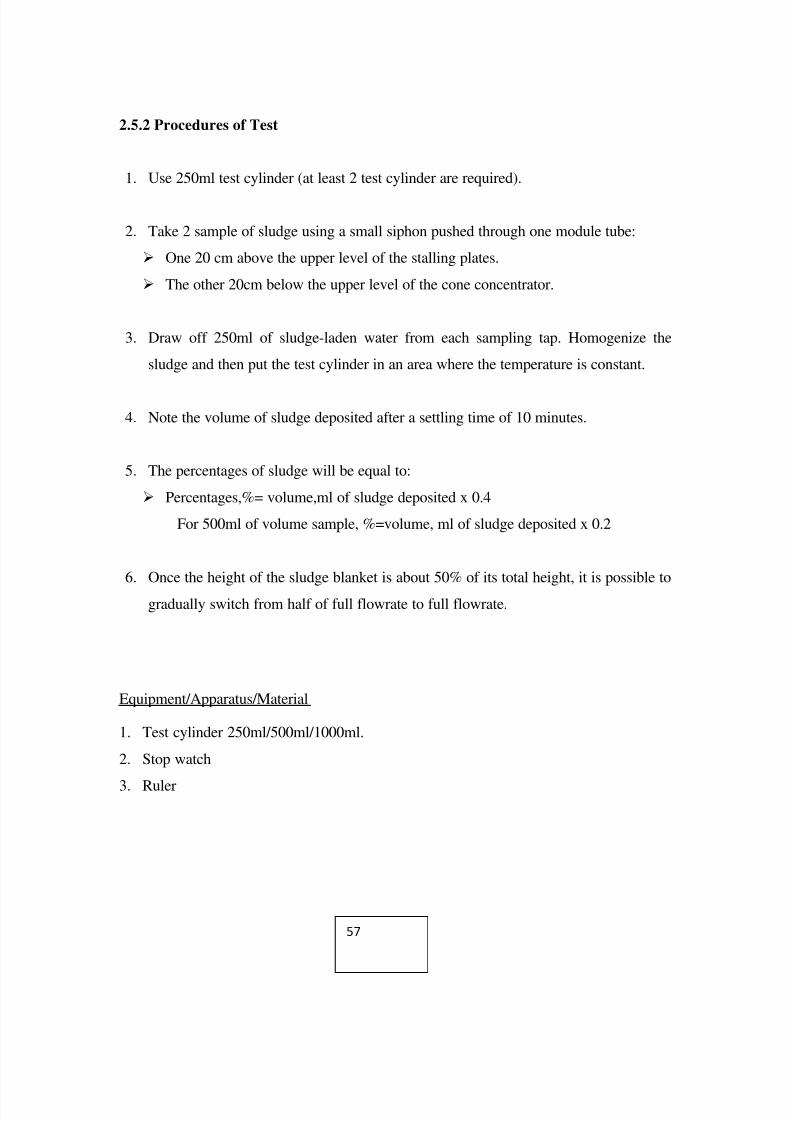
2.5.2 Procedures of Test
1. Use 250ml test cylinder (at least 2 test cylinder are required).
2. Take 2 sample of sludge using a small siphon pushed through one module tube:
One 20 cm above the upper level of the stalling plates.
The other 20cm below the upper level of the cone concentrator.
3. Draw off 250ml of sludge-laden water from each sampling tap. Homogenize the
sludge and then put the test cylinder in an area where the temperature is constant.
4. Note the volume of sludge deposited after a settling time of 10 minutes.
5. The percentages of sludge will be equal to:
Percentages,%= volume,ml of sludge deposited x 0.4
For 500ml of volume sample, %=volume, ml of sludge deposited x 0.2
6. Once the height of the sludge blanket is about 50% of its total height, it is possible to
gradually switch from half of full flowrate to full flowrate.
Equipment/Apparatus/Material
1. Test cylinder 250ml/500ml/1000ml.
2. Stop watch
3. Ruler
57
8/2/2019 Report Sebenar
http://slidepdf.com/reader/full/report-sebenar 57/73
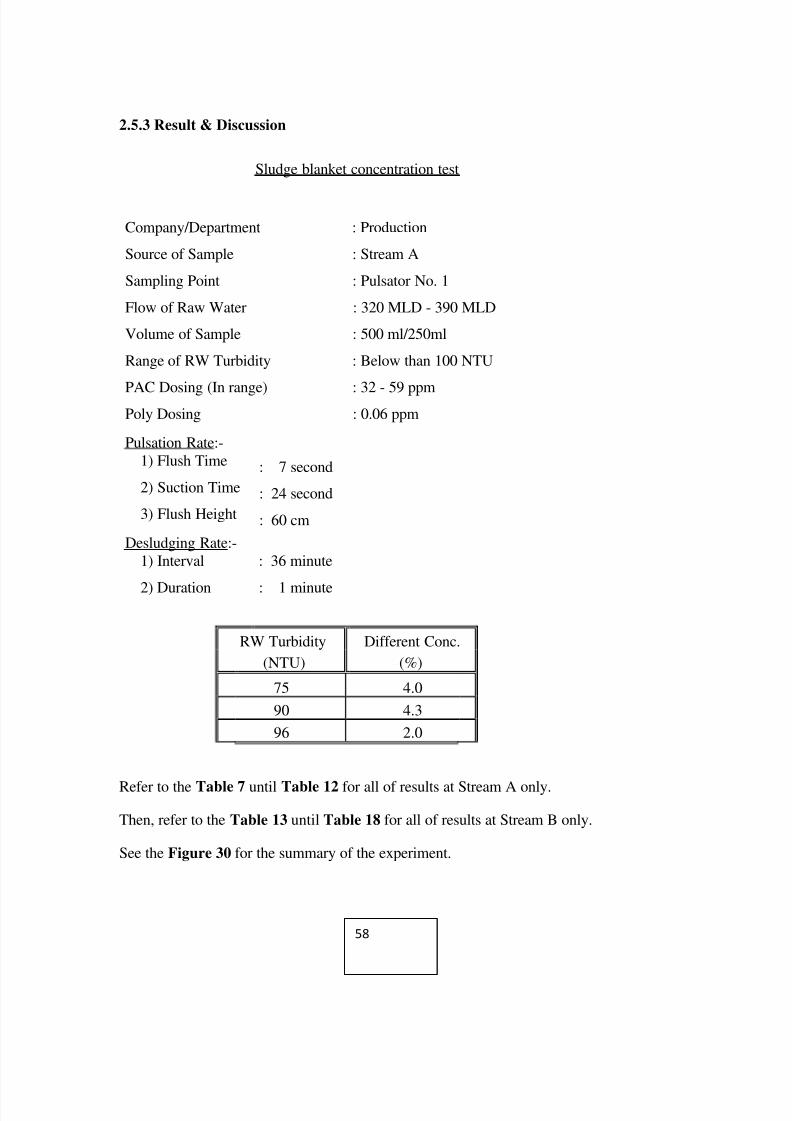
2.5.3 Result & Discussion
Sludge blanket concentration test
Company/Department : Production
Source of Sample : Stream A
Sampling Point : Pulsator No. 1
Flow of Raw Water : 320 MLD - 390 MLD
Volume of Sample : 500 ml/250ml
Range of RW Turbidity : Below than 100 NTU
PAC Dosing (In range) : 32 - 59 ppmPoly Dosing : 0.06 ppm
Pulsation Rate:-
1) Flush Time : 7 second
2) Suction Time : 24 second
3) Flush Height : 60 cm
Desludging Rate:-
1) Interval : 36 minute
2) Duration : 1 minute
RW Turbidity Different Conc.
(NTU) (%)
75 4.0
90 4.3
96 2.0
Refer to the Table 7 until Table 12 for all of results at Stream A only.
Then, refer to the Table 13 until Table 18 for all of results at Stream B only.
See the Figure 30 for the summary of the experiment.
58
8/2/2019 Report Sebenar
http://slidepdf.com/reader/full/report-sebenar 58/73
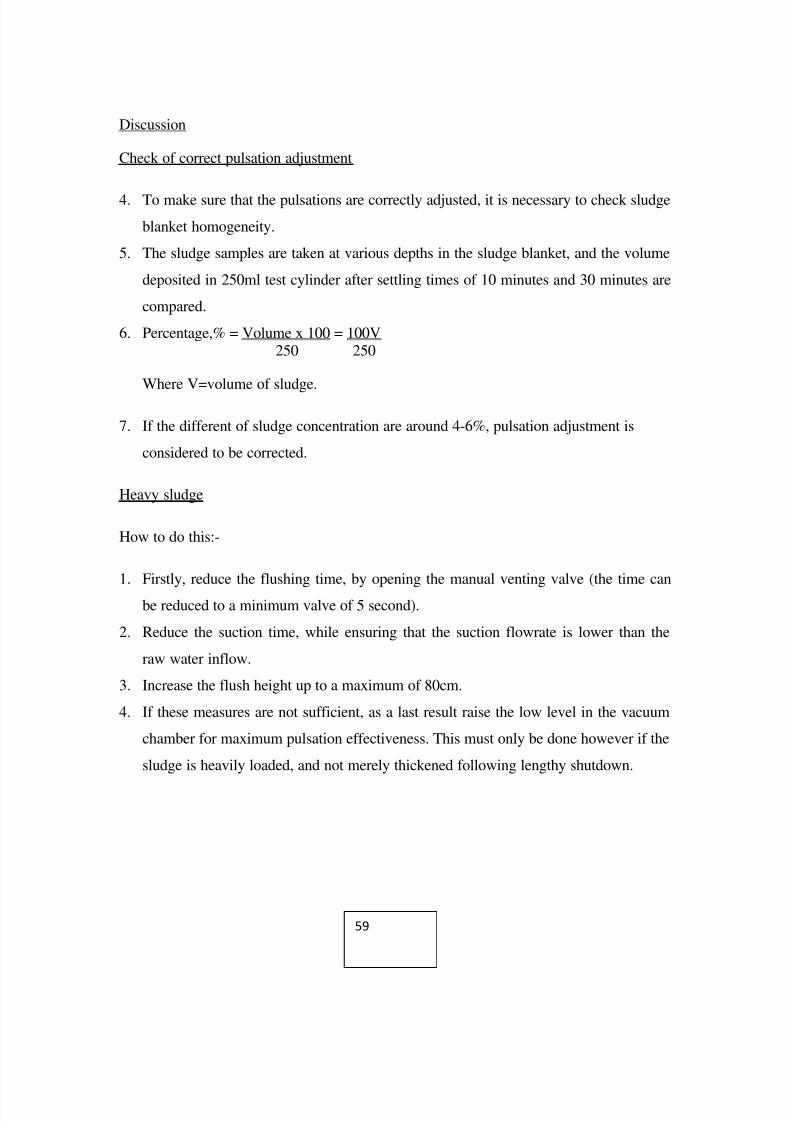
Discussion
Check of correct pulsation adjustment
4. To make sure that the pulsations are correctly adjusted, it is necessary to check sludge
blanket homogeneity.
5. The sludge samples are taken at various depths in the sludge blanket, and the volume
deposited in 250ml test cylinder after settling times of 10 minutes and 30 minutes are
compared.
6. Percentage,% = Volume x 100 = 100V250 250
Where V=volume of sludge.
7. If the different of sludge concentration are around 4-6%, pulsation adjustment is
considered to be corrected.
Heavy sludge
How to do this:-
1. Firstly, reduce the flushing time, by opening the manual venting valve (the time can
be reduced to a minimum valve of 5 second).
2. Reduce the suction time, while ensuring that the suction flowrate is lower than the
raw water inflow.
3. Increase the flush height up to a maximum of 80cm.
4. If these measures are not sufficient, as a last result raise the low level in the vacuum
chamber for maximum pulsation effectiveness. This must only be done however if the
sludge is heavily loaded, and not merely thickened following lengthy shutdown.
59
8/2/2019 Report Sebenar
http://slidepdf.com/reader/full/report-sebenar 59/73
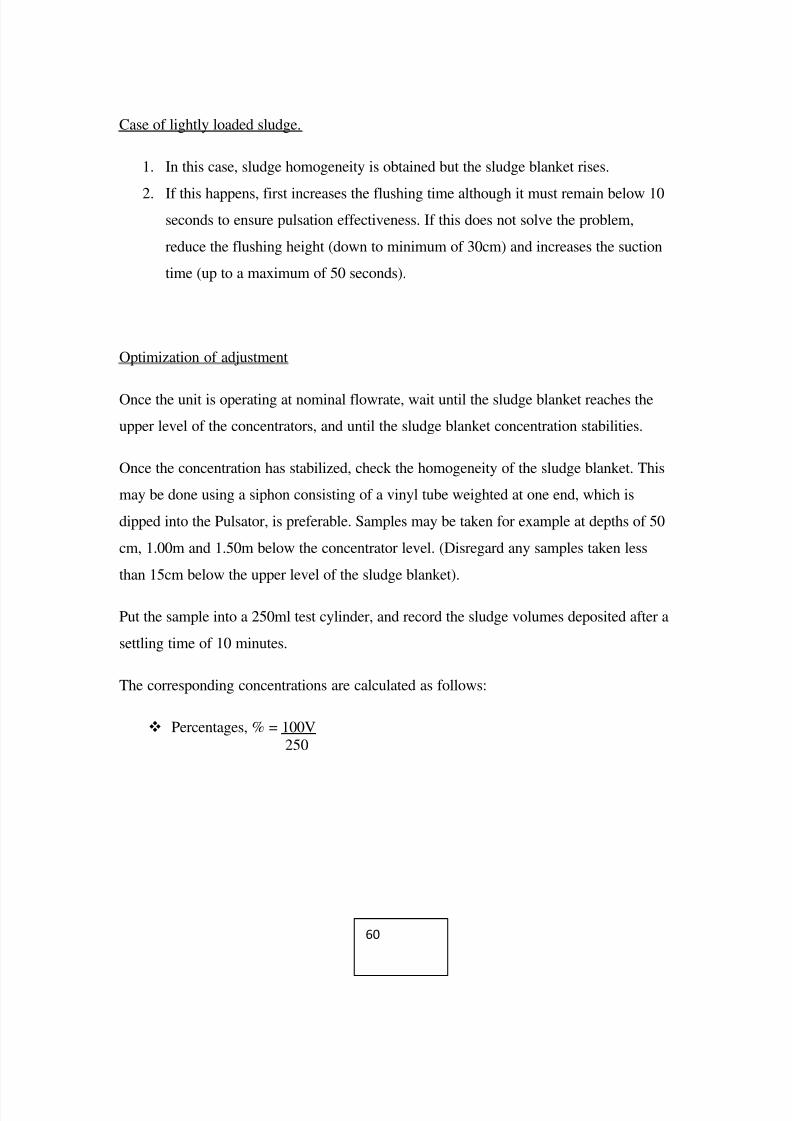
Case of lightly loaded sludge.
1. In this case, sludge homogeneity is obtained but the sludge blanket rises.
2. If this happens, first increases the flushing time although it must remain below 10
seconds to ensure pulsation effectiveness. If this does not solve the problem,
reduce the flushing height (down to minimum of 30cm) and increases the suction
time (up to a maximum of 50 seconds).
Optimization of adjustment
Once the unit is operating at nominal flowrate, wait until the sludge blanket reaches the
upper level of the concentrators, and until the sludge blanket concentration stabilities.
Once the concentration has stabilized, check the homogeneity of the sludge blanket. This
may be done using a siphon consisting of a vinyl tube weighted at one end, which is
dipped into the Pulsator, is preferable. Samples may be taken for example at depths of 50
cm, 1.00m and 1.50m below the concentrator level. (Disregard any samples taken less
than 15cm below the upper level of the sludge blanket).
Put the sample into a 250ml test cylinder, and record the sludge volumes deposited after a
settling time of 10 minutes.
The corresponding concentrations are calculated as follows:
Percentages, % = 100V
250
60
8/2/2019 Report Sebenar
http://slidepdf.com/reader/full/report-sebenar 60/73
Interpreting result
The homogeneity of the sludge blanket is obtained by means of the pulsation rate. The
aim is to obtain a sludge blanket which is basically homogeneous. If the rate is too slow,
the sludge blanket will tend to condense, and the measured concentration will be
markedly higher in the lower part than in the upper part. If the pulsation rate is too fast,
the sludge blanket will break up, and higher concentration will be found in the upper part,
while floc will be entrained by the clarifier water. Conclusions must not however be
drawn hastily, and any anomaly detected must be confirmed by taking several
consecutive measurements with the unit operating at a stable flowrate. If the flowrate is
reduced, the sludge tends to condense, and the measurements taken show higher values in
the lower part. Conversely, if the flowrate is increased, the sludge expends and
deconcentration in the lower part of the clarifier may be observed. For these reasons, only
measurements taken after operation at a steady flowrate for at least 3 hours should be
taken into account.
61
8/2/2019 Report Sebenar
http://slidepdf.com/reader/full/report-sebenar 61/73
2.6 Sludge Draw-off Test
2.6.1 Introduction
Objective
1. To measure the volumes and percentages of sludge during desludging.
2. To learn the accurate setting of pulsation rate and desludging rate.
Sludge draw-off adjustment
When the sludge blanket level reaches the upper edge of the concentrators, the draw-offs
must be start-up.
Draw-off time and draw-off frequency depends on the suspended solid in the raw water
(to which reagent have been added), the settling of the sludge, and the instantaneous
flowrate of each draw-off valve.
Estimating of draw-off percentages
A rough idea of the percentages to be extracted can be obtained by estimating the
quantity of sludge obtained in flocculation. Using the raw water available, perform a
laboratory flocculation test on five 1 liter beakers of water, to which the optimum amount
of reagent have been added.
After conducting the normal flocculation test, allow to settle for 10 minute. The draw-off
the clarified water, collect the sludge from the 5 beakers, and put it into a 1-liter test
cylinder, pouring the sludge gently so as not to break up the floc. Stir the sample by
holding the test cylinder at the top and turning it through several revolutions.
62
8/2/2019 Report Sebenar
http://slidepdf.com/reader/full/report-sebenar 62/73
Record the number P of cm3 sludge settled after a settling time of 15 minutes
Where; P= The number of cm3 of sludge settled after a settling time of 15 minutes.
R= The percentages of sludge.
The relationship will be: R= P5000
Estimating of suspended solids in draw-off.
Once the suspended solids content of the raw water and reagents is known, and draw-off
rate indicated by the above percentages, it is possible to calculate the average suspended
solids content of the draw-off.
Equipment/Apparatus/Material
1. Test cylinder 250ml/500ml/1000ml.
2. Stop watch
3. Rule
63
8/2/2019 Report Sebenar
http://slidepdf.com/reader/full/report-sebenar 63/73
2.6.2 Procedures of Test
1. Use 250ml/500ml/1000ml test cylinder (at least 2 test cylinder are required).
2. Take 2 sample of sludge through the desludging pipes:
1 cylinder test for 10 seconds after open valve.
1 cylinder test for 10 seconds before close valve.
4. Draw off 250ml of sludge-laden water from each sampling tap. Homogenize the
sludge and then put the test cylinder in an area where the temperature is constant.
5. Note the volume of sludge deposited after a settling time of 10 minutes.
6. The percentages of sludge will be equal to:
Percentages,%= volume,ml of sludge deposited x 0.4
For 500ml of volume sample, %=volume, ml of sludge deposited x 0.2
7. Once the height of the sludge blanket is about 50% of its total height, it is possible to
gradually switch from half of full flowrate to full flowrate.
64
8/2/2019 Report Sebenar
http://slidepdf.com/reader/full/report-sebenar 64/73
2.6.3 Result & Discussion
Result
Refer to the Table 19 until Table 25 for all of results at Stream B only.
Discussion
Adjustment of draw-off
Once the sludge blanket level has reaches the concentrator weir:
Start up the draw-off automatic control device, and more the following initial
adjustment:
Draw-off time : 15 second
Frequency : 30 minutes.
The adjustment can be optimized by references to the draw-off rate and the percentages
to be extracted as defined above. Otherwise, draw-off adjustment can be performed
empirically, either by checking the concentration of extracted sludge, or by plumbing the
level of sludge in the concentrators.
i. Concentration check
Take the 250 ml sample of sludge-laden water from the sampling valve 2 seconds after
opening the draw-off valve, and another 250 ml test cylinder sample 3 seconds after
closing the draw-off valve. Stir the sludge, and they allow to settle. Record the sludge
percentages after settling times of 5, 10 and 30 minutes. The sludge percentages in the
samples after 5 minutes should be around 99.0 %. After 30 minutes, the percentages
should be similar in both test cylinder, or at least equal to 90.0 %.
If after 30 minutes the percentages difference is greater than 10 %, reduce the sludge
draw-off time. If this is not enough, reduce the interval between 2 draw-offs time.
65
8/2/2019 Report Sebenar
http://slidepdf.com/reader/full/report-sebenar 65/73
ii. Adjustment by level in concentrators
If the sludge blanket is stable, and to limit water losses, plumb the level of sludge in
the concentrators and increases the intervals between draw-offs until the level of
sludge in the concentrators.
The kinds of adjustment are only applicable if the flowrate is constant, and provided
that the level of sludge is regularly checked. If checks are not adequate, it is better to
perform too many draw-off rather than not enough.
66
8/2/2019 Report Sebenar
http://slidepdf.com/reader/full/report-sebenar 66/73
8/2/2019 Report Sebenar
http://slidepdf.com/reader/full/report-sebenar 67/73
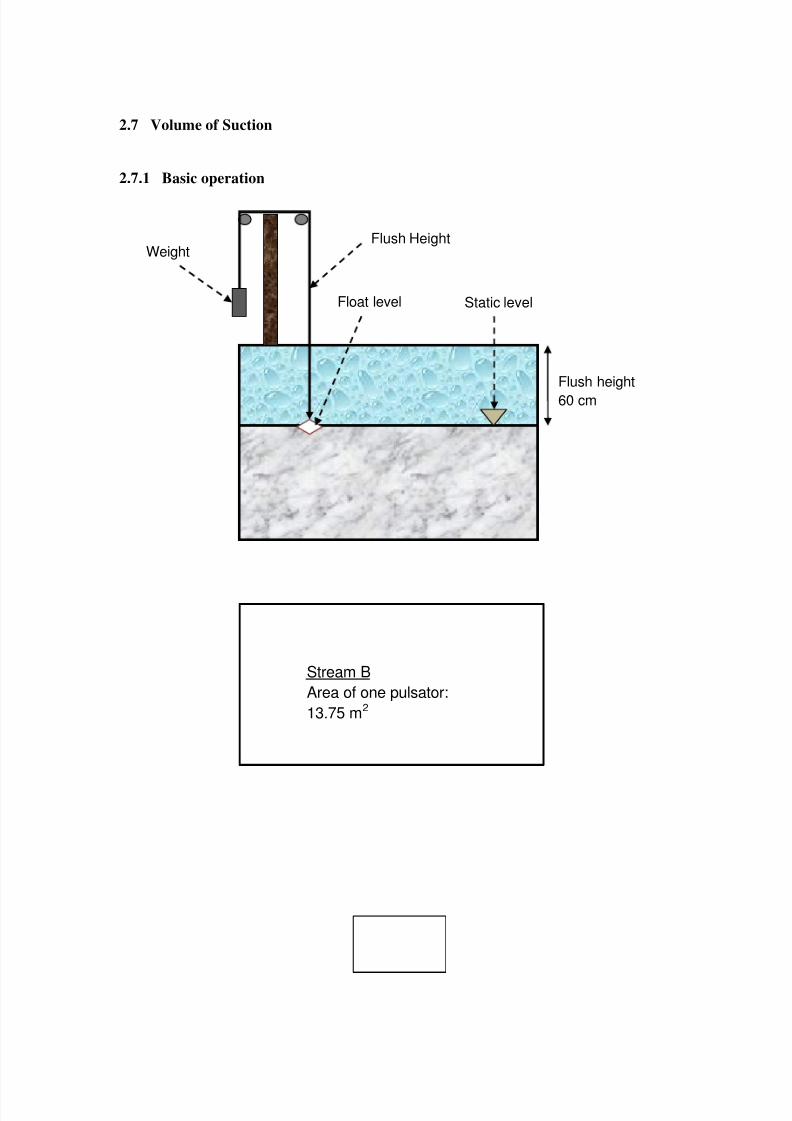
2.7 Volume of Suction
2.7.1 Basic operation
Static levelFloat level
60 cm
Flush height
Flush HeightWeight
Stream B
Area of one pulsator:
13.75 m2
8/2/2019 Report Sebenar
http://slidepdf.com/reader/full/report-sebenar 68/73
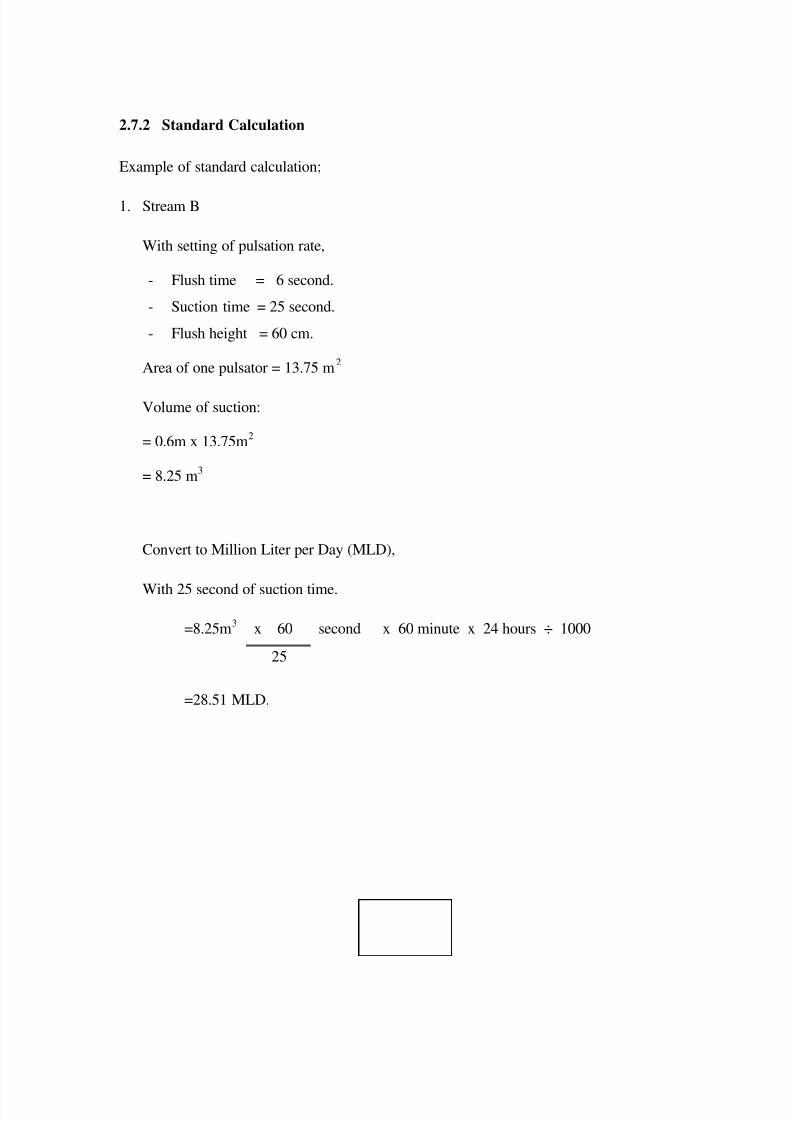
2.7.2 Standard Calculation
Example of standard calculation;
1. Stream B
With setting of pulsation rate,
- Flush time = 6 second.
- Suction time = 25 second.
- Flush height = 60 cm.
Area of one pulsator = 13.75 m2
Volume of suction:
= 0.6m x 13.75m2
= 8.25 m3
Convert to Million Liter per Day (MLD),
With 25 second of suction time.
=8.25m3 x 60 second x 60 minute x 24 hours ÷ 1000
25
=28.51 MLD.
8/2/2019 Report Sebenar
http://slidepdf.com/reader/full/report-sebenar 69/73
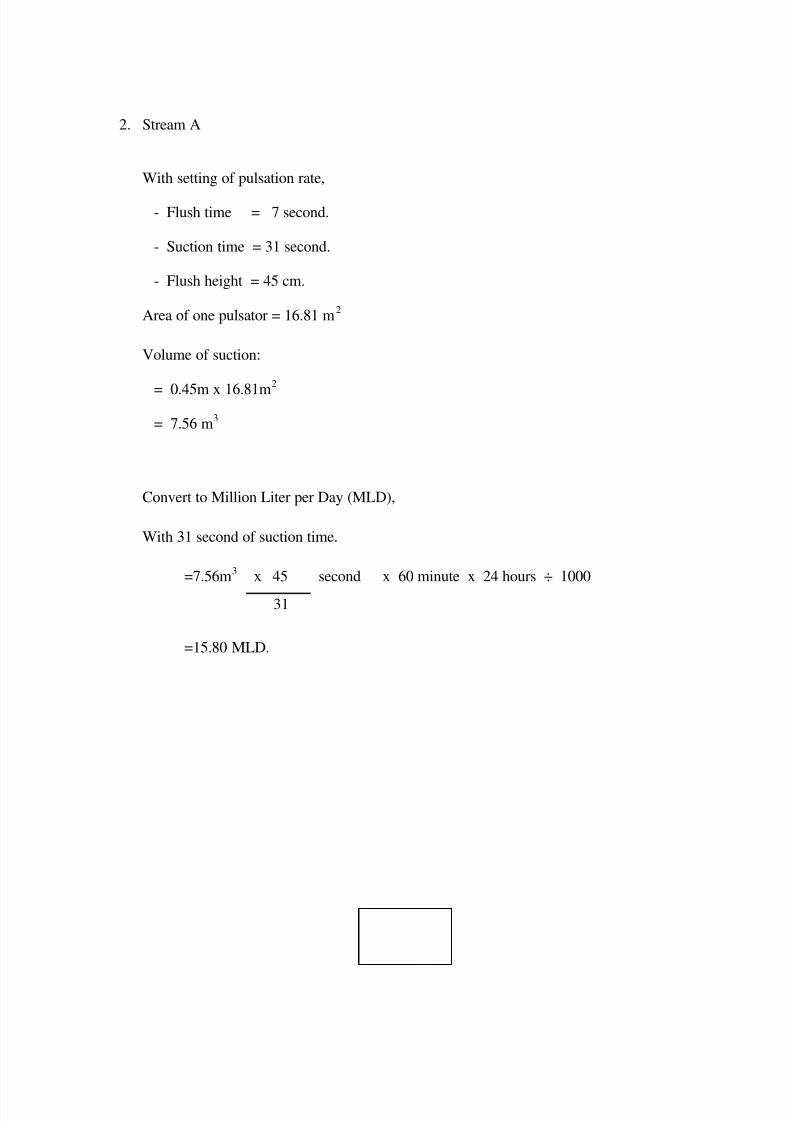
2. Stream A
With setting of pulsation rate,
- Flush time = 7 second.
- Suction time = 31 second.
- Flush height = 45 cm.
Area of one pulsator = 16.81 m2
Volume of suction:
= 0.45m x 16.81m2
= 7.56 m3
Convert to Million Liter per Day (MLD),
With 31 second of suction time.
=7.56m3 x 45 second x 60 minute x 24 hours ÷ 1000
31
=15.80 MLD.
8/2/2019 Report Sebenar
http://slidepdf.com/reader/full/report-sebenar 70/73
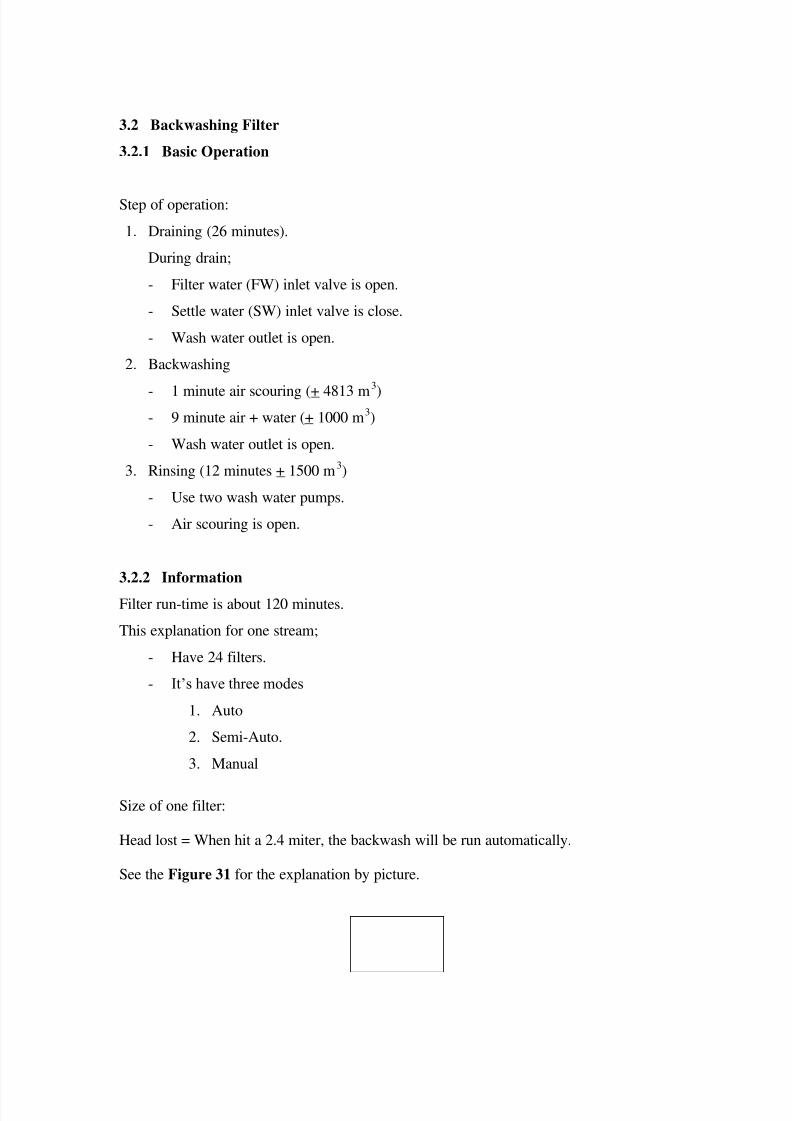
3.2 Backwashing Filter
3.2.1 Basic Operation
Step of operation:
1. Draining (26 minutes).
During drain;
- Filter water (FW) inlet valve is open.
- Settle water (SW) inlet valve is close.
- Wash water outlet is open.
2. Backwashing
- 1 minute air scouring (+ 4813 m3
)
- 9 minute air + water (+ 1000 m3)
- Wash water outlet is open.
3. Rinsing (12 minutes + 1500 m3)
- Use two wash water pumps.
- Air scouring is open.
3.2.2 Information
Filter run-time is about 120 minutes.
This explanation for one stream;
- Have 24 filters.
- It‟s have three modes
1. Auto
2. Semi-Auto.
3. Manual
Size of one filter:
Head lost = When hit a 2.4 miter, the backwash will be run automatically.
See the Figure 31 for the explanation by picture.
8/2/2019 Report Sebenar
http://slidepdf.com/reader/full/report-sebenar 71/73
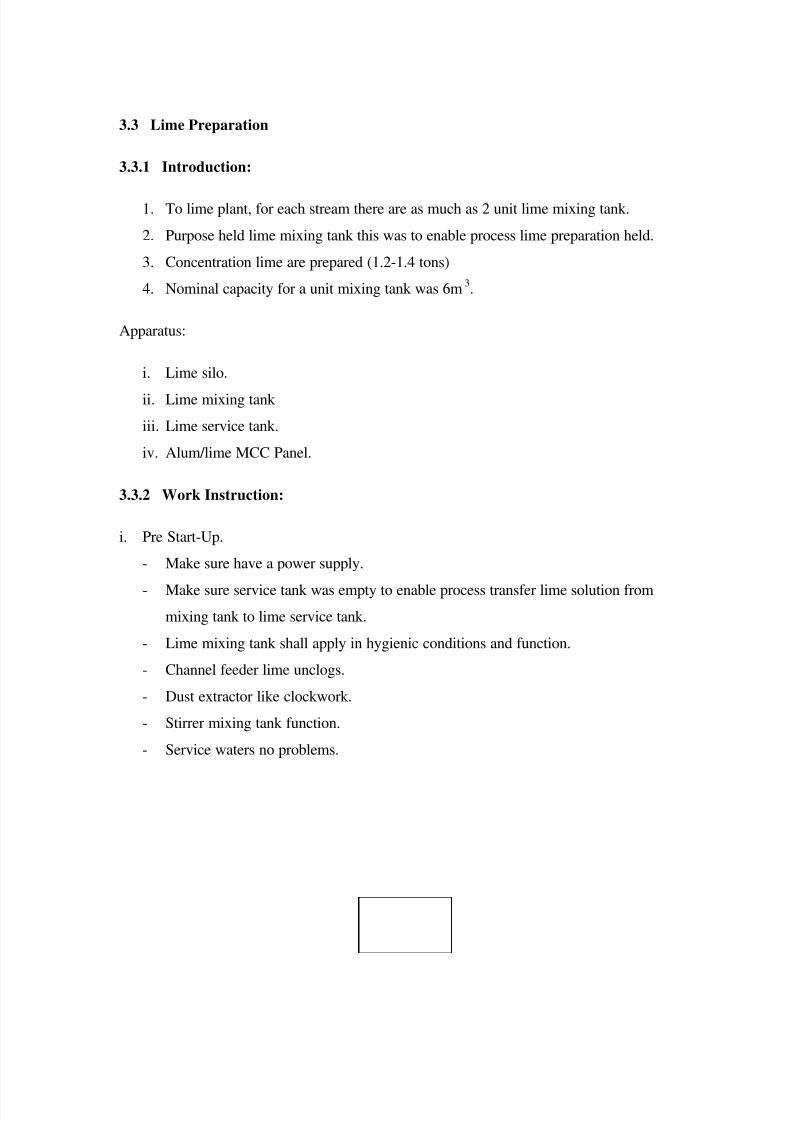
3.3 Lime Preparation
3.3.1 Introduction:
1. To lime plant, for each stream there are as much as 2 unit lime mixing tank.
2. Purpose held lime mixing tank this was to enable process lime preparation held.
3. Concentration lime are prepared (1.2-1.4 tons)
4. Nominal capacity for a unit mixing tank was 6m3.
Apparatus:
i. Lime silo.
ii. Lime mixing tank
iii. Lime service tank.
iv. Alum/lime MCC Panel.
3.3.2 Work Instruction:
i. Pre Start-Up.
- Make sure have a power supply.
- Make sure service tank was empty to enable process transfer lime solution from
mixing tank to lime service tank.
- Lime mixing tank shall apply in hygienic conditions and function.
- Channel feeder lime unclogs.
- Dust extractor like clockwork.
- Stirrer mixing tank function.
- Service waters no problems.
8/2/2019 Report Sebenar
http://slidepdf.com/reader/full/report-sebenar 72/73

8/2/2019 Report Sebenar
http://slidepdf.com/reader/full/report-sebenar 73/73
- When weight (tone) lime in total require real enough, kill switch fluidization
water valve, screw feeder and dust collector.
- To stirrer and dust extractor, letting for 5-10 minutes. This to enable lime
solution in mixing tank mixed perfectly and regular.
- Kill switch stirrer
- Kill switch dust extractor.
- Record number mixing tank and time preparation in boring FRM / CP/02.NOTE:
Note:
1. To stream A, time adopt for lime preparation from lime silo to mixing tank for
heavy between 1.2-1.3 tons was 5-10 minutes.
2. To stream B, time taken to lime preparation from lime silo to mixing tank for
heavy between 1.2-1.3 tons was 15-25 minutes.