je ournal of nvironment & biotechnology research vinanie ... et al_012017.pdf · syndrome...
TRANSCRIPT
Journal of
Environment & Research VINANIE PUBLISHERS
New generation of magnetic microporus material for enhancing route for methylene blue removal from waste water
M. Ruthiraan,1 E.C. Abdullah,1,* N.M. Mubarak,2,* K.R. Thines1
1 Malaysia-Japan International Institute of Technology (MJIIT), Universiti Teknologi Malaysia, Jalan Semarak, 54100 Kuala Lumpur, Malaysia2 Department of Chemical Engineering, Faculty of Engineering and Science, Curtin University, 98009 Sarawak, Malaysia
ORIGINAL RESEARCH ARTICLE
ABSTRACT A statistical analysis was carried out for adsorption of methylene blue onto nickel oxide impregnated magnetic
biochar to determine the optimised condition of methylene blue dye adsorption to attain greater equilibrium adsorption capacity. The mangosteen peel derived magnetic biochar underwent pyrolysis process at zero oxygen environments at 800 0C for 25 min duration. The Design of Experiment (DOE) of the batch adsorption of methylene blue dye onto magnetic biochar was investigated by interacting agitation speed, contact time and adsorbate pH. Design Expert software version 7.0 with Central Composite Design (CCD) method was employed to obtain a minimum number of experiments with maximised operating parameters interactions. The adsorbent dosage and adsorbate initial concentration were fixed at 0.3 g and 50 mg/L respectively, throughout the experimental study. The optimised condition to attain highest removal percentage of 97% was recorded at pH above 7.0, agitation speed of 125 rpm and 30 min contact time. The adsorption isotherm was evaluated using various adsorption isotherm models namely Langmuir, Freundlich, Tempkin and Dubinin–Radushkevich isotherm models. Moreover, the effect temperature on adsorption process was investigated through thermodynamics studies at various temperatures. The magnetic biochar produced at optimum condition possesses total BET surface area of 819.7 m2/g and pore volume of 0.137 cm3/g.
KEYWORDSadsorption; adsorption isotherm; magnetic biochar; mangosteen peel; methylene blue; nickel oxide
1. INTRODUCTION
Mangosteen also known as the queen of fruit is a tropical fruit which vastly grown at south-east Asian countries namely Thailand, Malaysia, Indonesia and Philippines. Approximately 170,000 tonnes were produced annually and 60% remain as bio-waste (Chen et al., 2012). Agriculture waste is one of the major contributors in accelerating the global temperature by increasing the contents of deadly gases such as CO2, N2O and CH4 emission into the atmosphere through different soil and crop management practices. The medium of crop production, soil is one of the major sinks of global warming gaseous and it helps to
confiscate more carbon and cut the N2O emission by adopting smart soil and crop management techniques (Ahmad and Alrozi, 2010). Converting this bio-waste into a useful material reduces the waste management cost as well as contributes to the sustainability of the environment. Conversion of this material into carbon-based adsorbents such as activated carbon required two stage process which consume more energy and at the end exhibit low yield percentage mangosteen (Weecharangsan et al., 2006). Magnetic biochar synthesized via pyrolysis process is one of the viable organic sustainable waste management solution and promising adsorbent for various applications such as wastewater treatment which requires a simple and single adsorption production method either
www.vinanie.com/jebrBiotechnology
Corresponding authors: E.C.Abdullah (ECA); N.M.Mubarak (NMM)
Tel: +0322031211 (ECA); +60 85443939x3833 (NMM)Fax: + 0322031266 (ECA); +60 85 443837 (NMM)E. mail: [email protected] (ECA);[email protected] (NMM)
Received: 01-11-2016Revised: 21-11-2016Accepted: 05-12-2016Available online: 01-01-2017
Journal of Environment and Biotechnology Research, Vol. 6, No. 1, Pages XX-XX, 2017
105
Ruthiraan et al., Journal of Environment and Biotechnology Research, Vol. 6, No. 1, Pages XX-XX, 2017
by slow or fast pyrolysis process. The presence of cationic and anionic charges on the surface of the adsorbent possesses outstanding traits for effective soil amendment for farming, which can combat climate change and improve the soil health with sustainable crop production. Until recently, bio-wastes were mainly pyrolysed for agricultural purposes until researchers found the extraordinary trait of biochar which can be used for wastewater treatment (Talberg and Nielson, 2009). Activated carbon and biochar produced from discarded biomass became a helping hand in this area till they face limitation such as low adsorption efficiency of biochar due to less surface area and two stage synthesis process of activated carbon. These factors have further driven the interest of researcher to look for substituent which is cheap in cost with high adsorption capacity and easy handling (Downie et al., 2009; Major et al., 2009).The introduction of magnetic properties on the surface biochar has enhanced the porosity of this adsorbent which is more efficient and easy handling for wastewater treatment at both pilot plant scale and industrial scale. Moreover, the application of magnetic biochar in water treatment has cut down the post treatment process to remove adsorbent from wastewater (Schnepp et al., 2010). The usage of a permanent magnet to remove the adsorbent from the wastewater exhibited potential benefits compared to other adsorbents. For conventional adsorbents, the filtration process is a must to remove the adsorbent before channeling the treated effluent into sewage. There is increasing concern to treat wastewater containing various types of aqueous pollutants such as heavy metal ions, both organic and inorganic pollutants to decrease their impact on the environment. The exposure of these pollutants can often lead to various diseases such as asthma, skin cancer and many others as well as the extinction of aquatic living (Acharya et al., 2009). Magnetic biochar, that belongs to carbon family is a widely used adsorbent in the removal of heavy metals and other pollutants from wastewater (Inyang et al., 2012). This carbon rich adsorbent removes heavy metals by complexation reaction or by electrostatic attraction of metal ions to various surface oxygen-containing functional groups (Mubarak et al., 2014). Moreover, production of magnetic biochar at minimal oxygen supply enhance the crystalline structure of this adsorbent due to its graphitic domains that are much smaller in comparison with the nanocarbon materials (Ruoff and Lorents, 1995). It also has distinctive and versatile character due to its surface area, microporous
structure, high adsorption capacity, and the high degree of surface reactivity (Liu et al., 2011). Magnetic biochar is known for its economic and cost effective advantages. Organic compounds are another variety of pollutants present in water bodies. These are substances that contain carbon as the chief element combined chemically with at least one other element. Methylene blue (C16H18N3SCl) is one such heterocyclic aromatic compound (Gürses et al., 2004). It has many applications in various branches of chemistry and biology. It is used as a pharmaceutical drug and as a stain (Hameed and Ahmad, 2009; Haque et al., 2011). At room temperature, it appears as an odourless, solid, dark green powder, and yields a blue solution when dissolved in water. It has a significant role in intravital or supravital staining of nerve fibres, as described for the first time by Paul Ehrlich in 1887 (Krafts et al., 2012). The blue colour develops when the dye is exposed to oxygen and is fixed by immersing the stained specimen in an aqueous solution of ammonium molybdate (Fujii and Kusama, 1984; Stark et al., 1969). The dye was earlier extensively used to examine the innervation of internal organs, skin and muscle (Kennedy, 2004). It is also used as a remedy for fungal infections in aquaculture by tropical fish hobbyists. Nevertheless, a combination of malachite green and formaldehyde is far more effective against the parasitic protozoa Ichthyophthirius multiplies (Sudova et al., 2007). Newly laid fish eggs can be protected from being infected by fungus and bacteria. Methylene Blue is very effective for topical and internal treatment of injured, treatment of nitrite, ammonia, and cyanide poisoning and is also used as a part of “medicated fish bath” (Belayachi et al., 2015). Methylene blue is also an inhibitor of monoamine oxidase (MAOI). When the intravenous dosage exceeds 5 mg/kg, it may lead to serious serotonin toxicity also called serotonin syndrome (Aeschlimann et al., 1996; Ramsay et al., 2007; Petzer et al., 2012). This study was carried out to analyse the characteristic of nickel oxide attached magnetic biochar produced at optimum condition by employing various characterisation techniques and to perform statistical optimisation on the removal of methylene blue dye from aqueous solution. The adsorption controlling parameters such as adsorbate-adsorbent contact time, agitation speed and adsorbate pH were investigated by using DOE and the effect of the operating parameters were computed to determine the optimum adsorption condition. Furthermore, the adsorption behaviour in achieving maximum adsorption capacity of the
106
produced adsorbent was determined by conducting adsorption isotherm, kinetics and thermodynamic studies.
2. MATERIALS AND METHODS
2.1. Raw material
All chemicals used in this study were of analytical grade quality purchased from Friendemann Schmidt and were used as received. The Mangosteen peels were collected locally in Penang and were thoroughly washed to remove impurities and fungus.
2.2. Synthesis of magnetic biochar
The grounded and sieved raw biomass was sonicated with 1.0 M NiO aqueous solution for 5 h at 40 0C with 70% sonicating frequency (Elmasonic) by adding 0.4 M of KMnO4 and HNO3 aqueous solution at a ratio of 1:3. The well-mixed suspension was filtered and oven dried at 105 0C for 5 days to achieve minimum moist content. About 50 g of the well dried mixture was placed in a crucible and pyrolysed by using modified muffle furnace (Model Wise Therm, FP-03) 3 L at 1000 0C and zero oxygen environment. A suction pump was connected to the top valve of the furnace to achieve zero oxygen content. The suction was continued until the suction pressure stabilise which indicate that the air inside the furnace were removed and the valve was tight prior to pyrolysis process. The pyrolysis process was conducted at 800 0C for 25 min. The produced nickel oxide magnetic biochar (MBN) was cooled at room temperature and washed thoroughly with deionised water until the washed water reached pH 7.0.
2.3. Characterisation of magnetic biochar
The morphology and characteristic of mangosteen peel derived magnetic biochar at optimum condition were studied by conducting various characterization studies. Field-emission scanning electron microscopy (FESEM) (Brand: Zeiss Model: Auriga) was used to study the transformation of the surface structure. The introduction of HNO3 and KMnO4 aqueous solutions was believed to produce more surface functional groups which enhance the pores formation. The functional groups form on the surface of MBN as the product of pyrolysis was analysed by using the Fourier Transform Infrared (FTIR) (Brand: Bruker, Model: IFS66v/S) spectroscope. The enrichment of surface area due
to the formation of pores with various pore size was determined using Autosorb 1 surface area analyser by nitrogen adsorption at 77 K and drying of the sample at 200 0C for 10 h. Furthermore, the crystallinity of MBN was investigated by utilising X-Ray Diffractometry (XRD) (Brand: Shimadzu). Energy Dispersive X-Ray (EDX) spectroscope was used to determine the elemental chemical composition of both raw material and MBN produced under optimized conditions.
2.4. Batch adsorption study of magnetic biochar
All batch adsorption studies were carried out by adding 0.3 g of MBN into 100 mL of 50mg/L concentrated methylene blue aqueous solution. The adsorption experiments were performed at room temperature (25 0C) by manipulating the operating parameters according to design obtained from the Design of Expert (DOE). The upper and lower value of the parameters were adsorbate pH from 4 to 10, agitation speed from 100 to 150 rpm and agitation time from 30 to 60 min. The orbital shaker was used to conduct the adsorption study to attain uniformity in agitation speed and the pH of the methylene blue dye was altered by adding 0.5 M of NaOH and HNO3 respectively. The removal percentage of adsorbate was computed as below,
( )
(1)
where Co and Cf represent the initial and final concentrations (mg/L) of adsorbate respectively. The sorption equilibrium capacity at given time, qt was calculated by using Equation 2 as stated below:-
(2)
where Co and Ce are the initial and equilibrium concentrations (mg/L) of both adsorbate respectively; W is the mass (g) of MBN and V represent the volume (L) of adsorbate. The removal percentage of methylene blue dye was measured using Ultraviolet-Visible Spectrophotometry (Model: Shimadzu, UV-1800) at the wavelength of 668 nm.
2.5. Adsorption isotherm study
The adsorption isotherm of the mangosteen derived adsorbent was evaluated by conducting batch sorption experiments by varying the initial concentration of methylene blue dye solution from the range of 50 to
Ruthiraan et al., Journal of Environment and Biotechnology Research, Vol. 6, No. 1, Pages XX-XX, 2017
107
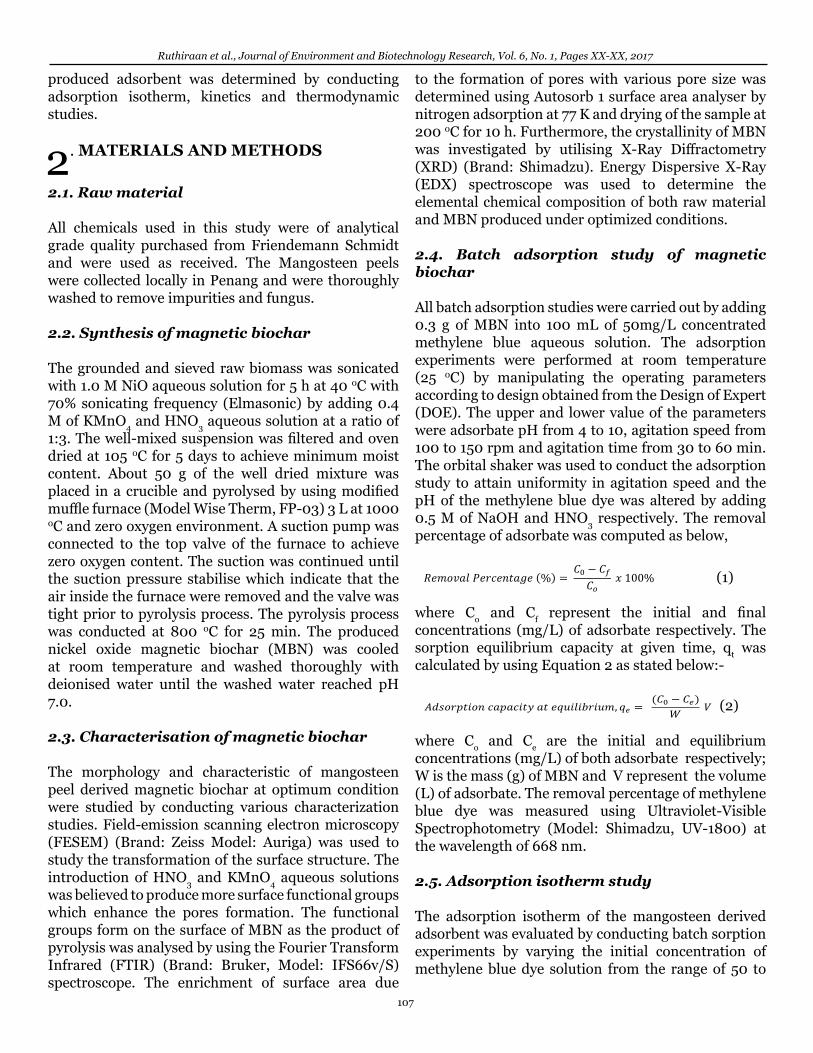
150 mg/L while other parameters were kept constant. The adsorbate-adsorbent were agitated continuously for 2 h and the final concentration was measured. In total, four isotherm models were studied in this study, which includes the Langmuir, Freundlich, Dubinin–Radushkevich and Temkin isotherm models to identify the adsorption behaviour of the adsorbate. For each model studied, an independent graph was plotted to analyse the suitability of each model as shown in Table 1. The equilibrium concentration of adsorbate (mg/L), Ce was measured to calculate the equilibrium amount of adsorbate particles adsorbed per gram of adsorbent qm (mg/g). The Langmuir isotherm model represented by Equation 3 (Table 1), where Ce (mg/L) is the unabsorbed adsorbate concentration, qe (mg/g) is the uptake capacity of the adsorbate after adsorption, KL (L/mg) is the equilibrium constant or Langmuir constant related to the affinity of binding sites and qm (mg/g) represents a particle limiting adsorption capacity. The relationship proposed according to the Freundlich isotherm model is presented in Equation 4, where KF is a Freundlich constant that shows the adsorption capacity of the adsorbent and n is a constant, which shows the affinity between the adsorbate and adsorbent. The equation 5 represent the Tempkin Isotherm model where A (L/g) is the Tempkin isotherm equilibrium binding constant, b (J/mol) is the Tempkin isotherm constant, R is the universal gas constant (8.314 J/mol.K), T (K) is the temperature and B refer to the heat of sorption constant. The isotherm constant of Dubinin–Radushkevich isotherm model (Equation 6) includes, KD which denotes the Dubinin–Radushkevich
isotherm constant (mol2/kJ2), ε is the dimensionless Dubinin–Radushkevich isotherm constant and BD is the isotherm constant.
3. RESULTS AND DISCUSSION
3.1. Characterisation of magnetic biochar
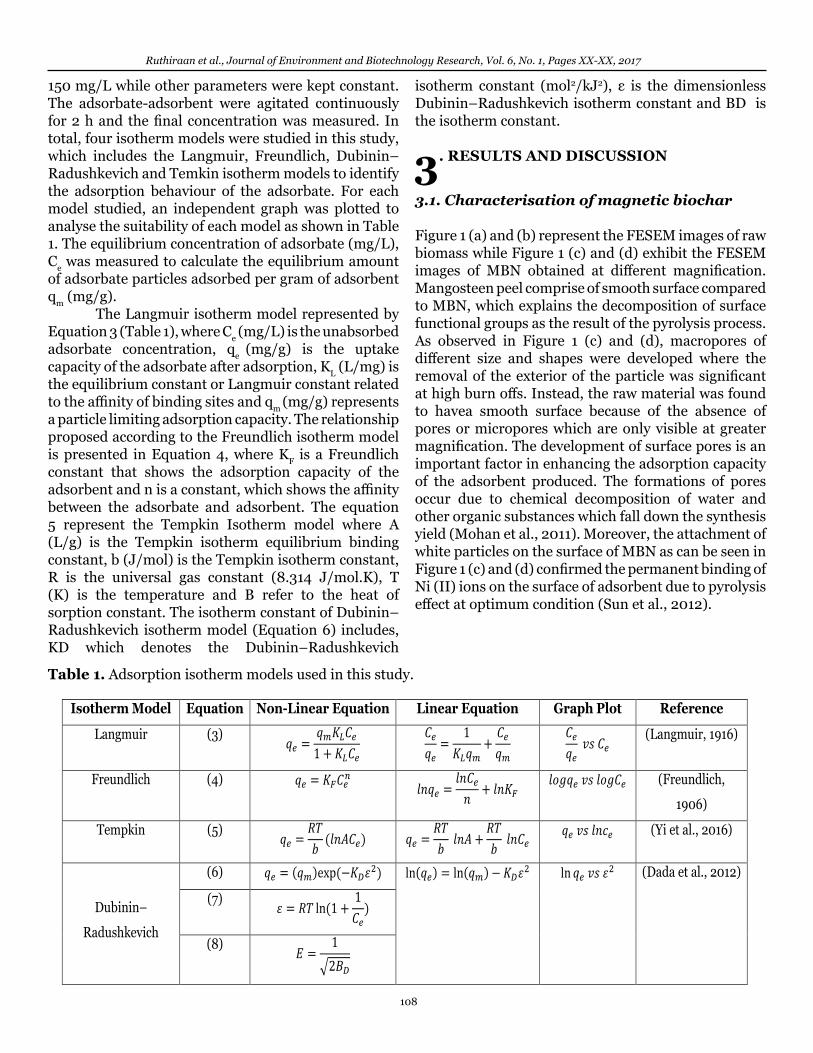
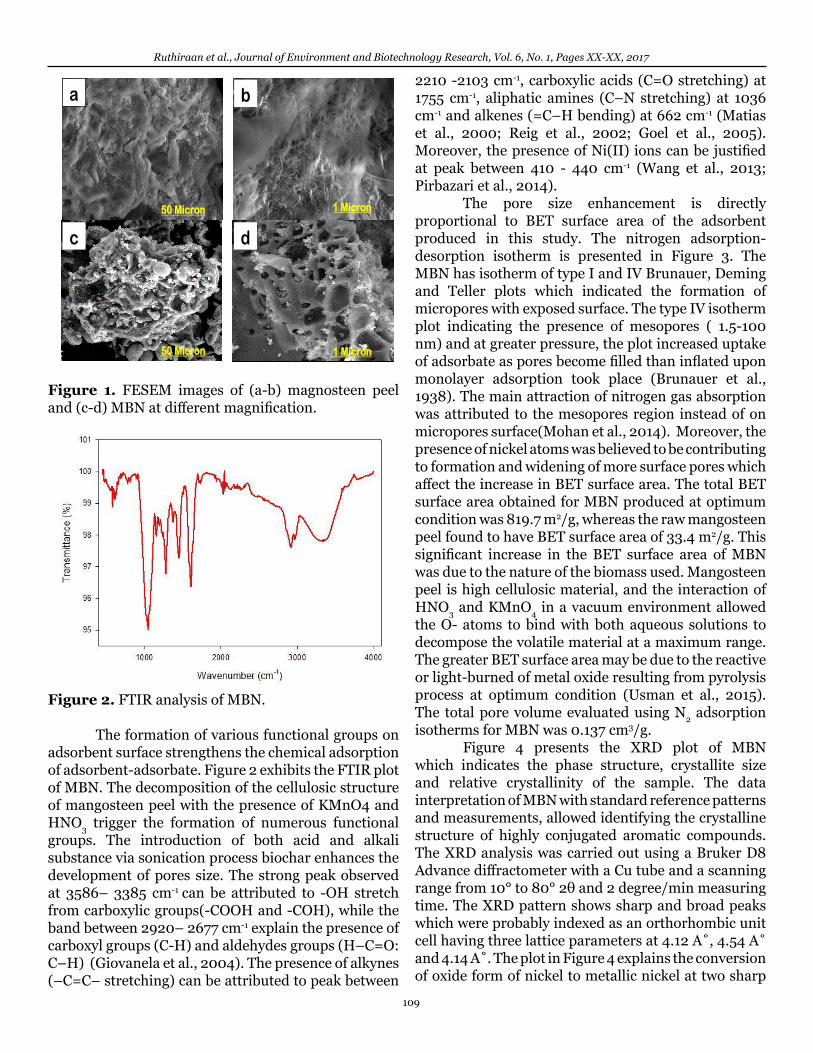
Figure 1 (a) and (b) represent the FESEM images of raw biomass while Figure 1 (c) and (d) exhibit the FESEM images of MBN obtained at different magnification. Mangosteen peel comprise of smooth surface compared to MBN, which explains the decomposition of surface functional groups as the result of the pyrolysis process. As observed in Figure 1 (c) and (d), macropores of different size and shapes were developed where the removal of the exterior of the particle was significant at high burn offs. Instead, the raw material was found to havea smooth surface because of the absence of pores or micropores which are only visible at greater magnification. The development of surface pores is an important factor in enhancing the adsorption capacity of the adsorbent produced. The formations of pores occur due to chemical decomposition of water and other organic substances which fall down the synthesis yield (Mohan et al., 2011). Moreover, the attachment of white particles on the surface of MBN as can be seen in Figure 1 (c) and (d) confirmed the permanent binding of Ni (II) ions on the surface of adsorbent due to pyrolysis effect at optimum condition (Sun et al., 2012).
Ruthiraan et al., Journal of Environment and Biotechnology Research, Vol. 6, No. 1, Pages XX-XX, 2017
108
Isotherm Model Equation Non-Linear Equation Linear Equation Graph Plot Reference
Langmuir (3)
(Langmuir, 1916)
Freundlich (4)
(Freundlich,
1906)
Tempkin (5)
(Yi et al., 2016)
Dubinin–
Radushkevich
(6) (Dada et al., 2012)
(7)
(8) √
Table 1. Adsorption isotherm models used in this study.
a
50 Micron
50 Micron
1 Micron
1 Micron
c
b
d
Figure 1. FESEM images of (a-b) magnosteen peel and (c-d) MBN at different magnification.
Figure 2. FTIR analysis of MBN.
The formation of various functional groups on adsorbent surface strengthens the chemical adsorption of adsorbent-adsorbate. Figure 2 exhibits the FTIR plot of MBN. The decomposition of the cellulosic structure of mangosteen peel with the presence of KMnO4 and HNO3 trigger the formation of numerous functional groups. The introduction of both acid and alkali substance via sonication process biochar enhances the development of pores size. The strong peak observed at 3586– 3385 cm-1 can be attributed to -OH stretch from carboxylic groups(-COOH and -COH), while the band between 2920– 2677 cm-1 explain the presence of carboxyl groups (C-H) and aldehydes groups (H–C=O: C–H) (Giovanela et al., 2004). The presence of alkynes (–C=C– stretching) can be attributed to peak between
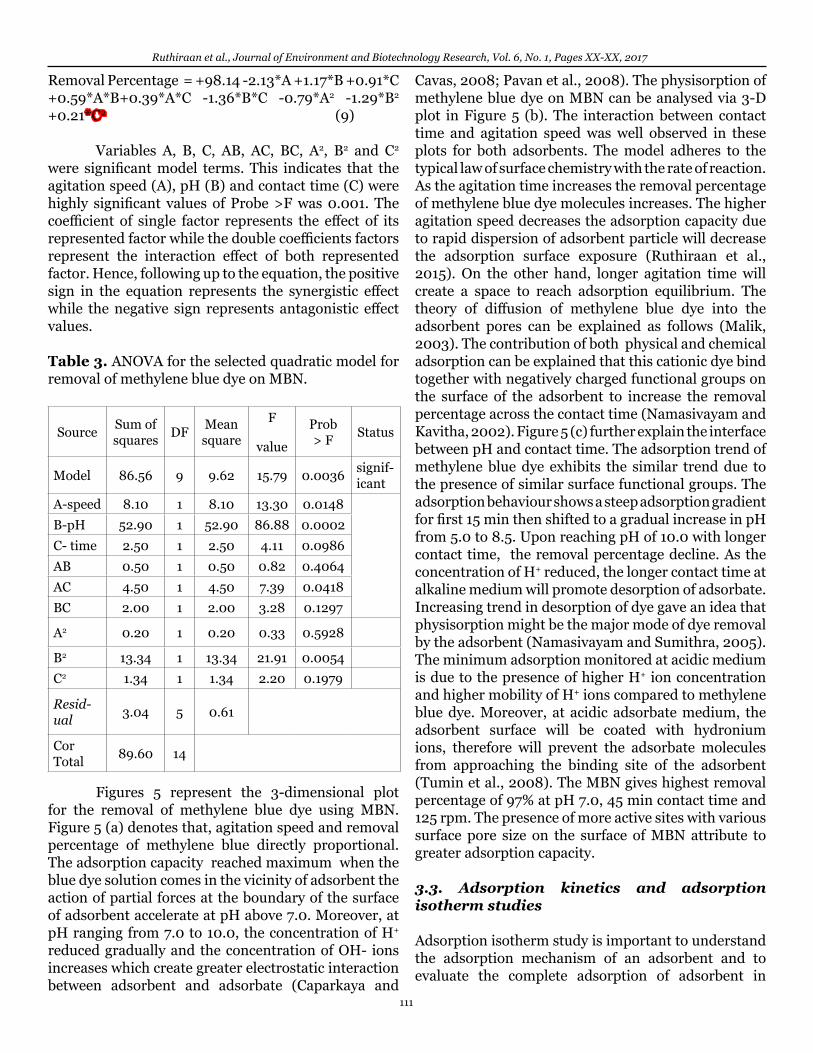
2210 -2103 cm-1, carboxylic acids (C=O stretching) at 1755 cm-1, aliphatic amines (C–N stretching) at 1036 cm-1 and alkenes (=C–H bending) at 662 cm-1 (Matias et al., 2000; Reig et al., 2002; Goel et al., 2005). Moreover, the presence of Ni(II) ions can be justified at peak between 410 - 440 cm-1 (Wang et al., 2013; Pirbazari et al., 2014). The pore size enhancement is directly proportional to BET surface area of the adsorbent produced in this study. The nitrogen adsorption-desorption isotherm is presented in Figure 3. The MBN has isotherm of type I and IV Brunauer, Deming and Teller plots which indicated the formation of micropores with exposed surface. The type IV isotherm plot indicating the presence of mesopores ( 1.5-100 nm) and at greater pressure, the plot increased uptake of adsorbate as pores become filled than inflated upon monolayer adsorption took place (Brunauer et al., 1938). The main attraction of nitrogen gas absorption was attributed to the mesopores region instead of on micropores surface(Mohan et al., 2014). Moreover, the presence of nickel atoms was believed to be contributing to formation and widening of more surface pores which affect the increase in BET surface area. The total BET surface area obtained for MBN produced at optimum condition was 819.7 m2/g, whereas the raw mangosteen peel found to have BET surface area of 33.4 m2/g. This significant increase in the BET surface area of MBN was due to the nature of the biomass used. Mangosteen peel is high cellulosic material, and the interaction of HNO3 and KMnO4 in a vacuum environment allowed the O- atoms to bind with both aqueous solutions to decompose the volatile material at a maximum range. The greater BET surface area may be due to the reactive or light-burned of metal oxide resulting from pyrolysis process at optimum condition (Usman et al., 2015). The total pore volume evaluated using N2 adsorption isotherms for MBN was 0.137 cm3/g. Figure 4 presents the XRD plot of MBN which indicates the phase structure, crystallite size and relative crystallinity of the sample. The data interpretation of MBN with standard reference patterns and measurements, allowed identifying the crystalline structure of highly conjugated aromatic compounds. The XRD analysis was carried out using a Bruker D8 Advance diffractometer with a Cu tube and a scanning range from 10° to 80° 2θ and 2 degree/min measuring time. The XRD pattern shows sharp and broad peaks which were probably indexed as an orthorhombic unit cell having three lattice parameters at 4.12 A˚, 4.54 A˚ and 4.14 A˚. The plot in Figure 4 explains the conversion of oxide form of nickel to metallic nickel at two sharp
Ruthiraan et al., Journal of Environment and Biotechnology Research, Vol. 6, No. 1, Pages XX-XX, 2017
109
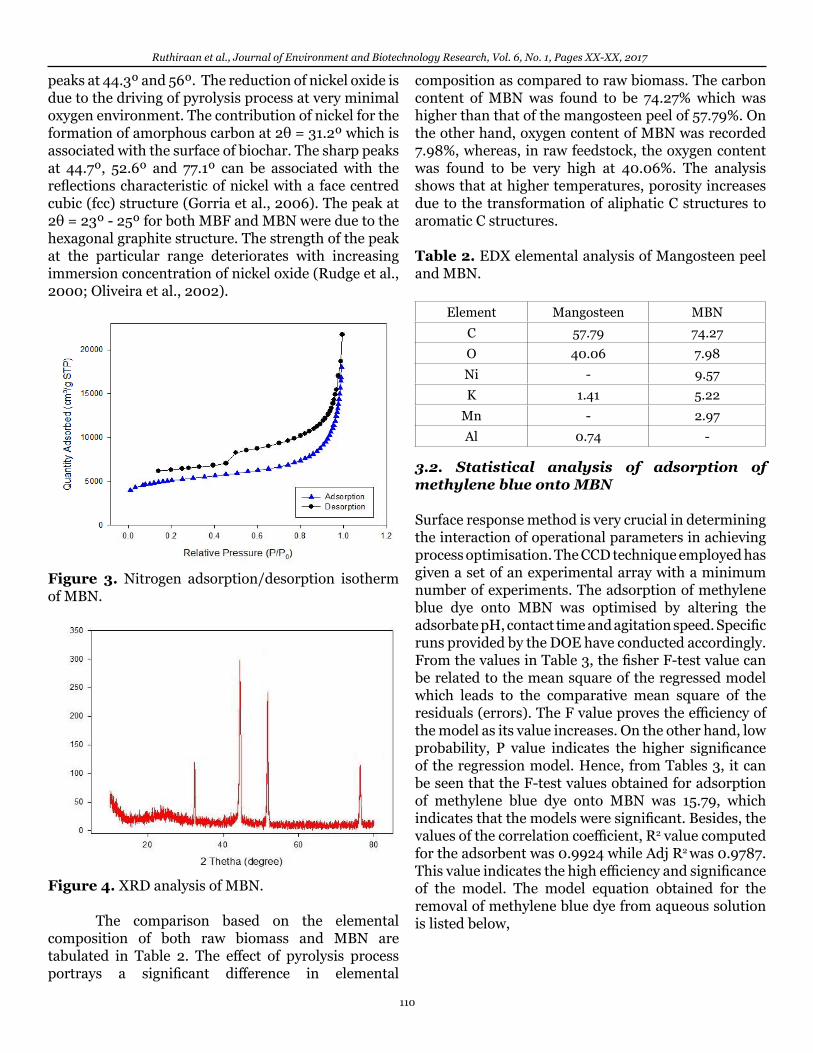
peaks at 44.3º and 56º. The reduction of nickel oxide is due to the driving of pyrolysis process at very minimal oxygen environment. The contribution of nickel for the formation of amorphous carbon at 2θ = 31.2º which is associated with the surface of biochar. The sharp peaks at 44.7º, 52.6º and 77.1º can be associated with the reflections characteristic of nickel with a face centred cubic (fcc) structure (Gorria et al., 2006). The peak at 2θ = 23º - 25º for both MBF and MBN were due to the hexagonal graphite structure. The strength of the peak at the particular range deteriorates with increasing immersion concentration of nickel oxide (Rudge et al., 2000; Oliveira et al., 2002).
Figure 3. Nitrogen adsorption/desorption isotherm of MBN.
Figure 4. XRD analysis of MBN.
The comparison based on the elemental composition of both raw biomass and MBN are tabulated in Table 2. The effect of pyrolysis process portrays a significant difference in elemental
composition as compared to raw biomass. The carbon content of MBN was found to be 74.27% which was higher than that of the mangosteen peel of 57.79%. On the other hand, oxygen content of MBN was recorded 7.98%, whereas, in raw feedstock, the oxygen content was found to be very high at 40.06%. The analysis shows that at higher temperatures, porosity increases due to the transformation of aliphatic C structures to aromatic C structures.
Table 2. EDX elemental analysis of Mangosteen peel and MBN.
Element Mangosteen MBNC 57.79 74.27O 40.06 7.98Ni - 9.57K 1.41 5.22
Mn - 2.97Al 0.74 -
3.2. Statistical analysis of adsorption of methylene blue onto MBN
Surface response method is very crucial in determining the interaction of operational parameters in achieving process optimisation. The CCD technique employed has given a set of an experimental array with a minimum number of experiments. The adsorption of methylene blue dye onto MBN was optimised by altering the adsorbate pH, contact time and agitation speed. Specific runs provided by the DOE have conducted accordingly. From the values in Table 3, the fisher F-test value can be related to the mean square of the regressed model which leads to the comparative mean square of the residuals (errors). The F value proves the efficiency of the model as its value increases. On the other hand, low probability, P value indicates the higher significance of the regression model. Hence, from Tables 3, it can be seen that the F-test values obtained for adsorption of methylene blue dye onto MBN was 15.79, which indicates that the models were significant. Besides, the values of the correlation coefficient, R2 value computed for the adsorbent was 0.9924 while Adj R2 was 0.9787. This value indicates the high efficiency and significance of the model. The model equation obtained for the removal of methylene blue dye from aqueous solution is listed below,
110
Ruthiraan et al., Journal of Environment and Biotechnology Research, Vol. 6, No. 1, Pages XX-XX, 2017
Removal Percentage = +98.14 -2.13*A +1.17*B +0.91*C +0.59*A*B+0.39*A*C -1.36*B*C -0.79*A2 -1.29*B2 +0.21*C2 (9)
Variables A, B, C, AB, AC, BC, A2, B2 and C2 were significant model terms. This indicates that the agitation speed (A), pH (B) and contact time (C) were highly significant values of Probe >F was 0.001. The coefficient of single factor represents the effect of its represented factor while the double coefficients factors represent the interaction effect of both represented factor. Hence, following up to the equation, the positive sign in the equation represents the synergistic effect while the negative sign represents antagonistic effect values.
Table 3. ANOVA for the selected quadratic model for removal of methylene blue dye on MBN.
Source Sum of squares DF Mean
square
F
value
Prob > F Status
Model 86.56 9 9.62 15.79 0.0036 signif-icant
A-speed 8.10 1 8.10 13.30 0.0148B-pH 52.90 1 52.90 86.88 0.0002C- time 2.50 1 2.50 4.11 0.0986AB 0.50 1 0.50 0.82 0.4064AC 4.50 1 4.50 7.39 0.0418BC 2.00 1 2.00 3.28 0.1297
A2 0.20 1 0.20 0.33 0.5928
B2 13.34 1 13.34 21.91 0.0054C2 1.34 1 1.34 2.20 0.1979
Resid-ual 3.04 5 0.61
Cor Total 89.60 14
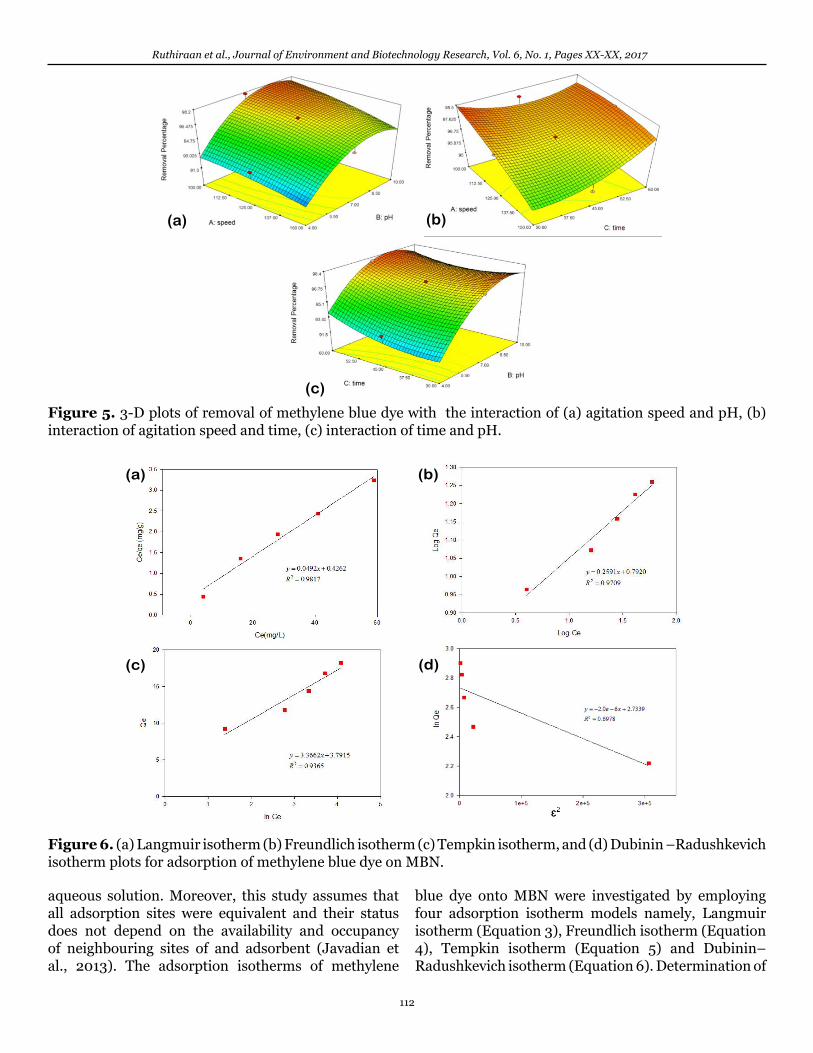
Figures 5 represent the 3-dimensional plot for the removal of methylene blue dye using MBN. Figure 5 (a) denotes that, agitation speed and removal percentage of methylene blue directly proportional. The adsorption capacity reached maximum when the blue dye solution comes in the vicinity of adsorbent the action of partial forces at the boundary of the surface of adsorbent accelerate at pH above 7.0. Moreover, at pH ranging from 7.0 to 10.0, the concentration of H+ reduced gradually and the concentration of OH- ions increases which create greater electrostatic interaction between adsorbent and adsorbate (Caparkaya and
Cavas, 2008; Pavan et al., 2008). The physisorption of methylene blue dye on MBN can be analysed via 3-D plot in Figure 5 (b). The interaction between contact time and agitation speed was well observed in these plots for both adsorbents. The model adheres to the typical law of surface chemistry with the rate of reaction. As the agitation time increases the removal percentage of methylene blue dye molecules increases. The higher agitation speed decreases the adsorption capacity due to rapid dispersion of adsorbent particle will decrease the adsorption surface exposure (Ruthiraan et al., 2015). On the other hand, longer agitation time will create a space to reach adsorption equilibrium. The theory of diffusion of methylene blue dye into the adsorbent pores can be explained as follows (Malik, 2003). The contribution of both physical and chemical adsorption can be explained that this cationic dye bind together with negatively charged functional groups on the surface of the adsorbent to increase the removal percentage across the contact time (Namasivayam and Kavitha, 2002). Figure 5 (c) further explain the interface between pH and contact time. The adsorption trend of methylene blue dye exhibits the similar trend due to the presence of similar surface functional groups. The adsorption behaviour shows a steep adsorption gradient for first 15 min then shifted to a gradual increase in pH from 5.0 to 8.5. Upon reaching pH of 10.0 with longer contact time, the removal percentage decline. As the concentration of H+ reduced, the longer contact time at alkaline medium will promote desorption of adsorbate. Increasing trend in desorption of dye gave an idea that physisorption might be the major mode of dye removal by the adsorbent (Namasivayam and Sumithra, 2005). The minimum adsorption monitored at acidic medium is due to the presence of higher H+ ion concentration and higher mobility of H+ ions compared to methylene blue dye. Moreover, at acidic adsorbate medium, the adsorbent surface will be coated with hydronium ions, therefore will prevent the adsorbate molecules from approaching the binding site of the adsorbent (Tumin et al., 2008). The MBN gives highest removal percentage of 97% at pH 7.0, 45 min contact time and 125 rpm. The presence of more active sites with various surface pore size on the surface of MBN attribute to greater adsorption capacity.
3.3. Adsorption kinetics and adsorption isotherm studies
Adsorption isotherm study is important to understand the adsorption mechanism of an adsorbent and to evaluate the complete adsorption of adsorbent in
111
Ruthiraan et al., Journal of Environment and Biotechnology Research, Vol. 6, No. 1, Pages XX-XX, 2017
aqueous solution. Moreover, this study assumes that all adsorption sites were equivalent and their status does not depend on the availability and occupancy of neighbouring sites of and adsorbent (Javadian et al., 2013). The adsorption isotherms of methylene
blue dye onto MBN were investigated by employing four adsorption isotherm models namely, Langmuir isotherm (Equation 3), Freundlich isotherm (Equation 4), Tempkin isotherm (Equation 5) and Dubinin–Radushkevich isotherm (Equation 6). Determination of
112
Ruthiraan et al., Journal of Environment and Biotechnology Research, Vol. 6, No. 1, Pages XX-XX, 2017
(a) (b)
(c)
Figure 5. 3-D plots of removal of methylene blue dye with the interaction of (a) agitation speed and pH, (b) interaction of agitation speed and time, (c) interaction of time and pH.
(c) (d)
(a) (b)
Figure 6. (a) Langmuir isotherm (b) Freundlich isotherm (c) Tempkin isotherm, and (d) Dubinin –Radushkevich isotherm plots for adsorption of methylene blue dye on MBN.
the adsorption capacity and to evaluate the adsorption intensity of methylene blue dye, four adsorption isotherm models were used to further explain the adsorption behaviour of the adsorbent as shown in Figure 6(a-d). The R2 values obtained for all isotherm models are tabulated in Table 4. This value was taken as the key criterion in determining the validity of the adsorption isotherm models evaluated in this study. The Langmuir, Freundlich and Tempkin isotherm models gave a better prediction of the adsorption process as evident in the R2 value of more than 0.95; whereas the Dubinin-Radushkevich shows a least fit with R2 value of 0.698 for MBN. The higher KL value indicates a better affinity for methylene blue in solution with qm value of 20.325 mg/g. The Freundlich adsorption isotherm constant, 1/n value for the adsorbent was less than one indicating the batch adsorption was dominated by physical adsorption. The R2 value for Tempkin adsorption value resembles better fit on MBN indicating the possibility of different functional group dominating the surface of the adsorbent. The FTIR analysis as shown in Figure 2 shows a strong peak indicating the presence of the aliphatic amine, alkyne and aldehyde group on the surface of MBN may attribute to greater physical adsorption capacity of adsorbate. The computed value of mean free energy, E, value describes the adsorption mechanism of the adsorbent. The value range in between 8 to 16 kJ/mol, which denotes chemical adsorption while the E value lesser than 8 kJ/mol indicates the adsorption occurs physically. The plot ln qe versus ε2 exhibit in Figure 6 (d) represents least favourable R2 correlation value and thus indicates that the Dubinin–Radushkevich adsorption isotherm model could not describe the isotherm data well.
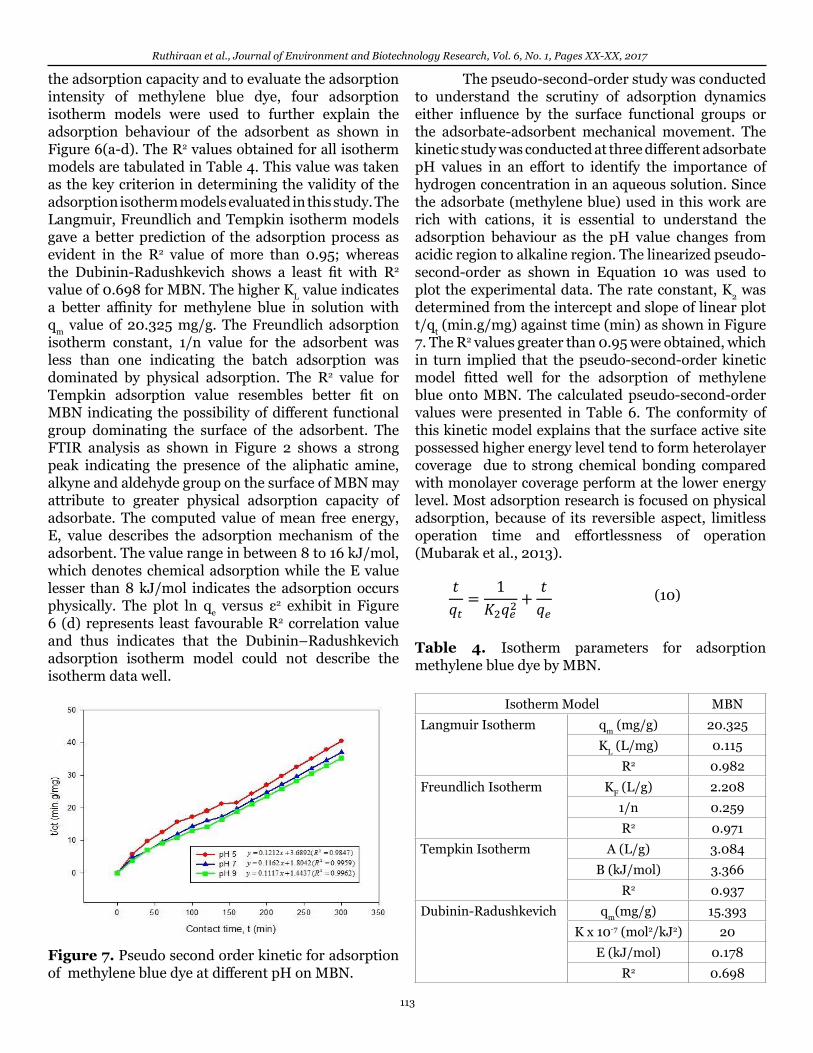
Figure 7. Pseudo second order kinetic for adsorption of methylene blue dye at different pH on MBN.
The pseudo-second-order study was conducted to understand the scrutiny of adsorption dynamics either influence by the surface functional groups or the adsorbate-adsorbent mechanical movement. The kinetic study was conducted at three different adsorbate pH values in an effort to identify the importance of hydrogen concentration in an aqueous solution. Since the adsorbate (methylene blue) used in this work are rich with cations, it is essential to understand the adsorption behaviour as the pH value changes from acidic region to alkaline region. The linearized pseudo-second-order as shown in Equation 10 was used to plot the experimental data. The rate constant, K2 was determined from the intercept and slope of linear plot t/qt (min.g/mg) against time (min) as shown in Figure 7. The R2 values greater than 0.95 were obtained, which in turn implied that the pseudo-second-order kinetic model fitted well for the adsorption of methylene blue onto MBN. The calculated pseudo-second-order values were presented in Table 6. The conformity of this kinetic model explains that the surface active site possessed higher energy level tend to form heterolayer coverage due to strong chemical bonding compared with monolayer coverage perform at the lower energy level. Most adsorption research is focused on physical adsorption, because of its reversible aspect, limitless operation time and effortlessness of operation (Mubarak et al., 2013).
(10)
Table 4. Isotherm parameters for adsorption methylene blue dye by MBN.
Isotherm Model MBNLangmuir Isotherm qm (mg/g) 20.325
KL (L/mg) 0.115R2 0.982
Freundlich Isotherm KF (L/g) 2.2081/n 0.259R2 0.971
Tempkin Isotherm A (L/g) 3.084B (kJ/mol) 3.366
R2 0.937Dubinin-Radushkevich qm(mg/g) 15.393
K x 10-7 (mol2/kJ2) 20E (kJ/mol) 0.178
R2 0.698
113
Ruthiraan et al., Journal of Environment and Biotechnology Research, Vol. 6, No. 1, Pages XX-XX, 2017
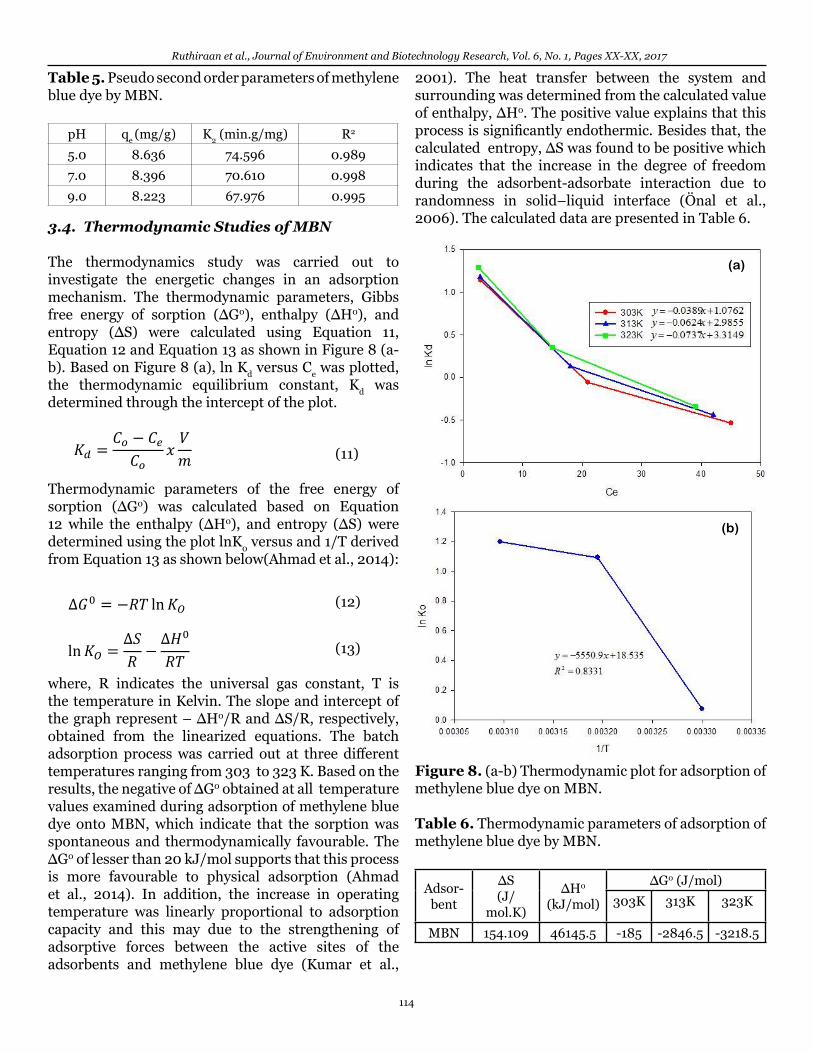
Table 5. Pseudo second order parameters of methylene blue dye by MBN.
pH qe (mg/g) K2 (min.g/mg) R2
5.0 8.636 74.596 0.9897.0 8.396 70.610 0.9989.0 8.223 67.976 0.995
3.4. Thermodynamic Studies of MBN
The thermodynamics study was carried out to investigate the energetic changes in an adsorption mechanism. The thermodynamic parameters, Gibbs free energy of sorption (ΔG0), enthalpy (ΔH0), and entropy (ΔS) were calculated using Equation 11, Equation 12 and Equation 13 as shown in Figure 8 (a-b). Based on Figure 8 (a), ln Kd versus Ce was plotted, the thermodynamic equilibrium constant, Kd was determined through the intercept of the plot.
(11)
Thermodynamic parameters of the free energy of sorption (ΔG0) was calculated based on Equation 12 while the enthalpy (ΔH0), and entropy (ΔS) were determined using the plot lnK0 versus and 1/T derived from Equation 13 as shown below(Ahmad et al., 2014):
(12)
(13)
where, R indicates the universal gas constant, T is the temperature in Kelvin. The slope and intercept of the graph represent – ΔH0/R and ΔS/R, respectively, obtained from the linearized equations. The batch adsorption process was carried out at three different temperatures ranging from 303 to 323 K. Based on the results, the negative of ΔG0 obtained at all temperature values examined during adsorption of methylene blue dye onto MBN, which indicate that the sorption was spontaneous and thermodynamically favourable. The ΔG0 of lesser than 20 kJ/mol supports that this process is more favourable to physical adsorption (Ahmad et al., 2014). In addition, the increase in operating temperature was linearly proportional to adsorption capacity and this may due to the strengthening of adsorptive forces between the active sites of the adsorbents and methylene blue dye (Kumar et al.,
2001). The heat transfer between the system and surrounding was determined from the calculated value of enthalpy, ΔH0. The positive value explains that this process is significantly endothermic. Besides that, the calculated entropy, ΔS was found to be positive which indicates that the increase in the degree of freedom during the adsorbent-adsorbate interaction due to randomness in solid–liquid interface (Önal et al., 2006). The calculated data are presented in Table 6.
(a)
(b)
Figure 8. (a-b) Thermodynamic plot for adsorption of methylene blue dye on MBN.
Table 6. Thermodynamic parameters of adsorption of methylene blue dye by MBN.
Adsor-bent
∆S (J/
mol.K)
∆H0 (kJ/mol)
∆G0 (J/mol)303K 313K 323K
MBN 154.109 46145.5 -185 -2846.5 -3218.5
114
Ruthiraan et al., Journal of Environment and Biotechnology Research, Vol. 6, No. 1, Pages XX-XX, 2017
4. CONCLUSIONS
The mangosteen peel derived magnetic biochar was prepared by using modified muffle furnace at zero oxygen environments. The adsorbent exhibited promising adsorption capacity of methylene blue dye at optimised experimental conditions. The XRD analysis reveals that the magnetic strength of the produced adsorbent was due to reduction process of nickel oxide to Ni2+ ions which resulted in two strong peaks of 44.3º and 56º. Moreover, the presence of the white substrate on the biochar surface explains the binding of Ni2+ ions onto the adsorbent surface through pyrolysis process. Methylene blue adsorption onto MBN was pH and ionic strength dependent where the adsorption mechanism was rapid at low H+ concentration in the adsorbate. The Langmuir, Freundlich and Tempkin isotherm models fitted the experimental data well as compared to Dubinin-Radushkevich isotherm model with the R2 values above 0.95. The maximum adsorption capacity, qm, was determined as 20.325 mg/g with removal percentage of 97%. Moreover, the thermodynamic studies indicated negative Gibbs’s free energy, ΔG0 at all temperatures examined, which for indicate that the sorption of methylene blue onto MPN was spontaneous and thermodynamically favourable.
REFERENCES
Acharya, S., Dilnawaz, F. and Sahoo, S.K. (2009) Targeted epidermal growth factor receptor nanoparticle bioconjugates for breast cancer therapy. Biomaterials, 30, 5737-5750.
Aeschlimann, C., Cerny, T. and Küpfer, A. (1996) Inhibition of (mono) amine oxidase activity and prevention of ifosfamide encephalopathy by methylene blue. Drug metabolism and disposition, 24, 1336-1339.
Ahmad, M.A. and Alrozi, R. (2010) Optimization of preparation conditions for mangosteen peel-based activated carbons for the removal of Remazol brilliant blue R using response surface methodology. Chemical Engineering Journal, 165, 883-890.
Ahmad, M.A., Puad, N.A.A. and Bello, O.S. (2014) Kinetic, equilibrium and thermodynamic studies of synthetic dye removal using pomegranate peel activated carbon prepared by microwave-induced KOH activation. Water Resources and Industry, 6, 18-35.
Belayachi, A., Bestani, B., Bendraoua, A., Benderdouche, N. and Duclaux, L. (2015) The influence of surface functionalization of activated carbon on dyes and metal ion removal from aqueous media. Desalination and Water Treatment, 57, 17557-17569.
Brunauer, S., Emmett, P.H. and Teller, E. (1938) Adsorption of gases in multimolecular layers. Journal of the American Chemical Society, 60, 309-319.
Caparkaya, D. and Cavas, L. (2008) Biosorption of methylene blue by a brown alga Cystoseira barbatula Kützing. Acta Chimica Slovenica, 55, 547-553.
Chen, Y., Huang, M., Chen, W. and Huang, B. (2012) Adsorption of Cu (II) from aqueous solution using activated carbon derived from mangosteen peel. Bioresources, 7, 4965-4975.
Dada, A., Olalekan, A., Olatunya, A. and Dada, O. (2012) Langmuir, Freundlich, Temkin and Dubinin–Radushkevich isotherms studies of equilibrium sorption of Zn2+ unto phosphoric acid modified rice husk. Journal of Applied Chemistry, 3, 38-45.
Downie, A., Crosky, A. and Munroe, P. (2009) Physical properties of biochar. 1st edition. Biochar for Environmental Management: Science and Technology, pp. 13-32.
Freundlich, U. (1906) Die adsorption in lusungen. Journal of Physical Chemistry, 57, 385-470.
Fujii, M. and Kusama, T. (1984) Fixation of horseradish peroxidase reaction products with ammonium molybdate. Neuroscience Research, 1, 153-156.
Giovanela, M., Parlanti, E., Soriano-Sierra, E., Soldi, M. and Sierra, M. (2004) Elemental compositions, FT-IR spectra and thermal behavior of sedimentary fulvic and humic acids from aquatic and terrestrial environments. Geochemical Journal, 38, 255-264.
Goel, J., Kadirvelu, K., Rajagopal, C. and Garg, V.K. (2005) Removal of lead (II) by adsorption using treated granular activated carbon: batch and column studies. Journal of Hazardous Materials, 125, 211-220.
Gorria, P., Sevilla, M., Blanco, J.A. and Fuertes, A.B. (2006) Synthesis of magnetically separable adsorbents through the incorporation of protected nickel nanoparticles in an activated carbon. Carbon, 44, 1954-1957.
Gürses, A., Karaca, S., Doğar, Ç., Bayrak, R., Açıkyıldız, M. and Yalçın, M. (2004) Determination of adsorptive properties of clay/water system: methylene blue sorption. Journal of Colloid and Interface Science, 269, 310-314.
Hameed, B. and Ahmad, A. (2009) Batch adsorption of methylene blue from aqueous solution by garlic peel, an agricultural waste biomass. Journal of Hazardous Materials, 164, 870-875.
Haque, E., Jun, J.W. and Jhung, S.H. (2011) Adsorptive removal of methyl orange and methylene blue from aqueous solution with a metal-organic framework material, iron terephthalate (MOF-235). Journal of Hazardous Materials, 185, 507-511.
Inyang, M., Gao, B., Yao, Y., Xue, Y., Zimmerman, A.R., Pullammanappallil, P. and Cao, X. (2012) Removal of heavy metals from aqueous solution by biochars derived from anaerobically digested biomass. Bioresource Technology, 110, 50-56.
Javadian, H., Ghorbani, F., Tayebi, H.-A. and Asl, S.H. (2013) Study of the adsorption of Cd (II) from aqueous solution using zeolite-based geopolymer, synthesized from coal fly ash; kinetic, isotherm and thermodynamic studies. Arabian Journal of Chemistry, 8, 837-849.
Kennedy, W.R. (2004) Opportunities afforded by the study of unmyelinated nerves in skin and other organs. Muscle and Nerve, 29, 756-767.
Krafts, K., Hempelmann, E. and Skórska-Stania, A. (2012) From methylene blue to chloroquine: a brief review of the development of an antimalarial therapy. Parasitology Research, 111, 1-6.
Kumar, P., Mal, N., Oumi, Y., Yamana, K. and Sano, T. (2001) Mesoporous materials prepared using coal fly ash as the silicon and aluminium source. Journal of Materials Chemistry, 11, 3285-3290.
Langmuir, I. 1916. The constitution and fundamental properties of solids and liquids. Part I. solids. Journal of the American Chemical Society, 38, 2221-2295.
115
Ruthiraan et al., Journal of Environment and Biotechnology Research, Vol. 6, No. 1, Pages XX-XX, 2017
Liu, W.-J., Zeng, F.-X., Jiang, H. and Zhang, X.-S. (2011) Preparation of high adsorption capacity bio-chars from waste biomass. Bioresource Technology, 102, 8247-8252.
Major, J., Steiner, C., Downie, A. and Lehmann, J. (2009) Biochar effects on nutrient leaching. 1st edition, Biochar for environmental management: Science and Technology, pp. 271.
Malik, P.K. (2003) Use of activated carbons prepared from sawdust and rice-husk for adsorption of acid dyes: a case study of Acid Yellow 36. Dyes and pigments, 56, 239-249.
Matias, M., De La Orden, M., Sánchez, C.G. and Urreaga, J.M. (2000) Comparative spectroscopic study of the modification of cellulosic materials with different coupling agents. Journal of Applied Polymer Science, 75, 256-266.
Mohan, D., Kumar, H., Sarswat, A., Alexandre-Franco, M. and Pittman, C.U. (2014) Cadmium and lead remediation using magnetic oak wood and oak bark fast pyrolysis bio-chars. Chemical Engineering Journal, 236, 513-528.
Mohan, D., Rajput, S., Singh, V.K., Steele, P.H. and Pittman, C.U. (2011) Modeling and evaluation of chromium remediation from water using low cost bio-char, a green adsorbent. Journal of Hazardous materials, 188, 319-333.
Mubarak, N.M., Alicia, R.F., Abdullah, E.C., Sahu, J.N., Haslija, A.B.A. and Tan, J. (2013) Statistical optimization and kinetic studies on removal of Zn2+ using functionalized carbon nanotubes and magnetic biochar. Journal of Environmental Chemical Engineering, 1, 486-495.
Mubarak, N.M., Kundu, A., Sahu, J.N., Abdullah, E.C. and Jayakumar, N.S. (2014) Synthesis of palm oil empty fruit bunch magnetic pyrolytic char impregnating with FeCl3 by microwave heating technique. Biomass and Bioenergy, 61, 265-275.
Namasivayam, C. and Kavitha, D. (2002) Removal of Congo red from water by adsorption onto activated carbon prepared from coir pith, an agricultural solid waste. Dyes and Pigments, 54, 47-58.
Namasivayam, C. and Sumithra, S. (2005) Removal of direct red 12B and methylene blue from water by adsorption onto Fe (III)/Cr (III) hydroxide, an industrial solid waste. Journal of Environmental Management, 74, 207-215.
Oliveira, L.C., Rios, R.V., Fabris, J.D., Garg, V., Sapag, K. and Lago, R.M. (2002) Activated carbon/iron oxide magnetic composites for the adsorption of contaminants in water. Carbon, 40, 2177-2183.
Önal, Y., Akmil-Başar, C., Eren, D., Sarıcı-Özdemir, Ç. and Depci, T. (2006) Adsorption kinetics of malachite green onto activated carbon prepared from Tunçbilek lignite. Journal of Hazardous Materials, 128, 150-157.
Pavan, F.A., Mazzocato, A.C. and Gushikem, Y. (2008) Removal of methylene blue dye from aqueous solutions by adsorption using yellow passion fruit peel as adsorbent. Bioresource Technology, 99, 3162-3165.
Petzer, A., Harvey, B.H., Wegener, G. and Petzer, J.P. (2012) Azure B, a metabolite of methylene blue, is a high-potency, reversible inhibitor of monoamine oxidase. Toxicology and Applied Pharmacology, 258, 403-409.
Pirbazari, A.E., Saberikhah, E. and Kozani, S.H. (2014) Fe3O4-wheat straw: preparation, characterization and its application for methylene blue adsorption. Water Resources and Industry, 7, 23-37.
Ramsay, R., Dunford, C. and Gillman, P. (2007) Methylene blue and serotonin toxicity: inhibition of monoamine oxidase A (MAO A) confirms a theoretical prediction. British Journal of Pharmacology, 152, 946-951.
Reig, F.B., Adelantado, J.G. and Moreno, M.M. (2002) FTIR quantitative analysis of calcium carbonate (calcite) and silica (quartz) mixtures using the constant ratio method. Application to geological samples. Talanta, 58, 811-821.
Rudge, S.R., Kurtz, T.L., Vessely, C.R., Catterall, L.G. and Williamson, D.L. (2000) Preparation, characterization, and performance of magnetic iron–carbon composite microparticles for chemotherapy. Biomaterials, 21, 1411-1420.
Ruoff, R.S. and Lorents, D.C. (1995) Mechanical and thermal properties of carbon nanotubes. Carbon, 33, 925-930.
Ruthiraan, M., Mubarak, N.M., Thines, R.K., Abdullah, E.C., Sahu, J.N., Jayakumar, N.S. and Ganesan, P. (2015) Comparative kinetic study of functionalized carbon nanotubes and magnetic biochar for removal of Cd2+ ions from wastewater. Korean Journal of Chemical Engineering, 32, 446-457.
Schnepp, Z., Yang, W., Antonietti, M. and Giordano, C. (2010) Biotemplating of metal carbide microstructures: The magnetic leaf. Angewandte Chemie International Edition, 49, 6564-6566.
Stark, M.J., Smalley, K.N. and Rowe, E.C. (1969) Methylene blue staining of axons in the ventral nerve cord of insects. Stain Technology, 44, 97-102.
Sudova, E., Machova, J., Svobodova, Z. and Vesely, T. (2007) Negative effects of malachite green and possibilities of its replacement in the treatment of fish eggs and fish: a review. Veterinarni Medicina, 52, 527-539.
Sun, H., Hockaday, W.C., Masiello, C.A. and Zygourakis, K. (2012) Multiple controls on the chemical and physical structure of biochars. Industrial and Engineering Chemistry Research, 51, 3587-3597.
Talberg, A. and Nielson, L. (2009) The Kyoto Protocol’s clean development mechanism. background note. Parliament of Australia. http://www.aph.gov. au/Library/pubs/BN/2008-09/KyotoProtocol_CDM.pdf.
Tumin, N.D., Chuah, A.L., Zawani, Z. and Rashid, S.A. (2008) Adsorption of copper from aqueous solution by Elais Guineensis kernel activated carbon. Journal of Engineering Science and Technology, 3, 180-189.
Usman, A.R., Ahmad, M., El-Mahrouky, M., Al-Omran, A., Ok, Y. S., Sallam, A.S., El-Naggar, A.H. and Al-Wabel, M.I. (2015) Chemically modified biochar produced from conocarpus waste increases NO3 removal from aqueous solutions. Environmental Geochemistry and Health, 38, 511-521.
Wang, Y., Wang, X., Wang, X., Liu, M., Wu, Z., Yang, L., Xia, S. and Zhao, J. (2013) Adsorption of Pb (II) from aqueous solution to Ni-doped bamboo charcoal. Journal of Industrial and Engineering Chemistry, 19, 353-359.
Weecharangsan, W., Opanasopit, P., Sukma, M., Ngawhirunpat, T., Sotanaphun, U. and Siripong, P. (2006) Antioxidative and neuroprotective activities of extracts from the fruit hull of mangosteen (Garcinia mangostana Linn.). Medical Principles and Practice, 15, 281-287.
Yi, Q., Fan, R., Xie, F., Min, H., Zhang, Q. and Luo, Z. (2016) Selective recovery of Au(III) and Pd(II) from waste PCBs using ethylenediamine modified persimmon tannin adsorbent. Procedia Environmental Sciences, 31, 185-194.
116
Ruthiraan et al., Journal of Environment and Biotechnology Research, Vol. 6, No. 1, Pages XX-XX, 2017