distribution and temporal behaviour of o and no … nazatul...berdekatan sekolah-sekolah terpilih di...
TRANSCRIPT

Sains Malaysiana 46(2)(2017): 197–207 http://dx.doi.org/10.17576/jsm-2017-4602-03
Distribution and Temporal Behaviour of O3 and NO2 Near Selected Schools in Seberang Perai, Pulau Pinang and Parit Buntar, Perak, Malaysia
(Sifat Taburan dan Masa O3 dan NO2 Berdekatan Sekolah-sekolah Terpilih di Seberang Perai, Pulau Pinang dan Parit Buntar, Perak, Malaysia)
NAZATUL SYADIA ZAINORDIN*, NOR AZAM RAMLI & MAHER ELBAYOUMI
ABSTRACT
Air quality has deteriorated in urban areas as a result of increased anthropogenic activities. Quantitative information on the influence of meteorological conditions on several pollutants in a tropical climate is still lacking. Real-time ozone (O3) and nitrogen dioxide (NO2) levels were measured nearby selected schools in Malaysia to examine the impact of meteorological factors on monitoring pollutants. The results showed the overall 10 min average concentrations of the main parameters during school holiday were 24 ppb (O3) and 33 ppb (NO2) while during school day the overall 10 min average concentrations were 26 ppb (O3) and 51 ppb (NO2). Although there are no minimum requirements for short-term exposure by MAAQG, if compared to 1 h average requirements, all concentrations were still below the suggested values. Regarding spatial distribution, a different trend in pollutant concentration among the schools was observed because of the influence of temperature (AT) and wind speed (WS). The results were verified by Pearson correlation, where significant correlations (p<0.01) were determined between air pollutants and meteorological factors, which were temperature, wind speed and relative humidity. Meanwhile, the distribution of O3 was moderately correlated with NO2. However, the results of multivariate analysis indicate that temperature and relative humidity had the most significant influence on the formation of O3. In summary, the results of this study showed that all precursors and meteorological parameters contribute to the production of O3. Hence, reducing O3 precursors, which are emitted by vehicles, is essential to lessening the exposure to O3.
Keywords: Downwind transport; meteorological parameters; nitrogen oxide; ozone; wet condition
ABSTRAK
Kualiti udara telah merosot di kawasan bandar akibat daripada peningkatan aktiviti antropogen. Maklumat kuantitatif terhadap pengaruh keadaan meteorologi kepada beberapa pencemar dalam iklim tropika masih kurang. Kadar ozon (O3) dan nitrogen dioksida (NO2) pada masa sebenar telah diukur berdekatan beberapa sekolah yang telah dipilih di Malaysia untuk menilai kesan factor meteorologi terhadap pencemar yang dipantau. Keputusan menunjukkan kepekatan purata 10 min keseluruhan bagi parameter utama semasa cuti sekolah adalah 24 ppb (O3) dan 33 ppb (NO2) sementara semasa hari sekolah adalah 26 ppb (O3) dan 51 ppb (NO2). Walaupun tiada syarat minimum untuk pendedahan jangka pendek, jika dibandingkan dengan syarat purata 1 jam, kesemua kepekatan ini masih di bawah nilai yang disarankan oleh Garis Panduan Kualiti Udara Malaysia (MAAQG). Mengenai taburan reruang, perbezaan trend bagi kepekatan pencemar antara sekolah-sekolah diperhatikan, disebabkan pengaruh suhu dan kelajuan angin. Keputusan telah dibuktikan melalui korelasi Pearson, dengan korelasi ketaranya (p<0.01) ditentukan antara pencemar udara dan faktor meteorologi, iaitu suhu, kelajuan angin dan kelembapan relatif. Sementara itu, taburan kepekatan O3 adalah berkolerasi sederhana dengan kepekatan NO2. Namun begitu, keputusan daripada analisis multivariat menunjukkan suhu dan kelembapan relatif mempunyai pengaruh yang paling ketara dalam pembentukan O3. Secara ringkas, keputusan daripada kajian ini menunjukkan bahawa semua prapenanda O3 dan parameter meteorologi menyumbang kepada penghasilan O3. Justeru itu, pengurangan prapenanda O3 yang dihasilkan oleh kenderaan adalah sangat penting dalam mengurangkan pendedahan terhadap pencemaran O3.
Kata kunci: Keadaan lembap; nitrogen dioksida; ozon; parameter meteorologi; pembawaan angin
INTRODUCTION
Urban air pollution is a serious environmental problem that threatens human health and well-being as reported by many researchers from all over the world (Beauchamp et al. 2004; Mayer et al. 1999; Unal et al. 2003). Ground-level ozone (O3) is a noxious secondary air pollutant that is produced
by a series of complex photochemical reactions between its precursors, such as nitrogen oxides (NOx) or volatile organic compounds (VOCs) and incoming solar radiations (Ghazali et al. 2010; Seinfeld & Pandis 2006). Nitrogen dioxide (NO2) is generally produced by anthropogenic activities, such as combustion of fossil fuels and biomass

198
burning. O3 and NO2 are always associated with negative impact which gave adversely affect to human health, crop yield and sensitive materials. Ozone is a major constituent of photochemical smog and and plays significant roles as greenhouse gas (Abdul Wahab et al. 2005; Kleanthous et al. 2014). Furthermore, O3 and NO2 also play critical role in tropospheric chemistry since it is principal precursors to hydroxyl radical (OH) which controlling oxidizing power at lower atmosphere (Alghamdi et al. 2014). Formations and variations in O3 and NO2 concentrations are regulated by various processes, such as photochemistry, physical and chemical pollutant removal, dispersion and transportation (Alghamdi et al. 2014). All emitted pollutants are dispersed and diluted in the atmosphere and these processes are strongly influenced by meteorological conditions, such as temperature (AT), UV light, wind speed (WS), wind direction (WD) and relative humidity (RH) (Ghazali et al. 2010; Kovac-Andric et al. 2009; Toh et al. 2013). Several studies showed that intense solar radiation, high temperature, minimal rainfall, low wind speed and low relative rainfall also promote higher O3 concentrations (Kovac-Andric et al. 2009; Latif et al. 2012; Tawfik & Steiner 2013; Toh et al. 2013). Malaysia is currently experiencing rapid urbanization and economic growth as it strives to become an industrialized nation. Increased anthropogenic activities such as industrialization, urbanization and transportation significantly affect the air quality of tropical countries such as Malaysia. The O3 variations in tropical countries do not follow the same trend as temporal countries, which have four prominent seasons with maximum concentrations measured during summer. Diurnal variations for UVB in tropical climates that influence air temperature and high relative humidity may affect the diurnal variability of O3 concentration compared with that in temporal countries. The ambient concentrations of O3 and NO2 are expected to be higher during school days compared with those during school holidays because of high traffic volume.
Exposure to these pollutants repeatedly may give adverse effects to human health especially to schoolchildren. Thus, the objective of this study were to determine the differences of the concentrations between school holidays and school days as well as to investigate the influences of meteorological parameters on O3 and NO2 concentrations for both school phases at selected schools in a tropical region, which is climatically different from other regions.
MATERIALS AND METHODS
SITE DESCRIPTION
Penang is located in the peninsular of Malaysia by the Straits of Malacca. It is divided into two parts, namely, Seberang Perai (753 km2) and Penang Island (293 km2). Penang is also known as a highly urbanized and industrialized area in Malaysia. In 2013, the total human population and number of motor vehicles in Penang were 1,647,716 (Department of Statistics Malaysia 2013) and 2,408,715 (Road Transport Department Malaysia 2013), respectively. Meanwhile, Parit Buntar is a small town located on north of Kerian District and bordered by Bandar Baharu, Kedah and Nibong Tebal, Penang. Parit Buntar is now greatly develop especially on transportation sector. Thus, major concerns regarding pollutant levels are taken seriously because of their adverse effects on human health and the environment. Sampling was carried out near four school buildings located in different areas. These areas were selected based on their population and traffic volume. In areas with high population and traffic volume, a large number of pedestrians are expected to use the pedestrian facilities near the area (Dueñas et al. 2004). Thus, these individuals may have been exposed more to pollutants and hazards caused by the traffic. The distributions and descriptions of the selected schools in Penang are shown in Figure 1 and Table 1.
FIGURE 1. Site distribution of selected schools in Seberang Perai, Penang and Parit Buntar, Perak (not to scale)
Parit Buntar, Perak
Seberang Perai, Penang
199
DATA SAMPLING
In the first phase, data sampling were collected during school holiday. Data sampling was carried out during school holidays from November 2014 to January 2015. Data were collected for 12 h from 7:00 am to 7:00 pm. Data during school holiday were used to represent the background concentrations on each selected schools. For the second phase of monitoring, data samplings were collected during school day for five days on weekday (Monday to Friday). Data sampling during school day were represented as the actual concentrations of these selected schools. Duration of data monitoring were different based on the school hours. Data were collected on the roadside of the selected schools to determine the air pollutant concentrations that pedestrians were exposed to. Five parameters were considered in this study: O3, NO2, AT, RH, and WS. O3 and NO2 were measured using Aeroqual S500, while meteorological parameters were obtained employing the E-Sampler 9800. Based on the results from the survey that were reported elsewhere, the average time that most of the students stay by the roadside were 10 min before they were picked up by their parents or guardians after school. Therefore, 10 min average data was analysed to observe the short-term exposure of gaseous pollutants to the schoolchildren. Box and Whisker plot was employed to graphically describe the mean, median, lower and upper quartile, as well as the maximum and minimum values of the parameters. The daily variations of O3, NO2 and meteorological parameters were used to provide important information regarding O3 and NO2 concentrations, as well as the effect of meteorological parameters on O3 formation. The spatial variability of O3 and NO2 in all the selected schools was assessed using coefficients of divergence (COD). COD values indicate the differences between the absolute concentrations of pollutants at the monitoring sites (Wang et al. 2011; Wilson et al. 2005). COD provides the degree of uniformity between the simultaneously sampled sites j and k, as shown in (1).
COD I, k = , (1)
where xi, j and k are the measured concentrations at sites j and k over the sampling period; and p is the number of observations. A small COD (r < 0.2) indicates similar pollutant concentrations between two sites, whereas a value approaching unity indicates a significant difference in absolute concentrations and subsequent spatial non-uniformity between the sites. Pearson correlation coefficient was employed for univariate analysis to measure the linear association and the strength and direction of the relationship between selected variables and a dependent variable (Awang et al. 2015; Elbayoumi et al. 2014). Equation 2 shows equation for calculating r.
r = (2)
where x and y are selected variables and and are the means of the variables. Multivariate analysis was performed to assess the main factors associated with O3 and NO2 levels. For statistical analysis, SPSS (version 22) was used. Statistical significance was taken as p ≤ 0.01. Through these analyses, the variation and influence of meteorological factors on O3 and NO2 levels were determined.
RESULTS AND DISCUSSION
CHARACTERISTICS OF POLLUTANT LEVELS
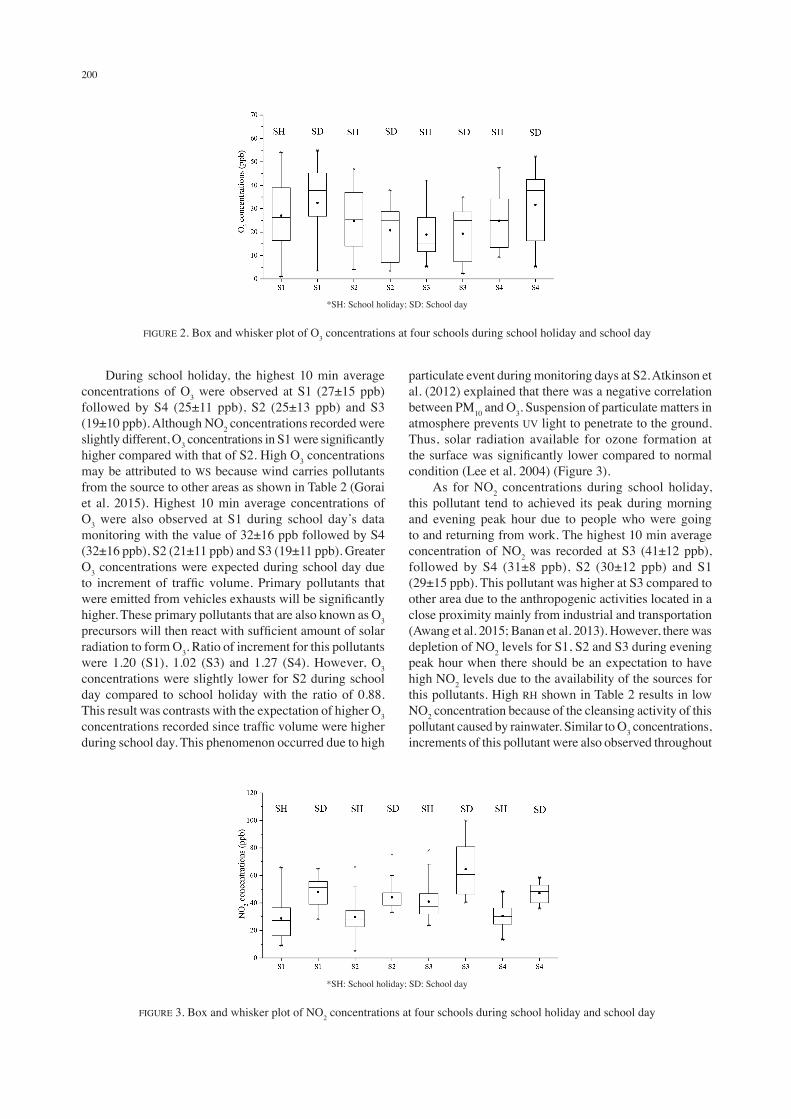
The results for box and whisker plots of O3 and NO2 concentrations at four schools are illustrated in Figures 2 and 3. During school holiday, the ranges of O3 concentrations were 1-54 ppb for S1, 4-47 ppb for S2, 5-42 ppb for S3 and 9-48 ppb for S4. Meanwhile, the ranges of NO2 concentrations were 9-66 ppb for S1, 5-66 ppb for S2, 24-78 ppb for S3 and 13-48 ppb for S4. During school day, O3 concentrations were in the range between 3-55 ppb for S1, 3-38 ppb for S2, 2-35 ppb for S3 and 5-52 ppb for S4. As for NO2 concentrations, the ranges were between 28 and 65 ppb for S1, 33-75 ppb for S2, 41-100 ppb for S3 and 36-58 ppb for S4 (Figure 2).
TABLE 1. Description of selected schools in Seberang Perai, Penang and Parit Buntar, Perak
Site Location Schools ID Coordinate Location
SJK (C) Sin Hwa S1 5° 7’ 35.2416”N100° 29’ 31.1388”E Town and commercial area
SMK Seri Nibong S2 5° 10’ 17.601”N100° 28’ 15.7008”E Residential and commercial area
SK Seri Tasek S3 5° 17’ 4.1712” N100° 30’ 11.4012”E Rural and industrial area
SMK Tunku Abdul Rahman S4 5° 10’ 8.241”N100° 29’ 10.8306”E Industrial and residential area
200
During school holiday, the highest 10 min average concentrations of O3 were observed at S1 (27±15 ppb) followed by S4 (25±11 ppb), S2 (25±13 ppb) and S3 (19±10 ppb). Although NO2 concentrations recorded were slightly different, O3 concentrations in S1 were significantly higher compared with that of S2. High O3 concentrations may be attributed to WS because wind carries pollutants from the source to other areas as shown in Table 2 (Gorai et al. 2015). Highest 10 min average concentrations of O3 were also observed at S1 during school day’s data monitoring with the value of 32±16 ppb followed by S4 (32±16 ppb), S2 (21±11 ppb) and S3 (19±11 ppb). Greater O3 concentrations were expected during school day due to increment of traffic volume. Primary pollutants that were emitted from vehicles exhausts will be significantly higher. These primary pollutants that are also known as O3 precursors will then react with sufficient amount of solar radiation to form O3. Ratio of increment for this pollutants were 1.20 (S1), 1.02 (S3) and 1.27 (S4). However, O3 concentrations were slightly lower for S2 during school day compared to school holiday with the ratio of 0.88. This result was contrasts with the expectation of higher O3 concentrations recorded since traffic volume were higher during school day. This phenomenon occurred due to high
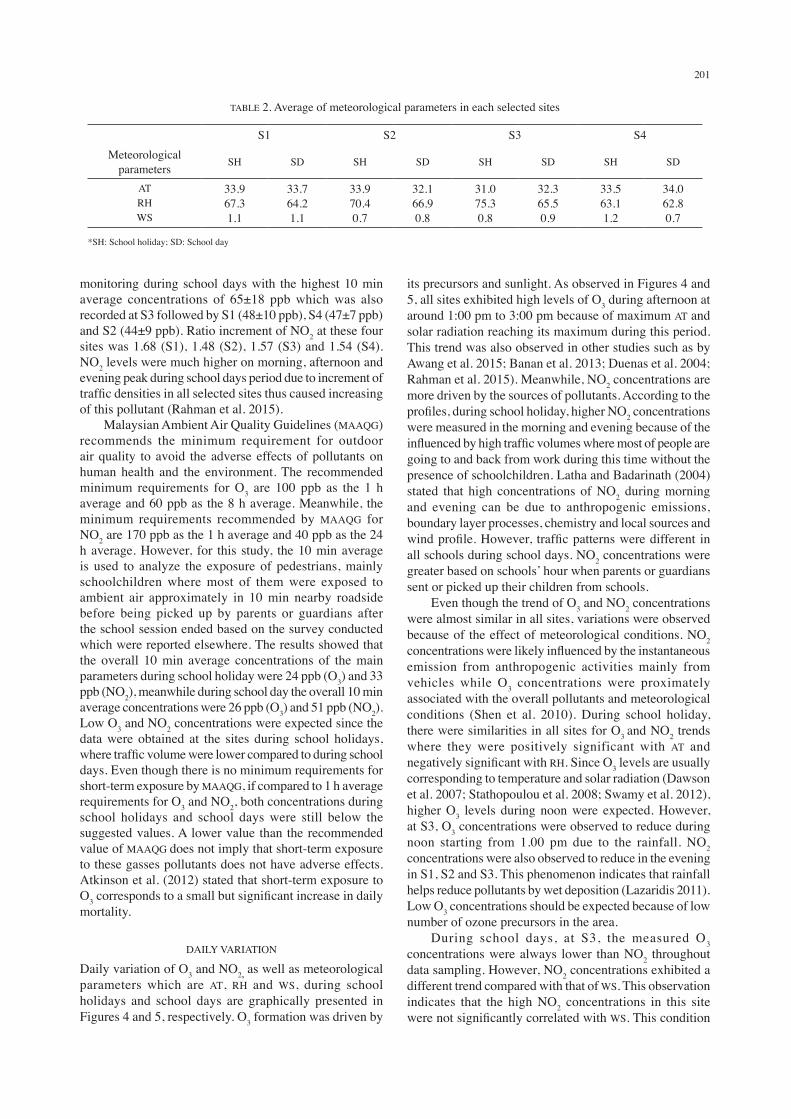
particulate event during monitoring days at S2. Atkinson et al. (2012) explained that there was a negative correlation between PM10 and O3. Suspension of particulate matters in atmosphere prevents UV light to penetrate to the ground. Thus, solar radiation available for ozone formation at the surface was significantly lower compared to normal condition (Lee et al. 2004) (Figure 3). As for NO2 concentrations during school holiday, this pollutant tend to achieved its peak during morning and evening peak hour due to people who were going to and returning from work. The highest 10 min average concentration of NO2 was recorded at S3 (41±12 ppb), followed by S4 (31±8 ppb), S2 (30±12 ppb) and S1 (29±15 ppb). This pollutant was higher at S3 compared to other area due to the anthropogenic activities located in a close proximity mainly from industrial and transportation (Awang et al. 2015; Banan et al. 2013). However, there was depletion of NO2 levels for S1, S2 and S3 during evening peak hour when there should be an expectation to have high NO2 levels due to the availability of the sources for this pollutants. High RH shown in Table 2 results in low NO2 concentration because of the cleansing activity of this pollutant caused by rainwater. Similar to O3 concentrations, increments of this pollutant were also observed throughout
*SH: School holiday; SD: School day
FIGURE 2. Box and whisker plot of O3 concentrations at four schools during school holiday and school day
SH SD
*SH: School holiday; SD: School day
FIGURE 3. Box and whisker plot of NO2 concentrations at four schools during school holiday and school day
201
monitoring during school days with the highest 10 min average concentrations of 65±18 ppb which was also recorded at S3 followed by S1 (48±10 ppb), S4 (47±7 ppb) and S2 (44±9 ppb). Ratio increment of NO2 at these four sites was 1.68 (S1), 1.48 (S2), 1.57 (S3) and 1.54 (S4). NO2 levels were much higher on morning, afternoon and evening peak during school days period due to increment of traffic densities in all selected sites thus caused increasing of this pollutant (Rahman et al. 2015). Malaysian Ambient Air Quality Guidelines (MAAQG) recommends the minimum requirement for outdoor air quality to avoid the adverse effects of pollutants on human health and the environment. The recommended minimum requirements for O3 are 100 ppb as the 1 h average and 60 ppb as the 8 h average. Meanwhile, the minimum requirements recommended by MAAQG for NO2 are 170 ppb as the 1 h average and 40 ppb as the 24 h average. However, for this study, the 10 min average is used to analyze the exposure of pedestrians, mainly schoolchildren where most of them were exposed to ambient air approximately in 10 min nearby roadside before being picked up by parents or guardians after the school session ended based on the survey conducted which were reported elsewhere. The results showed that the overall 10 min average concentrations of the main parameters during school holiday were 24 ppb (O3) and 33 ppb (NO2), meanwhile during school day the overall 10 min average concentrations were 26 ppb (O3) and 51 ppb (NO2). Low O3 and NO2 concentrations were expected since the data were obtained at the sites during school holidays, where traffic volume were lower compared to during school days. Even though there is no minimum requirements for short-term exposure by MAAQG, if compared to 1 h average requirements for O3 and NO2, both concentrations during school holidays and school days were still below the suggested values. A lower value than the recommended value of MAAQG does not imply that short-term exposure to these gasses pollutants does not have adverse effects. Atkinson et al. (2012) stated that short-term exposure to O3 corresponds to a small but significant increase in daily mortality.
DAILY VARIATION
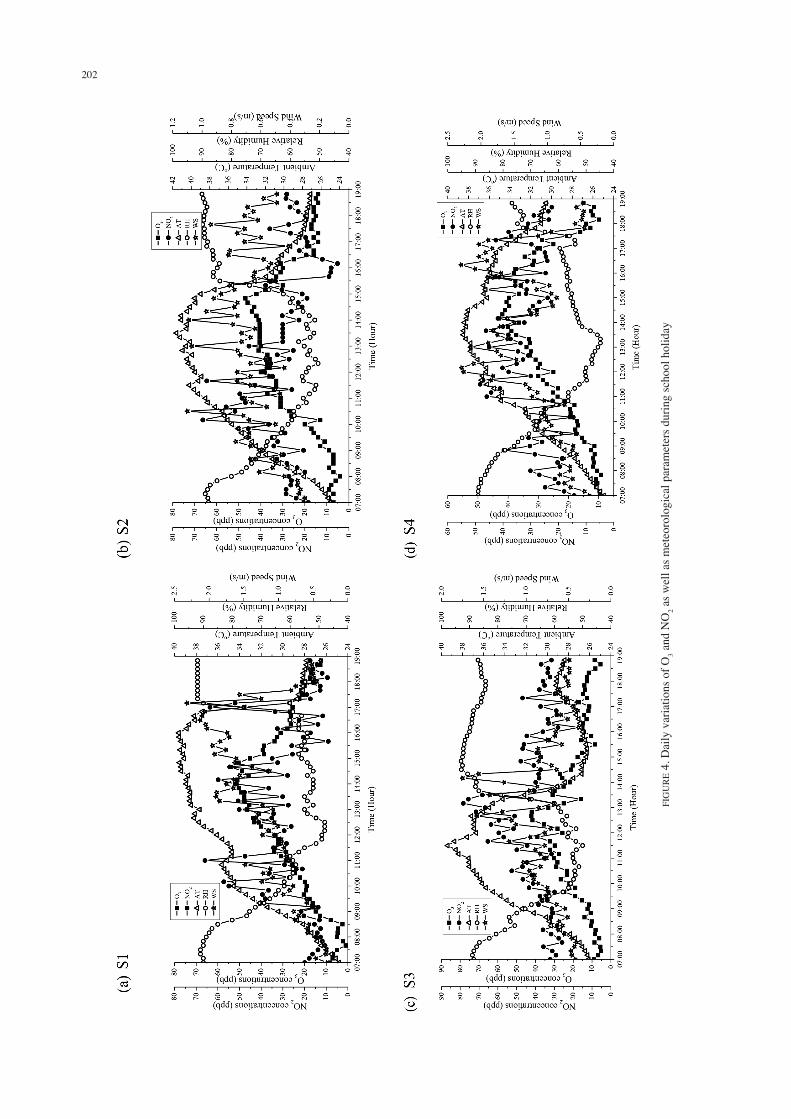
Daily variation of O3 and NO2, as well as meteorological parameters which are AT, RH and WS, during school holidays and school days are graphically presented in Figures 4 and 5, respectively. O3 formation was driven by
its precursors and sunlight. As observed in Figures 4 and 5, all sites exhibited high levels of O3 during afternoon at around 1:00 pm to 3:00 pm because of maximum AT and solar radiation reaching its maximum during this period. This trend was also observed in other studies such as by Awang et al. 2015; Banan et al. 2013; Duenas et al. 2004; Rahman et al. 2015). Meanwhile, NO2 concentrations are more driven by the sources of pollutants. According to the profiles, during school holiday, higher NO2 concentrations were measured in the morning and evening because of the influenced by high traffic volumes where most of people are going to and back from work during this time without the presence of schoolchildren. Latha and Badarinath (2004) stated that high concentrations of NO2 during morning and evening can be due to anthropogenic emissions, boundary layer processes, chemistry and local sources and wind profile. However, traffic patterns were different in all schools during school days. NO2 concentrations were greater based on schools’ hour when parents or guardians sent or picked up their children from schools. Even though the trend of O3 and NO2 concentrations were almost similar in all sites, variations were observed because of the effect of meteorological conditions. NO2 concentrations were likely influenced by the instantaneous emission from anthropogenic activities mainly from vehicles while O3 concentrations were proximately associated with the overall pollutants and meteorological conditions (Shen et al. 2010). During school holiday, there were similarities in all sites for O3 and NO2 trends where they were positively significant with AT and negatively significant with RH. Since O3 levels are usually corresponding to temperature and solar radiation (Dawson et al. 2007; Stathopoulou et al. 2008; Swamy et al. 2012), higher O3 levels during noon were expected. However, at S3, O3 concentrations were observed to reduce during noon starting from 1.00 pm due to the rainfall. NO2 concentrations were also observed to reduce in the evening in S1, S2 and S3. This phenomenon indicates that rainfall helps reduce pollutants by wet deposition (Lazaridis 2011). Low O3 concentrations should be expected because of low number of ozone precursors in the area. During school days, at S3, the measured O3 concentrations were always lower than NO2 throughout data sampling. However, NO2 concentrations exhibited a different trend compared with that of WS. This observation indicates that the high NO2 concentrations in this site were not significantly correlated with WS. This condition
*SH: School holiday; SD: School day
FIGURE 2. Box and whisker plot of O3 concentrations at four schools during school holiday and school day
SH SD
TABLE 2. Average of meteorological parameters in each selected sites
S1 S2 S3 S4Meteorological
parameters SH SD SH SD SH SD SH SD
ATRHWS
33.967.31.1
33.764.21.1
33.970.40.7
32.166.90.8
31.075.30.8
32.365.50.9
33.563.11.2
34.062.80.7
*SH: School holiday; SD: School day
202
FIG
UR
E 4.
Dai
ly v
aria
tions
of O
3 and
NO
2 as w
ell a
s met
eoro
logi
cal p
aram
eter
s dur
ing
scho
ol h
olid
ay

203
FIG
UR
E 5.
Dai
ly v
aria
tions
of O
3 and
NO
2 as w
ell a
s met
eoro
logi
cal p
aram
eter
s dur
ing
scho
ol d
ay

204
happened due to pollutant sources originally come from this area. As mentioned earlier, S3 is located in close proximity with industrial area with greater traffic volume. Thus, the pollutants from these sources contributed to the condition of this site. The recorded data showed that WS exhibited a similar pattern as O3. This observation verifies that increased of O3 concentrations are positively and significantly correlated with WS. Lal et al. (2000) mentioned that surface wind direction is directly influences high O3 levels, but they also responsible for the diurnal variations of the primary pollutants. In summary, the O3 levels are strongly depending on wind effect (Banan et al. 2013).
SPATIAL VARIABILITY
COD is a statistical technique employed to measure the magnitude of differences between sites. The summary of COD values calculated for O3 and NO2 concentrations are shown in Tables 3 and 4. The COD values for O3 concentrations between S2 and S4 as well as S1 and S2 are smaller than 0.2. These differences show the spatial homogeneity between sites, a state that explains the almost identical concentrations. S2 and S4 are located at residential area where high traffic volume is expected to become the major source of air pollutants. Relatively high divergences were observed between other sites with COD values of 0.2054, 0.2344, 0.2589 and 0.2935 for differences between sites S1 and S4, S2 and S3, S3 and S4, as well as S1 and S3, respectively. COD values approximately higher than 0.2 indicate a heterogeneous spatial distribution between these sites. As for NO2 concentrations, all COD values were found to be higher than 0.2 between these sites. This indicates that there were high significantly differences between S1, S2, S3 with S4 during 10 min data monitoring. The lower COD value was recorded between S3 and S4 with 0.2066, meanwhile higher COD value was recorded between S1 and S3 with 0.3123. Even though S1 located in a town area, S3 recorded higher NO2 concentrations rather than at S1. Location of
S3 which exposed to more nearby anthropogenic sources mainly industrial as well as transportation lead to greater levels of this pollutant in this area.
CORRELATIONS BETWEEN INDOOR VARIABLES AND METEOROLOGICAL PARAMETERS
Table 5 presents the Pearson correlation matrix between O3, NO2 and meteorological parameters. Based on the results for both during school holidays and school days, O3 is significantly and positively correlated with NO2, AT and WS except for RH, where a significantly negative correlation was observed. During school holiday, the highest magnitude was recorded between O3 and AT (r=0.905, p<0.01), followed by WS (r=0.824, p<0.01), RH (r=0.797, p<0.01) and NO2 (r=0.635, p<0.01). Meanwhile, during school days, the highest magnitude was also recorded between O3 and AT (r=0.991, p<0.01), followed by RH (r=0.855, p<0.01), WS (r=0.843, p<0.01) and NO2 (r=0.468, p<0.01). A magnitude value that is close to 1.00 indicates an almost similar temporal behavior between parameters. Therefore, according to the r-value, O3 was highly correlated with AT, RH and WS meanwhile O3 formation was moderately correlated with NO2. The positive correlation between O3 with AT and WS were expected to occur since sunlight may initiate the oxidation of O3 precursors, which leads to O3 formation (Jenkin & Clemitshaw 2000). Hassan et al. (2013) stated that downwind effect may also significantly affect O3 concentrations. The movement of gaseous pollutants, particularly O3 precursors, from one area to another often results in high levels of O3 concentration because of photochemical reaction. However, the positive correlation between O3 and NO2 was not expected because NO2 is known as one of O3 precursor. Increased O3 levels are associated with a drop of NO2 due to oxidation of this precursor (Awang at al. 2015). RH corresponds to the wet condition of the area. Wet condition or high RH will reduce O3 formation because of insufficient sunlight to driven O3 formation. Thus, RH was expected to be negatively correlated with O3.
TABLE 3. Summarize of COD values of O3 concentrations between sites
S1 S2 S3 S4S1S2S3S4
1 0.17331
0.29350.2344
1
0.20540.16660.2589
1
TABLE 4. Summarize of COD values of NO2 concentrations between sites
S1 S2 S3 S4S1S2S3S4
1 0.27301
0.31230.2590
1
0.25240.22980.2066
1

205
FACTORS AFFECTING O3 AND NO2 CONCENTRATIONS
Table 6 shows the results of the multivariate analysis of factors that affect O3 and NO2 concentrations, which are mainly meteorological parameters for all the monitoring sites. During school holidays, O3 concentrations were significantly influenced by AT and RH (p<0.01). AT was positively correlated with O3 concentrations and negatively correlated with RH because O3 production
requires sufficient amount of solar radiation. However, O3 formation was insignificantly influenced by WS. These results also found during school days where only AT and RH were significantly influenced the production of O3. As for NO2 concentrations during school holiday, only RH significantly influenced the increase of NO2 levels at the monitoring sites. Meanwhile, AT and WS were found to be insignificant. RH was negatively correlated with NO2 levels. During high RH, the precipitation of rainwater occurs,
TABLE 5. Pearson correlation matrix of O3, NO2 and meteorological parameters
School holidayO3 (ppb) NO2 (ppb) AT (°C) RH (%) WS (m/s)
O3 (ppb)NO2 (ppb)AT (°C)RH (%)WS (m/s)
1 0.635**
10.905**
0.789**
1
-0.797**
-0.827**
-0.968**
1
0.824**
0.500**
0.755**
-0.650**
1School day
O3 (ppb) NO2 (ppb) AT (°C) RH (%) WS (m/s)O3 (ppb)NO2 (ppb)AT (°C)RH (%)WS (m/s)
1 0.468**
10.991**
0.654**
1
-0.855**
-0.744**
-0.974**
1
0.843**
0.682**
0.919**
-0.895**
1
**Correlation is significant at the 0.01 level (2-tailed)
TABLE 6. Multivariate analysis of factors affecting O3 and NO2 concentrations for overall monitoring sites
School holidayB (Standardized coefficient) Significance
O3 concentrationsATRHWSAdjusted R2
1.8591.0830.123
0.0000.0000.0420.918
NO2 concentrationsATRHWSAdjusted R2
-0.099-0.951-0.043
0 7830.0030.7200.673
School DayB (Standardized coefficient) Significance
O3 concentrationsATRHWSAdjusted R2
1.7540.830-0.027
0.0000.0000.8290.876
NO2 concentrationsATRHWSAdjusted R2
-1.901-2.1200.532
0.0000.0000.0100.679

206
which carry the pollutants to the ground. This phenomenon decreases the pollutant level in the atmosphere (Rahman et al. 2015). However, varied from school day’s data monitoring, AT also gave a significant influenced to NO2 levels. AT was negatively correlated with NO2 levels because of O3 formation. Solar radiation initiated oxidation of O3 precursors particularly NO2 to produce O3 (Jenkin & Clemitshaw 2000).
CONCLUSION
The objective of this study were to determine the differences of the concentrations between school holidays and school days as well as to investigate the influences of meteorological parameters on O3 and NO2 concentrations for both school phases at selected schools in a tropical region, which is climatically different from other regions. The results showed the overall 10 min average concentrations of the main parameters during school holiday were 24 ppb (O3) and 33 ppb (NO2) while during school days, the overall 10 min average concentrations were 26 ppb (O3) and 51 ppb (NO2). The results also showed individual concentrations to determine the differences between school holidays and school days. The results indicated that all sites recorded higher O3 concentrations during school days except for S2 where the concentrations were slightly lower than during school holiday due to the high particulate event during data monitoring. The maximum ratio of concentrations differences was recorded at S4 with 1.27. Meanwhile, NO2 concentrations at all sites were higher during school days with the maximum ratio recorded at S1 (1.68). According to the Pearson correlation coefficient, O3 was highly correlated with AT, RH and WS. Meanwhile, O3 was moderately correlated with NO2. These results verify that NO2 and meteorological parameters are crucial in O3 production. A sufficient amount of solar radiation and O3 precursors are needed in O3 formation. Hence, reducing O3 precursors, which are mainly emitted by vehicles, is essential to lessen the exposure of pedestrians to O3.
ACKNOWLEDGEMENTS
The authors would like to thank Universiti Sains Malaysia for the funding under Research University Grant of RUI 1001/PAWAM/811206 and also to MyBrain15 for the financial support throughout the research.
REFERENCES
Abdul-Wahab, S.A., Bakheit, C.S. & Al-Alawi, S.M. 2005. Principal component and multiple regression analysis in modelling of ground-level ozone and factors affecting its concentrations. Environmental Modelling & Software 20(10): 1263-1271.
Alghamdi, M., Khoder, M., Harrison, R.M., Hyvärinen, A.P., Hussein, T., Al-Jeelani, H. & Almehmadi, F. 2014. Temporal variations of O3 and NOx in the urban background atmosphere of the coastal city Jeddah, Saudi Arabia. Atmospheric Environment 94: 205-214.
Atkinson, R.W., Yu, D., Armstrong, B.G., Pattenden, S., Wilkinson, P., Doherty, R.M., Heal, M.R. & Anderson, H.R. 2012. Concentration-response function for ozone and daily mortality: Results from five urban and five rural U.K. populations. Environmental Health Perspectives 120(10): 1411-1417.
Awang, N.R., Elbayoumi, M., Ramli, N.A. & Yahaya, A.S. 2015. Diurnal variations of ground-level ozone in three port cities in Malaysia. Air Quality, Atmosphere and Health DOI10.1007/S11869-015-0334-7.
Beauchamp, J., Wisthaler, A., Grabmer, W., Neuner, C., Weber, A. & Hansel, A. 2004. Short-term measurements of CO, NO, NO2, organic compounds and PM10 at a motorway location in an Austrian valley. Atmospheric Environment 38: 2511-2522.
Banan, N., Latif, M.T., Juneng, L. & Ahamad, F. 2013. Characteristics of surface ozone concentrations at stations with different backgrounds in the Malaysian Peninsula. Aerosol and Air Quality Research 13: 1090-1106.
Dawson, J.P., Adams, P.J. & Pandis, S.N. 2007. Sensitivity of ozone to summertime climate in the eastern USA: A modeling case study. Atmospheric Environment 41(7): 1494-1511.
Department of Statistic Malaysia. 2013. Penang Basic Information 2013.
Dueñas, C., Fernandez, M., Canete, S., Carretero, J. & Liger, E. 2004. Analyses of ozone in urban and rural sites in Málaga (Spain). Chemosphere 56(6): 631-639.
Elbayoumi, M., Ramli, N.A., Md Yusof, N.F.F., Yahaya, A.S.B., AlMadhoun, W. & Ul-Saufie, A.Z. 2014. Multivariate methods for indoor PM10 and PM2.5 modelling in naturally ventilated schools buildings. Atmospheric Environment 94: 11-12.
Ghazali, N.A., Ramli, N.A., Yahaya, A.S., Yusof, N.F.F.M.D., Sansuddin, N. & Al Madhoun, W.A. 2010. Transformation of nitrogen dioxide into ozone and prediction of ozone concentrations using multiple linear regression techniques. Environmental Monitoring and Assessment 165(1): 475-489.
Gorai, A.K., Tuluri, F., Tchounwou, P.B. & Ambinakudige, S. 2015. Influence of local meteorology and NO2 conditions on ground-level ozone concentrations in the eastern part of Texas, USA. Air Quality, Atmospheric and Health 8: 81-96.
Hassan, I.A., Basahi, J.M., Ismail, I.M. & Habeebullah, T.M. 2013. Spatial distribution and temporal variation in ambient ozone and its associated NOx in the atmosphere of Jeddah City, Saudi Arabia. Aerosol and Air Quality Research 13(6): 1712-1722.
Jenkin, M.E. & Clemitshaw, K.C. 2000. Ozone and other secondary photochemical pollutants: Chemical processes governing their formation in the planetary boundary layer. Atmospheric Environment 34: 2499-2527.
Kleanthous, S., Vrekoussis, M., Mihalopoulos, N., Kalabokas, P. & Lelieveld, J. 2014. On the temporal and spatial variation of ozone in Cyprus. Science of the Total Environment 476: 677-687.
Kovač-Andrić, E., Brana, J. & Gvozdić, V. 2009. Impact of meteorological factors on ozone concentrations modelled by time series analysis and multivariate statistical methods. Ecological Informatics 4(2): 117-122.
Lal, S., Naja, M. & Subbaraya, B.H. 2000. Seasonal variations in surface ozone and its precursors over an urban site in India. Atmospheric Environment 34: 2713-2724.
Latha, K.M. & Badarinath, K.V.S. 2004. Correlation between black carbon aerosols, carbon monoxide and tropospheric

207
ozone over a tropical urban site. Atmospheric Research 71: 265-274.
Latif, M.T., Huey, L.S. & Juneng, L. 2012. Variations of surface ozone concentration across the Klang Valley, Malaysia. Atmospheric Environment 61: 434-445.
Lazaridis, M. 2011. First Principles of Meteorology and Air Pollution. New York and London: Springer.
Lee, B.K., Juna, N.Y. & Lee, H.K. 2004. Comparison of particulate matter characteristics before, during, and after Asian dust events in Incheon and Ulsan, Korea. Atmospheric Environment 38: 1535-1545.
Mayer, H., Haustein, C. & Matzarakis, A. 1999. Urban air pollution caused by motor-traffic. Air Pollution VII.WIT PRESS. Advances in Air Pollution 6: 251-260.
Rahman, S.R.A., Ismail, S.N.S., Ramli, M.F., Latif, M.T., Abidin, E.Z. & Praveena, S.M. 2015. The assessment of ambient air pollution trend in Klang Valley, Malaysia. World Environment 5(1): 1-11.
Road Transport Department Malaysia. 2013. Total Motor Vehicles by Type and State, Malaysia.
Seinfeld, J. & Pandis, S. 2006. Atmospheric Chemistry and Physics: From Air Pollution to Climate Change 2nd ed. New Jersey: John Wiley & Sons, Inc.
Shen, Z., Ha, Y., Cao, J., Tian, J., Zhu, C., Liu, S., Liu, P. & Wang, Y. 2010. Characteristics of traffic-related emissions: A case study in roadside ambient air over Xi’an, China. Aerosol and Air Quality Research 10: 292-300.
Stathopoulou, E., Mihalakakou, G., Santamouris, M. & Bagiorgas, H.S. 2008. On the impact of temperature on tropospheric ozone concentration levels in urban environments. Journal of Earth System Science 117(3): 227-236.
Swamy, Y.V., Venkanna, R., Nikhih, G.N., Chitanya, D.N.S.K., Sinha, P.R., Ramakrishna, M. & Rao, A.G. 2012. Impact of nitrogen oxides, volatile organic compounds and black carbon on atmospheric ozone levels at a semi-arid urban site in Hyderabad. Aerosol and Air Quality Research 12: 662-671.
Tawfik, A.B. & Steiner, A.L. 2013. A proposed physical mechanism for ozone-meteorology correlations using land-atmosphere coupling regimes. Atmospheric Environment 72: 50-59.
Toh, Y.Y., Lim, S.F. & von Glasow, R. 2013. The influence of meteorological factors and biomass burning on surface ozone concentrations at Tanah Rata, Malaysia. Atmospheric Environment 70: 435-446.
Unal, A., Rouphail, N.M. & Frey, H.C. 2003. Effect of arterial signalization and level of service on measured vehicle emissions. 82nd Annual Meeting of the Transportation Research Board. pp. 47-56.
Wang, Y., Hopke, P.K. & Utell, M.J. 2011. Urban-scale spatial-temporal variability of black carbon and winter residential wood combustion particles. Aerosol and Air Quality Research 11: 473-481.
Wilson, J.G., Kinghama, S., Pearcea, J. & Sturman, A.P. 2005. A review of intraurban variations in particulate air pollution: Implications for epidemiological research. Atmospheric Environment 39: 6444-646.
Environmental Assessment and Clean Air ResearchSchool of Civil Engineering, Engineering CampusUniversiti Sains Malaysia14300 Nibong Tebal, Pulau Pinang Malaysia
*Corresponding author; email: [email protected]
Received: 11 January 2016Accepted: 9 May 2016