spatial and temporal variation of physico-chemical parameters in
TRANSCRIPT
Tropical Life Sciences Research, 25(2), 1–19, 2014
© Penerbit Universiti Sains Malaysia, 2014
Spatial and Temporal Variation of Physico-chemical Parameters in the Merbok Estuary, Kedah, Malaysia 1,3
Kaniz Fatema, 1,2
Wan Maznah W O and 1,2
Mansor Mat Isa 1School of Biological Sciences, Universiti Sains Malaysia, 11800 USM, Pulau Pinang,
Malaysia 2Center for Marine and Coastal Studies (CEMACS), Universiti Sains Malaysia, 11800
USM, Pulau Pinang, Malaysia 3Department of Fisheries, University of Dhaka, Dhaka 1000, Bangladesh
Abstrak: Dalam kajian ini, analisis faktor (FA) telah digunakan untuk mendapatkan faktor-
faktor tersembunyi yang bertanggungjawab untuk variasi kualiti air dalam kedua-dua musim hujan dan panas. Sampel air diambil dari enam stesen persampelan (St. 1 Sungai Lalang, St. 2 Sungai Semeling, St. 3 Sungai Jagung, St. 4 Sungai Teluk Wang, St. 5 Sungai Gelam dan St. 6 Sungai Derhaka) di muara Merbok, Malaysia dari Januari hingga Disember 2011; sampel telah dianalisis selanjutnya di makmal. Analisis korelasi daripada set data menunjukkan korelasi yang kuat antara parameter. Nutrien seperti nitrat (NO3
–),
nitrit (NO2–), ammonia (NH3) dan fosfat (PO4
3–) menjadi petunjuk penting kualiti air
sepanjang tahun. Parameter kualiti air yang mempengaruhi semasa musim hujan ialah kekonduksian, kemasinan, keperluan oksigen biokimia (BOD), oksigen terlarut (DO) dan klorofil a (Chla), manakala pepejal terampai total (TSS) dan pH merupakan indikator kualiti
air penting pada musim kemarau. Ujian Kruskal-Wallis H menunjukkan bahawa parameter kualiti air berbeza dengan signifikan antara bulan-bulan persampelan dan stesen (p<0.05), dan ujian Mann-Whitney U seterusnya mendedahkan parameter yang berbeza dengan signifikan adalah suhu, pH, DO, TSS, NO2
– dan BOD (p<0.01), manakala kemasinan,
konduktiviti, NO3–, PO4
3–, NH3 dan Chla tidak berbeza secara signifikan (p>0.05).
Parameter kualiti air di muara ini bervariasi secara temporal dan spatial, dan keputusan ini dapat berfungsi sebagai maklumat garis asas untuk pengurusan muara, khususnya untuk muara Merbok. Kata kunci: Analisis Faktor, Perubahan Bermusim, Parameter Fizikokimia, Muara Merbok
Abstract: In this study, factor analysis (FA) was applied to extract the hidden factors
responsible for water quality variations during both wet and dry seasons. Water samples were collected from six sampling stations (St. 1 Lalang River, St. 2 Semeling River, St. 3 Jagung River, St. 4 Teluk Wang River, St. 5 Gelam River and St. 6 Derhaka River) in the Merbok estuary, Malaysia from January to December 2011; the samples were further analysed in the laboratory. Correlation analysis of the data sets showed strong correlations between the parameters. Nutrients such as nitrate (NO3
–), nitrite (NO2
–),
ammonia (NH3) and phosphate (PO43–
) were determined to be critical indicators of water quality throughout the year. Influential water quality parameters during the wet season were conductivity, salinity, biochemical oxygen demand (BOD), dissolved oxygen (DO) and chlorophyll a (Chla), whereas total suspended solid (TSS) and pH were critical water quality indicators during the dry season. The Kruskal-Wallis H test showed that water quality parameters were significantly different among the sampling months and stations (p<0.05), and Mann-Whitney U tests further revealed that the significantly different parameters were temperature, pH, DO, TSS, NO2
– and BOD (p<0.01), whereas salinity,
Corresponding author: [email protected]
Kaniz Fatema et al.
2
conductivity, NO3–, PO4
3–, NH3 and Chla were not significantly different (p>0.05). Water
quality parameters in the estuary varied on both temporal and spatial scales and these results may serve as baseline information for estuary management, specifically for the Merbok estuary. Keywords: Factor Analysis, Seasonal Variation, Physico-chemical Parameters, Merbok
Estuary
INTRODUCTION Estuarine and coastal areas have complex and dynamic aquatic environments (Morris et al. 1995). Estuarine ecosystems play an important role in the global economy and biodiversity of the region (Smith & Hollibaugh 1993) as well as act as a transitional zone between land and sea (Bardarudeen et al. 1996). A large number of physical and chemical processes occur as the river water mixes with seawater, which may influence water quality (Anitha & Kumar 2013). Water quality within estuaries is deteriorating due to rapid industrialisation and aquaculture practices along the river. Estuaries and coastal areas are essential for domestic, industrial, and agricultural purposes and are also used as a means for waste disposal, transportation, food sources and recreational activities (Boon et al. 1992). These areas are facing an increasing number of ecological problems due to the population increase and the resulting rapid economic development. These problems lead to an excess of nutrients from industrial and municipal waste water as well as from forest and agricultural products (Ball 1992). Nutrient loads discharge into the estuaries and cause eutrophication, which affects biological communities (Wang et al. 1999). Hydrobiological studies are therefore important to better understand the different trophic levels and food webs of these aquatic systems (Damotharan et al. 2010). Water quality varies both spatially and temporally. River discharge and pollutant concentration in water bodies vary with temporal variations in precipitation, surface runoff, interflow and groundwater flow (Vega et al. 1998). Seasonal changes in surface water quality are used to interpret temporal variations in river pollution caused by natural or anthropogenic inputs from point and nonpoint sources (Ouyang et al. 2006; Fan et al. 2012). Previous water quality monitoring studies focused on the physical and chemical parameters as well as a few key biological parameters, including dissolved oxygen (DO), biochemical oxygen demand (BOD), chemical oxygen demand, suspended solids, pH, conductivity, salinity, temperature, nitrogen in the form of ammonia (NH3), turbidity, dissolved solids, total solids, nitrates, chloride and phosphates for scoring water quality status (Ouyang et al. 2006; Iscen et al. 2008; Pejman et al. 2009; Varol et al. 2012; Mustapha et al. 2012; Anitha & Kumar 2013).
Although a number of researchers have studied the physico-chemical characteristics of Malaysian estuaries and seas (Ong et al. 1991; Alkarkhi et al. 2009; Juahir et al. 2011), only a few studies have been conducted at the Merbok estuary to assess its water quality. The present study analyses the seasonal and temporal variations of the physico-chemical variables in the Merbok estuary to answer two central questions: (1) how does water quality vary with respect to
Physico-chemical Parameters Variation in Merbok Estuary
3
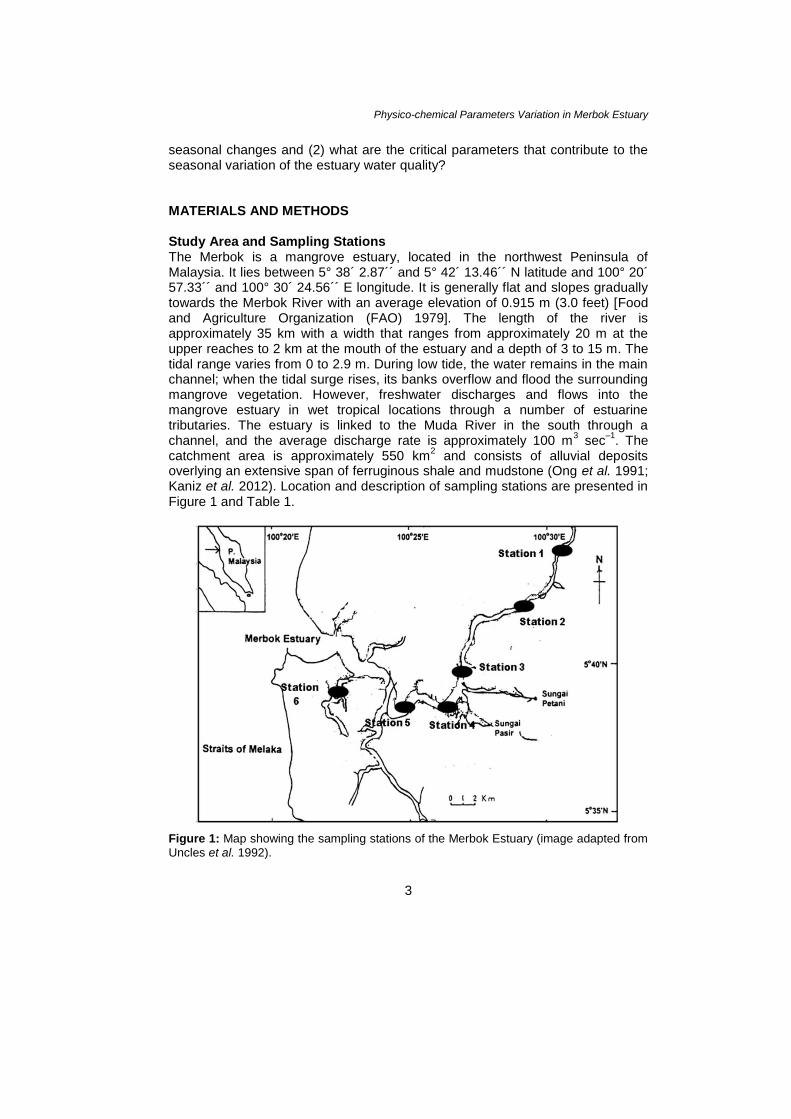
seasonal changes and (2) what are the critical parameters that contribute to the seasonal variation of the estuary water quality? MATERIALS AND METHODS Study Area and Sampling Stations The Merbok is a mangrove estuary, located in the northwest Peninsula of Malaysia. It lies between 5° 38´ 2.87´´ and 5° 42´ 13.46´´ N latitude and 100° 20´ 57.33´´ and 100° 30´ 24.56´´ E longitude. It is generally flat and slopes gradually towards the Merbok River with an average elevation of 0.915 m (3.0 feet) [Food and Agriculture Organization (FAO) 1979]. The length of the river is approximately 35 km with a width that ranges from approximately 20 m at the upper reaches to 2 km at the mouth of the estuary and a depth of 3 to 15 m. The tidal range varies from 0 to 2.9 m. During low tide, the water remains in the main channel; when the tidal surge rises, its banks overflow and flood the surrounding mangrove vegetation. However, freshwater discharges and flows into the mangrove estuary in wet tropical locations through a number of estuarine tributaries. The estuary is linked to the Muda River in the south through a channel, and the average discharge rate is approximately 100 m
3 sec
–1. The
catchment area is approximately 550 km2 and consists of alluvial deposits
overlying an extensive span of ferruginous shale and mudstone (Ong et al. 1991; Kaniz et al. 2012). Location and description of sampling stations are presented in Figure 1 and Table 1.
Figure 1: Map showing the sampling stations of the Merbok Estuary (image adapted from
Uncles et al. 1992).
Kaniz Fatema et al.
4
Table 1: Location and description of sampling sites.
Stream Sampling stations
Symbol GPS locations Description
Upstream Lalang River
St. 1 05 41´ 56.63´´ N
100 30´ 16.94´´ E
Surrounded by mangrove forest, located near a fishing village and residential area. Receives pollutants from surrounding agricultural fields, livestock farms, fish ponds and wastewater discharges.
Semeling River
St. 2 05 41´ 13.66´´ N
100 28´ 32.19´´ E
Middle stream Jagung River
St. 3 05 39´ 27.33´´ N
100 26´ 58.00´´ E
Surrounded by mangrove forest; receiving polluted water from branches of the Sungai Petani and the Sungai Pasir. In addition, aquaculture is the main activity in these areas.
Teluk Wang River
St. 4 05 38´ 2.87´´ N
100 25´ 57.67´´ E
Downstream Gelam River
St. 5 05 38´ 37.68´´ N
100 25´ 4.01´´ E
Surrounded by mangrove forests and oil palm plantations, aquaculture activities and land development.
Derhaka River
St. 6 05 39´ 26.27´´ N
100 23´ 3.27´´ E
Sample Collection and Analytical Methods Surface and bottom water samples were collected monthly for one year from January to December, 2011 at six sampling stations in the Merbok estuary. Water samples were collected in acid-washed polythene bottles (1.5 litre), and all the samples were kept in the dark at a cool temperature (4°C) before transportation to the Plankton Laboratory, School of Biological Sciences, Universiti Sains Malaysia (USM). All the collected samples were kept in a refrigerator below 4°C to reduce metabolism of the organisms in the water. Rainfall data were obtained from the Meteorological Department of Kedah, Malaysia. Temperature, DO, salinity and electrical conductivity (EC) were measured in situ using HYDROLAB SRV3-DL (Surveyor 3 Data Logger, USA). pH was measured using a pH meter (Eco Testr TM, USA). BOD, Chla, ammonia, nitrite (NO2
–), nitrate (NO3
–), phosphate (PO4
3–) and total suspended solids (TSS)
were measured following standard methods [Strickland & Parsons 1972; American Public Health Association (APHA) 2005]. According to the Malaysian Meteorological Department (MMD) annual report, rainfall above 200 mm constitutes the wet season and 0–200 mm constitutes the dry season (MMD 2009). This study used rainfall data from MMD (2011) and adopted seasonal classifications used by MMD for grouping the data into dry and wet seasons. The mean annual rainfall at Sungai Petani, Kedah was 2528.05 mm during the study period.
A nonparametric (Kruskal-Wallis H) test was performed to determine the differences in the water quality parameters among the sampling months and stations. Mann-Whitney U tests were performed to observe the effect of seasons on the water quality parameters (Ho 2006). Spearman rank-order correlations (Spearman R coefficient) were used to study the correlation structure between variables as datasets showed abnormal distribution of water quality parameters (Wunderlin et al. 2001). In this study, temporal variation of estuary water quality
Physico-chemical Parameters Variation in Merbok Estuary
5
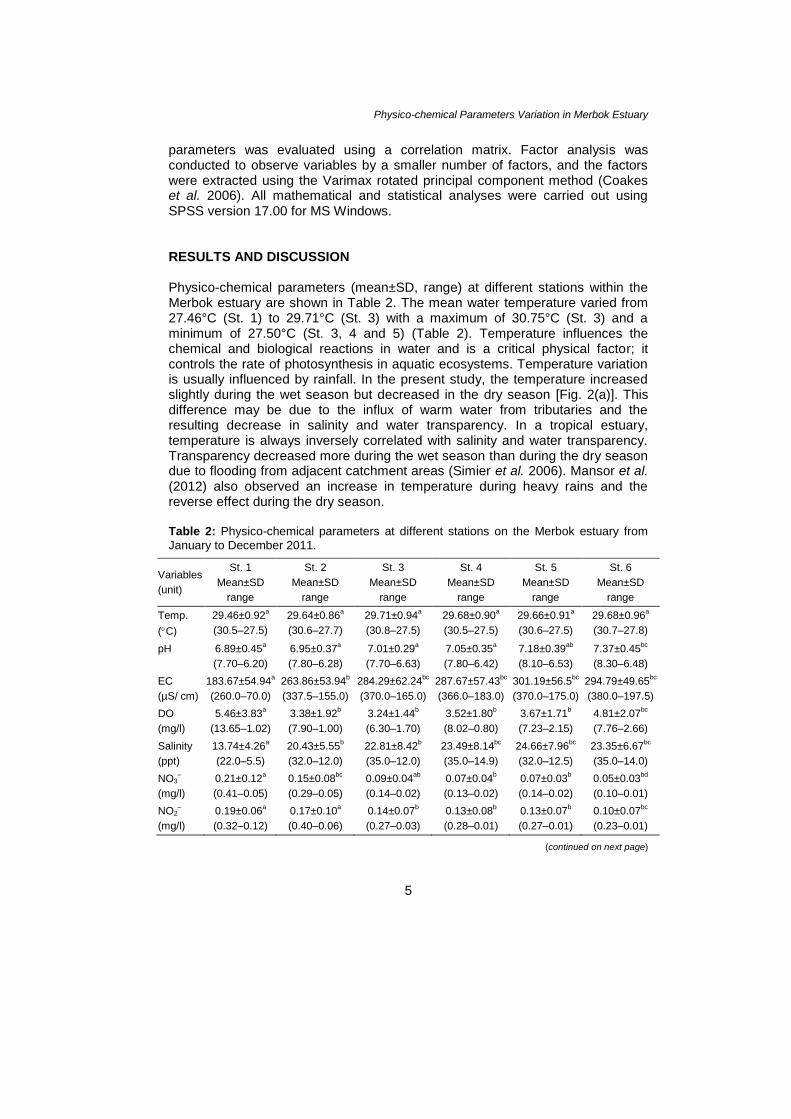
parameters was evaluated using a correlation matrix. Factor analysis was conducted to observe variables by a smaller number of factors, and the factors were extracted using the Varimax rotated principal component method (Coakes et al. 2006). All mathematical and statistical analyses were carried out using SPSS version 17.00 for MS Windows. RESULTS AND DISCUSSION Physico-chemical parameters (mean±SD, range) at different stations within the Merbok estuary are shown in Table 2. The mean water temperature varied from 27.46°C (St. 1) to 29.71°C (St. 3) with a maximum of 30.75°C (St. 3) and a minimum of 27.50°C (St. 3, 4 and 5) (Table 2). Temperature influences the chemical and biological reactions in water and is a critical physical factor; it controls the rate of photosynthesis in aquatic ecosystems. Temperature variation is usually influenced by rainfall. In the present study, the temperature increased slightly during the wet season but decreased in the dry season [Fig. 2(a)]. This difference may be due to the influx of warm water from tributaries and the resulting decrease in salinity and water transparency. In a tropical estuary, temperature is always inversely correlated with salinity and water transparency. Transparency decreased more during the wet season than during the dry season due to flooding from adjacent catchment areas (Simier et al. 2006). Mansor et al. (2012) also observed an increase in temperature during heavy rains and the reverse effect during the dry season. Table 2: Physico-chemical parameters at different stations on the Merbok estuary from
January to December 2011.
Variables
(unit)
St. 1
Mean±SD
range
St. 2
Mean±SD
range
St. 3
Mean±SD
range
St. 4
Mean±SD
range
St. 5
Mean±SD
range
St. 6
Mean±SD
range
Temp.
(C)
29.46±0.92a
(30.5–27.5)
29.64±0.86a
(30.6–27.7)
29.71±0.94a
(30.8–27.5)
29.68±0.90a
(30.5–27.5)
29.66±0.91a
(30.6–27.5)
29.68±0.96a
(30.7–27.8)
pH 6.89±0.45a
(7.70–6.20)
6.95±0.37a
(7.80–6.28)
7.01±0.29a
(7.70–6.63)
7.05±0.35a
(7.80–6.42)
7.18±0.39ab
(8.10–6.53)
7.37±0.45bc
(8.30–6.48)
EC
(µS/ cm)
183.67±54.94a
(260.0–70.0)
263.86±53.94b
(337.5–155.0)
284.29±62.24bc
(370.0–165.0)
287.67±57.43bc
(366.0–183.0)
301.19±56.5bc
(370.0–175.0)
294.79±49.65bc
(380.0–197.5)
DO
(mg/l)
5.46±3.83a
(13.65–1.02)
3.38±1.92b
(7.90–1.00)
3.24±1.44b
(6.30–1.70)
3.52±1.80b
(8.02–0.80)
3.67±1.71b
(7.23–2.15)
4.81±2.07bc
(7.76–2.66)
Salinity
(ppt)
13.74±4.26a
(22.0–5.5)
20.43±5.55b
(32.0–12.0)
22.81±8.42b
(35.0–12.0)
23.49±8.14bc
(35.0–14.9)
24.66±7.96bc
(32.0–12.5)
23.35±6.67bc
(35.0–14.0)
NO3–
(mg/l)
0.21±0.12a
(0.41–0.05)
0.15±0.08bc
(0.29–0.05)
0.09±0.04ab
(0.14–0.02)
0.07±0.04b
(0.13–0.02)
0.07±0.03b
(0.14–0.02)
0.05±0.03bd
(0.10–0.01)
NO2–
(mg/l)
0.19±0.06a
(0.32–0.12)
0.17±0.10a
(0.40–0.06)
0.14±0.07b
(0.27–0.03)
0.13±0.08b
(0.28–0.01)
0.13±0.07b
(0.27–0.01)
0.10±0.07bc
(0.23–0.01)
(continued on next page)
Kaniz Fatema et al.
6
Table 2: (continued)
Variables
(unit)
St. 1
Mean±SD
range
St. 2
Mean±SD
range
St. 3
Mean±SD
range
St. 4
Mean±SD
range
St. 5
Mean±SD
range
St. 6
Mean±SD
range
NH3
(mg/l)
1.18±0.69a
(3.41–0.05)
0.30±0.21bc
(0.96–0.02)
0.17±0.12b
(0.35–0.02)
0.13±0.10b
(0.30–0.01)
0.10±0.08ab
(0.29–0.02)
0.10±0.07ab
(0.23–0.02)
TSS
(mg/l)
30.28±11.16a
(66.66–20.00)
36.67±14.19bc
(80.00–20.00)
41.67±14.24b
(100.00–20.00)
47.45±17.92b
(93.33–26.66)
45.00±15.19b
(86.66–20.00)
65.00±38.25ab
(186.60–33.33)
BOD
(mg/l)
3.94±3.78a
(12.38–0.06)
3.00±2.31a
(10.51–0.82)
2.16±1.67ab
(6.64–0.51)
1.80±1.69b
(6.68–0.30)
1.33±1.50b
(5.85–0.14)
1.55±1.74bc
(9.42–0.01)
Chla
(µg/l)
1.14±1.31a
(4.27–0.03)
0.49±0.35a
(1.24–0.02)
0.46±0.39ab
(1.38–0.01)
0.48±0.41ab
(1.38–0.03)
0.45±0.30a
(1.01–0.01)
1.78±1.66a
(13.94–0.80)
PO43–
(mg/l)
0.08±0.04a
(0.16–0.02)
0.08±0.03a
(0.12–0.03)
0.08±0.02a
(0.10–0.02)
0.07±0.02b
(0.10–0.02)
0.07±0.02b
(0.09–0.03)
0.06±0.02b
(0.10–0.02)
Notes: Mean±SD in similar row with different superscript letters are significantly different (Kruskal-Wallis H test). Temp. = temperature; numbers in brackets represent variation of water quality parameters within 12 months period.
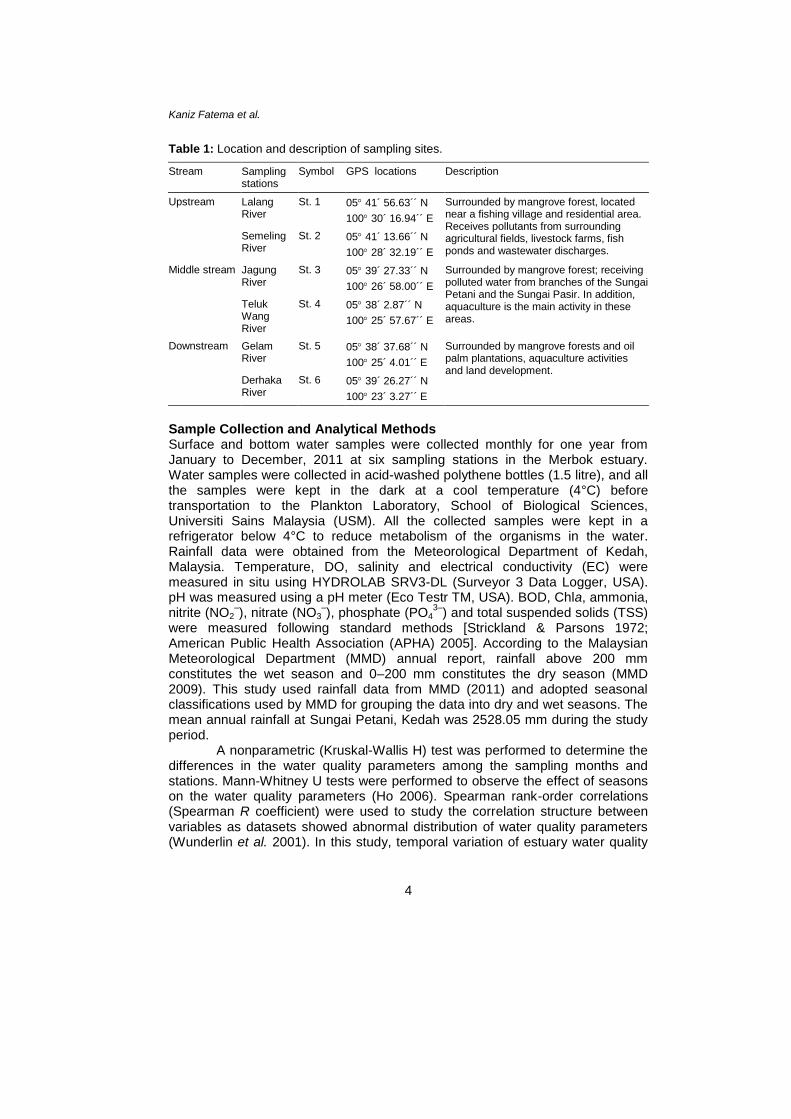
(a) (b)
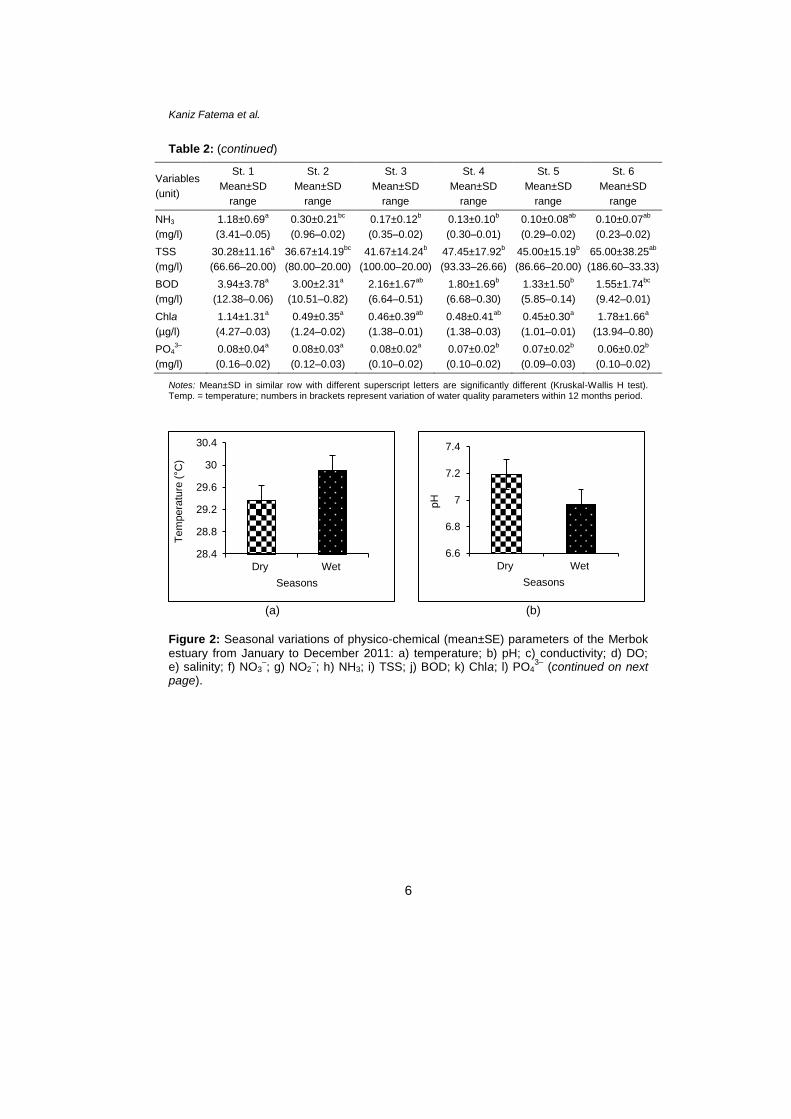
Figure 2: Seasonal variations of physico-chemical (mean±SE) parameters of the Merbok
estuary from January to December 2011: a) temperature; b) pH; c) conductivity; d) DO; e) salinity; f) NO3
–; g) NO2
–; h) NH3; i) TSS; j) BOD; k) Chla; l) PO4
3– (continued on next
page).
28.4
28.8
29.2
29.6
30
30.4
Dry Wet
Te
mpera
ture
(°C
)
Seasons
6.6
6.8
7
7.2
7.4
Dry Wet
pH
Seasons
Physico-chemical Parameters Variation in Merbok Estuary
7
(c) (d)
(e) (f)
(g) (h)
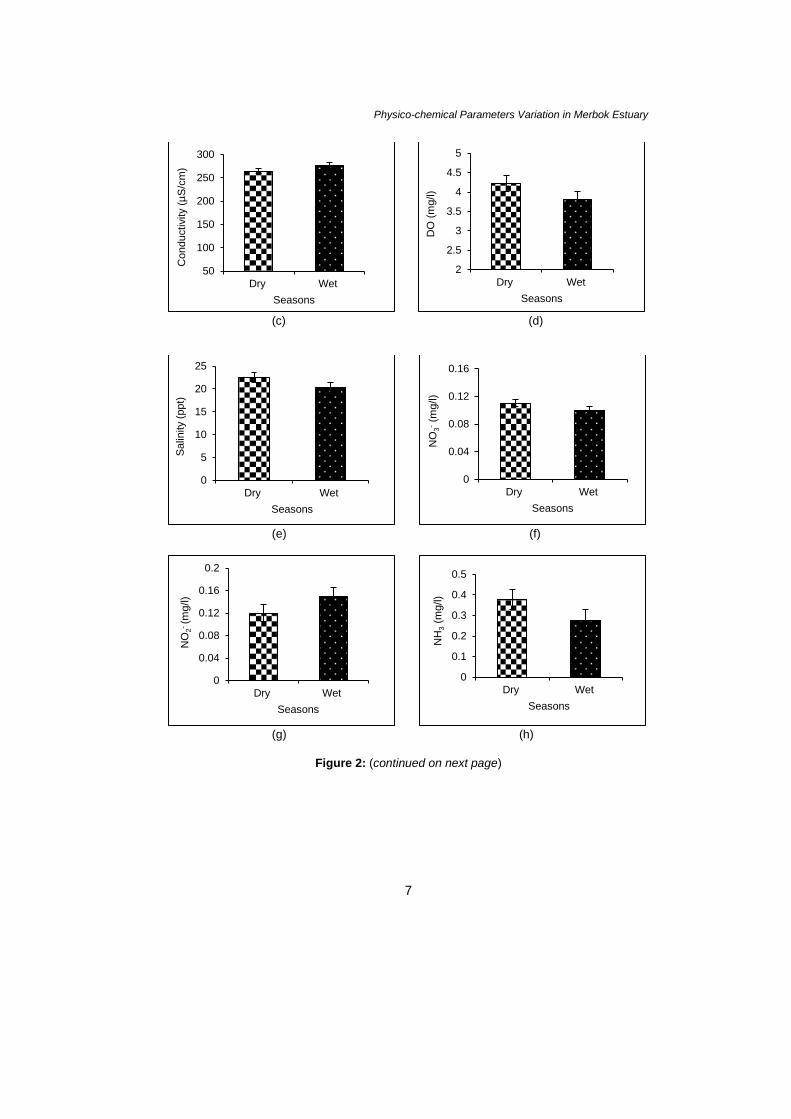
Figure 2: (continued on next page)
50
100
150
200
250
300
Dry Wet
Conductivity (
µS
/cm
)
Seasons
2
2.5
3
3.5
4
4.5
5
Dry Wet
DO
(m
g/l)
Seasons
0
5
10
15
20
25
Dry Wet
Salin
ity (
ppt)
Seasons
0
0.04
0.08
0.12
0.16
Dry Wet
NO
3- (m
g/l)
Seasons
0
0.04
0.08
0.12
0.16
0.2
Dry Wet
NO
2- (m
g/l)
Seasons
0
0.1
0.2
0.3
0.4
0.5
Dry Wet
NH
3 (
mg/l)
Seasons
Kaniz Fatema et al.
8
(i) (j)
(k) (l)
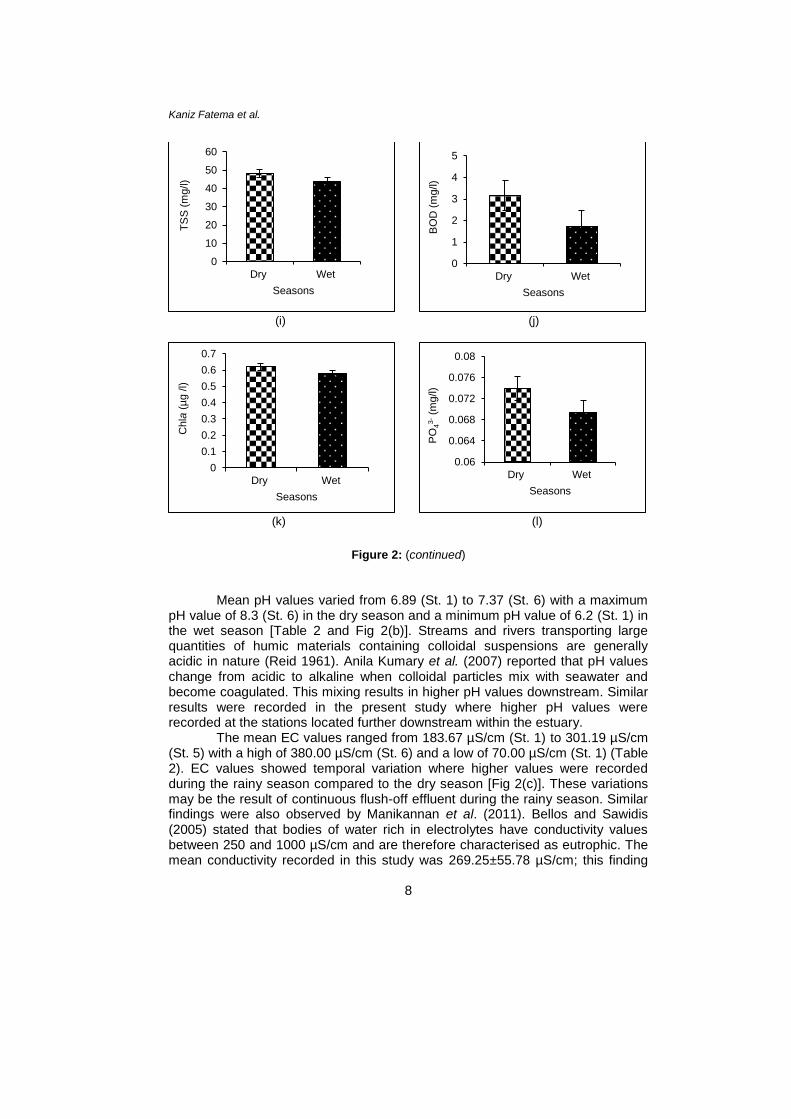
Figure 2: (continued)
Mean pH values varied from 6.89 (St. 1) to 7.37 (St. 6) with a maximum
pH value of 8.3 (St. 6) in the dry season and a minimum pH value of 6.2 (St. 1) in the wet season [Table 2 and Fig 2(b)]. Streams and rivers transporting large quantities of humic materials containing colloidal suspensions are generally acidic in nature (Reid 1961). Anila Kumary et al. (2007) reported that pH values change from acidic to alkaline when colloidal particles mix with seawater and become coagulated. This mixing results in higher pH values downstream. Similar results were recorded in the present study where higher pH values were recorded at the stations located further downstream within the estuary.
The mean EC values ranged from 183.67 µS/cm (St. 1) to 301.19 µS/cm (St. 5) with a high of 380.00 µS/cm (St. 6) and a low of 70.00 µS/cm (St. 1) (Table 2). EC values showed temporal variation where higher values were recorded during the rainy season compared to the dry season [Fig 2(c)]. These variations may be the result of continuous flush-off effluent during the rainy season. Similar findings were also observed by Manikannan et al. (2011). Bellos and Sawidis (2005) stated that bodies of water rich in electrolytes have conductivity values between 250 and 1000 µS/cm and are therefore characterised as eutrophic. The mean conductivity recorded in this study was 269.25±55.78 µS/cm; this finding
0
10
20
30
40
50
60
Dry Wet
TS
S (
mg/l)
Seasons
0
1
2
3
4
5
Dry Wet
BO
D (
mg/l)
Seasons
0
0.1
0.2
0.3
0.4
0.5
0.6
0.7
Dry Wet
Chla
(µ
g /l)
Seasons
0.06
0.064
0.068
0.072
0.076
0.08
Dry Wet
PO
43- (m
g/l)
Seasons
Physico-chemical Parameters Variation in Merbok Estuary
9
indicates that the estuary is rich in electrolytes and may be characterised as eutrophic.
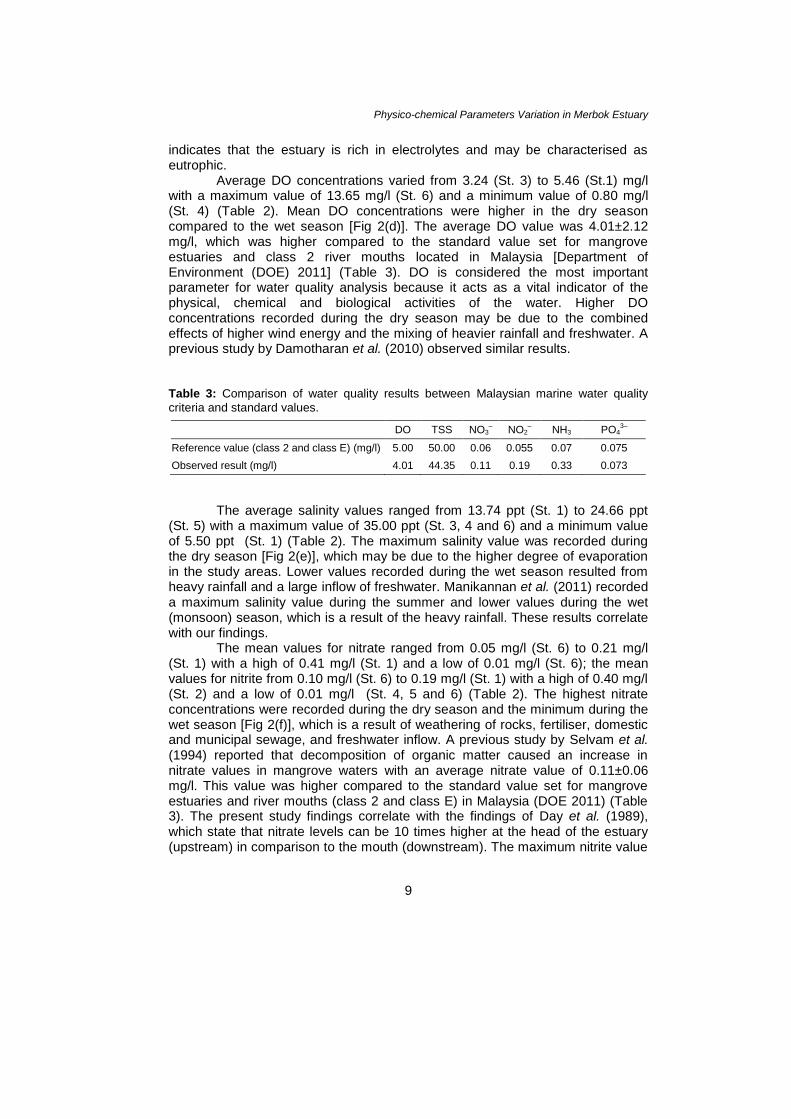
Average DO concentrations varied from 3.24 (St. 3) to 5.46 (St.1) mg/l with a maximum value of 13.65 mg/l (St. 6) and a minimum value of 0.80 mg/l (St. 4) (Table 2). Mean DO concentrations were higher in the dry season compared to the wet season [Fig 2(d)]. The average DO value was 4.01±2.12 mg/l, which was higher compared to the standard value set for mangrove estuaries and class 2 river mouths located in Malaysia [Department of Environment (DOE) 2011] (Table 3). DO is considered the most important parameter for water quality analysis because it acts as a vital indicator of the physical, chemical and biological activities of the water. Higher DO concentrations recorded during the dry season may be due to the combined effects of higher wind energy and the mixing of heavier rainfall and freshwater. A previous study by Damotharan et al. (2010) observed similar results. Table 3: Comparison of water quality results between Malaysian marine water quality
criteria and standard values.
DO TSS NO3– NO2
– NH3 PO4
3–
Reference value (class 2 and class E) (mg/l) 5.00 50.00 0.06 0.055 0.07 0.075
Observed result (mg/l) 4.01 44.35 0.11 0.19 0.33 0.073
The average salinity values ranged from 13.74 ppt (St. 1) to 24.66 ppt (St. 5) with a maximum value of 35.00 ppt (St. 3, 4 and 6) and a minimum value of 5.50 ppt (St. 1) (Table 2). The maximum salinity value was recorded during the dry season [Fig 2(e)], which may be due to the higher degree of evaporation in the study areas. Lower values recorded during the wet season resulted from heavy rainfall and a large inflow of freshwater. Manikannan et al. (2011) recorded a maximum salinity value during the summer and lower values during the wet (monsoon) season, which is a result of the heavy rainfall. These results correlate with our findings.
The mean values for nitrate ranged from 0.05 mg/l (St. 6) to 0.21 mg/l (St. 1) with a high of 0.41 mg/l (St. 1) and a low of 0.01 mg/l (St. 6); the mean values for nitrite from 0.10 mg/l (St. 6) to 0.19 mg/l (St. 1) with a high of 0.40 mg/l (St. 2) and a low of 0.01 mg/l (St. 4, 5 and 6) (Table 2). The highest nitrate concentrations were recorded during the dry season and the minimum during the wet season [Fig 2(f)], which is a result of weathering of rocks, fertiliser, domestic and municipal sewage, and freshwater inflow. A previous study by Selvam et al. (1994) reported that decomposition of organic matter caused an increase in nitrate values in mangrove waters with an average nitrate value of 0.11±0.06 mg/l. This value was higher compared to the standard value set for mangrove estuaries and river mouths (class 2 and class E) in Malaysia (DOE 2011) (Table 3). The present study findings correlate with the findings of Day et al. (1989), which state that nitrate levels can be 10 times higher at the head of the estuary (upstream) in comparison to the mouth (downstream). The maximum nitrite value
Kaniz Fatema et al.
10
was recorded during the wet season and the minimum during the dry season [Fig 2(g)]. Variations in phytoplankton excretion, oxidation of ammonia, and reduction of nitrate most likely contributed to this finding, in addition to the recycling of nitrogen and bacterial decomposition from planktonic detritus and denitrification. Prabu et al. (2008) observed a similar pattern of results. The mean nitrite value in the present study was 0.19±0.08 mg/l. This value was more than three-fold higher than the typical value observed for mangrove estuaries and river mouths (class 2 and class E) in Malaysia (DOE 2011) (Table 3).
Ammonia values were also measured and ranged from 0.10 mg/l (St. 5 and 6) to 1.18 mg/l (St. 1) with a high of 3.41 mg/l (St. 1) and a low of 0.01 mg/l (St. 4) (Table 2). The highest ammonia concentration was recorded during the dry season [Fig 2(h)], a result stemming from low precipitation. However, dilution of rainwater may be important in reducing the ammonium level in the estuary. A similar pattern of results was observed by Damotharan et al. (2010). Altogether, our study recorded a mean ammonium concentration of 0.33±0.21 mg/l. As with our other parameters, the ammonium concentrations gathered from this study were higher than the standard values set for mangrove estuaries and river mouths (class 2 and class E) in Malaysia (DOE 2011) (Table 3).
TSS levels ranged from 30.28 mg/l (St. 1) to 65.00 mg/l (St. 6) with a minimum of 20.00 mg/l (St. 1, 2, 3 and 5) and a maximum of 186.60 mg/l (St. 6) (Table 2). The mean recorded TSS level was 44.35±18.49 mg/l. This value was lower compared to the standard value set for mangrove estuaries and river mouths (class 2) in Malaysia (DOE 2011) (Table 3). Furthermore, TSS levels were higher during the dry season than the wet season [Fig 2(i)]. The TSS level increased at the middle of the estuary and further downstream due to wastewater disposal, an influx of run-off from the upper reaches, and the use of fish feed for caged fish rearing. These findings also correlate with a study conducted by Jonnalagadda and Mhere (2001).
Mean BOD values varied from 1.33 mg/l (St. 5) to 3.94 mg/l (St. 1) with the highest value reaching 12.38 mg/l (St. 1) and the lowest reaching 0.01 mg/l (St. 6) (Table 2). Higher BOD values were observed during the dry season compared to the wet season [Fig 2(j)]. BOD values are indicators of organic pollution in the water. A BOD5 value accounts for the decomposition of organic material over the span of 5 days, which is directly correlated with burdens of organic materials in streams (Grafny et al. 2000). The present study recorded high BOD values at St. 1, and this increase may be due to the influx of organic sewage from anthropogenic activities, wastewater discharges and/or agricultural activities.
The mean Chla content ranged from 0.45 µg/l (St. 5) to 1.78 µg/l (St. 6) with the highest level reaching 13.94 µg/l (St. 6) and the lowest reaching 0.01 µg/l (St. 3 and 5) (Table 2). The maximum was measured during the dry season and the minimum during the wet season [Fig 2(k)], and these values may be a direct result of longer daylight hours during the dry season. Dunn et al. (2007) and Prabhahar et al. (2011) also reported lower Chla concentrations during the monsoon season and higher levels during the summer.
Physico-chemical Parameters Variation in Merbok Estuary
11
Average phosphate values ranged from 0.06 mg/l (St. 6) to 0.08 (St. 1, 2 and 3) with a high of 0.16 mg/l (St. 1) (dry season) and a low of 0.02 mg/l (St. 1, 3, 4 and 6) (wet season) [Table 2 and Fig 2(l)]. A previous study by Ajithkumar et al. (2006) reported that fertilisers from agricultural fields are a source of phosphates that contribute to the increased phosphate levels. The present study showed that the mean phosphate concentration in the water samples was 0.073±0.02 mg/l, a value slightly lower than that set for mangrove estuaries and river mouths (class 2 and class E) in Malaysia (DOE 2011) (Table 3).
Kruskal-Wallis H tests showed that the water quality parameters were significantly different among the sampling months (p<0.05). Kruskal-Wallis H tests were performed to compare the water quality parameters among the different sampling stations and revealed that except for temperature and Chla, all other parameters were significantly different (p<0.05). Mann-Whitney U tests showed that among the 12 water quality parameters, 6 (temperature, pH, DO, TSS, NO2
– and BOD) were significantly different between the 2 seasons
(p<0.01), whereas the other 6 (salinity, EC, NO3–, PO4
3–, NH3 and Chla) were not
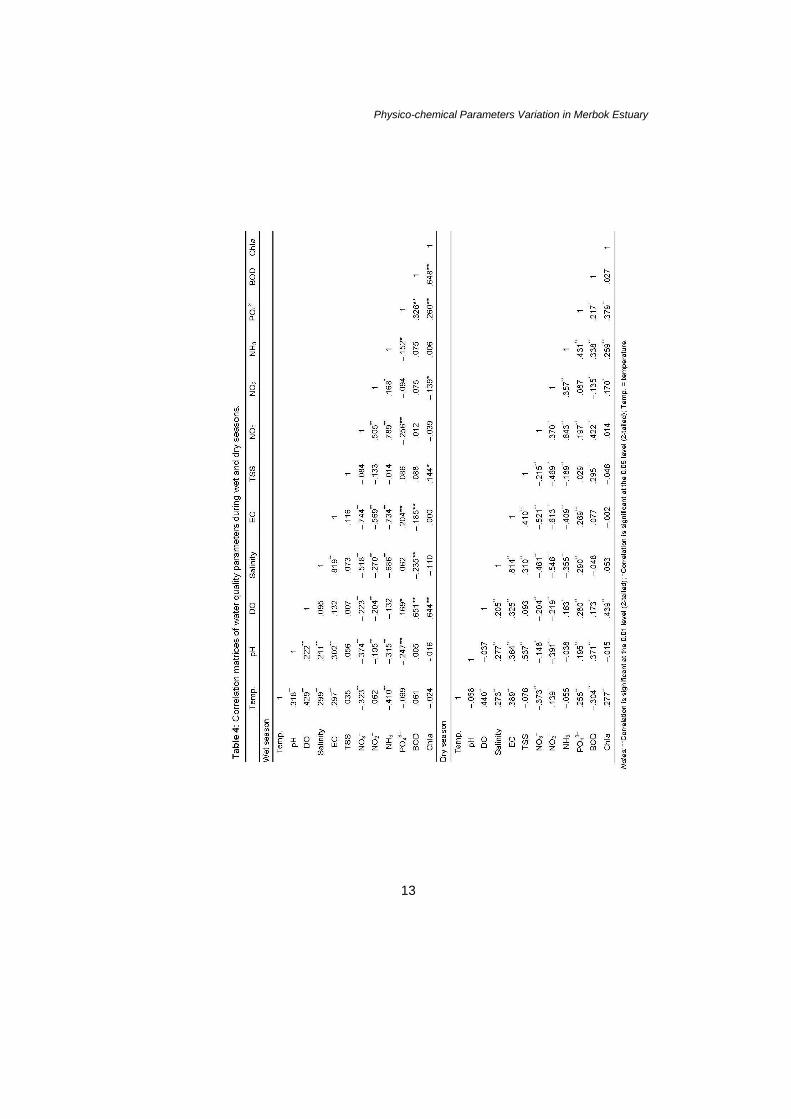
significantly different with regard to seasons (p>0.05). Table 4 provides the correlation matrix of the water quality parameters for
both dry and wet seasons, respectively. In both the dry and wet seasons, temperature significantly correlates with the other parameters including pH, DO, salinity, EC, NO3
–, NH3, PO4
3–, Chla and BOD (p<0.01). Altın et al. (2009)
observed that water temperature had a very weak correlation with parameters such as DO, conductivity, NO3
–, BOD, NH3, PO4
3– and TDS.
The correlation coefficients between pH and EC, NO3– and NH3 were
0.302, –0.374 and –0.315 during the wet season, respectively. However, during the dry season, correlation coefficients between pH and EC, TSS, NO2
– and BOD
were 0.364, 0.537, –0.391 and 0.371, respectively. DO is correlated with BOD and Chla during the wet season to a significant degree (p<0.01), whereas in the dry season, only DO is correlated with Chla (r=0.439) to a significant degree (p<0.01). Salinity correlated with EC, NO3
–, NH3 and NO2
–, respectively, with
correlation coefficients of 0.819, –0.518 and –0.686 in the wet season and 0.814, –0.461, and –0.546 in the dry season. Ouyang et al. (2006) reported that pH showed a strong correlation with EC (0.83) and salinity (0.83) during the fall season. However, the correlation between these same parameters was very poor during the spring, summer and winter. The present study also found that EC values were negatively correlated with NO3
– (r=–0.744), NO2 (r=–0.509) and NH3
(r=–0.734) during the wet season, but EC values strongly correlated with TSS (r=0.410), NO3
– (r=0.521), NO2
– (r=–0.613) and NH3 (r=–0.409) during the dry
season. TSS values recorded during the dry season correlated with NO3–
(r=–0.215), NO2– (r=–0.469), NH3 (r=–0.189), and BOD (r=0.295) to a significant
degree (p<0.01). In contrast, wet season TSS values were positively (p<0.05) correlated with Chla (r=0.144). Muslim and Jones (2003) studied the seasonal variation of dissolved nutrients, Chla, and suspended sediments. This study found a link between Chla and TSS and Chla and PO4
3– with correlation
coefficients of 0.49 and 0.47, respectively. These results are similar to our findings in which PO4
3–, BOD, and Chla correlated to a significant degree
(p<0.01) during both the dry and wet seasons. Strong correlations between NO3–
Kaniz Fatema et al.
12
and NO2– (0.505) and NO3
– and NH3 (0.789) occurred during the wet season.
However, in the dry season, there was not a strong correlation between NO3– and
NH3 (r=0.643), BOD (r=0.422) or NO2– (r=0.370). Muduli et al. (2011) found that
BOD was positively correlated with ammonia levels but that salinity was negatively correlated with nutrient values. These findings are similar to those recorded in the present study.
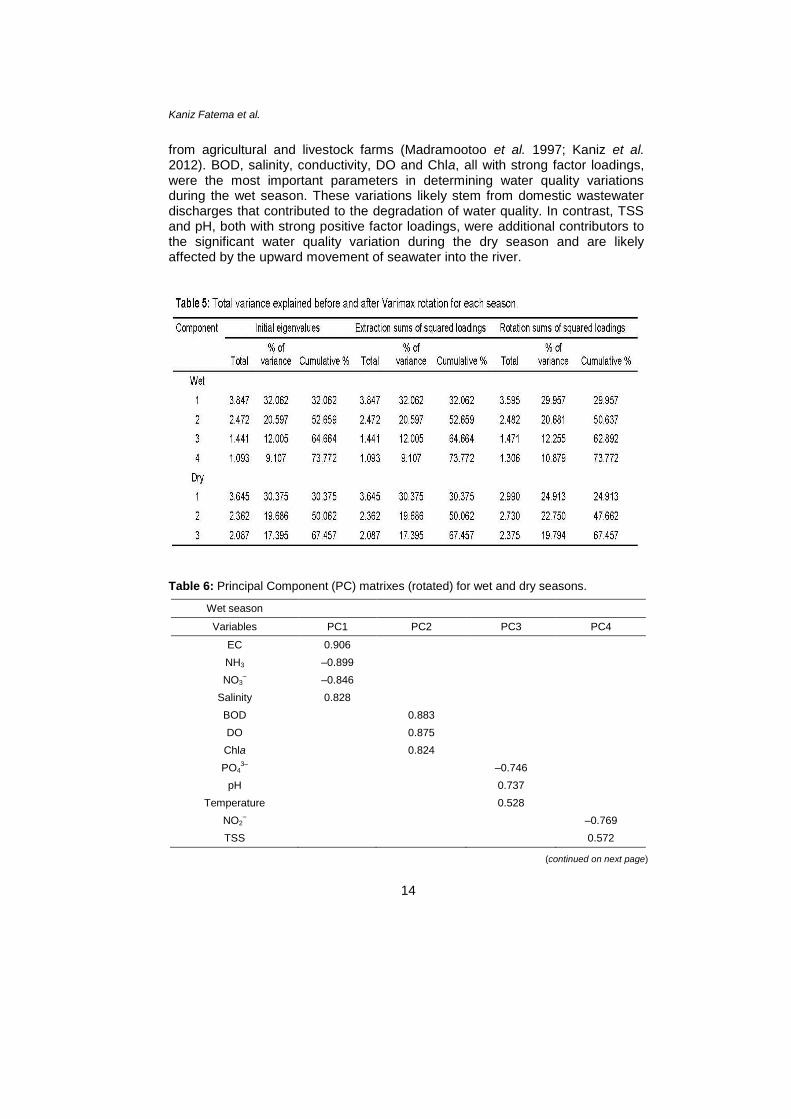
Principle component analysis (PCA) methods were used to extract key factors. The component loadings are the linear combinations for each principal component, and they express the correlation between the original variables and the newly formed components. The component loadings are used to determine the relative importance of a variable compared to other variables in a principal component. Eigenvalues greater than 1 were used as a cut-off value to determine the number of factors. The first 4 principal components had eigenvalues greater than 1 and explained approximately 73.772% of the total variances in the original dataset for the wet season. For the dry season, the first 3 principal components had eigenvalues greater than 1 and explained approximately 67.457% of the total variances in the original dataset (Table 5). For the wet season, Factor 1 (F1) explained 32.062% of the total variance, showing a strong positive loading for conductivity and salinity but a strong negative loading for NH3 and NO3
–. These differences may be due to tidal effects
(Tables 5 and 6). Factor 2 (F2) explained 20.597% of the total variance and had a strong positive loading for BOD, DO and Chla, a reflection of the biological interactions among parameters. Factor 3 (F3) explained 12.01% of the total variance and had a moderate positive and negative loading for pH, temperature and PO4
3–, respectively. These results may be due to domestic wastewater
discharges from the catchment area. Factor 4 (F4) explained 9.107% of the total variance and had a moderately positive loading for TSS, due to erosion effects, and a negative loading for NO2
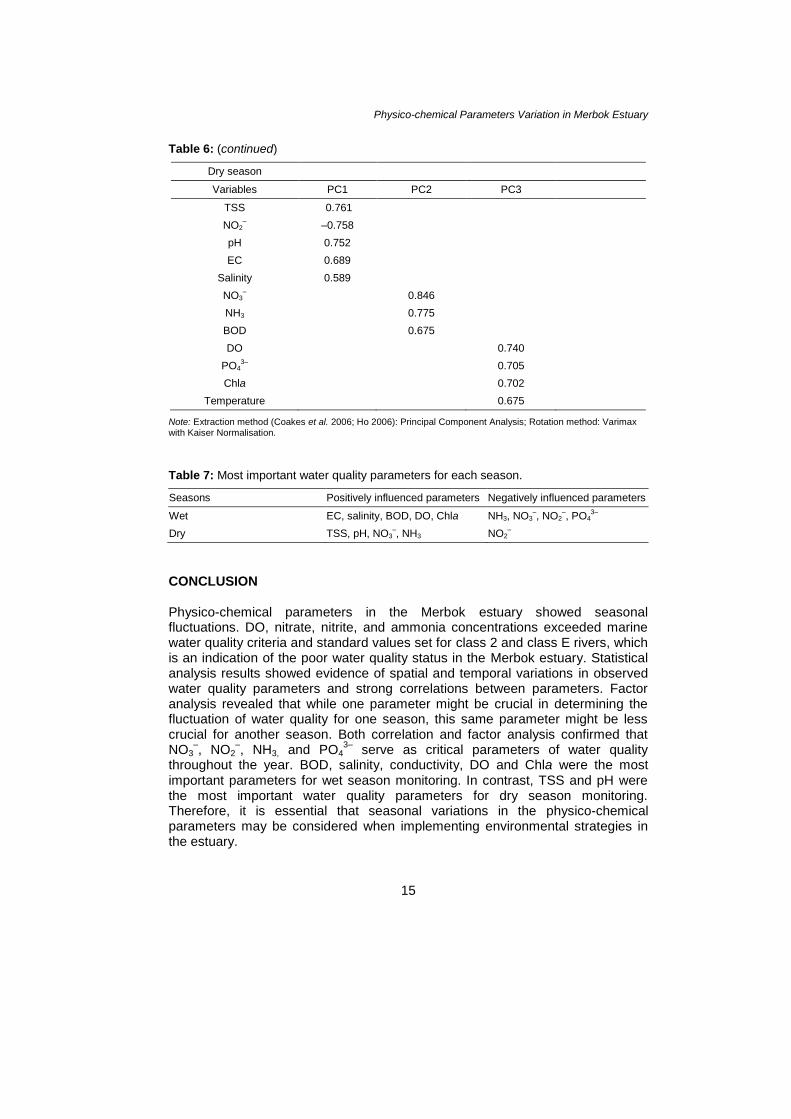
– (Tables 5 and 6). In the dry season, Factor 1
(F1) explained 30.375% of the total variance and had a moderately positive loading for EC, salinity, TSS, pH and BOD and a negative loading for NO2
–.
These results can be attributed to sea water intrusion into the river. Factor 2 (F2) explained 19.686% of the total variance and had a strong positive loading for NO3
– and moderate loading for both NH3 and BOD. These parameters were
determined to be non-point sources of pollution. Finally, Factor 3 (F3) explained 17.395% of the total variance and had a moderate positive loading for BOD, DO, temperature and Chla (Tables 5 and 6). As with Factor 2, these results may be due to biological interactions among parameters.
According to Pejman et al. (2009), water quality parameters, which showed a strong correlation coefficient value (>75%), were considered to be significant parameters for water quality monitoring. The significant water quality parameters that should be used to measure the seasonal variation in water quality of the Merbok estuary are listed in Table 7. NO3
–, NO2
–, NH3 and PO4
3–
are the most significant parameters defining water quality for both seasons in the Merbok estuary. These nutrient concentration patterns are the result of both point and nonpoint sources of pollution as well as erosion effects. Point sources of pollution can be attributed to domestic wastewater discharged from upstream human settlements, whereas nonpoint sources of pollution feed into the estuary
Physico-chemical Parameters Variation in Merbok Estuary
13
Kaniz Fatema et al.
14
from agricultural and livestock farms (Madramootoo et al. 1997; Kaniz et al. 2012). BOD, salinity, conductivity, DO and Chla, all with strong factor loadings, were the most important parameters in determining water quality variations during the wet season. These variations likely stem from domestic wastewater discharges that contributed to the degradation of water quality. In contrast, TSS and pH, both with strong positive factor loadings, were additional contributors to the significant water quality variation during the dry season and are likely affected by the upward movement of seawater into the river.
Table 6: Principal Component (PC) matrixes (rotated) for wet and dry seasons.
Wet season
Variables PC1 PC2 PC3 PC4
EC 0.906
NH3 –0.899
NO3–
–0.846
Salinity 0.828
BOD 0.883
DO 0.875
Chla 0.824
PO43–
–0.746
pH 0.737
Temperature 0.528
NO2–
–0.769
TSS 0.572
(continued on next page)
Physico-chemical Parameters Variation in Merbok Estuary
15
Table 6: (continued)
Dry season
Variables PC1 PC2 PC3
TSS 0.761
NO2–
–0.758
pH 0.752
EC 0.689
Salinity 0.589
NO3–
0.846
NH3 0.775
BOD 0.675
DO 0.740
PO43–
0.705
Chla 0.702
Temperature 0.675
Note: Extraction method (Coakes et al. 2006; Ho 2006): Principal Component Analysis; Rotation method: Varimax with Kaiser Normalisation.
Table 7: Most important water quality parameters for each season.
Seasons Positively influenced parameters Negatively influenced parameters
Wet EC, salinity, BOD, DO, Chla NH3, NO3–, NO2
–, PO4
3–
Dry TSS, pH, NO3–, NH3 NO2
–
CONCLUSION Physico-chemical parameters in the Merbok estuary showed seasonal fluctuations. DO, nitrate, nitrite, and ammonia concentrations exceeded marine water quality criteria and standard values set for class 2 and class E rivers, which is an indication of the poor water quality status in the Merbok estuary. Statistical analysis results showed evidence of spatial and temporal variations in observed water quality parameters and strong correlations between parameters. Factor analysis revealed that while one parameter might be crucial in determining the fluctuation of water quality for one season, this same parameter might be less crucial for another season. Both correlation and factor analysis confirmed that NO3
–, NO2
–, NH3, and PO4
3– serve as critical parameters of water quality
throughout the year. BOD, salinity, conductivity, DO and Chla were the most important parameters for wet season monitoring. In contrast, TSS and pH were the most important water quality parameters for dry season monitoring. Therefore, it is essential that seasonal variations in the physico-chemical parameters may be considered when implementing environmental strategies in the estuary.
Kaniz Fatema et al.
16
ACKNOWLEDGEMENT The authors thank USM for providing research facilities. This study would not have been possible without the cooperation of the staff at the School of Biological Sciences, USM. This study was funded by a USM grant (grant number 1001/PBIOLOGI/844083 and Research University Grant 1001/PBIOLOGI/815048). The first author acknowledges Third World Organization for Women in Science (TWOWS) and Swedish International Development Cooperation Agency (SIDA) for providing a study fellowship. The University of Dhaka, Bangladesh is acknowledged for granting study leave for the first author to pursue PhD studies at USM. REFERENCES Ajithkumar T T, Thangaradjou T and Kannan L. (2006). Physico-chemical and biological
properties of the Muthupettai mangrove in Tamil Nadu. Journal of the Marine Biological Association of India 48: 131–138.
Alkarkhi A F M, Ahmad A and Easa A M. (2009). Assessment of surface water quality of selected estuaries of Malaysia: Multivariate statistical techniques. The Environmentalist 29(3): 255–262.
Altın A, Filiz Z and Iscen C F. (2009). Assessment of seasonal variations of surface water quality characteristics for Porsuk Stream. Environmental Monitoring and Assessment 158(1): 51–65.
Anila Kumary K S A, Azis P K A and Natarajan P. (2007). Water quality of the Adimalathura estuary, Southwest coast of India. Journal of the Marine Biological Association of India 49(1): 1–6.
Anitha G and Kumar S P. (2013). Seasonal variations in physico-chemical parameters of Thengapattanam estuary, Southwest coastal zone, Tamil Nadu, India. International Journal of Environmental Sciences 3(4): 1253–1261.
American Public Health Association (APHA). (2005). Standard methods for the examination of water and waste water, 21
st ed. Washington DC: American Public
Health Association. Ball P W. (1992). Nutrient behavior in two contrasting Scottish estuaries. The Forth and
Tay. Oceanologica Acta 15(3): 261–277. Bardarudeen T, Damodaran K T, Sajan K and Padmalal D. (1996). Texture and
geochemistry of the sediments of a tropical mangrove ecosystem, Southwest coast of India. Environmental Geology 27: 164–169.
Bellos D and Sawidis T. (2005). Chemical pollution monitoring of the River Pinios (Thessalia-Greece). Journal of Environmental Management 76(4): 282–292.
Boon P J, Calow P and Petts G E. (1992). Essential elements in the case for river conservation. In P J Boon, P Calow and G E Petts (eds.). River conservation and management. Chichester, UK: John Wiley and Sons, 10–33.
Coakes J S, Steed L and Dzidic P. (2006). SPSS version 13.0 for Windows: Analysis without anguish. Australia: John Wiley and Sons Ltd.
Damotharan P, Perumal N V, Arumugam M, Vijayalakshmi S and Balasubramanian T. (2010). Seasonal variation of physico-chemical characteristics in point calimere coastal waters (South East coast of India). Middle-East Journal Science Research 6(4): 333–339.
Physico-chemical Parameters Variation in Merbok Estuary
17
Day J J W, Hall C A S, Kemp W M and Yanéz-Arancibia A. (1989). Estuarine ecology. New York: Wiley.
Department of Environment (DOE). (2011). Malaysia Environmental Quality Report 2010.
Malaysia: Department of Environment, Ministry of Science, Technology and the Environment, 24–34.
Dunn R J K, Ali A, Lemckert C J, Teasdale P and Welsh D T. (2007). Short-term variability of physico-chemical parameters and the estimated transport of filterable nutrients and chlorophyll-a in the urbanised Coombabah Lake and Coombabah Creek system, southern Moreton Bay, Australia. Journal of Coastal Research 50(Spl. Issue): 1062–1068.
Fan X, Cui B, Zhang K, Zhang Z and Shao H. (2012). Water quality management based on division of dry and wet seasons in Pearl River Delta, China. CLEAN–Soil, Air, Water 40(4): 381–393.
Food and Agriculture Organization (FAO). (1979). South China Sea fisheries development and coordinating programe.
www.fao.org/docrep/field/003/ab743e/AB743E11.htm (accessed on 20 March 2014).
Grafny S, Goren M and Gasith A. (2000). Habitat condition and fish assemblage structure in a coastal mediterranean stream (Yarqon, Israel) receiving domestic effluent. Hydrobiologia 422: 319–330.
Ho R. (2006). Handbook of univariate and multivariate data analysis and interpretation with SPSS. London: Chapman & Hall.
Iscen C F, Emiroglu Ö, Ilhan S, Arslan N, Yilmaz V and Ahiska S. (2008). Application of multivariate statistical techniques in the assessment of surface water quality in Uluabat Lake, Turkey. Environmental Monitoring and Assessment 144(1): 269–276.
Jonnalagadda S and Mhere G. (2001). Water quality of the Odzi river in the eastern highlands of Zimbabwe. Water Research 35(10): 2371–2376.
Juahir H, Zain S M, Yusoff M K, Hanidza T I T, Armi A S M, Toriman M E and Mokhtar M. (2011). Spatial water quality assessment of Langat River Basin (Malaysia) using environmetric techniques. Environmental Monitoring and Assessment 173(1):
625–641. Kaniz F, Wan Maznah W O and Mansor M I. (2012). Fluctuation of water quality
parameters in Merbok Estuary, Kedah, Malaysia. 3rd
International Conference on Environmental Research and Technology (ICERT 2012). Universiti Sains Malaysia, Pulau Pinang, Malaysia, 30 May–1
June 2012, 476–479.
Madramootoo C A, Johnston W R and Willardson L S. (1997). Management of agricultural drainage water quality, vol. 13. Rome: International Commission, FAO.
Manikannan R, Asokan S and Ali A H M S. (2011). Seasonal variations of physico-chemical properties of the Great Vedaranyam Swamp, Point Calimere Wildlife Sanctuary, South-east coast of India. African Journal of Environmental Science and Technology 5(9): 673–681.
Mansor M, Mohammad-Zafrizal M, Nur-Fadhilah M, Khairun Y and Wan-Maznah W O. (2012). Temporal and spatial variations in fish assemblage structures in relation to the physicochemical parameters of the Merbok Estuary, Kedah. Journal of Natural Sciences Research 2(7): 110–127.
Malaysian Meteorological Department (MMD). (2011). Malaysian Meteorological Department annual report. Kedah, Malaysia: MMD.
Kaniz Fatema et al.
18
____. (2009). Malaysian Meteorological Department annual report. Kedah, Malaysia: MMD.
Morris A W, Allen J I, Howland R J M and Wood R G. (1995). The estuary plume zone: Source or sink for land derived nutrient discharges? Estuarine, Coastal and Shelf Science 40(4): 387–402.
Muduli P R, Vinithkumar N V, Begum M, Robin R S, Vardhan K V, Venkatesan R and Kirubagarun R. (2011). Spatial variation of hydrochemical characteristics in and around Port Blair Bay Andaman and Nicobar Islands, India. World Applied Sciences Journal 13(3): 564–571.
Mustapha A, Aris A Z, Ramli M F and Juahir H. (2012). Spatial-temporal variation of surface water quality in the downstream region of the Jakara River, north-western Nigeria: A statistical approach. Journal of Environmental Science and Health 47(11): 1551–1560.
Muslim I and Jones G. (2003).The seasonal variation of dissolved nutrients, chlorophyll a and suspended sediments at Nelly Bay, Magnetic Island. Estuarine, Coastal and Shelf Science 57(3): 445–455.
Ong J, Gong W, Wong C, Din Z H and Kjerfve B. (1991). Characterization of a Malaysian mangrove estuary. Estuaries and Coasts 14(1): 38–48.
Ouyang Y, Nkedi-Kizza P, Wu Q, Shinde D and Huang C. (2006). Assessment of seasonal variations in surface water quality. Water Research 40(20): 3800–3810.
Pejman A H, Bidhendi G R N, Karbassi A R, Mehrdadi N and Bidhendi M E. (2009). Evaluation of spatial and seasonal variations in surface water quality using multivariate statistical techniques. International Journal of Environmental Science and Technology 6(3): 467–476.
Prabhahar C, Saleshrani K and Enbarasan R. (2011). Studies on the ecology and distribution of phytoplankton biomass in Kadalur coastal zone Tamil nadu, India. Current Botany 2(3): 26–30.
Prabu V A, Rajkumar M and Perumal P. (2008). Seasonal variations in physico-chemical parameters in Uppanar estuary, Cuddalore (southeast coast of India). Journal of the Marine Biological Association of India 50(2): 161–165
Reid G K. (1961). Ecology of inland waters and estuaries. New York: Van Nostrand
Reinhold Company. Selvam V, Hariprasad V, Mohan R and Ramasubramanian R. (1994). Diurnal variations in
the water quality of sewage polluted Adayar mangrove water, east coast of India. Indian Journal of Marine Sciences 23: 94–97.
Simier M, Laurent C, Ecoutin J M and Albaret J J. (2006). The Gambia River estuary: A reference point for estuarine fish assemblages studies in West Africa. Estuarine, Coastal and Shelf Science 69(3): 615–628.
Smith S and Hollibaugh J. (1993). Coastal metabolism and the oceanic organic carbon balance. Reviews of Geophysics 31(1): 75–89.
Strickland J and Parsons T R. (1972). A practical handbook of seawater analysis, vol. 167. Ottawa: Fisheries Research Board of Canada.
Uncles R J, Gong W K and Ong J E. (1992). Intra-tidal fluctuations in stratification within a mangrove estuary. Hydrobiologia 247: 163–171.
Varol M, Gökot B, Bekleyen A and Şen B. (2012). Spatial and temporal variations in surface water quality of the dam reservoirs in the Tigris River basin, Turkey. Catena 92: 11–21.

Physico-chemical Parameters Variation in Merbok Estuary
19
Vega M, Pardo R, Barrado E and Deban L. (1998). Assessment of seasonal and polluting effects on the quality of river water by exploratory data analysis. Water Research 32(12): 3581–3592.
Wang P F, Martin J and Morrison G. (1999). Water quality and eutrophication in Tampa Bay, Florida, East Coast. Shelf Science 49(1): 1–20.
Wunderlin D A, Diaz M P, Ame M V, Pesce S F, Hued A C and Bistoni M A. (2001). Pattern recognition techniques for the evaluation of spatial and temporal variations in water quality. A case study: Suquia river basin (Cordoba, Argentina). Water Research 35(12): 2881–2894.