1 februari, 2019 file"best ada rencana buka kawasan industri baru. alternatif kawasan industri...
TRANSCRIPT
To subscribe to our Daily Focus, please contact us at [email protected]
Mirae Asset Sekuritas Indonesia
1 Februari, 2019
Market Index
Last Trade Chg (%) MoM YoY
JCI 6,533.0 1.1 4.4 -2.0
MSCI Indonesia 27.7 1.6 9.7 -8.6
MSCI EM 1,049.9 1.3 7.3 -17.0
HANG SENG 27,942.5 1.1 7.0 -15.3
KOSPI 2,204.9 0.4 8.0 -14.2
FTSE 6,968.9 0 3.2 -7.3
DJIA 24,999.7 -0.1 7.2 -4.5
NASDAQ 7,281.7 1.4 8.3 -2.7
Valuation
2018F P/E (x) P/B (x) ROE (%)
JCI 15.8 2.3 17.6
Key Rates
Last Trade Chg (bps) MoM YoY
BI 7-Day RR 6.00 0 25 -100
3yr 7.65 -14 -25 195
10yr 8.01 -15 -2 179
FX
Last Trade Chg (%) MoM YoY
USD/IDR 13,973 -1.1 -1.8 5.6
USD/KRW 1,113 -0.3 -0.3 3.8
USD/JPY 109 -0.1 -0.8 -0.5
USD/CNY 7 -0.3 -2.4 6.8
Commodities
Last Trade Chg (%) MoM YoY
WTI 53.8 -0.8 18.5 2.6
Gold 1,321.3 0.1 3.0 -2.0
Coal 99.0 -0.3 -3.0 -5.1
Palm Oil 2,200.0 -0.2 6.3 -11.1
Rubber 131.9 0.3 8.2 4.0
Nickel 12,480.0 1.1 14.8 -10.9
Copper 6,136.0 1.4 2.9 -13.8
Tin 20,850.0 0.2 6.8 -4.1
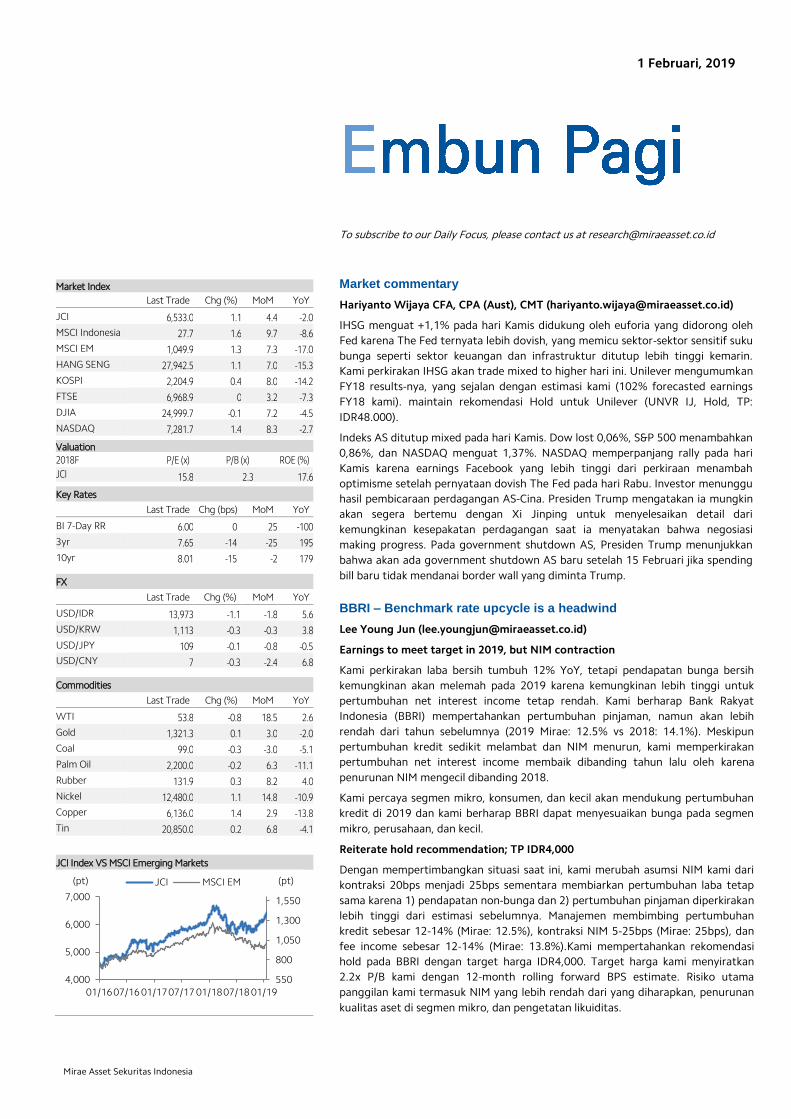
JCI Index VS MSCI Emerging Markets
Market commentary
Hariyanto Wijaya CFA, CPA (Aust), CMT ([email protected])
IHSG menguat +1,1% pada hari Kamis didukung oleh euforia yang didorong oleh
Fed karena The Fed ternyata lebih dovish, yang memicu sektor-sektor sensitif suku
bunga seperti sektor keuangan dan infrastruktur ditutup lebih tinggi kemarin.
Kami perkirakan IHSG akan trade mixed to higher hari ini. Unilever mengumumkan
FY18 results-nya, yang sejalan dengan estimasi kami (102% forecasted earnings
FY18 kami). maintain rekomendasi Hold untuk Unilever (UNVR IJ, Hold, TP:
IDR48.000).
Indeks AS ditutup mixed pada hari Kamis. Dow lost 0,06%, S&P 500 menambahkan
0,86%, dan NASDAQ menguat 1,37%. NASDAQ memperpanjang rally pada hari
Kamis karena earnings Facebook yang lebih tinggi dari perkiraan menambah
optimisme setelah pernyataan dovish The Fed pada hari Rabu. Investor menunggu
hasil pembicaraan perdagangan AS-Cina. Presiden Trump mengatakan ia mungkin
akan segera bertemu dengan Xi Jinping untuk menyelesaikan detail dari
kemungkinan kesepakatan perdagangan saat ia menyatakan bahwa negosiasi
making progress. Pada government shutdown AS, Presiden Trump menunjukkan
bahwa akan ada government shutdown AS baru setelah 15 Februari jika spending
bill baru tidak mendanai border wall yang diminta Trump.
BBRI – Benchmark rate upcycle is a headwind
Lee Young Jun ([email protected])
Earnings to meet target in 2019, but NIM contraction
Kami perkirakan laba bersih tumbuh 12% YoY, tetapi pendapatan bunga bersih
kemungkinan akan melemah pada 2019 karena kemungkinan lebih tinggi untuk
pertumbuhan net interest income tetap rendah. Kami berharap Bank Rakyat
Indonesia (BBRI) mempertahankan pertumbuhan pinjaman, namun akan lebih
rendah dari tahun sebelumnya (2019 Mirae: 12.5% vs 2018: 14.1%). Meskipun
pertumbuhan kredit sedikit melambat dan NIM menurun, kami memperkirakan
pertumbuhan net interest income membaik dibanding tahun lalu oleh karena
penurunan NIM mengecil dibanding 2018.
Kami percaya segmen mikro, konsumen, dan kecil akan mendukung pertumbuhan
kredit di 2019 dan kami berharap BBRI dapat menyesuaikan bunga pada segmen
mikro, perusahaan, dan kecil.
Reiterate hold recommendation; TP IDR4,000
Dengan mempertimbangkan situasi saat ini, kami merubah asumsi NIM kami dari
kontraksi 20bps menjadi 25bps sementara membiarkan pertumbuhan laba tetap
sama karena 1) pendapatan non-bunga dan 2) pertumbuhan pinjaman diperkirakan
lebih tinggi dari estimasi sebelumnya. Manajemen membimbing pertumbuhan
kredit sebesar 12-14% (Mirae: 12.5%), kontraksi NIM 5-25bps (Mirae: 25bps), dan
fee income sebesar 12-14% (Mirae: 13.8%).Kami mempertahankan rekomendasi
hold pada BBRI dengan target harga IDR4,000. Target harga kami menyiratkan
2.2x P/B kami dengan 12-month rolling forward BPS estimate. Risiko utama
panggilan kami termasuk NIM yang lebih rendah dari yang diharapkan, penurunan
kualitas aset di segmen mikro, dan pengetatan likuiditas.
550
800
1,050
1,300
1,550
4,000
5,000
6,000
7,000
01/1607/16 01/1707/17 01/1807/18 01/19
JCI MSCI EM (pt) (pt)
1 Februari, 2019
2
Embun Pagi
Mirae Asset Sekuritas Indonesia
Local flashes
BEST: Bekasi Fajar (BEST) menyiapkan Rp 600 miliar untuk ekspansi. Untuk tahun ini, salah
satu pengembang, BEST masih akan fokus ekspansi dengan kawasan industri MM2100 yang
dikembangkan. Hal ini mengingat semakin meningkatnya aksesibilitas kawasan tersebut
seperti tol Jakarta-Cikampek. "BEST ada rencana buka kawasan industri baru. Alternatif
kawasan industri yang menyasar tenaga kerja lebih murah," kata Seni, Investor Relations
BEST, Kamis (31/1). Untuk mendukung rencana ekspansi tersebut, perusahaan sektor
properti ini menganggarkan belanja modal alias capital expenditure (capex) Rp 600 miliar
dari internal dan eksternal untuk kawasan industri lama, ditambah untuk membuka kawasan
industri baru sekitar 600 hektare. (Kontan)
SMGR: Usai akuisisi Holcim, Semen Indonesia (SMGR) targetkan penjualan naik 5%. Usai
mengakuisisi 80,6% atau 6,18 miliar saham PT Holcim Indonesia Tbk (SMCB) pada Kamis
(31/1), PT Semen Indonesia Tbk (SMGR) berharap penjualan bisa tumbuh hingga 5% di
2019.Lewat akuisisi, Semen Indonesia berharap mampu meningkatkan sinergi perusahaan,
sekaligus memperluas jaringan pabrik semen di dalam negeri. Selain itu, tujuan akuisisi juga
untuk memperluas diversifikasi jenis produk yang ditawarkan. (Kontan)
MDKA : Merdeka Copper (MDKA) bakal lepas 470 juta saham baru lewat rights issue tahap
II. PT Merdeka Copper Gold Tbk (MDKA) berencana mencari pendanaan tambahan lewat
skema penerbitan saham baru. Perusahaan tambang ini akan menggelar Penambahan Modal
Dengan Memberikan Hak Memesan Efek Terlebih Dahulu (PMHMETD) tahap II alias rights
issue. Dari rights issue kali ini, MDKA berencana menerbitkan 470 juta saham biasa dengan
nilai nominal sebesar Rp 100 per saham. Rencana aksi korporasi ini akan diputuskan dalam
Rapat Umum Pemegang Saham Luar Biasa (RUPSLB) MDKA yang akan dilaksanakan pada 11
Maret mendatang. Adapun batas akhir pendaftaran (recording date) bagi pemegang saham
untuk hadir dalam RUPSLB adalah tanggal 14 Februari 2019. (Kontan)
TOWR: Perusahaan lain buka pintu, Sarana Menara Nusantara (TOWR) siap mengakuisisi.
PT Sarana Menara Nusantara Tbk (TOWR) menyatakan kesiapannya melakukan akuisisi
sejumlah perusahaan penyedia menara telekomunikasi di tahun 2019. Namun, Wakil
Direktur Utama Sarana Menara Nusantara Adam Gifari mengatakan, akuisisi itu tergantung
pada penawaran yang masuk ke TOWR. “Belum ada untuk saat ini, karena kami kan bukan
pemiliknya jadi kami tidak tahu. Mereka yang memulai prosesnya duluan, kami hanya
partisipan,” (Kontan)
ADHI : Adhi Karya kerjakan pembebasan lahan untuk depo LRT di Bekasi Timur.
Pemerintah dan BUMN infrastruktur tengah menyiapkan pembebasan lahan untuk
pembangunan depo LRT di Bekasi Timur. Untuk saat ini progress pembebasan sudah
mencapai 60% dan ditargetkan akan kelar dalam waktu dekat. Direktur Utama PT Adhi Karya
Budi Harto menyampaikan pihaknya telah melakukan pembebasan lahan di suatu area
pemukiman di Bekasi Timur sejak waktu yang cukup lama. "Targetnya Maret ini selesai dan
operasional April 2021," (Kontan)
BIRD: Masuki bisnis lelang, Blue Bird (BIRD) gandeng Mitsubishi dan Takari. PT Blue Bird
Tbk (BIRD) tengah berupaya untuk meningkatkan kinerjanya di tahun 2019 ini. Salah satu
upaya yang dilakukan adalah dengan membentuk usaha patungan (joint venture) bersama
Mitsubishi UFJ Lease & Finance Co. Ltd dan PT Takari Kokoh Sejahtera di bidang lelang yang
diberi nama PT Balai Lelang Caready. Perusahaan patungan ini telah didirikan pada Kamis,
(24/1). Adapun PT Balai Lelang Caready memiliki lokasi usaha di Jakarta Timur. Bidang usaha
ialah lelang termasuk lelang kendaraan bermotor. Status perusahaan ialah Perseroan
Terbatas Penanaman Modal Asing (PT PMA) (Kontan)
1 Februari, 2019
3
Embun Pagi
Mirae Asset Sekuritas Indonesia
Technical analysis
Tasrul +62-21-515-1140 [email protected]
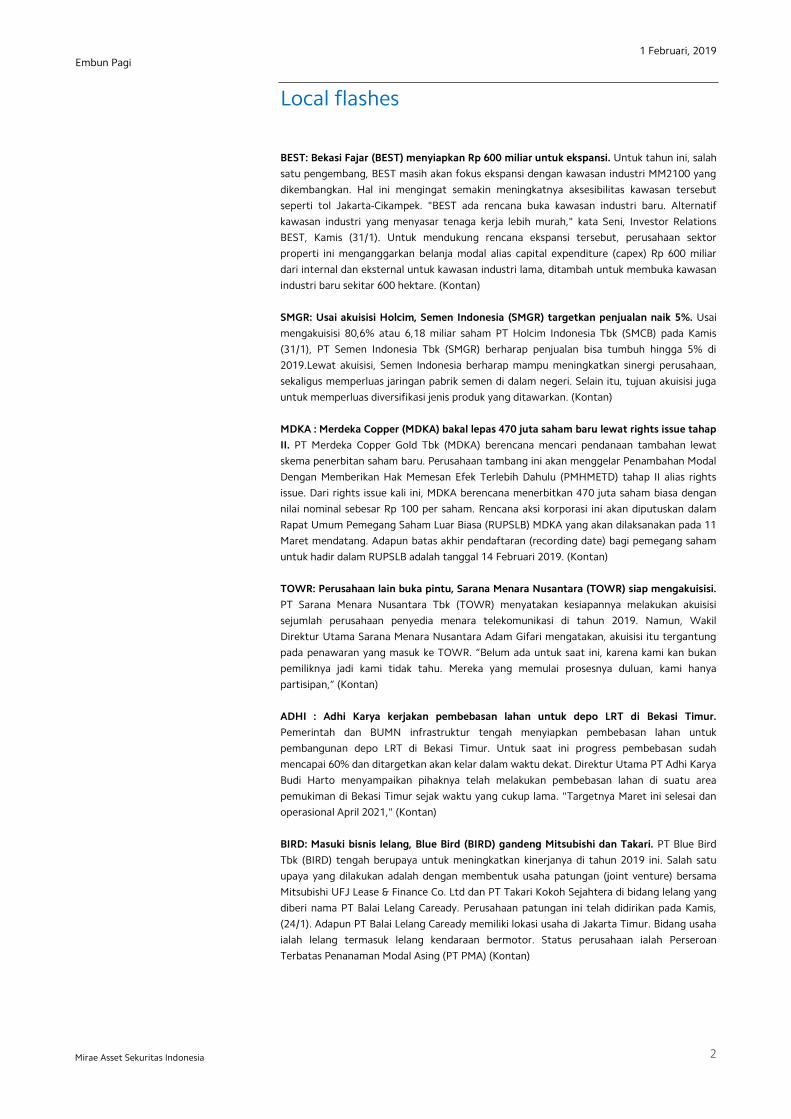
Jakarta Composite Index (JCI) – Consolidation
IHSG akan coba naik mendekati normal upper band pada pola uptrend jangka
pendek.
IHSG coba bertahan diatas center line band pola uptrend jangka jangka pendek dimana
korelasi pergerakkan indeks ini masih relatif valid (r-squared = 0.9508) sejak 68 hari
terakhir dimana bergerak normal dalam rentang +/- 1.97 std.deviasi dari centerline.
Peluang IHSG bergerak di luar pergerakan normal sekitar 4.92% atau sekitar 3 bar chart.
Rata-rata volatilitas normal pergerakan IHSG secara harian saat ini antara +0.52% / -
0.42% atau +33.97/ -27.44 point (rata-rata pergerakan normal positif / negatif selama
periode analisis) sebagaimana terlihat pada Figure 1.
Summary
Item Data Item Data
Close (Jan 31, 2019) 6,532.97(+1.06%) Trading range 6,496 - 6,557
8Average index performance (%) 6.15 Target
Period 68 - Daily 6,557
r-squared 0.9508 - Weekly 6,585
Volatility (+/-, %) +0.52/ -0.42 - Monthly 6,580
Volatility (+/-, point) +33.97/ -27.44 Stop loss 6,418
Source: Mirae Asset Sekuritas Indonesia Research
Figure 1. Daily , Short term trend – Uptrend
4 - 6,161 Source: Mirae Asset Sekuritas Indonesia Research
Created with AmiBroker - adv anced charting and technical analy sis sof tware. http://www.amibroker.com
_____ 6,556.6
_____ 6,495.8
Optimization Trading System - ©2010 Optimization Trading System - ©2010 Optimization Trading System - ©2010
^JKSE [ ^JKSE ] - Daily - 1/31/2019 Open: 6,491 High: 6,544 Low: 6,491 Close: 6,533 Vol. 10,895,020,032
Prev. Avg. Price: 6,522.9
R-Squared: 0.9508
Period: 68
Std.Dev: 1.97
Volatility (+) : 0.0052
Volatility (-) : -0.0042
V-Ratio : 1.24
Chg.: 1.06%
6,532.97
6,490.23
6,490.23
6,418.32
6,392
6,378.7
6,588.46
6,601.77
22 29 Nov 12 19 26 Dec 10 17 26 2019 7 14 21 28
^JKSE - Volume = 10,895,020,032.00, MA(Volume,17) = 9,775,067,136.00
10,895,020,032
9,775,067,136
1 Februari, 2019
4
Embun Pagi
Mirae Asset Sekuritas Indonesia
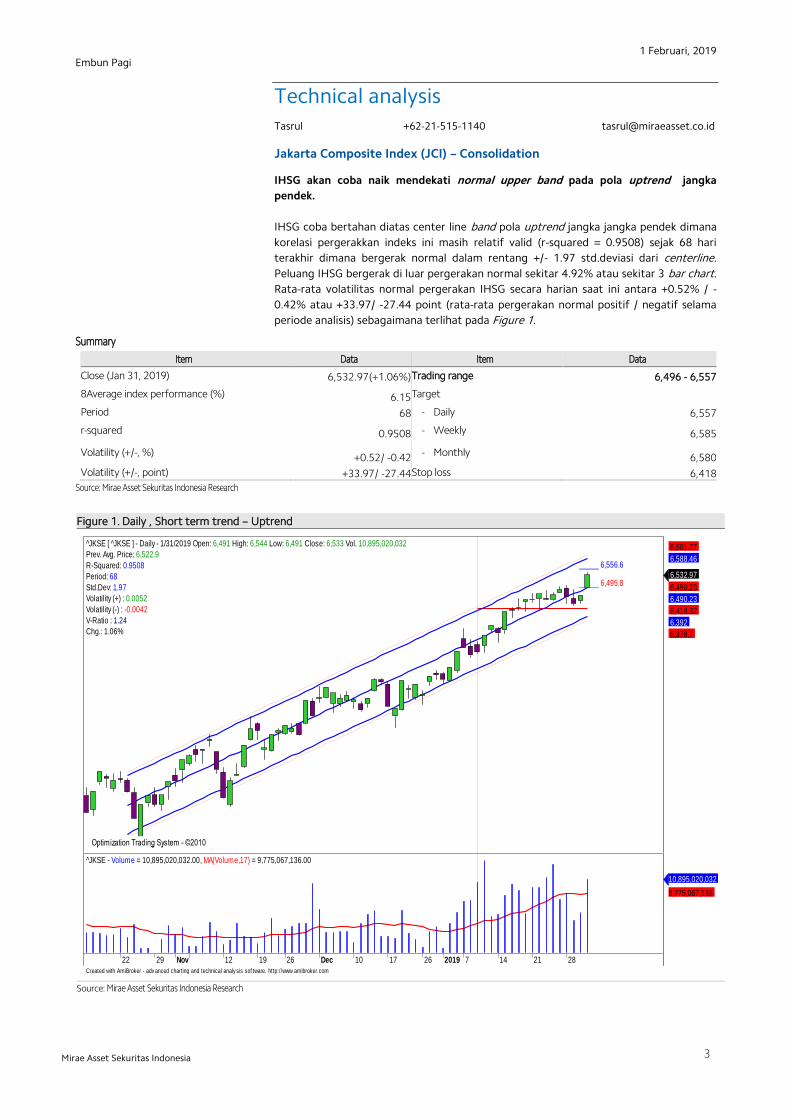
Aliran dana masuk dan volatilitas indeks naik masih terlihat terbatas.
Pada Figure 2, terlihat dari hasil optimalisasi terakhir pada periode daily indikator MFI
optimized dan indikator W%R optimized masih cenderung naik. Pada periode
weekly ,indikator MFI optimized, indikator RSI optimized dan indikator stochastic%D
optimized mulai terlihat tanda-tanda top reversal. Daily resistance terdekat di 6,557 dan
support di 6,496. Cut loss level di 6,418.
Figure 2. Daily, Short term trend, MFI optimized & W%R optimized
X` x`x`
Source: Mirae Asset Sekuritas Indonesia Research
Created with AmiBroker - adv anced charting and technical analy sis sof tware. http://www.amibroker.com
^JKSE - MFI Smoothed = 60.40
60.4048
^JKSE - Will%R Smoothed = -35.84
-35.843
_____ 6,556.6_____ 6,495.8
Optimization Trading System - ©2010
^JKSE [ ^JKSE ] - Daily - 1/31/2019 Open: 6,491 High: 6,544 Low: 6,491 Close: 6,533 Vol. 10,895,020,032
Prev. Avg. Price: 6,522.9
R-Squared: 0.9508
Period: 68
Std.Dev: 1.97
Volatility (+) : 0.0052
Volatility (-) : -0.0042
V-Ratio : 1.24
Chg.: 1.06%
6,532.97
6,418.32
Aug Sep Oct Nov Dec 2019
^JKSE - Volume = 10,895,020,032.00, MA(Volume,17) = 9,775,067,136.00
10,895,020,032
9,775,067,136
1 Februari, 2019
5
Embun Pagi
Mirae Asset Sekuritas Indonesia
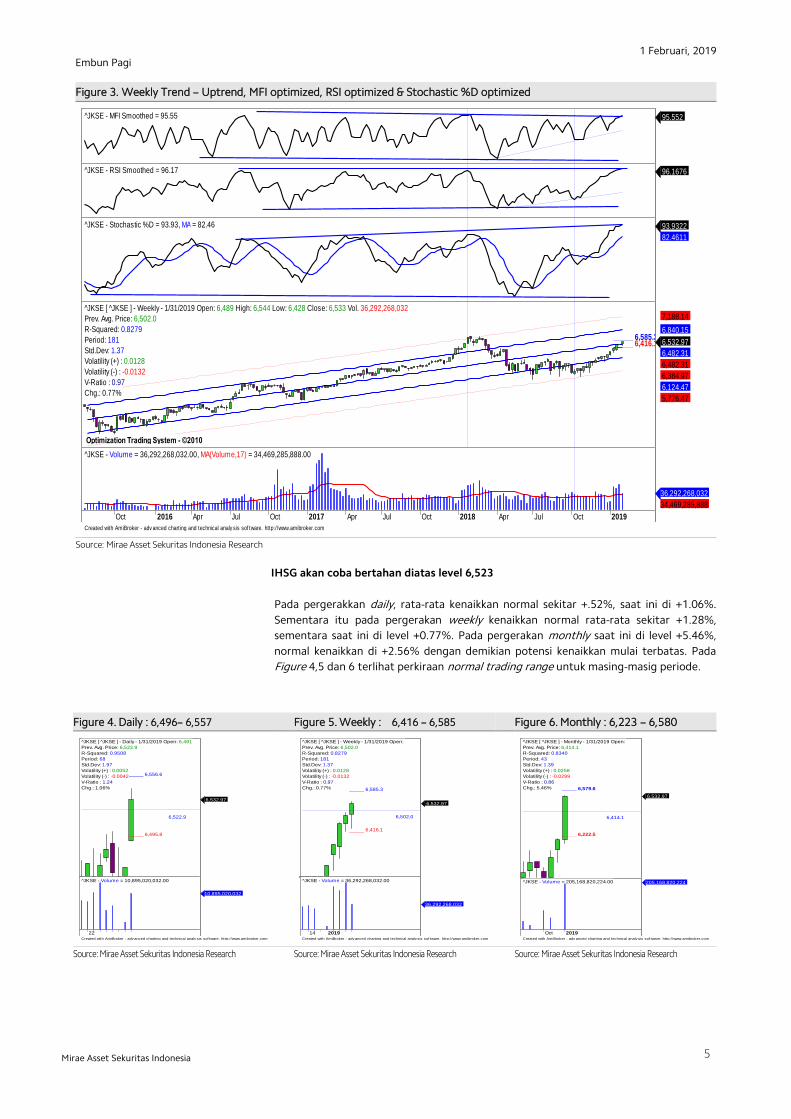
Figure 3. Weekly Trend – Uptrend, MFI optimized, RSI optimized & Stochastic %D optimized
A
Source: Mirae Asset Sekuritas Indonesia Research
IHSG akan coba bertahan diatas level 6,523
Pada pergerakkan daily, rata-rata kenaikkan normal sekitar +.52%, saat ini di +1.06%.
Sementara itu pada pergerakan weekly kenaikkan normal rata-rata sekitar +1.28%,
sementara saat ini di level +0.77%. Pada pergerakan monthly saat ini di level +5.46%,
normal kenaikkan di +2.56% dengan demikian potensi kenaikkan mulai terbatas. Pada
Figure 4,5 dan 6 terlihat perkiraan normal trading range untuk masing-masig periode.
Figure 4. Daily : 6,496– 6,557 Figure 5. Weekly : 6,416 – 6,585 Figure 6. Monthly : 6,223 – 6,580
x
x x`
Source: Mirae Asset Sekuritas Indonesia Research
Source: Mirae Asset Sekuritas Indonesia Research
Source: Mirae Asset Sekuritas Indonesia Research
Created with AmiBroker - adv anced charting and technical analy sis sof tware. http://www.amibroker.com
^JKSE - MFI Smoothed = 95.55 95.552
^JKSE - RSI Smoothed = 96.17 96.1676
^JKSE - Stochastic %D = 93.93, MA = 82.46 93.9322
82.4611
_____ 6,585.3_____ 6,416.1
Optimization Trading System - ©2010 Optimization Trading System - ©2010 Optimization Trading System - ©2010
^JKSE [ ^JKSE ] - Weekly - 1/31/2019 Open: 6,489 High: 6,544 Low: 6,428 Close: 6,533 Vol. 36,292,268,032
Prev. Avg. Price: 6,502.0
R-Squared: 0.8279
Period: 181
Std.Dev: 1.37
Volatility (+) : 0.0128
Volatility (-) : -0.0132
V-Ratio : 0.97
Chg.: 0.77%
6,532.97
6,482.31
6,482.31
6,384.97
6,124.47
5,776.47
6,840.15
7,188.14
Oct 2016 Apr Jul Oct 2017 Apr Jul Oct 2018 Apr Jul Oct 2019
^JKSE - Volume = 36,292,268,032.00, MA(Volume,17) = 34,469,285,888.00
36,292,268,032
34,469,285,888
Created with AmiBroker - adv anced charting and technical analy sis sof tware. http://www.amibroker.com
_____ 6,556.6
_____ 6,495.8
6,522.9
^JKSE [ ^JKSE ] - Daily - 1/31/2019 Open: 6,491
Prev. Avg. Price: 6,522.9
R-Squared: 0.9508
Period: 68
Std.Dev: 1.97
Volatility (+) : 0.0052
Volatility (-) : -0.0042
V-Ratio : 1.24
Chg.: 1.06%
6,532.97
22
^JKSE - Volume = 10,895,020,032.00
10,895,020,032
Created with AmiBroker - adv anced charting and technical analy sis sof tware. http://www.amibroker.com
_____ 6,585.3
_____ 6,416.1
6,502.0
^JKSE [ ^JKSE ] - Weekly - 1/31/2019 Open:
Prev. Avg. Price: 6,502.0
R-Squared: 0.8279
Period: 181
Std.Dev: 1.37
Volatility (+) : 0.0128
Volatility (-) : -0.0132
V-Ratio : 0.97
Chg.: 0.77%
6,532.97
14 2019
^JKSE - Volume = 36,292,268,032.00
36,292,268,032
Created with AmiBroker - adv anced charting and technical analy sis sof tware. http://www.amibroker.com
_____ 6,579.6
_____ 6,222.5
6,414.1
^JKSE [ ^JKSE ] - Monthly - 1/31/2019 Open:
Prev. Avg. Price: 6,414.1
R-Squared: 0.8340
Period: 43
Std.Dev: 1.39
Volatility (+) : 0.0258
Volatility (-) : -0.0299
V-Ratio : 0.86
Chg.: 5.46%
6,532.97
Oct 2019
^JKSE - Volume = 205,168,820,224.00 205,168,820,224
1 Februari, 2019
6
Embun Pagi
Mirae Asset Sekuritas Indonesia
Stocks on our focus list
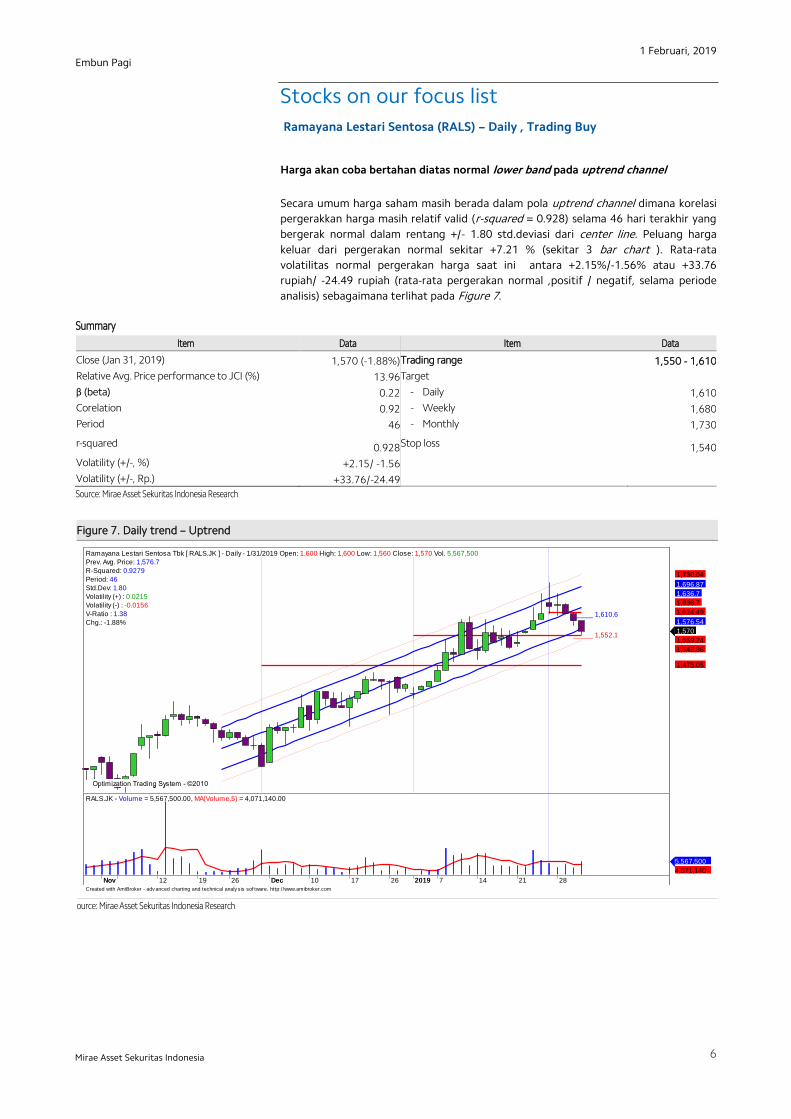
Ramayana Lestari Sentosa (RALS) – Daily , Trading Buy
Harga akan coba bertahan diatas normal lower band pada uptrend channel
Secara umum harga saham masih berada dalam pola uptrend channel dimana korelasi
pergerakkan harga masih relatif valid (r-squared = 0.928) selama 46 hari terakhir yang
bergerak normal dalam rentang +/- 1.80 std.deviasi dari center line. Peluang harga
keluar dari pergerakan normal sekitar +7.21 % (sekitar 3 bar chart ). Rata-rata
volatilitas normal pergerakan harga saat ini antara +2.15%/-1.56% atau +33.76
rupiah/ -24.49 rupiah (rata-rata pergerakan normal ,positif / negatif, selama periode
analisis) sebagaimana terlihat pada Figure 7.
Summary
Item Data Item Data
Close (Jan 31, 2019) 1,570 (-1.88%) Trading range 1,550 - 1,610
Relative Avg. Price performance to JCI (%) 13.96 Target
β (beta) 0.22 - Daily 1,610
Corelation 0.92 - Weekly 1,680
Period 46 - Monthly 1,730
r-squared 0.928 Stop loss 1,540
Volatility (+/-, %) +2.15/ -1.56
Volatility (+/-, Rp.) +33.76/-24.49
Source: Mirae Asset Sekuritas Indonesia Research
Figure 7. Daily trend – Uptrend
ource: Mirae Asset Sekuritas Indonesia Research
Created with AmiBroker - adv anced charting and technical analy sis sof tware. http://www.amibroker.com
_____ 1,610.6
_____ 1,552.1
Optimization Trading System - ©2010 Optimization Trading System - ©2010 Optimization Trading System - ©2010 Optimization Trading System - ©2010 Optimization Trading System - ©2010
Ramayana Lestari Sentosa Tbk [ RALS.JK ] - Daily - 1/31/2019 Open: 1,600 High: 1,600 Low: 1,560 Close: 1,570 Vol. 5,567,500
Prev. Avg. Price: 1,576.7
R-Squared: 0.9279
Period: 46
Std.Dev: 1.80
Volatility (+) : 0.0215
Volatility (-) : -0.0156
V-Ratio : 1.38
Chg.: -1.88%
1,570
1,559.24
1,543.36
1,475.05
1,576.54
1,624.49
1,636.7
1,636.7
1,696.87
1,730.04
Nov 12 19 26 Dec 10 17 26 2019 7 14 21 28
RALS.JK - Volume = 5,567,500.00, MA(Volume,5) = 4,071,140.00
5,567,500
4,071,140
1 Februari, 2019
7
Embun Pagi
Mirae Asset Sekuritas Indonesia
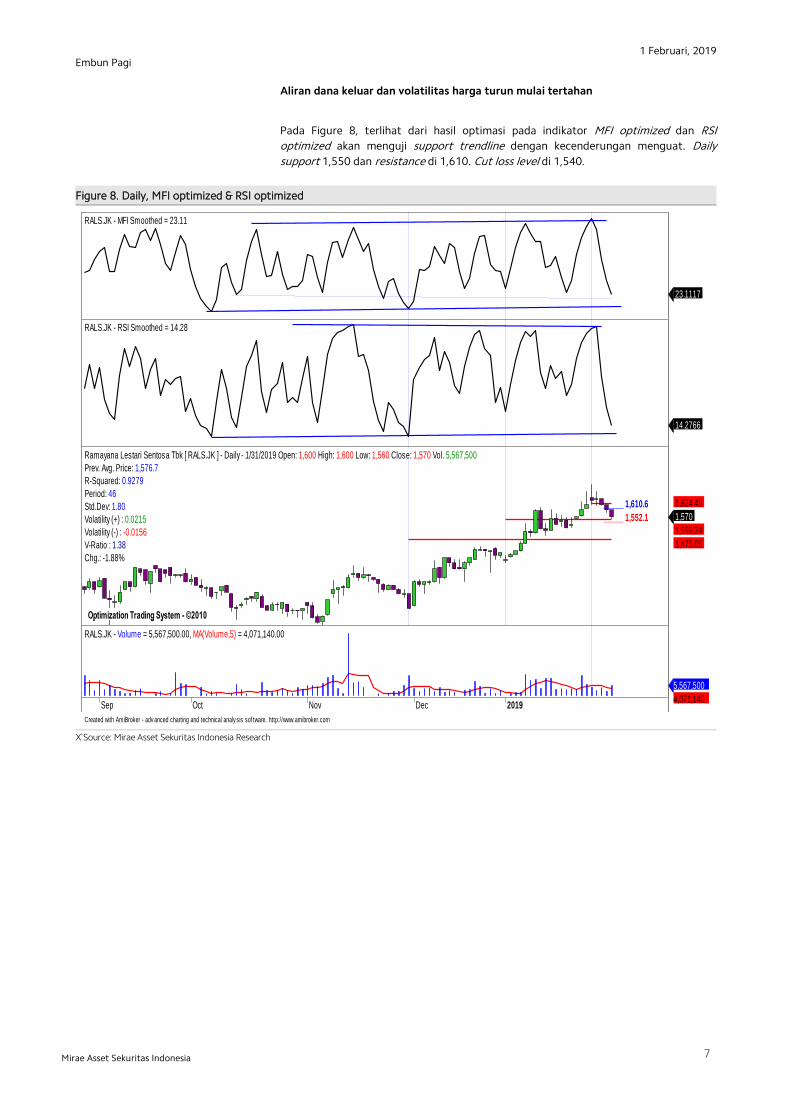
Aliran dana keluar dan volatilitas harga turun mulai tertahan
Pada Figure 8, terlihat dari hasil optimasi pada indikator MFI optimized dan RSI
optimized akan menguji support trendline dengan kecenderungan menguat. Daily
support 1,550 dan resistance di 1,610. Cut loss level di 1,540.
Figure 8. Daily, MFI optimized & RSI optimized
X`Source: Mirae Asset Sekuritas Indonesia Research
Created with AmiBroker - adv anced charting and technical analy sis sof tware. http://www.amibroker.com
RALS.JK - MFI Smoothed = 23.11
23.1117
RALS.JK - RSI Smoothed = 14.28
14.2766
_____ 1,610.6
_____ 1,552.1
Optimization Trading System - ©2010 Optimization Trading System - ©2010 Optimization Trading System - ©2010
Ramayana Lestari Sentosa Tbk [ RALS.JK ] - Daily - 1/31/2019 Open: 1,600 High: 1,600 Low: 1,560 Close: 1,570 Vol. 5,567,500
Prev. Avg. Price: 1,576.7
R-Squared: 0.9279
Period: 46
Std.Dev: 1.80
Volatility (+) : 0.0215
Volatility (-) : -0.0156
V-Ratio : 1.38
Chg.: -1.88%
1,570
1,559.24
1,475.05
1,624.49
Sep Oct Nov Dec 2019
RALS.JK - Volume = 5,567,500.00, MA(Volume,5) = 4,071,140.00
5,567,500
4,071,140
1 Februari, 2019
8
Embun Pagi
Mirae Asset Sekuritas Indonesia
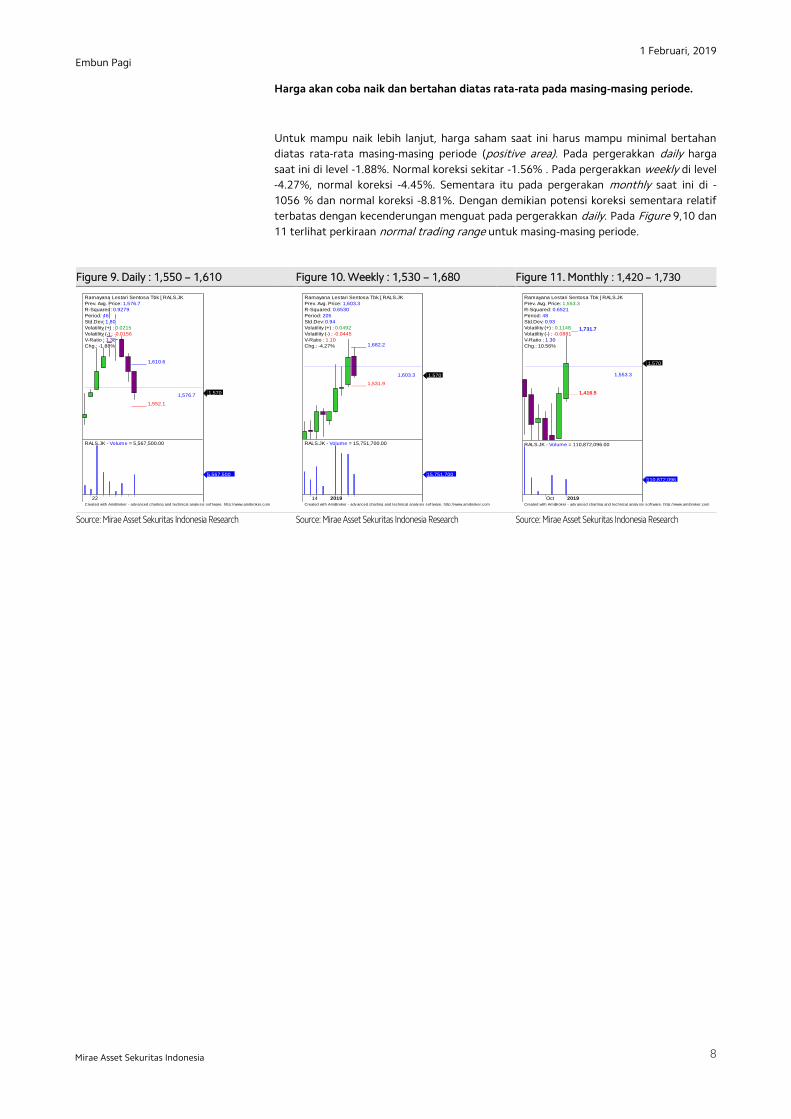
Harga akan coba naik dan bertahan diatas rata-rata pada masing-masing periode.
Untuk mampu naik lebih lanjut, harga saham saat ini harus mampu minimal bertahan
diatas rata-rata masing-masing periode (positive area). Pada pergerakkan daily harga
saat ini di level -1.88%. Normal koreksi sekitar -1.56% . Pada pergerakkan weekly di level
-4.27%, normal koreksi -4.45%. Sementara itu pada pergerakan monthly saat ini di -
1056 % dan normal koreksi -8.81%. Dengan demikian potensi koreksi sementara relatif
terbatas dengan kecenderungan menguat pada pergerakkan daily. Pada Figure 9,10 dan
11 terlihat perkiraan normal trading range untuk masing-masing periode.
Figure 9. Daily : 1,550 – 1,610 Figure 10. Weekly : 1,530 – 1,680 Figure 11. Monthly : 1,420 – 1,730
x`x`
Source: Mirae Asset Sekuritas Indonesia Research
Source: Mirae Asset Sekuritas Indonesia Research
Source: Mirae Asset Sekuritas Indonesia Research
Created with AmiBroker - adv anced charting and technical analy sis sof tware. http://www.amibroker.com
_____ 1,610.6
_____ 1,552.1
1,576.7
Ramayana Lestari Sentosa Tbk [ RALS.JK
Prev. Avg. Price: 1,576.7
R-Squared: 0.9279
Period: 46
Std.Dev: 1.80
Volatility (+) : 0.0215
Volatility (-) : -0.0156
V-Ratio : 1.38
Chg.: -1.88%
1,570
22
RALS.JK - Volume = 5,567,500.00
5,567,500
Created with AmiBroker - adv anced charting and technical analy sis sof tware. http://www.amibroker.com
_____ 1,682.2
_____ 1,531.9
1,603.3
Ramayana Lestari Sentosa Tbk [ RALS.JK
Prev. Avg. Price: 1,603.3
R-Squared: 0.6530
Period: 205
Std.Dev: 0.94
Volatility (+) : 0.0492
Volatility (-) : -0.0445
V-Ratio : 1.10
Chg.: -4.27%
1,570
14 2019
RALS.JK - Volume = 15,751,700.00
15,751,700
Created with AmiBroker - adv anced charting and technical analy sis sof tware. http://www.amibroker.com
_____ 1,731.7
_____ 1,416.5
1,553.3
Ramayana Lestari Sentosa Tbk [ RALS.JK
Prev. Avg. Price: 1,553.3
R-Squared: 0.6521
Period: 48
Std.Dev: 0.93
Volatility (+) : 0.1148
Volatility (-) : -0.0881
V-Ratio : 1.30
Chg.: 10.56%
1,570
Oct 2019
RALS.JK - Volume = 110,872,096.00
110,872,096

1 Februari, 2019
9
Embun Pagi
Mirae Asset Sekuritas Indonesia
Ace Hardware Indonesia (ACES) – Daily, Trading Buy
Harga akan coba naik mendekati center line pada uptrend channel
Secara umum harga saham ini masih berada dalam pola uptrend channel dimana
korelasi pergerakkan harga masih relatif valid (r-squared = 0.825) selama 70 hari
terakhir dan bergerak normal dalam rentang +/-1.36 std.deviasi dari center line.
Peluang harga keluar dari pergerakan normal sekitar +17.46% (sekitar 12 bar chart ).
Rata-rata volatilitas normal pergerakan harga saat ini antara +1.71% /-1.35% atau
+29.07 rupiah / -22.95 rupiah (rata-rata pergerakan normal positif / negatif, selama
periode analisis) sebaaimana sebagaimana terlihat pada Figure 12.
Summary
Item Data Item Data
Close (Jan 31, 2019) 1,700 (0.00%) Trading range 1,680 - 1,750
Relative Avg. Price performance to JCI (%) 9.99 Target
β (beta) 0.34 - Daily 1,750
Corelation 0.93 - Weekly 1,790
Period 70 - Monthly 1,810
r-squared 0.825 Stop loss 1,660
Volatility (+/-, %) +1.71/ -1.35
Volatility (+/-, Rp.) +29.07/ -22.95
Source: Mirae Asset Sekuritas Indonesia Research
Figure 12. Daily – Uptrend
x`
Source: Mirae Asset Sekuritas Indonesia Research
Created with AmiBroker - adv anced charting and technical analy sis sof tware. http://www.amibroker.com
_____ 1,733.5
_____ 1,680.3
Optimization Trading System - ©2010 Optimization Trading System - ©2010 Optimization Trading System - ©2010 Optimization Trading System - ©2010
Ace Hardware Ind [ ACES.JK ] - Daily - 1/31/2019 Open: 1,700 High: 1,730 Low: 1,680 Close: 1,700 Vol. 18,286,900
Prev. Avg. Price: 1,703.3
R-Squared: 0.8254
Period: 70
Std.Dev: 1.36
Volatility (+) : 0.0177
Volatility (-) : -0.0135
V-Ratio : 1.31
Chg.: 0.00% 1,700
1,691.17
1,663.58
1,612.46
1,740.85
1,740.85
1,760.83
1,818.12
1,869.24
8 15 22 29 Nov 12 19 26 Dec 10 17 26 2019 14 21 28
ACES.JK - Volume = 18,286,900.00, MA(Volume,7) = 13,348,929.00
18,286,900
13,348,929

1 Februari, 2019
10
Embun Pagi
Mirae Asset Sekuritas Indonesia
Aliran dana keluar dan volatilitas harga turun sudah terbatas.
Pada Figure 13, terlihat dari hasil optimalisasi indikator MFI optimized dan RSI
optimized akan menguji support trend line dengan kecenderungan menguat. Daily
resistance di 1,750. Sementara itu daily support di 1,680. Cut loss level di 1,660.
Figure 13. Daily , MFI optimized & W%R optimized
,
Source: Mirae Asset Sekuritas Indonesia Research
Created with AmiBroker - adv anced charting and technical analy sis sof tware. http://www.amibroker.com
ACES.JK - MFI Smoothed = 1.78
1.77862
ACES.JK - Will%R Smoothed = -77.02
-77.0224
_____ 1,733.5_____ 1,680.3
Optimization Trading System - ©2010 Optimization Trading System - ©2010
Ace Hardware Ind [ ACES.JK ] - Daily - 1/31/2019 Open: 1,700 High: 1,730 Low: 1,680 Close: 1,700 Vol. 18,286,900
Prev. Avg. Price: 1,703.3
R-Squared: 0.8254
Period: 70
Std.Dev: 1.36
Volatility (+) : 0.0177
Volatility (-) : -0.0135
V-Ratio : 1.31
Chg.: 0.00%
1,700
1,691.17
1,599.81
Sep Oct Nov Dec 2019
ACES.JK - Volume = 18,286,900.00, MA(Volume,7) = 13,348,929.00
18,286,900
13,348,929
1 Februari, 2019
11
Embun Pagi
Mirae Asset Sekuritas Indonesia
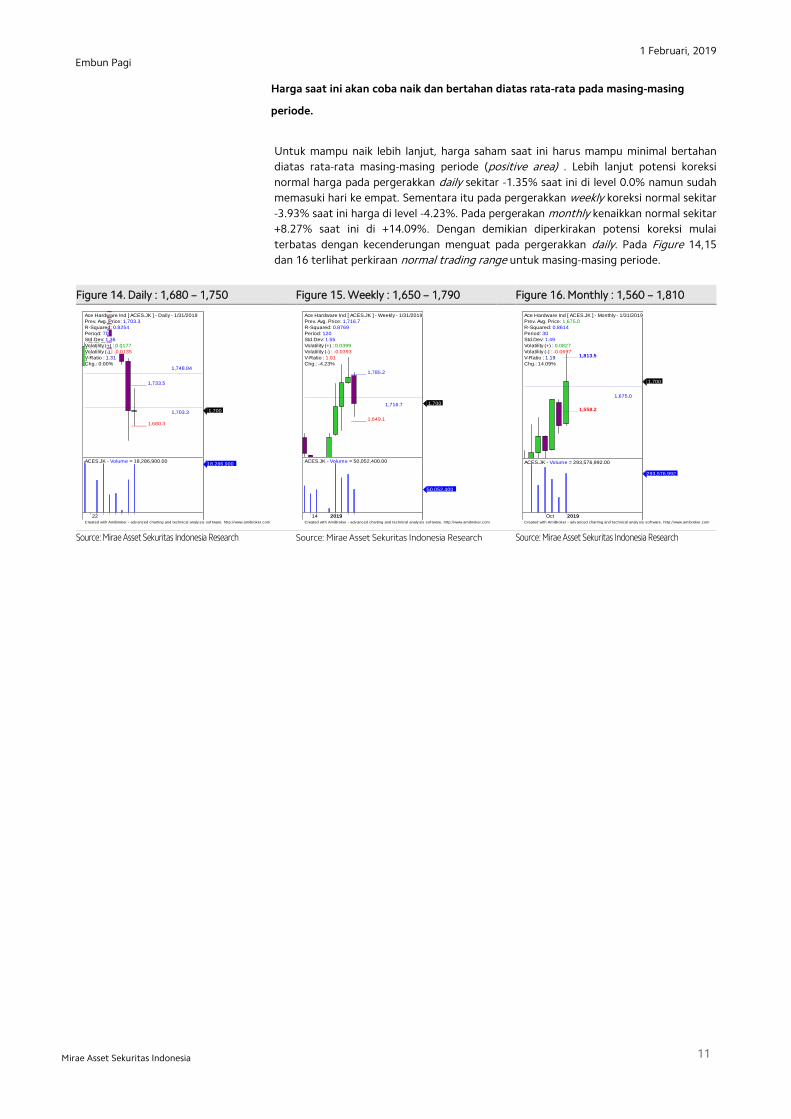
Harga saat ini akan coba naik dan bertahan diatas rata-rata pada masing-masing
periode.
Untuk mampu naik lebih lanjut, harga saham saat ini harus mampu minimal bertahan
diatas rata-rata masing-masing periode (positive area) . Lebih lanjut potensi koreksi
normal harga pada pergerakkan daily sekitar -1.35% saat ini di level 0.0% namun sudah
memasuki hari ke empat. Sementara itu pada pergerakkan weekly koreksi normal sekitar
-3.93% saat ini harga di level -4.23%. Pada pergerakan monthly kenaikkan normal sekitar
+8.27% saat ini di +14.09%. Dengan demikian diperkirakan potensi koreksi mulai
terbatas dengan kecenderungan menguat pada pergerakkan daily. Pada Figure 14,15
dan 16 terlihat perkiraan normal trading range untuk masing-masing periode.
Figure 14. Daily : 1,680 – 1,750 Figure 15. Weekly : 1,650 – 1,790 Figure 16. Monthly : 1,560 – 1,810
x`
x
Source: Mirae Asset Sekuritas Indonesia Research
Source: Mirae Asset Sekuritas Indonesia Research
Source: Mirae Asset Sekuritas Indonesia Research
Created with AmiBroker - adv anced charting and technical analy sis sof tware. http://www.amibroker.com
_____ 1,733.5
_____ 1,680.3
1,703.3
1,748.84
Ace Hardware Ind [ ACES.JK ] - Daily - 1/31/2019
Prev. Avg. Price: 1,703.3
R-Squared: 0.8254
Period: 70
Std.Dev: 1.36
Volatility (+) : 0.0177
Volatility (-) : -0.0135
V-Ratio : 1.31
Chg.: 0.00%
1,700
22
ACES.JK - Volume = 18,286,900.0018,286,900
Created with AmiBroker - adv anced charting and technical analy sis sof tware. http://www.amibroker.com
_____ 1,785.2
_____ 1,649.1
1,716.7
Ace Hardware Ind [ ACES.JK ] - Weekly - 1/31/2019
Prev. Avg. Price: 1,716.7
R-Squared: 0.8769
Period: 120
Std.Dev: 1.55
Volatility (+) : 0.0399
Volatility (-) : -0.0393
V-Ratio : 1.01
Chg.: -4.23%
1,700
14 2019
ACES.JK - Volume = 50,052,400.00
50,052,400
Created with AmiBroker - adv anced charting and technical analy sis sof tware. http://www.amibroker.com
_____ 1,813.5
_____ 1,558.2
1,675.0
Ace Hardware Ind [ ACES.JK ] - Monthly - 1/31/2019
Prev. Avg. Price: 1,675.0
R-Squared: 0.8614
Period: 30
Std.Dev: 1.49
Volatility (+) : 0.0827
Volatility (-) : -0.0697
V-Ratio : 1.19
Chg.: 14.09%
1,700
Oct 2019
ACES.JK - Volume = 293,576,992.00
293,576,992
1 Februari, 2019
12
Embun Pagi
Mirae Asset Sekuritas Indonesia
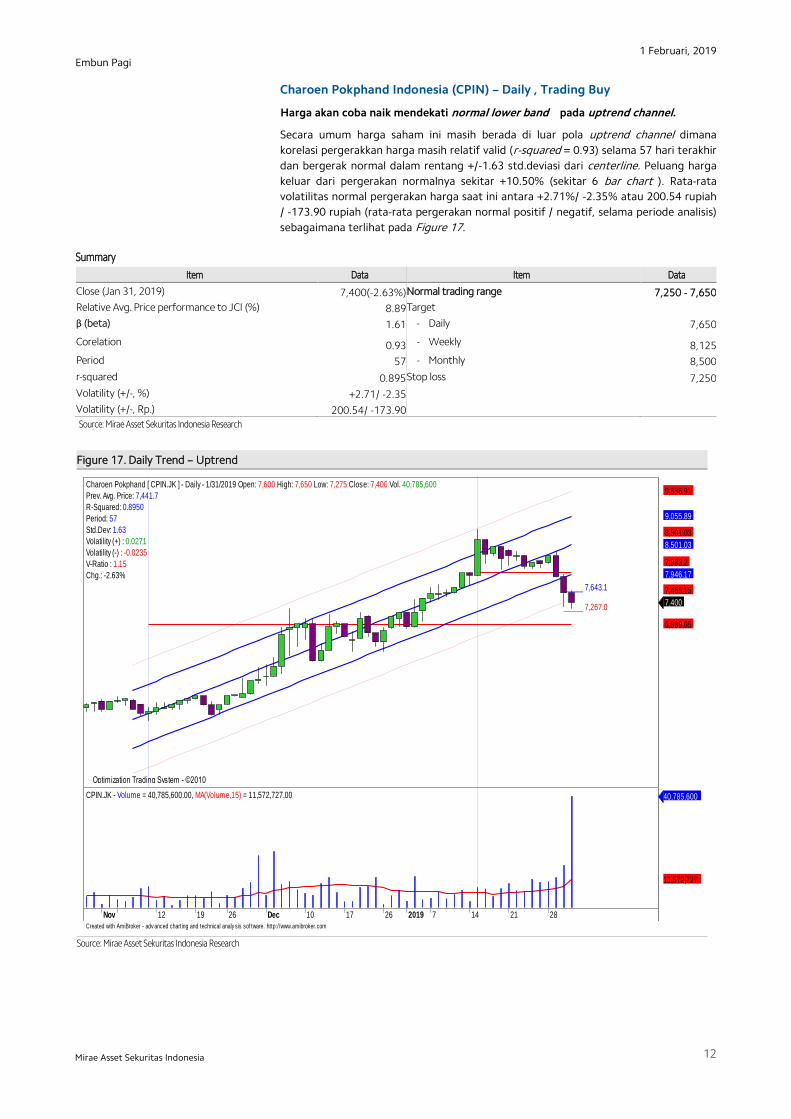
Charoen Pokphand Indonesia (CPIN) – Daily , Trading Buy
Harga akan coba naik mendekati normal lower band pada uptrend channel.
Secara umum harga saham ini masih berada di luar pola uptrend channel dimana
korelasi pergerakkan harga masih relatif valid (r-squared = 0.93) selama 57 hari terakhir
dan bergerak normal dalam rentang +/-1.63 std.deviasi dari centerline. Peluang harga
keluar dari pergerakan normalnya sekitar +10.50% (sekitar 6 bar chart ). Rata-rata
volatilitas normal pergerakan harga saat ini antara +2.71%/ -2.35% atau 200.54 rupiah
/ -173.90 rupiah (rata-rata pergerakan normal positif / negatif, selama periode analisis)
sebagaimana terlihat pada Figure 17.
Summary
Item Data Item Data
Close (Jan 31, 2019) 7,400(-2.63%) Normal trading range 7,250 - 7,650
Relative Avg. Price performance to JCI (%) 8.89 Target
β (beta) 1.61 - Daily 7,650
Corelation 0.93 - Weekly 8,125
Period 57 - Monthly 8,500
r-squared 0.895 Stop loss 7,250
Volatility (+/-, %) +2.71/ -2.35
Volatility (+/-, Rp.) 200.54/ -173.90
Source: Mirae Asset Sekuritas Indonesia Research
Figure 17. Daily Trend – Uptrend
Source: Mirae Asset Sekuritas Indonesia Research
,
Created with AmiBroker - adv anced charting and technical analy sis sof tware. http://www.amibroker.com
_____ 7,643.1
_____ 7,267.0
Optimization Trading System - ©2010 Optimization Trading System - ©2010 Optimization Trading System - ©2010 Optimization Trading System - ©2010
Charoen Pokphand [ CPIN.JK ] - Daily - 1/31/2019 Open: 7,600 High: 7,650 Low: 7,275 Close: 7,400 Vol. 40,785,600
Prev. Avg. Price: 7,441.7
R-Squared: 0.8950
Period: 57
Std.Dev: 1.63
Volatility (+) : 0.0271
Volatility (-) : -0.0235
V-Ratio : 1.15
Chg.: -2.63%
7,400
6,989.65
7,465.15
7,946.17
7,983.2
8,501.03
8,501.03
9,055.89
9,536.91
Nov 12 19 26 Dec 10 17 26 2019 7 14 21 28
CPIN.JK - Volume = 40,785,600.00, MA(Volume,15) = 11,572,727.00 40,785,600
11,572,727
1 Februari, 2019
13
Embun Pagi
Mirae Asset Sekuritas Indonesia
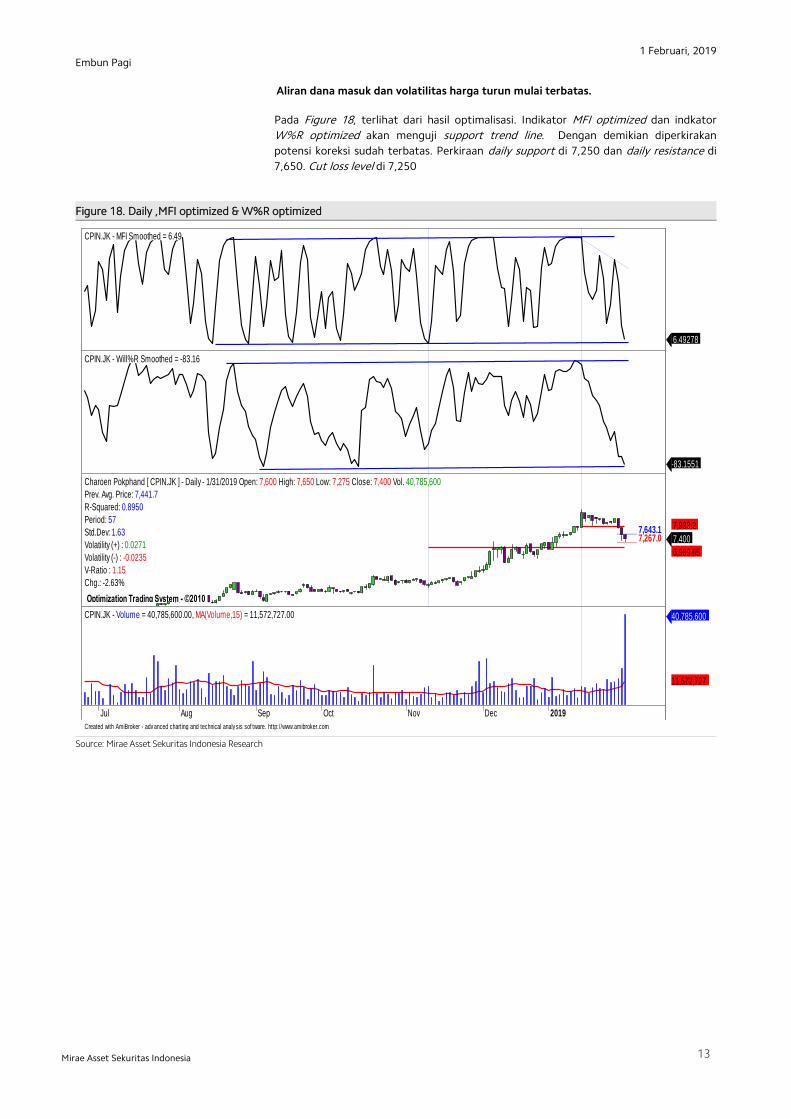
Aliran dana masuk dan volatilitas harga turun mulai terbatas.
Pada Figure 18, terlihat dari hasil optimalisasi. Indikator MFI optimized dan indkator
W%R optimized akan menguji support trend line. Dengan demikian diperkirakan
potensi koreksi sudah terbatas. Perkiraan daily support di 7,250 dan daily resistance di
7,650. Cut loss level di 7,250
Figure 18. Daily ,MFI optimized & W%R optimized
Source: Mirae Asset Sekuritas Indonesia Research
Created with AmiBroker - adv anced charting and technical analy sis sof tware. http://www.amibroker.com
CPIN.JK - MFI Smoothed = 6.49
6.49278
CPIN.JK - Will%R Smoothed = -83.16
-83.1551
_____ 7,643.1_____ 7,267.0
Optimization Trading System - ©2010 Optimization Trading System - ©2010
Charoen Pokphand [ CPIN.JK ] - Daily - 1/31/2019 Open: 7,600 High: 7,650 Low: 7,275 Close: 7,400 Vol. 40,785,600
Prev. Avg. Price: 7,441.7
R-Squared: 0.8950
Period: 57
Std.Dev: 1.63
Volatility (+) : 0.0271
Volatility (-) : -0.0235
V-Ratio : 1.15
Chg.: -2.63%
7,400
6,989.65
7,983.2
Jul Aug Sep Oct Nov Dec 2019
CPIN.JK - Volume = 40,785,600.00, MA(Volume,15) = 11,572,727.00 40,785,600
11,572,727
1 Februari, 2019
14
Embun Pagi
Mirae Asset Sekuritas Indonesia
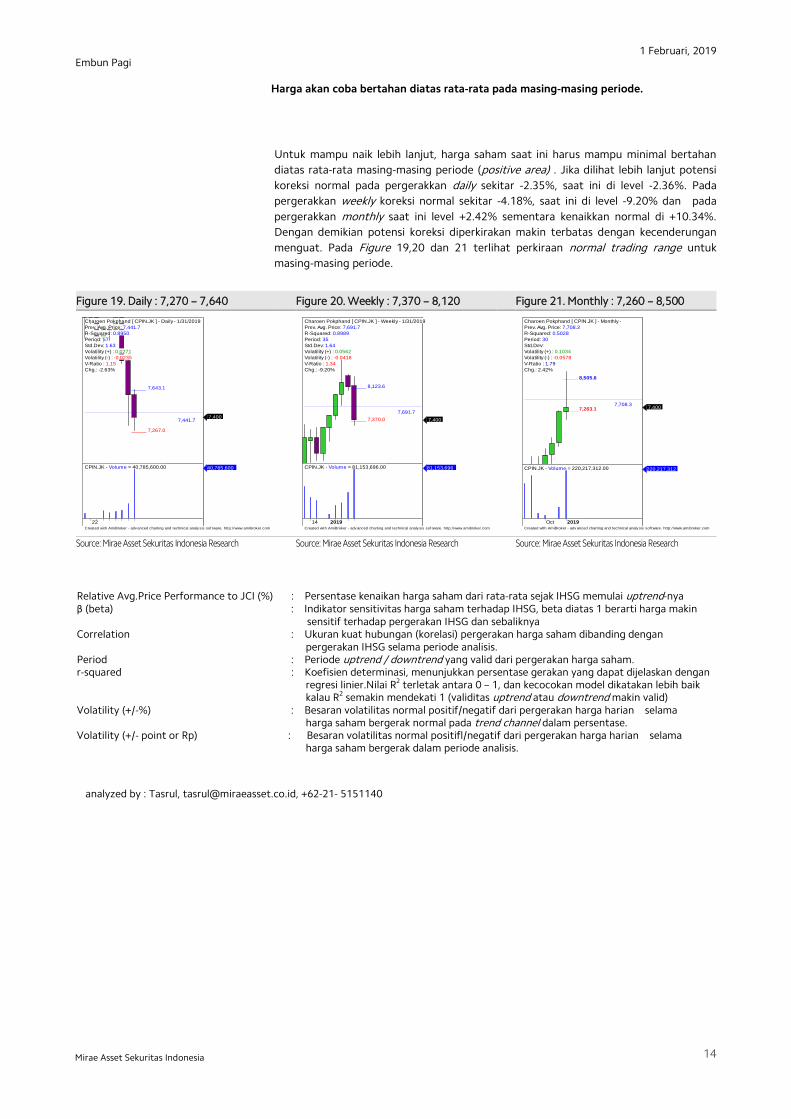
Harga akan coba bertahan diatas rata-rata pada masing-masing periode.
Untuk mampu naik lebih lanjut, harga saham saat ini harus mampu minimal bertahan
diatas rata-rata masing-masing periode (positive area) . Jika dilihat lebih lanjut potensi
koreksi normal pada pergerakkan daily sekitar -2.35%, saat ini di level -2.36%. Pada
pergerakkan weekly koreksi normal sekitar -4.18%, saat ini di level -9.20% dan pada
pergerakkan monthly saat ini level +2.42% sementara kenaikkan normal di +10.34%.
Dengan demikian potensi koreksi diperkirakan makin terbatas dengan kecenderungan
menguat. Pada Figure 19,20 dan 21 terlihat perkiraan normal trading range untuk
masing-masing periode.
Figure 19. Daily : 7,270 – 7,640 Figure 20. Weekly : 7,370 – 8,120 Figure 21. Monthly : 7,260 – 8,500
,,
x` x,
Source: Mirae Asset Sekuritas Indonesia Research
Source: Mirae Asset Sekuritas Indonesia Research
Source: Mirae Asset Sekuritas Indonesia Research
analyzed by : Tasrul, [email protected], +62-21- 5151140
Relative Avg.Price Performance to JCI (%) : Persentase kenaikan harga saham dari rata-rata sejak IHSG memulai uptrend-nya β (beta) : Indikator sensitivitas harga saham terhadap IHSG, beta diatas 1 berarti harga makin sensitif terhadap pergerakan IHSG dan sebaliknya Correlation : Ukuran kuat hubungan (korelasi) pergerakan harga saham dibanding dengan pergerakan IHSG selama periode analisis. Period : Periode uptrend / downtrend yang valid dari pergerakan harga saham. r-squared : Koefisien determinasi, menunjukkan persentase gerakan yang dapat dijelaskan dengan regresi linier.Nilai R2 terletak antara 0 – 1, dan kecocokan model dikatakan lebih baik kalau R2 semakin mendekati 1 (validitas uptrend atau downtrend makin valid) Volatility (+/-%) : Besaran volatilitas normal positif/negatif dari pergerakan harga harian selama harga saham bergerak normal pada trend channel dalam persentase. Volatility (+/- point or Rp) : Besaran volatilitas normal positifl/negatif dari pergerakan harga harian selama harga saham bergerak dalam periode analisis.
Created with AmiBroker - adv anced charting and technical analy sis sof tware. http://www.amibroker.com
_____ 7,643.1
_____ 7,267.0
7,441.7
Charoen Pokphand [ CPIN.JK ] - Daily - 1/31/2019
Prev. Avg. Price: 7,441.7
R-Squared: 0.8950
Period: 57
Std.Dev: 1.63
Volatility (+) : 0.0271
Volatility (-) : -0.0235
V-Ratio : 1.15
Chg.: -2.63%
7,400
22
CPIN.JK - Volume = 40,785,600.00 40,785,600
Created with AmiBroker - adv anced charting and technical analy sis sof tware. http://www.amibroker.com
_____ 8,123.6
_____ 7,370.0
7,691.7
Charoen Pokphand [ CPIN.JK ] - Weekly - 1/31/2019
Prev. Avg. Price: 7,691.7
R-Squared: 0.8989
Period: 35
Std.Dev: 1.64
Volatility (+) : 0.0562
Volatility (-) : -0.0418
V-Ratio : 1.34
Chg.: -9.20%
7,400
14 2019
CPIN.JK - Volume = 81,153,696.00 81,153,696
Created with AmiBroker - adv anced charting and technical analy sis sof tware. http://www.amibroker.com
_____ 8,505.6
_____ 7,263.17,708.3
Charoen Pokphand [ CPIN.JK ] - Monthly -
Prev. Avg. Price: 7,708.3
R-Squared: 0.5028
Period: 30
Std.Dev:
Volatility (+) : 0.1034
Volatility (-) : -0.0578
V-Ratio : 1.79
Chg.: 2.42%
7,400
Oct 2019
CPIN.JK - Volume = 220,217,312.00 220,217,312
1 Februari, 2019
15
Embun Pagi
Mirae Asset Sekuritas Indonesia
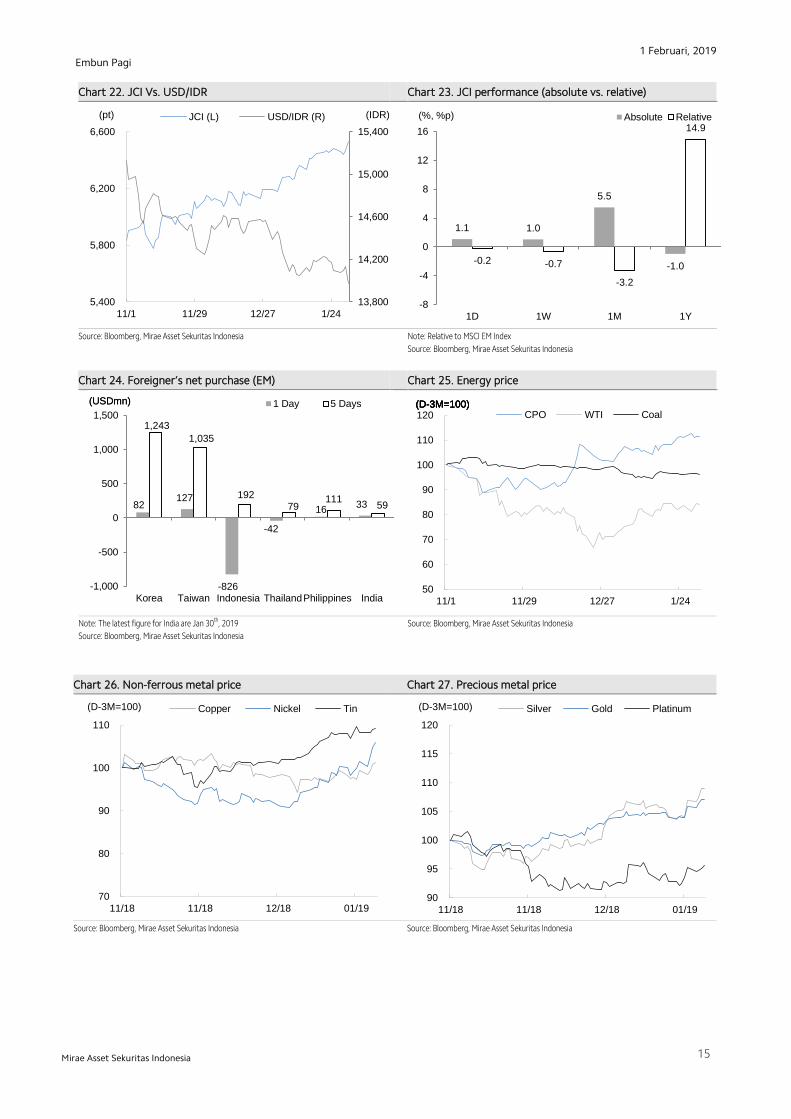
Chart 22. JCI Vs. USD/IDR Chart 23. JCI performance (absolute vs. relative)
Source: Bloomberg, Mirae Asset Sekuritas Indonesia
Note: Relative to MSCI EM Index
Source: Bloomberg, Mirae Asset Sekuritas Indonesia
Chart 24. Foreigner’s net purchase (EM) Chart 25. Energy price
V
Note: The latest figure for India are Jan 30th, 2019
Source: Bloomberg, Mirae Asset Sekuritas Indonesia
Source: Bloomberg, Mirae Asset Sekuritas Indonesia
Chart 26. Non-ferrous metal price Chart 27. Precious metal price
Source: Bloomberg, Mirae Asset Sekuritas Indonesia Source: Bloomberg, Mirae Asset Sekuritas Indonesia
13,800
14,200
14,600
15,000
15,400
5,400
5,800
6,200
6,600
11/1 11/29 12/27 1/24
(IDR) (pt) JCI (L) USD/IDR (R)
1.1 1.0
5.5
-1.0 -0.2 -0.7
-3.2
14.9
-8
-4
0
4
8
12
16
1D 1W 1M 1Y
Absolute Relative(%, %p)
82 127
-826
-42
16 33
1,243
1,035
192 79
111 59
-1,000
-500
0
500
1,000
1,500
Korea Taiwan Indonesia ThailandPhilippines India
1 Day 5 Days (USDmn) (USDmn)
80
90
100
110
6/27 7/25 8/22 9/19
CPO WTI Coal(D-3M=100) (D-3M=100)
50
60
70
80
90
100
110
120
11/1 11/29 12/27 1/24
CPO WTI Coal(D-3M=100) (D-3M=100) (D-3M=100) (D-3M=100)
70
80
90
100
110
11/18 11/18 12/18 01/19
(D-3M=100) Copper Nickel Tin
90
95
100
105
110
115
120
11/18 11/18 12/18 01/19
(D-3M=100) Silver Gold Platinum

1 Februari, 2019
16
Embun Pagi
Mirae Asset Sekuritas Indonesia
Table. Key valuation metrics
Company Name Ticker Price Market Cap Price Performance (%) P/E(X)* P/B(X)* ROE(%)*
(IDR) (IDRbn) 1D 1W 1M 1Y FY18 FY19 FY18 FY19 FY18 FY19
Jakarta Composite Index JCI 6,533 7,440,039 1.1 1.0 5.5 -1.0 15.8 14.1 2.3 2.1 17.6 1.2
FINANCIALS
Bank Central Asia BBCA 28,175 694,655 2.1 3.2 8.4 20.5 27.1 23.7 4.6 4.1 18.2 18.2
Bank Mandiri Persero BMRI 7,450 347,667 2.8 -0.3 1.0 -9.1 13.8 14.5 1.9 1.9 14.4 13.9
Bank Rakyat Indonesia Persero BBRI 3,850 474,881 2.7 1.6 5.2 4.1 13.8 14.6 2.4 2.5 18.5 18.4
Bank Negara Indonesia Persero BBNI 9,075 169,237 0.8 0.8 3.1 -2.7 10.9 11.1 1.5 1.6 14.5 14.6
Bank Tabungan Negara Persero BBTN 2,740 29,017 2.6 2.2 7.9 -24.1 21.0 18.4 2.1 2.0 10.5 11.2
CONSUMER
HM Sampoerna HMSP 3,830 445,498 0.8 3.2 3.2 -19.9 33.8 30.0 12.8 11.9 38.1 40.9
Gudang Garam GGRM 83,650 160,950 0.8 1.3 0.0 2.3 19.7 16.8 3.5 3.2 18.5 19.5
Indofood CBP Sukses Makmur ICBP 10,775 125,657 0.0 -0.7 3.1 23.9 28.6 26.3 5.7 5.2 20.8 20.5
Indofood Sukses Makmur INDF 7,750 68,048 0.6 -0.3 4.0 0.6 16.6 15.0 2.0 1.9 12.1 12.4
Kalbe Farma KLBF 1,600 75,000 -0.6 0.0 5.3 -5.0 30.5 29.0 5.1 4.7 17.7 17.0
Unilever Indonesia UNVR 50,000 381,500 1.9 1.9 10.1 -8.1 38.0 47.8 82.4 60.4 141.8 139.8
AGRICULTURAL
Astra Agro Lestari AALI 14,000 26,946 0.2 6.1 18.4 7.5 18.0 15.1 1.4 1.4 7.6 8.6
PP London Sumatera Indonesia LSIP 1,470 10,030 0.7 1.7 17.6 9.7 19.3 16.0 1.2 1.1 5.8 7.1
Sawit Sumbermas Sarana SSMS 1,185 11,287 -0.8 -0.8 -5.2 -20.5 20.1 33.9 2.6 2.5 12.8 7.3
INFRASTRUCTURE
XL Axiata EXCL 2,170 23,193 2.8 -6.9 9.6 -26.2 273.2 41.2 1.1 1.0 0.4 2.5
Jasa Marga JSMR 4,920 35,709 2.1 1.0 15.0 -12.1 15.9 17.3 2.0 1.9 12.4 10.7
Perusahaan Gas Negara PGAS 2,570 62,301 1.6 7.5 21.2 2.4 18.4 16.7 1.5 1.3 8.2 8.3
Tower Bersama Infrastructure TBIG 4,920 22,294 0.0 3.1 36.7 -19.0 23.8 19.6 6.9 6.3 29.0 31.4
Telekomunikasi Indonesia TLKM 3,900 386,343 1.0 1.0 4.0 -1.1 19.7 17.3 3.9 3.6 19.5 20.7
Soechi Lines SOCI 168 1,186 0.0 2.4 28.2 -39.6 #N/A N/A
#N/A N/A #N/A N/A
#N/A N/A
#N/A N/A
#N/A N/A Garuda Indonesia GIAA 454 11,753 12.4 26.8 52.3 44.6 #N/A
N/A #N/A
N/A 1.2 1.4 -12.1 -13.1
BASIC-INDUSTRIES
Semen Indonesia SMGR 12,675 75,182 1.0 -4.0 10.2 18.5 30.6 27.0 2.5 2.4 8.1 8.8
Charoen Pokphand Indonesia CPIN 7,400 121,345 -2.6 -9.5 2.4 117.0 26.9 25.0 6.3 5.4 25.2 22.8
Indocement Tunggal Prakarsa INTP 19,225 70,772 0.3 -3.4 4.2 -12.1 65.5 48.9 3.2 3.1 5.3 6.9
Japfa Comfeed Indonesia JPFA 2,930 34,359 -3.9 19.6 36.3 100.7 14.5 13.1 3.2 2.7 22.1 21.1
MINING
Indo Tambangraya Megah ITMG 22,800 25,762 4.8 2.2 12.6 -26.0 7.0 7.0 1.8 1.8 27.0 26.1
Adaro Energy ADRO 1,390 44,460 3.0 0.7 14.4 -42.1 7.1 7.1 0.9 0.8 12.0 10.9
Aneka Tambang ANTM 965 23,190 1.6 7.8 26.1 6.0 29.3 19.8 1.2 1.2 3.9 6.2
Vale Indonesia INCO 3,850 38,255 3.5 9.1 18.1 1.3 39.4 25.1 1.5 1.4 4.0 6.2
Tambang Batubara Bukit Asam PTBA 4,310 49,654 0.2 -1.8 0.2 29.0 9.3 9.2 2.9 2.6 35.5 30.0
TRADE
United Tractors UNTR 25,725 95,958 -0.7 -3.4 -5.9 -33.7 8.8 8.0 1.8 1.6 22.0 21.1
AKR Corporindo AKRA 5,250 21,077 4.0 11.9 22.4 -12.5 23.8 20.6 2.5 2.4 13.1 12.4
Global Mediacom BMTR 368 5,524 -1.1 4.5 52.1 -49.9 #N/A N/A
#N/A N/A
#N/A N/A
#N/A N/A #N/A N/A
#N/A N/A Matahari Department Store LPPF 7,000 20,425 3.3 3.3 25.0 -37.8 11.8 9.9 6.2 5.1 66.7 61.6
Media Nusantara Citra MNCN 845 12,063 3.0 -1.7 22.5 -46.2 8.4 7.3 1.2 1.1 14.9 15.5
Matahari Putra Prima MPPA 182 1,370 1.7 -5.2 19.7 -62.4 #N/A N/A
#N/A N/A
#N/A N/A #N/A N/A #N/A N/A
#N/A N/A Surya Citra Media SCMA 1,885 27,562 0.5 -4.8 0.8 -30.4 18.2 16.6 5.7 5.1 34.2 32.5
Siloam International Hospital SILO 3,220 5,235 -1.8 -2.7 -10.3 -63.8 107.9 91.8 0.8 0.8 0.8 1.0
PROPERTY
Bumi Serpong Damai BSDE 1,330 25,598 0.4 -4.7 6.0 -29.1 13.8 11.2 0.9 0.9 7.0 8.0
Adhi Karya ADHI 1,630 5,804 0.9 -4.1 2.8 -27.2 7.5 5.9 0.9 0.8 11.9 12.9
Alam Sutera Relaty ASRI 356 6,995 -0.6 2.3 14.1 -13.6 6.2 5.2 0.7 0.6 11.1 12.5
Ciputra Development CTRA 975 18,096 10.8 -1.5 -3.5 -28.6 17.6 16.6 1.2 1.1 7.0 7.0
Lippo Karawaci LPKR 280 6,464 -2.8 -3.4 10.2 -50.0 5.6 7.4 0.3 0.3 5.6 4.9
Pembangunan Perumahan PTPP 2,340 14,508 7.3 2.6 29.6 -26.4 9.2 7.9 1.1 1.0 12.5 13.2
Pakuwon Jati PWON 650 31,304 -1.5 -7.8 4.8 -5.8 13.8 12.6 2.5 2.1 19.2 17.6
Summarecon Agung SMRA 1,035 14,932 4.0 0.5 28.6 -13.0 41.7 36.9 2.1 2.0 5.4 5.8
Wijaya Karya WIKA 1,895 16,998 3.6 0.8 14.5 -7.1 10.9 9.3 1.2 1.0 10.8 11.7
Waskita Karya WSKT 1,975 26,809 6.8 0.0 17.6 -29.5 6.0 6.2 1.2 1.0 20.7 16.7
MISCELLANEOUS
Astra International ASII 8,450 342,086 1.2 0.3 2.7 -1.5 15.4 14.0 2.5 2.2 16.5 16.3
Source: Bloomberg, Mirae Asset Sekuritas Indonesia
*Note: Valuation metrics based on Bloomberg consensus estimates
1 Februari, 2019
17
Embun Pagi
Mirae Asset Sekuritas Indonesia
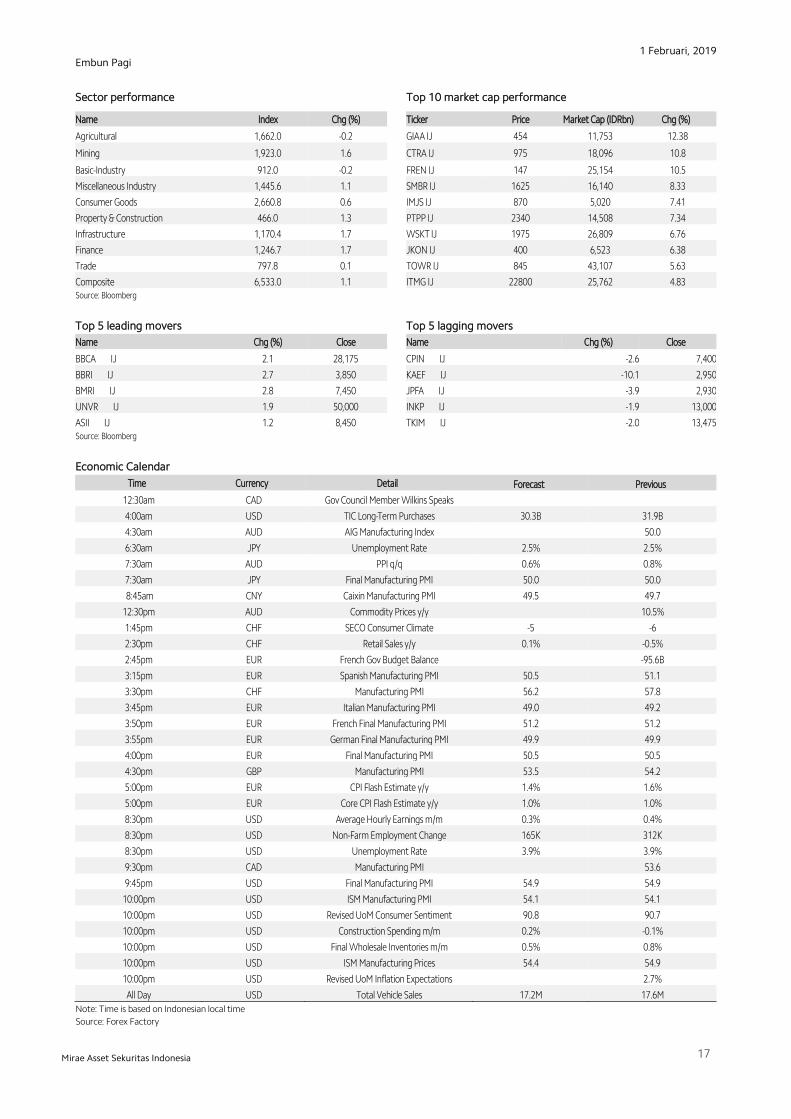
Sector performance Top 10 market cap performance
Name Index Chg (%) Ticker Price Market Cap (IDRbn) Chg (%)
Agricultural 1,662.0 -0.2 GIAA IJ 454 11,753 12.38
Mining 1,923.0 1.6
CTRA IJ 975 18,096 10.8
Basic-Industry 912.0 -0.2 FREN IJ 147 25,154 10.5
Miscellaneous Industry 1,445.6 1.1 SMBR IJ 1625 16,140 8.33
Consumer Goods 2,660.8 0.6 IMJS IJ 870 5,020 7.41
Property & Construction 466.0 1.3
PTPP IJ 2340 14,508 7.34
Infrastructure 1,170.4 1.7 WSKT IJ 1975 26,809 6.76
Finance 1,246.7 1.7 JKON IJ 400 6,523 6.38
Trade 797.8 0.1 TOWR IJ 845 43,107 5.63
Composite 6,533.0 1.1 ITMG IJ 22800 25,762 4.83 Source: Bloomberg
Top 5 leading movers Top 5 lagging movers
Name Chg (%) Close Name Chg (%) Close
BBCA IJ 2.1 28,175 CPIN IJ -2.6 7,400
BBRI IJ 2.7 3,850 KAEF IJ -10.1 2,950
BMRI IJ 2.8 7,450 JPFA IJ -3.9 2,930
UNVR IJ 1.9 50,000 INKP IJ -1.9 13,000
ASII IJ 1.2 8,450 TKIM IJ -2.0 13,475 Source: Bloomberg
Economic Calendar
Time Currency Detail Forecast Previous
12:30am CAD Gov Council Member Wilkins Speaks
4:00am USD TIC Long-Term Purchases 30.3B 31.9B
4:30am AUD AIG Manufacturing Index 50.0
6:30am JPY Unemployment Rate 2.5% 2.5%
7:30am AUD PPI q/q 0.6% 0.8%
7:30am JPY Final Manufacturing PMI 50.0 50.0
8:45am CNY Caixin Manufacturing PMI 49.5 49.7
12:30pm AUD Commodity Prices y/y 10.5%
1:45pm CHF SECO Consumer Climate -5 -6
2:30pm CHF Retail Sales y/y 0.1% -0.5%
2:45pm EUR French Gov Budget Balance -95.6B
3:15pm EUR Spanish Manufacturing PMI 50.5 51.1
3:30pm CHF Manufacturing PMI 56.2 57.8
3:45pm EUR Italian Manufacturing PMI 49.0 49.2
3:50pm EUR French Final Manufacturing PMI 51.2 51.2
3:55pm EUR German Final Manufacturing PMI 49.9 49.9
4:00pm EUR Final Manufacturing PMI 50.5 50.5
4:30pm GBP Manufacturing PMI 53.5 54.2
5:00pm EUR CPI Flash Estimate y/y 1.4% 1.6%
5:00pm EUR Core CPI Flash Estimate y/y 1.0% 1.0%
8:30pm USD Average Hourly Earnings m/m 0.3% 0.4%
8:30pm USD Non-Farm Employment Change 165K 312K
8:30pm USD Unemployment Rate 3.9% 3.9%
9:30pm CAD Manufacturing PMI 53.6
9:45pm USD Final Manufacturing PMI 54.9 54.9
10:00pm USD ISM Manufacturing PMI 54.1 54.1
10:00pm USD Revised UoM Consumer Sentiment 90.8 90.7
10:00pm USD Construction Spending m/m 0.2% -0.1%
10:00pm USD Final Wholesale Inventories m/m 0.5% 0.8%
10:00pm USD ISM Manufacturing Prices 54.4 54.9
10:00pm USD Revised UoM Inflation Expectations 2.7%
All Day USD Total Vehicle Sales 17.2M 17.6M
Note: Time is based on Indonesian local time
Source: Forex Factory

1 Februari, 2019
18
Embun Pagi
Mirae Asset Sekuritas Indonesia
Disclaimers
This report is prepared strictly for private circulation only to clients of PT Mirae Asset Sekuritas Indonesia (MASI). It is purposed only to person having
professional experience in matters relating to investments. The information contained in this report has been taken from sources which we deem reliable. No
warranty (express or implied) is made to the accuracy or completeness of the information. All opinions and estimates included in this report constitute our
judgments as of this date, without regards to its fairness, and are subject to change without notice. However, none of MASI and/or its affiliated companies
and/or their respective employees and/or agents makes any representation or warranty (express or implied) or accepts any responsibility or liability as to, or
in relation to, the accuracy or completeness of the information and opinions contained in this report or as to any information contained in this report or any
other such information or opinions remaining unchanged after the issue thereof. We expressly disclaim any responsibility or liability (express or implied) of
MASI, its affiliated companies and their respective employees and agents whatsoever and howsoever arising (including, without limitation for any claims,
proceedings, action, suits, losses, expenses, damages or costs) which may be brought against or suffered by any person as a results of acting in reliance upon
the whole or any part of the contents of this report and neither MASI, its affiliated companies or their respective employees or agents accepts liability for any
errors, omissions or misstatements, negligent or otherwise, in the report and any liability in respect of the report or any inaccuracy therein or omission there
from which might otherwise arise is hereby expresses disclaimed.
This document is not an offer to sell or a solicitation to buy any securities. This firms and its affiliates and their officers and employees may have a position,
make markets, act as principal or engage in transaction in securities or related investments of any company mentioned herein, may perform services for or
solicit business from any company mentioned herein, and may have acted upon or used any of the recommendations herein before they have been provided
to you. © PT Mirae Asset Sekuritas Indonesia 2016.