vortex measurement at bell-shaped ... - journalarticle.ukm.myjournalarticle.ukm.my/13797/1/11.pdf,,...
TRANSCRIPT
Jurnal Kejuruteraan 30(2) 2018: 209-217http://dx.doi.org/10.17576/jkukm-2018-30(2)
Vortex Measurement at Bell-Shaped Pump Inlet Using Particle Image Velocimetry
(Pengukuran Pusaran pada Inlet Pam Berbentuk Loceng dengan Menggunakan Velosimeter Imej Zarah)
Muhammad Azhar Akbar Batcha, Tajul Ariffin Norizan, Zulkhairi Zainol Abidin & Zambri Harun*Centre for Integrated Design of Advanced Mechanical System,, Universiti Kebangsaan Malaysia, 43600 Bangi, Malaysia
Wan Hanna Melini Wan MohtarSustainable and Smart Township Research Centre, Universiti Kebangsaan Malaysia, 43600 Bangi, Malaysia
ABSTRACT
The vortex formed at the pump intake is known to be the main factor affecting the performance of a pump and it contributes directly to the increase of energy consumption. This study was aimed at obtaining an in-depth visualization and identifying the characteristics of the vortices generated by the installation of a bell-shaped suction inlet in a pump-induced flow using particle image velocimetry (PIV). A complementary metal-oxide semiconductor (CMOS) camera was used to capture images of the illuminated bubbles in a sump pump model. The PIV images were analysed using PIVlab, which provided representations of the 2-D plane velocities and vorticities around the inlet of the pump. The measurements were taken at four different planes that were coaxial with the bell circumference below the bell inlet. The results showed that the diameter of the vortex structure became smaller as it approached the bell inlet. Higher values of vorticity were observed within the vortex core, which conformed to the characteristics of a vortex formation. The velocity profiles exhibited the proportionality of the velocity against the radius of the vortex, which categorized this as a forced vortex. The findings from the study will be utilized by the Department of Irrigation and Drainage (DID) Malaysia to develop remedial measures for problems related to the formation of vortices in sump pumps.
Keywords: Particle image velocimetry (PIV); Submerged vortex
ABSTRAK
Pusaran yang terbentuk di dalam muka sauk telah dikenal pasti sebagai punca utama yang menjejaskan prestasi pam dan yang paling utama penggunaan tenaga. Kajian ini dijalankan bertujuan mendapatkan penggambaran terperinci serta mengenal pasti ciri-ciri pusaran yang terbentuk kesan daripada pemasangan paip sedutan berbentuk loceng menggunakan velosimeter imej zarah yang lebih dikenali sebagai particle image velocimetry (PIV). Sebuah kamera CMOS telah mengambil imej buih yang disinari cahaya laser di dalam sebuah model muka sauk yang digunakan sebagai zarah surihan aliran membolehkan imej PIV distruktur semula kepada halaju, kepusaran dan lain-lain sifat aliran yang relevan dengan bantuan perisian PIV. Matlab dan PIVlab digunakan sebagai perisian pemprosesan imej untuk mengira kekuatan pusaran, magnitud dan vektor halaju, magnitud dan vektor kepusaran dan aliran garis arusdi dalam bingkai siasatan PIV. Pengukuran telah diambil pada empat satah berbeza yang sepaksi dengan lilitan bulatan loceng di bawah loceng sedutan. Keputusan menunjukkan bahawa diameter struktur pusaran semakin kecil apabila menghampiri loceng sedutan. Nilai kepusaran yang tinggi telah diukur di dalam teras pusaran yang mengakuri pembentukan sebuah pusaran. Profil halaju telah menunjukkan bahawa halaju berkadar terus dengan jejari pusaran dan ini membuktikan pusaran yang terbentuk adalah pusaran paksaan. Dapatan daripada kajian ini akan digunakan oleh Jabatan Pengairan dan Saliran (JPS) Malaysia untuk membangunkan langkah-langkah penyelesaian kepada masalah berkaitan pembentukan pusaran di dalam muka sauk.
Kata kunci: Velosimeter imej zarah; pusaran tenggelam
INTRODUCTION
Heavy rains occasionally brought extreme floods to low land areas which resulted in damages to property and sometimes casualties. To mitigate the occurrence of these extreme floods, pumping stations are built to reroute the excess water to the designated floodwater containment areas. Various problems associated to hydraulics in the floodwater could occur during pump operations which can affect the effectiveness of the pump in handling the pumped fluid such as cavitation,
vibration and eventually exacerbate head losses. Large-scale flood can occur even in developed countries when unexpected large volume of water flowed into a drainage system which was not designed for such volume.
Large-scale eddies and vortices formed due to high turbulence intensity during an extreme flood event (Clark 1967). Such problems are mainly undesirable particularly at channel towards pump intake, as the non-uniformity of the flow increases (and directly accelerates the formation of vortex) towards the pump sump. Mohd Nazri and Sharil
Artikel 11.indd 209 10/10/2018 11:24:35
210
(2017), in their aquatic vegetation study concluded that that longitudinal velocity magnitude decreased significantly with slight increase in vegetation density. They also found that the turbulent kinetic energy (TKE) and turbulent intensities were both greater in higher densities vegetated channel compared to the lower densities. The generation of vortex began to be observed by Ting and Kim (1994) on a submerged rectangular object using physical modelling. In their study of properties of vortices, Kida et al. (2002) found that energy dissipation took place more actively in the layers than in the central cores and concurred that vortex was one of the major components in the turbulent flow.
Extensive studies have been carried out by researchers in the past decades to determine the factors that contributed to the occurrence of vortex in pump sump. For example, Bauer and Nakato (1997) studied the flow field in a scaled pump sump model with multiple pumps to observe vortex formation near the pump inlet, in which it was proven that the installation of dividing walls between the pumps had straightened the intake flow and thus significantly reduced the vortex formation. Rajendran et al. (1998) measured the vortices occurred in a pump sump model set using particle image velocimetry (PIV) to evaluate the size, location and strength of the formed vortices. The results of the study were very useful for validation of numerical modelling of vortices used in simulation of flow in pump sump. The experiment also demonstrated the potential of PIV in obtaining quantitative information on vortices formed in pump sump. Nagahara et al. (2003) comprehensively investigated the velocity distribution around vortex cavities in pump suction through PIV measurements. Johansson (2005) conducted model studies on the ground through physical testing and by using computational fluid dynamics (CFD) and showed how hydraulic models could be used to identify unacceptable flow conditions, such as surface swirls, high rotations, pre-rolls, and velocity distribution. The outcome of the study was used to improve hydraulic performance of pumps with similar
settings. A recent CFD study by Norizan et al. (2018) shows that the vorticity at the pump inlet could be reduced if a floor splitter is installed at the sump, just under the inlet pump.
The purpose of this study is to analyze the characteristics of vortices formed near a bell-shaped pump suction inlet, in a steady flow channel. The analysis was carried out based on the visualization of the vortices in the form of velocity and vorticity distribution plots and flow streamlines. The captured images are then processed using a software for PIV image processing called PIVLab, a package of Matlab.
METHODOLOGY
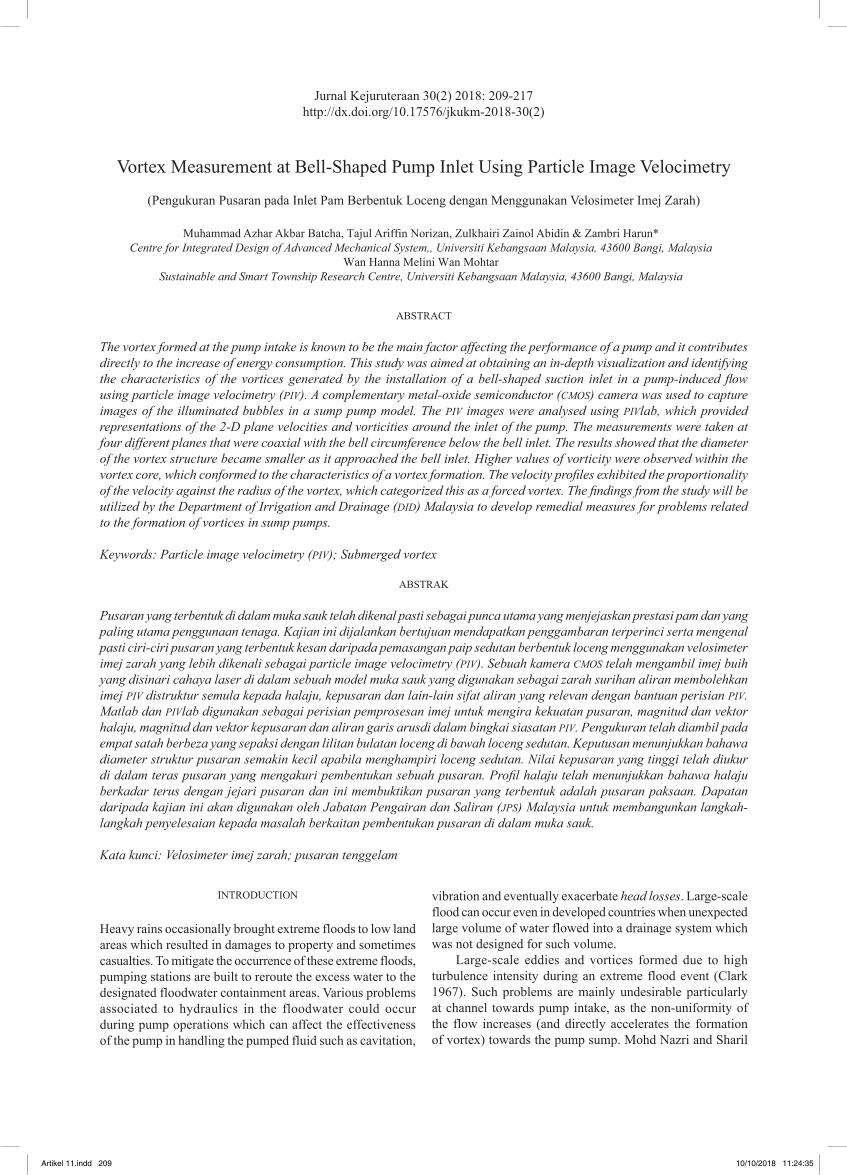
A rectangular pump sump model with a single pump intake was designed in-house. The pump inlet is submerged at the end of a straight water channel called the flume ensuring a steady-state flow as achieved coming into the sump. The flume was made of mild steel structure for 1.65 m long from the inlet before connected to an acrylic made sump for visualization purpose. The system is a closed loop in which the water drawn through the suction pipe is pumped back into a 1 m × 1 m × 1.5 m reservoir, which acts as continuous flow feeder into the channel. The general arrangement is illustrated in Figure 1.
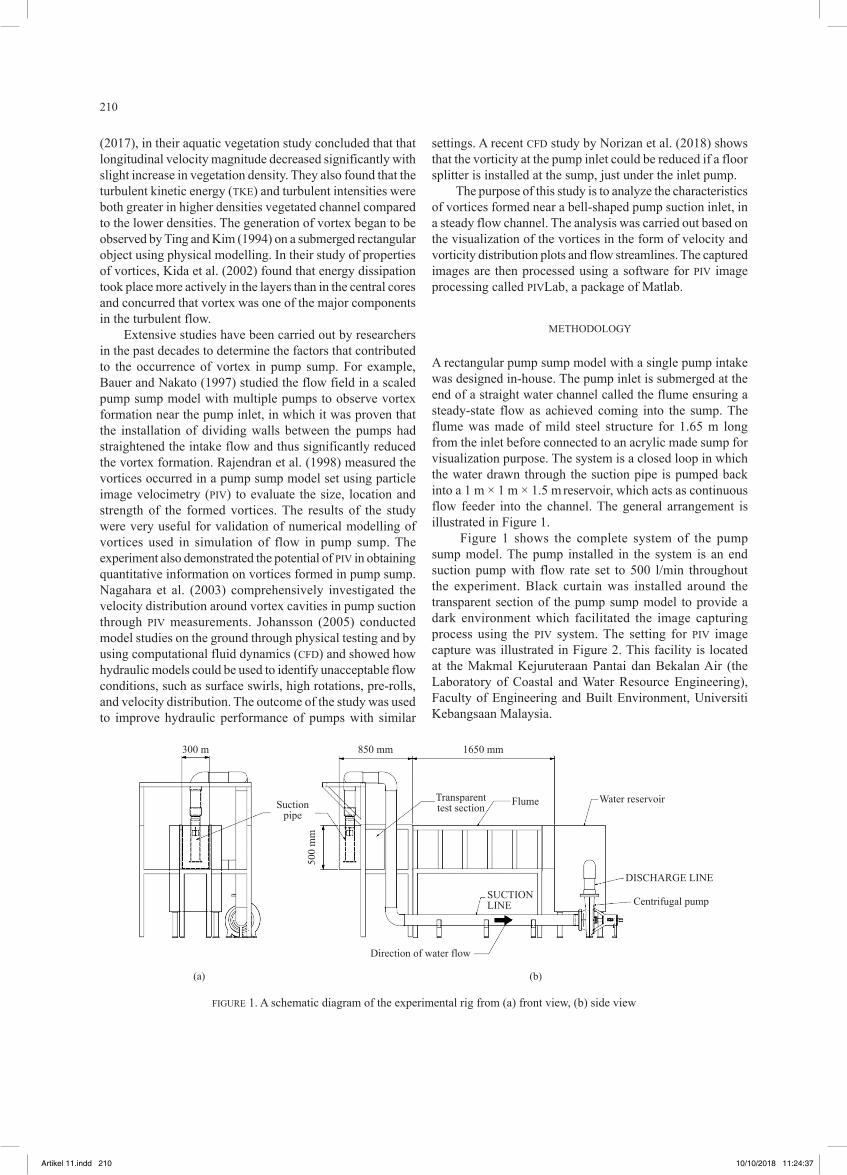
Figure 1 shows the complete system of the pump sump model. The pump installed in the system is an end suction pump with flow rate set to 500 l/min throughout the experiment. Black curtain was installed around the transparent section of the pump sump model to provide a dark environment which facilitated the image capturing process using the PIV system. The setting for PIV image capture was illustrated in Figure 2. This facility is located at the Makmal Kejuruteraan Pantai dan Bekalan Air (the Laboratory of Coastal and Water Resource Engineering), Faculty of Engineering and Built Environment, Universiti Kebangsaan Malaysia.
FIGURE 1. A schematic diagram of the experimental rig from (a) front view, (b) side view
300 m 850 mm
500
mm
1650 mm
Suction pipe
Transparenttest section
Water reservoir
Direction of water flow
DISCHARGE LINESUCTIONLINE Centrifugal pump
Flume
(a) (b)
Artikel 11.indd 210 10/10/2018 11:24:37
211
Water was filled in the reservoir up to the required level. During the process, the drain plug was closed to prevent water from leaking. Air must be extracted from the system before operating the pump as it operates by pressure difference. The extraction of air in the pipeline was accomplished with a process called priming. During this process, the regulating gate valve must be kept in closed position to ensure the air trapped exited only through the suction pipe. After the air has stopped flowing out from the suction pipe, the priming was stopped and subsequently the valve at the priming plug was closed. Next, the regulating gate valve was opened before operating the pump. The suction process at the suction pipe was observed. Vortex would be visible in the vicinity of the pipe inlet if the pump has successfully discharged all trapped bubbles in the pipeline, usually after a few minutes. If no vortex was observed, the suction flow can be visualized by adding tracer particles or food dye in the water and then the direction of flow could be observed.
A 532 nm Nd-Yag laser with double pulse at 15 Hz was used to illuminate the particles within the fluid. The laser plane is placed at near-pump intake; giving a 2-D measurement plane to the camera. The camera was placed under the acrylic tank to capture the image from respective direction. This configuration is vital to obtain the window of the resulting vortex image which was captured with the resolution of 2700 × 1600 pixels. The images were captured at 4 measurement levels i.e. at 3.5 cm, 4.0 cm, 5.5 cm and 7.0 cm from the base of the sump. The CMOS camera captured the image pairs which were subsequently stored in a computer. These images were further analyzed by using PIVLab, a software package of Matlab to obtain flow statistics such as
velocity magnitudes, vorticities, vortex strengths, and flow streamlines visualisation. Micro bubbles that were present in the water during the experiment were used as seeding particle for the PIV measurement due to its ability to follow the flow of the fluid in the pump sump. Although micro bubbles possess different density from the fluid, it could still be used as seeding particle because the measurement was made only within the x-y plane and therefore the influence of gravity – density is negligible.
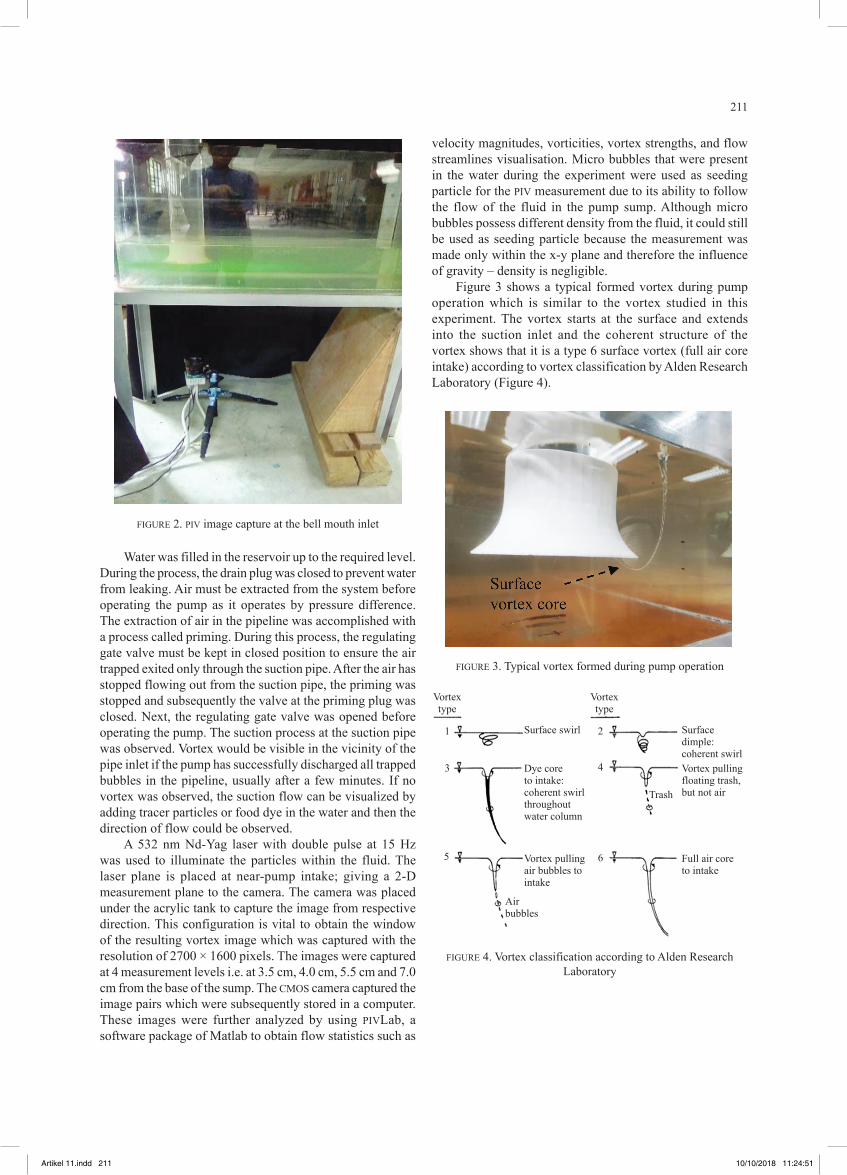
Figure 3 shows a typical formed vortex during pump operation which is similar to the vortex studied in this experiment. The vortex starts at the surface and extends into the suction inlet and the coherent structure of the vortex shows that it is a type 6 surface vortex (full air core intake) according to vortex classification by Alden Research Laboratory (Figure 4).
FIGURE 2. PIV image capture at the bell mouth inlet
FIGURE 3. Typical vortex formed during pump operation
FIGURE 4. Vortex classification according to Alden Research Laboratory
Full air coreto intake
Vortex pulling floating trash, but not air
Surface dimple:coherent swirl
21
3
5
Vortextype
Trash
Vortextype
Airbubbles
Vortex pulling air bubbles to intake
Dye core to intake: coherent swirl throughout water column
Surface swirl
4
6
Artikel 11.indd 211 10/10/2018 11:24:51
212
RESULTS AND DISCUSSION
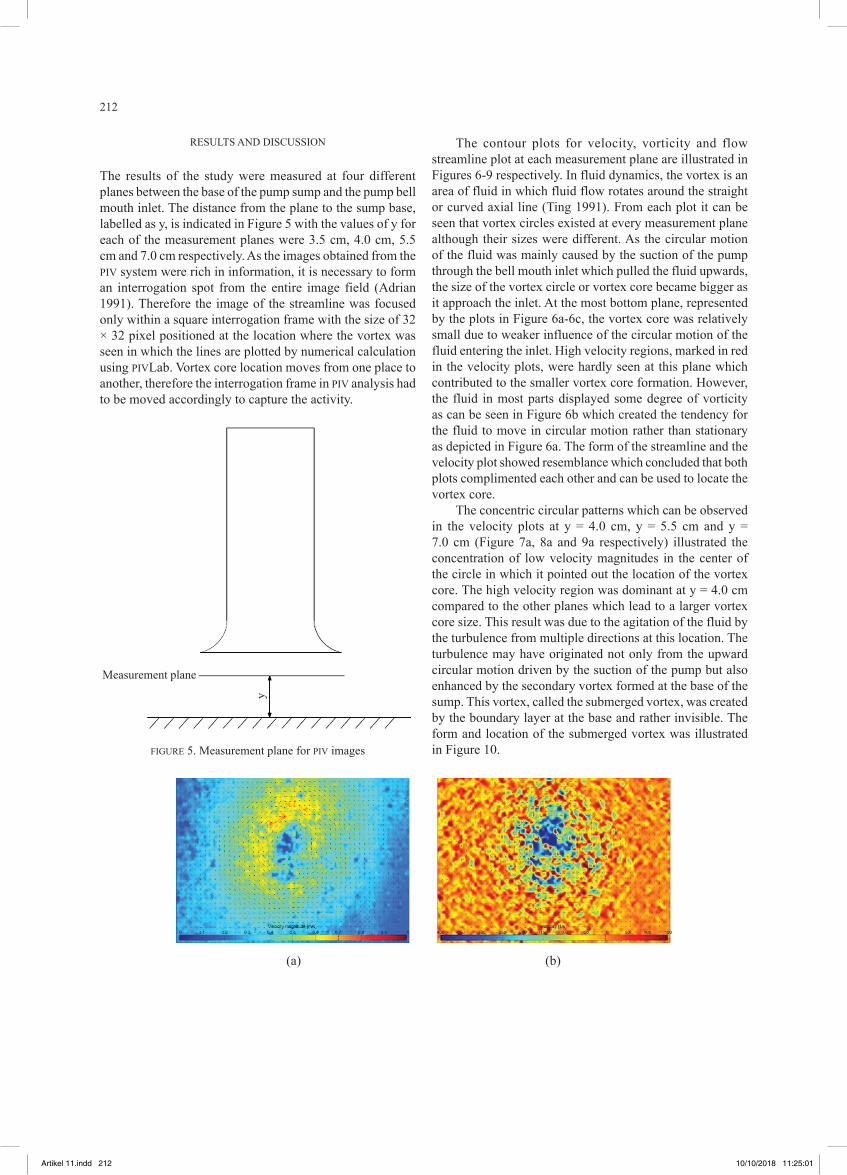
The results of the study were measured at four different planes between the base of the pump sump and the pump bell mouth inlet. The distance from the plane to the sump base, labelled as y, is indicated in Figure 5 with the values of y for each of the measurement planes were 3.5 cm, 4.0 cm, 5.5 cm and 7.0 cm respectively. As the images obtained from the PIV system were rich in information, it is necessary to form an interrogation spot from the entire image field (Adrian 1991). Therefore the image of the streamline was focused only within a square interrogation frame with the size of 32 × 32 pixel positioned at the location where the vortex was seen in which the lines are plotted by numerical calculation using PIVLab. Vortex core location moves from one place to another, therefore the interrogation frame in PIV analysis had to be moved accordingly to capture the activity.
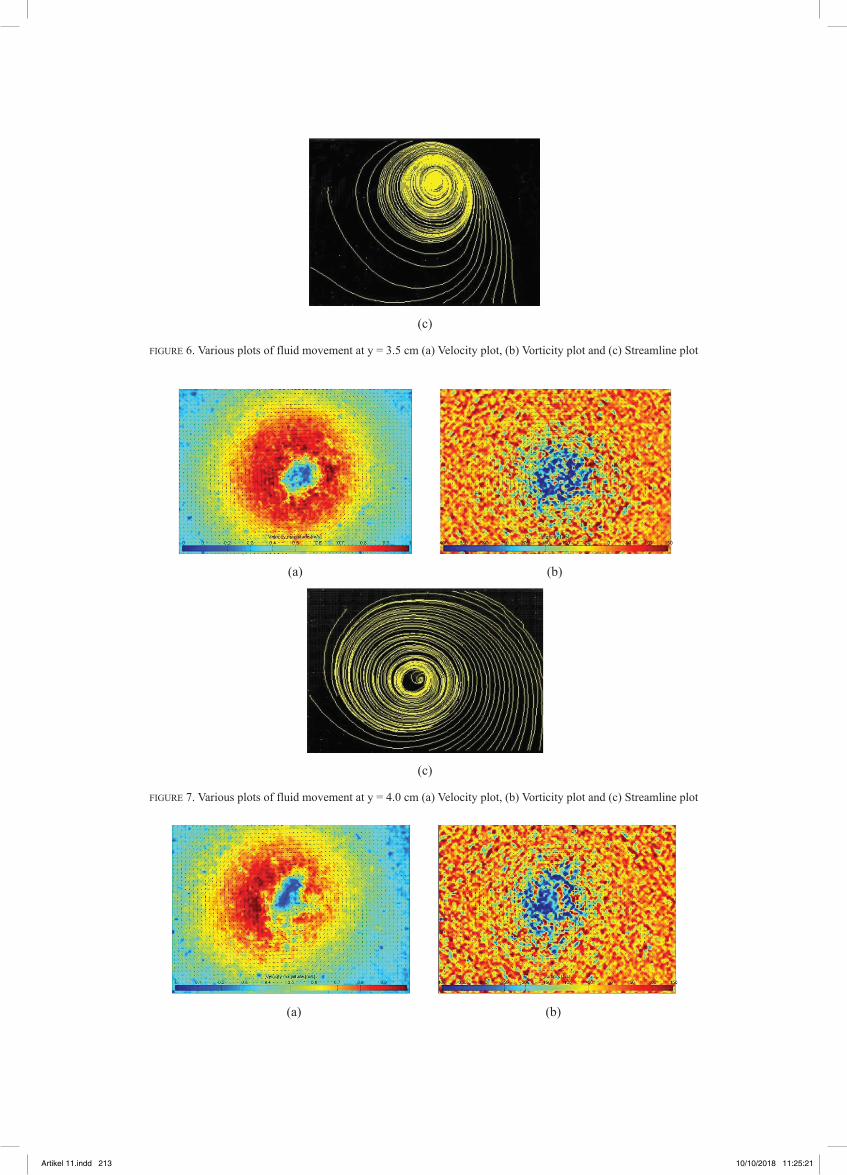
The contour plots for velocity, vorticity and flow streamline plot at each measurement plane are illustrated in Figures 6-9 respectively. In fluid dynamics, the vortex is an area of fluid in which fluid flow rotates around the straight or curved axial line (Ting 1991). From each plot it can be seen that vortex circles existed at every measurement plane although their sizes were different. As the circular motion of the fluid was mainly caused by the suction of the pump through the bell mouth inlet which pulled the fluid upwards, the size of the vortex circle or vortex core became bigger as it approach the inlet. At the most bottom plane, represented by the plots in Figure 6a-6c, the vortex core was relatively small due to weaker influence of the circular motion of the fluid entering the inlet. High velocity regions, marked in red in the velocity plots, were hardly seen at this plane which contributed to the smaller vortex core formation. However, the fluid in most parts displayed some degree of vorticity as can be seen in Figure 6b which created the tendency for the fluid to move in circular motion rather than stationary as depicted in Figure 6a. The form of the streamline and the velocity plot showed resemblance which concluded that both plots complimented each other and can be used to locate the vortex core.
The concentric circular patterns which can be observed in the velocity plots at y = 4.0 cm, y = 5.5 cm and y = 7.0 cm (Figure 7a, 8a and 9a respectively) illustrated the concentration of low velocity magnitudes in the center of the circle in which it pointed out the location of the vortex core. The high velocity region was dominant at y = 4.0 cm compared to the other planes which lead to a larger vortex core size. This result was due to the agitation of the fluid by the turbulence from multiple directions at this location. The turbulence may have originated not only from the upward circular motion driven by the suction of the pump but also enhanced by the secondary vortex formed at the base of the sump. This vortex, called the submerged vortex, was created by the boundary layer at the base and rather invisible. The form and location of the submerged vortex was illustrated in Figure 10.
Measurement plane
y
FIGURE 5. Measurement plane for PIV images
(b)(a)
Artikel 11.indd 212 10/10/2018 11:25:01
(b)
(b)
(c)
(c)
(a)
(a)
FIGURE 6. Various plots of fluid movement at y = 3.5 cm (a) Velocity plot, (b) Vorticity plot and (c) Streamline plot
FIGURE 7. Various plots of fluid movement at y = 4.0 cm (a) Velocity plot, (b) Vorticity plot and (c) Streamline plot
Artikel 11.indd 213 10/10/2018 11:25:21
214
(c)
(c)
(a) (b)
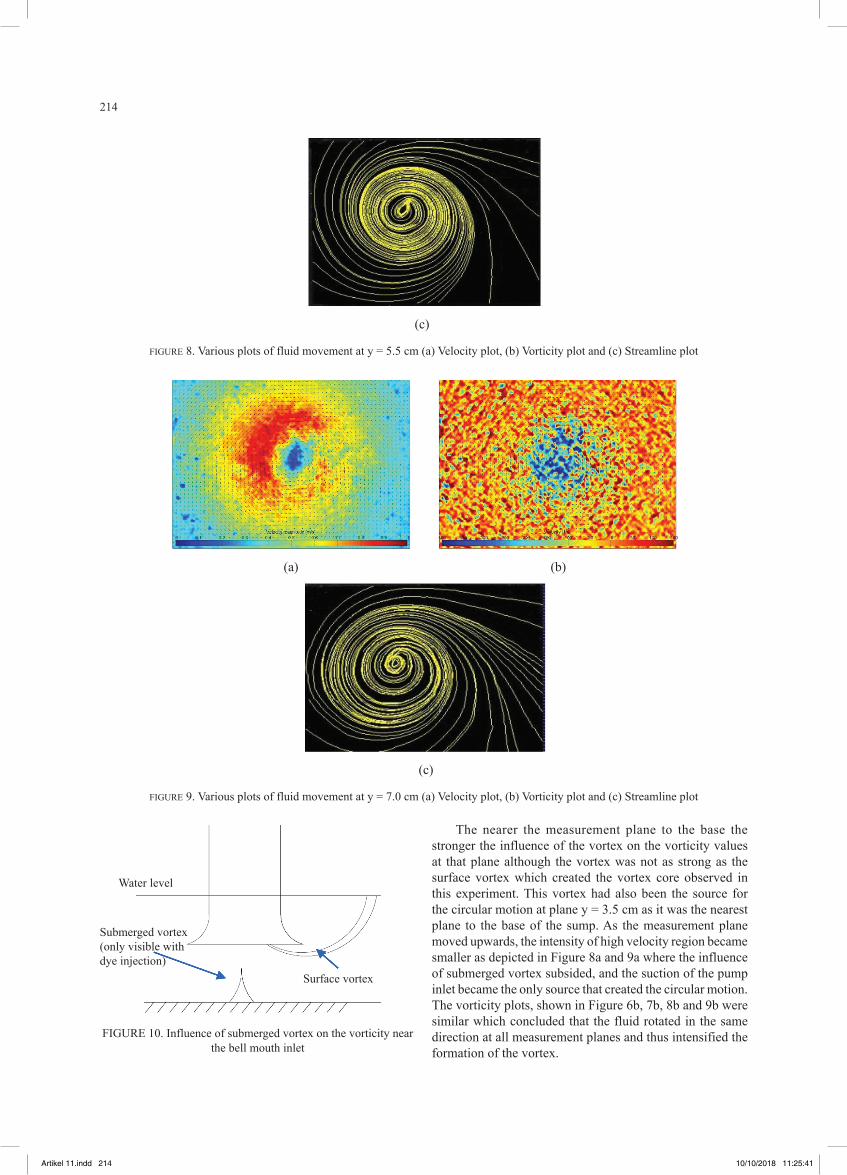
FIGURE 8. Various plots of fluid movement at y = 5.5 cm (a) Velocity plot, (b) Vorticity plot and (c) Streamline plot
FIGURE 9. Various plots of fluid movement at y = 7.0 cm (a) Velocity plot, (b) Vorticity plot and (c) Streamline plot
FIGURE 10. Influence of submerged vortex on the vorticity near the bell mouth inlet
The nearer the measurement plane to the base the stronger the influence of the vortex on the vorticity values at that plane although the vortex was not as strong as the surface vortex which created the vortex core observed in this experiment. This vortex had also been the source for the circular motion at plane y = 3.5 cm as it was the nearest plane to the base of the sump. As the measurement plane moved upwards, the intensity of high velocity region became smaller as depicted in Figure 8a and 9a where the influence of submerged vortex subsided, and the suction of the pump inlet became the only source that created the circular motion. The vorticity plots, shown in Figure 6b, 7b, 8b and 9b were similar which concluded that the fluid rotated in the same direction at all measurement planes and thus intensified the formation of the vortex.
Submerged vortex(only visible withdye injection)
Water level
Surface vortex
Artikel 11.indd 214 10/10/2018 11:25:41
215
VELOCITY AND VORTICITY PLOT ACROSS AVERAGE VORTEX CORE
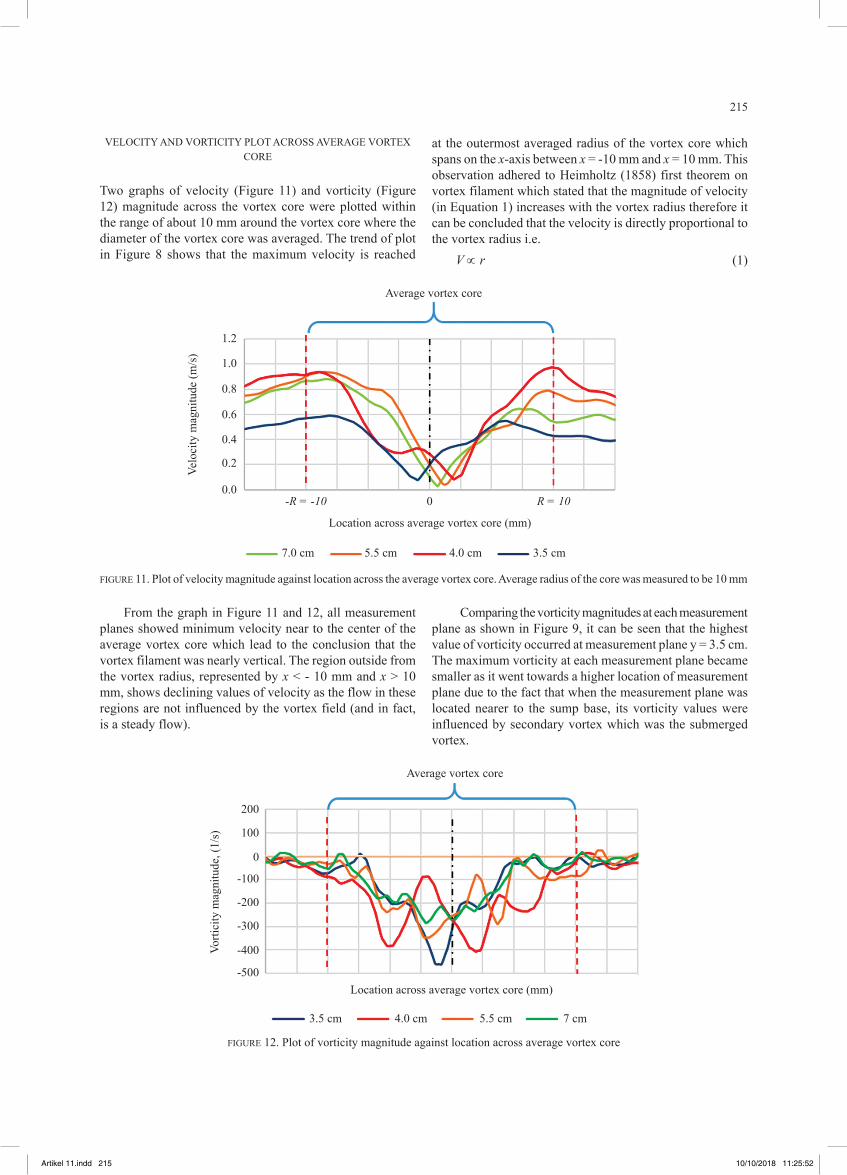
Two graphs of velocity (Figure 11) and vorticity (Figure 12) magnitude across the vortex core were plotted within the range of about 10 mm around the vortex core where the diameter of the vortex core was averaged. The trend of plot in Figure 8 shows that the maximum velocity is reached
at the outermost averaged radius of the vortex core which spans on the x-axis between x = -10 mm and x = 10 mm. This observation adhered to Heimholtz (1858) first theorem on vortex filament which stated that the magnitude of velocity (in Equation 1) increases with the vortex radius therefore it can be concluded that the velocity is directly proportional to the vortex radius i.e.
V ∝ r (1)
FIGURE 11. Plot of velocity magnitude against location across the average vortex core. Average radius of the core was measured to be 10 mm
FIGURE 12. Plot of vorticity magnitude against location across average vortex core
Average vortex core
Velo
city
mag
nitu
de (m
/s)
Location across average vortex core (mm)
-R = -100.0
7.0 cm 5.5 cm 4.0 cm 3.5 cm
0.2
0.4
0.6
0.8
1.0
1.2
Average vortex core
Vorti
city
mag
nitu
de, (
1/s)
Location across average vortex core (mm)
3.5 cm 4.0 cm 5.5 cm 7 cm
-400
-500
-300
-200
-100
0
100
200
R = 100
From the graph in Figure 11 and 12, all measurement planes showed minimum velocity near to the center of the average vortex core which lead to the conclusion that the vortex filament was nearly vertical. The region outside from the vortex radius, represented by x < - 10 mm and x > 10 mm, shows declining values of velocity as the flow in these regions are not influenced by the vortex field (and in fact, is a steady flow).
Comparing the vorticity magnitudes at each measurement plane as shown in Figure 9, it can be seen that the highest value of vorticity occurred at measurement plane y = 3.5 cm. The maximum vorticity at each measurement plane became smaller as it went towards a higher location of measurement plane due to the fact that when the measurement plane was located nearer to the sump base, its vorticity values were influenced by secondary vortex which was the submerged vortex.
Artikel 11.indd 215 10/10/2018 11:25:52
216
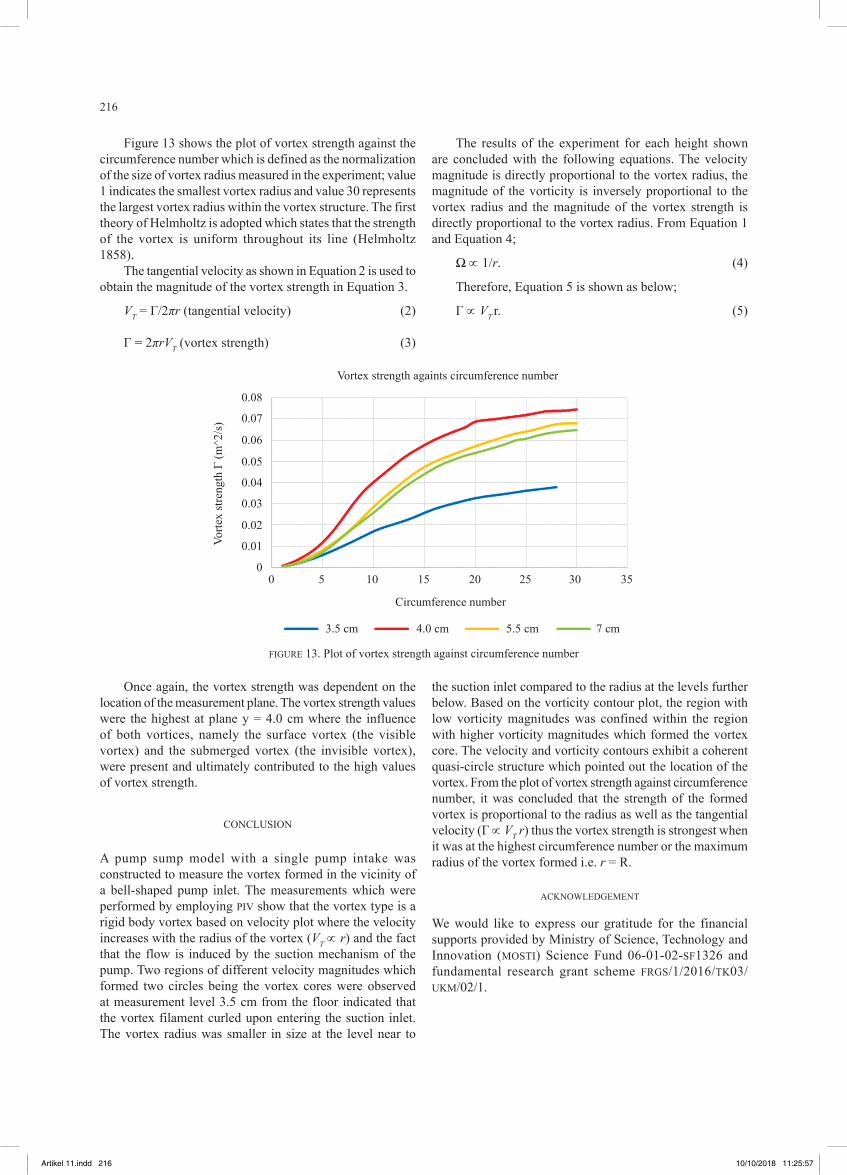
Figure 13 shows the plot of vortex strength against the circumference number which is defined as the normalization of the size of vortex radius measured in the experiment; value 1 indicates the smallest vortex radius and value 30 represents the largest vortex radius within the vortex structure. The first theory of Helmholtz is adopted which states that the strength of the vortex is uniform throughout its line (Helmholtz 1858).
The tangential velocity as shown in Equation 2 is used to obtain the magnitude of the vortex strength in Equation 3.
VT = Г/2πr (tangential velocity) (2)
Г = 2πrVT (vortex strength) (3)
The results of the experiment for each height shown are concluded with the following equations. The velocity magnitude is directly proportional to the vortex radius, the magnitude of the vorticity is inversely proportional to the vortex radius and the magnitude of the vortex strength is directly proportional to the vortex radius. From Equation 1 and Equation 4;
Ω ∝ 1/r. (4)
Therefore, Equation 5 is shown as below;
Г ∝ VT r. (5)
Once again, the vortex strength was dependent on the location of the measurement plane. The vortex strength values were the highest at plane y = 4.0 cm where the influence of both vortices, namely the surface vortex (the visible vortex) and the submerged vortex (the invisible vortex), were present and ultimately contributed to the high values of vortex strength.
CONCLUSION
A pump sump model with a single pump intake was constructed to measure the vortex formed in the vicinity of a bell-shaped pump inlet. The measurements which were performed by employing PIV show that the vortex type is a rigid body vortex based on velocity plot where the velocity increases with the radius of the vortex (VT ∝ r) and the fact that the flow is induced by the suction mechanism of the pump. Two regions of different velocity magnitudes which formed two circles being the vortex cores were observed at measurement level 3.5 cm from the floor indicated that the vortex filament curled upon entering the suction inlet. The vortex radius was smaller in size at the level near to
the suction inlet compared to the radius at the levels further below. Based on the vorticity contour plot, the region with low vorticity magnitudes was confined within the region with higher vorticity magnitudes which formed the vortex core. The velocity and vorticity contours exhibit a coherent quasi-circle structure which pointed out the location of the vortex. From the plot of vortex strength against circumference number, it was concluded that the strength of the formed vortex is proportional to the radius as well as the tangential velocity (Г ∝ VT r) thus the vortex strength is strongest when it was at the highest circumference number or the maximum radius of the vortex formed i.e. r = R.
ACKNOWLEDGEMENT
We would like to express our gratitude for the financial supports provided by Ministry of Science, Technology and Innovation (MOSTI) Science Fund 06-01-02-SF1326 and fundamental research grant scheme FRGS/1/2016/TK03/UKM/02/1.
FIGURE 13. Plot of vortex strength against circumference number
Vortex strength againts circumference number
Vorte
x st
reng
th Г
(m^2
/s)
Circumference number
3.5 cm 4.0 cm 5.5 cm 7 cm
0.02
0.01
00 5 10 15 20 25 30 35
0.03
0.04
0.05
0.06
0.07
0.08
Artikel 11.indd 216 10/10/2018 11:25:57
217
REFERENCES
Adrian, R.J. 1991. Particle imaging techniques for experimental fluid mechanics. Annual Review of Fluid Mechanics 23(1): 261-304.
Bauer, D.I. & Nakato, T. 1997. Subsurface vortex suppression in water intakes with multiple-pump sumps. Iowa Institute of Hydraulic Research, University of Iowa. Iowa City, IA, United States.
Clark, K. 1967. Leonardo da Vinci: An Account of His Development as an Artist. Penguin Books.
Helmholtz, H. 1858. BerIntegrale der hydrodynamischen Gleichungen, welche den Wirbelbewegungen.
Johansson, A. E. 2005. Advancements in hydraulic modeling of cooling water intakes in power plants, In Proceedings of the PWR, Chicago, United States, 7-16.
Kida, S., Goto, S. & Makihara, T. 2002. Life, structure, and dynamical role of vortical motion in turbulence, in Tubes, Sheets and Singularities in Fluid Dynamics. Fluid Mechanics and Its Applications. Springer.
Mohd Nazri, S.S. & Sharil, S. 2017. Hydrodynamic characterisation of channel with submerged vegetation. Jurnal Kejuruteraan. Special Issue (1): 9-14.
Nagahara, T., Sato, T. & Okamura, T. 2003. Measurement of the flow around the submerged vortex cavitation in a pump intake by means of PIV. The 5th International Conference of Symposium on Cavitation. Osaka, Japan.
Rajendran, V.P., Constantinescu, G.S. & Patel, V.C. 1998. Experiments on flow in a model water-pump intake sump to validate a numerical model. International Conference of ASME Fluids Engineering Division Summer Meeting. Washington DC, United States.
Norizan, T.A., Reda, E. & Harun, Z. 2018. Enhancement of vorticity reduction by floor splitter in pump sump to improve pump efficiency. Journal of Sustainable Energy Technologies & Assessments 26: 28-36.
Ting, L. 1991. Viscous vortical flows. Lecture notes in physics. Verlag: Springer Publisher
Ting, F.C.K. & Kim, Y.K. 1994. Vortex generation in water waves propagating over a submerged obstacle. Coastal Engineering 24(1-2): 23-49.
*Zambri HarunMuhammad Azhar Akbar BatchaTajul Ariffin NorizanZulkhairi Zainol AbidinCentre for Integrated Design for Most Advanced Mechanical System (PRISMA), Faculty of Engineering and Built EnvironmentUniversiti Kebangsaan Malaysia43600 UKM Bangi, Malaysia.
Wan Hanna Melini Wan MohtarSustainable and Smart Township Research CentreFaculty of Engineering and Built EnvironmentUniversiti Kebangsaan Malaysia43600 UKM Bangi, Malaysia.
*Corresponding author; email: [email protected]
Received date: 3rd November 2017Accepted date: 31st July 2018Online First date: 1st September 2018Published date: 31st October 2018
Artikel 11.indd 217 10/10/2018 11:25:58