synthesis of maximum water recovery network for batch ... · synthesis of maximum water recovery...
TRANSCRIPT
Journal of Cleaner Production 13 (2005) 1381e1394
www.elsevier.com/locate/jclepro
Synthesis of maximum water recovery network for batchprocess systems
Dominic Chwan Yee Foo a,1, Zainuddin Abdul Manan b,*, Yin Ling Tan c,2
a Chemical Engineering Pilot Plant, Universiti Teknologi Malaysia, 81310 Skudai, Johor, Malaysiab Chemical Engineering Department, Universiti Teknologi Malaysia, 81310 Skudai, Johor, Malaysia
c Process Synthesis and Design Laboratory, Chemical Engineering Department,
Universiti Teknologi Malaysia, 81310 Skudai, Johor, Malaysia
Received 30 July 2004; accepted 29 April 2005
Available online 11 July 2005
Abstract
Development of maximum water recovery (MWR) networks for continuous processes based on Pinch Analysis has been ratherwell established. In contrast, less work has been done on the water minimisation problem for batch process systems. This work
presents a two-stage procedure for the synthesis of an MWR network for a batch process system, covering both mass transfer-basedand non-mass transfer-based water-using processes. The first stage of the synthesis task is to locate the various network targets,which include the overall and interval-based minimum utility targets (fresh water and wastewater flows) as well as storage capacity
target using the newly developed time-dependent water cascade analysis (WCA) technique. In the second stage, a new tool called thetime-water network is introduced to help in the development of the MWR network to achieve the established utility targets. Thisnew network representation has an advantage of clearly depicting the time-dependent nature of a batch water network.� 2005 Elsevier Ltd. All rights reserved.
Keywords: Water minimisation; Pinch analysis; Batch process systems; Utility targeting; Network design
1. Introduction
The current drive towards environmental sustainabil-ity and the rising costs of fresh water and effluenttreatment have encouraged the process industry to findnew ways to reduce fresh water consumption andwastewater generation. Process plants are now takingmore serious measures towards the minimisation offresh water consumption via in-plant water reuse and
* Corresponding author. Tel.: C60 7 5535512; fax: C60 7 5581463.
E-mail addresses: [email protected] (D.C.Y. Foo), zain@
fkkksa.utm.my (Z.A. Manan), [email protected] (Y.L. Tan).1 Tel.: C60 7 5531662; fax: C60 7 5569706.2 Tel.: C60 12 4654233.
0959-6526/$ - see front matter � 2005 Elsevier Ltd. All rights reserved.
doi:10.1016/j.jclepro.2005.04.013
recycle. This corresponds to reduced effluent generationas a means to reduce production costs and to ensuresustainable growth in the business activities. The adventof various network synthesis tools for the systematicdesign of optimal water recovery network has seenextensive progress over the last decades [1e52].
Water-using operations in a process plant cangenerally be classified into mass transfer-based and non-mass transfer-based operations [22]. A mass transfer-based water-using operation is characterised by thepreferential transfer of a material species from a richstream to water, which is being utilised as a lean streamor a mass separating agent (MSA). Various washingoperations (e.g. desalter in refinery, pulp washing inpaper mill, surface cleaning in electroplating industries,etc.) are typical examples of such operations. Cleaning
1382 D.C.Y. Foo et al. / Journal of Cleaner Production 13 (2005) 1381e1394
involves the preferential transfer of species (contami-nants) from a ‘‘rich stream’’ (in this case, the processstream) to a lean stream or an MSA (in this case, water).During cleaning, water is fed into the process (asa demand) while wastewater is generated (as a source).The input and output flowrates of a mass transferprocess are normally assumed to be equal.
The non-mass transfer-based water-using operationcovers functions of water other than as a MSA. Typicalexamples include water being fed as a raw material, orbeing withdrawn as a product or a by-product ina chemical reaction, as well as being utilised as a heatingor cooling medium (e.g. cooling tower make-up). Wateras a raw material fed into a reactor, or as heating orcooling media are clearly non-mass transfer operationssince these operations are not designed to preferentiallytransfer contaminant between streams. For such oper-ations, sometimes, only water demands or water sourcesexist. For non-mass transfer-based water-using opera-tions, water flowrate is more important than the amountof contaminant accumulated. Hence, a non-mass trans-fer-based process may have different inlet and outletflowrates, which often remain constant.
Two main approaches are generally used to addressthe issue of systematic synthesis of a water recovery net-work, i.e. the graphical approach (or more commonlyknown as the water pinch technique) [1e23] andmathematically-based optimisation approach [24e52].The former technique divides the synthesis task intoa two-step procedure, i.e. utility targeting and networkdesign. The main advantage of this approach is that, theminimum utilities targets which consist of fresh waterand wastewater flowrates are both located ahead ofdetailed network design.
Wang and Smith [1] initiated the two-stage waterpinch approach based on the more generalised massexchange network synthesis problems [53e56]. In thefirst stage, a limiting water profile is introduced to locatethe minimum fresh water and wastewater flowrates(termed as ‘‘utility targets’’) prior to detailed networkdesign. The opportunities for regenerationereuse andregenerationerecycling were also explored. In their laterwork, these authors also took into consideration flowrateconstraints in their network analyses [2]. The basicconcept underlying these works is that, the water-usingprocesses are modelled as mass transfer operations.
The mass transfer model-based approach in handlingthe water recovery network might not always beadequate. Some operations in the process industry, suchas boiler blowdown, cooling tower make-up and reactoreffluent are typical examples where water quantity ismore important than the water quality. The masstransfer-based approach fails to model these operations.Dhole et al. [4] later introduced a new targeting toolcalled the water source and demand composite curves toovercome this limitation. They also suggested process
changes like mixing and bypassing to further reduce thewater flowrates. However, Polley and Polley [9] laterpointed out that, unless the correct stream mixing systemwas identified, the apparent targets generated by Dhole’scomposite curves [4] could be substantially higher thanthe true minimum utility targets.
Sorin and Bedard [7] later developed the Evolution-ary Table, a numerical tool that is equivalent to Dhole’scomposite curves to determine the fresh water andwastewater targets. They pointed out that the targetingtechnique introduced by Dhole et al. [4] could result ina number of ‘‘local’’ pinch points, which might notnecessarily be the actual or the ‘‘global’’ pinch points.However, Hallale [16] recently, pointed out that theEvolutionary Table by Sorin and Bedard [7] may alsonot provide a clear picture of the analysis. The targetsobtained may not be a true solution, as they greatlydepend on the mixing patterns (which is supposed to bea part of the network design) of the process streams.Moreover, when more than one global pinch pointoccurred in water-using processes, the EvolutionaryTable failed to locate them correctly [16].
Two recent graphical approaches in locating theglobal minimum utility targets were individually pre-sented by Hallale [16], El-Halwagi et al. [18] andPrakash and Shenoy [23]. Hallale [16] presented theiterative graphical procedure called the water surplusdiagram that was adapted from the hydrogen networkanalysis [57] for locating the minimum utility targets ina water recovery network. Appropriate placement ofwater regeneration units is also addressed [16]. Morerecently, the iterative procedure in water surplusdiagrams is overcome by a numerically equivalent watercascade analysis (WCA) technique presented by theauthor [22]. On the other hand, El-Halwagi et al. [18]and Prakash and Shenoy [23] individually developeda simpler non-iterative graphical approach for utilitytargeting, with the introduction of a new set ofcomposite curves located on a load versus flowratediagram. The four latest works [16,18,22,23] are by farthe most promising targeting techniques in locatingutility targets in a MWR network. They overcome thelimitations of the mass transfer-based approach, andyet, these new tools have automatically built in allmixing possibilities to determine the true pinch pointand reuse target.
Apart from the targeting stage, numerous techniqueshave also been proposed to deal with the second stageof the pinch-based water recovery network synthesisproblem, i.e. designing an MWR network. This includesthe use of water grid diagram [1], load table [5], watermain method [6,8,11] and algorithmic design procedure[37e40] for mass transfer-based process; as well assource sink mapping diagram [12e15,56] and source sinkapproach [16,23,56,58] for non-mass transfer-basedprocesses. It should be noted that the key step in the
1383D.C.Y. Foo et al. / Journal of Cleaner Production 13 (2005) 1381e1394
pinch-based approach for synthesising an MWRnetwork is to locate the minimum utility targetscorrectly. Once the utility targets are identified, anydesign tools can be used to design a network thatachieves the established targets.
On the other hand, mathematically-based optimisa-tion approach for water recovery network synthesis hasalso received much attention from the research commu-nity. Early work in this area was reported by Takamaet al. [24] for a petroleum refinery case study. Asuperstructure of all water-using operations is firstlysetup. This superstructure is then optimised to removethe irrelevant and uneconomical options. A linearprogramming technique was used in their later workto address the water allocation problem together withthe water treating units [25,26]. Their works, however,were constrained by the available optimisation softwareat that time.
After the seminal work of Takama and his co-workers [24e26], various other mathematically-basedapproaches were presented. Alva-Argaez and co-authorsdeveloped the integrated approach combining the in-sights from water pinch and mathematical programmingin handing the mass transfer-based water recoverynetwork synthesis problems [28,29]. The combinationuse of pinch and linear programming techniques waslater presented by Jacob et al. [43]. Optimisation-basedapproach was presented by Yang et al. [44] and Dunnet al. [41] for mass transfer and non-mass transfer-basedprocesses, respectively. Huang et al. [30] and Benkoet al. [33,34] individually developed the mathematically-based approach to include water treatment in the totalwater recovery network synthesis. More recent works onthis area are dominated by fuzzy programming [45,47e49] and genetic algorithm approaches [42,50,51]. Themathematically-based optimisation approach serves asa supplementary tool to the graphical pinch approach inaddressing more complex systems, such as systems withmany water-using processes (more than 10 streams) ormultiple contaminant problems. A good review ofvarious existing techniques in addressing the waterrecovery network problem is presented by Bagajewicz[35].
From the afore-mentioned literature, one will noticethat water recovery network synthesis has been an activeresearch area throughout the past decade. However, oneparticular sector within this area that receives lessattention from the research community is that of waterrecovery network for batch process systems. In variousindustrial sectors, such as food, pharmaceutical andbiochemical manufacturing, processes are commonlyoperated in batch mode. Relatively few works have beenconducted in this area. The development of a systematicprocedure for water minimisation for batch processsystems which are industrially very common as well asimportant is therefore, required.
Wang and Smith [3] published the first work for waterminimisation for batch operation based on water pinchanalysis technique. By putting time as their main processconstraint, the authors attempted to maximise the masstransfer driving force used in each of the concentrationprofiles. However, this work is limited to mass transfer-based water-using processes, which does not take intoaccount the various non-mass transfer-based processese.g. reactor, cooling towermake-up, etc. Apart from that,these authors had failed to present a good water networkdiagram for batch systems. The proposed water recoverynetwork used the conventional water network diagramfor a continuous process [1]. The main drawback for thisrepresentation is that, a designer cannot visualise howthese processes are linked with time. This, in turn, willeasily lead to a sup-optimal water recovery networkduring the design stage. Clearly, a better representationof the water recovery network is required.
Besides, other works on batch water recoverynetwork synthesis are mainly based on the mathematicaloptimisation approach by Almato and co-workers[27,31,32]. Almato et al. [27] developed a mathematicalmodel to determine the best tanks-streams assignment torationalise the water usage. A water stream chart whichcan easily identify the possibility for direct water reuse ina process was built. This model included tank capacity,stream concentration upper bounds and time con-straints. A software tool for the optimisation of waterusage in the batch water-using processes was laterdeveloped based on their mathematical model [36]. Thesoftware enabled the system to be optimised underdifferent criteria such as fresh water demand, water cost,energy cost, and water reuse network design. However,the optimality of the solutions could not be guaranteedas the model resulted in a non-convex non-linearprogramming problem.
More recently, an optimisation-based approach isdeveloped by Kim and Smith [52]. Process constraintssuch as stream location and storage capacity are alsotaken into consideration in the mathematical model,which is solved by the mixed integer non-linear pro-gramme (MINLP). However, this work is also limited tomass transfer-based water-using processes. Non-masstransfer-based processes are not appropriately modelledin this approach.
In this work, new tools are presented to synthesisea maximum water recovery (MWR) network for batchprocesses based on the graphical pinch analysistechnique. Some analogy is taken from previous workon heat [59e63] and mass [64,65] integration for batchprocess systems. It has been previously shown that,through appropriate adjustments, utility targeting andnetwork design tools from continuous processes canbe extended to batch processes. We will examine thissituation for batch water recovery network in thispaper.
1384 D.C.Y. Foo et al. / Journal of Cleaner Production 13 (2005) 1381e1394
2. Problem statement
Problem statement for the synthesis of a batch MWRnetwork is given as follows:
Given a set of water-using processes, operated in batchor semi-continuous mode, it is desired to synthesisea network of stream interconnections among these batchwater-using processes so that the overall consumption offresh water is minimised while the processes utilise waterof adequate quality.
3. Time-dependent water cascade analysis
The seminal work of Kemp and co-workers [59e63]on batch heat integration provides the very basicfoundation on how the conventional process integrationtechnique could be applied to many industrial processesthat are operated in batch mode. They showed that bydividing the time intervals where the process hot andcold streams exist, utility targeting and network designcould be carried out independently in these intervals.Foo et al. [64,65] recently showed that the same analogycould be applied to batch mass integration. Hence, theapproach for batch water recovery network is built onthe same principles of batch heat and mass integration.
Similar to any pinch-based approach in heat andmass integration, the first stage in synthesising a batchMWR network is to locate the various network targetsahead of the detailed network design. Note also that, inboth batch heat and mass integration, numericaltargeting approach is utilised to locate the minimumutility targets, in contrast to the common practise ofgraphical approach (e.g. composite curves, etc.). In thisinstance, time-dependent heat cascade analysis wasutilised in batch heat integration [59e63], while time-dependent composition interval table was utilised inbatch mass integration [64,65]. This is due to thecomplex nature of batch process integration work.Often, one will need to repeat the utility targetingprocedure independently for each time interval. Numer-
ical approaches produce accurate targets and reduce thetime required for tedious drawings and calculationsinvolved in the graphical approach.
The WCA technique by Manan et al. [22] isa numerical approach that is used to establish thevarious network targets for batch process systems in thiswork. The WCA technique was originally developed fordetermining the utility targets for an MWR network incontinuous mode. This technique possesses the advan-tage to include both mass transfer-based and non-masstransfer-based water-using processes in the analysis [22].In the next section, we demonstrate how the WCAtechnique serves as a good utility targeting tool fora batch MWR network through a literature case study.
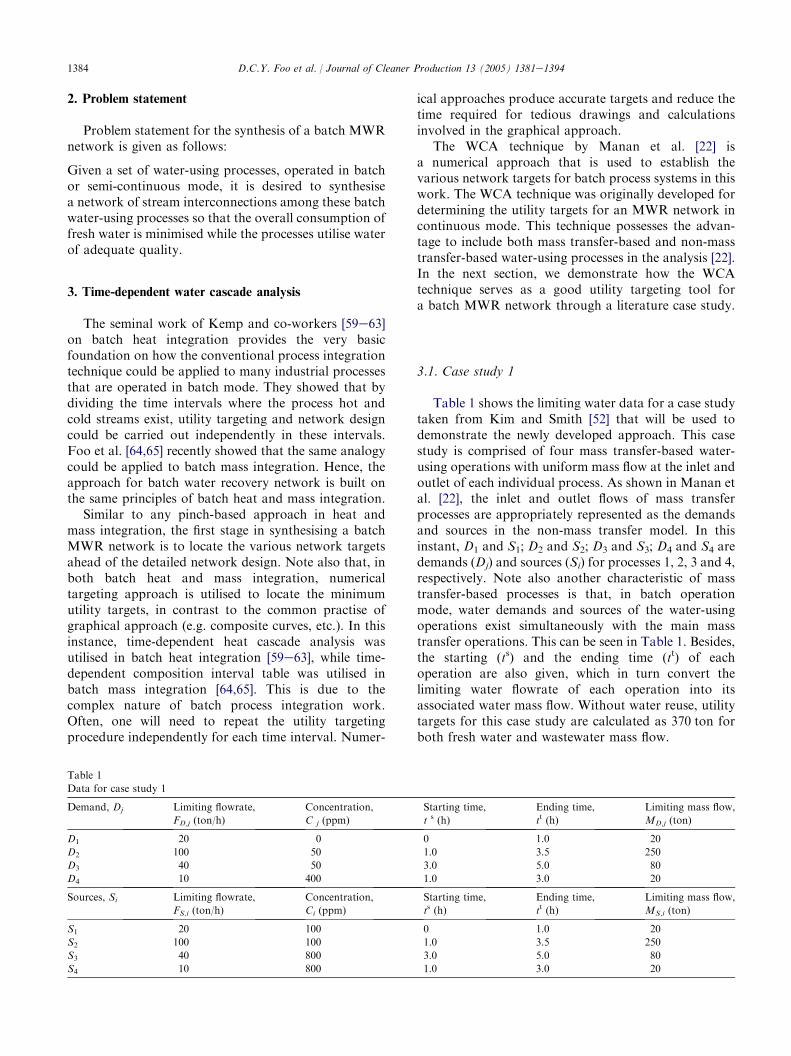
3.1. Case study 1
Table 1 shows the limiting water data for a case studytaken from Kim and Smith [52] that will be used todemonstrate the newly developed approach. This casestudy is comprised of four mass transfer-based water-using operations with uniform mass flow at the inlet andoutlet of each individual process. As shown in Manan etal. [22], the inlet and outlet flows of mass transferprocesses are appropriately represented as the demandsand sources in the non-mass transfer model. In thisinstant, D1 and S1; D2 and S2; D3 and S3; D4 and S4 aredemands (Dj) and sources (Si) for processes 1, 2, 3 and 4,respectively. Note also another characteristic of masstransfer-based processes is that, in batch operationmode, water demands and sources of the water-usingoperations exist simultaneously with the main masstransfer operations. This can be seen in Table 1. Besides,the starting (ts) and the ending time (tt) of eachoperation are also given, which in turn convert thelimiting water flowrate of each operation into itsassociated water mass flow. Without water reuse, utilitytargets for this case study are calculated as 370 ton forboth fresh water and wastewater mass flow.
Table 1
Data for case study 1
Demand, Dj Limiting flowrate,
FD,j (ton/h)
Concentration,
C j (ppm)
Starting time,
t s (h)
Ending time,
tt (h)
Limiting mass flow,
MD,j (ton)
D1 20 0 0 1.0 20
D2 100 50 1.0 3.5 250
D3 40 50 3.0 5.0 80
D4 10 400 1.0 3.0 20
Sources, Si Limiting flowrate,
FS,i (ton/h)
Concentration,
Ci (ppm)
Starting time,
ts (h)
Ending time,
tt (h)
Limiting mass flow,
MS,i (ton)
S1 20 100 0 1.0 20
S2 100 100 1.0 3.5 250
S3 40 800 3.0 5.0 80
S4 10 800 1.0 3.0 20
1385D.C.Y. Foo et al. / Journal of Cleaner Production 13 (2005) 1381e1394
The first step in the utility targeting stage is to locatethe water demands and sources at their respective timeintervals; this can be carried out by dividing the timeintervals where the water demands and sources arefound. A time interval table is introduced for thispurpose (Table 2). Mass flow of water demand j (MD, j)and water source i (MS, i) at interval k is assumed toexist in the intervals in proportion to the duration of thetime interval (Dtk). With the time interval table in place,one can clearly identify the existence of instantaneouswater demands and sources in each of these timeintervals before any analysis is carried out. We nowdemonstrate how this time interval table can be used tolocate the various network targets in a batch waternetwork, for system without water storage tank, andsubsequently, for system with storage tank installed.
3.1.1. Batch water recovery network without waterstorage tank
As shown in the time interval table (Table 2), all timeintervals consist of both water demands and sources,which mean that direct water integration can occur inthese intervals. A close observation indicates that waterdemands and sources that exist in the same intervaloriginate from the same water-using processes. This ismainly due to the fact that these water-using processesin the network are mass transfer-based operations, inwhich their water demands and sources exist during theoccurrence of the processes. Note, however, that this isnot often the case. When non-mass transfer-basedprocesses exist in the network, the water demands andsources of these processes are often found in differenttime intervals. Often, only water demands or sources arefound in certain time intervals, which means that nodirect water integration occur in these intervals. Hence,either fresh water is needed to supplement the waterdemands (when water demands exist only) or wastewa-ter is generated (water sources exist only) from theseintervals.
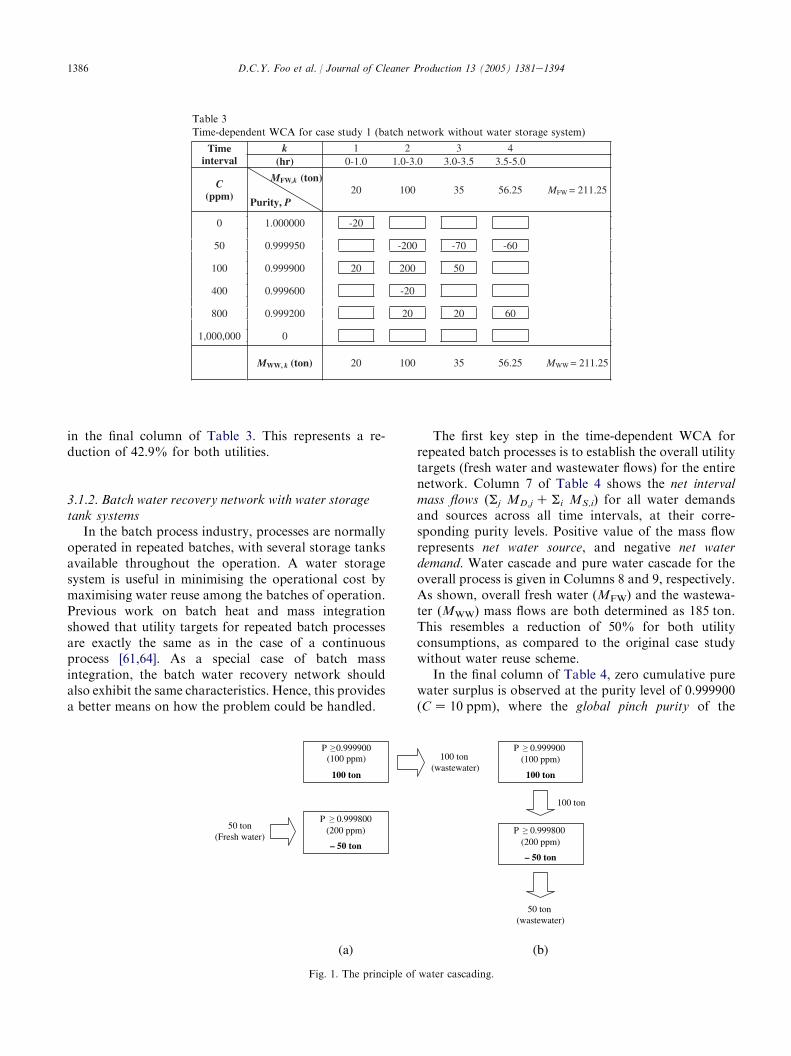
Next, water sources and demands are located at theirindividual contaminant concentration level in each timeinterval. The first column of Table 3 contains thecontaminant concentration levels (C ) arranged inascending order. Each concentration level is expressedin terms of the water purity (P) in the second column.With the concentration of pure water set at one millionppm, the fraction of pure water in a contaminatedstream, or the water purity, can be expressed as [16]:
Purity; PZ1;000;000�C
1;000;000ð1Þ
where CZ contaminant concentration in ppm.The number of purity levels (n) in each time interval k
equals the total number of water demands (ND) andwater sources (NS) minus any duplicate purity (NDP)[22]:
nZNDCNS �NDP ð2Þ
Columns 3e6 (kZ 1e4) of Table 3 contain the massflow of the water demands and sources that exist in eachtime interval, at their corresponding purity levels. Themass flow of water demand is fixed as negative, and thewater source positive. In order to achieve the target foran MWR network, utility targeting is to be carried outin each time interval. This involves the use of thenumerical targeting technique of WCA [22].
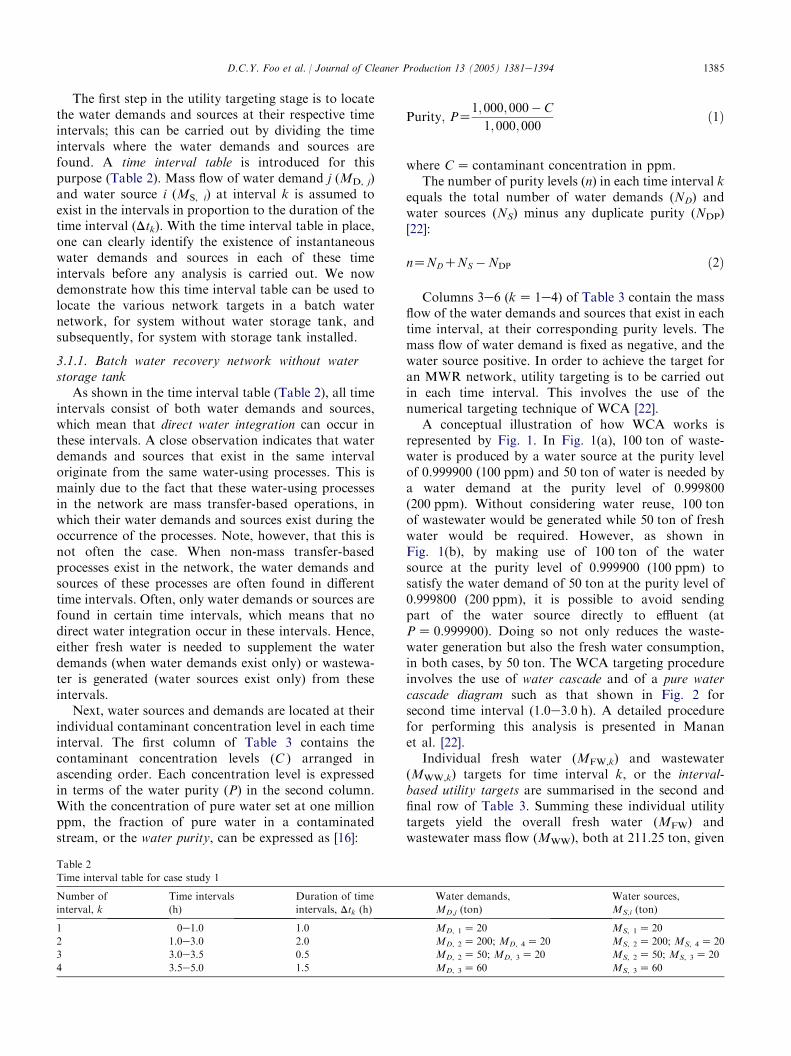
A conceptual illustration of how WCA works isrepresented by Fig. 1. In Fig. 1(a), 100 ton of waste-water is produced by a water source at the purity levelof 0.999900 (100 ppm) and 50 ton of water is needed bya water demand at the purity level of 0.999800(200 ppm). Without considering water reuse, 100 tonof wastewater would be generated while 50 ton of freshwater would be required. However, as shown inFig. 1(b), by making use of 100 ton of the watersource at the purity level of 0.999900 (100 ppm) tosatisfy the water demand of 50 ton at the purity level of0.999800 (200 ppm), it is possible to avoid sendingpart of the water source directly to effluent (atPZ 0.999900). Doing so not only reduces the waste-water generation but also the fresh water consumption,in both cases, by 50 ton. The WCA targeting procedureinvolves the use of water cascade and of a pure watercascade diagram such as that shown in Fig. 2 forsecond time interval (1.0e3.0 h). A detailed procedurefor performing this analysis is presented in Mananet al. [22].
Individual fresh water (MFW,k) and wastewater(MWW,k) targets for time interval k, or the interval-based utility targets are summarised in the second andfinal row of Table 3. Summing these individual utilitytargets yield the overall fresh water (MFW) andwastewater mass flow (MWW), both at 211.25 ton, given
Table 2
Time interval table for case study 1
Number of
interval, k
Time intervals
(h)
Duration of time
intervals, Dtk (h)
Water demands,
MD,j (ton)
Water sources,
MS,i (ton)
1 0e1.0 1.0 MD, 1Z 20 MS, 1Z 20
2 1.0e3.0 2.0 MD, 2Z 200; MD, 4Z 20 MS, 2Z 200; MS, 4Z 20
3 3.0e3.5 0.5 MD, 2Z 50; MD, 3Z 20 MS, 2Z 50; MS, 3Z 20
4 3.5e5.0 1.5 MD, 3Z 60 MS, 3Z 60
1386 D.C.Y. Foo et al. / Journal of Cleaner Production 13 (2005) 1381e1394
Table 3
Time-dependent WCA for case study 1 (batch network without water storage system)
in the final column of Table 3. This represents a re-duction of 42.9% for both utilities.
3.1.2. Batch water recovery network with water storagetank systems
In the batch process industry, processes are normallyoperated in repeated batches, with several storage tanksavailable throughout the operation. A water storagesystem is useful in minimising the operational cost bymaximising water reuse among the batches of operation.Previous work on batch heat and mass integrationshowed that utility targets for repeated batch processesare exactly the same as in the case of a continuousprocess [61,64]. As a special case of batch massintegration, the batch water recovery network shouldalso exhibit the same characteristics. Hence, this providesa better means on how the problem could be handled.
The first key step in the time-dependent WCA forrepeated batch processes is to establish the overall utilitytargets (fresh water and wastewater flows) for the entirenetwork. Column 7 of Table 4 shows the net intervalmass flows (Sj MD,jC Si MS,i) for all water demandsand sources across all time intervals, at their corre-sponding purity levels. Positive value of the mass flowrepresents net water source, and negative net waterdemand. Water cascade and pure water cascade for theoverall process is given in Columns 8 and 9, respectively.As shown, overall fresh water (MFW) and the wastewa-ter (MWW) mass flows are both determined as 185 ton.This resembles a reduction of 50% for both utilityconsumptions, as compared to the original case studywithout water reuse scheme.
In the final column of Table 4, zero cumulative purewater surplus is observed at the purity level of 0.999900(CZ 10 ppm), where the global pinch purity of the
0.999900P(100 ppm)
100 ton
P 0.999900
P 0.999800
(100 ppm)
100 ton
100 ton (wastewater)
100 ton
(200 ppm)
– 50 ton
P 0.999800(200 ppm)
– 50 ton
50 ton (Fresh water)
50 ton (wastewater)
(a) (b)
Fig. 1. The principle of water cascading.
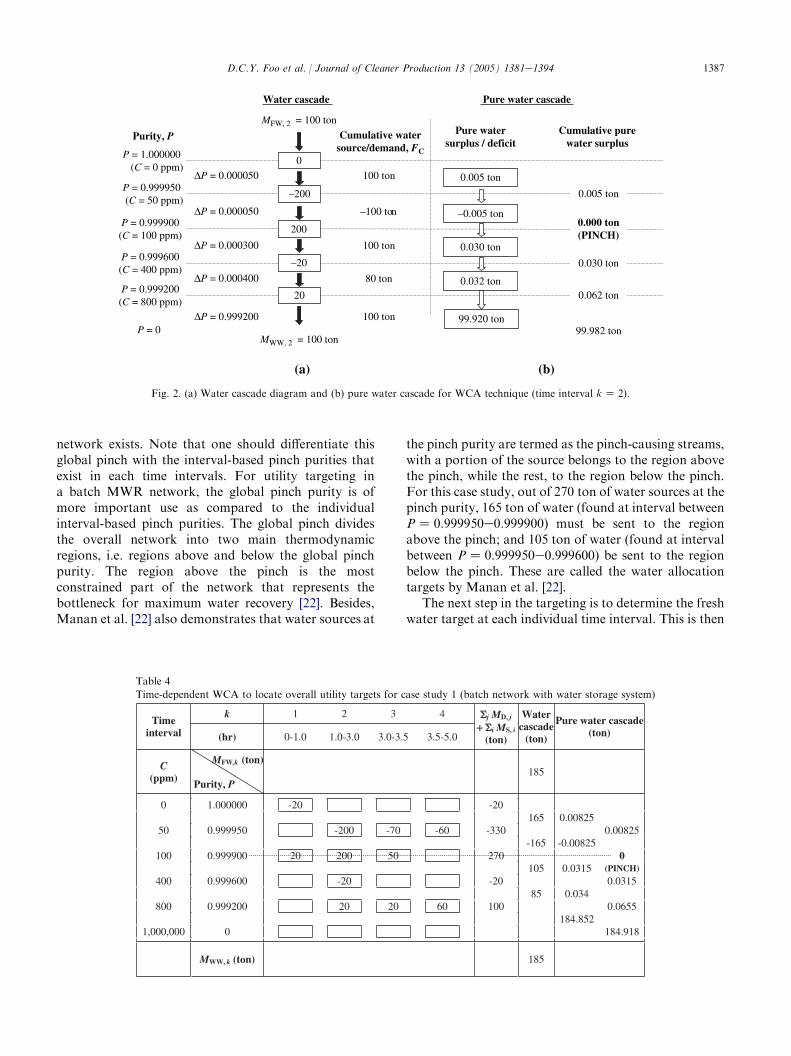
1387D.C.Y. Foo et al. / Journal of Cleaner Production 13 (2005) 1381e1394
Water cascade Pure water cascade
Pure watersurplus / deficit
Cumulative pure water surplus
80 ton
100 ton
–100 ton
0.005 ton
–0.005 ton
0.030 ton
0.005 ton
0.000 ton(PINCH)
0.062 ton0.032 ton
0.030 ton
99.920 ton
100 ton
∆P = 0.000400
∆P = 0.000300
∆P = 0.000050
∆P = 0.000050
–200
200
–20
20
0
MFW, 2 = 100 ton
Cumulative watersource/demand, FC
P = 0.999200 (C = 800 ppm)
P = 0.999600 (C = 400 ppm)
P = 0.999900 (C = 100 ppm)
P = 0.999950 (C = 50 ppm)
P = 1.000000 (C = 0 ppm)
Purity, P
100 ton ∆P = 0.999200 99.982 tonP = 0
MWW, 2 = 100 ton
(a) (b)
Fig. 2. (a) Water cascade diagram and (b) pure water cascade for WCA technique (time interval kZ 2).
network exists. Note that one should differentiate thisglobal pinch with the interval-based pinch purities thatexist in each time intervals. For utility targeting ina batch MWR network, the global pinch purity is ofmore important use as compared to the individualinterval-based pinch purities. The global pinch dividesthe overall network into two main thermodynamicregions, i.e. regions above and below the global pinchpurity. The region above the pinch is the mostconstrained part of the network that represents thebottleneck for maximum water recovery [22]. Besides,Manan et al. [22] also demonstrates that water sources at
the pinch purity are termed as the pinch-causing streams,with a portion of the source belongs to the region abovethe pinch, while the rest, to the region below the pinch.For this case study, out of 270 ton of water sources at thepinch purity, 165 ton of water (found at interval betweenPZ 0.999950e0.999900) must be sent to the regionabove the pinch; and 105 ton of water (found at intervalbetween PZ 0.999950e0.999600) be sent to the regionbelow the pinch. These are called the water allocationtargets by Manan et al. [22].
The next step in the targeting is to determine the freshwater target at each individual time interval. This is then
Table 4
Time-dependent WCA to locate overall utility targets for case study 1 (batch network with water storage system)
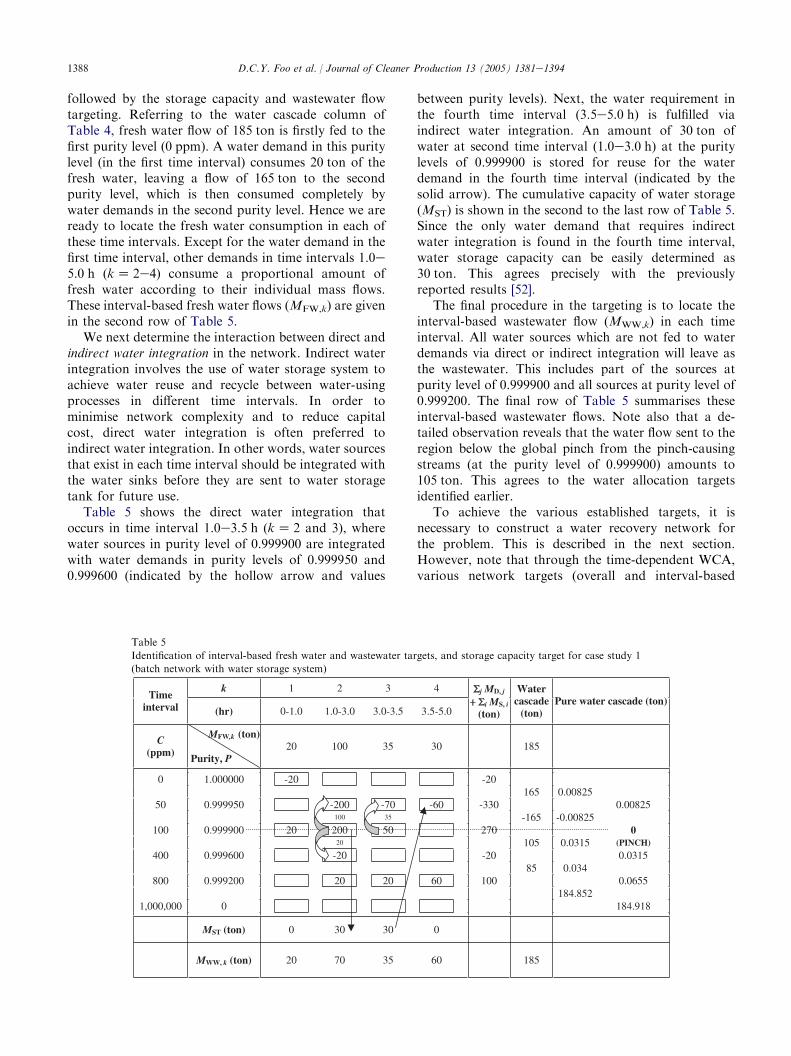
1388 D.C.Y. Foo et al. / Journal of Cleaner Production 13 (2005) 1381e1394
followed by the storage capacity and wastewater flowtargeting. Referring to the water cascade column ofTable 4, fresh water flow of 185 ton is firstly fed to thefirst purity level (0 ppm). A water demand in this puritylevel (in the first time interval) consumes 20 ton of thefresh water, leaving a flow of 165 ton to the secondpurity level, which is then consumed completely bywater demands in the second purity level. Hence we areready to locate the fresh water consumption in each ofthese time intervals. Except for the water demand in thefirst time interval, other demands in time intervals 1.0e5.0 h (kZ 2e4) consume a proportional amount offresh water according to their individual mass flows.These interval-based fresh water flows (MFW,k) are givenin the second row of Table 5.
We next determine the interaction between direct andindirect water integration in the network. Indirect waterintegration involves the use of water storage system toachieve water reuse and recycle between water-usingprocesses in different time intervals. In order tominimise network complexity and to reduce capitalcost, direct water integration is often preferred toindirect water integration. In other words, water sourcesthat exist in each time interval should be integrated withthe water sinks before they are sent to water storagetank for future use.
Table 5 shows the direct water integration thatoccurs in time interval 1.0e3.5 h (kZ 2 and 3), wherewater sources in purity level of 0.999900 are integratedwith water demands in purity levels of 0.999950 and0.999600 (indicated by the hollow arrow and values
between purity levels). Next, the water requirement inthe fourth time interval (3.5e5.0 h) is fulfilled viaindirect water integration. An amount of 30 ton ofwater at second time interval (1.0e3.0 h) at the puritylevels of 0.999900 is stored for reuse for the waterdemand in the fourth time interval (indicated by thesolid arrow). The cumulative capacity of water storage(MST) is shown in the second to the last row of Table 5.Since the only water demand that requires indirectwater integration is found in the fourth time interval,water storage capacity can be easily determined as30 ton. This agrees precisely with the previouslyreported results [52].
The final procedure in the targeting is to locate theinterval-based wastewater flow (MWW,k) in each timeinterval. All water sources which are not fed to waterdemands via direct or indirect integration will leave asthe wastewater. This includes part of the sources atpurity level of 0.999900 and all sources at purity level of0.999200. The final row of Table 5 summarises theseinterval-based wastewater flows. Note also that a de-tailed observation reveals that the water flow sent to theregion below the global pinch from the pinch-causingstreams (at the purity level of 0.999900) amounts to105 ton. This agrees to the water allocation targetsidentified earlier.
To achieve the various established targets, it isnecessary to construct a water recovery network forthe problem. This is described in the next section.However, note that through the time-dependent WCA,various network targets (overall and interval-based
Table 5
Identification of interval-based fresh water and wastewater targets, and storage capacity target for case study 1
(batch network with water storage system)
1389D.C.Y. Foo et al. / Journal of Cleaner Production 13 (2005) 1381e1394
utility, storage capacity and water allocation targets) areobtained ahead of detailed network design.
3.1.3. Batch water recovery network designTo achieve the minimum utility targets for an MWR
network, network design is to be carried out indepen-dently for each time interval. This has been shown in theprevious work of batch heat and mass integration[62,65]. As has been pointed out by Manan et al. [22]that any appropriate network design tool can be used toconstruct a water recovery network that features theminimum utility targets, as long as the right targets arecorrectly identified in the targeting stage. In this paper,the source sink approach [16,56,58] has been utilised.
Hallale (2002) pointed out that in order to achieve theutility targets, it is necessary to observe the pinchdivision. For the region above the pinch, the pure watersurplus is always equal to the total pure water deficit.This means that the water sources above the pinch(including fresh water) should neither be fed to the waterdemands nor mixed with the water sources below thepinch. These guidelines must be observed during thenetwork design in each of the time intervals.
After observing the above guidelines, the waternetwork design can be conducted in each of the timeintervals using the following equations [16,56,58]:
(a) For water demands:Mass flow:
X
i
MS;i;D;jZMD;j ð3Þ
where MS,i;D,j is the mass flow of water fed from watersource Si to water demand Dj and MD, j is the mass flowof water fed from water demand Dj.
Concentration:Pi
MS;i;D; jCS;i
Pi
MS;i;D; j
%Cmax;D; j ð4Þ
where CS,i is the contaminant concentration for sourceSi and Cmax,D,j is the maximum concentration forcontaminant for the water demand Dj. This constraintcan be written in terms of water purity, in which case theinequality sign should be reversed.
(b) Sources:Mass flow:
X
i
MS;i;D; j%MS;i ð5Þ
(i)
MFW, 1 = 20 ton
D1
S1MWW, 1 =
20 ton
MFW, 2 = 100 ton
D2
MWW, 2 = 80 ton
20 ton100 ton
D4
S2
S4MWW, 2 =
20 ton
(ii)
MFW, 3 = 25 ton MFW, 3 = 10 tonMFW, 4 = 56.25 ton
S3
D3
3.75 ton
MWW, 4 =
56.25 ton
(iv)(iii)
D2
MWW, 3 = 15 ton
25 ton 10 ton
D3
S2
S3MWW, 3 =
20 ton
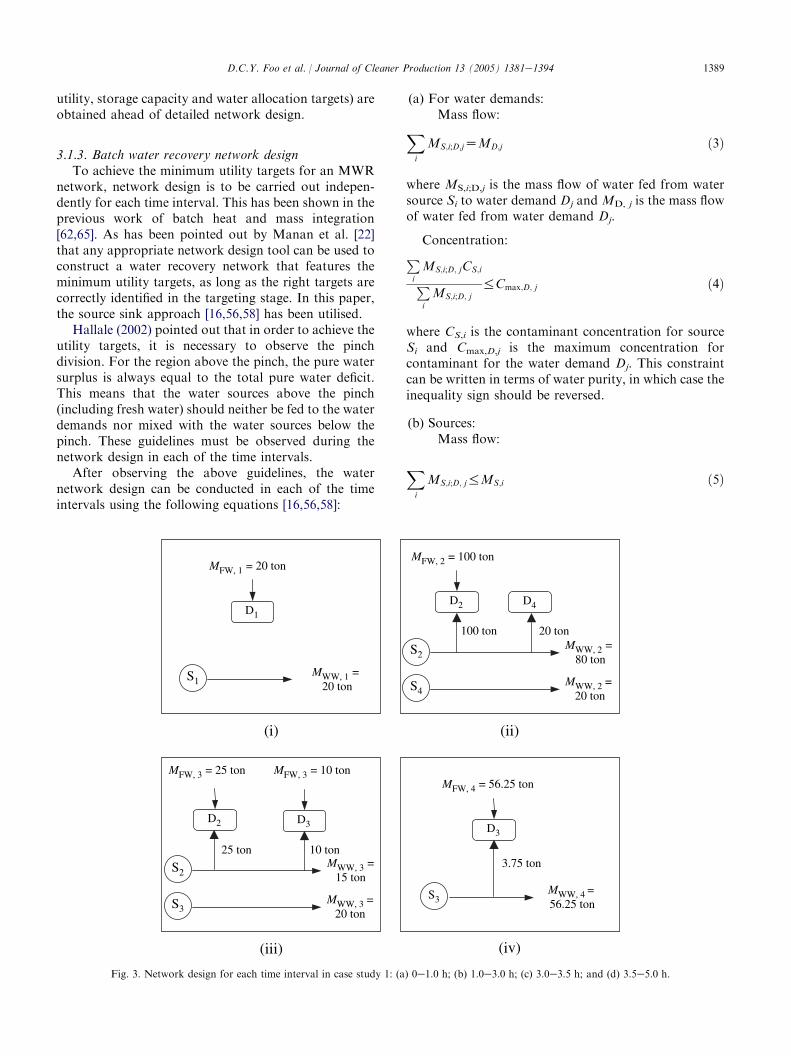
Fig. 3. Network design for each time interval in case study 1: (a) 0e1.0 h; (b) 1.0e3.0 h; (c) 3.0e3.5 h; and (d) 3.5e5.0 h.
1390 D.C.Y. Foo et al. / Journal of Cleaner Production 13 (2005) 1381e1394
D3 / S3
D2 / S2
D4 / S4
66.25 ton
MWW =211.25 ton
20 ton
20 ton
10 ton
D1 / S1
125 ton
125 ton
20 ton
MFW =211.25 ton
0 1.0 2.0 3.0 4.0 5.0
3.75 ton
95 ton
20 ton
Time (h)
Fig. 4. Time-water network diagram for batch water-using processes without water storage tank.
where MS,i is the total mass flow available from sourceSi. Any water from a source that is not fed to a demandwill leave as a wastewater stream. Note also that themass flow terms in the above equations are readilytransformed into volume terms for case studies wherestreams are reported in volume measurement.
We now start to design the water recovery networksubject to the rules and constraints mentioned. Networkwithout water storage system will be considered first.Fig. 3 shows the network design for all the time intervalsinvolved. Since water demands and sources exist in alltime intervals, direct water integration occurs. Exceptthe water demand in the first time interval (0e1.0 h) thatrequires the high quality of fresh water, wastewatergenerated from the water sources in other time intervalsare fed to the water demands in the same interval.However, due to the purity limitation of the watersources, only part of the wastewater generated from
some water sources could be reused. Fresh water isrequired to supplement the total flow of water requiredin these time intervals. The total fresh water needed aswell as the wastewater flows establish the water recoverynetwork amount to 211.25 ton, which agrees with thetargets established during the earlier stage. Note alsothat in this water recovery network, water fed to eachwater demand fulfils exactly the required flow in each ofthe demands, as given by the limiting data in Table 1.
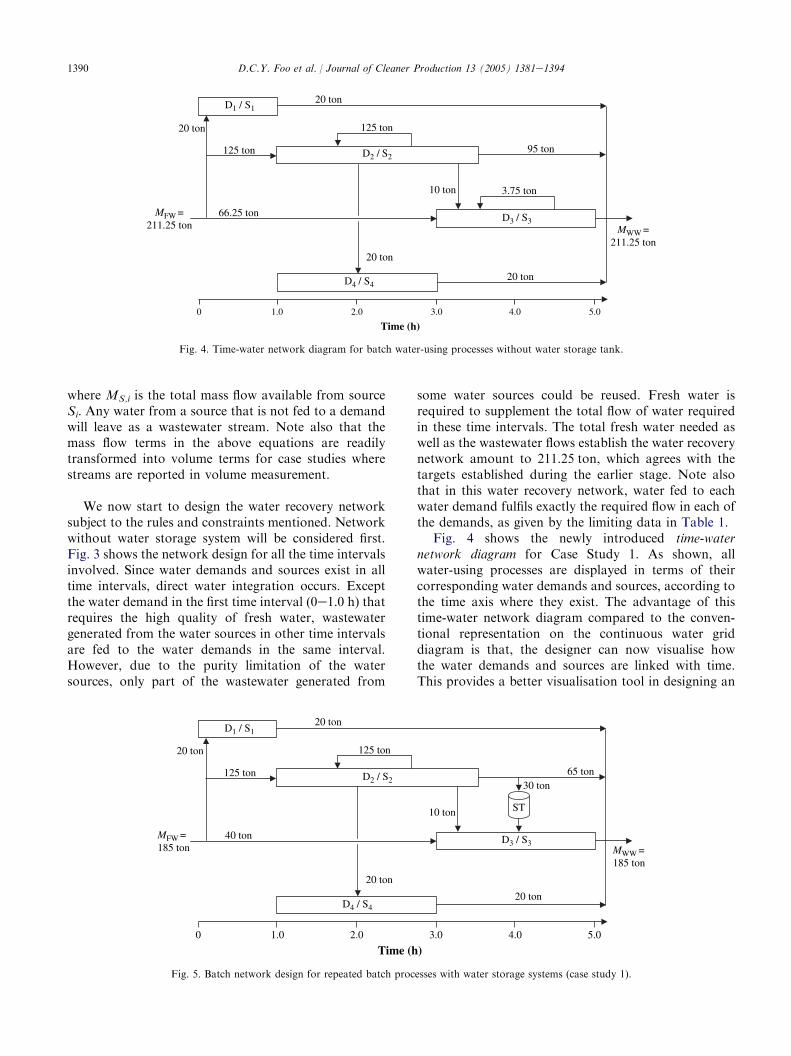
Fig. 4 shows the newly introduced time-waternetwork diagram for Case Study 1. As shown, allwater-using processes are displayed in terms of theircorresponding water demands and sources, according tothe time axis where they exist. The advantage of thistime-water network diagram compared to the conven-tional representation on the continuous water griddiagram is that, the designer can now visualise howthe water demands and sources are linked with time.This provides a better visualisation tool in designing an
40 tonMWW =185 ton
20 ton
20 ton
10 ton
D1 / S1
D2 / S2
D3 / S3
D4 / S4
125 ton
125 ton
20 ton
0 1.0 2.0 3.0 4.0 5.0
30 ton
ST
65 ton
20 ton
MFW =185 ton
Time (h)
Fig. 5. Batch network design for repeated batch processes with water storage systems (case study 1).
1391D.C.Y. Foo et al. / Journal of Cleaner Production 13 (2005) 1381e1394
Table 6
Data for case study 2
Demand, Dj Limiting flowrate,
FD,j (ton/h)
Concentration,
Cj (ppm)
Starting time,
ts (h)
Ending time,
tt (h)
Limiting mass
flow, MD,j (ton)
D1 100 100 0.5 1.5 100
D2 80 0 0 0.5 40
D3 50 100 0.5 1.0 25
Sources, Si Limiting flowrate,
FS,i (ton/h)
Concentration,
Ci (ppm)
Starting time,
ts (h)
Ending time,
tt (h)
Limiting mass
flow, MS,i (ton)
S1 100 400 0.5 1.5 100
S2 80 200 0 0.5 40
S3 50 200 0.5 1.0 25
optimum batch water recovery network. Note also thatthis network representation can also readily display anynon-mass transfer-based processes where water demandand sources for a water-using operation may exist indifferent time intervals.
Next, the time-water network diagram is used todepict the network representation on the repeated batchwater recovery network with water storage tank systeminstalled. Conceptually, a water storage system mayfunction either as a water source or as a water demand,depending on the role of the water storage at the timeinterval of interest. Water storage will function asa water demand if water is stored at one time intervalfor further reuse. On the other hand, available storedwater at any time interval will function as a source whenit is integrated with the water demands via indirect waterintegration. Fig. 5 shows the time-water network for thiscase, which is designed following the various interval-based targets identified during the targeting stage(Table 5). The minimum utility consumption achievedin this design, i.e. 185 ton of fresh water and wastewater
flows agree exactly with the targeted utility using thetime-dependent WCA.
3.2. Case study 2
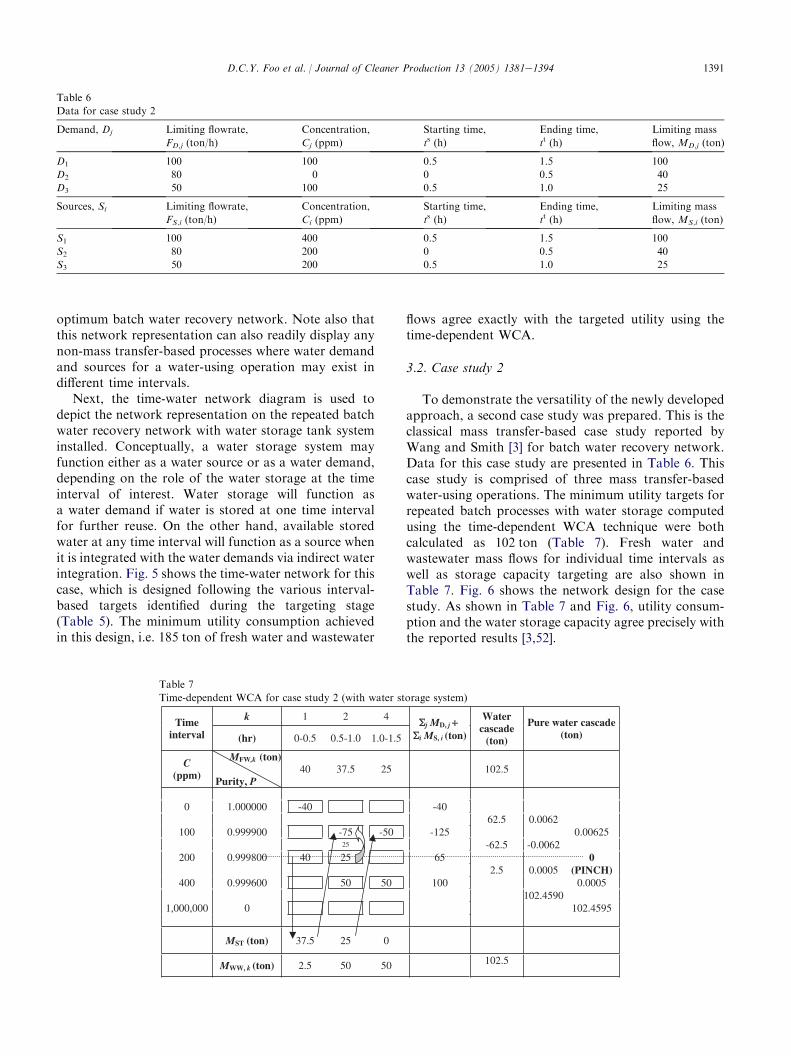
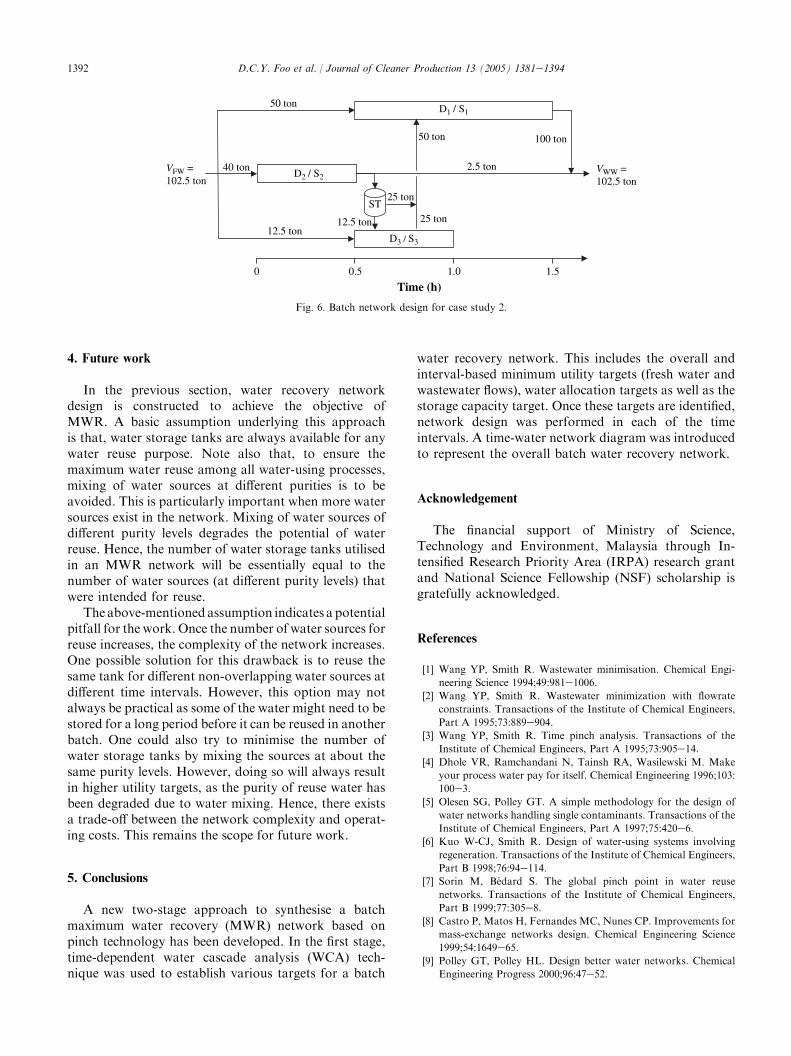
To demonstrate the versatility of the newly developedapproach, a second case study was prepared. This is theclassical mass transfer-based case study reported byWang and Smith [3] for batch water recovery network.Data for this case study are presented in Table 6. Thiscase study is comprised of three mass transfer-basedwater-using operations. The minimum utility targets forrepeated batch processes with water storage computedusing the time-dependent WCA technique were bothcalculated as 102 ton (Table 7). Fresh water andwastewater mass flows for individual time intervals aswell as storage capacity targeting are also shown inTable 7. Fig. 6 shows the network design for the casestudy. As shown in Table 7 and Fig. 6, utility consum-ption and the water storage capacity agree precisely withthe reported results [3,52].
Table 7
Time-dependent WCA for case study 2 (with water storage system)
1392 D.C.Y. Foo et al. / Journal of Cleaner Production 13 (2005) 1381e1394
0 0.5 1.0 1.5
Time (h)
25 ton
D2 / S2
D1 / S1
D3 / S3
40 ton
ST
100 ton50 ton
25 ton
12.5 ton
2.5 ton
12.5 ton
50 ton
VWW =102.5 ton
VFW =102.5 ton
Fig. 6. Batch network design for case study 2.
4. Future work
In the previous section, water recovery networkdesign is constructed to achieve the objective ofMWR. A basic assumption underlying this approachis that, water storage tanks are always available for anywater reuse purpose. Note also that, to ensure themaximum water reuse among all water-using processes,mixing of water sources at different purities is to beavoided. This is particularly important when more watersources exist in the network. Mixing of water sources ofdifferent purity levels degrades the potential of waterreuse. Hence, the number of water storage tanks utilisedin an MWR network will be essentially equal to thenumber of water sources (at different purity levels) thatwere intended for reuse.
The above-mentioned assumption indicates a potentialpitfall for the work. Once the number of water sources forreuse increases, the complexity of the network increases.One possible solution for this drawback is to reuse thesame tank for different non-overlapping water sources atdifferent time intervals. However, this option may notalways be practical as some of the water might need to bestored for a long period before it can be reused in anotherbatch. One could also try to minimise the number ofwater storage tanks by mixing the sources at about thesame purity levels. However, doing so will always resultin higher utility targets, as the purity of reuse water hasbeen degraded due to water mixing. Hence, there existsa trade-off between the network complexity and operat-ing costs. This remains the scope for future work.
5. Conclusions
A new two-stage approach to synthesise a batchmaximum water recovery (MWR) network based onpinch technology has been developed. In the first stage,time-dependent water cascade analysis (WCA) tech-nique was used to establish various targets for a batch
water recovery network. This includes the overall andinterval-based minimum utility targets (fresh water andwastewater flows), water allocation targets as well as thestorage capacity target. Once these targets are identified,network design was performed in each of the timeintervals. A time-water network diagram was introducedto represent the overall batch water recovery network.
Acknowledgement
The financial support of Ministry of Science,Technology and Environment, Malaysia through In-tensified Research Priority Area (IRPA) research grantand National Science Fellowship (NSF) scholarship isgratefully acknowledged.
References
[1] Wang YP, Smith R. Wastewater minimisation. Chemical Engi-
neering Science 1994;49:981e1006.
[2] Wang YP, Smith R. Wastewater minimization with flowrate
constraints. Transactions of the Institute of Chemical Engineers,
Part A 1995;73:889e904.[3] Wang YP, Smith R. Time pinch analysis. Transactions of the
Institute of Chemical Engineers, Part A 1995;73:905e14.
[4] Dhole VR, Ramchandani N, Tainsh RA, Wasilewski M. Make
your process water pay for itself. Chemical Engineering 1996;103:
100e3.
[5] Olesen SG, Polley GT. A simple methodology for the design of
water networks handling single contaminants. Transactions of the
Institute of Chemical Engineers, Part A 1997;75:420e6.
[6] Kuo W-CJ, Smith R. Design of water-using systems involving
regeneration. Transactions of the Institute of Chemical Engineers,
Part B 1998;76:94e114.[7] Sorin M, Bedard S. The global pinch point in water reuse
networks. Transactions of the Institute of Chemical Engineers,
Part B 1999;77:305e8.
[8] Castro P, Matos H, Fernandes MC, Nunes CP. Improvements for
mass-exchange networks design. Chemical Engineering Science
1999;54:1649e65.
[9] Polley GT, Polley HL. Design better water networks. Chemical
Engineering Progress 2000;96:47e52.
1393D.C.Y. Foo et al. / Journal of Cleaner Production 13 (2005) 1381e1394
[10] Zbontar L, Glavic P. Total site: wastewater minimization.
Wastewater reuse and regeneration reuse. Resources, Conserva-
tion and Recycling 2000;30:261e75.
[11] Feng X, Seider WD. New structure and design method for water
networks. Industrial and Engineering Chemistry Research 2001;
40:6140e6.
[12] Dunn RF, BushG. Process integration technology for CLEANER
production. Journal of Cleaner Production 2001;9:1e23.
[13] Dunn RF, Wenzel H. Process integration design methods for
water conservation and wastewater reduction in industry. Part 1:
design for single contaminant. Cleaner Production Processes
2001;3:307e18.[14] Parthasarathy G, Krishnagopalan G. Systematic reallocation of
aqueous resources using mass integration in a typical pulp mill.
Advances in Environmental Research 2001;5:61e79.
[15] Wenzel H, Dunn RF, Gottrup L, Kringelum J. Process
integration design methods for water conservation and waste-
water reduction in industry. Part 3: experience of industrial
application. Clean Technology and Environmental Policy 2002;4:
16e25.
[16] Hallale N. A new graphical targeting method for wastewater
minimisation. Advances in Environmental Research 2002;6:
377e90.[17] Ujang Z, Wong CL, Manan ZA. Industrial wastewater mini-
misation using water pinch analysis: a case study on an old textile
plant. Water Science and Technology 2002;46(11):77e84.
[18] El-Halwagi MM, Gabriel F, Harrel D. Rigorous graphical
targeting for resource conservation via material reuse/recycle
networks. Industrial and Engineering Chemistry Research 2003;42:
4319e28.[19] Thevendiraraj S, Klemes J, Paz D, Aso G, Cardenas GJ. Water
and wastewater minimisation study of a citrus plant. Resources,
Conservation and Recycling 2003;37:227e50.
[20] Xu D, Hu Y, Hua B, Wang X. Manimization of the flowrate of
fresh water and corresponding regenerated water in water-using
system with regeneration reuse. Chinese Journal of Chemical
Engineering 2003;11(3):257e63.
[21] Liu YA, Lucas B, Mann J. Up-to-date tools for water system
optimization. Chemical Engineering 2004;January:30e41.
[22] Manan ZA, Foo DCY, Tan YL. Targeting the minimum water
flow rate using water cascade analysis technique. AIChE Journal
2004;50(12):3169e83.[23] Prakash R, Shenoy UV. Targeting and design of water networks
for fixed flowrate and fixed contaminant load operations.
Chemical Enginnering Science 2005;60(1):255e68.[24] Takama N, Kuriyama T, Shiroko K, Umeda T. Optimal water
allocation in a petroleum refinery. Computers and Chemical
Engineering 1980;4:251e8.
[25] Takama N, Kuriyama T, Shiroko K, Umeda T. Optimal planning
of water allocation in industry. Journal of Chemical Engineering
of Japan 1980;13(6):478e83.
[26] Takama N, Kuriyama T, Shiroko K, Umeda T. On the
formulation of optimal water allocation problem by linear
programming. Computers and Chemical Engineering 1981;5:
119e21.
[27] Almato M, Sanmartı E, Espuna A, Puigjaner L. Rationalizing the
water use in the batch process industry. Computers and Chemical
Engineering 1997;21:971e6.
[28] Alva-Argaez A, Kokossis AC, Smith R. Wastewater minimisation
of industrial systems using an integrated approach. Computers
and Chemical Engineering 1998;22:S741e4.
[29] Alva-Argaez A, Vallianatos A, Kokossis A. A multi-contaminant
transhipment model for mass exchange network and wastewater
minimisation problems. Computers and Chemical Engineering
1999;23:1439e53.
[30] Huang C-H, Chang C-T, Ling H-C, Chang C-C. A mathematical
programming model for water usage and treatment network
design. Industrial and Engineering Chemistry Research 1999;38:
2666e79.
[31] Almato M, Espuna A, Puigjaner L. Optimisation of water use in
batch process industries. Computers and Chemical Engineering
1999;23:1427e37.
[32] Almato M, Sanmatı E, Espuna A, Puigjaner L. Economic
optimization of the water reuse network in batch process
industries. Computers and Chemical Engineering 1999;23:
S153e6.
[33] Benko N, Rev E, Szitkai Z, Fonyo Z. Optimal water use and
treatment allocation. Computers and Chemical Engineering 1999;
S157e60.[34] Benko N, Rev E, Fonyo Z. The use of nonlinear programming to
optimal water allocation. Chemical Engineering Communication
2000;178:67e101.
[35] Bagajewicz M. A review of recent design procedures for water
networks in refineries and process plants. Computers and
Chemical Engineering 2000;24:2093e113.
[36] Puigjaner L, Espuna A, Almato M. A software tool for helping in
decision-making about water management in batch process
industries. Waste Management 2000;20:645e9.
[37] Savelski M, Bagajewicz M. On the optimality of water utilization
systems in process plants with single contaminant. Chemical
Engineering Science 2000;55:5035e48.
[38] Savelski M, Bagajewicz M. Design of water utilization systems in
process plants with a single contaminant. Waste Management
2000;20:659e64.
[39] Savelski M, Bagajewicz M. Algorithmic procedure to design water
utilization systems featuring a single contaminant in process
plants. Chemical Engineering Science 2001;56:1897e911.[40] Bagajewicz M, Savelski M. On the use of linear models for the
design of water utilization systems in process plants with a single
contaminant. Transactions of the Institute of Chemical Engineers,
Part A 2001;79:600e10.[41] Dunn RF, Wenzel H, Overcash MR. Process integration design
methods for water conservation and wastewater reduction in
industry. Part 2: design for multiple contaminant. Cleaner
Production Processes 2001;3:319e29.[42] Tsai M-J, Chang C-T. Water usage and treatment network design
using genetic algorithms. Industrial and Engineering Chemistry
Research 2001;40:4874e88.
[43] Jacob J, Kaipe H, Couderc F, Paris J. Water network analysis in
pulp and paper processes by pinch and linear programming
techniques. Chemical Engineering Communication 2002;189(2):
184e206.[44] Yang YH, Lou HH, Huang YL. Synthesis of an optimal
wastewater reuse network. Waste Management 2000;20:311e9.
[45] Tan RR. Assessing the sensitivity of wastewater reuse networks to
noisy loads using possibility theory. Chemical Engineering Congress,
Manila, Philippines; 2002.
[46] Koppol ARP, Bagajewicz M, Dericks BJ, Savelski M. On zero
water discharge solutions in the process industry. Advances in
Environmental Research 2003;8:151e71.[47] Tan RR, Cruz DE. Synthesis of robust water reuse networks
using symmetric fuzzy lp superstructures. In: Proceedings of the
International Conference on Chemical and Bioprocess Engineer-
ing, Kota Kinabalu, Malaysia; 2003.
[48] Tan RR, Cruz DE. Synthesis of robust water reuse networks
using fuzzy nonlinear programming. Regional Symposium on
Chemical Engineering, Manila, Philippines; 2003.
[49] Tan RR, Cruz DE. Synthesis of robust water reuse networks for
single-component source/sink retrofit problems using symmetric
fuzzy linear programming. Computers and Chemical Engineering
2004;28:2547e51.
[50] Prakotpol D, Srinophakun T. GAPinch: genetic algorithm
toolbox for water pinch technology. Chemical Engineering and
Processing 2004;43(2):203e17.
1394 D.C.Y. Foo et al. / Journal of Cleaner Production 13 (2005) 1381e1394
[51] Shafier S, Domenech S, Koteles R, Paris J. System closure in pulp
and paper mills: network analysis by genetic algorithm. Journal of
Cleaner Production 2004;12:131e5.
[52] Kim J-K, Smith R. Automated design of discontinuous water
systems. Transactions of the Institute of Chemical Engineers,
Part B 2004;82(B3):238e48.
[53] El-Halwagi MM, Manousiouthakis V. Synthesis of mass
exchange networks. AIChE Journal 1989;35(8):1233e44.[54] El-Halwagi MM, Manousiouthakis V. Automatic synthesis of
mass exchange networks with single component targets. Chemical
Engineering Science 1990;45(9):2813e31.
[55] El-Halwagi MM, Manousiouthakis V. Simultaneous synthesis of
mass exchange and regeneration networks. AIChE Journal
1990;36(8):1209e19.
[56] El-Halwagi MM. Pollution prevention through process in-
tegration: systematic design tools. San Diego: Academic Press;
1997.
[57] Alves JJ, Towler GP. Analysis of refinery hydrogen distribution
systems. Industrial and Engineering Chemistry Research 2002;41:
5759e69.
[58] Vaidyanathan R, Wilks T, Manousiouthakis V, Wilson S. Design
‘‘clean’’ chemical processes. Hydrocarbon Processing 1998;77
(4):79e84.[59] Kemp IC, Macdonald EK. Energy and process integration in
continuous and batch processes. IChemE Symposium Series
1987;105:185e200.
[60] Kemp IC, Macdonald EK. Application of pinch technology to
separation, reaction and batch processes. IChemE Symposium
Series 1988;109:239e57.
[61] Kemp IC, Deakin AW. The cascade analysis for energy and
process integration of batch processes. Part 1: calculation of
energy targets. Transactions of the Institute of Chemical
Engineers, Part A 1989;67:495e509.
[62] Kemp IC, Deakin AW. The cascade analysis for energy and
process integration of batch processes. Part 2: network design and
process scheduling. Transactions of the Institute of Chemical
Engineers, Part A 1989;67:510e6.
[63] Kemp IC,DeakinAW.The cascade analysis for energy and process
integration of batch processes. Part 3: a case study. Transac-
tions of the Institute of Chemical Engineers, Part A 1989;67:
517e25.[64] Foo CY, Manan ZA, Yunus RM, Aziz RA. Synthesis of mass
exchange network for batch processes e Part I: utility targeting.
Chemical Engineering Science 2004;59(5):1009e26.
[65] Foo CY, Manan ZA, Yunus RM, Aziz RA. Synthesis of mass
exchangenetwork forbatchprocessesePart II:minimumunits target
and batch network design. Chemical Engineering Science 2005;
60(5):1349e62.
Dominic Chwan Yee Foo is a Research Associate at Chemical
Engineering Pilot Plant (CEPP), Universiti Teknologi Malaysia. His
main research interests include process synthesis and design as well as
process integration by pinch technology. He obtained his BEng and
MEng degree from Universiti Teknologi Malaysia, both in Chemical
Engineering. He is a member of Institute of Chemical Engineers
Malaysia (IChEM) and IChemE.
Zainuddin A. Manan is an Associate Professor and Head of Chemical
Engineering Department, Universiti Teknologi Malaysia. He received
a BSc Che from Houston, MSc Process Integration from Centre for
Process Integration, UMIST, and PhD in Chemical Engineering from
University of Edinburgh. For 15 years, he has been extensively
involved as a researcher, consultant and trainer for chemical process
industries in the area of process systems design and process
improvement with emphasis on efficient energy utilisation (pinch
analysis) and waste minimisation. He is a member of Institute of
Chemical Engineers Malaysia (IChEM) and IChemE.
Yin LingTan is a research student at Chemical EngineeringDepartment,
Universiti Teknologi Malaysia. Her research interests are mainly in the
area of process integration by pinch technology and process improve-
ment focusing on water minimisation. She received her BEng degree of
Chemical Engineering from Universiti Teknologi Malaysia.