characterization and modeling of static recovery...
TRANSCRIPT

i
CHARACTERIZATION AND MODELING OF STATIC RECOVERY PROCESS OF BRASS (COPPER ZINC) ALLOY
MOHAMAD HAFIZUL HISYAM BIN YAHYA
UNIVERSITI MALAYSIA PAHANG
ii
UNIVERSITI MALAYSIA PAHANG
BORANG PENGESAHAN STATUS TESIS
JUDUL: CHARACTERIZATION AND MODELING OF STATIC RECOVERY
PROCESS OF BRASS (COPPER ZINC) ALLOY
SESI PENGAJIAN: 2008/2009
Saya, MOHAMAD HAFIZUL HISYAM BIN YAHYA (850802-11-5637) (HURUF BESAR)
mengaku membenarkan tesis (Sarjana Muda / Sarjana / Doktor Falsafah)* ini disimpan di perpustakaan dengan syarat-syarat kegunaan seperti berikut: 1. Tesis ini adalah hakmilik Universiti Malaysia Pahang (UMP). 2. Perpustakaan dibenarkan membuat salinan untuk tujuan pengajian sahaja. 3. Perpustakaan dibenarkan membuat salinan tesis ini sebagai bahan pertukaran antara institusi
pengajian tinggi. 4. **Sila tandakan (√)
SULIT (Mengandungi maklumat yang berdarjah keselamatan atau
kepentingan Malaysia seperti yang termaktub di dalam AKTA RAHSIA RASMI 1972)
TERHAD (Mengandungi maklumat TERHAD yang telah ditentukan oleh
organisasi / badan di mana penyelidikan dijalankan)
TIDAK TERHAD
_( A N2T T
√
CATATAN
Disahkan oleh:
________________________ __________________________ TANDATANGAN PENULIS) (TANDATANGAN PENYELIA)
lamat Tetap:
o 7 BANDAR PERMAISURI DR. AHMAD SYAHRIZAN BIN SULAIMAN2100 SETIU (Nama Penyelia) ERENGGANU
arikh: 3 NOVEMBER 2008 Tarikh: 3 NOVEMBER 2008
: * Potong yang tidak berkenaan.
** Jika tesis ini SULIT atau TERHAD, sila lampirkan surat daripada pihak berkuasa/organisasi berkenaan dengan menyatakan sekali tempoh tesis ini perlu dikelaskan sebagai SULIT atau TERHAD. Tesis dimaksudkan sebagai tesis bagi Ijazah Doktor Falsafah dan Sarjana secara Penyelidikan, atau disertasi bagi pengajian secara kerja kursus dan penyelidikan, atau Laporan Projek Sarjana Muda (PSM).
ii
CHARACTERIZATION AND MODELING OF STATIC RECOVERY PROCESS OF BRASS (COPPER ZINC) ALLOY
MOHAMAD HAFIZUL HISYAM BIN YAHYA
A report submitted in partial fulfillment of the requirements for the award of the degree of
Bachelor of Mechanical Engineering
Faculty of Mechanical Engineering UNIVERSITI MALAYSIA PAHANG
NOVEMBER 2008
iii
SUPERVISOR’S DECLARATION
We hereby declare that we have checked this project and in our opinion this project is
satisfactory in terms of scope and quality for the award of the degree of Bachelor of
Mechanical Engineering.
…………………................
Name of Supervisor: DR. AHMAD SYAHRIZAN BIN SULAIMAN
Position: HEAD OF PROGRAM, FACULTY OF MECHANICAL ENGINEERING
Date: 12 NOVEMBER 2008
…………………................
Name of Panel: NUR AZHANI BINTI ABD RAZAK
Position: LECTURER
Date: 12 NOVEMBER 2008
iv
STUDENT’S DECLARATION
I hereby declare that the work in this thesis is my own except for quotations and
summaries which have been duly acknowledged. The thesis has not been accepted
for any degree and is not concurently submitted for award of other degree.
…………………………......
Name: MOHAMAD HAFIZUL HISYAM BIN YAHYA
ID Number: MA 06004
Date: 03 NOVEMBER 2008

v
To my beloved mother and knowledge of human kind
vi
ACKNOWLEDGEMENTS
I am grateful and would like to express my sincere gratitude to my supervisor
Dr. Ahmad Syahrizan Bin Sulaiman for his excellence ideas, invaluable guidance,
continuous encouragement and constant support in making this research possible. I
appreciate his consistent support from the first day I applied to graduate program to
these concluding moments. I am truly grateful for his professionalism while making
decision, his tolerance of my naïve mistakes, and his commitment to my future
career. I also would like to express very special thanks to all other lecturer involve
for my final year project for their suggestions and co-operation throughout the study.
I also sincerely thanks for the time spent proofreading and correcting my many
mistakes.
My sincere thanks go to all my members of the student of the bachelor
mechanical engineering, UMP, who helped, supported and critiqued me in many
ways. Many special thanks go to all instructor engineer and assistant instructor
engineer for their excellent co-operation and supported during this study.
I acknowledge my sincere indebtedness and gratitude to my mother for their
love, supported, excellence ideas, advices, patience and sacrifice throughout my life.
I am also grateful to my bother and sister who willing to hear and supported my idea
about this project.
vii
ABSTRACT
Static recovery process is a process of restoration of material properties back
to original state. This process only occurs just below recrystallization temperature. In
static recovery condition the dislocation of material is annihilated so the internal
stress of material could be released. To obtain fraction of recovery, brass will be pre
strain in various amount of value before go through annealing process in various
static recovery temperature. This experimental process starts with machining the
specimens by using manual lathe machining. Then all the specimens will be annealed
in recrystallization temperature which is 570˚C. Next process is pre strain in various
pre strain performed by compression and tensile test machine. After that process,
specimens will be annealed in recovery temperature which is below 290˚C. Then
final pre strain will be performed to obtain yield strength of recovered material.
Finally based on the experimental data Friedel’s model is used to acquire activation
energy. From the calculation some of the activation energy value could be acquire
such as -30 kJ/mol, 516 kJ/mol, 276 kJ/mol and 349 kJ/mol. These values of
activation energy are compared with value obtained by using same method that used
by Martinez which is in range of 216-357 kJ/mol. From the comparison percent of
difference can be acquire. Since this percent of difference could be acquired, the
significant value can be obtained and this is how Friedel’s model is validated.
viii
ABSTRAK
Proses pemulihan statik merupaka satu proses pemulihan sifat bahan kembali kepada
keadaan asal. Pemulihan statik hanya berlaku dibawah suhu penghabluran semula.
Pada keadaan pemulihan statik, logam terherot akan dihapuskan supaya tegasan
dalaman bahan tersebut dapat dilepaskan. Untuk mendapatkan darjah pemulihan,
loyang akan di pra terikan dalam beberapa nilai sebelum disepuh lindap dalam
beberapa nilai dalam suhu pemulihan statik. Proses ujikaji ini dimulakan memesin
bahan ujikaji dengan menggunakan mesin larik secara manual. Kemudian semua
bahan ujikaji akan disepuh lindap pada susu penghabluran semula iaitu pada suhu
570˚C. Proses seterusnya ialah pra terikkan dalam beberapa nilai dengan menggukan
mesin mampatan dan mesin teikkan. Setelah proses tersebut dijalankan, bahab ujikaji
akan disepuh lindap pada suhu pemulihan static iaitu dibawah suhu 290˚C. Pra
terikkan terakhir akan dijalankan utuk mengetahui nilai kekuatan alah bahan yang
telah pulih. Akhir sekali daripada data ujikaji permedelan Friedel digunakan untuk
mendapatkan nilai tanaga pengaktifan. Daripada pengiraan nilai tenaga penaktifan
dapat diperolehi antaranya ialah-30 kJ/mol, 516 kJ/mol, 276 kJ/mol and 349 kJ/mol.
Niali-nilai ini akan dibandingkan dengan nilai yang diperolehi dengan menggunakan
cara yang sama yang digunakan oleh Martinez iaitu dalam julat 216-357 kJ/mol.
Daripada perbandingan tersebut peratusan pembezaan dapat diperolehi. Oleh kerana
peratusan pembezaan dapat diperolehi, nilai yang berkaitan dapat diperolehi dan
inilah cara pemoldelan Fridel dapat di buktikan.
ix
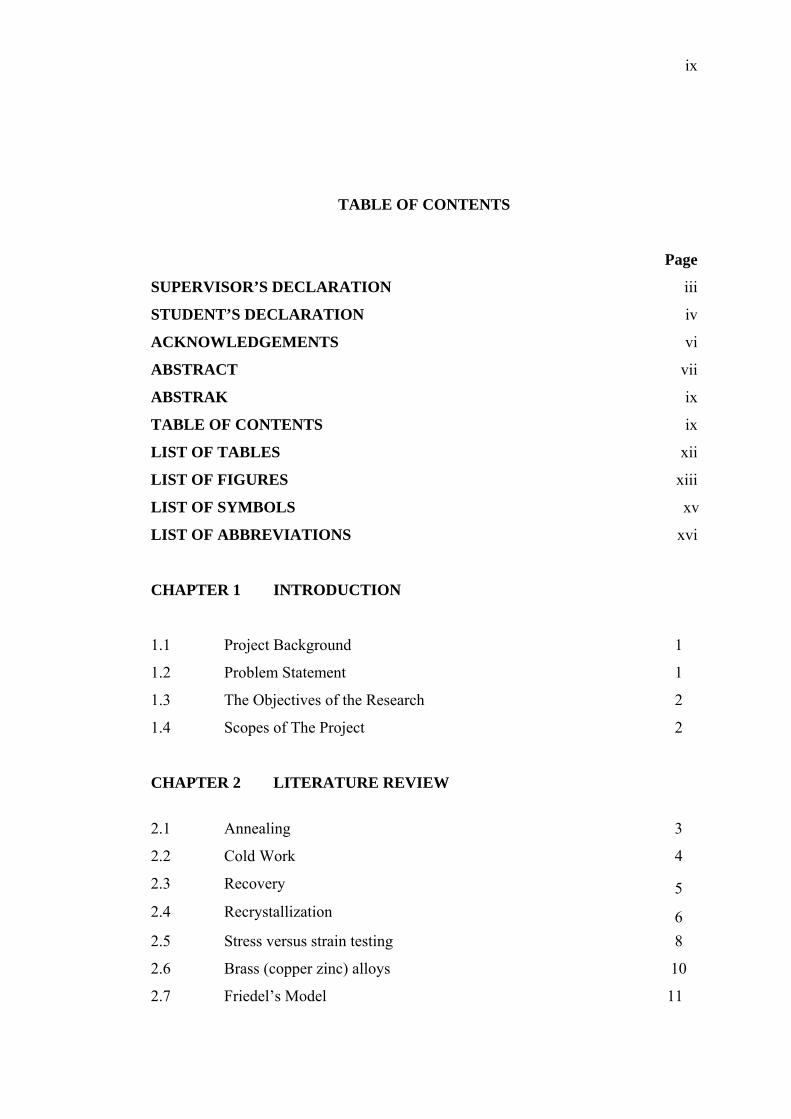
TABLE OF CONTENTS
Page
SUPERVISOR’S DECLARATION iii
STUDENT’S DECLARATION iv
ACKNOWLEDGEMENTS vi
ABSTRACT vii
ABSTRAK ix
TABLE OF CONTENTS ix
LIST OF TABLES xii
LIST OF FIGURES xiii
LIST OF SYMBOLS xv
LIST OF ABBREVIATIONS xvi
CHAPTER 1 INTRODUCTION
1.1 Project Background 1
1.2 Problem Statement 1
1.3 The Objectives of the Research 2
1.4 Scopes of The Project 2
CHAPTER 2 LITERATURE REVIEW
2.1 Annealing 3
2.2 Cold Work 4
2.3 Recovery 5 2.4 Recrystallization 6 2.5 Stress versus strain testing 8
2.6 Brass (copper zinc) alloys 10
2.7 Friedel’s Model 11
x
2.8 Modeling Recovery Kinetic 12
2.8.1 Arrhenius Rate Method 18
CHAPTER 3 METHODOLOGY
3.1 Introduction 20
3.2 Flow Chart 21
3.3 Lathe Machining 22 3.4 Annealing The Specimen 23 3.5 Pre Strain 24
3.6 Annealing In Static Recovery Temperature 25
3.7 Tensile or Compression Test of The Recovered Material 26 3.8 Find Fraction of Recovery 27 Graph Plotting 27 Friedel’s Modeling 28
CHAPTER 4 RESULTS AND DISCUSSION
4.1 Introduction 31
4.2 Result 31
4.2.1. Results for Compression Test on Recovery Vs Time 31 4.2.2. Results for Compression Test on Recovery Vs
Temperature 34
4.2.3. Results for Compression Test on Recovery Vs Pre Strain 36 4.2.4. Results for Tensile Test on Recovery Vs Time 37 4.2.5. Results for Tensile Test on Recovery Vs Temperature 40 4.2.6. Results for Tensile Test on Recovery Vs Pre Strain 42 4.3 Modeling Recovery Kinetic 44
CHAPTER 5 CONCLUSION AND RECOMMENDATIONS
5.1 Conclusions 49
5.2 Recommendations 50

xi
REFERENCES 51
APPENDICES 52
A Drawing of tensile test specimen 52 B Drawing of compression test specimen 53
C Data collected from Martinez journal 54
D Gantt chart 55
E Picture during final year project 56

xii
LIST OF TABLES
Table No. Page 2.1 Summary of Stress strain testing values 9 2.2 Data Constant a and b. 14 4.1 Data Recovery vs. Times at 280˚C and 5% pre strain 32 4.2 Data Recovery vs. Temperatures at 5% pre strain in 1 Hour 34 4.3 Data Recovery vs. Times at 280˚C and 5% pre strain 36 4.4 Data Recovery vs. Pre-Strain at 230˚C and 5% pre strain. 38 4.5 Data Recovery vs. Temperatures at 5% pre strain in 1 Hour 40 4.6 Data Recovery vs. Pre-Strain at 230˚C in 1 Hour 43
xiii
LIST OF FIGURES
Figure No. Page 2.1 Schematic illustration of effect of annealing temperature on Brass 4 2.2 A cold worked Brass 5 2.3 (a) Deform metal crystal showing dislocation. 6 2.3 (b) After recovery heat treatment, dislocations move to small angle
grain boundaries 6
2.4(a) A cold worked Brass. 8 2.4(b) After 3 s at 580°C. 8 2.4(c) After 4 s at 580°C. 8 2.4(d) After 8 s at 580°C. 8 2.4(e) After 1 hour at 580°C. 8 2.5 Stress strain curve. 9 2.6 Binary phase diagrams of Copper Zinc. 10 2.7 Evolution of the fraction of residual strain versus function of the
annealing time in vary temperature on a logarithmic time scale 13
2.8 The relation between a and temperatures in degree Celsius. 14 2.9 The relation between b and temperatures in degree Celsius. 15 2.10 The natural logarithm of the instantaneous rate of recovery
calculated at various Xrec value vs. the inverse temperature. 16
2.11 The relations between activation energy and fraction of recovery. 17 2.12 19 2.13 19 3.1 Tensile test specimen dimensions. 22
xiv
3.2 Compression test specimen dimensions. 22 3.3 Annealing graph for brass. 24 3.4 Brasses after annealed in static recovery temperature. 26 3.5 Relation of Friedel’s model with linear equation on graph fraction
of recovery versus time. 29
3.6 Relation of Friedel’s model with linear equation on graph fraction
of recovery versus inverse of temperature. 29
4.1 Graph fraction of recovery versus time at 280˚C and 5% pre
strain. 33
4.2 Graph fractions of recovery versus temperature in an hour and 5%
pre strain. 35
4.3 Graph fraction of recovery versus pre strain at 280˚C in an hour. 37 4.4 Graph fraction of recovery versus time at 230˚C and 5% pre
strain. 38
4.5 Graph fractions of recovery versus temperature in an hour and 5%
pre strain 41
4.6 Graph fraction of recovery versus pre strain at 230˚C in an hour. 43 4.7 Evolution of the fraction of residual strain versus function of the
annealing time in vary temperature on a logarithmic time scale of brass.
44
4.8 The relation between a and temperatures in degree Celsius. 45 4.9 The relation between b and temperatures in degree Celsius. 45 4.10 The natural logarithm of the instantaneous rate of recovery
calculated at various Xrec value vs. the inverse temperature of brass material.
46
4.11 The relations between activation energy and fraction of recovery
of brass. 47
xv
LIST OF SYMBOLS
ε Strain σ∆ Stress difference
mσ Yield stress of deformed material
oσ Yield stress of recover material
rσ Yield stress of undeformed material
recX Fraction of recovery
Q Activation energy t Time R Gas constant T Temperature c1 Constant a Constant b Constant
xvi
LIST OF ABBREVIATIONS
ASTM American Society for Testing and Materials Cu Copper Zn Zinc CNC Computer Numerical Control
1
CHAPTER 1
INTRODUCTION
1.1 Project Background
Mechanical properties of metals can be changed by heat treatment process. T
process typically done by combining varied types of mechanical deformation
annealing processes. Static recovery only occurs below recrystallization temperature
involves motion and extermination of point deflects as well as extermination and
arrangement of dislocation. It will result the formation of subgrain and subg
boundaries. The unique feature of static recovery process is that it does not involve
change in grain structure of cold worked metal, the only changes is the disloca
disarrangement within existing grain. It is proposed that a series of heat treatm
experiments are performed brass alloys in order to properly characterize the st
recovery process. In this research tensile test will used to determine the differenc
stress of static recovery between varies pre-strain specimens. Mathematical model
produced from the static recovery behavior. The mathematical will be useful too
predict commercial end product mechanical properties.
his
and
and
re
rain
any
tion
ent
atic
e of
will
l to
2
1.2 Problem Statement
Static recovery is process of grain recovery below recrystallization temperature.
Friedel’s model states that the degree of recovery depends on the amount of pre strain,
time and temperature. It is important to validate this Friedel’s model so the manufacturer
can easily predict end of the result after recovery process.
1.3 Objective
To validate Friedel’s model static recovery process for brass (cooper zinc) alloy
1.4 Project Scopes
This focus area is done based on the following aspect:
(i) Analyze stress difference using tensile and compression test.
(ii) Material used only Brass (copper zinc).
(iii) Pre strain at 2.5% - 12.5%.
(iv) Analyze static recovery.
(v) Specimens for tensile and compression test machine by manual machining.
3
CHAPTER 2
LITERATURE REVIEW
2.1 ANNEALING
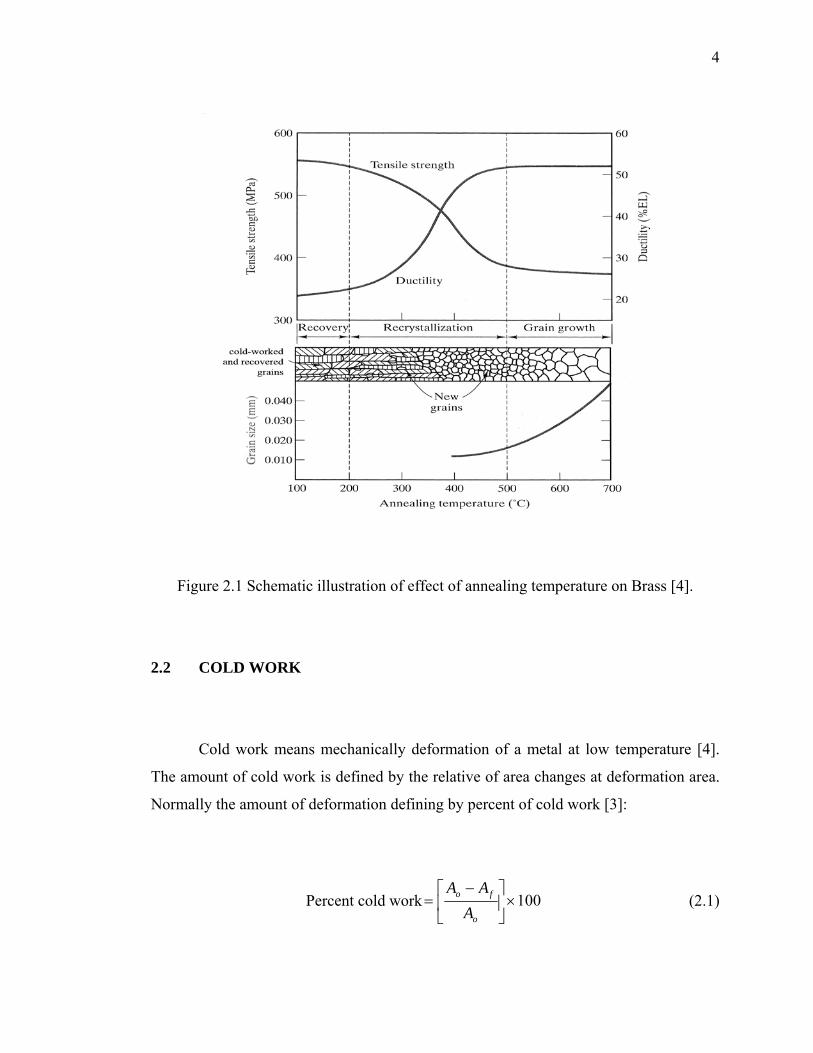
Annealing is a process of heat treatment used to eliminate the effect of c
working. Annealing in low temperature condition may be used to remove residual st
during cold work process [3]. Annealing also know as stress relief by relieving inte
strain from cold work, welding or some fabrication process [2]. Two common prac
annealing process is full annealing process annealing. Full annealing involves hea
the material to austenite region. For process annealing the material involve heating
point just below the austenite transition temperature. Upon annealing several proce
occur such as there is a large decrease in the number of point defects. There are
dislocations of opposite sign attract and exterminate each other. Then the dislocat
rearrange themselves into lower energy configurations. Finally both point defects
dislocations are absorbed by grain boundaries migrating through the material. In
case, there is reduction will occur in the grain boundary area. Figure 2.1 show effec
annealing temperature on strength and ductility of Brass alloy. It’s shown that mos
the softening alloy occurs during the recrystallization stage. For brasses annea
temperature usually in range of 430-650°C and stress relief usually perform in 1 h
with temperature range of 204-260°C [2].
old
ress
rnal
tice
ting
to a
sses
also
ions
and
this
t of
t of
ling
our
4
Figure 2.1 Schematic illustration of effect of annealing temperature on Brass [4].
2.2 COLD WORK
Cold work means mechanically deformation of a metal at low temperature [4].
The amount of cold work is defined by the relative of area changes at deformation area.
Normally the amount of deformation defining by percent of cold work [3]:
Percent cold work 100×⎥⎦
⎤⎢⎣
⎡ −=
o
fo
AAA
(2.1)
5
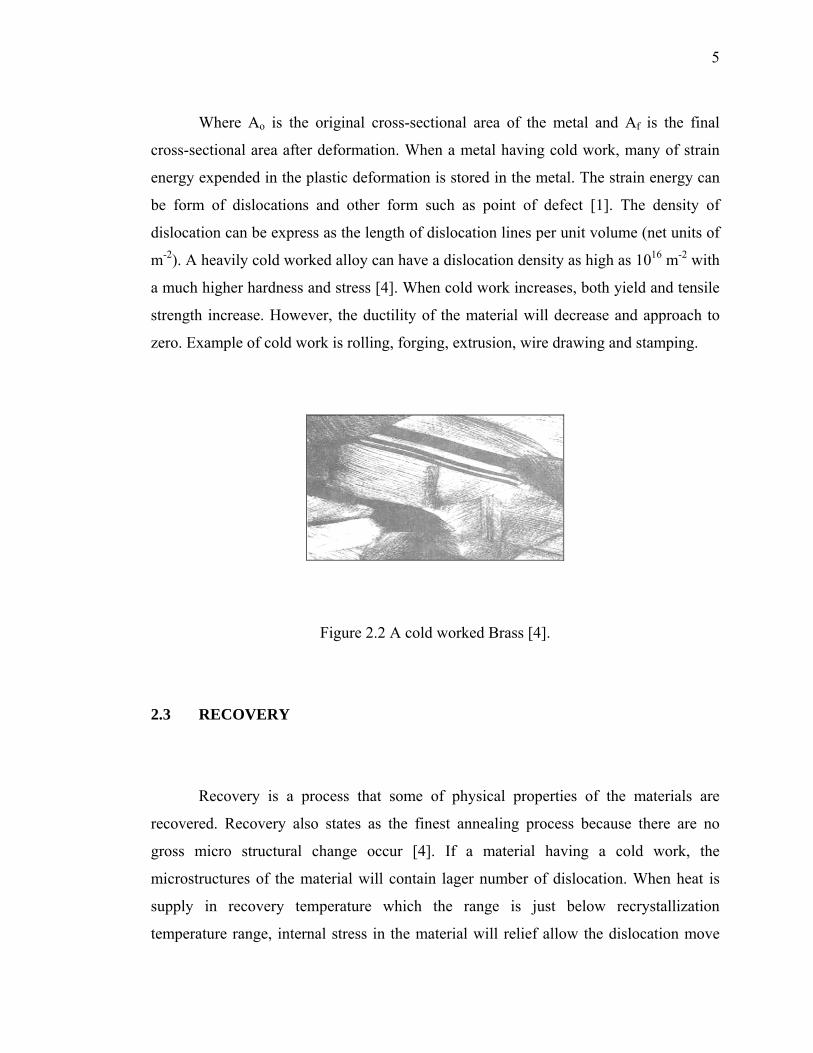
Where Ao is the original cross-sectional area of the metal and Af is the final
cross-sectional area after deformation. When a metal having cold work, many of strain
energy expended in the plastic deformation is stored in the metal. The strain energy can
be form of dislocations and other form such as point of defect [1]. The density of
dislocation can be express as the length of dislocation lines per unit volume (net units of
m-2). A heavily cold worked alloy can have a dislocation density as high as 1016 m-2 with
a much higher hardness and stress [4]. When cold work increases, both yield and tensile
strength increase. However, the ductility of the material will decrease and approach to
zero. Example of cold work is rolling, forging, extrusion, wire drawing and stamping.
Figure 2.2 A cold worked Brass [4].
2.3 RECOVERY
Recovery is a process that some of physical properties of the materials are
recovered. Recovery also states as the finest annealing process because there are no
gross micro structural change occur [4]. If a material having a cold work, the
microstructures of the material will contain lager number of dislocation. When heat is
supply in recovery temperature which the range is just below recrystallization
temperature range, internal stress in the material will relief allow the dislocation move
6
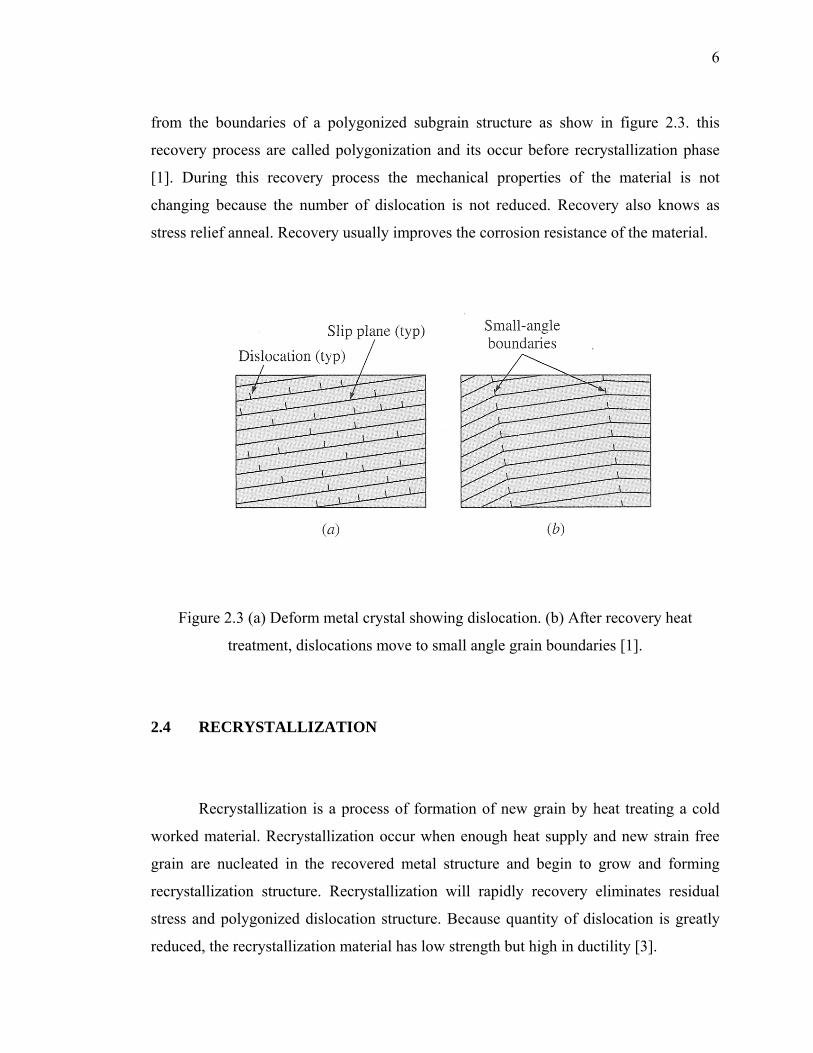
from the boundaries of a polygonized subgrain structure as show in figure 2.3. this
recovery process are called polygonization and its occur before recrystallization phase
[1]. During this recovery process the mechanical properties of the material is not
changing because the number of dislocation is not reduced. Recovery also knows as
stress relief anneal. Recovery usually improves the corrosion resistance of the material.
Figure 2.3 (a) Deform metal crystal showing dislocation. (b) After recovery heat
treatment, dislocations move to small angle grain boundaries [1].
2.4 RECRYSTALLIZATION
Recrystallization is a process of formation of new grain by heat treating a cold
worked material. Recrystallization occur when enough heat supply and new strain free
grain are nucleated in the recovered metal structure and begin to grow and forming
recrystallization structure. Recrystallization will rapidly recovery eliminates residual
stress and polygonized dislocation structure. Because quantity of dislocation is greatly
reduced, the recrystallization material has low strength but high in ductility [3].
7
Primary recrystallization occurs by two principal which is an isolated nucleus
can expand with deformation grain or original high angle grain boundary can travel into
more highly deform region of material. Recrystallization will occur if there is a
minimum deformation of the material. If the degree of deformation is small (above
minimum) the temperature for recrystallization occurs is higher. To decrease the time for
recrystallization the temperature should be increase.
The degree of deformation will affect the final size of grain size. If there are
more deformation, the lower annealing temperature for recrystallization and the smaller
grain size. Grater amount of deformation needed to produce an equivalent
recrystallization if the grain size is big. The purity of material will decrease the
recrystallization temperature. Figure 2.4 show recrystallization process occurs in Brass
in various times.
The figure 2.4 shown Brass grain after having cold work. Then new grain starts
to appear after 3 seconds at temperature 580°C. The process continues after 4 seconds
and many more grain appear. The complete recrystallization occurs after 8 second and
substantial grain growth occur after 1 hour.
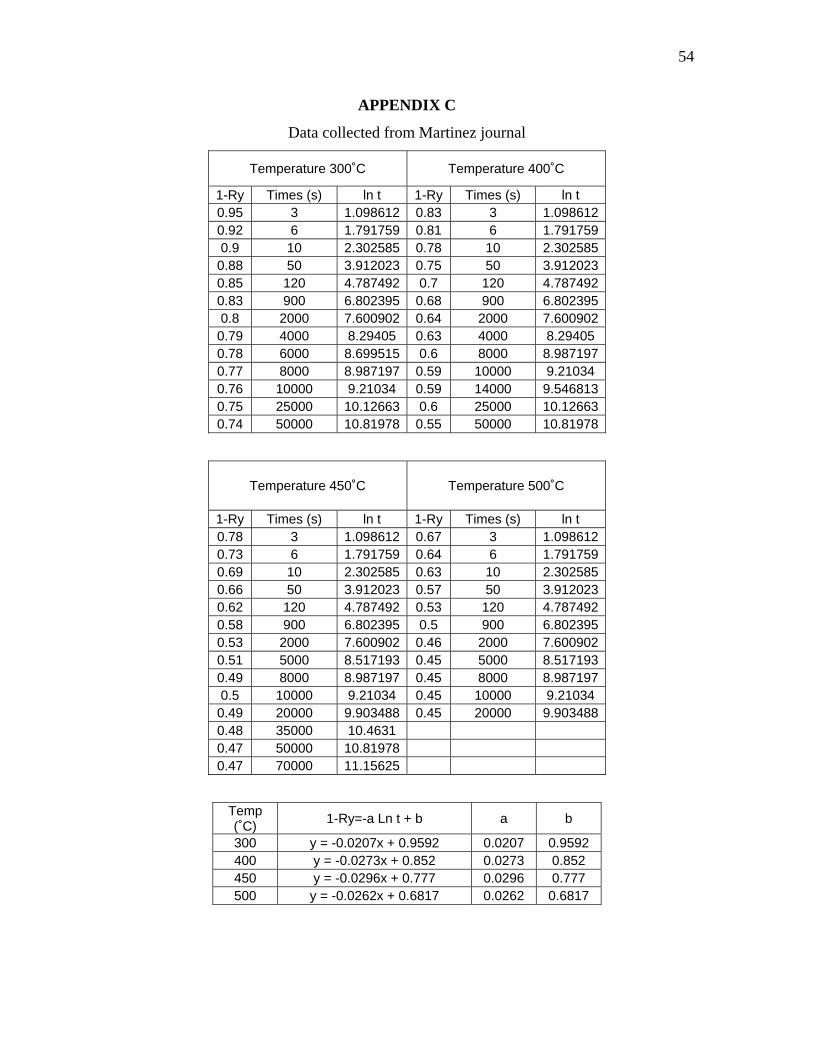
54
APPENDIX C
Data collected from Martinez journal
Temperature 300˚C Temperature 400˚C
1-Ry Times (s) ln t 1-Ry Times (s) ln t 0.95 3 1.098612 0.83 3 1.098612 0.92 6 1.791759 0.81 6 1.791759 0.9 10 2.302585 0.78 10 2.302585 0.88 50 3.912023 0.75 50 3.912023 0.85 120 4.787492 0.7 120 4.787492 0.83 900 6.802395 0.68 900 6.802395 0.8 2000 7.600902 0.64 2000 7.600902 0.79 4000 8.29405 0.63 4000 8.29405 0.78 6000 8.699515 0.6 8000 8.987197 0.77 8000 8.987197 0.59 10000 9.21034 0.76 10000 9.21034 0.59 14000 9.546813 0.75 25000 10.12663 0.6 25000 10.12663 0.74 50000 10.81978 0.55 50000 10.81978
Temperature 450˚C Temperature 500˚C
1-Ry Times (s) ln t 1-Ry Times (s) ln t 0.78 3 1.098612 0.67 3 1.098612 0.73 6 1.791759 0.64 6 1.791759 0.69 10 2.302585 0.63 10 2.302585 0.66 50 3.912023 0.57 50 3.912023 0.62 120 4.787492 0.53 120 4.787492 0.58 900 6.802395 0.5 900 6.802395 0.53 2000 7.600902 0.46 2000 7.600902 0.51 5000 8.517193 0.45 5000 8.517193 0.49 8000 8.987197 0.45 8000 8.987197 0.5 10000 9.21034 0.45 10000 9.21034 0.49 20000 9.903488 0.45 20000 9.903488 0.48 35000 10.4631 0.47 50000 10.81978 0.47 70000 11.15625
Temp (˚C) 1-Ry=-a Ln t + b a b
300 y = -0.0207x + 0.9592 0.0207 0.9592 400 y = -0.0273x + 0.852 0.0273 0.852 450 y = -0.0296x + 0.777 0.0296 0.777 500 y = -0.0262x + 0.6817 0.0262 0.6817

55
APPENDIX D
Gantt chart final year project 1
Gantt chart final year project 2
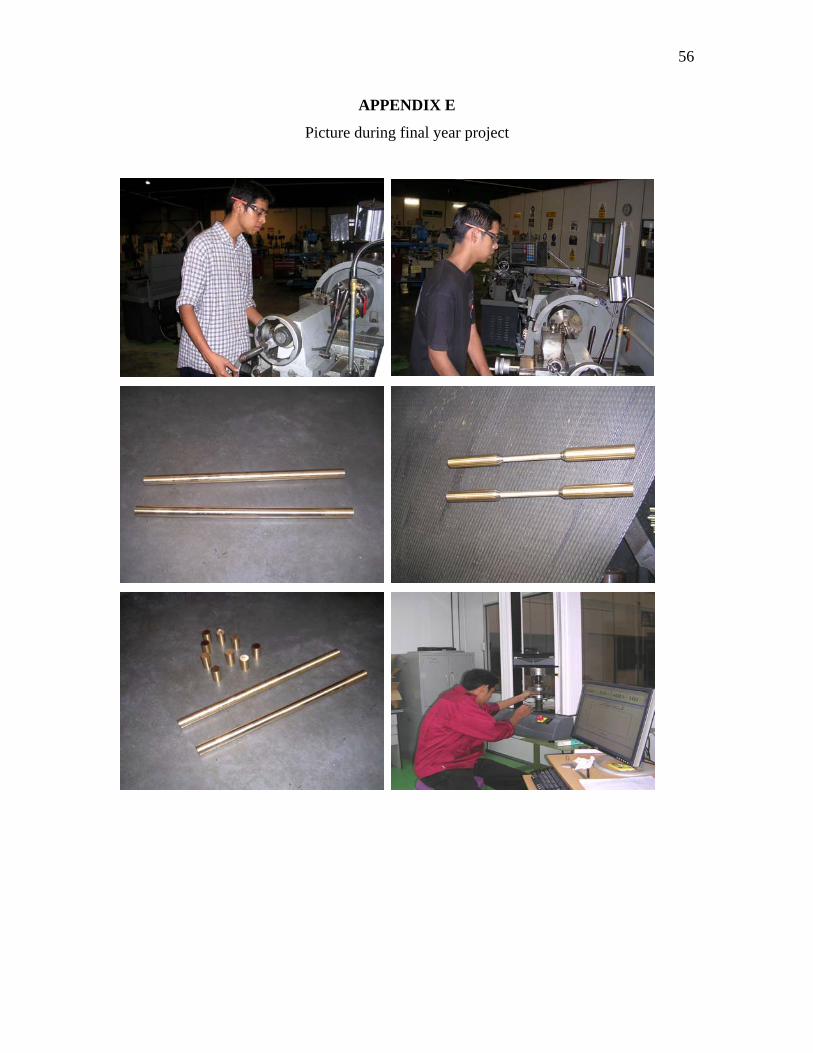
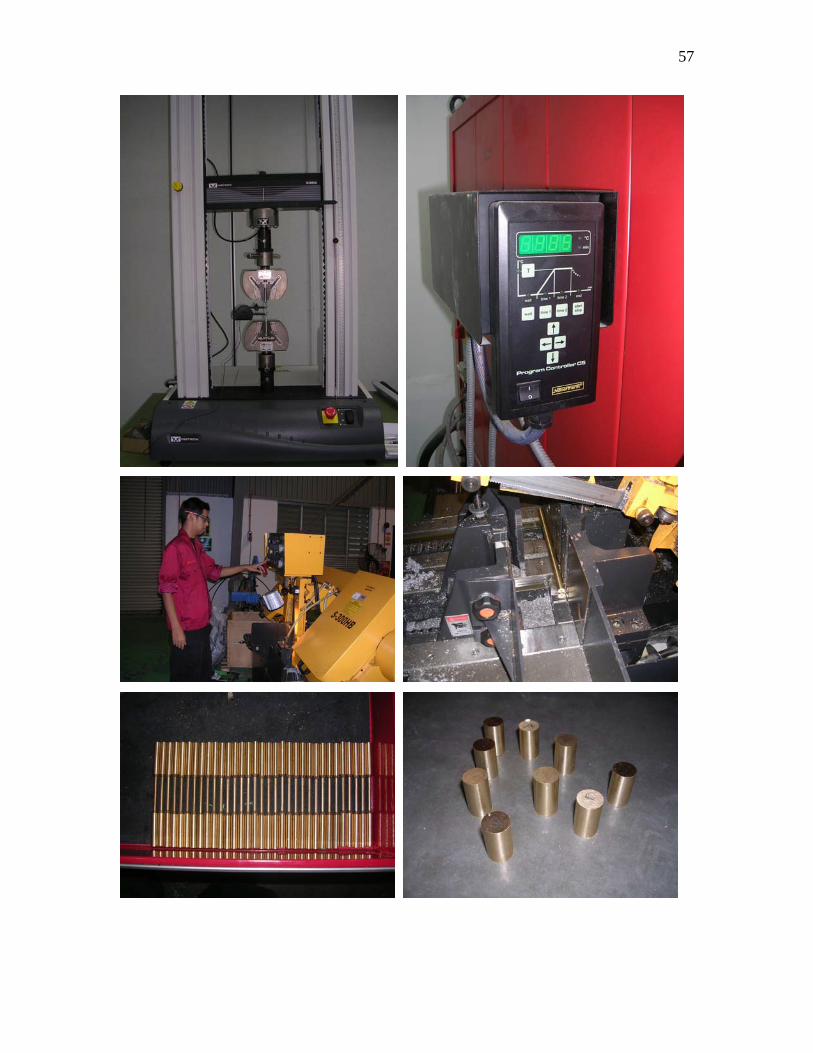
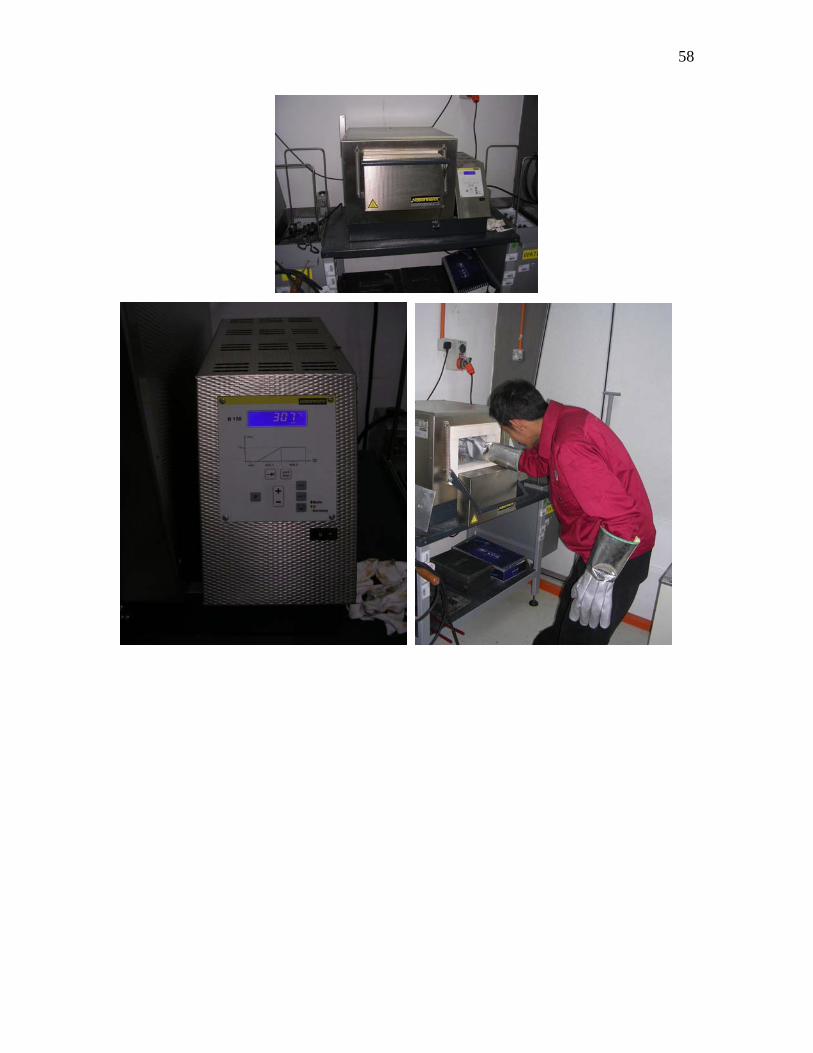
56
APPENDIX E
Picture during final year project
57
58