mangrove carbon stock assessment by optical satellite imagery
TRANSCRIPT

Journal of Tropical Forest Science 25(4): 554–565 (2013) Hamdan O et al.
554© Forest Research Institute Malaysia
MANGROVE CARBON STOCK ASSESSMENT BY OPTICAL SATELLITE IMAGERY
O Hamdan1, *, MR Khairunnisa2, AA Ammar3, I Mohd Hasmadi2 & H Khali Aziz1
1Forest Research Institute Malaysia, 52109 Kepong, Selangor Darul Ehsan, Malaysia2Faculty of Forestry, Universiti Putra Malaysia, 43400 Serdang, Selangor Darul Ehsan, Malaysia3School of Geography Planning and Environmental Management, University of Queensland, Brisbane, St Lucia QLD 4072, Australia
Received November 2012
HAMDAN O, KHAIRUNNISA MR, AMMAR AA, MOHD HASMADI I & KHALI AZIZ H. 2013. Mangrove carbon stock assessment by optical satellite imagery. Matang Mangrove Forest Reserve or known as Matang Mangroves is the largest single mangroves in Peninsular Malaysia. Covering an area of about 41,000 ha, majority of this area is forest reserve. Mangroves have long been known as extremely productive ecosystem that cycle carbon (C) rapidly, but studies related to carbon in this ecosystem are limited. This study was carried out to assess the carbon stock and quantify their changes following deforestation, wood extraction and forest degradation. Landsat-TM and SPOT-5 satellite images for 1991 and 2011 respectively were utilised to identify mangroves. Vegetation index generated from the images was used as a variable to indicate carbon stock and it was correlated to forest inventory information through regression. The study showed that carbon stocks of Matang Mangroves ranged from 1.03 to 263.65 t C ha-1 and 1.01 to 259.68 t C ha-1 for the years 1991 and 2011 respectively. Total carbon stock in Matang Mangroves was estimated at about 3.04 mil t C in year 1991 and 2.15 mil t C in 2011. The study suggested that the traditional use of vegetation index from optical imagery systems is still relevant and viable in vegetative studies.
Keywords: Landsat-TM, SPOT-5, vegetation index, aboveground carbon
HAMDAN O, KHAIRUNNISA MR, AMMAR AA, MOHD HASMADI I & KHALI AZIZ H. 2013. Penilaian stok karbon hutan paya laut menggunakan imej satelit optik. Hutan Simpan Paya Laut Matang atau lebih dikenali sebagai Hutan Bakau Matang merupakan hutan paya laut yang terbesar di Semenanjung Malaysia. Meliputi kawasan seluas kira-kira 41,000 ha, majoritinya merupakan hutan simpan. Hutan paya laut telah sekian lama terkenal sebagai satu ekosistem yang amat produktif dalam pengitaran karbon (C). Bagaimanapun, kajian berkaitan karbon dalam ekosistem ini adalah terhad. Kajian ini dijalankan untuk menentukan stok karbon serta menilai perubahannya akibat daripada pembasmian hutan, pengeluaran kayu dan juga degradasi hutan. Imej satelit Landsat-TM dan SPOT-5 masing-masing bagi tahun 1991 dan 2011 telah diguna untuk mengenal pasti hutan paya laut. Indeks tumbuhan yang dihasilkan daripada imej satelit dijadikan pemboleh ubah sebagai penunjuk kepada stok karbon dan indeks tersebut dihubungkan kepada maklumat inventori hutan melalui kaedah regresi. Kajian menunjukkan bahawa stok karbon di Hutan Bakau Matang masing-masing berjulat antara 1.03 t C ha-1 hingga 263.65 t C ha-1 dan 1.01 t C ha-1 hingga 259.68 t C ha-1 bagi tahun 1991 dan 2011. Sementara itu, stok karbon yang terdapat di Hutan Bakau Matang dianggarkan berjumlah 3.04 juta t C pada tahun 1991 dan 2.15 juta t C pada tahun 2011. Kajian menyarankan bahawa kegunaan indeks tumbuhan masih lagi relevan dan boleh dipraktikkan dalam kajian berkaitan tumbuhan.
INTRODUCTION
Mangrove forests play an important role as a substantial coastal carbon (C) sink. They are ranked among the most carbon-rich forests in the tropics with an average storage of 1023 t C ha-1 (Laffoley & Grimsditch 2009). Mangroves have been estimated to have higher amounts of carbon than the other types of forest, with a storage capacity of between 990 and
1074 t C ha-1 (Donato et al. 2011). It is interesting to note that although plant biomass in the ocean and coastal areas comprises only 0.05% of the total plant biomass on land, it cycles a comparable amount of carbon each year (Bouillon et al. 2008). A typical hectare of mangrove has the potential to release as much carbon as a 3 to 5 ha of terrestrial tropical forest (Ong 1993,
Journal of Tropical Forest Science 25(4): 554–565 (2013) Hamdan O et al.
555© Forest Research Institute Malaysia
Murray et al. 2011). Effective management and conservation of the mangrove ecosystem would be vital in any effort to address climate change (Ong 1993). However, despite being a crucial component in the global carbon cycle and having potentially profound influence on climate change, the areal extent of mangrove forests has declined significantly as a result of coastal development, aquaculture expansion and over-harvesting (FAO 2007). Malaysia lost a total areal extent of approximately 111,046 ha of mangrove forests from 1973 till 2000 due to unsustainable forestry practices, illegal harvests, agriculture, aquaculture, construction of airports and harbours, industrialisation and urbanisation, land reclamation for coastal development and waste disposal and pollution (Chong & Sasekumar 2002). The most significant losses have been in Peninsular Malaysia where large areas have been converted into coastal roads, aquacultural, agricultural land and housing estates (Giesen et al. 2006, Hamdan et al. 2012). Mangrove forests sequester carbon faster and longer than any terrestrial forest but they have been cleared at a much faster rate. Thus, there is an urgent and growing need for methods of quantifying the spatial variation of carbon stock in the ecosystem. This is essential to form a better understanding of how carbon dynamics respond to changes in time and space. It will also enable the formulation of management strategies that could incorporate the management of carbon stock to promote efficient and sustainable use of ecosystem services. Satellite remote sensing offers the potential to methodologically quantify carbon dynamics in a more detailed and accurate manner. Recent advancement in technology has not only improved the accuracy of remote sensing for mapping and change detection but has also led to increased capability of estimating standing biomass (Proisy et al. 2007). It offers the ability to effectively measure and monitor large forested areas in a very consistent and robust manner (Huete 2012). Remote sensing is also a potentially effective tool because it offers a cost effective and non-intrusive method in the analysis of the characteristics of mangroves. This study aimed to quantify and characterise carbon dynamics of Matang Mangrove Forest Reser ve (hereafter Matang Mangroves) in Malaysia by applying satellite remote sensing
techniques. Whilst an extensive range of studies have focused on estimation of biomass and the productivity of Matang Mangroves (Putz & Chan 1986, Gong & Ong 1990, Ong et al. 1995), these studies have primarily focused on specific date or time. No study has extensively analysed the carbon flux of Matang Mangroves over a period of time. This study was designed to address literature gap in the carbon dynamics of a managed mangrove forest. It was conducted to (1) derive an empirical relationship between mangrove carbon stock and vegetation indices of optical satellite images, (2) produce spatial distribution map of carbon stock, (3) quantify changes of carbon stock that occurred within 20 years from 1991 till 2011 over the whole Matang Mangroves and (4) identify the variation of forest carbon in a managed mangrove forest.
MATERIALS AND METHODS
Study area
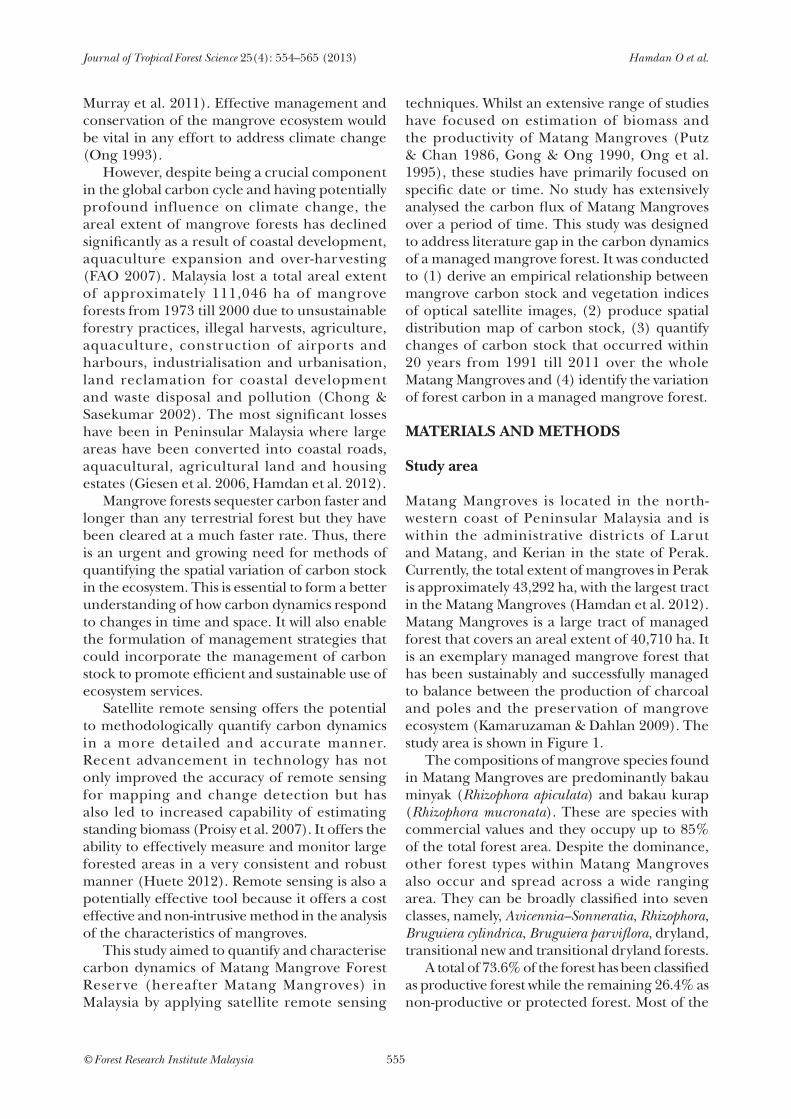
Matang Mangroves is located in the north-western coast of Peninsular Malaysia and is within the administrative districts of Larut and Matang, and Kerian in the state of Perak. Currently, the total extent of mangroves in Perak is approximately 43,292 ha, with the largest tract in the Matang Mangroves (Hamdan et al. 2012). Matang Mangroves is a large tract of managed forest that covers an areal extent of 40,710 ha. It is an exemplary managed mangrove forest that has been sustainably and successfully managed to balance between the production of charcoal and poles and the preservation of mangrove ecosystem (Kamaruzaman & Dahlan 2009). The study area is shown in Figure 1. The compositions of mangrove species found in Matang Mangroves are predominantly bakau minyak (Rhizophora apiculata) and bakau kurap (Rhizophora mucronata). These are species with commercial values and they occupy up to 85% of the total forest area. Despite the dominance, other forest types within Matang Mangroves also occur and spread across a wide ranging area. They can be broadly classified into seven classes, namely, Avicennia–Sonneratia, Rhizophora, Bruguiera cylindrica, Bruguiera parviflora, dryland, transitional new and transitional dryland forests. A total of 73.6% of the forest has been classified as productive forest while the remaining 26.4% as non-productive or protected forest. Most of the
Journal of Tropical Forest Science 25(4): 554–565 (2013) Hamdan O et al.
556© Forest Research Institute Malaysia
productive forests consist of mainly Rhizophora stands (Putz & Chan 1986). The productive forests are assigned for the production of charcoal and poles while the non-productive forests are assigned for biodiversity conservation, erosion mitigation, research and education, recreation, local community needs and settlement.
Satellite data
In order to obtain carbon dynamics for a period of 20 years (1991–2011) two series of optical satellite images were used. The image data sets for 1991 were acquired from the Land Observation Satellite—Thematic Mapper 5 (Landsat5-TM) while the 2011 image data sets were obtained from high resolution geometric sensor onboard the Systeme Probatoire d’Observation de la Terre 5 (SPOT-5). These optical satellites were selected as they both shared similar spectral characteristics that would allow derivation of vegetation indices that utilised the red and near-infrared spectral
bands. Both Landsat-TM and SPOT-5 images were atmospherically and radiometrically corrected to obtain synchronised images with true surface reflectance values. The conversion of digital numbers into the surface reflectance were done by using cos-theta method (Chander et al. 2009) and historical empirical line method (HELM) (Clark et al. 2010) for Landsat-TM and SPOT-5 images respectively.
Methodology
This study integrated field inventory data with the satellite images. In performing this, field inventor y data were gathered and carbon stock was calculated on sampling plots basis prior to image analysis. Analysis was conducted which involved four major steps, namely, (1) forest stratification, (2) mangroves changes detection, (3) derivation of vegetation indices and (4) correlation analysis. These processes are explained below.
Figure 1 Location of the study area, Matang Mangroves

Journal of Tropical Forest Science 25(4): 554–565 (2013) Hamdan O et al.
557© Forest Research Institute Malaysia
Field inventory data
The collection of ground sample plots was carried out from 2010 till 2011 covering all parts of the study area. A total of 108 sampling plots with the size of 20 m × 50 m were distributed randomly and established within the study area. The stratified random sampling approach was used in designing the sampling methods, which was based on the forest strata. Sample plots covered all important forest types which included undisturbed virgin jungle reser ve, mature Rhizophora, regenerating Rhizophora forests and Avicennia–Sonneratia and Bruguiera. The majority of the ground sample plots were concentrated in the dominating Rhizophora forest. All tree stands measuring 5 cm and above were included in the inventory process and species of the measured stands were also recorded. Besides ground sample plots, this study was also designed to incorporate an ancillary data set which contained the spatial information on the forest classes and management zones. The data set was derived from the previous 10-year (2000–2009) working plan of Matang Mangroves (Azhar & Nik Mohd Shah 2003). They were used primarily to facilitate the forest stratification process.
Plot level carbon stock
Allometric equations from Ong et al. (2004) and Komiyama et al. (2005) were adopted to calculate aboveground biomass for R. apiculata and Avicennia alba respectively. The respective allometric equations are presented by the following equations:
R. apiculata: Aboveground biomass (kg) = 0.235D2.42 (1)
A. alba: Aboveground biomass (kg) = 0.251ρD2.46 (2)
where ρ = wood density and D = diameter at breast height (dbh) in cm. The value of wood density used was 0.506 g cm-3 (Komiyama et al. 2008) for A. alba (in non-productive forest strata). Equations 1 and 2 were used for all trees in Rhizophora and non-productive forests respectively. The aboveground biomass was then converted to carbon stock by using a global default conversion factor of 0.5 (IPCC 2007, Abdul Rashid et al. 2009).
Forest stratification
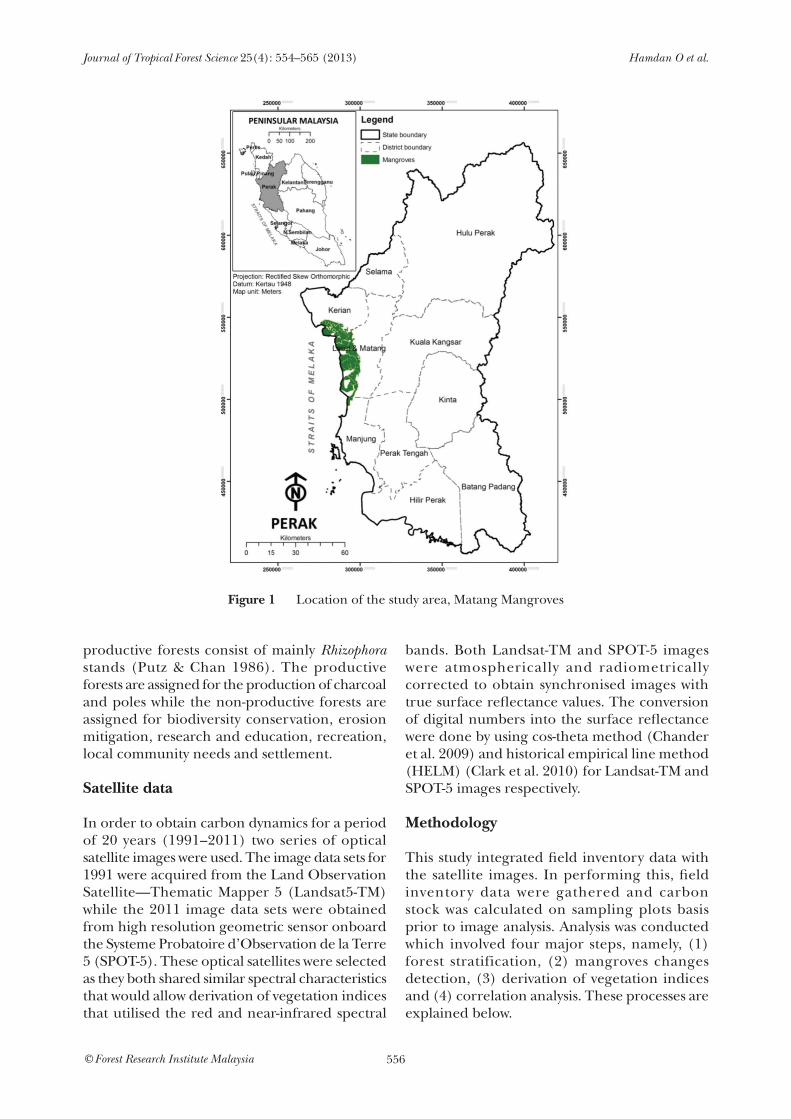
The ecological structure and species composition of the study area were complex but the stand structure within a mangrove type was homogenous. The study area has seven types of mangrove forest and each type varies in species, stand structure, size distribution, density and thus biomass. Due to these conditions, a strategy to reclassify the study area was considered. Using the SPOT-5 (2011), Landsat-TM (1991) and information derived from zoning maps found in the working plan, the study area was classified into three categories, namely, (1) mature Rhizophora forest, (2) Rhizophora forest that was logged less than 20 years, and (3) non-productive forest, mainly consisting of Avicennia–Sonneratia forest and poor mixed forest. The logged-over category was categorised as less than 20 years because satellite images used in the study had 20 years difference. Most of the scars within the harvesting regime that were felled in 1991 were clearly visible in the image data set and could be easily demarcated by visual interpretation and vectorisation. A similar process was also applied to the Landsat-TM image of year 1991. Stratification outcomes are depicted in Figure 2.
Mangroves change detection
The spatial sizes of images were sharpened using panchromatic bands and all were classified using the maximum likelihood classification method to classify mangroves in the study areas. The special spectral characteristic of mangroves, which reside in wet coastal regions and hence appear darker on satellite images, has made the selection of training area easy using the combinations of bands 4, 5 and 3 for Landsat-TM and 4, 3 and 2 for SPOT-5 images (Khali Aziz et al. 2009). Changes were detected by comparing the two classification results. Changes that were assessed in this study were permanent changes resulting from landuse changes from mangroves to agriculture, aquaculture and development areas. Changes due to clear felling and harvesting activities were not included in the analysis as the areas would be replanted with mangroves.
Derivation of vegetation indices
A variety of vegetation indices (VIs) have been developed for retrieving vegetation density from optical remote sensing images. The VIs
Journal of Tropical Forest Science 25(4): 554–565 (2013) Hamdan O et al.
558© Forest Research Institute Malaysia
are used to predict the biomass of trees and the most common one is with the normalised difference vegetation index (NDVI) (Li et al. 2007). NDVI is based on the characteristics that vegetation has noticeable absorption in the red spectrum and very strong reflectance in the near infrared spectrum. However using NDVI alone can significantly underestimate the biomass of some woody mangroves because NDVI represents canopy properties rather than trunk properties that are crucial for accurate biomass retrieval (Foody et al. 2001). Consequently, Kasawani et al. (2010) also revealed the same and found that soil-adjusted vegetation index (SAVI) was more promising in characterising biophysical profile of mangroves. The combination of several VIs through canonical correlation analysis (CCA) has improved the estimation accuracy (Heiskanen 2006, Proisy et al. 2007). Therefore, three vegetation indices, i.e. NDVI, SAVI and optimised soil-adjusted vegetation index (OSAVI) were used in this study to investigate their capability
in estimating mangrove biomass in Matang mangrove forest. Although there are issues raised relating to the saturation level of biomass on VIs, they are not critical for mangroves in Malaysia as the indices only effect very high biomass such as forests in the Amazon, Brazil (Huete et al. 2002). The VIs used in this study are as follows:
NDVI =
NIR – RNIR – R
(3) Rouse et al.(1974) SAVI = × 1.5
NIR – RNIR + R + 0.5
(4) Huete (1988)
OSAVI =NIR–R
NIR + R + 0.16 (5) Rondeaux et al.
(1996)
where NIR = near infrared spectrum (Band-4 for Landsat-TM and Band-3 for SPOT-5) and R = red spectrum (Band-3 for Landsat-TM and Band-2 for SPOT-5).
Figure 2 Forest strata of Matang Mangroves for (a) 1991 and (b) 2011
Journal of Tropical Forest Science 25(4): 554–565 (2013) Hamdan O et al.
559© Forest Research Institute Malaysia
Correlation analysis
Plot sampling process was implemented to extract VI values of the satellite images at the corresponding locations on the ground. The 2011 SPOT-5 satellite image was utilised for this process. A ground plot with the size of 20 m × 50 m can cover exactly 10 pixels (2 × 5 pixels) of 10-m resolution. However, due to unexpected errors such as geometric displacement of satellite image and GPS location readings, a buffer of at least one pixel or 10 m around the exact size was taken into account and averaged together, which made up 28 pixels (4 × 7 pixels). The average value of VIs contained within the 28 pixels was used for the correlation analysis. Both VIs and total carbon stock within each ground sample plots were correlated to produce regression functions used to estimate carbon stock over the entire study area.
Validation of estimation
In order to validate results, a total of 25 check plots distributed within the study area were randomly selected. Of these, 20 were distributed within mature and logged-over Rhizophora forests (10 plots each) and 5 within non-productive forest. These plots were established independently, specifically for the validation process.
RESULTS AND DISCUSSION
Changes of mangroves extents
Within the observed 20-year period (1991–2011), Matang Mangroves had lost about 830 ha (from
41,539.45 ha in 1991 to 40,709.83 ha in 2011) or an average of 41.5 ha year-1. Most of the changes occurred along the edge of mangroves and towards the land area in the eastern region. There are several factors that contributed to the loss of mangrove in this area; the main causes being land conversion to agriculture and aquaculture which accounted for 50.2 and 16.8% respectively. Mangrove forests were also lost due to conversion to settlement (13.7%), coastal erosion (10.8%) and wood extraction (8.5%). Despite the loss, about 90 ha of land accretion occurred along the western part of the study area, especially along the edges of the Avicennia–Sonneratia forest seaward. This natural process occurs because sediments suspended on the mudflat encourage mature trees to produce new seedlings that will eventually colonise new grounds (Hamdan et al. 2012).
Carbon stock distribution in the study area
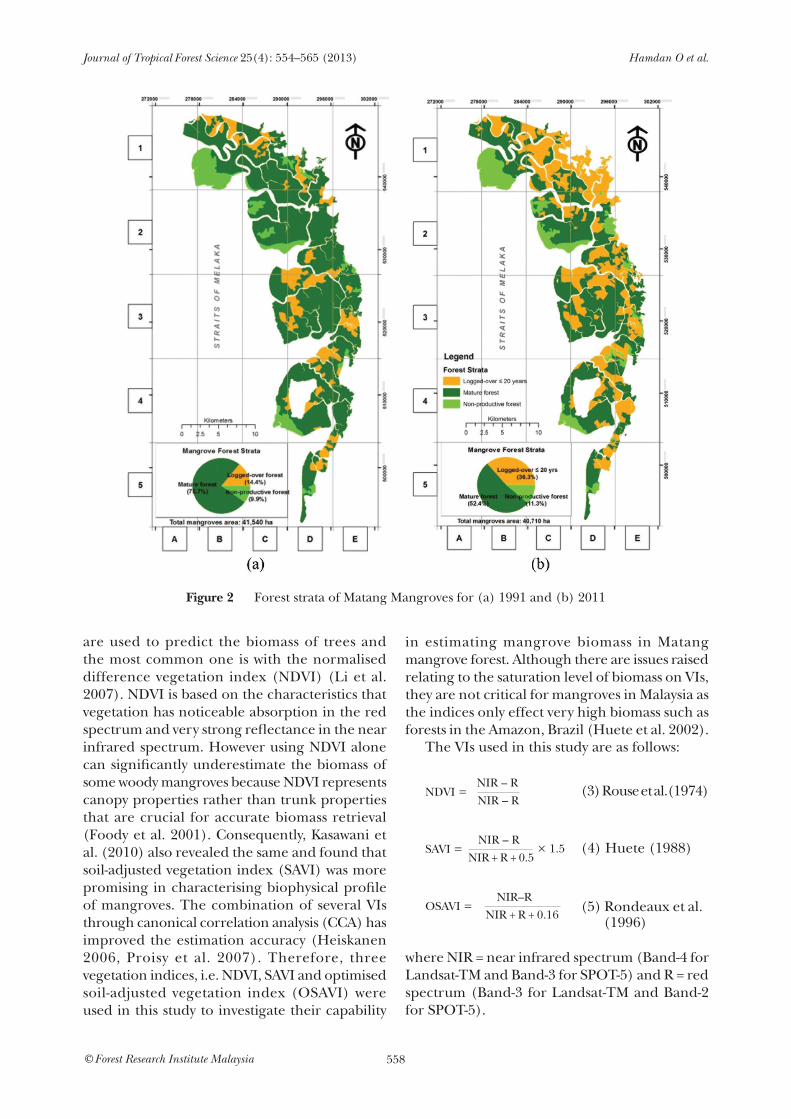
Figure 3 summarises the information gathered from all the 108 sample plots that have been surveyed. Carbon stock of all plots ranged from 7.04 to 261.62 t C ha-1 with an average of 81.15 t C ha-1, a value which represented secondary mangrove forest (Bipal et al. 2009). In this study, it was found that SAVI and OSAVI provided similar responses to the sampled biomass, with coefficient of determination (R2) of around 0.65 for all strata. The NDVI on the other hand had produced a slightly higher R2 when compared with the rest of the VIs used in this study (~0.72). Linear and non-linear regressions were tested on samples and both produced different relationships
Figure 3 Summary of plot inventory information (n = 108); dbh = diameter at breast height
Minimum no. of trees per plot: 37Maximum no. of trees per plot: 212Minimum tree size, dbh (cm): 5Maximum tree size, dbh (cm): 48.8Total no. of trees: 10,942Total C stock of all plot (t C): 416,587.90
60.0
50.0
40.0
30.0
20.0
10.0
0.0
Per
cent
age
(%)
5 to 10 cm 10 to 20 cm 20 to 30 cm > 30 cm
Tree size, dbh (cm)
55.3%
38.5%
5.7%0.5%
Journal of Tropical Forest Science 25(4): 554–565 (2013) Hamdan O et al.
560© Forest Research Institute Malaysia
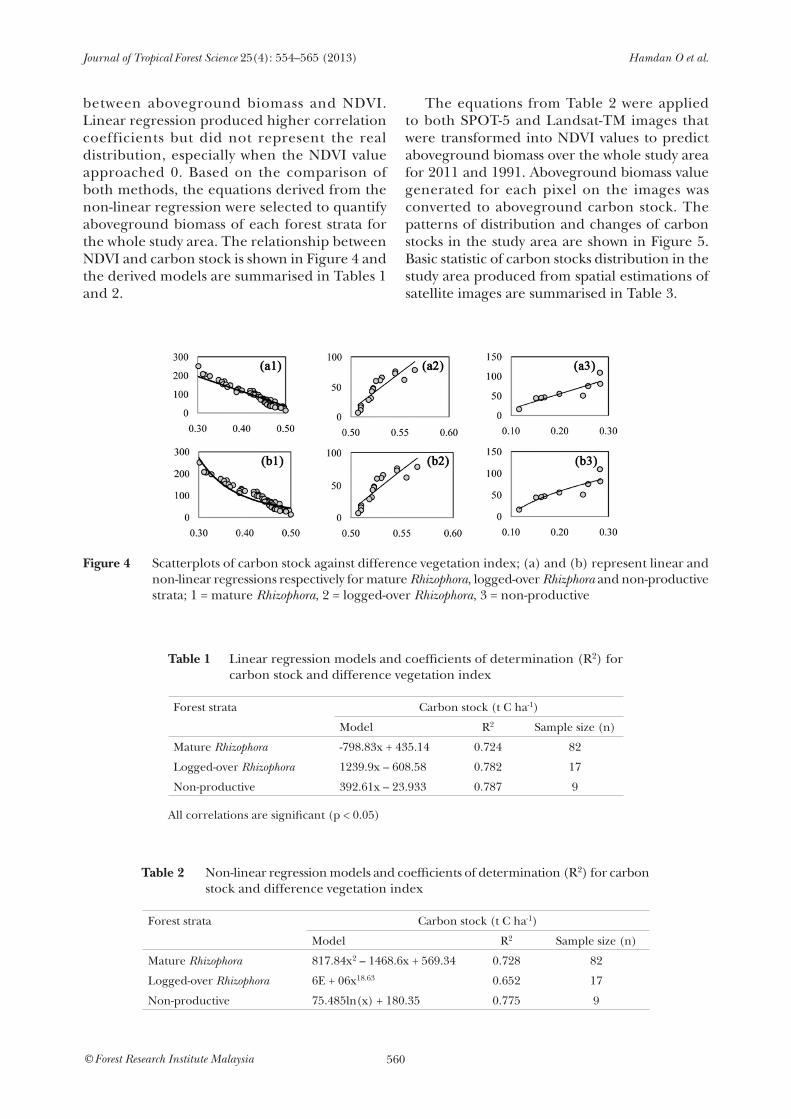
between aboveground biomass and NDVI. Linear regression produced higher correlation coefficients but did not represent the real distribution, especially when the NDVI value approached 0. Based on the comparison of both methods, the equations derived from the non-linear regression were selected to quantify aboveground biomass of each forest strata for the whole study area. The relationship between NDVI and carbon stock is shown in Figure 4 and the derived models are summarised in Tables 1 and 2.
The equations from Table 2 were applied to both SPOT-5 and Landsat-TM images that were transformed into NDVI values to predict aboveground biomass over the whole study area for 2011 and 1991. Aboveground biomass value generated for each pixel on the images was converted to aboveground carbon stock. The patterns of distribution and changes of carbon stocks in the study area are shown in Figure 5. Basic statistic of carbon stocks distribution in the study area produced from spatial estimations of satellite images are summarised in Table 3.
Figure 4 Scatterplots of carbon stock against difference vegetation index; (a) and (b) represent linear and non-linear regressions respectively for mature Rhizophora, logged-over Rhizphora and non-productive strata; 1 = mature Rhizophora, 2 = logged-over Rhizophora, 3 = non-productive
Table 1 Linear regression models and coefficients of determination (R2) for carbon stock and difference vegetation index
Forest strata Carbon stock (t C ha-1)
Model R2 Sample size (n)
Mature Rhizophora -798.83x + 435.14 0.724 82
Logged-over Rhizophora 1239.9x – 608.58 0.782 17
Non-productive 392.61x – 23.933 0.787 9
All correlations are significant (p < 0.05)
Table 2 Non-linear regression models and coefficients of determination (R2) for carbon stock and difference vegetation index
Forest strata Carbon stock (t C ha-1)
Model R2 Sample size (n)
Mature Rhizophora 817.84x2 – 1468.6x + 569.34 0.728 82
Logged-over Rhizophora 6E + 06x18.63 0.652 17
Non-productive 75.485ln(x) + 180.35 0.775 9

Journal of Tropical Forest Science 25(4): 554–565 (2013) Hamdan O et al.
561© Forest Research Institute Malaysia
Changes of carbon stock in the study area
Carbon stocks of 1991 and 2011 ranged from 1.03 to 263.65 t C ha-1 and 1.01 to 259.68 t C ha-1 respectively (Figure 5). Dominant carbon stock for both years was around 100 t C ha-1. A slightly higher average in carbon stock in 1991 (76.62 t C ha-1) as opposed to that in 2011 (69.89 t C ha-1) could be attributed to the harvesting that took place within the period. Carbon stock of each strata is reported in Table
3. Statistic shows that each strata has different profile of carbon stock. The increased extent of production areas from 14.4% in 1991 to 36.3% in 2011 as shown in Figure 3 also explains these changes. It has been reported that the highest carbon stock for > 80-year-old R. apiculata-dominated mangrove forest was 230.0 t C ha-1 (Putz & Chan 1986) while those of 20- and 28-year-old Rhizophora forests (also aciculate) were 114 and
105.9 t C ha-1 respectively (Ong et al. 1995). The
Figure 5 Distribution of carbon stock in the study area for (a) 1991 (b) and 2011
C stock distribution of 1991 C stock distribution of 2011
8000
6000
4000
2000
0
No.
of p
ixel
s
Carbon stock (t C ha-1)
1.03
27.8
154
.58
81.3
610
8.14
134.
9116
1.69
188.
4721
5.24
242.
02
No.
of p
ixel
s
8000
6000
4000
2000
0
1.01
30.4
359
.85
89.2
711
8.68
148.
1017
7.52
206.
9323
6.35
Carbon stock (t C ha-1)

Journal of Tropical Forest Science 25(4): 554–565 (2013) Hamdan O et al.
562© Forest Research Institute Malaysia
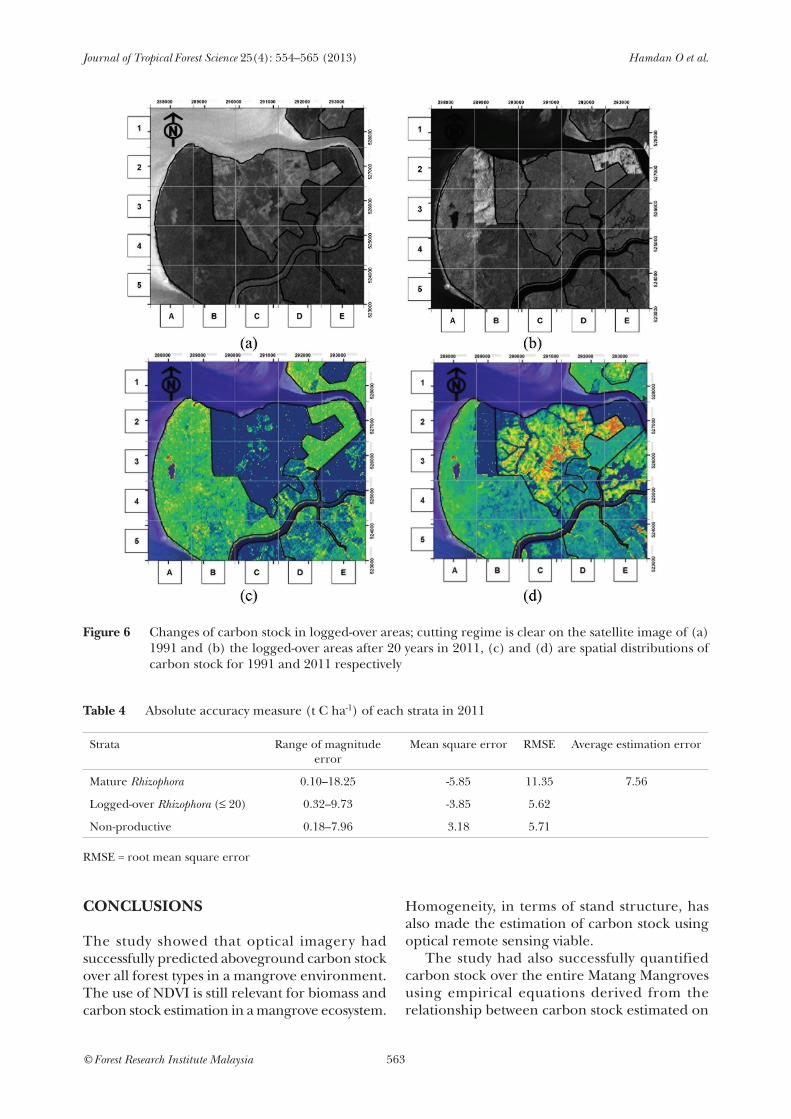
average carbon values derived for 1991 and 2011 in this study were in agreement with previous researches which were performed at Matang Mangroves. In order to quantify the growth rate of mangroves in logged-over forest, a comparison was made between 645.3 ha of the clear-cut regime in 1991 (where carbon stock was relatively 0 t C ha-1) and the 20-year-old forest in the same area in 2011 (Figure 6). In 2011, the total carbon accumulation in that area was 53,234 t C (ranged between 0 and 184.3 t C ha-1) with an average of 136.7 t C ha-1. This indicates that the mangrove trees in that particular area have sequestered about 2662 t year-1 of carbon with an average of 4.1 t C ha-1 year-1. Within the next 10 years (after 2011), this regime will undergo the next rotation of a 30-year clear felling cycle that is practised by the Forestry Department for mangrove forest production. It can be concluded that even though the 20-year mangrove is considered as mature forest, its carbon stock will never be the same as natural mangrove stands such as that found in virgin jungle reserve which can store up to 250 t C ha-1. Considering the spatial distribution over the entire study area of about 41,540 ha in year 1991 and 40,710 ha in 2011, total carbon stocks in Matang Mangroves were 3.04 and 2.15 mil t C in 1991 and 2011 respectively. This meant that the total change of carbon stock within the period was 883,928 t C, with an average loss of 44,196 t C ha1 year-1. In this case, the released carbon can be considered as a source of carbon emission that equals 3.2 million t CO2e or about 0.2 t CO2e per year (Ong 1993). These estimates were
derived from individual pixels obtained from the image data sets of the mangrove forest. The estimates took into account the variation of each carbon stock value of each pixel on the satellite images. As the approach did not apply the biome average method which involved the application of an estimated average carbon stock value to the entire areal extent, the estimates produced in this study presented a more accurate estimate that reflected the profile of the forest. It has been estimated that the carbon stock in Matang Mangroves with acreage of about 40,800 ha was at 4.13 million t C (Gong & Ong 1990). Comparing this estimate with the result of this study (3.04 million t C in year 1991), this study has underestimated about 1.1 million t C. However, as explained earlier, the biome average method was susceptible to issues that arose from generalisation of the mangrove forest. It could provide erroneous estimates because only a single average value was applied. For example, if this study uses an average carbon stock of 114 t C ha-1 as reported by Ong et al. (1995), the yield will be about 4.6 million t C. Validation process carried out using root mean square error indicated that magnitude of errors for the 25 check plots ranged from 0.1 to 18.25 t C ha-1 (Table 4). The huge variation within the distribution reflected the randomness of the check plots. Negative values in mean square error indicated that the generated carbon stock from the equation had underestimated the carbon stock and vice versa. Average carbon stock in Matang Mangroves was, therefore, 76.62 ± 7.56 t C ha-1 and 69.89 ± 7.56 t C ha-1 for the years 1991 and 2011 respectively.
Table 3 Basic statistics of carbon stock in the study area over the years 2011 and 1991
Year Strata Statistics(t C ha-1)
Total (t C)
Min Max Mean Mode
2011 Mature Rhizophora 20.35 260.70 64.08 75.36 1,367,439.00
Logged-over Rhizophora (≤ 20 years) 0 244.09 49.49 29.53 736,620.84
Non-productive 0 122.80 18.16 21.35 48,095.26
Subtotal 2,152,155.10
1991 Mature Rhizophora 17.57 259.68 65.14 73.07 2,048,352.70
Logged-over Rhizophora 0 231.02 47.56 28.94 702,287.24
Non-productive 0 161.06 25.31 38.25 285,442.75
Subtotal 3,036,082.69
Total changes -883,927.59
Journal of Tropical Forest Science 25(4): 554–565 (2013) Hamdan O et al.
563© Forest Research Institute Malaysia
CONCLUSIONS
The study showed that optical imagery had successfully predicted aboveground carbon stock over all forest types in a mangrove environment. The use of NDVI is still relevant for biomass and carbon stock estimation in a mangrove ecosystem.
Homogeneity, in terms of stand structure, has also made the estimation of carbon stock using optical remote sensing viable. The study had also successfully quantified carbon stock over the entire Matang Mangroves using empirical equations derived from the relationship between carbon stock estimated on
Figure 6 Changes of carbon stock in logged-over areas; cutting regime is clear on the satellite image of (a) 1991 and (b) the logged-over areas after 20 years in 2011, (c) and (d) are spatial distributions of carbon stock for 1991 and 2011 respectively
Table 4 Absolute accuracy measure (t C ha-1) of each strata in 2011
Strata Range of magnitude error
Mean square error RMSE Average estimation error
Mature Rhizophora 0.10–18.25 -5.85 11.35 7.56
Logged-over Rhizophora (≤ 20) 0.32–9.73 -3.85 5.62
Non-productive 0.18–7.96 3.18 5.71
RMSE = root mean square error
Journal of Tropical Forest Science 25(4): 554–565 (2013) Hamdan O et al.
564© Forest Research Institute Malaysia
the ground and the NDVI of satellite image. Total carbon stocks in Matang Mangroves were estimated at 3.04 in 1991 and 2.15 mil t C in 2011 with the reduction of about 0.9 mil t C. It was estimated that about 3.2 mil t CO2e of carbon emission had been released within 20 years, which equalled to 0.2 t CO2e per annum. Overall, the study indicated that the use of vegetation indices from optical remote sensing data to assess carbon stock (and changes) in a mangrove ecosystem is still a viable technique. Multispectral optical data offer choices for carbon stock in mangrove forest where it has capability to derive a number of indices. This study, thus, suggested for replication of carbon stock assessment on mangroves in different parts of the world.
REFERENCES
Abdul RAshid AM, shAMsudin i, isMAil P & FletcheR sc. 2009. The role of FRIM in addressing climate-change issues. Research Pamphlet No. 128. Forest Research Institute Malaysia, Kepong.
AzhAR M & nik Mohd shAh nM. 2003. A Working Plan for the Matang Mangrove Forest Reserve, Perak: The Third 10-Year Period (2000–2009) of the Second Rotation. State Forestry Department of Perak, Ipoh.
biPAl kJ, biswAs s, MAJuMdeR M, PAnkAJ kR & MAzuMdAR A. 2009. Carbon sequestration rate and aboveground biomass carbon potential of four young species. Journal of Ecology and Natural Environment 1: 15–24.
bouillon s, boRges AV, cAstAñedA-MoyA e, diele k, dittMAR t, duke nc, kRistensen e, lee sy, MARchAnd c, MiddelbuRg JJ, RiVeRA-MonRoy Vh, sMith tJ & twilley RR. 2008. Mangrove production and carbon sinks: a revision of global budget estimates. Global Biogeochemical Cycles 22: 1–12.
chAndeR g, MARkhAM bl & heldeR dl. 2009. Summary of current radiometric calibration coefficients for Landsat MSS, TM, ETM+, and EO-1 ALI sensors. Remote Sensing of Environment 113: 893–903.
chong Vc & sAsekuMAR A. 2002. Coastal habitats (mangroves, coral reefs and seagrass beds) of the ASEAN region: status, utilization and management issues. Fish Science 68: 566–571.
clARk b, suoMAlAinen J & PellikkA P. 2010. A comparison of method for the retrieval of surface reflectance factor from multitemporal SPOT HRV, HRVIR, and HRG multispectral satellite imagery. Canadian Journal of Remote Sensing 36: 397–411.
donAto dc, kAuFFMAn Jb, MuRdiyARso d, kuRniAnto s, stidhAM M & kAnninen M. 2011. Mangroves among the most carbon-rich forests in the tropics. Nature Geosciences 4: 293–297.
FAo (Food And AgRicultuRe oRgAnizAtion). 2007. The World’s Mangrove 1980–2005. FAO Forestry Paper 153. FAO, Rome.
Foody gM, cutleR Me, McMoRRow J, Pelz d, tAngki h, boyd ds & douglAs i. 2001. Mapping the biomass of Bornean tropical rain forest from remotely sensed data. Global Ecology and Biogeography 10: 379–386.
giesen w, wulFFRAAt s, zieRen M & scholten l. 2006. Mangrove Guidebook for Southeast Asia. FAO and Wetlands International, Bangkok.
gong wk & ong Je. 1990. Plant biomass and nutrient flux in a managed mangrove forest in Malaysia. Estuarine, Coastal and Shelf Science 31: 519–530.
hAMdAn o, khAli Aziz h, shAMsudin i & RAJA bARizAn Rs. 2012. Status of Mangroves in Peninsular Malaysia. Forest Research Institute Malaysia, Kepong.
heiskAnen J. 2006. Estimating aboveground tree biomass and leaf area index in a mountain birch forest using ASTER satellite data. International Journal of Remote Sensing 27:1135–1158.
huete AR. 1988. A soil-adjusted vegetation index (SAVI). Remote Sensing of Environment 25: 295–309.
huete AR. didAn k, MiuRA t, RodRiguez eP, gAo X & FeRReiRA lg. 2002. Overview of the radiometric and biophysical performance of the MODIS vegetation indices. Remote Sensing of Environment 83: 195–213.
huete A. 2012. Vegetation indices, remote sensing and forest monitoring. Geography Compass 6: 513–532.
iPcc (inteRgoVeRnMentAl PAnel on cliMAte chAnge). 2007. Climate Change 2007: Synthesis Report. Contribution of Working Group I, II and III to the Fourth Assessment Report of the Intergovernmental Panel on Climate Change. (eds). IPCC, Geneva.
kAMARuzAMAn J & dAhlAn ht. 2009. Managing sustainable mangrove forests in Peninsular Malaysia. Journal of Sustainable Development 1: 88–96.
kAsAwAni i, noRsAlizA u & Mohd hAsMAdi i. 2010. Analysis of spectral vegetation indices related to soil-line for mapping mangrove forests using satellite imagery. Applied Remote Sensing Journal 1: 25–31.
khAli Aziz h, hAMdAn o, shAMsudin i & isMAil h. 2009. Digital change detection of mangrove forest in Selangor using remote sensing and geographic information system (GIS). The Malaysian Forester 72: 61–69.
koMiyAMA A, PoungPARn s & kAto s. 2005. Common allometric equations for estimating the tree weight of mangroves. Journal of Tropical Ecology 21: 471–477.
koMiyAMA A, ong Je & PoungPARn s. 2008. Allometry, biomass, and productivity of mangrove forests: a review. Aquatic Botany 89: 128–137.
lAFFoley d & gRiMsditch g. 2009. The Management of Natural Coastal Carbon Sinks. International Union for Conservation of Nature, Gland.
li XA, yeh go, wAng s, liu k, liu X, QiAn J & chen X. 2007. Regression and analytical models for estimating mangrove wetland biomass in South China using Radarsat images. International Journal of Remote Sensing 28: 5567–5582.
MuRRAy b, Pendleton l, Jenkins wA & siFleet s. 2011. Green Payments for Blue Carbon Economic Incentives for Protecting Threatened Coastal Habitats. Nicholas Institute Report NI R 11-04. Duke Nicholas Institute for Environmental Policy Solutions, Durham.
ong Je. 1993. Mangroves—a carbon source and sink. Chemosphere 27: 1097–1107.
Journal of Tropical Forest Science 25(4): 554–565 (2013) Hamdan O et al.
565© Forest Research Institute Malaysia
ong Je, gong wk & clough bF. 1995. Structure and productivity of a 20-year-old stand of Rhizophora apiculata Bl. mangrove forest. Journal of Biogeography 22: 417–424.
ong Je, gong wk & wong ch. 2004. Allometry and partitioning of the mangrove, Rhizophora apiculata. Forest Ecology and Management 188: 395–408.
PRoisy c, couteRon P & FRoMARd F. 2007. Predicting and mapping mangrove biomass from canopy grain analysis using Fourier-based textural ordination of IKONOS images. Remote Sensing of Environment 109: 379–392.
Putz F & chAn ht. 1986. Tree growth, dynamics, and productivity in a mature mangrove forest in Malaysia. Forest Ecology and Management 17: 211–230.
RondeAuX g, steVen M & bARet F. 1996. Optimisation of soil-adjusted vegetation indices. Remote Sensing of Environment 55: 95–107.
Rouse Jw, hAAs Rh, schell JA & deeRing dw. 1974. Monitoring vegetation systems in the Great Plains with ERTS. Pp 310– 317 in Freden SC et al. (eds) Proceedings of Third Earth Resources Technology Satellite-1 Symposium. 10–14 December 1973, Greenbelt.