universiti putra malaysia optical …psasir.upm.edu.my/id/eprint/5146/1/fk_2006_39.pdfselain itu,...
TRANSCRIPT
UNIVERSITI PUTRA MALAYSIA
OPTICAL TRANSMISSION-BASED WATER TURBIDITY MEASUREMENT SYSTEM
RUHIZAN LIZA BINTI AHMAD SHAURI
FK 2006 39
OPTICAL TRANSMISSION-BASED WATER TURBIDITY MEASUREMENT SYSTEM
By
RUHIZAN LIZA BINTI AHMAD SHAURI
Thesis Submitted to the School of Graduate Studies, Universiti Putra Malaysia, in Fulfilment of the Requirement for the Degree of Master of Science
April 2006

ii
DEDICATION
Special dedication goes to my beloved mother and father who have been very motivating and supportive towards my achievement for success in life.
iii
Abstract of thesis presented to the Senate of Universiti Putra Malaysia in fulfilment of the requirement for the degree of Master of Science
OPTICAL TRANSMISSION-BASED WATER TURBIDITY
MEASUREMENT SYSTEM
By
RUHIZAN LIZA BINTI AHMAD SHAURI
April 2006
Chairman: Rahman bin Wagiran
Faculty: Engineering
Turbidity is one of the important parameter for the determination of water quality.
The current existing method of measuring turbidity of water could come in bulky
size or small portable turbidity meter. The ability to handle many samples and
implementation of on-line monitoring is limited for such devices while some do not
support this feature. Taking measurements would be laborious and time consuming
especially when the sources of samples are located in remote places which are
difficult to be accessed by human.
In this research, an alternative turbidity measurement system called the “Optical
Transmission-Based Water Turbidity Measurement System” is designed and its
performance is analysed and compared to the measurement from a standard turbidity
meter. The concept of the proposed measurement system is to make the turbidity
measurement remote, easy to handle and more flexible. The use of fibre optic as the
element of carrying light enables measurement taken at the source of sample but
could be remotely controlled from other place by the user. The design for the fibre
optic set-up, transmitter circuit, receiver circuit and signal conditioning circuit were

iv
covered. The assembly program for Peripheral Interface Controller (PIC) was also
created.
v
Abstrak tesis yang dikemukakan kepada Senat Universiti Putra Malaysia sebagai memenuhi keperluan untuk ijazah Master Sains
SISTEM PENGUKURAN KEKERUHAN AIR MENGGUNAKAN KONSEP
TRANSMISI OPTIK
Oleh
RUHIZAN LIZA BINTI AHMAD SHAURI
April 2006
Pengerusi: Rahman bin Wagiran
Fakulti: Kejuruteraan
Kekeruhan air adalah satu daripada ciri penting yang terdapat di dalam pengukuran
kualiti air. Kaedah yang digunapakai kini boleh didapati daripada saiz mesin yang
besar sehingga saiz yang kecil dan mudah dibawa dipanggil meter pengukur
kekeruhan. Bagaimanapun, pengukuran yang melibatkan sampel yang banyak dan
aplikasi untuk pemerhatian secara berterusan adalah terhad. Penggunaan kaedah
sedemikian juga memenatkan dan menggunakan masa yang lama terutama bagi
pengukuran sampel yang berpunca daripada kawasan pedalaman dan sukar dilalui
oleh manusia.
Projek ini adalah bagi menghasilkan satu sistem pengukuran alternatif bagi
mengukur kekeruhan air yang dinamakan “Sistem Pengukuran Kekeruhan Air
Menggunakan Konsep Transmisi Optik”. Setelah direka dan diuji, hasil pengukuran
dianalisis dan dibandingkan dengan pengukuran daripada satu alat meter pengukur
kekeruhan. Sistem ini boleh menghasilkan satu kaedah pengukuran yang mudah,
lebih fleksibel dan boleh dikawal daripada tempat pengguna alat tersebut dari jauh
melalui aplikasi gentian optik yang digunakan untuk membawa cahaya. Projek ini

vi
meliputi pemasangan gentian optik, pembinaan litar untuk pemancar, penerima
cahaya dan pembaik signal. Selain itu, satu program untuk operasi sebuah pengawal
yang dipanggil “Pengawal Antara Muka Persisian” atau PIC juga dihasilkan.
vii
ACKNOWLEDGEMENTS
In the name of God, Most Gracious, Most Merciful. Praise be to God, the Cherisher
and Sustainer of the Worlds; Most Gracious, Most Merciful; Master of the Day of
Judgment. Thee do we worship, and Thine aid we seek. Show us the straight way, the
way of those on whom Thou hast bestowed Thy Grace, those whose (portion) is not
wrath, and who go not astray. May His blessings and peace upon our master
Muhammad, the Truthful and Trustworthy, and upon his family, and companions,
and all those excel in the following them until the day of reckoning.
I am deeply indebted to my supervisor, En. Rahman Wagiran and the committee
members, Dr. Samsul Bahari Mohd Noor and Dr. Roslina Mohd Sidek for their
helpful suggestions and comments during the progress of the thesis. My sincere
gratitude also goes to my friends and the laboratory assistants who have assisted me
throughout the finishing of this project.
Last but not least, I am deeply grateful to my mother and family for their
encouragement, understanding, and support for the success of this project.
viii
I certify that an Examination Committee has met on 13th April 2006 to conduct the final examination of Ruhizan Liza Binti Ahmad Shauri on her Master of Science thesis entitled “Optical Transmission-Based Water Turbidity Measurement System” in accordance with Universiti Pertanian Malaysia (Higher Degree) Act 1980 and Universiti Pertanian Malaysia (Higher Degree) 1981. The Committee recommends that the candidate be awarded the relevant degree. Members of the Examination Committee are as follows: Sudhanshu Shekhar Jamuar, PhD Professor Faculty of Engineering Universiti Putra Malaysia (Chairman) Mohd. Adzir Mahdi, PhD Associate Professor Faculty of Engineering Universiti Putra Malaysia (Internal Examiner) Syed Javaid Iqbal, PhD Lecturer Faculty of Engineering Universiti Putra Malaysia (Internal Examiner) Ruzairi Hj. Abdul Rahim, PhD Professor Faculty of Electrical Universiti Teknologi Malaysia (External Examiner)
__________________________________ HASANAH MOHD. GHAZALI, PhD Professor/Deputy Dean School of Graduate Studies Universiti Putra Malaysia Date:
ix
This thesis submitted to the Senate of Universiti Putra Malaysia and has been accepted as fulfilment of the requirement for the degree of Master of Science. The members of the Supervisory Committee are as follows: Rahman Wagiran, MSc Lecturer Faculty of Engineering Universiti Putra Malaysia (Chairman) Samsul Bahari Mohd Noor, PhD Lecturer Faculty of Engineering Universiti Putra Malaysia (Member)
Roslina Mohd Sidek, PhD Lecturer Faculty of Engineering Universiti Putra Malaysia (Member)
__________________________________ AINI IDERIS, PhD Professor/Dean School Of Graduate Studies Universiti Putra Malaysia Date:
x
DECLARATION I hereby declare that the thesis is based on my original work except for quotations and citations which have been duly acknowledged. I also declare that it has not been previously or concurrently submitted for any other degree at UPM or other institutions.
__________________________________ RUHIZAN LIZA BINTI AHMAD SHAURI Date:
xi
TABLE OF CONTENTS
Page DEDICATION ii ABSTRACT iii ABSTRAK v ACKNOWLEDGEMENTS vii APROVAL viii DECLARATION x LIST OF TABLES xiii LIST OF FIGURES xiv LIST OF ABBREVIATIONS/NOTATIONS/GLOSSARY OF TERMS xvi CHAPTER 1 INTRODUCTION 1 1.1 Objective of Project 1 1.2 Thesis Structure 2 2 LITERATURE REVIEW 3
2.1 Water Pollution 3 2.2 Water Quality 4
2.2.1 Turbidity 5 2.2.2 Importance of Turbidity 8 2.2.3 Standards for Turbidity 9 2.2.4 Existing Method of Measuring Turbidity 11
2.3 Water Quality Measurement System 12 2.3.1 Light Source Components 14 2.3.2 Optical Transducer 15 2.3.3 Properties of Optical Propagation in Turbidity Water 17 2.3.4 Fibre Optic and Its Application 19 2.3.5 Signal Conditioning 23 2.3.6 Microcontrollers 23 2.3.7 PIC16F873 Microcontroller 25
2.4 Summary 29 3 PROJECT METHODOLOGY AND EXPERIMENTAL SET-UP 30
3.1 Methodology 30 3.2 Transmitter Circuit 31 3.3 Receiver Circuit 33 3.4 PIC and Liquid Crystal Display Connection Circuit 34 3.5 Power Supply 36 3.6 PIC Programming 37
3.6.1 Register Setting 37 3.6.2 Architecture of Program 38
3.7 Experimental Set-Up 41 3.8 Optical Transmission-Based Turbidity Measurement System 43 3.9 Water Sample Measurement 51
xii
4 RESULTS AND DISCUSSION 54 4.1 Transmitter Circuit 54 4.2 Receiver Circuit 55
4.2.1 Simulation Result 56 4.2.2 Experimental Result 57
4.3 PIC Programming Result 72 4.3.1 System Calibration and Turbidity Range 73 4.3.2 Experiment 6: Output from LCD Display on Test Sample 74
5 CONCLUSION 76
5.1 Development of Optical Transmission-Based Turbidity Measurement System 76
5.2 Advantages and Disadvantages of the Measurement System 78 5.3 Future Recommendation 80
REFERENCES 81 APPENDICES 85 BIODATA OF THE AUTHOR 86
xiii
LIST OF TABLES
Table Page
2.1 Interim National Water Quality Standards for Malaysia [8] 10
3.1 Eleven Samples with Different Weight of Coffee Powder 51
3.2 Measurements Parameter 53
4.1 Various Combinations of LED and Output Voltage 54
4.2 Data of Vout from Controlled Samples 59
4.3 Regression Statistics for Different Vi 60
4.4 Sample Turbidity for Controlled Samples 62
4.5 Regression Statistics for Vout1 against Turbidity 64
4.6 Voutr1 and Turbidity of First Random Sample 65
4.7 Std Voltage and Percentage Error of Voutr1 66
4.8 Voutr2 and Turbidity of Second Random Sample 67
4.9 Std Voltage and Percentage Error of Voutr2 68
4.10 Measurement Results Using Kaolin Water Sample 70
4.11 Std Voltage and Percentage Error of Voutr3 71
4.12 Calculation of Constant Y and Equivalent Voltage 72
4.13 Vout Range, LCD Display and Turbidity Range 73
4.14 LCD Output Results 74
4.15 Comparison between Turbidity Range and HACH 74
5.1 Summary of Percentage Error 77
xiv
LIST OF FIGURES Figure Page 2.1 Jackson Candle Turbidimeter 7
2.2 Light Scattering Properties [23] 18
2.3 Basic Analogue Fibre Optic Receiver 22
3.1 Optical Transmission-Based Turbidity Measurement System Block Diagram 30
3.2 Transmitter Circuit 32
3.3 Receiver Circuit 34
3.4 PIC and LCD Connection Circuit 35
3.5 Voltage Regulator Circuit for +12V 36
3.6 Negative Converter Circuit 36
3.7 Compare Routine Program 39
3.8 Architecture of Program 40
3.9 Overall Operation Flow of the Measurement System 42
3.10 Reflectance and Transmission Method 44
3.11 The illustration of Optical Transmission-Based Water Turbidity Measurement System 45
3.12 Circuit Diagram of Optical Transmission-Based Water Turbidity
Measurement System 46 3.13 Schematic Diagram of Optical Transmission-Based Water Turbidity
Measurement System 46 3.14 Set-up of Turbidity Measurement System 47
3.15 Sample Filled in a Plastic Casing 47
3.16 Sample Measurement for Turbidity 48
3.17 Transmitter, Receiver and PIC Circuit 48
3.18 OPA111 Op-Amp and Photodiode Transducer 49
xv
3.19 Transmitter Circuit 49
3.20 Welcoming Display on LCD 49
3.21 Measuring in Process 50
3.22 Turbidity Value on LCD 50
3.23 Output Signal Measured on Oscilloscope 50
4.1 Relationship between Voltage Output and Various Combinations of LED 54
4.2 Circuit used for Simulation Exercise 56
4.3 Simulation Result for Output Voltage 57
4.4 Relationship between Vout and Powder Weight 60
4.5 Relationship between Turbidity and Powder Weight 62
4.6 Relationship between Vout1 and Turbidity 63
4.7 Comparison between Std Voltage and Voutr1 versus Turbidity 66
4.8 Comparison between Std Voltage and Voutr2 versus Turbidity 68
4.9 Comparison between Std Voltage and Voutr3 versus Turbidity 71

xvi
LIST OF ABBREVIATIONS/NOTATIONS/GLOSSARY OF TERMS
CMOS Complimentary Metal Oxide Semiconductor
CPU Central Processing Unit
EEPROM Electrically Erasable Programmable Read Only Memory
I/O Input/Output
LCD Liquid Crystal Display
LED Light Emitting Diode
NTU Nephelometric Turbidity Unit
PIC Peripheral Interface Controller
PPT Parts per million
ROM Read Only Memory
RAM Random Access Memory
WDT Watchdog Timer
CHAPTER 1
INTRODUCTION
The purpose of water quality measurement is to monitor specific parameters in
bodies of water. Changes in these parameters may be harmful not only to humans but
also to the organisms living in and around the water source. Although water covers
more than 70% of the earth's surface, only a mere 1% of the earth's water is available
as a source for drinking water [1]. Many factors can affect the quality of water in an
ecosystem including ungoverned discharges of industrial or agricultural wastages
such as asbestos, lead, mercury, turbidity and unstable organic chemicals, which
often pollute and contaminate water supplies. This project focused on the measuring
of one of the contaminant which is known as the turbidity. Turbidity of water is a
measurement of water clarity to show how clear the water appears. The amount of
total suspended solids (TSS) in water contributes proportionally to the value of
turbidity. Insoluble particles impede the passage of light through water by scattering
and absorbing the rays. Thus, the interference to the passage of light could be used
for turbidity measurement using a turbidity index.
1.1 Objective of Project
In this particular project, the determination of good or bad water in terms of turbidity
parameter will be studied. The current existing method of measuring turbidity of
water utilizes a turbidity meter that could come in small portable or bulky sized ones.
Thus, the ability to handle many samples and the implementation of on-line
monitoring are limited in such cases. Taking measurement is laborious and time
2
consuming especially when the sources of samples are located in remote places
which are difficult to be accessed by human.
A turbidity measurement system with the application of optical fibre is constructed in
this project. Comparison between the measurement from the proposed system and a
standard method of measuring water turbidity is presented. The performance of
proposed measurement system is analysed and data have been processed using PIC
controller which gives the equivalent turbidity output on to the LCD, as water sample
were measured. The research covered the design of fibre optic set-up, transmitter
circuit, receiver circuit and signal conditioning circuit.
1.2 Thesis Structure
This thesis consisted of five chapters. Chapter 1 describes the importance of
measuring water turbidity and the objectives of the project. It also explains the
advantages of the proposed measurement system. The literature review of the
concepts and also the theory of the components involved in the proposed system will
be covered in Chapter 2. Followed by Chapter 3 in which details of the project
methodology including the explanation on the setting-up of the completed system, on
both the hardware and software for the controller, will be described. In Chapter 4, the
results of the experiments and discussions are presented. Last but not least, the
conclusion on the analysed results including the performance, problems encountered
and future suggestions for the proposed system are presented in Chapter 5.
3
CHAPTER 2
LITERATURE REVIEW
Comprising over 70% of the earth’s surface, water is undoubtedly the most precious
natural resource that exists on the planet. Nowadays, human’s drinking water has
become greatly affected by not only industrial activities and fumes emitted by
vehicles but also many other human activities such as agricultural and logging. It is
important for everyone to understand the problem and study for ways to provide a
solution to overcome the water pollution.
2.1 Water Pollution
Water pollution occurs when the quality of water is affected due to the addition of
large amount of foreign particles to the water. When it is unfit for its intended use,
water is considered polluted. Two types of water pollutants are point source and non-
point source pollutants [2]. Point sources of pollution occur when harmful substances
are emitted directly into a body of water. A non-point source delivers pollutants
indirectly through environmental changes and contributes the majority of the
contaminants in the current water system.
The major sources of water pollution can be classified as municipal, industrial, and
agricultural [2]. Municipal water pollution consists of waste water from homes and
commercial establishments. For many years, the main goal of treating municipal
wastewater was simply to reduce the content of suspended solids, oxygen-demanding
materials, dissolved inorganic compounds and harmful bacteria. However, the
4
characteristics of industrial waste water differ considerably both within and among
industries. The pollution effect of industrial discharges depends on biochemical
oxygen demand, amount of suspended solids, the contents of specific inorganic and
organic substances. Agriculture including the commercial livestock and poultry
farming has become the source of many organic and inorganic pollutants in surface
waters and groundwater. These contaminants include sediment from erosion of
cropland, animal wastes and commercial fertilizers. Thus, the task of identifying the
compound of a polluting substance is important for the attainment of practical
treatment for the municipal wastewater.
2.2 Water Quality
Water quality can be defined as the measurement for the suitability of a particular
water system for use by human, and its suitability for providing and sustaining a
pollution-free environment [3]. A qualitative measure is important to determine and
describe the condition of water i.e. to determine what substances are in the water and
the concentration of each substance. A standard is used to determine the quality of a
particular water supply.
The characteristics of water can be classified into two different parameters; the
chemical and physical parameters. Chemical parameters are contributed by the
solvent capabilities of certain particles in water [4]. This category consists of total
dissolved solids (TDS), alkalinity, hardness, fluorides, metals, organics and nutrients.
This parameter is not taken into consideration since the measurement of turbidity
falls in the next physical parameter.
5
Physical parameters of water consist of suspended solids, turbidity, colour, taste,
odour and etc. Solids in water may consist of both organic and inorganic particles
which are classified by their size, state, chemical characteristics and size of
distribution [4]. Organic material might come from plant fibres, bacteria etc. in
surface water. Inorganic solids might come from clay, silt and other soil constituents
in surface water. Other suspended materials come from human activities such as
those included in everyday household discharge which also contributed to a variety
of organic suspended impurities and inorganic suspended solids. Filtration is the
most effective method on removing solids from water and in wastewater treatment,
level of suspended solids (SS) is used to measure the quality of wastewater influent.
Quality of water could also be measured by its colour [4]. Water is often coloured by
foreign substances such as organic particles encompassing from soils, minerals,
aquatic organisms and etc. which are present in natural waters. Taste and odour also
provide other methods for determining water quality. The taste and odour of water
are very much depends on the combination of substances such as minerals, metals,
constituents of wastewater and etc. [4]. In water treatment, water is oxidized using
oxidants such as potassium permanganate and chlorine to remove the taste and odour.
2.2.1 Turbidity
Fluids can contain suspended solid matter consisting of particles of many different
sizes. Some suspended material will be large and heavy enough to settle rapidly to
the bottom of a container if a liquid sample is left to stand (the settleable solids)
while very small particles will settle only very slowly or not at all if the sample is
regularly agitated or the particles are colloidal. These small solid particles cause the
6
liquid to appear turbid and the measurement of turbidity is a key test of water quality.
[5].
Turbidity can also be defined by muddiness created by stirring up sediment or having
foreign particles suspended [6]. It is a principal physical characteristic of water and is
an expression of the optical property that causes light to be scattered and absorbed by
particles and molecules rather than transmitted in straight lines through a water
sample [7]. This interference to light passage could be used for turbidity
measurement using a turbidity index.
Turbidity of water shows how clear the water appears. The greater the amount of
total suspended solids (TSS) in the water, the higher the turbidity value and vice
versa [4]. In surface water, turbidity comes from rock fragments, silt, clay, metal
oxides, micro-organisms and etc. Wastewater from household and industries are the
common distributors for turbidity-producing materials such as detergents, soaps and
emulsifying agents. Besides, particles in water may also consist of composites of
heavy metals such as lead, mercury, and toxic contaminants. For human use,
supplied drinking water has gone through great cost of water treatment. Low level of
turbidity in long term is sufficient enough to give great effect to aquatic organisms
and many researches are being done to avoid such treat to lakes and rivers [8].
The first practical attempts in the measurement of turbidity was in 1900 when
Whipple and Jackson developed a standard suspension fluid using 1,000 parts per
million (ppm) of diatomaceous earth (a non-toxic, safe substance made up from
crushed fossils of freshwater organisms and marine life) in distilled water [9].
7
Dilution of this reference suspension resulted in a series of standard suspensions,
which were then used to derive a ppm-silica scale for calibrating turbidimeters.
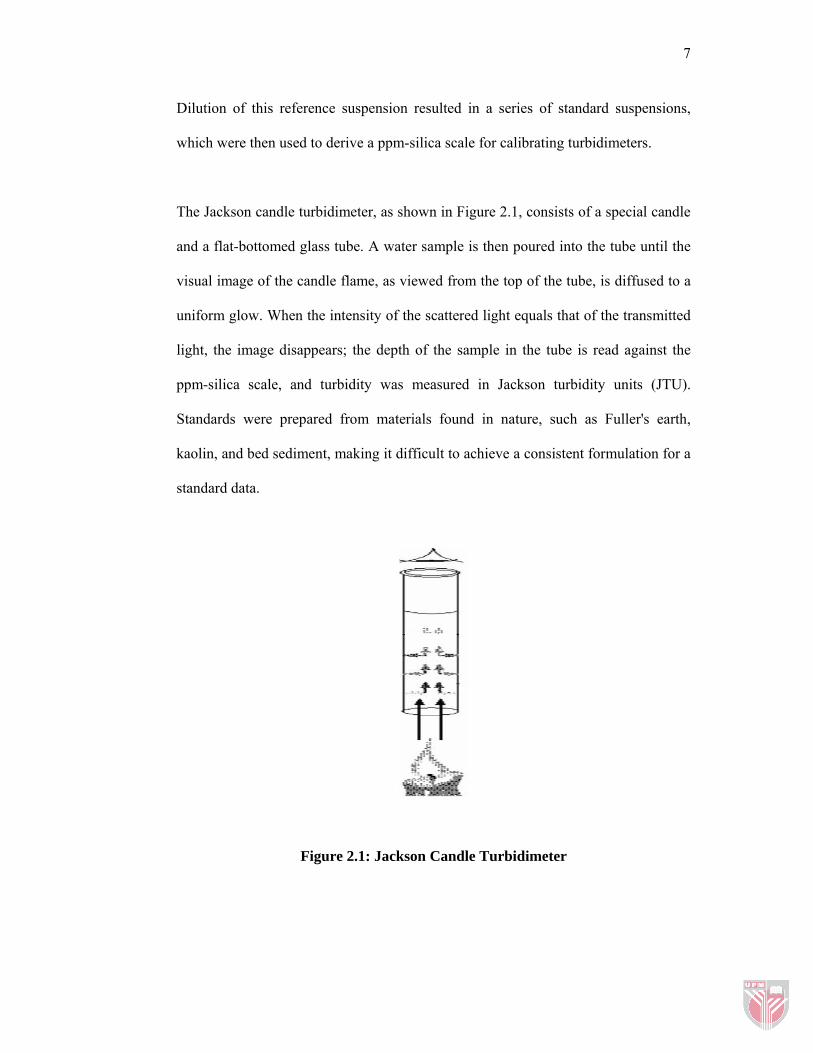
The Jackson candle turbidimeter, as shown in Figure 2.1, consists of a special candle
and a flat-bottomed glass tube. A water sample is then poured into the tube until the
visual image of the candle flame, as viewed from the top of the tube, is diffused to a
uniform glow. When the intensity of the scattered light equals that of the transmitted
light, the image disappears; the depth of the sample in the tube is read against the
ppm-silica scale, and turbidity was measured in Jackson turbidity units (JTU).
Standards were prepared from materials found in nature, such as Fuller's earth,
kaolin, and bed sediment, making it difficult to achieve a consistent formulation for a
standard data.
Figure 2.1: Jackson Candle Turbidimeter
8
In 1926, Kingsbury and Clark discovered formazin, which is formulated completely
of traceable raw materials and drastically improved the consistency in standards
formulation. Formazin is a suitable suspension for turbidity standards when prepared
accurately by weighing and dissolving 5.00 grams of hydrazine sulfate and 50.0
grams of hexamethylenetetramine in one litre of distilled water. The solution
develops a white hue after standing at 25 ºC for 48 hours. A new unit of turbidity
measurement was adopted called formazin turbidity units (FTU) [9].
Finally, in 1970, turbidity measurement standards changed when the nephelometric
turbidimeter, or nephelometer, was developed which determines turbidity by the light
scattered at an angle of 90º from the incident beam. A 90º detection angle is
considered to be the least sensitive to variations in particle size. Nephelometry has
been adopted by standard methods as the preferred means for measuring turbidity
because of the method's sensitivity, precision, and applicability over a wide range of
particles size and concentration [9].
2.2.2 Importance of Turbidity
Clarity is important when producing drinking water for human consumption and in
many manufacturing industries. Once considered as the most aesthetic characteristic
of a drinking water, significant evidence existed, proving that turbidity control is also
a competent safeguard against pathogens in drinking water [7], compared to clarity
alone. Turbidity can provide food and shelter for pathogens and if not removed,
turbidity can promote re-growth of pathogens in the distribution system. Although
turbidity is not a direct indicator of health risk, numerous studies showed a strong