laporan penemuan ringkas kajian perbelanjaan … documents library/dos/kpk_hes/summary.pdf ·...
TRANSCRIPT
LAPORAN PENEMUAN RINGKAS
KAJIAN PERBELANJAAN KELUARGA (KPK) 2015/16
Report of Summary Findings
Household Expenditure Survey (HES) 2015/16
Jabatan Perancangan dan Kemajuan Ekonomi Department of Economic Planning and Development
Jabatan Perdana Menteri Prime Minister’s Office
Report of Summary Findings Household Expenditure Survey 2015/16
(this page is intentionally left blank)
Report of Summary Findings Household Expenditure Survey 2015/16
Summary Findings
Introduction
The Department of Economic Planning and Development (JPKE) conducted the
Household Expenditure Survey (HES) 2015/16 starting from 1st April 2015 until
31st March 2016. HES 2015/16 was the sixth such survey being conducted in Brunei
Darussalam. The main objectives of HES 2015/16 were:
To collect up‐to‐date and comprehensive information on the pattern of
household expenditure and the level of household income;
To revise the lists and weightings of goods and services of the Consumer Price
Index (CPI); and
To provide additional information for national accounts and social statistics
purposes.
Household Expenditure
The data and analysis presented in this report mostly relate to the consumption
expenditure of households. Household consumption expenditure refers to all expenditures,
whether in cash or in‐kind, by the household and individual members on goods and services,
intended for consumption. It also includes the value of goods and services produced by the
household for own consumption. Thus, the imputed rent of owner‐occupied housing is
included as part of household consumption expenditure. Non‐consumption expenditures
such as repayment of loans, deposits with banks and purchase of properties are excluded.
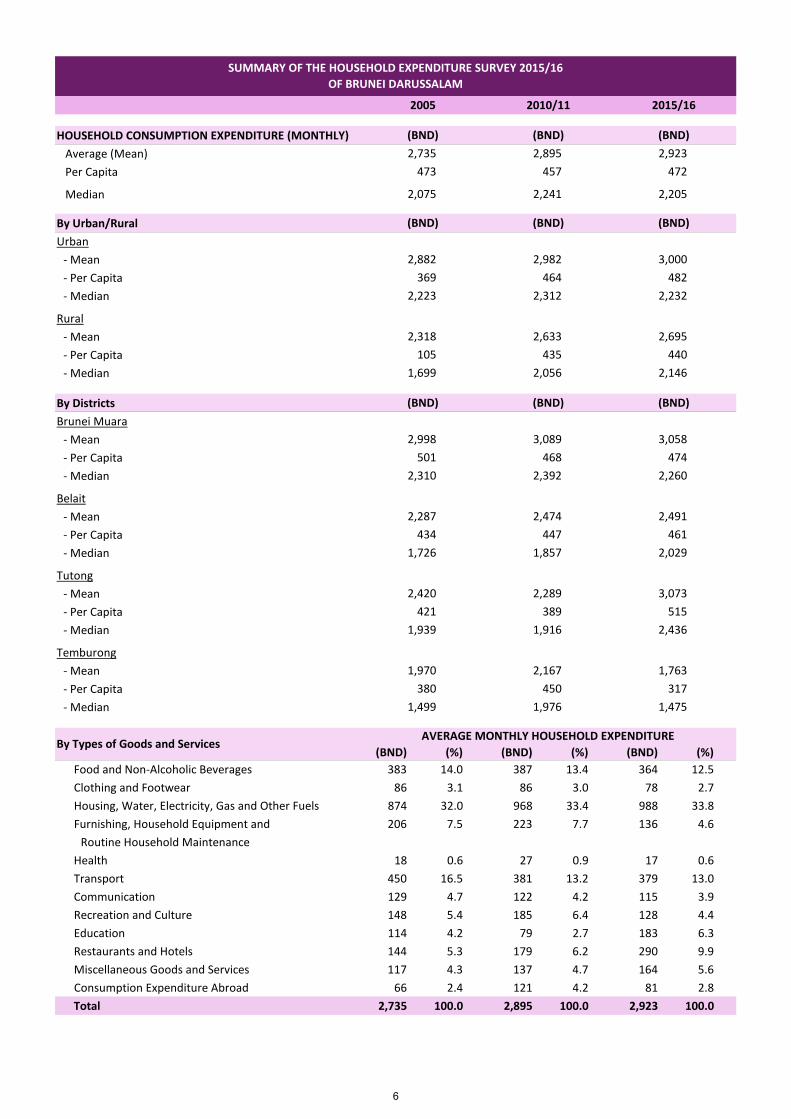
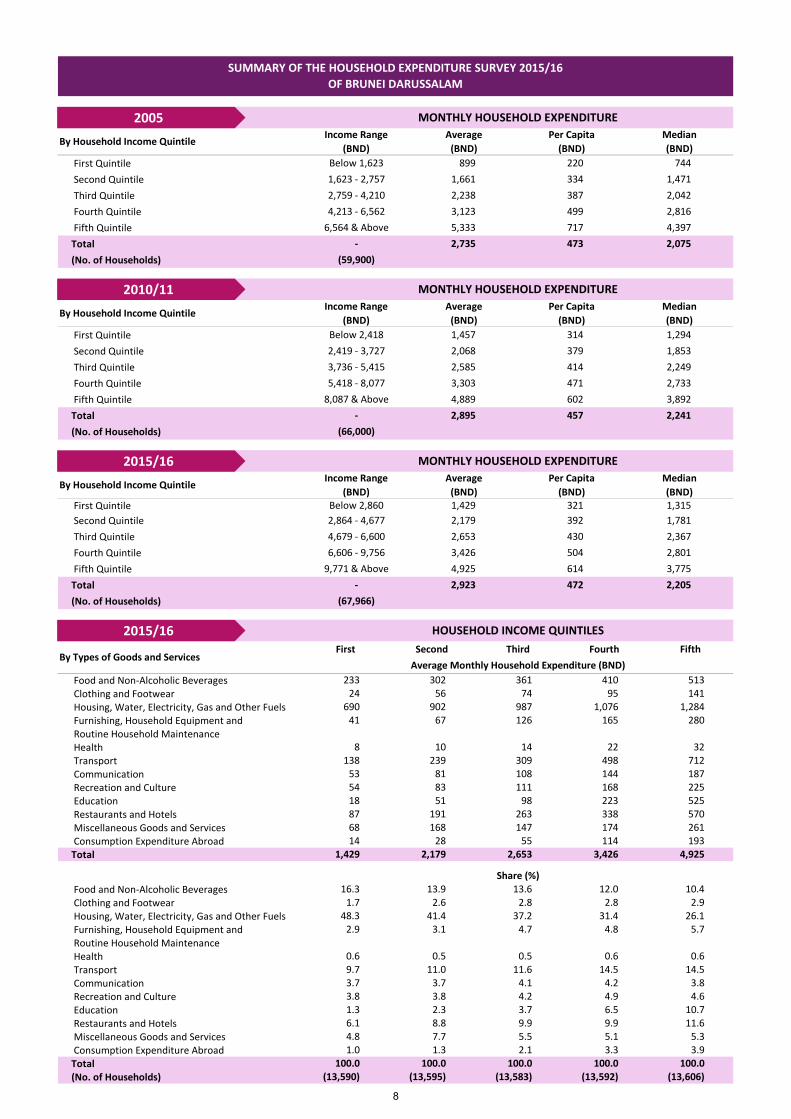
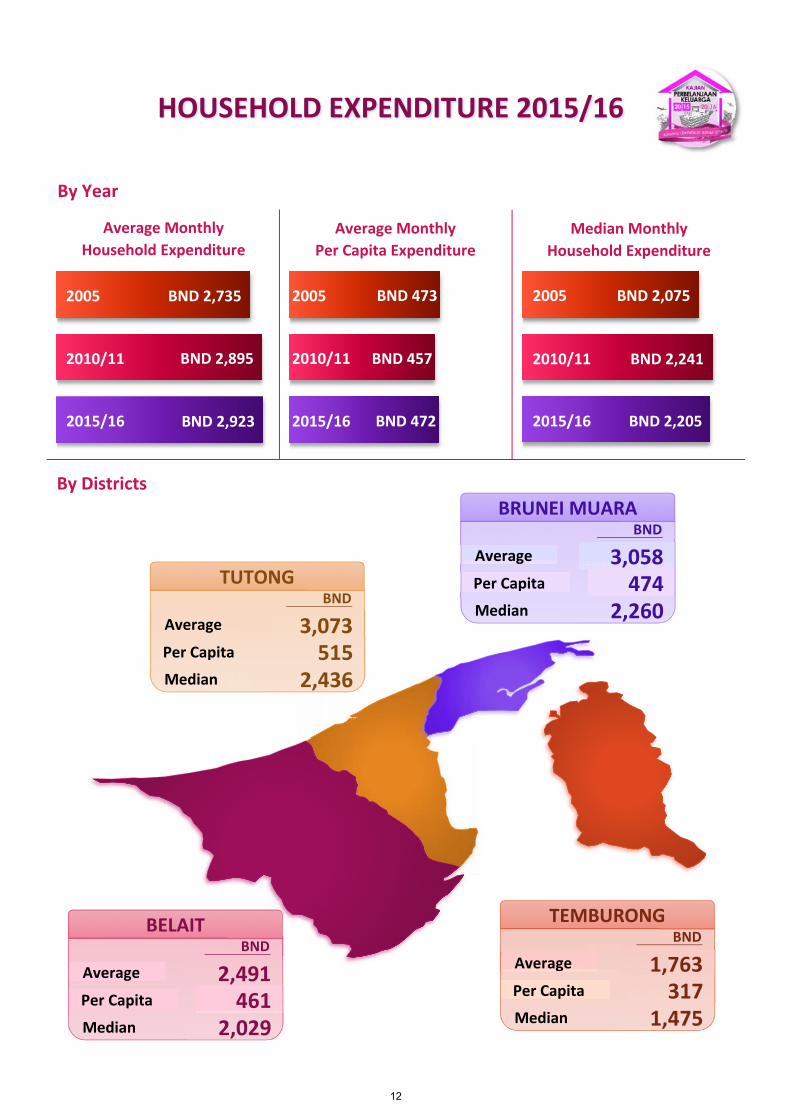
During the survey period 2015/16, a household in Brunei Darussalam spent an average
of BND 2,923 per month on household consumption. This represented an increase of 0.2 per
cent per year from BND 2,895 per month in 2010/11.
Meanwhile, the median monthly household expenditure in 2015/16 was BND 2,205
compared to BND 2,241 in 2010/11. This indicates that half of the households in Brunei
Darussalam spent less than BND 2,205 per month and the other half spent more than BND
2,205.
Households in urban areas had higher average and median monthly household
expenditure compared to those in the rural areas throughout the years from 2005 to 2015/16.
Among the districts, Tutong District recorded the highest in both average and median monthly
household expenditure at BND 3,073 and BND 2,436 respectively.
1
Report of Summary Findings Household Expenditure Survey 2015/16
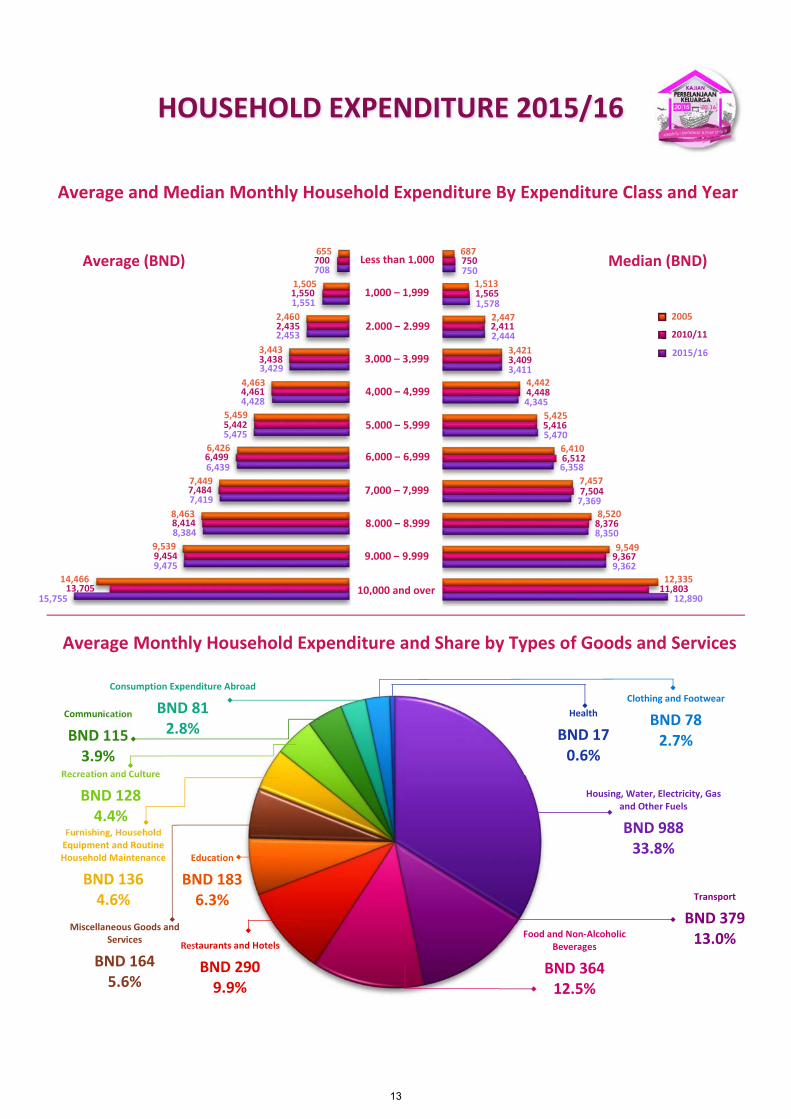
Household Expenditure by Type of Goods and Services
The expenditure pattern in 2015/16 showed that the expenditure groups of housing,
water, electricity, gas and other fuels; transport; and food and non‐alcoholic beverages
accounted for around 60 per cent of the average monthly household expenditure. The
expenditure on housing, water, electricity, gas and other fuels was the highest at about BND
988 per month, representing about 33.8 per cent of the average monthly household
expenditure. This was followed by expenditure on transport at BND 379 per month (13.0 per
cent) and food and non‐alcoholic beverages at BND 364 per month (12.5 per cent).
The household spending on education recorded the highest increase of 18.3 per cent
per year in a period of five years from BND 79 per month in 2010/11 to BND 183 in 2015/16;
while spending on furnishing, household equipment and routine household maintenance
recorded the highest decrease of 9.4 per cent per year from BND 223 per month in 2010/11
to BND 136 per month in 2015/16.
Household Expenditure by Income Groups
Household income affects the composition and patterns of a household’s monthly
expenditure. The households can be categorised by income quintile groups, each consisting
20 per cent of the households.
It can be observed that household expenditure increases with household income. In
2015/16, households in the first (bottom) quintile reported an average expenditure of BND
1,429 per month, while the fifth (top) quintile spent BND 4,925 per month, about 3 times
more than that spent by households in the bottom quintile. The median household
expenditure for the bottom and top quintiles were BND 1,315 and BND 3,775 respectively.
By types of goods and services, the largest share of the monthly household
expenditure across all income quintiles was on Housing, Water, Electricity, Gas and Other
Fuels, ranging from a share of 26.1 per cent for the top quintile to 48.3 per cent for the bottom
quintile. Expenditure on food constituted the second largest share of the monthly spending
by households in the first, second and third quintiles. The second highest spending of
households in the fourth and fifth quintiles was on transport, both at 14.5 per cent.
In terms of per capita expenditure, the average for the bottom quintile was BND 321
per month, and BND 614 for the top quintile. The national average per capita expenditure
was about BND 472 per month compared to BND 457 per month in 2010/11.
2
Report of Summary Findings Household Expenditure Survey 2015/16
Household Income
Household income consists of regular receipts, both in cash and in kind, accruing to
members of the household before compulsory deductions. It is made up of income from work,
self‐employment income, property income and transfer income. The monthly household
income refers to the average income received per month by all household members from all
sources. Household income also includes the imputed rent of owner‐occupied housing.
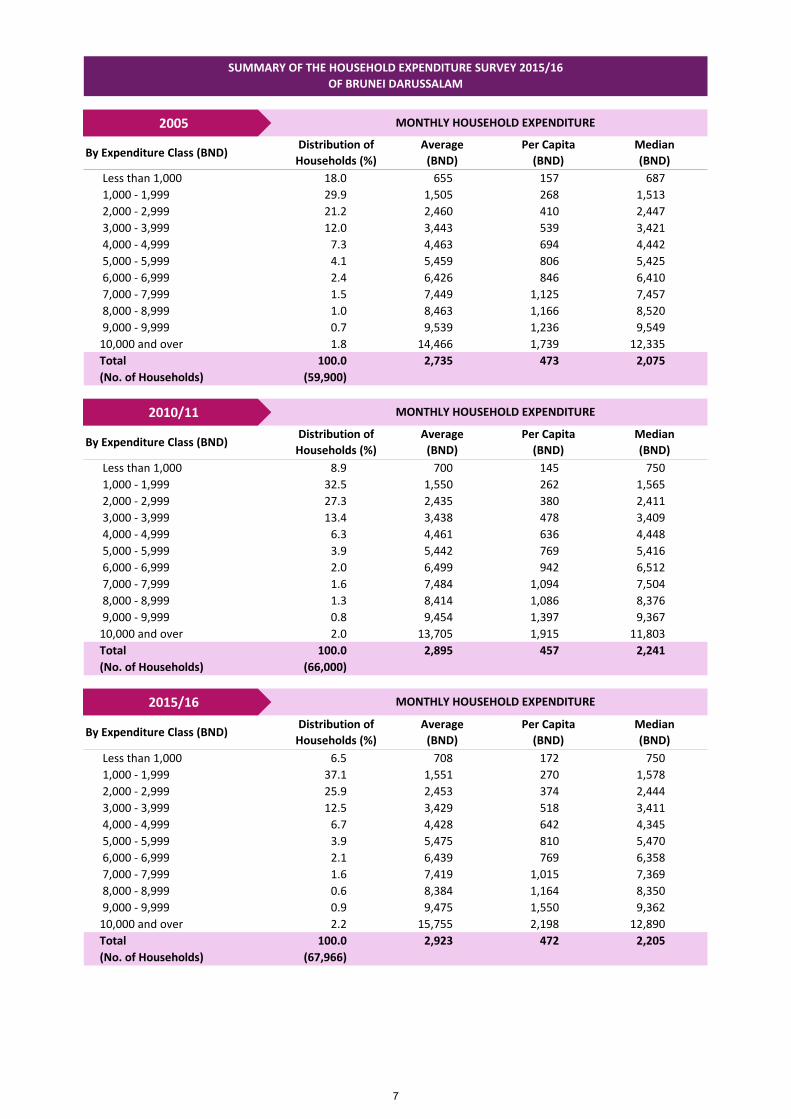
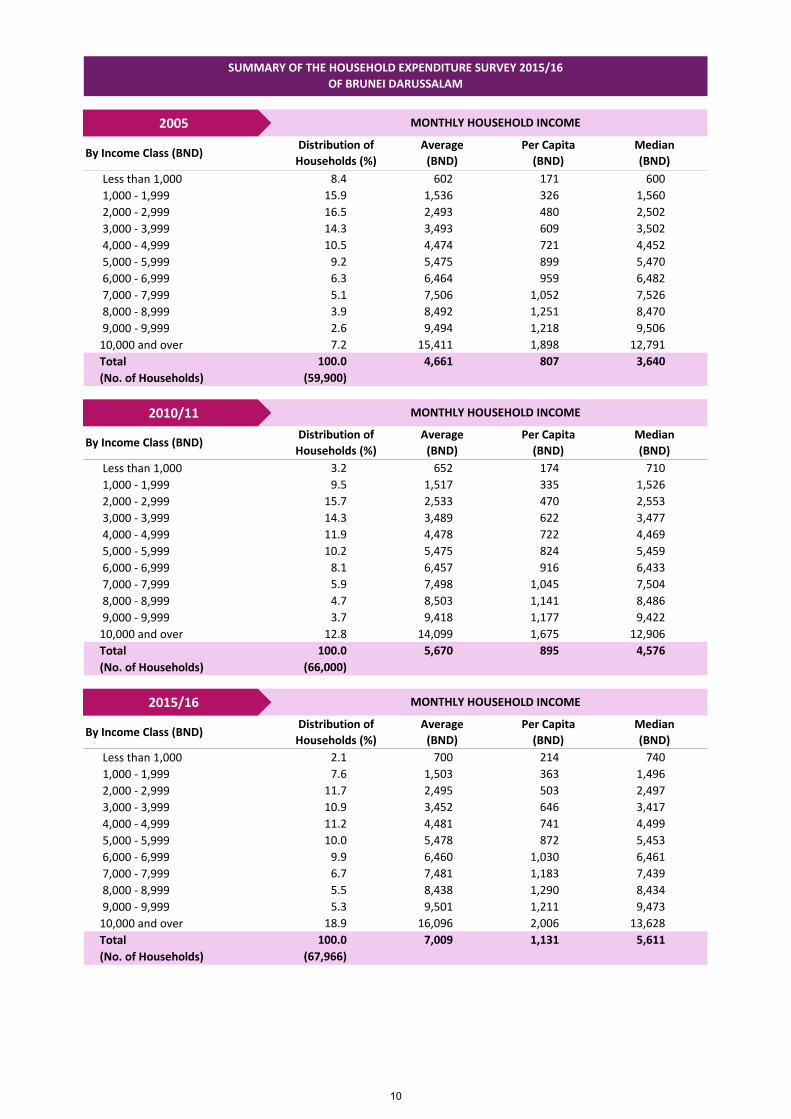
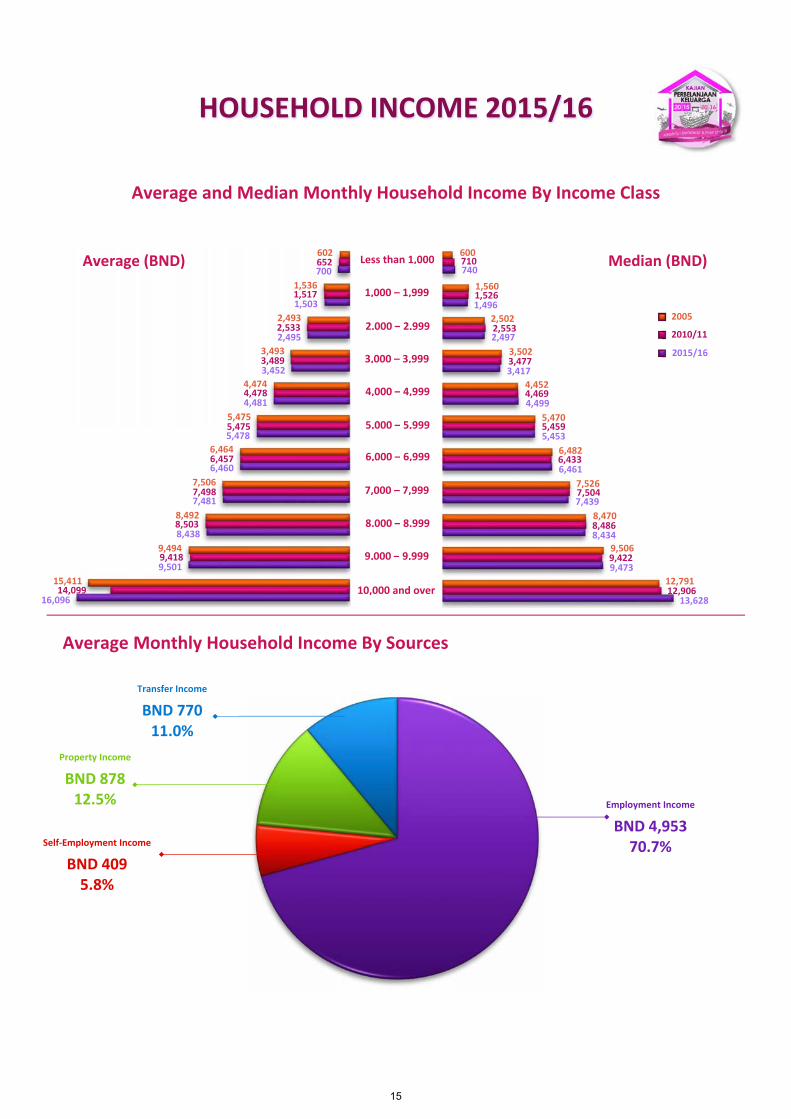
The distribution of households by monthly income classes shows a shift towards
higher household income over the years from 2010/11 to 2015/16. The proportion of
households earning less than BND 2,000 per month decreased from 12.7 per cent in 2010/11
to 9.7 per cent in 2015/16; while proportions of households earning BND 6,000 and more in
monthly income recorded increases, with those in the BND 10,000 and above income class
increasing in proportion from 12.8 per cent in 2010/11 to 18.9 per cent in 2015/16.
In this instance, the median is considered better than the average (mean) as an
indicator of a typical level of household income, because it is less affected by changes taking
place at the lower and upper extremes of the distribution. The median is a more stable and
robust measure and is not susceptible to outliers or extreme values.
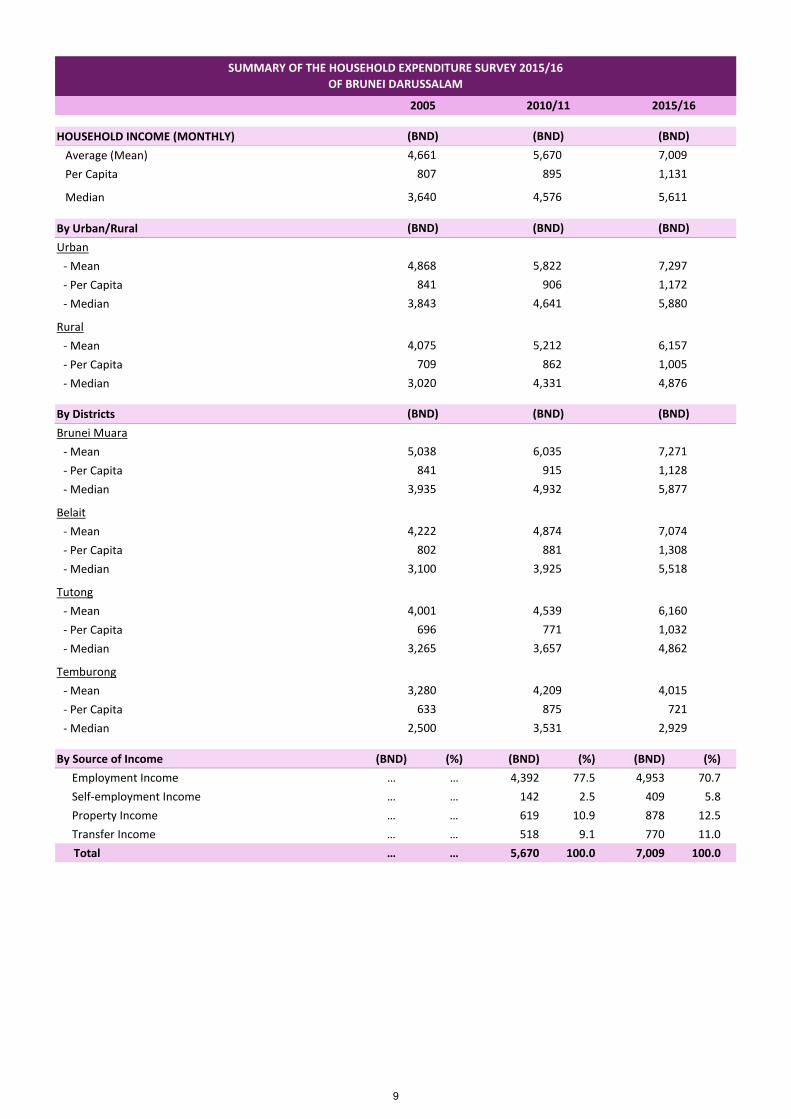
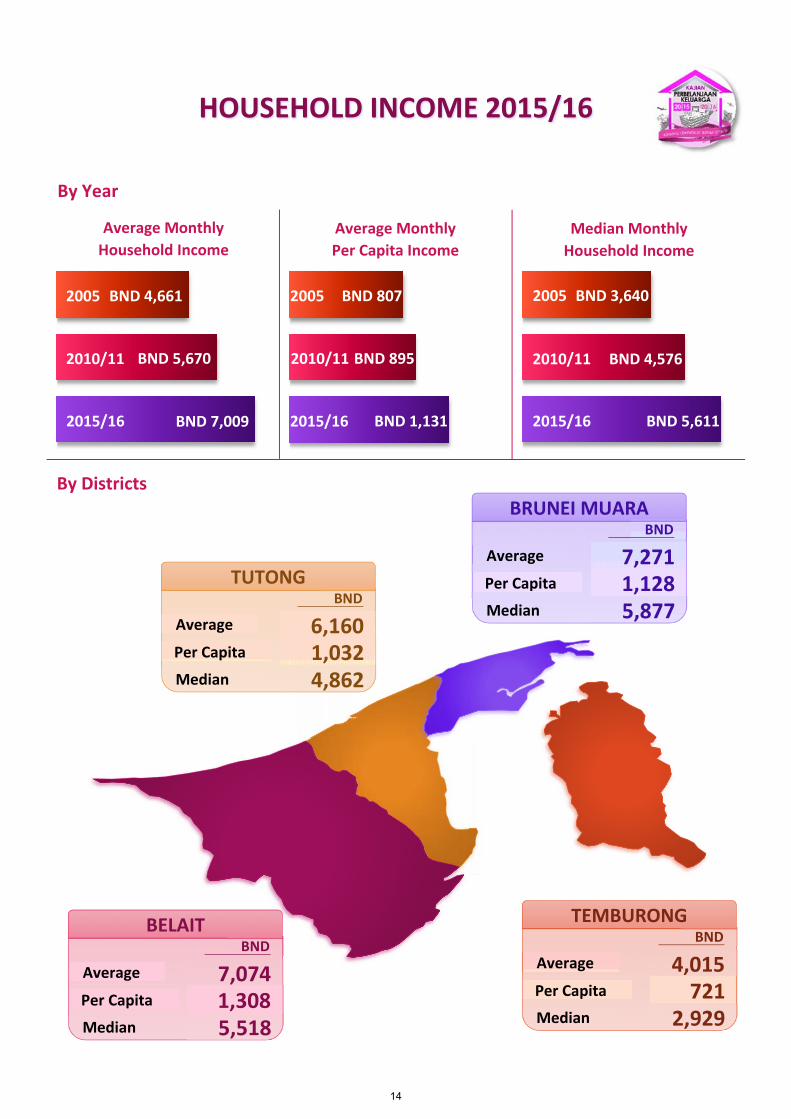
In 2015/16, the median household income was BND 5,611 per month, indicating that
half of all households in Brunei Darussalam earned an income of less than BND 5,611 per
month while the other half received more than BND 5,611 per month. This represented an
increase of 4.2 per cent per year from BND 4,576 in 2010/11.
Meanwhile, the average monthly household income in Brunei Darussalam in 2015/16
increased by 4.3 per cent per year to BND 7,009 from BND 5,670 in 2010/11.
Among the districts, Brunei Muara District recorded the highest in both average and
median monthly household income at BND 7,271 and BND 5,877 respectively.
Household Income by Sources
In terms of the composition of household income, the average (mean) remains the
most frequently used measure of income level since the different income components will
sum up to the total income.
By income sources, paid employment, which includes employer and employee
income, remained the largest portion of the average monthly household income at about BND
4,953 in 2015/16, compared to BND 4,392 in 2010/11. However, its share of the total
household income decreased to 70.7 per cent in 2015/16 from 77.5 per cent in 2010/11.
3
Report of Summary Findings Household Expenditure Survey 2015/16
Self‐employment income, including income of family workers, accounted for 5.8 per
cent, an increase from only 2.5 per cent in 2010/11. Meanwhile, property income, mainly
from the imputed rent of owner‐occupied housing, and transfer income contributed 12.5 per
cent (BND 878) and 11.0 per cent (BND 770) respectively.
Household Income by Income Groups
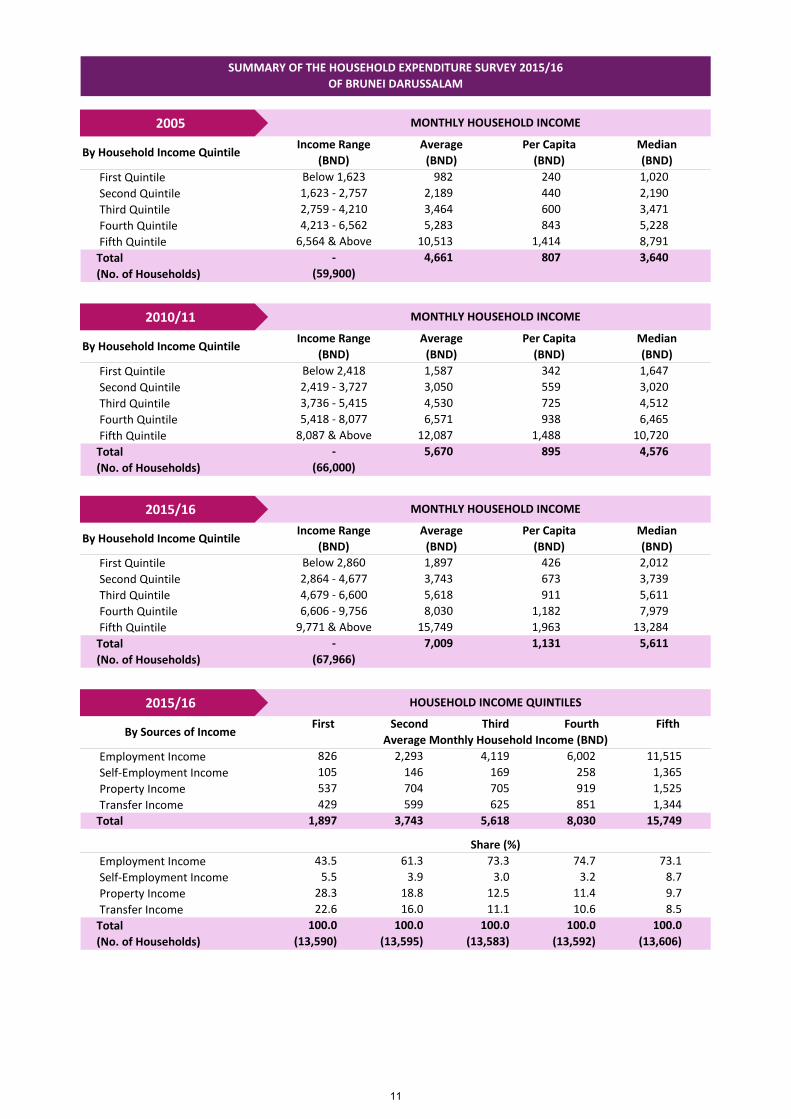
In 2015/16, the median monthly income of households the first quintile group
increased to BND 2,012 from BND 1,897 in 2010/11. Households in the other quintile groups
also experienced increases in their median monthly income compared to in 2010/11.
Similarly, the average household monthly income showed an increasing trend across all
quintile groups.
The major source of income in all the quintile groups was employment income,
followed by property income, transfer income and self‐employment income. For households
in the first quintile, employment income accounted for 43.5 per cent of their monthly
household income. This share increased to 73.1 per cent for the fifth quintile households.
The opposite trend was observed for property and transfer income, where the first
quintile households had higher shares (at 28.3 per cent and 22.6 per cent respectively)
compared to the fifth quintile households (at 9.7 per cent and 8.5 per cent respectively).
In terms of per capita monthly income, the average for the bottom quintile was BND
426 per month, and BND 1,963 for the top quintile. The national average per capita income
increased to BND 1,131 in 2015/16 from BND 895 in 2010/11.
4

Report of Summary Findings Household Expenditure Survey 2015/16
(this page is intentionally left blank)
5
HOUSEHOLD CONSUMPTION EXPENDITURE (MONTHLY)
Average (Mean)
Per Capita
Median
By Urban/Rural
Urban
‐ Mean
‐ Per Capita
‐ Median
Rural
‐ Mean
‐ Per Capita
‐ Median
By Districts
Brunei Muara
‐ Mean
‐ Per Capita
‐ Median
Belait
‐ Mean
‐ Per Capita
‐ Median
Tutong
‐ Mean
‐ Per Capita
‐ Median
Temburong
‐ Mean
‐ Per Capita
‐ Median
(BND) (%) (BND) (%) (BND) (%)
Food and Non‐Alcoholic Beverages 383 14.0 387 13.4 364 12.5
Clothing and Footwear 86 3.1 86 3.0 78 2.7
Housing, Water, Electricity, Gas and Other Fuels 874 32.0 968 33.4 988 33.8
Furnishing, Household Equipment and 206 7.5 223 7.7 136 4.6
Routine Household Maintenance
Health 18 0.6 27 0.9 17 0.6
Transport 450 16.5 381 13.2 379 13.0
Communication 129 4.7 122 4.2 115 3.9
Recreation and Culture 148 5.4 185 6.4 128 4.4
Education 114 4.2 79 2.7 183 6.3
Restaurants and Hotels 144 5.3 179 6.2 290 9.9
Miscellaneous Goods and Services 117 4.3 137 4.7 164 5.6
Consumption Expenditure Abroad 66 2.4 121 4.2 81 2.8
Total 2,735 100.0 2,895 100.0 2,923 100.0
SUMMARY OF THE HOUSEHOLD EXPENDITURE SURVEY 2015/16
OF BRUNEI DARUSSALAM
2005 2010/11 2015/16
(BND) (BND) (BND)
2,735 2,895 2,923
473 457 472
2,075 2,241 2,205
(BND) (BND) (BND)
2,882 2,982 3,000
369 464 482
2,223 2,312 2,232
2,318 2,633 2,695
105 435 440
1,699 2,056 2,146
(BND) (BND) (BND)
2,998 3,089 3,058
501 468 474
2,310 2,392 2,260
2,287 2,474 2,491
434 447 461
1,726 1,857 2,029
2,420 2,289 3,073
421 389 515
1,939 1,916 2,436
1,970 2,167 1,763
380 450 317
1,499 1,976 1,475
By Types of Goods and ServicesAVERAGE MONTHLY HOUSEHOLD EXPENDITURE
6
Less than 1,000 18.0 655 157 687
1,000 ‐ 1,999 29.9 1,505 268 1,513
2,000 ‐ 2,999 21.2 2,460 410 2,447
3,000 ‐ 3,999 12.0 3,443 539 3,421
4,000 ‐ 4,999 7.3 4,463 694 4,442
5,000 ‐ 5,999 4.1 5,459 806 5,425
6,000 ‐ 6,999 2.4 6,426 846 6,410
7,000 ‐ 7,999 1.5 7,449 1,125 7,457
8,000 ‐ 8,999 1.0 8,463 1,166 8,520
9,000 ‐ 9,999 0.7 9,539 1,236 9,549
10,000 and over 1.8 14,466 1,739 12,335
Total 100.0 2,735 473 2,075
(No. of Households) (59,900)
Less than 1,000 8.9 700 145 750
1,000 ‐ 1,999 32.5 1,550 262 1,565
2,000 ‐ 2,999 27.3 2,435 380 2,411
3,000 ‐ 3,999 13.4 3,438 478 3,409
4,000 ‐ 4,999 6.3 4,461 636 4,448
5,000 ‐ 5,999 3.9 5,442 769 5,416
6,000 ‐ 6,999 2.0 6,499 942 6,512
7,000 ‐ 7,999 1.6 7,484 1,094 7,504
8,000 ‐ 8,999 1.3 8,414 1,086 8,376
9,000 ‐ 9,999 0.8 9,454 1,397 9,367
10,000 and over 2.0 13,705 1,915 11,803
Total 100.0 2,895 457 2,241
(No. of Households) (66,000)
Less than 1,000 6.5 708 172 750
1,000 ‐ 1,999 37.1 1,551 270 1,578
2,000 ‐ 2,999 25.9 2,453 374 2,444
3,000 ‐ 3,999 12.5 3,429 518 3,411
4,000 ‐ 4,999 6.7 4,428 642 4,345
5,000 ‐ 5,999 3.9 5,475 810 5,470
6,000 ‐ 6,999 2.1 6,439 769 6,358
7,000 ‐ 7,999 1.6 7,419 1,015 7,369
8,000 ‐ 8,999 0.6 8,384 1,164 8,350
9,000 ‐ 9,999 0.9 9,475 1,550 9,362
10,000 and over 2.2 15,755 2,198 12,890
Total 100.0 2,923 472 2,205
(No. of Households) (67,966)
SUMMARY OF THE HOUSEHOLD EXPENDITURE SURVEY 2015/16
OF BRUNEI DARUSSALAM
MONTHLY HOUSEHOLD EXPENDITURE
By Expenditure Class (BND)Distribution of
Households (%)
Average
(BND)
Per Capita
(BND)
Median
(BND)
MONTHLY HOUSEHOLD EXPENDITURE
By Expenditure Class (BND)Distribution of
Households (%)
Average
(BND)
Per Capita
(BND)
Median
(BND)
MONTHLY HOUSEHOLD EXPENDITURE
By Expenditure Class (BND)Distribution of
Households (%)
Average
(BND)
Per Capita
(BND)
Median
(BND)
2005
2010/11
2015/16
7
First Quintile
Second Quintile
Third Quintile
Fourth Quintile
Fifth Quintile
Total
(No. of Households)
First Quintile
Second Quintile
Third Quintile
Fourth Quintile
Fifth Quintile
Total
(No. of Households)
First Quintile
Second Quintile
Third Quintile
Fourth Quintile
Fifth Quintile
Total
(No. of Households)
Food and Non‐Alcoholic Beverages Clothing and Footwear Housing, Water, Electricity, Gas and Other Fuels Furnishing, Household Equipment and Routine Household Maintenance Health Transport Communication Recreation and Culture Education Restaurants and Hotels Miscellaneous Goods and Services Consumption Expenditure Abroad Total
Food and Non‐Alcoholic Beverages Clothing and Footwear Housing, Water, Electricity, Gas and Other Fuels Furnishing, Household Equipment and Routine Household Maintenance Health Transport Communication Recreation and Culture Education Restaurants and Hotels Miscellaneous Goods and Services Consumption Expenditure Abroad Total (No. of Households)
SUMMARY OF THE HOUSEHOLD EXPENDITURE SURVEY 2015/16
OF BRUNEI DARUSSALAM
MONTHLY HOUSEHOLD EXPENDITURE
Below 1,623 899 220 744
Income Range
(BND)
Average
(BND)
Per Capita
(BND)
Median
(BND)
By Household Income Quintile
By Household Income Quintile
By Household Income Quintile
4,213 ‐ 6,562 3,123 499 2,816
6,564 & Above 5,333 717 4,397
1,623 ‐ 2,757 1,661 334 1,471
2,759 ‐ 4,210 2,238 387 2,042
Below 2,418 1,457 314 1,294
2,419 ‐ 3,727 2,068 379 1,853
2,075
MONTHLY HOUSEHOLD EXPENDITURE
Income Range
(BND)
Average
(BND)
Per Capita
(BND)
Median
(BND)
‐
(59,900)
2,735 473
8,087 & Above 4,889 602 3,892
‐ 2,895 457 2,241
3,736 ‐ 5,415 2,585 414 2,249
5,418 ‐ 8,077 3,303 471 2,733
(66,000)
MONTHLY HOUSEHOLD EXPENDITURE
Income Range
(BND)
Average
(BND)
Per Capita
(BND)
Median
(BND)
4,679 ‐ 6,600 2,653 430 2,367
6,606 ‐ 9,756 3,426 504 2,801
Below 2,860 1,429 321 1,315
2,864 ‐ 4,677 2,179 392 1,781
(67,966)
HOUSEHOLD INCOME QUINTILES
By Types of Goods and Services
9,771 & Above 4,925 614 3,775
‐ 2,923 472 2,205
233 302 361 410 513
First Second Third Fourth
24 56 74 95 141
14 28 55 114 193
(13,606)(13,590)
2,179
(13,595)
2,653
(13,583)
3,426
(13,592)
1.7 2.6 2.8
1,429 4,925
690 902 987 1,076 1,28441 67 126 165 280
8 10 14 22 32138 239 309 498 71253 81 108 144 18754 83 111 168 22518 51 98 223 525
2.8 2.948.3 41.4 37.2 31.4 26.1
Fifth
Average Monthly Household Expenditure (BND)
16.3 13.9 13.6 12.0 10.4
87 191 263 338 57068 168 147 174 261
2.9 3.1 4.7 4.8 5.7
0.6 0.5 0.5 0.6 0.69.7 11.0 11.6 14.5 14.5
9.9 11.6
3.7 3.7 4.1 4.2 3.83.8 3.8 4.2 4.9 4.6
100.0 100.0 100.0 100.0 100.0
Share (%)
4.8 7.7 5.5 5.1 5.31.0 1.3 2.1 3.3 3.9
1.3 2.3 3.7 6.5 10.76.1 8.8 9.9
2005
2015/16
2010/11
2015/16
8
HOUSEHOLD INCOME (MONTHLY)
Average (Mean)
Per Capita
Median
By Urban/Rural
Urban
‐ Mean
‐ Per Capita
‐ Median
Rural
‐ Mean
‐ Per Capita
‐ Median
By Districts
Brunei Muara
‐ Mean
‐ Per Capita
‐ Median
Belait
‐ Mean
‐ Per Capita
‐ Median
Tutong
‐ Mean
‐ Per Capita
‐ Median
Temburong
‐ Mean
‐ Per Capita
‐ Median
By Source of Income (BND) (%) (BND) (%) (BND) (%)
Employment Income … … 4,392 77.5 4,953 70.7
Self‐employment Income … … 142 2.5 409 5.8
Property Income … … 619 10.9 878 12.5
Transfer Income … … 518 9.1 770 11.0
Total … … 5,670 100.0 7,009 100.0
SUMMARY OF THE HOUSEHOLD EXPENDITURE SURVEY 2015/16
OF BRUNEI DARUSSALAM
2005 2010/11 2015/16
(BND) (BND) (BND)
4,661 5,670 7,009
807 895 1,131
3,640 4,576 5,611
(BND) (BND) (BND)
4,868 5,822 7,297
841 906 1,172
3,843 4,641 5,880
4,075 5,212 6,157
709 862 1,005
3,020 4,331 4,876
(BND) (BND) (BND)
5,038 6,035 7,271
841 915 1,128
3,935 4,932 5,877
4,222 4,874 7,074
802 881 1,308
3,100 3,925 5,518
4,001 4,539 6,160
696 771 1,032
3,265 3,657 4,862
2,500 3,531 2,929
3,280 4,209 4,015
633 875 721
9
Less than 1,000 8.4 602 171 600
1,000 ‐ 1,999 15.9 1,536 326 1,560
2,000 ‐ 2,999 16.5 2,493 480 2,502
3,000 ‐ 3,999 14.3 3,493 609 3,502
4,000 ‐ 4,999 10.5 4,474 721 4,452
5,000 ‐ 5,999 9.2 5,475 899 5,470
6,000 ‐ 6,999 6.3 6,464 959 6,482
7,000 ‐ 7,999 5.1 7,506 1,052 7,526
8,000 ‐ 8,999 3.9 8,492 1,251 8,470
9,000 ‐ 9,999 2.6 9,494 1,218 9,506
10,000 and over 7.2 15,411 1,898 12,791
Total 100.0 4,661 807 3,640
(No. of Households) (59,900)
Less than 1,000 3.2 652 174 710
1,000 ‐ 1,999 9.5 1,517 335 1,526
2,000 ‐ 2,999 15.7 2,533 470 2,553
3,000 ‐ 3,999 14.3 3,489 622 3,477
4,000 ‐ 4,999 11.9 4,478 722 4,469
5,000 ‐ 5,999 10.2 5,475 824 5,459
6,000 ‐ 6,999 8.1 6,457 916 6,433
7,000 ‐ 7,999 5.9 7,498 1,045 7,504
8,000 ‐ 8,999 4.7 8,503 1,141 8,486
9,000 ‐ 9,999 3.7 9,418 1,177 9,422
10,000 and over 12.8 14,099 1,675 12,906
Total 100.0 5,670 895 4,576
(No. of Households) (66,000)
Less than 1,000 2.1 700 214 740
1,000 ‐ 1,999 7.6 1,503 363 1,496
2,000 ‐ 2,999 11.7 2,495 503 2,497
3,000 ‐ 3,999 10.9 3,452 646 3,417
4,000 ‐ 4,999 11.2 4,481 741 4,499
5,000 ‐ 5,999 10.0 5,478 872 5,453
6,000 ‐ 6,999 9.9 6,460 1,030 6,461
7,000 ‐ 7,999 6.7 7,481 1,183 7,439
8,000 ‐ 8,999 5.5 8,438 1,290 8,434
9,000 ‐ 9,999 5.3 9,501 1,211 9,473
10,000 and over 18.9 16,096 2,006 13,628
Total 100.0 7,009 1,131 5,611
(No. of Households) (67,966)
SUMMARY OF THE HOUSEHOLD EXPENDITURE SURVEY 2015/16
OF BRUNEI DARUSSALAM
MONTHLY HOUSEHOLD INCOME
By Income Class (BND)Distribution of
Households (%)
Average
(BND)
Per Capita
(BND)
Median
(BND)
MONTHLY HOUSEHOLD INCOME
By Income Class (BND)Distribution of
Households (%)
Average
(BND)
Per Capita
(BND)
Median
(BND)
MONTHLY HOUSEHOLD INCOME
By Income Class (BND)Distribution of
Households (%)
Average
(BND)
Per Capita
(BND)
Median
(BND)
2005
2015/16
2010/11
10
First Quintile
Second Quintile
Third Quintile
Fourth Quintile
Fifth Quintile
Total
(No. of Households)
First Quintile
Second Quintile
Third Quintile
Fourth Quintile
Fifth Quintile
Total
(No. of Households)
First Quintile
Second Quintile
Third Quintile
Fourth Quintile
Fifth Quintile
Total
(No. of Households)
Employment Income
Self‐Employment Income
Property Income
Transfer Income
Total
Employment Income
Self‐Employment Income
Property Income
Transfer Income
Total
(No. of Households) (13,606)(13,590)
3,743
(13,595)
5,618
(13,583)
8,030
(13,592)
429 599 625 851 1,344
1,897 15,749
Share (%)
43.5 61.3 73.3 74.7 73.1
5.5 3.9 3.0
105 146 169 258 1,365
537 704 705 919 1,525
826 2,293 4,119 6,002 11,515
(67,966)
HOUSEHOLD INCOME QUINTILES
Average Monthly Household Income (BND)By Sources of Income
First Second Third Fourth
9,771 & Above 15,749 1,963 13,284
‐ 7,009 1,131 5,611
Fifth
4,679 ‐ 6,600 5,618 911 5,611
6,606 ‐ 9,756 8,030 1,182 7,979
Below 2,860 1,897 426 2,012
2,864 ‐ 4,677 3,743 673 3,739
(66,000)
MONTHLY HOUSEHOLD INCOME
Income Range
(BND)
Average
(BND)
Per Capita
(BND)
Median
(BND)
8,087 & Above 12,087 1,488 10,720
‐ 5,670 895 4,576
3,736 ‐ 5,415 4,530 725 4,512
5,418 ‐ 8,077 6,571 938 6,465
3,050 559 3,020
3,640
MONTHLY HOUSEHOLD INCOME
Income Range
(BND)
Average
(BND)
Per Capita
(BND)
Median
(BND)
‐
(59,900)
4,661 807
By Household Income Quintile
By Household Income Quintile
By Household Income Quintile
4,213 ‐ 6,562 5,283 843 5,228
6,564 & Above 10,513 1,414 8,791
1,623 ‐ 2,757 2,189 440 2,190
2,759 ‐ 4,210 3,464 600 3,471
Below 2,418 1,587 342 1,647
2,419 ‐ 3,727
SUMMARY OF THE HOUSEHOLD EXPENDITURE SURVEY 2015/16
OF BRUNEI DARUSSALAM
MONTHLY HOUSEHOLD INCOME
Below 1,623 982 240 1,020
Income Range
(BND)
Average
(BND)
Per Capita
(BND)
Median
(BND)
100.0 100.0 100.0 100.0 100.0
3.2 8.7
28.3 18.8 12.5 11.4 9.7
22.6 16.0 11.1 10.6 8.5
2005
2015/16
2010/11
2015/16
11
Average Monthly
Per Capita Expenditure
TUTONG
Average 3,073Per Capita
Median
5152,436
BND
BRUNEI MUARA
Average 3,058 Per Capita
Median
474 2,260
BND
BELAIT
Average 2,491 Per Capita
Median
461 2,029
BND
TEMBURONG
Average 1,763 Per Capita
Median
317 1,475
BND
2005
Average Monthly
Household Expenditure
HOUSEHOLD EXPENDITURE 2015/16
2015/16 BND 2,923
2005 BND 473
2010/11 BND 457
2015/16 BND 472
Median Monthly
Household Expenditure
BND 2,735
2010/11 BND 2,895
2005 BND 2,075
2010/11 BND 2,241
2015/16 BND 2,205
By Districts
By Year
12
Housing, Water, Electricity, Gas and Other Fuels
BND 988 33.8%
Transport
BND 379 13.0% Food and Non‐Alcoholic
Beverages
BND 364 12.5%
Restaurants and Hotels
BND 290 9.9%
Education
BND 183 6.3%
Miscellaneous Goods and Services
BND 164 5.6%
Furnishing, Household Equipment and Routine Household Maintenance
BND 136 4.6%
Recreation and Culture
BND 128 4.4%
Communication
BND 115 3.9%
Consumption Expenditure Abroad
BND 81 2.8%
Health
BND 17 0.6%
Clothing and Footwear
BND 78 2.7%
Average Monthly Household Expenditure and Share by Types of Goods and Services
Average and Median Monthly Household Expenditure By Expenditure Class and Year
HOUSEHOLD EXPENDITURE 2015/16
Average (BND) Median (BND) Less than 1,000
1,000 – 1,999
2,000 – 2,999
3,000 – 3,999
4,000 – 4,999
5,000 – 5,999
6,000 – 6,999
7,000 – 7,999
8,000 – 8,999
9,000 – 9,999
10,000 and over
655 700 708
1,505 1,550 1,551
2,460 2,435 2,453
3,443 3,438 3,429
4,463 4,461 4,428
5,459 5,442 5,475
6,426 6,499 6,439
7,449 7,484 7,419
8,463 8,414 8,384
9,539 9,454 9,475
14,466 13,705
15,755
687 750 750
1,513 1,565 1,578
2,447 2,411 2,444
3,421 3,409 3,411
4,442 4,448 4,345
5,425 5,416 5,470
6,410 6,512 6,358
7,457 7,504 7,369
8,520 8,376 8,350
9,549 9,367 9,362
12,335 11,803
12,890
2005
2010/11
2015/16
13
Average Monthly
Per Capita Income
2005
Average Monthly
Household Income
HOUSEHOLD INCOME 2015/16
2015/16 BND 7,009
2005 BND 807
2010/11 BND 895
2015/16 BND 1,131
Median Monthly
Household Income
BND 4,661
2010/11 BND 5,670
2005 BND 3,640
2010/11 BND 4,576
2015/16 BND 5,611
By Districts
By Year
TUTONG
Average 6,160Per Capita
Median
1,0324,862
BND
BRUNEI MUARA
Average 7,271 Per Capita
Median
1,128 5,877
BND
BELAIT
Average 7,074 Per Capita
Median
1,308 5,518
BND
TEMBURONG
Average 4,015 Per Capita
Median
721 2,929
BND
14
Average Monthly Household Income By Sources
Average and Median Monthly Household Income By Income Class
HOUSEHOLD INCOME 2015/16
Average (BND) Median (BND) Less than 1,000
1,000 – 1,999
2,000 – 2,999
3,000 – 3,999
4,000 – 4,999
5,000 – 5,999
6,000 – 6,999
7,000 – 7,999
8,000 – 8,999
9,000 – 9,999
10,000 and over
602 652 700
1,536 1,517 1,503
2,493 2,533 2,495
3,493 3,489 3,452
4,474 4,478 4,481
5,475 5,475 5,478
6,464 6,457 6,460
7,506 7,498 7,481
8,492 8,503 8,438
9,494 9,418 9,501
15,411 14,099
16,096
600 710 740
1,560 1,526 1,496
2,502 2,553 2,497
3,502 3,477 3,417
4,452 4,469 4,499
5,470 5,459 5,453
6,482 6,433 6,461
7,526 7,504 7,439
8,470 8,486 8,434
9,506 9,422 9,473
12,791 12,906
13,628
Employment Income
BND 4,953 70.7% Self‐Employment Income
BND 409 5.8%
Property Income
BND 878 12.5%
Transfer Income
BND 770 11.0%
2005
2010/11
2015/16
15
Report of Summary Findings Household Expenditure Survey 2015/16
Technical Notes
Survey Methodology
The coverage of the HES 2015/16 was nationwide on a sample basis limited to private
households. It used a stratified two‐stage sampling design, with “segments” as the first stage
of sampling and the households as the second stage sampling units.
The HES 2015/16 was conducted by a combination of the interview and ‘diary’
methods. Data on expenditures and incomes received was recorded on a daily basis, either
by the survey officers or the respondent themselves, using a Household Record Book (HRB).
The survey was conducted over a period of twelve months, where each selected
household was surveyed for one survey month. The reasons to spread over the twelve‐month
period were:
To ensure seasonal variation in particular months with festive activities were taken
into account;
To enhance data quality; and
To ensure good control of supervision of field work operations.
Concepts and Definitions
Household
A household is composed of a single person or a group of persons living together in the same
house and making common provisions for food and other essentials of living. This group of
persons may not necessarily be related to each other. Persons living in the same house but
having their own food arrangements are not considered as members of the same household.
Household Consumption Expenditure
Household consumption expenditure refers to all expenditures, whether in cash or in‐kind,
made by the household or individual members on goods and services that are intended for
consumption. It also includes the value of goods and services produced by the household for
their own consumption. Thus, the imputed rent of owner‐occupied housing is included as part
of household consumption expenditure.
Non‐consumption expenditures such as donations, repayment of loans and expenditures for
household enterprises.
16
Report of Summary Findings Household Expenditure Survey 2015/16
Types of Goods and Services
The types of goods and services for the household consumption expenditure is categorised
according to the Brunei Darussalam Standard Classification of Household Expenditure. This is
based on the Classification of Individual Consumption According to Purpose (COICOP),
including an additional category for consumption expenditure abroad. The major divisions
are:
1 Food and Non‐alcoholic Beverages
2 Clothing and Footwear
3 Housing, Water, Electricity, Gas and Other Fuels
4 Furnishings, Household Equipment and Routine Household Maintenance
5 Health
6 Transport
7 Communication
8 Recreation and Culture
9 Education
10 Restaurants and Hotels
11 Miscellaneous Goods and Services
12 Consumption Expenditure Abroad
Household Income
Household income consists of regular receipts, both in cash and in‐kind, accruing to members
of the household before compulsory deductions. The monthly household income refers to
the average income received per month by all household members from all sources. It also
includes the imputed rent of owner‐occupied housing. However, the income of domestic
workers or maids is excluded from the total household income.
Excluded from household income are non‐regular or non‐recurring receipts such as
withdrawals from savings and loans obtained.
17
Report of Summary Findings Household Expenditure Survey 2015/16
Source of Income
Household income is made up of income from work, self‐employment income, property
income and transfer income.
(i) Employment Income
This includes employer and employee income, but exclude self‐employment income.
Employer income refers to the average receipts or profits a person earns from a
business undertaking after deducting all operating expenses incurred such as
purchases of materials and services, rent for premises or machineries, cost of repair
of machineries and fixtures.
Employee income refers to the gross amount received per month before deductions
for the Employees Trust Fund and loan repayment. It includes the basic wage or salary,
overtime pay, allowances, tips, commissions as well as income inkind provided by the
employer, e.g. food, clothing and housing. It also includes one‐twelfth of the annual
bonus, and regular income received from secondary employment.
(ii) Self‐Employment Income
Self‐employment income is defined as the net income derived from self‐employment
in household enterprises, business, trade and professional activities.
(iii) Property Income
Property income refers to net receipts derived from ownership of assets and includes
interests, dividends, rent of buildings, land, machinery and equipment, as well as the
imputed rent of owner‐occupied housing.
(iv) Transfer Income
Transfer income consists of pensions, allowances and assistances from government
and private organisations. It also includes inter‐household transfers such as alimony,
child support, parental support and in‐kind goods and services from social
organisations.
Income Quintiles
Income quintiles refer to the household income groups where the households are ranked in
ascending order according to their incomes and then divided into five equal groups. Each
group comprises 20 per cent of the households. The first quintile consists of households with
income one‐fifth way from the bottom, while the fifth quintile consists of households with
income one‐fifth way from the top.
18