kuala lumpur 25 & 26 july 2017 - sime darby · kuala lumpur 25 & 26 july 2017. 2 table of...
TRANSCRIPT
Sime Darby Berhad Investor PresentationInvest Malaysia 2017Kuala Lumpur
25 & 26 July 2017
2
Table of ContentsAgenda
Sime Darby’s Financial Highlights A
B Key Divisional Highlights
C Sime Darby’s Pure Play Strategy
3
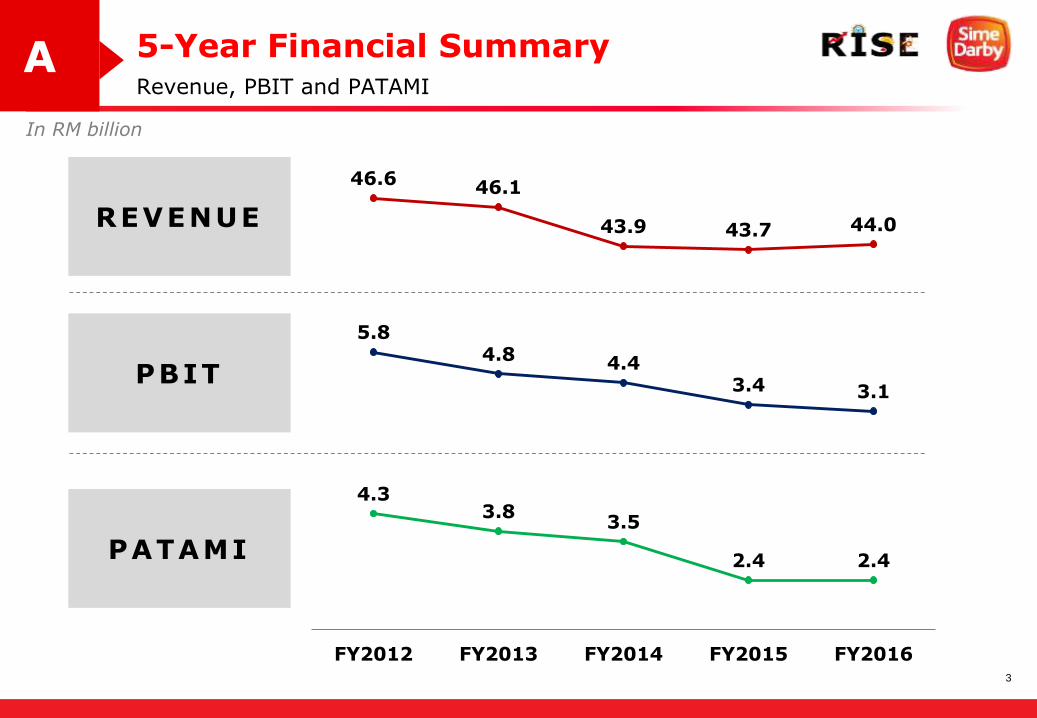
5-Year Financial Summary
In RM billion
Revenue, PBIT and PATAMIA
46.6 46.1
43.9 43.7 44.0
5.84.8 4.4
3.4 3.1
4.33.8
3.5
2.4 2.4
FY2012 FY2013 FY2014 FY2015 FY2016
REVENUE
PBIT
PATAMI
4
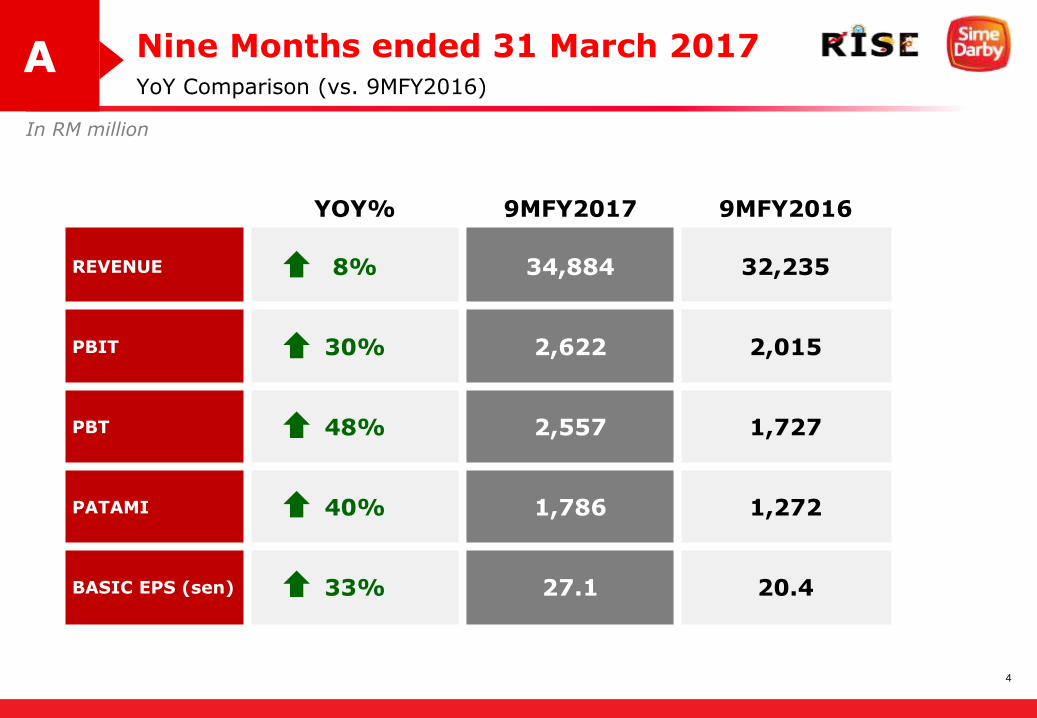
Nine Months ended 31 March 2017
In RM million
YoY Comparison (vs. 9MFY2016) A
YOY% 9MFY2017 9MFY2016
REVENUE 8% 34,884 32,235
PBIT 30% 2,622 2,015
PBT 48% 2,557 1,727
PATAMI 40% 1,786 1,272
BASIC EPS (sen) 33% 27.1 20.4
5
9MFY2017 Divisional PBITYoY Comparison (vs. 9MFY2016)
B
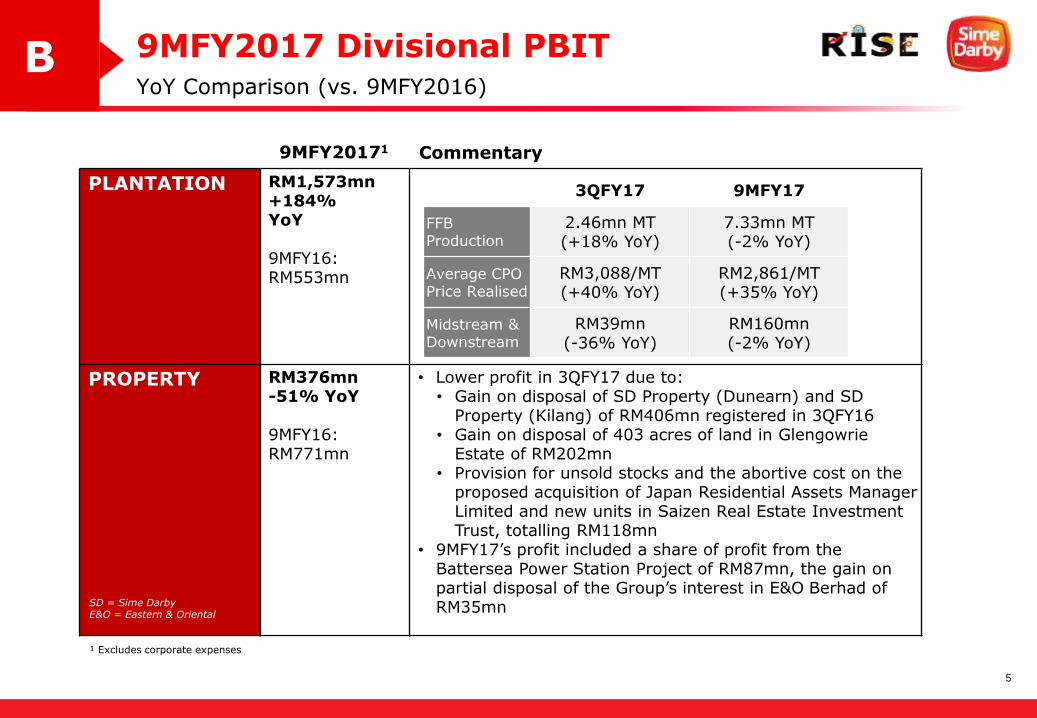
PLANTATION RM1,573mn +184% YoY
9MFY16: RM553mn
PROPERTY RM376mn -51% YoY
9MFY16: RM771mn
• Lower profit in 3QFY17 due to: • Gain on disposal of SD Property (Dunearn) and SD
Property (Kilang) of RM406mn registered in 3QFY16• Gain on disposal of 403 acres of land in Glengowrie
Estate of RM202mn• Provision for unsold stocks and the abortive cost on the
proposed acquisition of Japan Residential Assets Manager Limited and new units in Saizen Real Estate Investment Trust, totalling RM118mn
• 9MFY17’s profit included a share of profit from the Battersea Power Station Project of RM87mn, the gain on partial disposal of the Group’s interest in E&O Berhad of RM35mn
3QFY17 9MFY17
FFB Production
2.46mn MT (+18% YoY)
7.33mn MT(-2% YoY)
Average CPO Price Realised
RM3,088/MT (+40% YoY)
RM2,861/MT (+35% YoY)
Midstream & Downstream
RM39mn (-36% YoY)
RM160mn (-2% YoY)
9MFY20171 Commentary
SD = Sime DarbyE&O = Eastern & Oriental
¹ Excludes corporate expenses
6
9MFY2017 Divisional PBITYoY Comparison (vs. 9MFY2016)
B
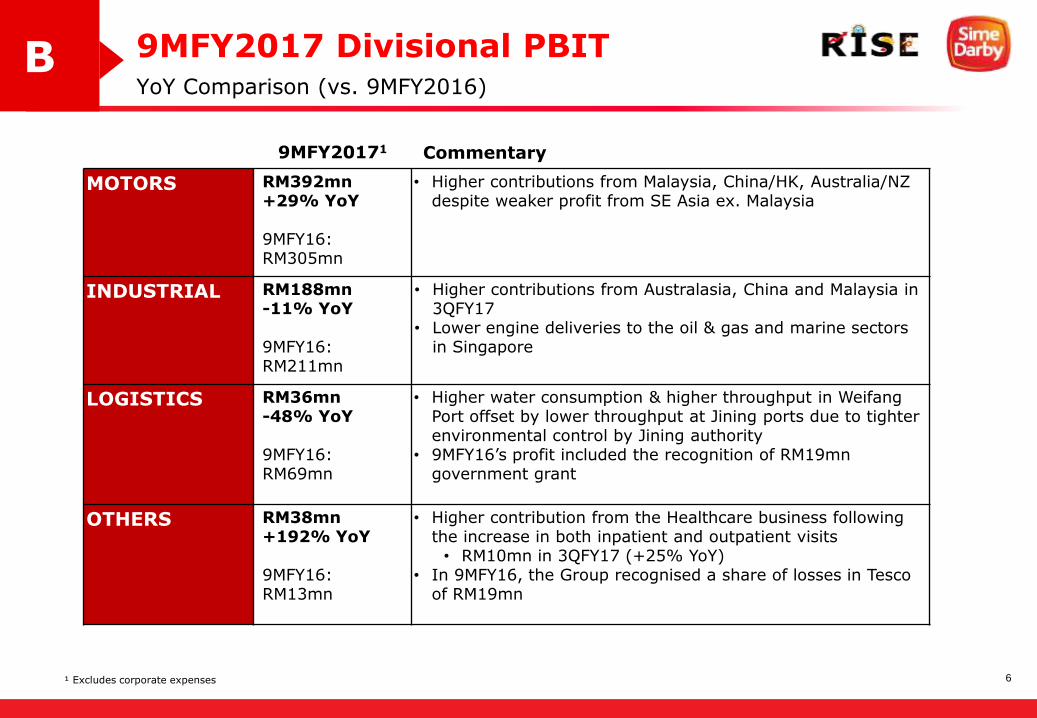
MOTORS RM392mn +29% YoY
9MFY16: RM305mn
• Higher contributions from Malaysia, China/HK, Australia/NZ despite weaker profit from SE Asia ex. Malaysia
INDUSTRIAL RM188mn -11% YoY
9MFY16: RM211mn
• Higher contributions from Australasia, China and Malaysia in3QFY17
• Lower engine deliveries to the oil & gas and marine sectors in Singapore
LOGISTICS RM36mn -48% YoY
9MFY16: RM69mn
• Higher water consumption & higher throughput in Weifang Port offset by lower throughput at Jining ports due to tighter environmental control by Jining authority
• 9MFY16’s profit included the recognition of RM19mn government grant
OTHERS RM38mn +192% YoY
9MFY16: RM13mn
• Higher contribution from the Healthcare business following the increase in both inpatient and outpatient visits• RM10mn in 3QFY17 (+25% YoY)
• In 9MFY16, the Group recognised a share of losses in Tesco of RM19mn
¹ Excludes corporate expenses
9MFY20171 Commentary
7
Key Divisional Highlights - PlantationB
FY2016 9MFY2017
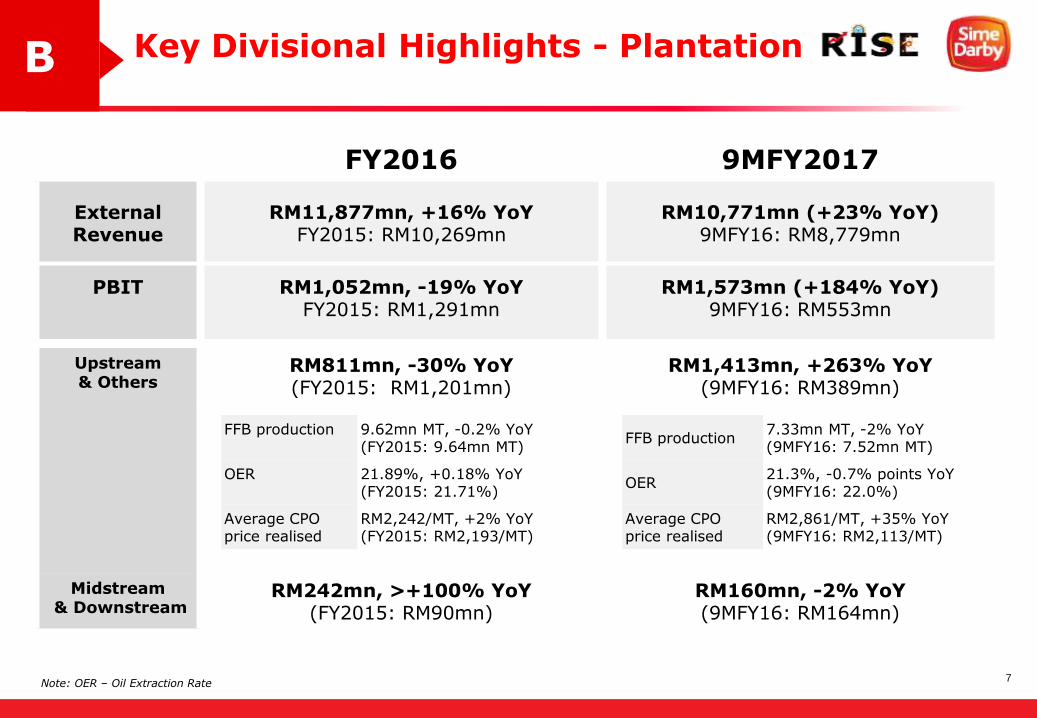
External Revenue
RM11,877mn, +16% YoYFY2015: RM10,269mn
RM10,771mn (+23% YoY)9MFY16: RM8,779mn
PBIT RM1,052mn, -19% YoYFY2015: RM1,291mn
RM1,573mn (+184% YoY)9MFY16: RM553mn
Upstream & Others
RM811mn, -30% YoY(FY2015: RM1,201mn)
RM1,413mn, +263% YoY (9MFY16: RM389mn)
Midstream& Downstream
RM242mn, >+100% YoY(FY2015: RM90mn)
RM160mn, -2% YoY(9MFY16: RM164mn)
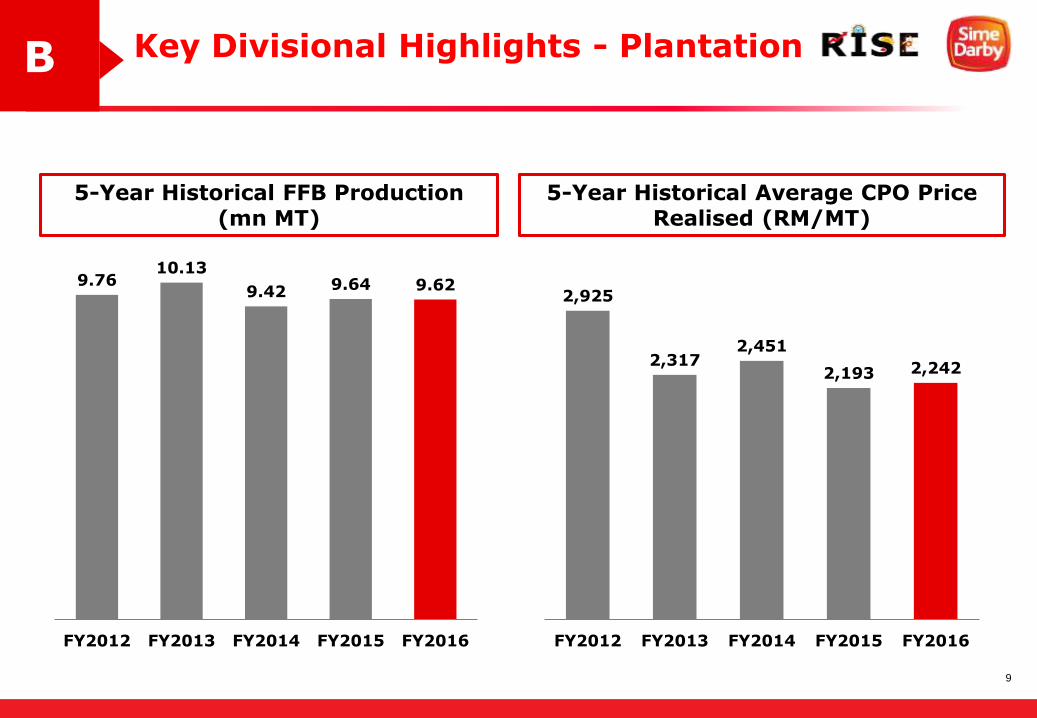
FFB production 9.62mn MT, -0.2% YoY(FY2015: 9.64mn MT)
OER 21.89%, +0.18% YoY (FY2015: 21.71%)
Average CPO price realised
RM2,242/MT, +2% YoY (FY2015: RM2,193/MT)
FFB production7.33mn MT, -2% YoY (9MFY16: 7.52mn MT)
OER21.3%, -0.7% points YoY (9MFY16: 22.0%)
Average CPO price realised
RM2,861/MT, +35% YoY (9MFY16: RM2,113/MT)
Note: OER – Oil Extraction Rate
8
Key Divisional Highlights - PlantationB
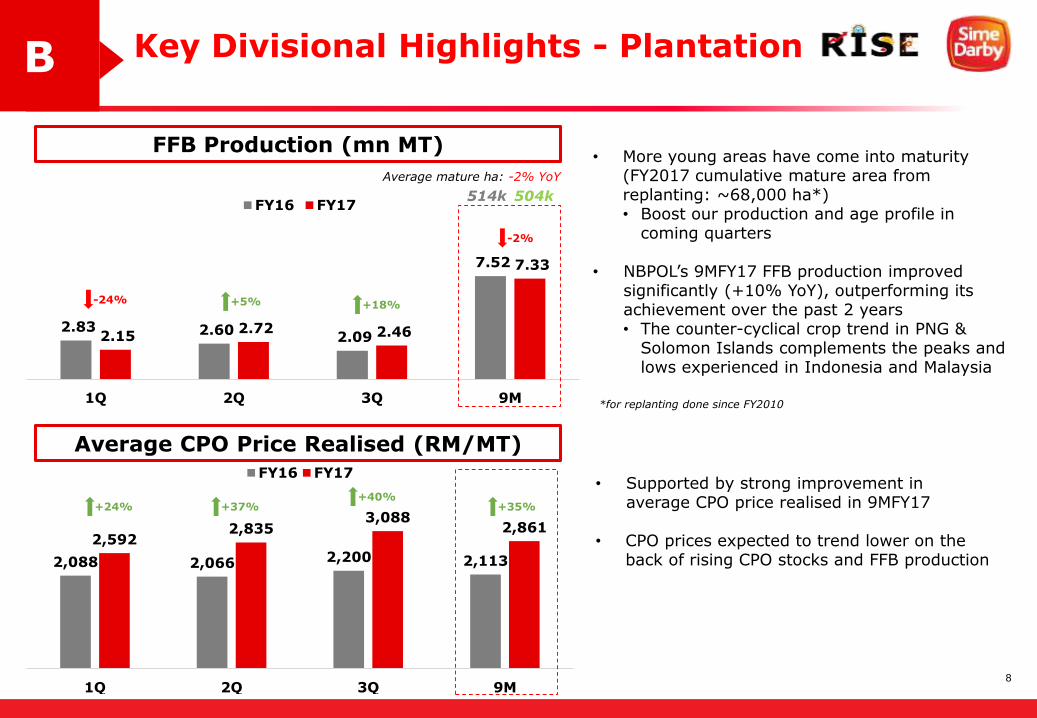
2.83 2.60 2.09
7.52
2.15 2.72 2.46
7.33
1Q 2Q 3Q 9M
FY16 FY17
2,088 2,066 2,200 2,113
2,5922,835
3,0882,861
1Q 2Q 3Q 9M
FY16 FY17
FFB Production (mn MT)
+5% +18%-24%
-2%
• More young areas have come into maturity (FY2017 cumulative mature area from replanting: ~68,000 ha*)• Boost our production and age profile in
coming quarters
• NBPOL’s 9MFY17 FFB production improved significantly (+10% YoY), outperforming its achievement over the past 2 years• The counter-cyclical crop trend in PNG &
Solomon Islands complements the peaks and lows experienced in Indonesia and Malaysia
Average CPO Price Realised (RM/MT)
+24% +37%+40%
+35%
• Supported by strong improvement in average CPO price realised in 9MFY17
• CPO prices expected to trend lower on the back of rising CPO stocks and FFB production
514k 504k
Average mature ha: -2% YoY
*for replanting done since FY2010
9
Key Divisional Highlights - PlantationB
5-Year Historical FFB Production (mn MT)
5-Year Historical Average CPO Price Realised (RM/MT)
9.7610.13
9.42 9.64 9.62
FY2012 FY2013 FY2014 FY2015 FY2016
2,925
2,3172,451
2,193 2,242
FY2012 FY2013 FY2014 FY2015 FY2016
10
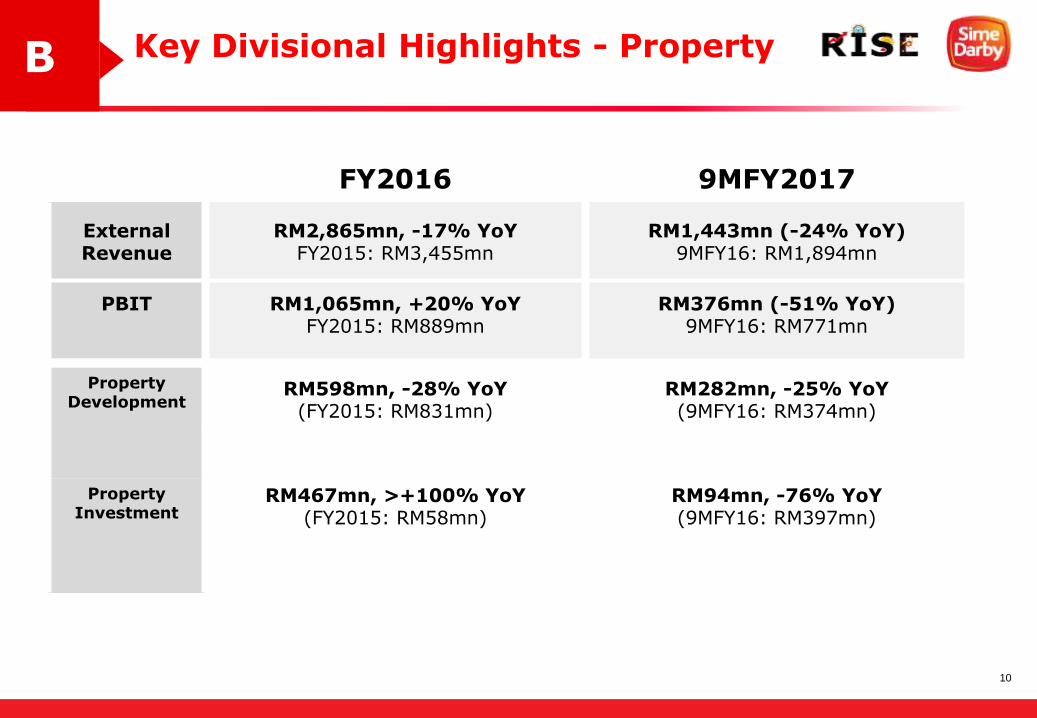
Key Divisional Highlights - PropertyB
FY2016 9MFY2017
External Revenue
RM2,865mn, -17% YoYFY2015: RM3,455mn
RM1,443mn (-24% YoY)9MFY16: RM1,894mn
PBIT RM1,065mn, +20% YoYFY2015: RM889mn
RM376mn (-51% YoY)9MFY16: RM771mn
Property Development
RM598mn, -28% YoY(FY2015: RM831mn)
RM282mn, -25% YoY (9MFY16: RM374mn)
Property Investment
RM467mn, >+100% YoY(FY2015: RM58mn)
RM94mn, -76% YoY(9MFY16: RM397mn)
11
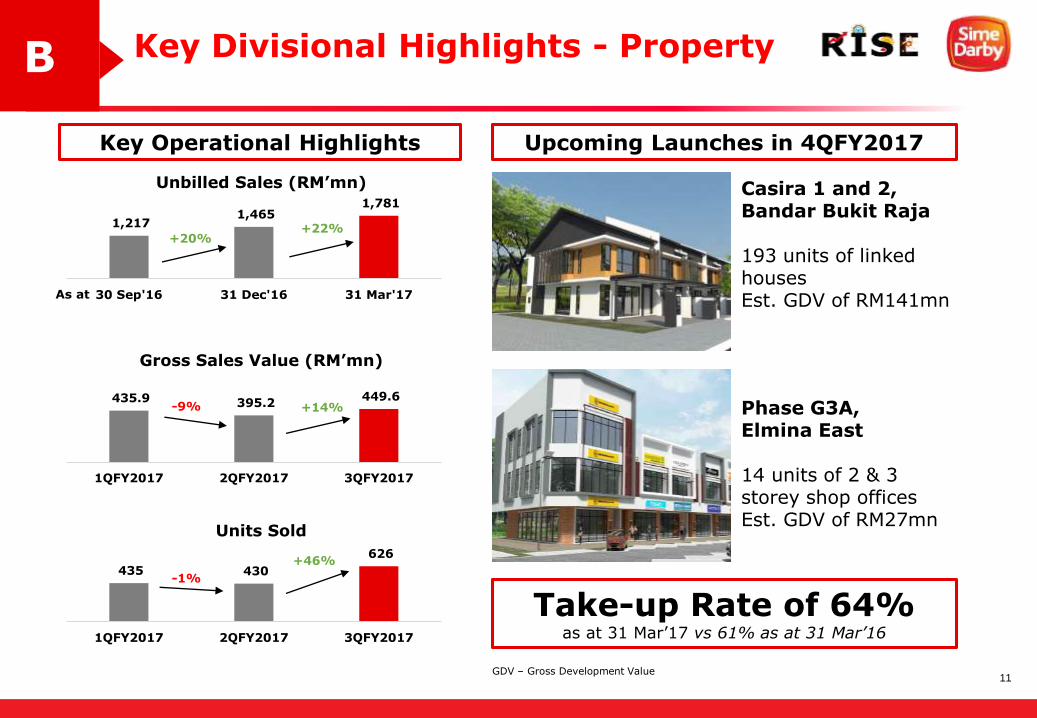
Key Divisional Highlights - PropertyB
Key Operational Highlights Upcoming Launches in 4QFY2017
Casira 1 and 2, Bandar Bukit Raja
193 units of linked houses Est. GDV of RM141mn
Unbilled Sales (RM’mn)
Gross Sales Value (RM’mn)
Units Sold
1,217 1,465
1,781
30 Sep'16 31 Dec'16 31 Mar'17
435.9 395.2 449.6
1QFY2017 2QFY2017 3QFY2017
435 430
626
1QFY2017 2QFY2017 3QFY2017
As at
+20%+22%
+14%-9%
-1%
+46%
Phase G3A, Elmina East
14 units of 2 & 3 storey shop officesEst. GDV of RM27mn
GDV – Gross Development Value
Take-up Rate of 64%as at 31 Mar’17 vs 61% as at 31 Mar’16
12
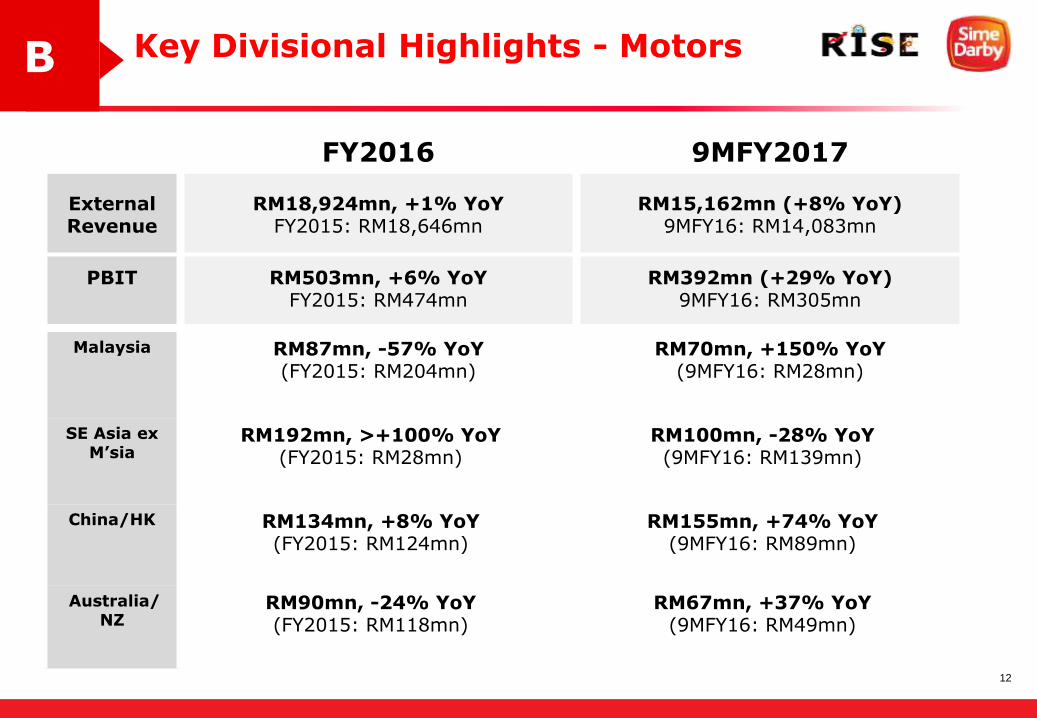
Key Divisional Highlights - MotorsB
FY2016 9MFY2017
External Revenue
RM18,924mn, +1% YoYFY2015: RM18,646mn
RM15,162mn (+8% YoY)9MFY16: RM14,083mn
PBIT RM503mn, +6% YoYFY2015: RM474mn
RM392mn (+29% YoY)9MFY16: RM305mn
Malaysia RM87mn, -57% YoY(FY2015: RM204mn)
RM70mn, +150% YoY (9MFY16: RM28mn)
SE Asia ex M’sia
RM192mn, >+100% YoY(FY2015: RM28mn)
RM100mn, -28% YoY(9MFY16: RM139mn)
China/HK RM134mn, +8% YoY(FY2015: RM124mn)
RM155mn, +74% YoY(9MFY16: RM89mn)
Australia/NZ
RM90mn, -24% YoY(FY2015: RM118mn)
RM67mn, +37% YoY(9MFY16: RM49mn)
13
Key Divisional Highlights - MotorsB
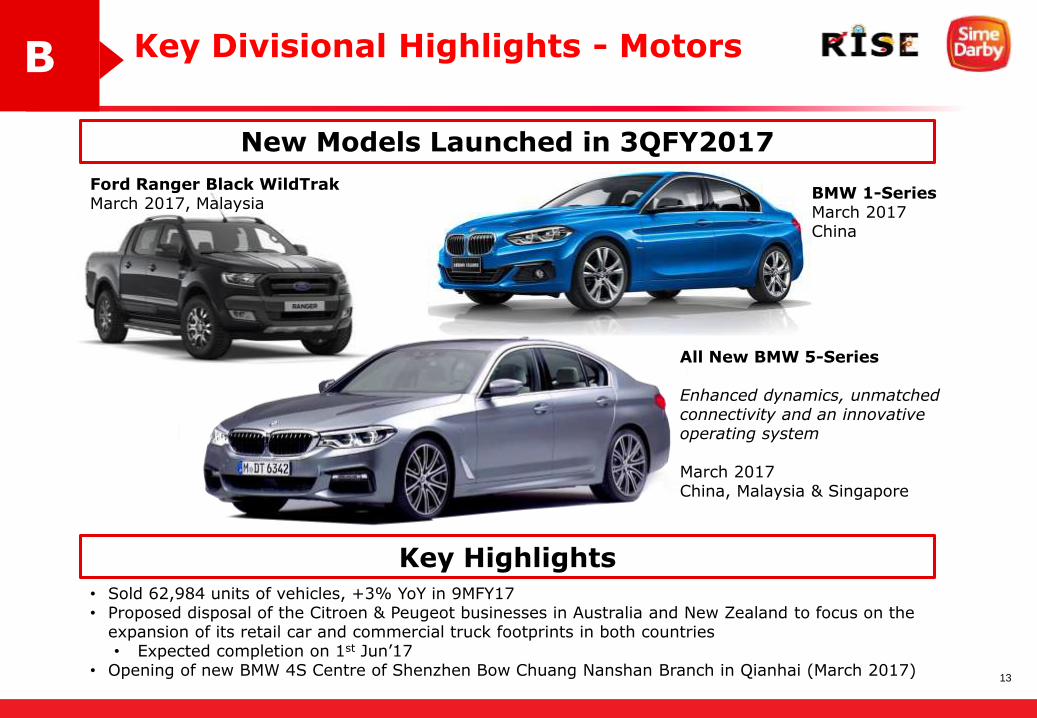
New Models Launched in 3QFY2017
Ford Ranger Black WildTrakMarch 2017, Malaysia
Key Highlights• Sold 62,984 units of vehicles, +3% YoY in 9MFY17 • Proposed disposal of the Citroen & Peugeot businesses in Australia and New Zealand to focus on the
expansion of its retail car and commercial truck footprints in both countries• Expected completion on 1st Jun’17
• Opening of new BMW 4S Centre of Shenzhen Bow Chuang Nanshan Branch in Qianhai (March 2017)
BMW 1-SeriesMarch 2017China
All New BMW 5-Series
Enhanced dynamics, unmatched connectivity and an innovative operating system
March 2017China, Malaysia & Singapore
14
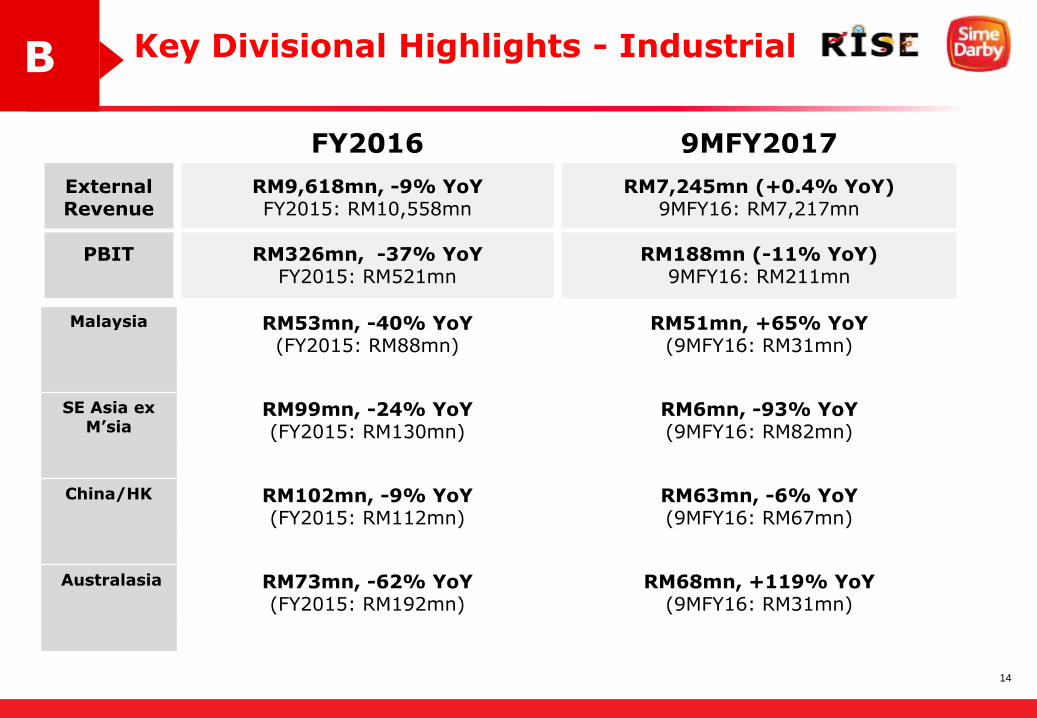
B Key Divisional Highlights - Industrial
FY2016 9MFY2017
External Revenue
RM9,618mn, -9% YoYFY2015: RM10,558mn
RM7,245mn (+0.4% YoY)9MFY16: RM7,217mn
PBIT RM326mn, -37% YoYFY2015: RM521mn
RM188mn (-11% YoY)9MFY16: RM211mn
Malaysia RM53mn, -40% YoY(FY2015: RM88mn)
RM51mn, +65% YoY (9MFY16: RM31mn)
SE Asia ex M’sia
RM99mn, -24% YoY(FY2015: RM130mn)
RM6mn, -93% YoY(9MFY16: RM82mn)
China/HK RM102mn, -9% YoY(FY2015: RM112mn)
RM63mn, -6% YoY(9MFY16: RM67mn)
Australasia RM73mn, -62% YoY(FY2015: RM192mn)
RM68mn, +119% YoY(9MFY16: RM31mn)
15
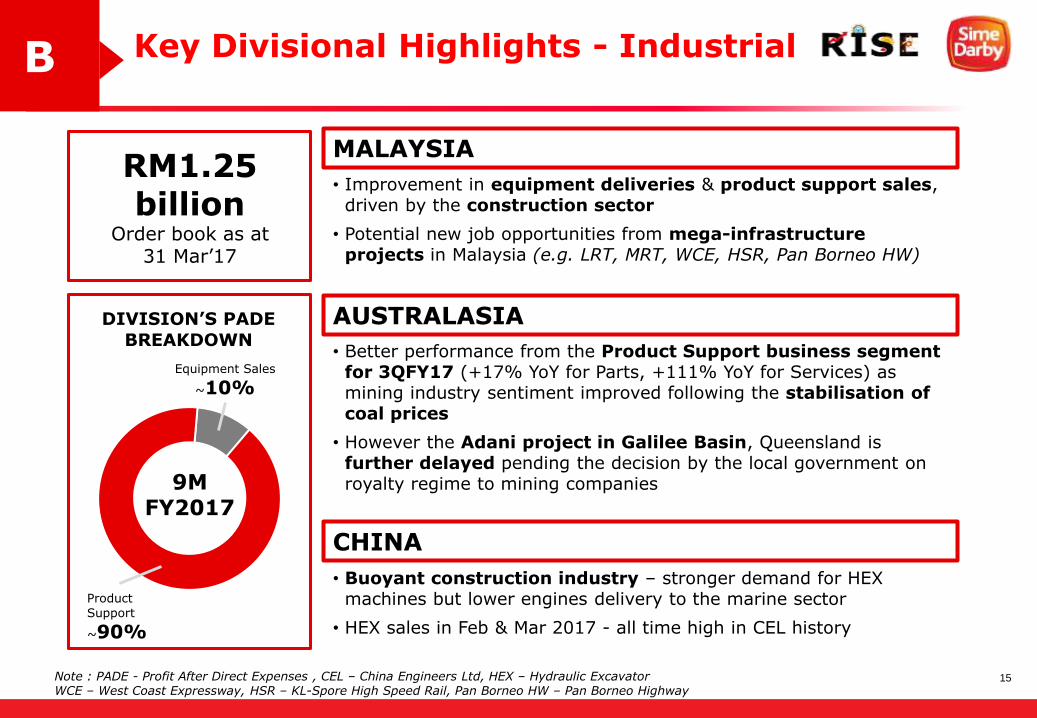
B Key Divisional Highlights - Industrial
RM1.25 billion
Order book as at 31 Mar’17
• Improvement in equipment deliveries & product support sales, driven by the construction sector
• Potential new job opportunities from mega-infrastructure projects in Malaysia (e.g. LRT, MRT, WCE, HSR, Pan Borneo HW)
Equipment Sales
~10%
Product
Support
~90%
DIVISION’S PADE
BREAKDOWN
9MFY2017
Note : PADE - Profit After Direct Expenses , CEL – China Engineers Ltd, HEX – Hydraulic ExcavatorWCE – West Coast Expressway, HSR – KL-Spore High Speed Rail, Pan Borneo HW – Pan Borneo Highway
MALAYSIA
AUSTRALASIA
• Better performance from the Product Support business segment for 3QFY17 (+17% YoY for Parts, +111% YoY for Services) as mining industry sentiment improved following the stabilisation of coal prices
• However the Adani project in Galilee Basin, Queensland is further delayed pending the decision by the local government on royalty regime to mining companies
CHINA
• Buoyant construction industry – stronger demand for HEX machines but lower engines delivery to the marine sector
• HEX sales in Feb & Mar 2017 - all time high in CEL history
16
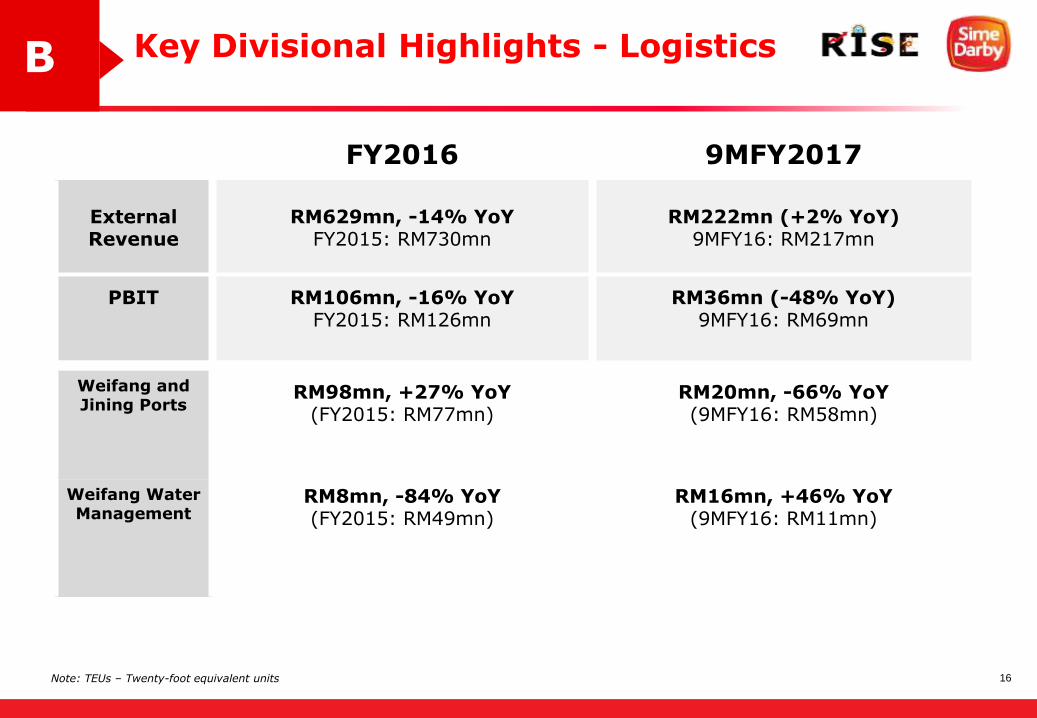
B Key Divisional Highlights - Logistics
FY2016 9MFY2017
External Revenue
RM629mn, -14% YoYFY2015: RM730mn
RM222mn (+2% YoY)9MFY16: RM217mn
PBIT RM106mn, -16% YoYFY2015: RM126mn
RM36mn (-48% YoY)9MFY16: RM69mn
Weifang and Jining Ports
RM98mn, +27% YoY(FY2015: RM77mn)
RM20mn, -66% YoY (9MFY16: RM58mn)
Weifang Water Management
RM8mn, -84% YoY(FY2015: RM49mn)
RM16mn, +46% YoY(9MFY16: RM11mn)
Note: TEUs – Twenty-foot equivalent units
17
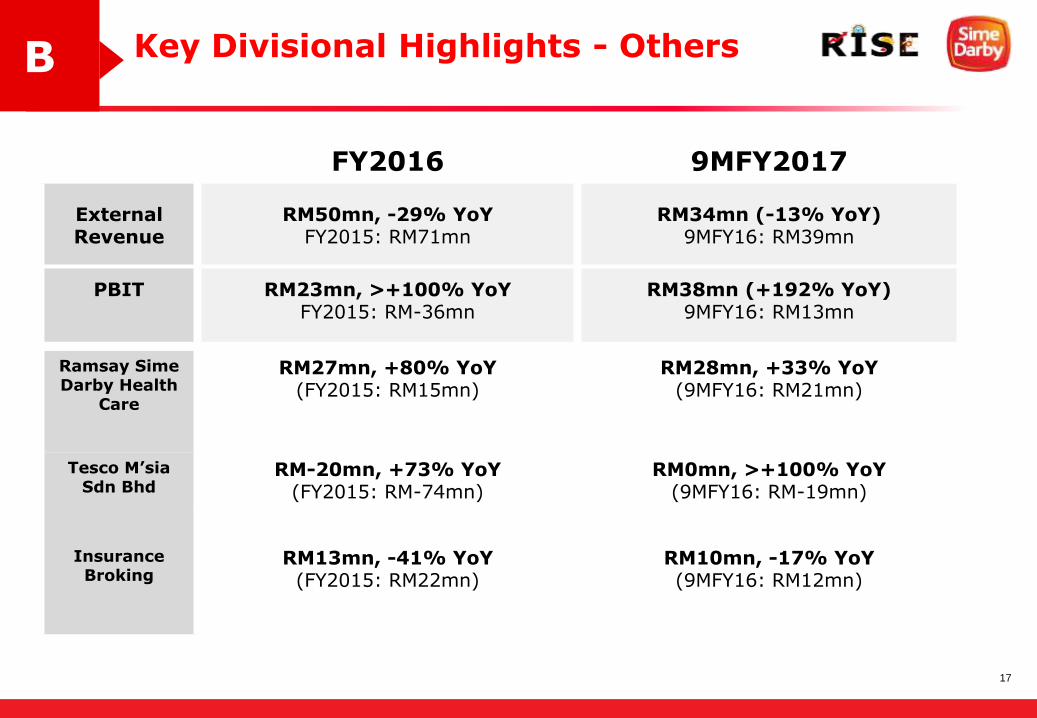
B Key Divisional Highlights - Others
FY2016 9MFY2017
External Revenue
RM50mn, -29% YoYFY2015: RM71mn
RM34mn (-13% YoY)9MFY16: RM39mn
PBIT RM23mn, >+100% YoYFY2015: RM-36mn
RM38mn (+192% YoY)9MFY16: RM13mn
Ramsay Sime Darby Health
Care
RM27mn, +80% YoY(FY2015: RM15mn)
RM28mn, +33% YoY (9MFY16: RM21mn)
Tesco M’sia Sdn Bhd
RM-20mn, +73% YoY (FY2015: RM-74mn)
RM0mn, >+100% YoY (9MFY16: RM-19mn)
Insurance Broking
RM13mn, -41% YoY(FY2015: RM22mn)
RM10mn, -17% YoY(9MFY16: RM12mn)
18
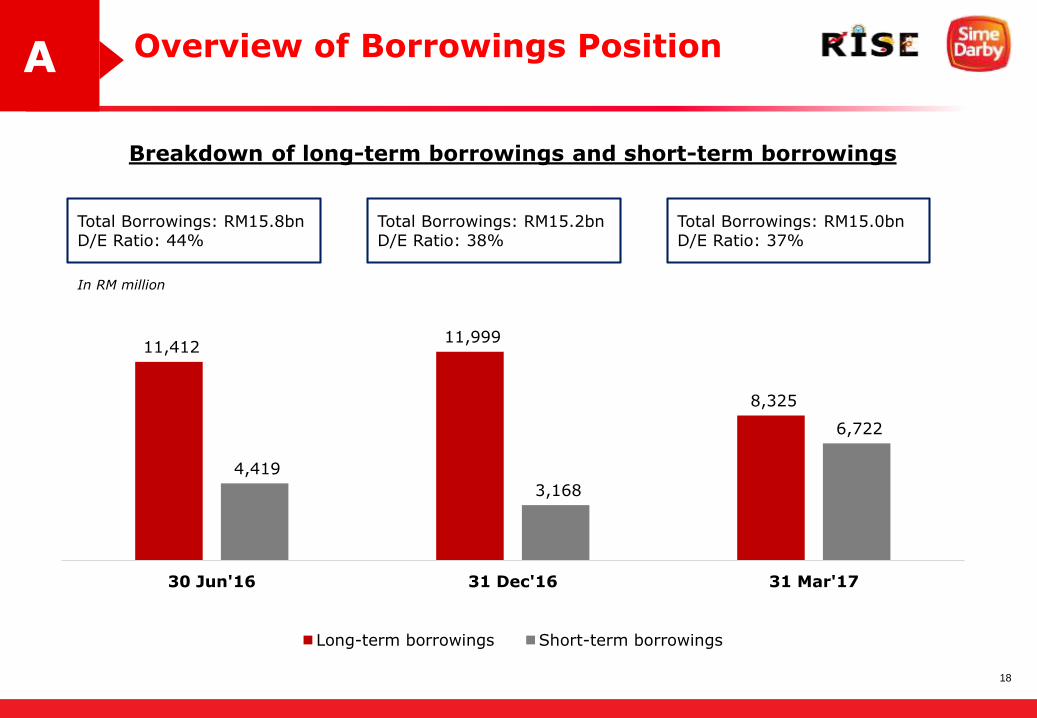
Overview of Borrowings Position A
4,419
3,168
6,722
11,412 11,999
8,325
30 Jun'16 31 Dec'16 31 Mar'17
Long-term borrowings Short-term borrowings
Total Borrowings: RM15.2bnD/E Ratio: 38%
Total Borrowings: RM15.0bnD/E Ratio: 37%
Breakdown of long-term borrowings and short-term borrowings
Total Borrowings: RM15.8bnD/E Ratio: 44%
In RM million
19
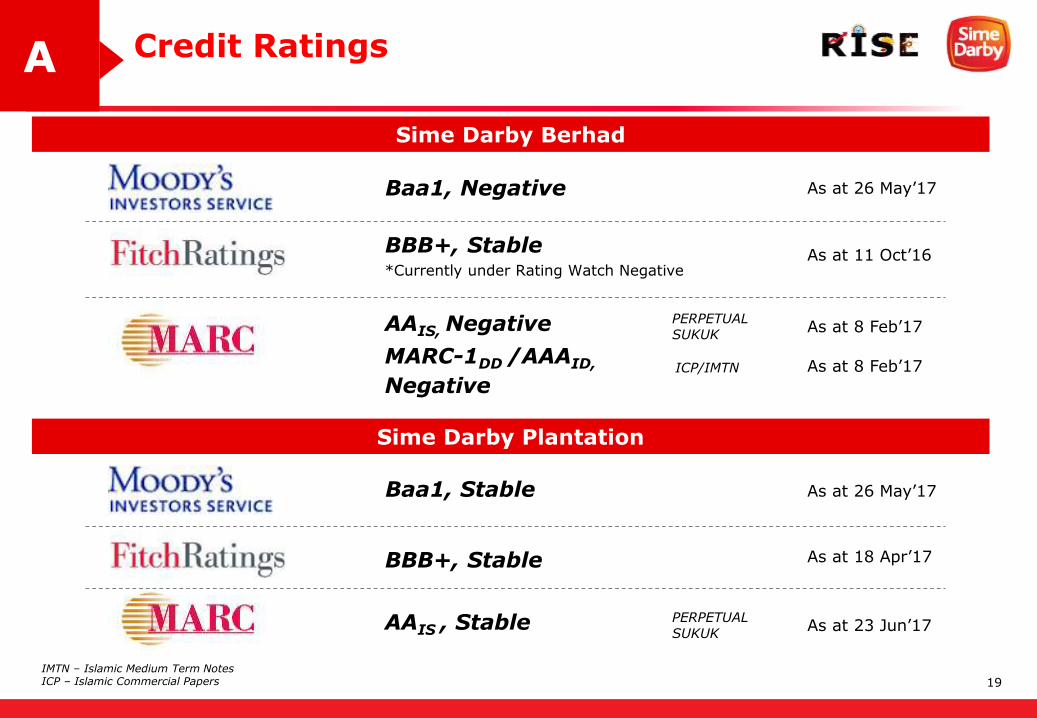
Credit RatingsA
Baa1, Negative As at 26 May’17
BBB+, Stable
AAIS, Negative
MARC-1DD /AAAID,
Negative
PERPETUAL SUKUK
ICP/IMTN
Sime Darby Berhad
*Currently under Rating Watch NegativeAs at 11 Oct’16
As at 8 Feb’17
As at 8 Feb’17
Sime Darby Plantation
Baa1, Stable As at 26 May’17
BBB+, Stable As at 18 Apr’17
IMTN – Islamic Medium Term NotesICP – Islamic Commercial Papers
AAIS , Stable PERPETUAL SUKUK
As at 23 Jun’17
20
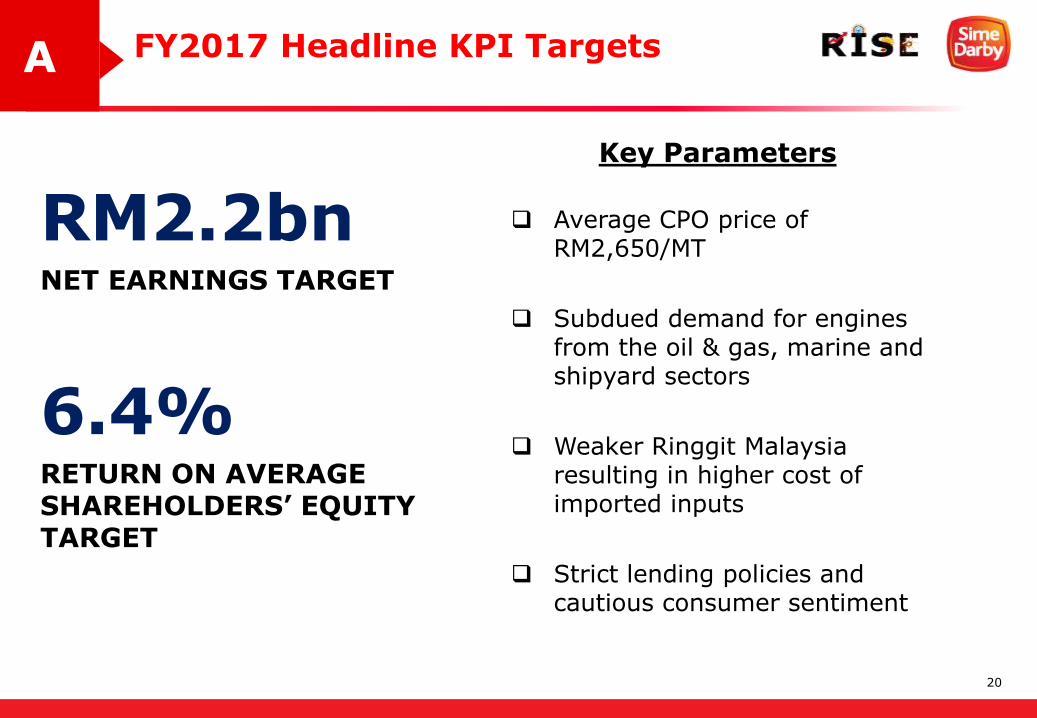
FY2017 Headline KPI TargetsA
RM2.2bnNET EARNINGS TARGET
6.4%RETURN ON AVERAGE SHAREHOLDERS’ EQUITYTARGET
Key Parameters
Average CPO price of RM2,650/MT
Subdued demand for engines from the oil & gas, marine and shipyard sectors
Weaker Ringgit Malaysia resulting in higher cost of imported inputs
Strict lending policies and cautious consumer sentiment
21
Sime Darby’s Pure Play StrategyC
1The Sime Darby journey
Our strengths & aspirations
Rationale for Pure Play strategy
The way forward
Transaction structure
2 3
4 5Proposed Internal Restructuring & Timeline
6
22
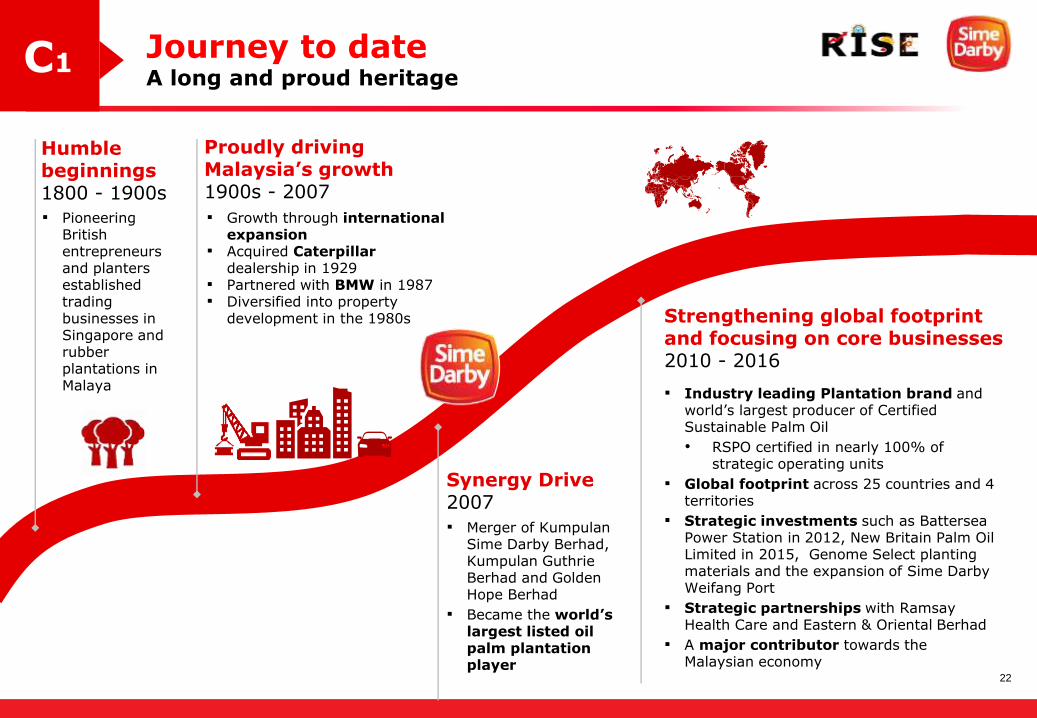
Journey to dateA long and proud heritage
Proudly driving Malaysia’s growth1900s - 2007
▪ Growth through international expansion
▪ Acquired Caterpillar dealership in 1929
▪ Partnered with BMW in 1987▪ Diversified into property
development in the 1980s
Humble beginnings1800 - 1900s
▪ Pioneering British entrepreneurs and planters established trading businesses in Singapore and rubber plantations in Malaya
Strengthening global footprint and focusing on core businesses2010 - 2016
▪ Industry leading Plantation brand and world’s largest producer of Certified Sustainable Palm Oil
• RSPO certified in nearly 100% of strategic operating units
▪ Global footprint across 25 countries and 4 territories
▪ Strategic investments such as Battersea Power Station in 2012, New Britain Palm Oil Limited in 2015, Genome Select planting materials and the expansion of Sime Darby Weifang Port
▪ Strategic partnerships with Ramsay Health Care and Eastern & Oriental Berhad
▪ A major contributor towards the Malaysian economy
Synergy Drive 2007
▪ Merger of Kumpulan Sime Darby Berhad, Kumpulan Guthrie Berhad and Golden Hope Berhad
▪ Became the world’s largest listed oil palm plantation player
C1
23
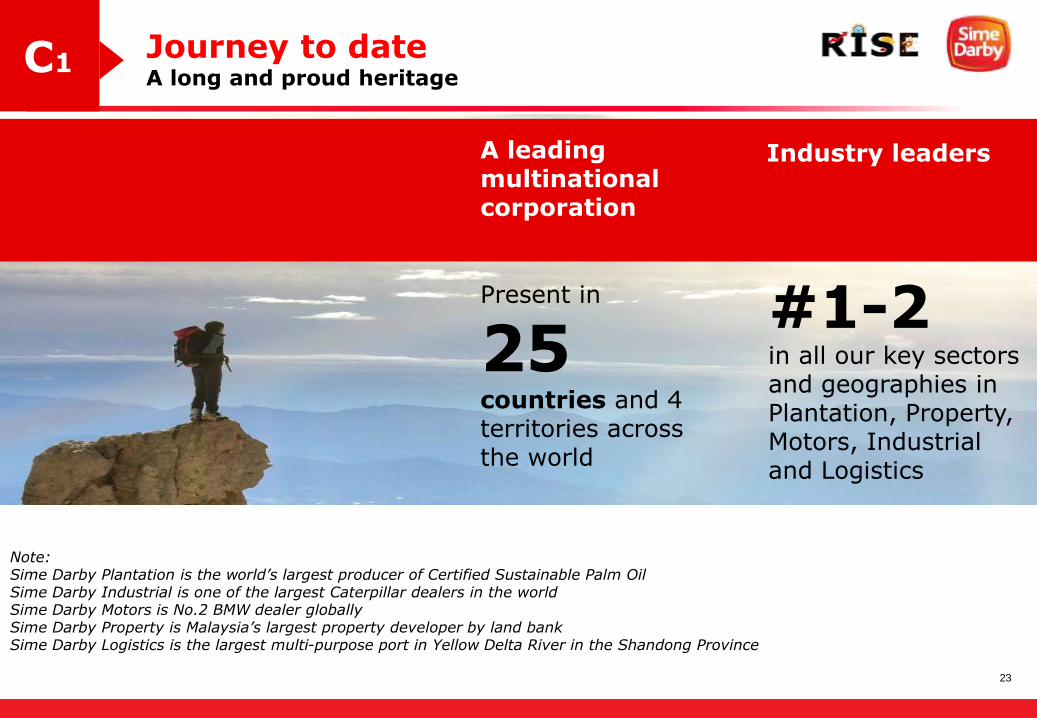
Present in
25countries and 4 territories acrossthe world
A leading multinational corporation
#1-2 in all our key sectors and geographies in Plantation, Property, Motors, Industrial and Logistics
Industry leaders
Note: Sime Darby Plantation is the world’s largest producer of Certified Sustainable Palm OilSime Darby Industrial is one of the largest Caterpillar dealers in the worldSime Darby Motors is No.2 BMW dealer globallySime Darby Property is Malaysia’s largest property developer by land bankSime Darby Logistics is the largest multi-purpose port in Yellow Delta River in the Shandong Province
Journey to dateA long and proud heritage
C1
24
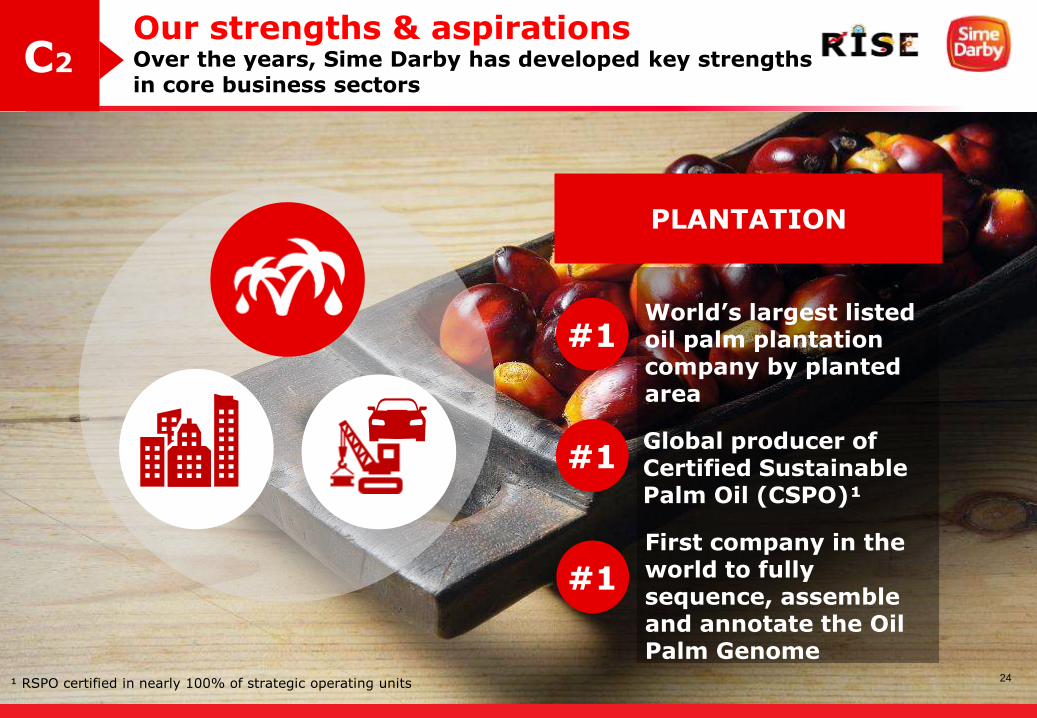
Our strengths & aspirationsOver the years, Sime Darby has developed key strengths in core business sectors
PLANTATION
#1
#1
#1
First company in the world to fully sequence, assemble and annotate the Oil Palm Genome
Global producer of Certified Sustainable Palm Oil (CSPO)¹
World’s largest listed oil palm plantation company by planted area
C2
24¹ RSPO certified in nearly 100% of strategic operating units
25
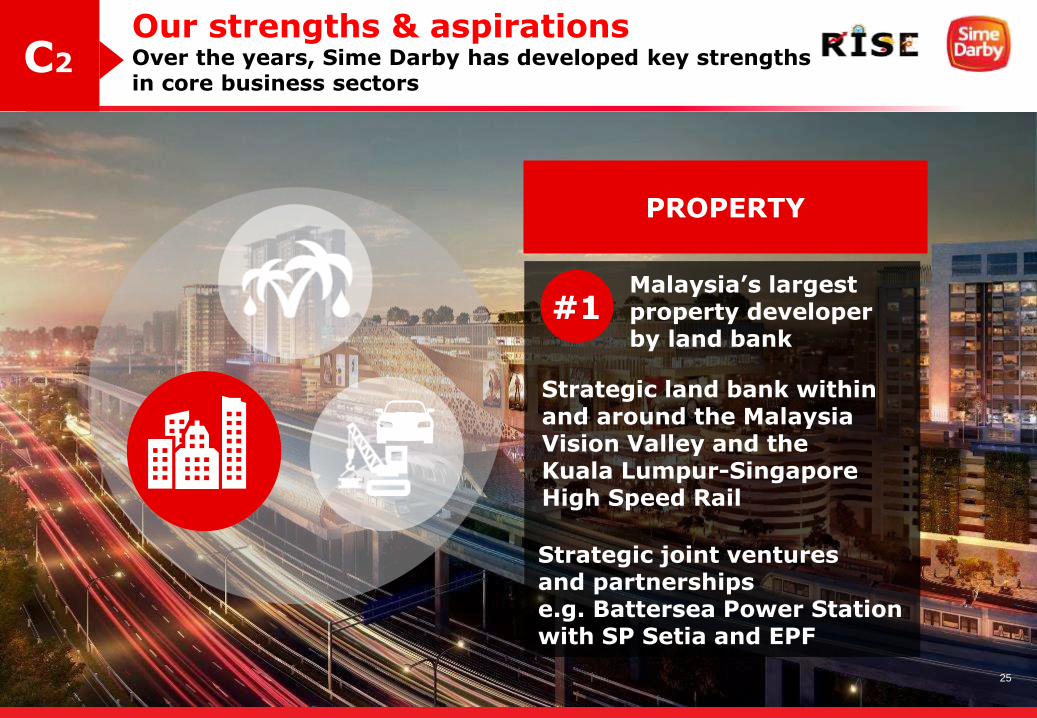
Our strengths & aspirationsOver the years, Sime Darby has developed key strengths in core business sectors
PROPERTY
#1
Strategic joint ventures and partnerships e.g. Battersea Power Station with SP Setia and EPF
Strategic land bank within and around the Malaysia Vision Valley and the Kuala Lumpur-Singapore High Speed Rail
Malaysia’s largest property developer by land bank
C2
25
26
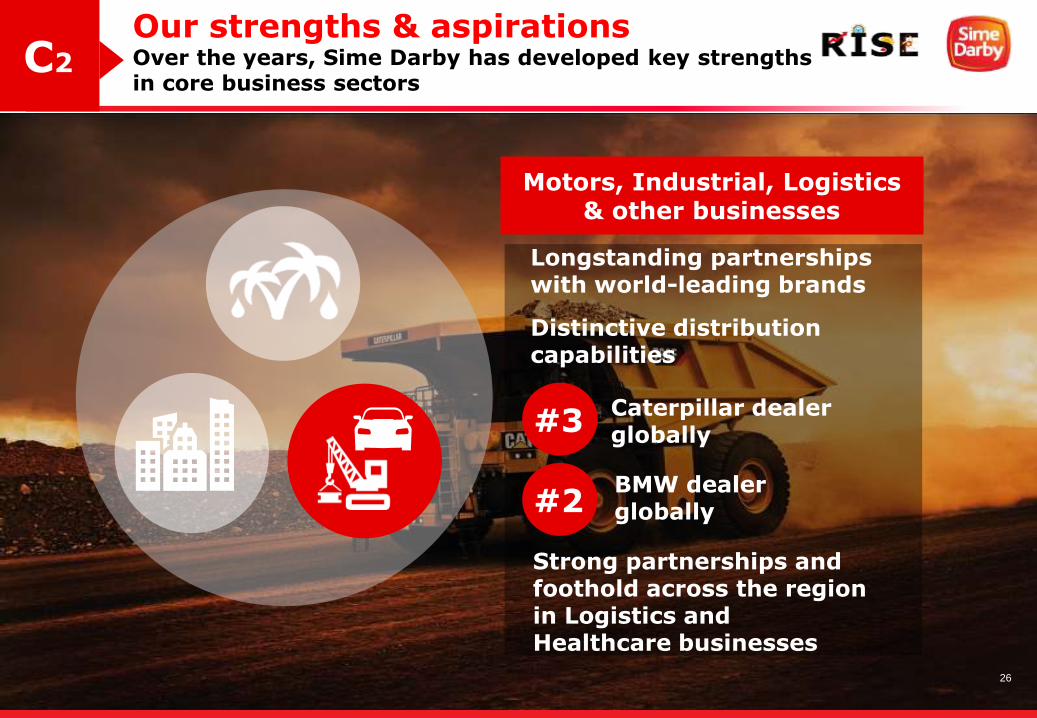
Our strengths & aspirationsOver the years, Sime Darby has developed key strengthsin core business sectors
Motors, Industrial, Logistics & other businesses
#3
Strong partnerships and foothold across the region in Logistics and Healthcare businesses
Longstanding partnerships with world-leading brands
Distinctive distribution capabilities
Caterpillar dealer globally
#2BMW dealer globally
C2
26
27
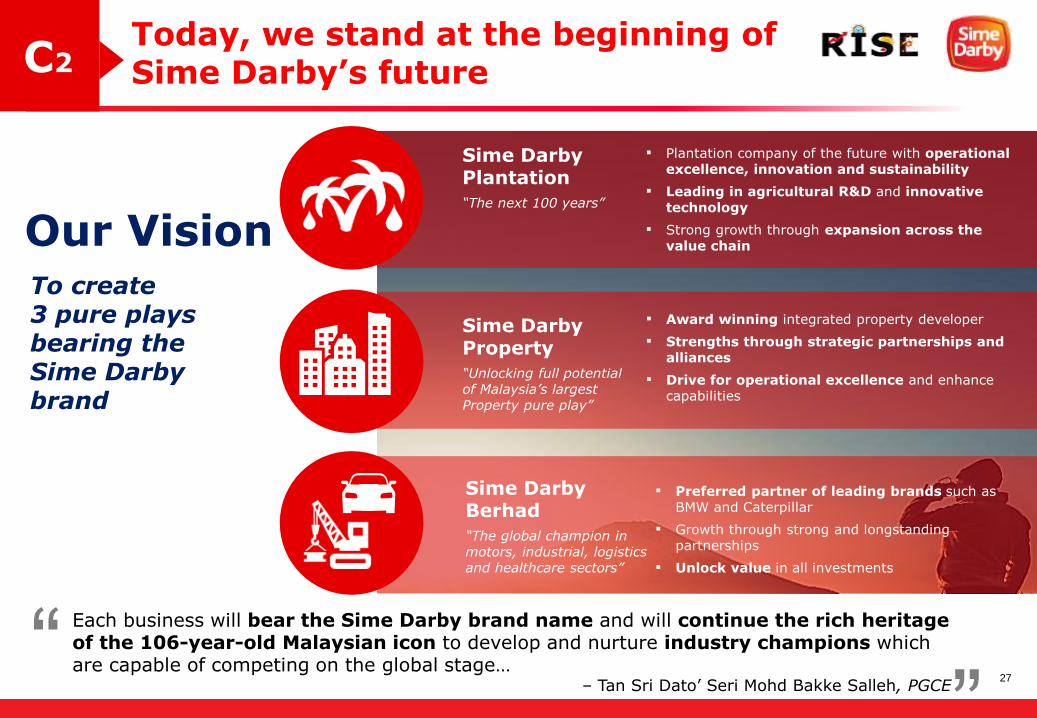
Each business will bear the Sime Darby brand name and will continue the rich heritage of the 106-year-old Malaysian icon to develop and nurture industry champions which are capable of competing on the global stage…
– Tan Sri Dato’ Seri Mohd Bakke Salleh, PGCE“
”
Our VisionTo create 3 pure plays bearing the Sime Darby brand
Sime Darby Plantation
“The next 100 years”
▪ Plantation company of the future with operational excellence, innovation and sustainability
▪ Leading in agricultural R&D and innovative technology
▪ Strong growth through expansion across the value chain
Sime Darby Property
“Unlocking full potential of Malaysia’s largest Property pure play”
▪ Award winning integrated property developer
▪ Strengths through strategic partnerships and alliances
▪ Drive for operational excellence and enhance capabilities
Sime Darby Berhad
“The global champion in motors, industrial, logistics and healthcare sectors”
▪ Preferred partner of leading brands such as BMW and Caterpillar
▪ Growth through strong and longstanding partnerships
▪ Unlock value in all investments
Today, we stand at the beginning of Sime Darby’s futureC2
27
28
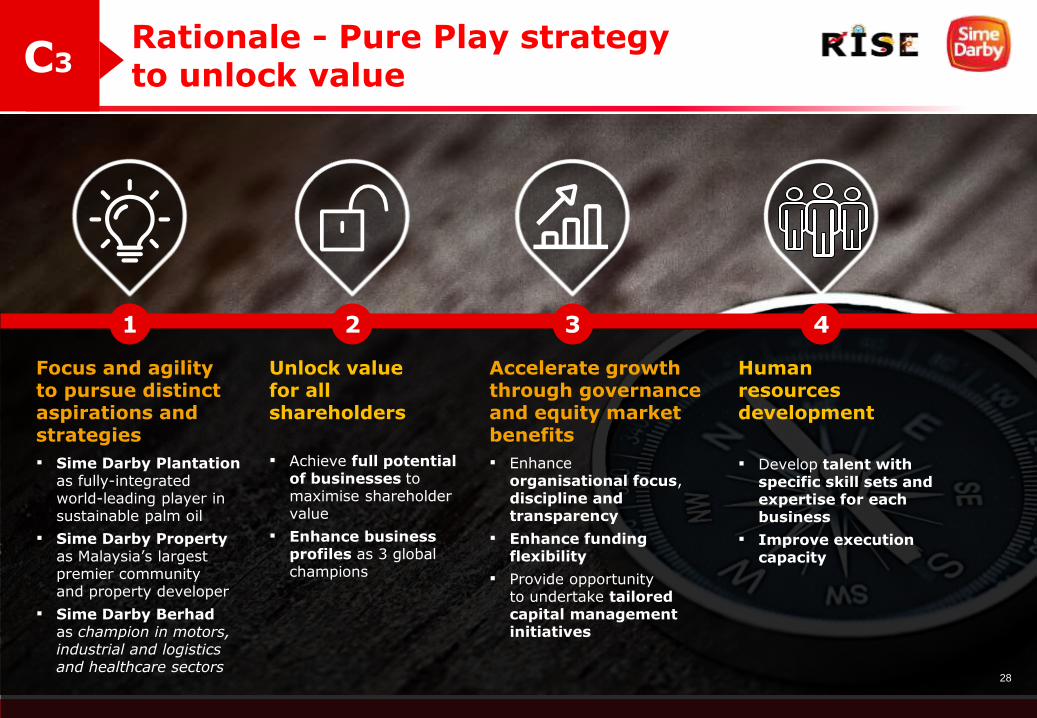
Rationale - Pure Play strategyto unlock value
Unlock value for all shareholders
2
▪ Achieve full potential of businesses to maximise shareholder value
▪ Enhance business profiles as 3 global champions
Focus and agility to pursue distinct aspirations and strategies
1
▪ Sime Darby Plantation as fully-integrated world-leading player in sustainable palm oil
▪ Sime Darby Property as Malaysia’s largest premier community and property developer
▪ Sime Darby Berhadas champion in motors, industrial and logistics and healthcare sectors
Accelerate growth through governance and equity market benefits
3
▪ Enhance organisational focus, discipline and transparency
▪ Enhance funding flexibility
▪ Provide opportunity to undertake tailored capital management initiatives
Human resources development
4
▪ Develop talent with specific skill sets and expertise for each business
▪ Improve execution capacity
C3
28
29
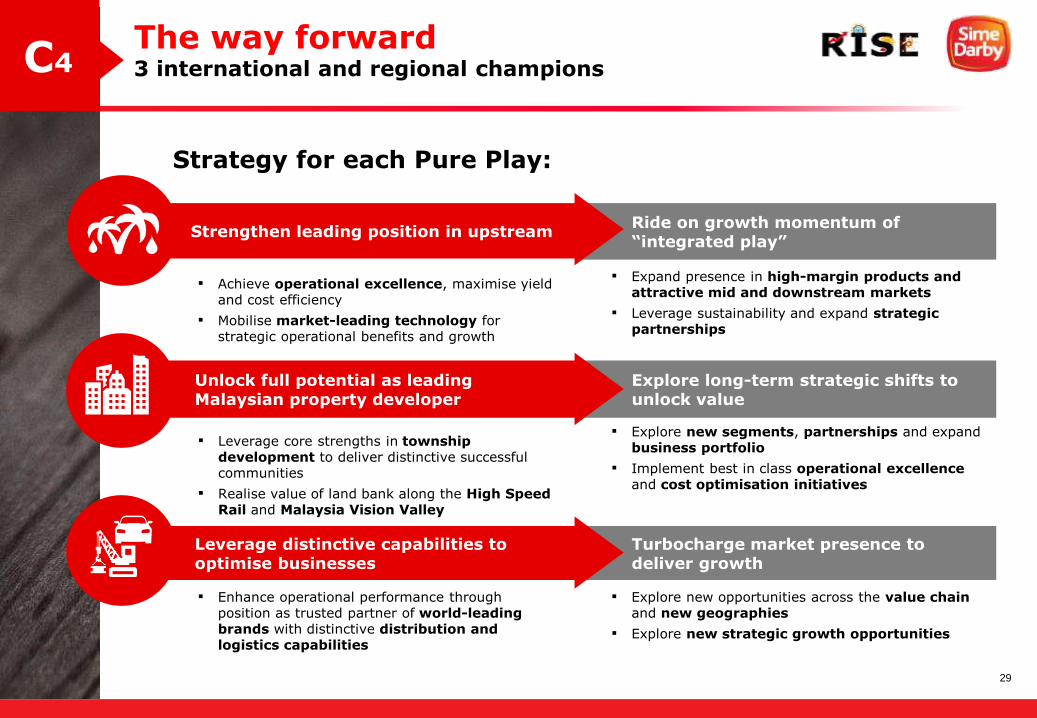
The way forward3 international and regional champions
▪ Achieve operational excellence, maximise yield and cost efficiency
▪ Mobilise market-leading technology for strategic operational benefits and growth
Ride on growth momentum of “integrated play”
▪ Expand presence in high-margin products and attractive mid and downstream markets
▪ Leverage sustainability and expand strategic partnerships
Strengthen leading position in upstream
Turbocharge market presence to deliver growth
▪ Enhance operational performance through position as trusted partner of world-leading brands with distinctive distribution and logistics capabilities
▪ Explore new opportunities across the value chain and new geographies
▪ Explore new strategic growth opportunities
Leverage distinctive capabilities to optimise businesses
Explore long-term strategic shifts to unlock value
▪ Explore new segments, partnerships and expand business portfolio
▪ Implement best in class operational excellence and cost optimisation initiatives
▪ Leverage core strengths in township development to deliver distinctive successful communities
▪ Realise value of land bank along the High Speed Rail and Malaysia Vision Valley
Unlock full potential as leading Malaysian property developer
C4
Strategy for each Pure Play:
30
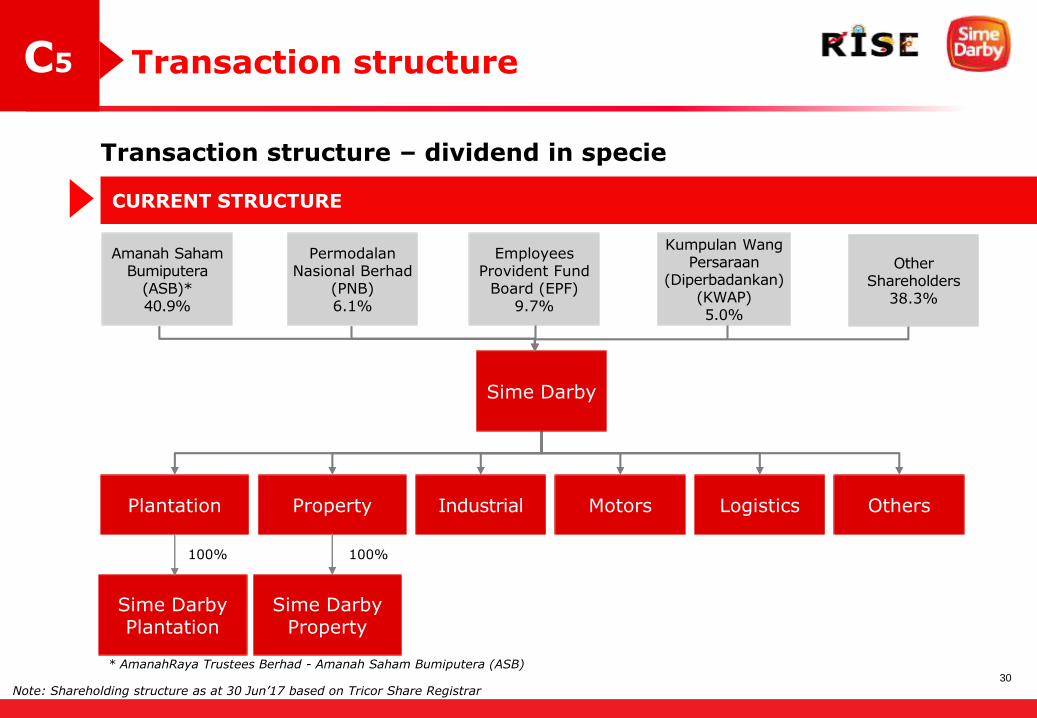
Transaction structure
Plantation Property
Transaction structure – dividend in specie
PermodalanNasional Berhad
(PNB)6.1%
Amanah SahamBumiputera
(ASB)* 40.9%
Other Shareholders
38.3%
Sime Darby
Industrial Motors Logistics Others
CURRENT STRUCTURE
Sime Darby Plantation
Sime Darby Property
100%100%
* AmanahRaya Trustees Berhad - Amanah Saham Bumiputera (ASB)
C5
Employees Provident Fund
Board (EPF)9.7%
Kumpulan Wang Persaraan
(Diperbadankan) (KWAP)5.0%
Note: Shareholding structure as at 30 Jun’17 based on Tricor Share Registrar
31
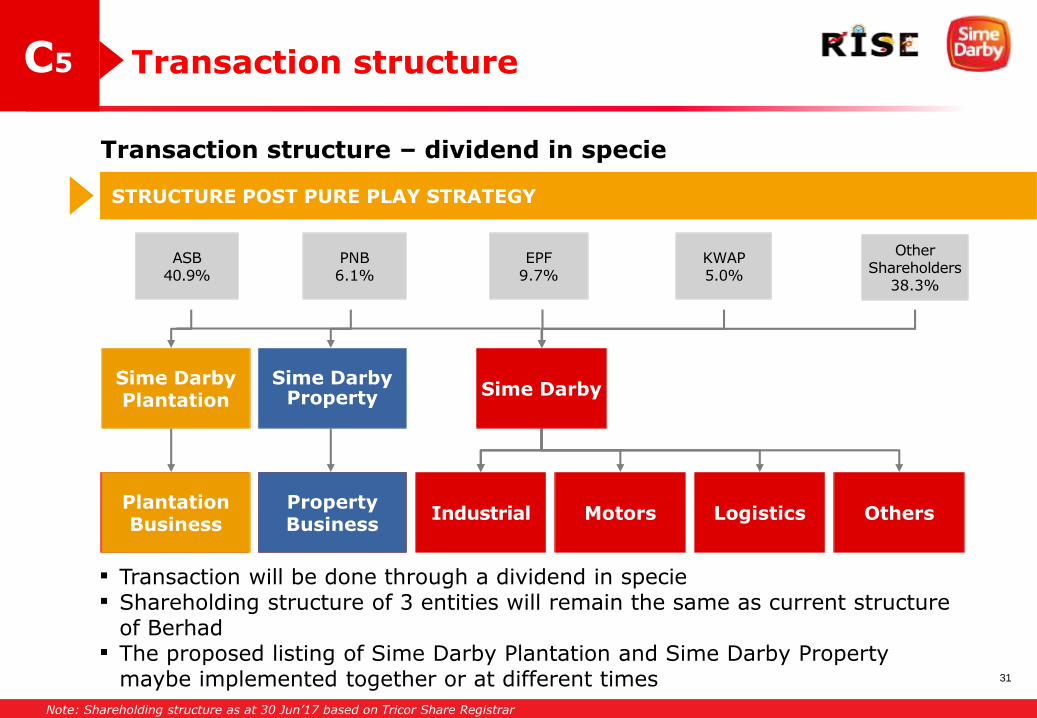
▪ Transaction will be done through a dividend in specie▪ Shareholding structure of 3 entities will remain the same as current structure
of Berhad▪ The proposed listing of Sime Darby Plantation and Sime Darby Property
maybe implemented together or at different times
Plantation(100%)
Property(100%)
Sime DarbyProperty
Sime DarbyPlantation
Transaction structure
Transaction structure – dividend in specie
Sime Darby
Industrial Motors Logistics OthersPlantation Business
Property Business
STRUCTURE POST PURE PLAY STRATEGY
C5
PNB6.1%
ASB40.9%
Other Shareholders
38.3%
EPF9.7%
KWAP5.0%
Note: Shareholding structure as at 30 Jun’17 based on Tricor Share Registrar
32
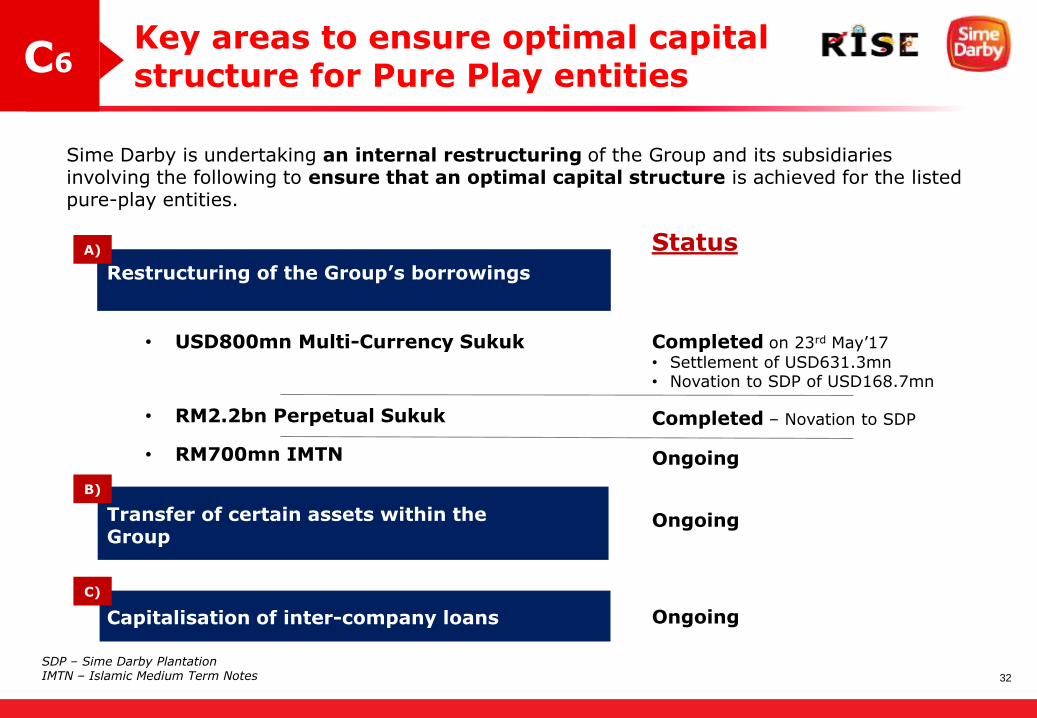
C6Key areas to ensure optimal capitalstructure for Pure Play entities
Ongoing
Restructuring of the Group’s borrowings
Transfer of certain assets within the Group
Capitalisation of inter-company loans Ongoing
Status
• USD800mn Multi-Currency Sukuk
• RM2.2bn Perpetual Sukuk
• RM700mn IMTN
Sime Darby is undertaking an internal restructuring of the Group and its subsidiaries involving the following to ensure that an optimal capital structure is achieved for the listed pure-play entities.
A)
B)
C)
Completed on 23rd May’17
• Settlement of USD631.3mn• Novation to SDP of USD168.7mn
Completed – Novation to SDP
Ongoing
SDP – Sime Darby PlantationIMTN – Islamic Medium Term Notes
33
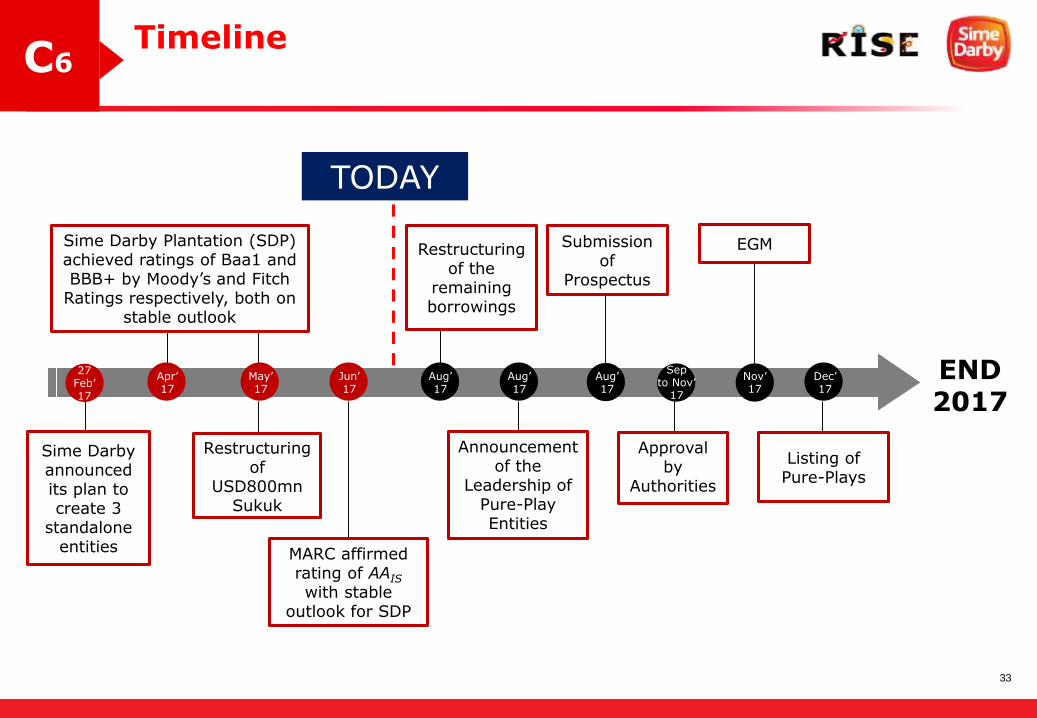
C6Timeline
END 2017
Announcement of the
Leadership of Pure-Play Entities
Restructuring of
USD800mn Sukuk
Restructuring of the
remaining borrowings
Submission of
Prospectus
Approval by
Authorities
Listing of Pure-Plays
TODAY
Sime Darby announced its plan to create 3
standalone entities MARC affirmed
rating of AAIS
with stable outlook for SDP
EGM
27Feb’17
Apr’17
May’17
Sime Darby Plantation (SDP) achieved ratings of Baa1 and BBB+ by Moody’s and Fitch
Ratings respectively, both on stable outlook
Jun’17
Aug’17
Dec’17
Nov’17
Aug’17
Septo Nov’
17
Aug’17
34
APPENDICES
1. Group
2. Plantation
3. Property
4. Motors
5. Industrial
6. Logistics
35
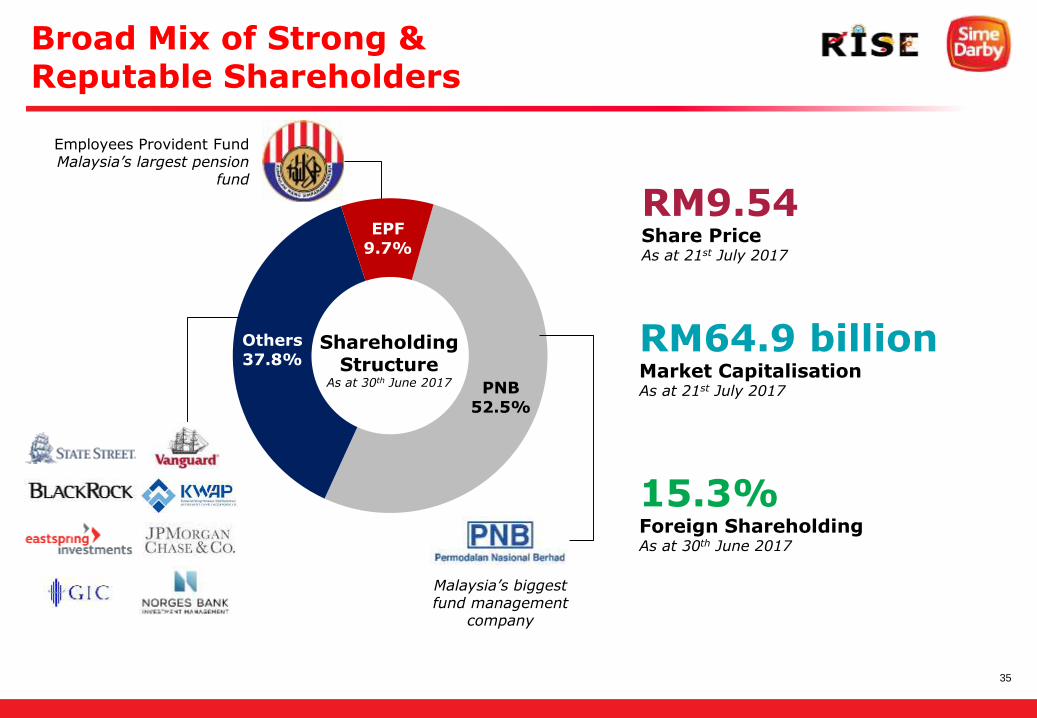
Broad Mix of Strong & Reputable Shareholders
PNB52.5%
Others37.8%
EPF9.7%
Malaysia’s biggest fund management
company
Employees Provident FundMalaysia’s largest pension
fund
ShareholdingStructure
As at 30th June 2017
RM64.9 billion Market CapitalisationAs at 21st July 2017
15.3%Foreign ShareholdingAs at 30th June 2017
RM9.54Share PriceAs at 21st July 2017
36
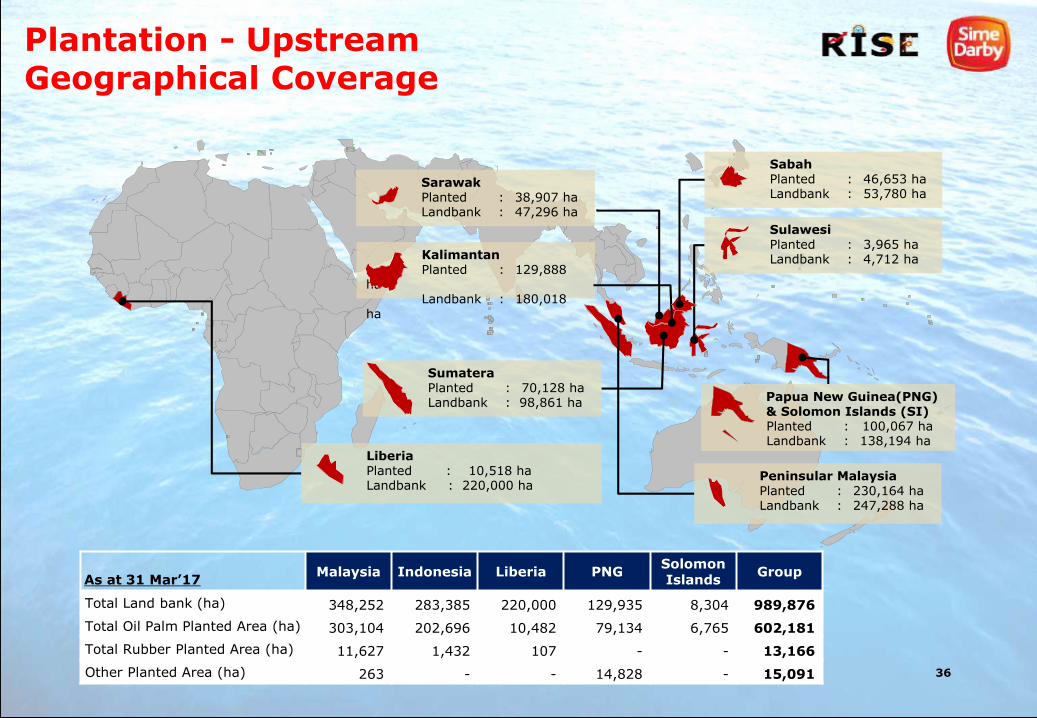
KalimantanPlanted : 129,888
haLandbank : 180,018
ha
SarawakPlanted : 38,907 haLandbank : 47,296 ha
SulawesiPlanted : 3,965 haLandbank : 4,712 ha
SabahPlanted : 46,653 haLandbank : 53,780 ha
Peninsular MalaysiaPlanted : 230,164 haLandbank : 247,288 ha
SumateraPlanted : 70,128 haLandbank : 98,861 ha
LiberiaPlanted : 10,518 haLandbank : 220,000 ha
36
Papua New Guinea(PNG) & Solomon Islands (SI)Planted : 100,067 haLandbank : 138,194 ha
Plantation - Upstream Geographical Coverage
As at 31 Mar’17Malaysia Indonesia Liberia PNG
Solomon Islands
Group
Total Land bank (ha) 348,252 283,385 220,000 129,935 8,304 989,876
Total Oil Palm Planted Area (ha) 303,104 202,696 10,482 79,134 6,765 602,181
Total Rubber Planted Area (ha) 11,627 1,432 107 - - 13,166
Other Planted Area (ha) 263 - - 14,828 - 15,091
37
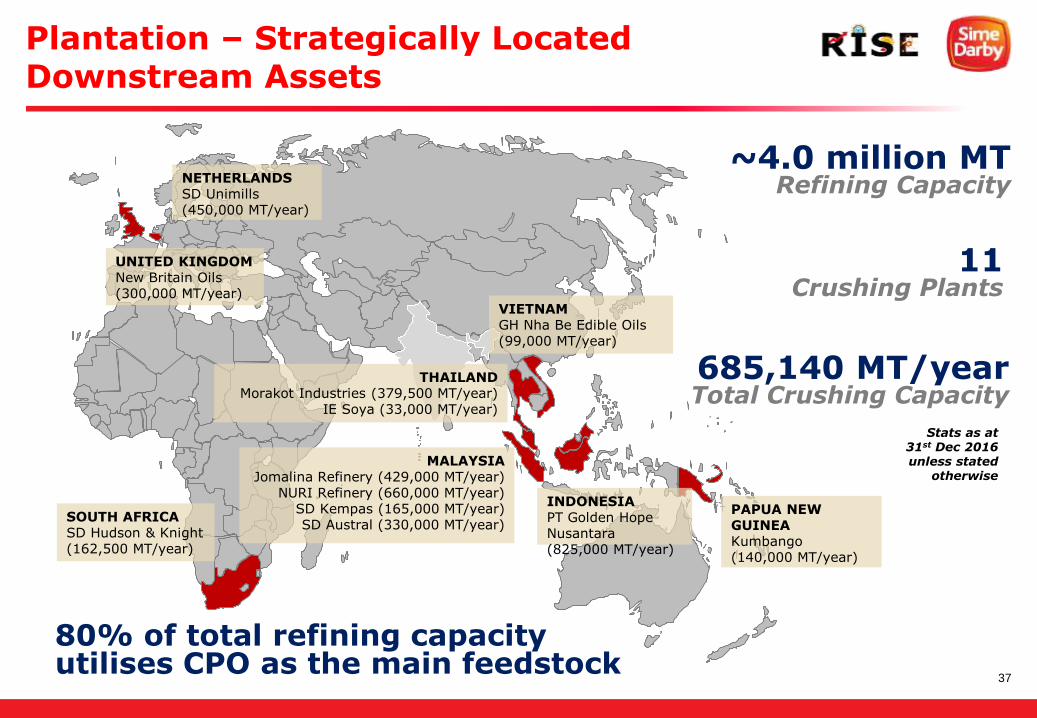
Plantation – Strategically Located Downstream Assets
UNITED KINGDOMNew Britain Oils (300,000 MT/year)
NETHERLANDSSD Unimills(450,000 MT/year)
SOUTH AFRICASD Hudson & Knight (162,500 MT/year)
VIETNAMGH Nha Be Edible Oils (99,000 MT/year)
THAILANDMorakot Industries (379,500 MT/year)
IE Soya (33,000 MT/year)
MALAYSIAJomalina Refinery (429,000 MT/year)
NURI Refinery (660,000 MT/year)SD Kempas (165,000 MT/year)SD Austral (330,000 MT/year)
INDONESIAPT Golden Hope Nusantara (825,000 MT/year)
PAPUA NEW GUINEAKumbango(140,000 MT/year)
11Crushing Plants
~4.0 million MTRefining Capacity
685,140 MT/yearTotal Crushing Capacity
80% of total refining capacity utilises CPO as the main feedstock
Stats as at 31st Dec 2016 unless stated
otherwise
38
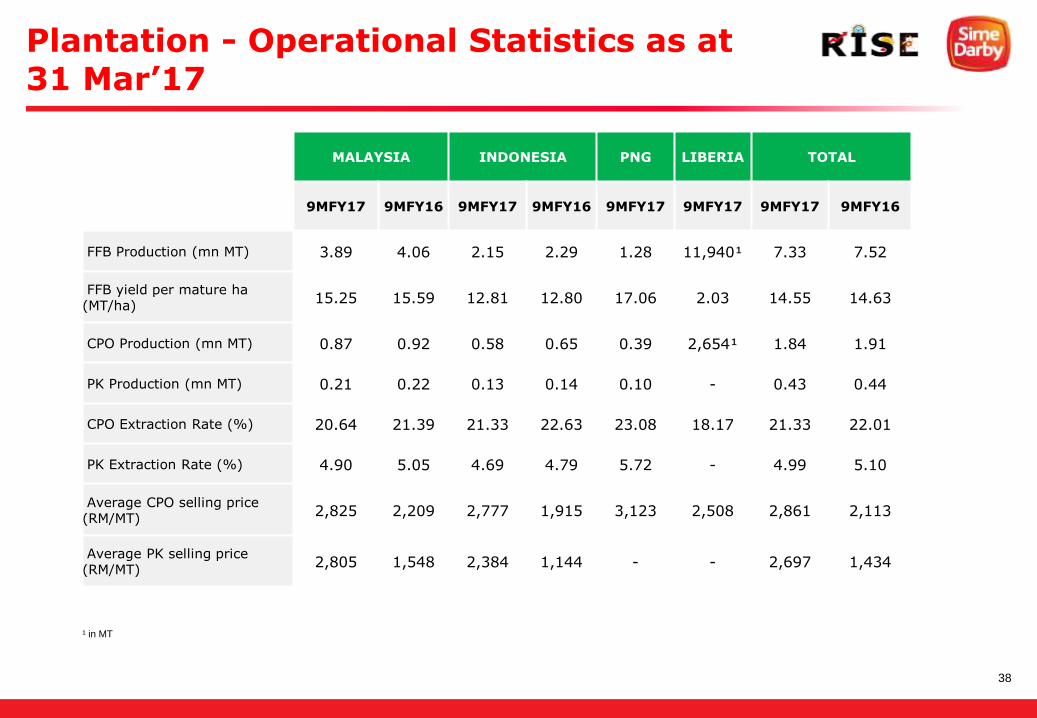
Plantation - Operational Statistics as at 31 Mar’17
MALAYSIA INDONESIA PNG LIBERIA TOTAL
9MFY17 9MFY16 9MFY17 9MFY16 9MFY17 9MFY17 9MFY17 9MFY16
FFB Production (mn MT) 3.89 4.06 2.15 2.29 1.28 11,940¹ 7.33 7.52
FFB yield per mature ha (MT/ha)
15.25 15.59 12.81 12.80 17.06 2.03 14.55 14.63
CPO Production (mn MT) 0.87 0.92 0.58 0.65 0.39 2,654¹ 1.84 1.91
PK Production (mn MT) 0.21 0.22 0.13 0.14 0.10 - 0.43 0.44
CPO Extraction Rate (%) 20.64 21.39 21.33 22.63 23.08 18.17 21.33 22.01
PK Extraction Rate (%) 4.90 5.05 4.69 4.79 5.72 - 4.99 5.10
Average CPO selling price (RM/MT)
2,825 2,209 2,777 1,915 3,123 2,508 2,861 2,113
Average PK selling price (RM/MT)
2,805 1,548 2,384 1,144 - - 2,697 1,434
¹ in MT
39
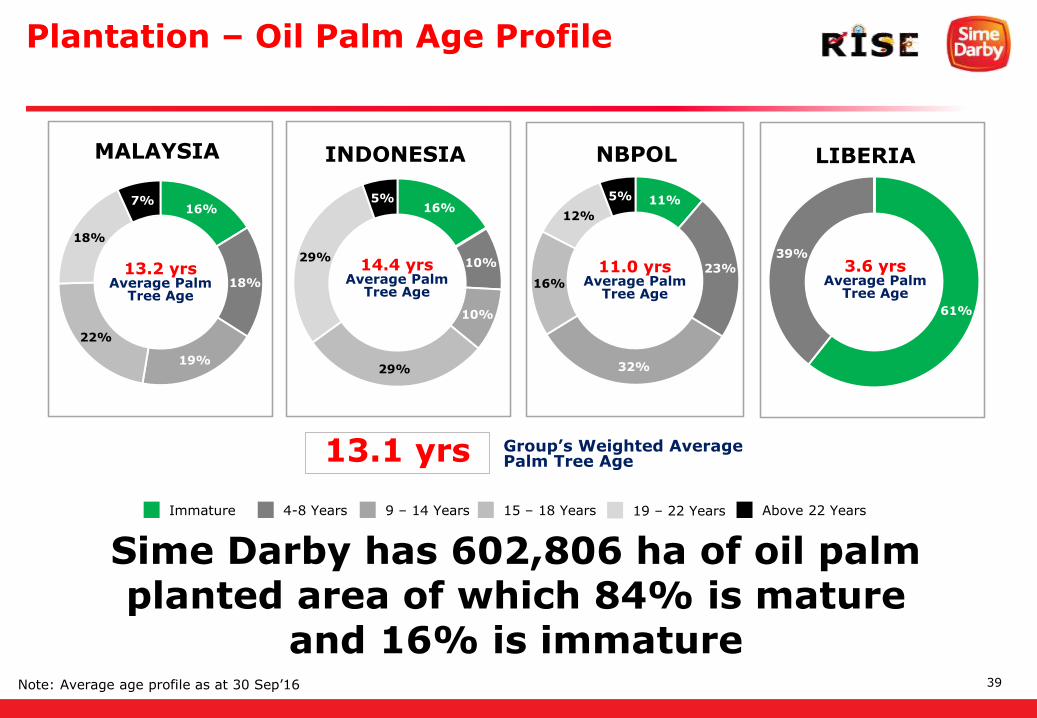
61%
39%
16%
10%
10%
29%
29%
5%16%
18%
19%
22%
18%
7%
MALAYSIA INDONESIA LIBERIA
Immature 4-8 Years 9 – 14 Years 15 – 18 Years 19 – 22 Years Above 22 Years
Sime Darby has 602,806 ha of oil palm planted area of which 84% is mature
and 16% is immature
13.2 yrsAverage Palm
Tree Age
14.4 yrsAverage Palm
Tree Age
3.6 yrsAverage Palm
Tree Age
13.1 yrs Group’s Weighted Average Palm Tree Age
Plantation – Oil Palm Age Profile
11%
23%
32%
16%
12%
5%
NBPOL
11.0 yrsAverage Palm
Tree Age
Note: Average age profile as at 30 Sep’16
40
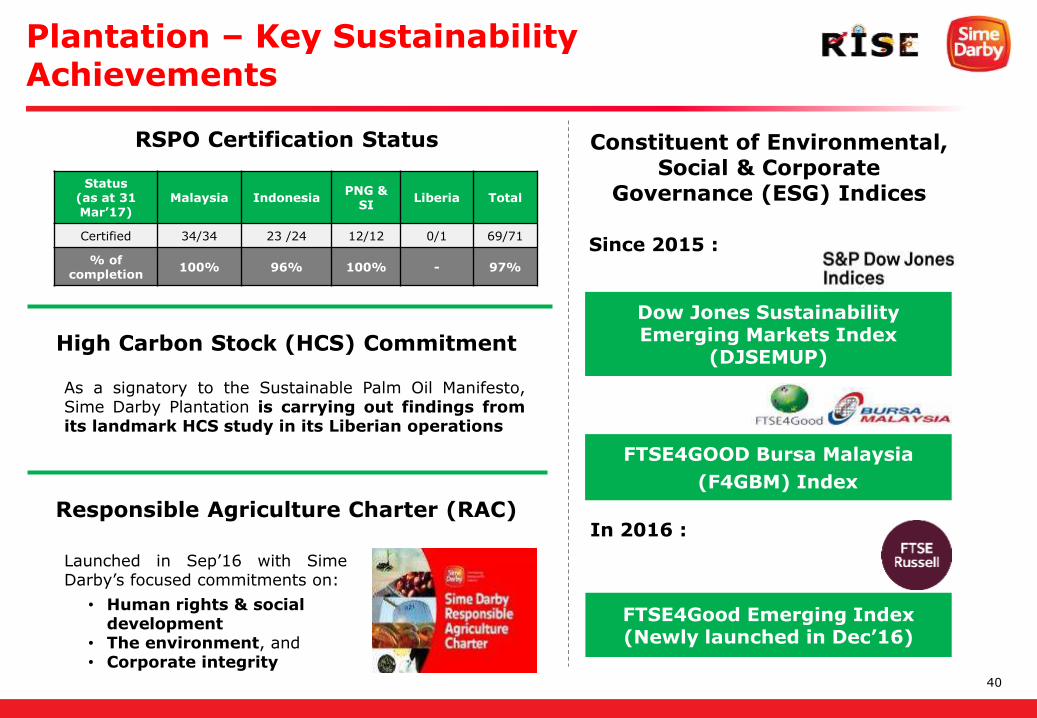
As a signatory to the Sustainable Palm Oil Manifesto,Sime Darby Plantation is carrying out findings fromits landmark HCS study in its Liberian operations
RSPO Certification Status
Status (as at 31 Mar’17)
Malaysia Indonesia PNG &
SILiberia Total
Certified 34/34 23 /24 12/12 0/1 69/71
% of completion
100% 96% 100% - 97%
High Carbon Stock (HCS) Commitment
Responsible Agriculture Charter (RAC)
Launched in Sep’16 with SimeDarby’s focused commitments on:
• Human rights & social development
• The environment, and• Corporate integrity
Constituent of Environmental, Social & Corporate
Governance (ESG) Indices
Dow Jones Sustainability Emerging Markets Index
(DJSEMUP)
FTSE4GOOD Bursa Malaysia
(F4GBM) Index
FTSE4Good Emerging Index(Newly launched in Dec’16)
Since 2015 :
In 2016 :
Plantation – Key Sustainability Achievements
41
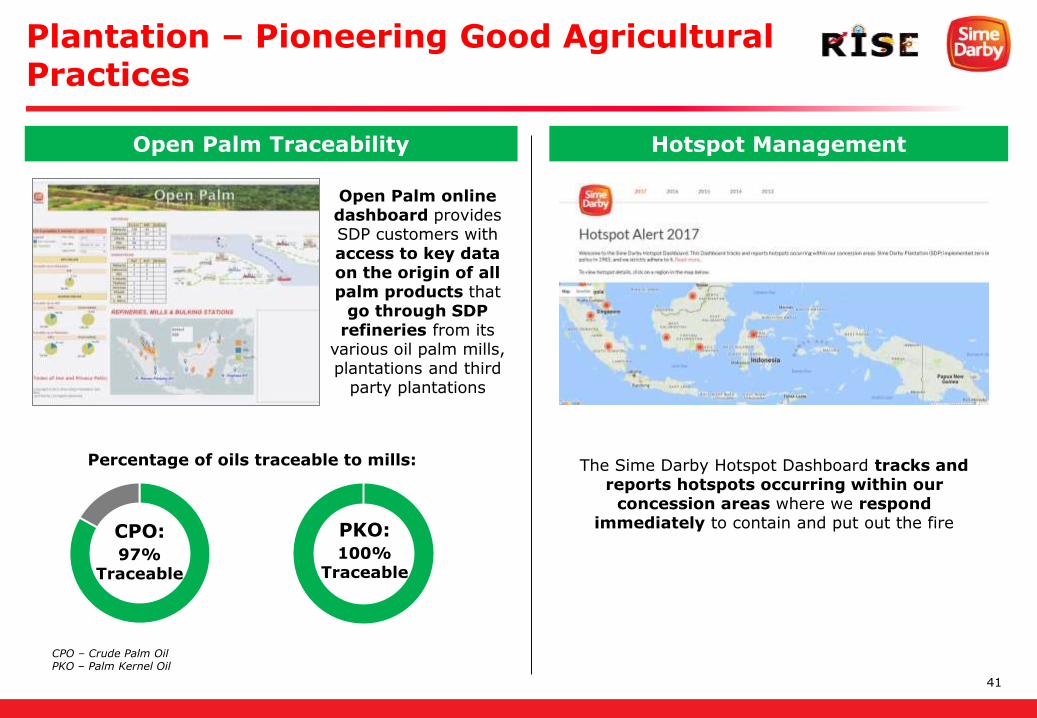
The Sime Darby Hotspot Dashboard tracks and reports hotspots occurring within our
concession areas where we respond immediately to contain and put out the fire
Open Palm online dashboard provides SDP customers with access to key data on the origin of all palm products that
go through SDP refineries from its
various oil palm mills, plantations and third
party plantations
CPO:97%
Traceable
PKO:100%
Traceable
Percentage of oils traceable to mills:
Open Palm Traceability Hotspot Management
CPO – Crude Palm OilPKO – Palm Kernel Oil
Plantation – Pioneering Good Agricultural Practices
42
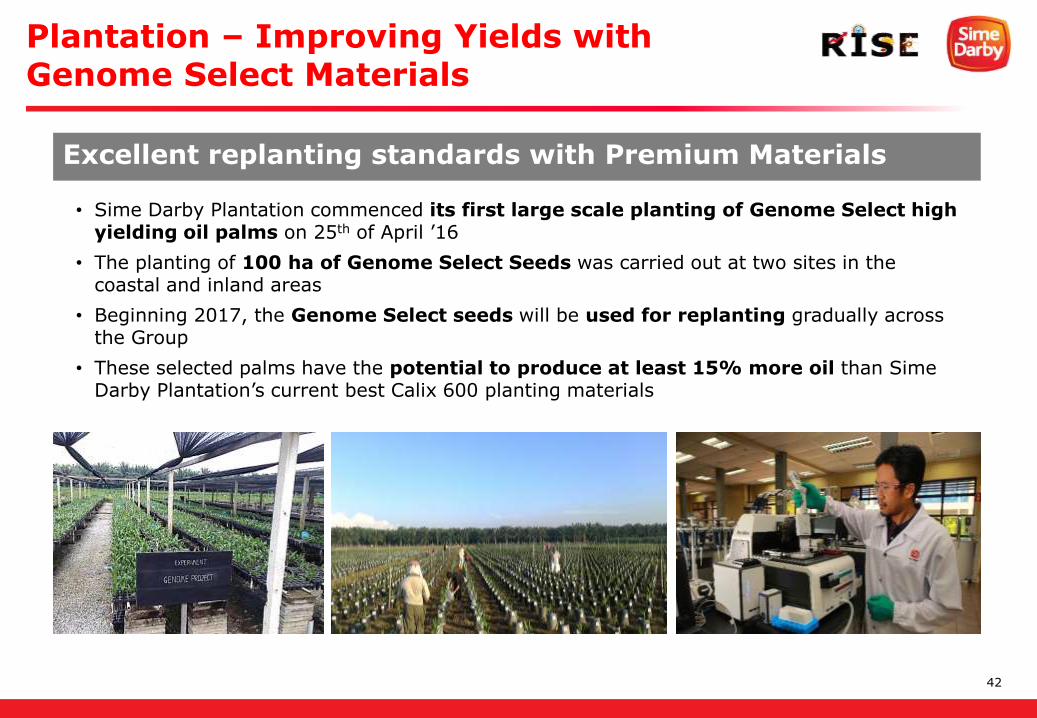
Plantation – Improving Yields with Genome Select Materials
Excellent replanting standards with Premium Materials
• Sime Darby Plantation commenced its first large scale planting of Genome Select high yielding oil palms on 25th of April ’16
• The planting of 100 ha of Genome Select Seeds was carried out at two sites in the coastal and inland areas
• Beginning 2017, the Genome Select seeds will be used for replanting gradually across the Group
• These selected palms have the potential to produce at least 15% more oil than Sime Darby Plantation’s current best Calix 600 planting materials
43
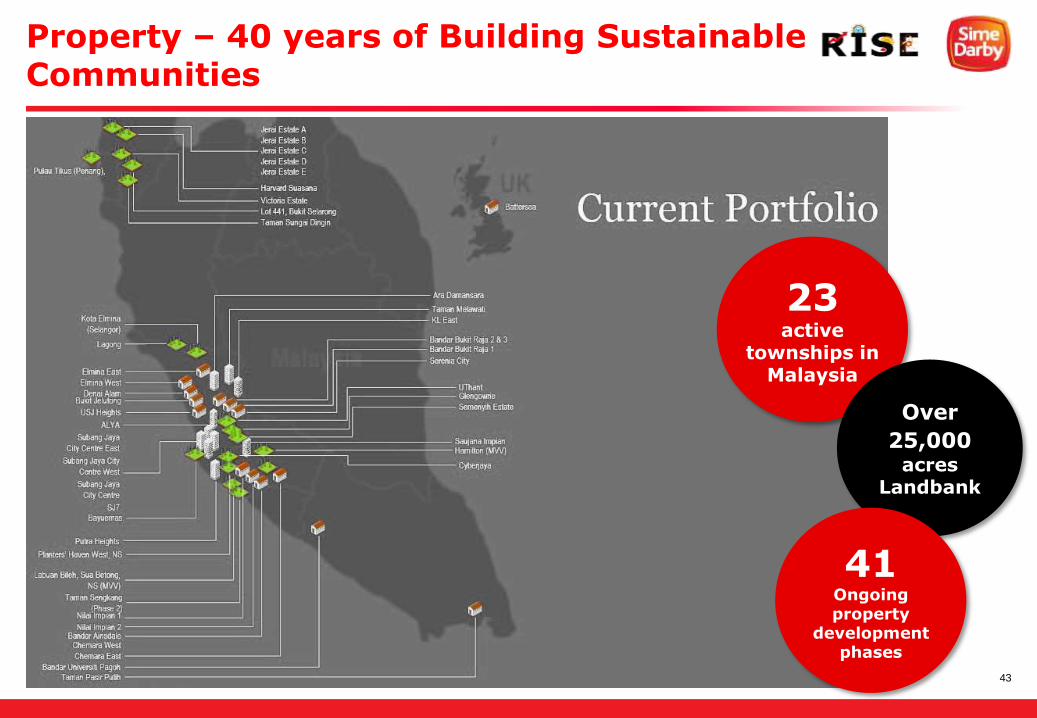
Property – 40 years of Building Sustainable Communities
23active
townships in Malaysia
Over
25,000acres
Landbank
41Ongoing property
development phases
44
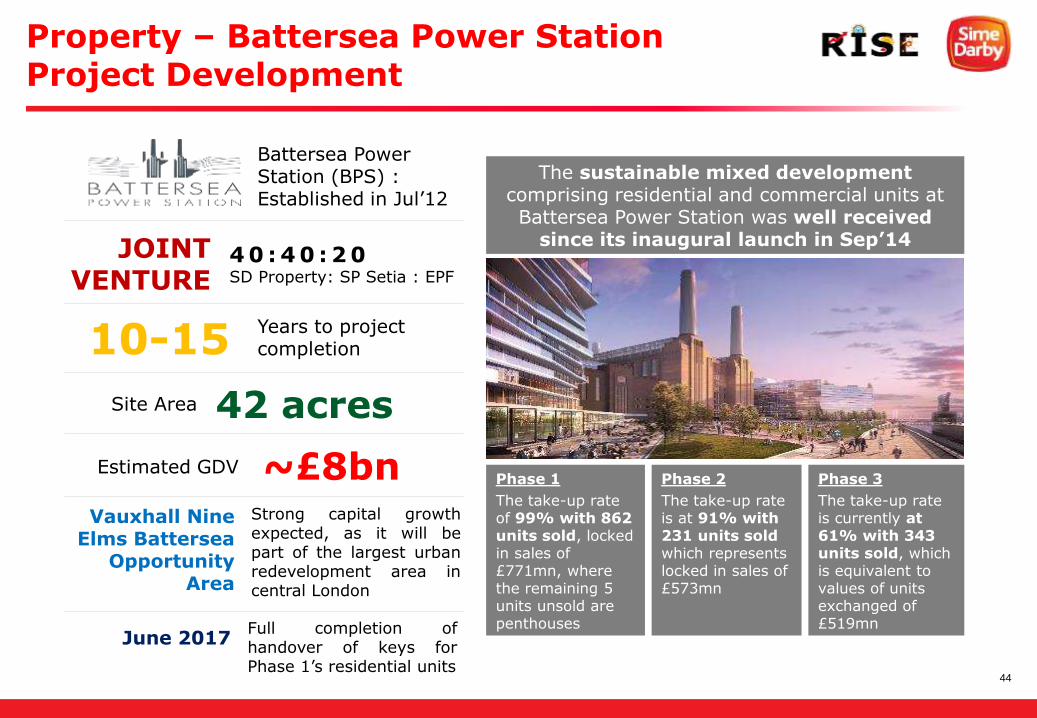
Battersea Power Station (BPS) : Established in Jul’12
JOINT VENTURE
4 0 : 4 0 : 2 0SD Property: SP Setia : EPF
10-15Years to project completion
42 acresSite Area
~£8bnEstimated GDV
Vauxhall Nine Elms Battersea
Opportunity Area
Strong capital growthexpected, as it will bepart of the largest urbanredevelopment area incentral London
Phase 1
The take-up rate of 99% with 862 units sold, locked in sales of £771mn, where the remaining 5 units unsold are penthouses
The sustainable mixed development comprising residential and commercial units at Battersea Power Station was well received
since its inaugural launch in Sep’14
Phase 2
The take-up rate is at 91% with 231 units soldwhich represents locked in sales of £573mn
Phase 3
The take-up rate is currently at 61% with 343 units sold, which is equivalent to values of units exchanged of £519mn
June 2017Full completion ofhandover of keys forPhase 1’s residential units
Property – Battersea Power Station Project Development
45
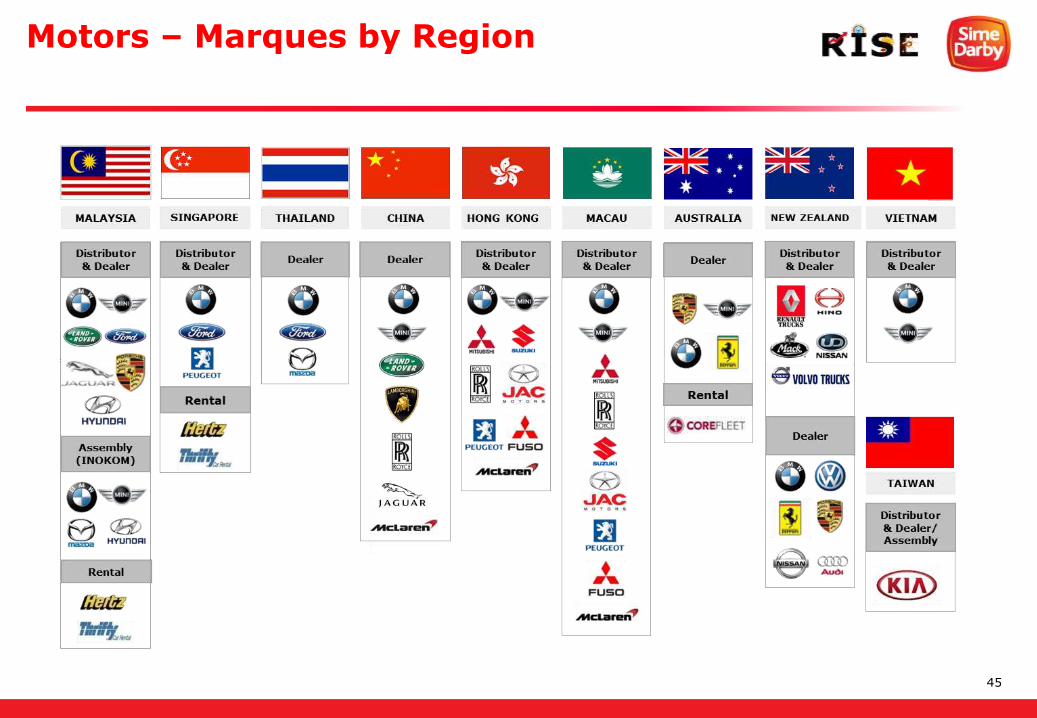
Motors – Marques by Region
46
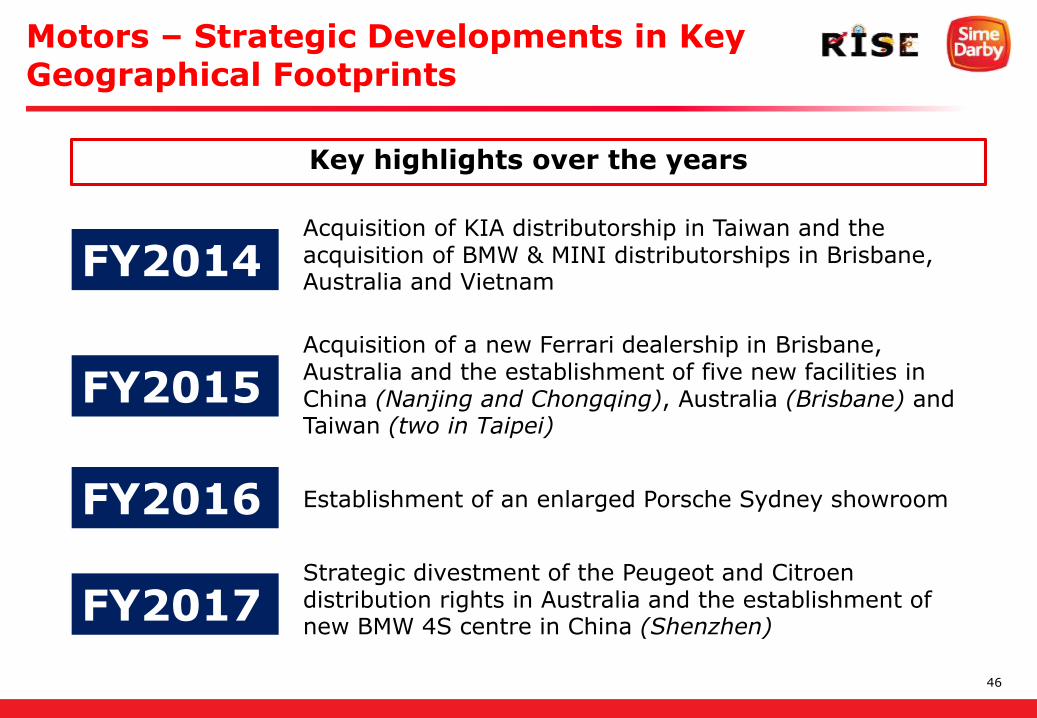
Key highlights over the years
Motors – Strategic Developments in Key Geographical Footprints
Acquisition of a new Ferrari dealership in Brisbane, Australia and the establishment of five new facilities in China (Nanjing and Chongqing), Australia (Brisbane) and Taiwan (two in Taipei)
Acquisition of KIA distributorship in Taiwan and the acquisition of BMW & MINI distributorships in Brisbane, Australia and Vietnam
Establishment of an enlarged Porsche Sydney showroom
Strategic divestment of the Peugeot and Citroen distribution rights in Australia and the establishment of new BMW 4S centre in China (Shenzhen)
FY2014
FY2015
FY2016
FY2017
47
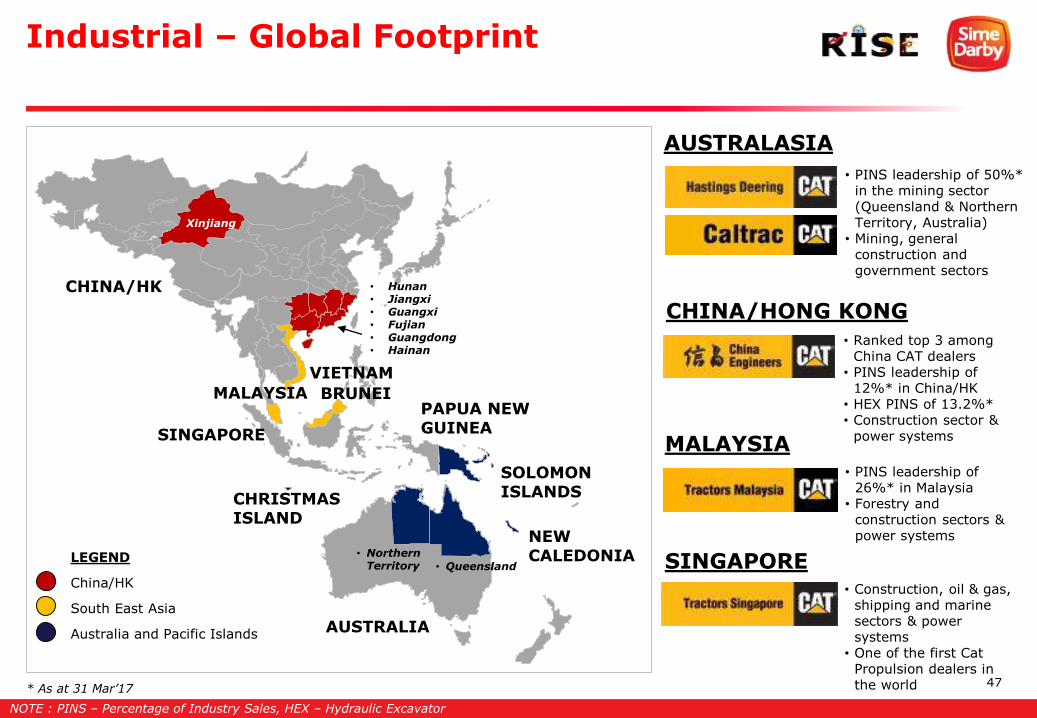
Industrial – Global Footprint
LEGEND
China/HK
South East Asia
Australia and Pacific Islands
CHINA/HK
VIETNAM
MALAYSIA BRUNEI
SINGAPORE
AUSTRALIA
PAPUA NEW GUINEA
SOLOMON ISLANDS
NEW CALEDONIA
CHRISTMAS ISLAND
AUSTRALASIA
CHINA/HONG KONG
MALAYSIA
SINGAPORE
• PINS leadership of 50%* in the mining sector (Queensland & Northern Territory, Australia)
• Mining, general construction and government sectors
• Ranked top 3 among China CAT dealers
• PINS leadership of 12%* in China/HK
• HEX PINS of 13.2%*• Construction sector &
power systems
• PINS leadership of 26%* in Malaysia
• Forestry and construction sectors & power systems
• Construction, oil & gas, shipping and marine sectors & power systems
• One of the first Cat Propulsion dealers in the world * As at 31 Mar’17
NOTE : PINS – Percentage of Industry Sales, HEX – Hydraulic Excavator
Xinjiang
• Northern Territory • Queensland
• Hunan• Jiangxi• Guangxi• Fujian• Guangdong• Hainan
48
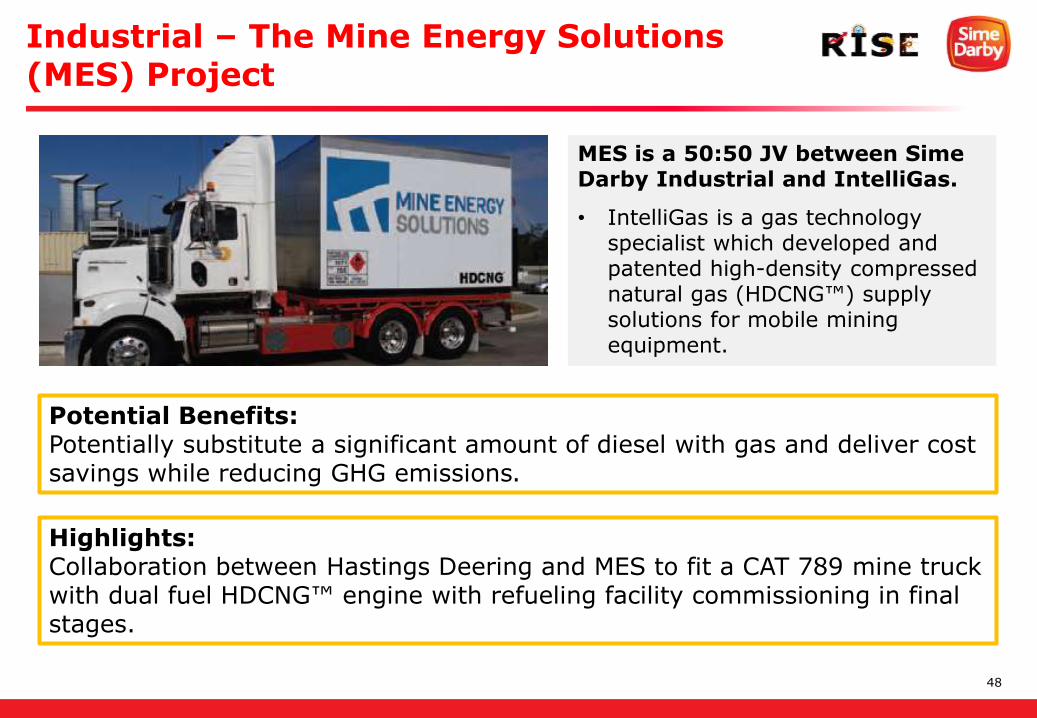
Industrial – The Mine Energy Solutions (MES) Project
MES is a 50:50 JV between Sime Darby Industrial and IntelliGas.
• IntelliGas is a gas technology specialist which developed and patented high-density compressed natural gas (HDCNG™) supply solutions for mobile mining equipment.
Potential Benefits:Potentially substitute a significant amount of diesel with gas and deliver cost savings while reducing GHG emissions.
Highlights:Collaboration between Hastings Deering and MES to fit a CAT 789 mine truck with dual fuel HDCNG™ engine with refueling facility commissioning in final stages.
49
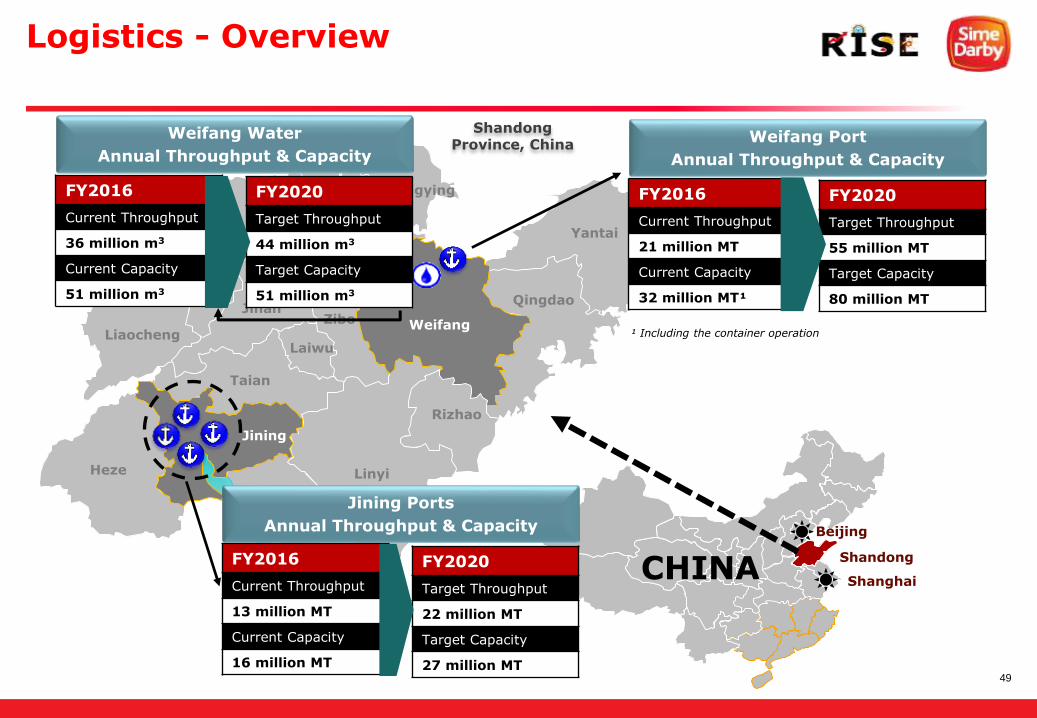
Weifang
Dongying
Heze
Liaocheng
Dezhou
JinanZibo
Laiwu
Taian
Zaozhuang
Linyi
Binzhou
Qingdao
Yantai
Weihai
Rizhao
Jining
Weifang Water
Annual Throughput & Capacity
Shandong Province, China
CHINA
Beijing
Shanghai
Shandong
FY2016
Current Throughput
36 million m3
Current Capacity
51 million m3
FY2020
Target Throughput
44 million m3
Target Capacity
51 million m3
FY2020
Target Throughput
55 million MT
Target Capacity
80 million MT
Weifang Port
Annual Throughput & Capacity
FY2016
Current Throughput
21 million MT
Current Capacity
32 million MT¹
Jining Ports
Annual Throughput & Capacity
FY2016
Current Throughput
13 million MT
Current Capacity
16 million MT
FY2020
Target Throughput
22 million MT
Target Capacity
27 million MT
Logistics - Overview
¹ Including the container operation
50
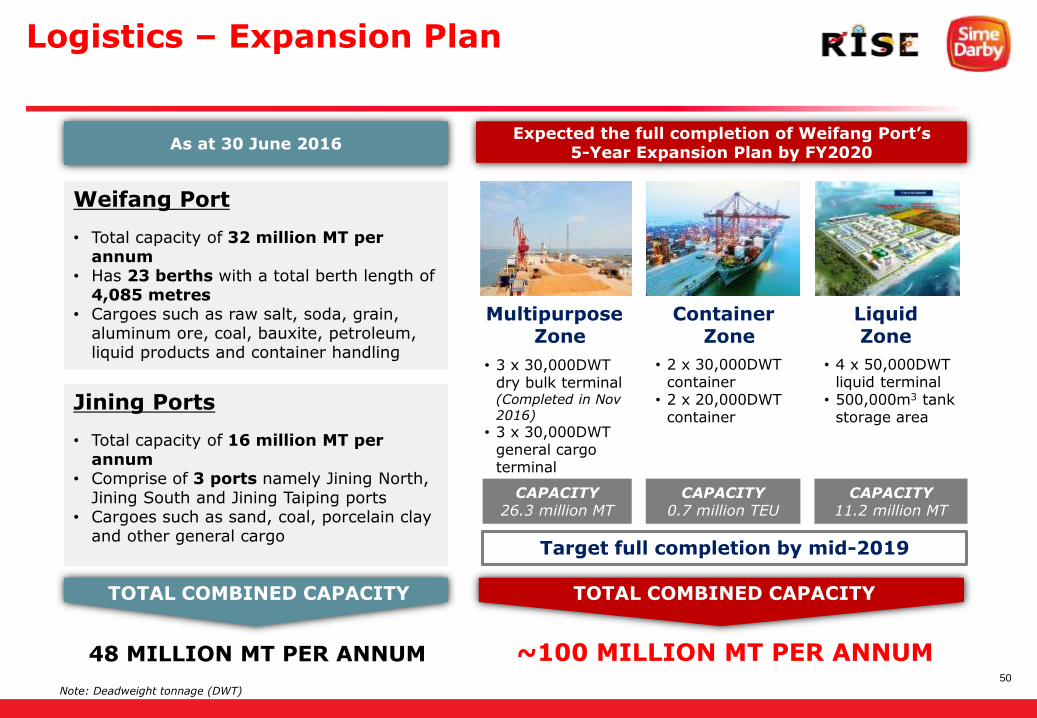
As at 30 June 2016Expected the full completion of Weifang Port’s
5-Year Expansion Plan by FY2020
• 3 x 30,000DWT dry bulk terminal (Completed in Nov 2016)
• 3 x 30,000DWT general cargo terminal
• 2 x 30,000DWT container
• 2 x 20,000DWT container
Weifang Port
• Total capacity of 32 million MT per annum
• Has 23 berths with a total berth length of 4,085 metres
• Cargoes such as raw salt, soda, grain, aluminum ore, coal, bauxite, petroleum, liquid products and container handling
Jining Ports
• Total capacity of 16 million MT per annum
• Comprise of 3 ports namely Jining North, Jining South and Jining Taiping ports
• Cargoes such as sand, coal, porcelain clay and other general cargo
TOTAL COMBINED CAPACITY
48 MILLION MT PER ANNUM
Multipurpose Zone
Container Zone
LiquidZone
CAPACITY26.3 million MT
CAPACITY0.7 million TEU
• 4 x 50,000DWT liquid terminal
• 500,000m3 tank storage area
CAPACITY11.2 million MT
TOTAL COMBINED CAPACITY
~100 MILLION MT PER ANNUM
Note: Deadweight tonnage (DWT)
Target full completion by mid-2019
Logistics – Expansion Plan

51
This presentation may contain forward-looking statements by Sime Darby Berhad that reflect management’s
current expectations, beliefs, intentions or strategies regarding the future and assumptions in light of currently
available information. These statements are based on various assumptions and made subject to a number of
risks, uncertainties and contingencies. Actual results, performance or achievements may differ materially and
significantly from those discussed in the forward-looking statements. Such statements are not and should not
be construed as a representation, warranty or undertaking as to the future performance or achievements of
Sime Darby Berhad and Sime Darby Berhad assumes no obligation or responsibility to update any such
statements.
No representation or warranty (either express or implied) is given by or on behalf of Sime Darby Berhad or its
related corporations (including without limitation, their respective shareholders, directors, officers, employees,
agents, partners, associates and advisers) (collectively, the "Parties") as to the quality, accuracy, reliability or
completeness of the information contained in this presentation (collectively, the "Information"), or that
reasonable care has been taken in compiling or preparing the Information.
None of the Parties shall be liable or responsible for any budget, forecast or forward-looking statements or
other projections of any nature or any opinion which may have been expressed in the Information.
The Information is and shall remain the exclusive property of Sime Darby Berhad and nothing herein shall
give, or shall be construed as giving, to any recipient(s) or party any right, title, ownership, interest, license or
any other right whatsoever in or to the Information herein. The recipient(s) acknowledges and agrees that this
presentation and the Information are confidential and shall be held in complete confidence by the recipient(s).
No part of this presentation is intended to or construed as an offer, recommendation or invitation to subscribe
for or purchase any securities in Sime Darby Berhad.
Disclaimer

52
Thank You
SIME DARBY INVESTOR RELATIONS
+(603) 2691 4122
http://www.simedarby.com/Overview.aspx