foreign consumer perception of tourism services · kajian ini menilai tanggapan pelancong terhadap...
TRANSCRIPT
Pertanika J. Soc. Sci. & Hum. 8(1): 7 - 17 (2000) ISSN: 0128-7702© Universiti Putra Malaysia Press
Foreign Consumer Perception of Tourism Services
SALLEH YAHYADepartment of Marketing & Management
Faculty of Economics & ManagementUniversiti Putm Malaysia, 43400 UPM, Serdang, Selangor, Malaysia
Keywords: hotel, restaurant, transportation, factors, tourism, satisfaction
ABSTRAK
Kajian ini menilai tanggapan pelancong terhadap kualiti perkhidmatan di dalam sektor hotel,restoran dan pengangkutan. Keputusan analisis menunjukkan bahawa kriteria tanggapan pelancongterhadap kualiti perkhidmatan bagi penginapan ialah: Layanan pekerja, kualiti bilik penginapan,kemudahan dalam melakukan urusan perniagaan, keselamatan Makanan yang bernilai sertamemadai, dan lain-lain kemudahan. Dimensi tanggapan pelancong terhadap restoran adalah:Kualiti serta penghidangan makanan, lokasi dan kemudahan pengangkutan, dan Layanan danreka bentuk restoran. Bagi dimensi yang berkaitan dengan pengangkutan, faktor-faktor yangtelah dikenal pasti ialah: kualiti sistem pengangkutan, kemudahan untuk mendapatkanperkhidmatan pengangkutan, dan layanan pekerja. Melalui analisis regresi, faktor-faktor yangpenting dalam mempengaruhi kepuasan pelancong telah dikenal pasti. Akhir sekali, kajian initelah memberi cadangan ten tang isu-isu yang perlu dipertimbangkan demi memajukan lagisektor pelancongan.
ABSTRACT
This paper performs an assessment of tourists' perception towards semces associated with lodging(hotel factors), dining (restaurant factors), and transportation (transportation factors). Theresults of the empirical analysis suggested that these are the underlying dimentions held by thetourists: (1) Hotel factors - Staff service quality, room quality, business serVices,. security, value andfood quality, and general amenities, (2) Restaurant factors - serving and food quality, accessibility,and general service and layout design, and (3) Transportation factors: system quality, accessibility,and staff service quality. By linking these factors with tourists' overall satisfattion level, thosefactors that significantly contribute to better travelling satisfaction have been identified. Inaddition, this paper provides information on level of service performance, and sheds light onareas that present great potential in retaining and attracting tourists.
INTRODUCTION
Today we can see the tremendous growth in thenumber of international travellers surfing allover the world. Based on the statistics compiledby the World Tourism Organisation (WTO) , thenumber of international tourists has dramaticallyincreased from 327.1 million in 1985 to 698.3million in 2000. Also from the same source, theworld international tourism receipts have jumpedfrom USD 118.1 billion in 1985 to 476 billion in2000. The surge of outbound travelling hastransformed the tourism industry in mostdeveloping countries from a cottage industry toa lucrative foreign exchange earner. In other
words, tourism industry is the only service sectorthat presents similar trading opportunities forall countries, regardless of their level ofdevelopment (Diaz 2001).
This remarkable surge could be attributedto the long economic boom of developed anddeveloping countries starting from the 1990s.Report by World Trade Organisation on tourismservices has noted that the increase in globalwealth has stimulated higher levels in tourismdemand (World Trade Organisation 1998).Another factor that has contributed to theenormous growth of outbound travellers is theexpansion of MNC operation. As the scale and
Salleh Yahya
operation of many MNCs expand to countriesabroad, outbound travelling of their personnel,and even chief executives, has become inevitable(The Economist 2001). wro Secretary-General,Francesco Frangialli, pointed out that the surgeof international tourists at the turn of the century,could also be due to the international occasionsand sport events such as Summer Olympics,Expo 2000, etc (World Tourism Organisation2001) .
One of the main characteristics of thetourism industry is that its supply of products,tourism services, involves cross-border movementof consumers coming to suppliers (World TradeOrganisation 1998). Although in most case themain concern of tourists lay on touristdestinations, the tourist destination is notconfined to places alone. Mill and Morrison(1992) noted that these elements are the buildingblocks of tourist destinations: attractions,facilities, infrastructure, transportation, andhospitality. Laws (1995) considered thoseelements proposed by Mill and Morrison (1992)as secondary elements. Laws (1995) recognisedthese elements as the primary contributors toattractiveness of tourist destinations: climate,ecology, culture and traditional architecture.These primary factors are often the distinctcharacteristics of one country, and should bepreserved and maintained in the course oftourism developments. On the other hand, thesecondary factors become the major determinantin ensuring tourists' travelling satisfaction.
The secondary elements are produced jointlyby different service sectors that are directly, orindirectly, supporting the tourism industry: hotel,restaurant, and transportation. One of theuniqueness of these service sectors, or tourismservice providers (TSP) , is that their productpossesses these general characteristics, as opposedto the normal products (i.e. assets): intangibility,variability, inseparability, and perishability. Thesupply of services by TSP is not limited only tothe contact personnel, but also include contactof customers with the physical environment,service systems, and other service customers(Stauss and Mang 1999). In other words, theTSP and the facilities they employ in the servicedelivery process determine the overall tourismperformance in serving tourists' needs. Theirlevel of performance could be judged throughfive service quality dimensions: tangibles, reliability,responsiveness, assurance, and empathy.
While good level of service is a must inattracting or retaining customers, a quality servicecould only be attained if it matches customer'sperception of quality. This means that a serviceis considered to be of high quality only when thecustomer judges it so. Empirical analysis hassuggested that consic\erable gap may occurbetween the service quality perceived betweenTSP and the customer itself (Camison et al.1996). The role of customers is especiallyimportant for service evaluation because of theirinvolvement in the service production process.Such participation in turn affects the customers'quality perception. Thus, asking tourists toexpress their degree of satisfaction towardsattributes related to hotels, restaurants andtransportation would provide inferences on thelevel of quality service performance of the TSP.This piece of information also reflects the generalneeds of tourists associated with hotel services,restaurant services, and transportation services.To sum, the findings of this study would provideinformation on:1. The current level of service performance by
TSP in fulfilling customers' needs andexpectations, and
2. Which areas of operation they should act onso as to remain competitive, and better servetheir existing customers and prospectiveones.
The findings of this study would be beneficialto Malaysia that has great potential in the tourismindustry. The weight of tourism industry in thecoming Malaysia's Third Outline Perspective Planreflects the importance of this particular industryin driving service sectors' growth. Variousinitiatives and plans are being formulated inorder to expand the industry. Areas beingconsidered include eco-tourism, research ontravellers' characteristics and behaviour patterns,expansion of recreational and entertainmentactivities, human resource development andtourism education, regional co-operation amongASEAN countries, among others.
liTERATURE REVIEW
A large number of tourism researchers havebeen concentrating on investigation of hotelattributes, and its importance to the travellers.An extensive review by Choi and Chu (2000) hasidentified these important attributes fromprevious literature: "cleanliness, location, room
8 PertanikaJ. Soc. Sci. & Hum. Vol. 8 No.1 2000
Foreign Consumer Perception of Tourism Services
rate, security, service quality, and the reputationof the hotel or chain". Empirical analysis byChoi and Chu (2000) identified these sevenhotel factors: "staff service quality", "roomquality", "general amenities", "business services","value", "security" and "IDD". In terms ofimportance, travellers survey by Ananth et al.(1992) have identified "price and quality" as themost important attribute, followed by "security"and "convenience of location". On the otherhand, LeBlanc and Nguyen (1996) maintainedthat environmental cues are more useful inattracting new customers. The findings reportedby Wong et al. (1999) indicated that employeerelated dimensions (i.e. behaviour andappearance) are more significant than thetangibles and reliability dimensions of hotelattributes.
In terms of restaurant attributes, Pizam andEllis (1999) proposed three major groupings:"material product", "environment", and"behaviour and attitude". The first group coversitems such as quality and price of F&B, portionsize, range of tastes and textures, and availabilityof menu items. The second group comprisesitems such as cleanliness of restaurants, locationand accessibility, furniture and fittings, noiselevel, availability of parking, and hours ofoperation. The third group comprises employeerelated items such as friendliness, competence,courtesy, and professionalism. Koo et ai. (1999),used nine restaurant attributes in their analysis:"location", "type of food', "variety of food","uniqueness", car park", "price", "quality or tasteof food", "decoration", and "service". Throughtheir analysis, they have found that it is possibleto segment the restaurant market based oncustomers' meal purposes (i.e. family meal,business meal, and tourists). With regard to thenature of the attributes, Cadotte and Turgeon(1988) have found that the following attributesof restaurants earn complaints more easily fromcustomers: "availability of parking", "hours ofoperation", "traffic congestion", "noise level",and "spaciousness of the establishment". Theyalso found other attributes where its unusualperformance could earn compliments, butaverage performance or absence of it will notcause complaints: "clean and neat restaurant",neat employees", "ample portions", and"responsiveness to complaints".
Unlike hotel and restaurant attributes,relatively few research papers have addressed
transportation attributes comprehensively.However, the importance of transportationattributes in promoting and supporting tourismindustry should not be neglected easily. InAugustyn's (1998) point of view, "tourismgenerating area", "transit", and "tourismdestination area" represents the three importantcomponents of tourism products at various stagesof tourist purchase-consumption process. InKozak and Rimmington's (1998) compiled listof tourist destination components, transportationrelated factors are being included. In a recentstudy by Chen and Gursoy (2001), theydiscovered that different cultural experiences,safety, and convenient transportation have apositive relationship with tourists' loyalty towardsdestinations. Hence, the finding of this study ontransportation attributes could provide moreinsight into the travelling dimensions perceivedby tourists.
METHODOLOGYThe Instrument
Questionnaire survey technique was used in thedata collection process. Two versions of selfadministered questionnaires were used in thedata collection process: Chinese version andEnglish version. The questionnaire comprisedtwo sections. The first section is designed tomeasure tourists' perception towards variousdimensions of service performance in hotelservices, restaurant services, and transportationservices. Specifically, the samples were asked toreflect their degree of satisfaction in relation tothe listed hotel attributes, restaurant attributes,and transportation attributes on a five-pointLikert scale ranging from 1 (strongly disagree)to 5 (strongly agree). The list includes 29 hotelattributes covering areas such as: staff servicequality, room quality, general amenities, businessservices, value, security, and IDD facilities. Forrestaurant attributes, 17 items covering thefollowing aspects: location, layout design,customer service, and food and beverage quality.Finally, for transportation attributes, fivedimensions described in 14 items wereconsidered: staff service quality, accessibility,station quality, security, and others. The type oftourist destination is also listed in this section inorder to obtain samples' perception andpreferences in their choice of travellingdestination. The respondents were also asked toindicate their overall satisfaction of Malaysia as a
PertanikaJ. Soc. Sci. & Hum. Vol. 8 0.1 2000 9
Salleh Yahya
tourist attraction compared to other Asiancountries, using a 10-point scale with 1 (very notsatisfied) and 10 (very satisfied). This responseis used later in the regression analysis. Thesecond section concentrates on capturing thesamples' demographic and travellingcharacteristics. The questions asked in this sectionare gender, age, occupation, purpose of visit toMalaysia, and days stayed in Malaysia.
The Sample and Sampling Procedure
The samples used in this study were randomlyselected from those international travellers whosedeparture was from the Malaysia Kuala LumpurInternational Airport (KLIA) between 17 - 31October 2000. A total of 506 sets ofquestionnaires were successfully collected, butonly 483 sets of usable questionnaires were usedin this study. For the definition of "traveller",this study followed those proposed by Ananth etal. (1992) and Choi and Chu (2000): "A travelleris any individual who is a temporary visitor,possessing a fixed place of abode, travelling inthe expectation of business or pleasure, andstaying overnight at a place other than his orher own, and involving an exchange of money".The characteristics of the respondents used inthis study could be summarised as below:1. Country of origin: Western (81%), Asian
(19%)2. Purpose of travelling: business (28.6%),
vacation (54.5%), others (16.9%)3. Age (years): below 25 (11.6%), 25-34
(39.3%),35-44 (20.7%),45-54 (16.8%),5564 (8.5%), over 64 (3.1%)
4. Travel arrangement: group-travel (12.9%),non-group travel (87.1 %)
5. Length of stay (days): 1-10 (69.2%), 11-20(18.2%),21-30 (8.4%),31 and above (4.2%)
Data Analysis
Before the mean score of the investigatedattributes are assessed, the underlying dimensionsperceived by tourists in term of hotel services,restaurant services, and transportation servicesmust be identified. This piece of informationwould provide a more complete assessment oncurrent service performance in each perceiveddimension. Hence, the first step of the analysiswas the principal component factor analysis,which was run separately on the hotel attributes,restaurant attributes, and transportationattributes. The orthogonal VARIMAX rotation
method was used in this study since it couldproduce clear factor structures with higher factorloading on the appropriate dimensions (Choiand Chu 2000). The VARIMAX rotation methodis also recognised as the standard rotationmethod for factor analysis (Manly 1986; Ngaiand Cheng 1997). The decision on the numberof factors to be extracted from the analysis, wasbased on the criterion of "eigenvalue greaterthan 1". The eigenvalue is the total varianceexplained by each factor. Mter that, items weregrouped to those components (or factors) whereit had the highest factor loading score. An itemwould be removed if none of its factor loadingis greater than 0.5. Then, the internal reliabilityof these factors was assessed using the Cronbach'salpha coefficient. This statistic measures theextent to which a set of variables is consistent inwhat it is intended to measure (Hair et al. 1998).Only those factors that have Cronbach's alphavalue greater than 0.7 were considered as reliable,and retained in the following analysis (Hair et al.1998).
In order to identify those factors thatcontribute to the tourists' overall satisfaction,three multivariate regression models wereestimated. The dependent variable for thesethree models was the tourists' overall satisfactionof Malaysia as a tourist attraction compared toother Asian countries. The factors identifiedthrough the factor analysis would be used as theindependent variables. Specifically, these threeregression models were the interest of this paper:
o = C1 + hlH I + h2H 2 + + h"H" (1)o = C2 + rlR j + r2R, + + r R (2)o = C3 + tiT} + t2T 2- + + <1',," (3)
where 0 = tourists' level of overall satisfactionhi = beta coefficient for hotel factor H
j
rj
= beta coefficient for restaurant factorR
I
tj
= beta coefficient for transportationfactor T
j
Cj= intercept
RESULTS AND DISCUSSION
Factor AnalysisThe factor analysis results for the three tourismsectors are summarised in Tables 1, 2, and 3.Column "Mean" indicates the mean score foreach item. Column "factor loading" indicatesthe degree of correlation between the item with
10 PertanikaJ. Soc. Sci. & Hum. Vol. 8 No.1 2000
Foreign Consumer Perception of Tourism Services
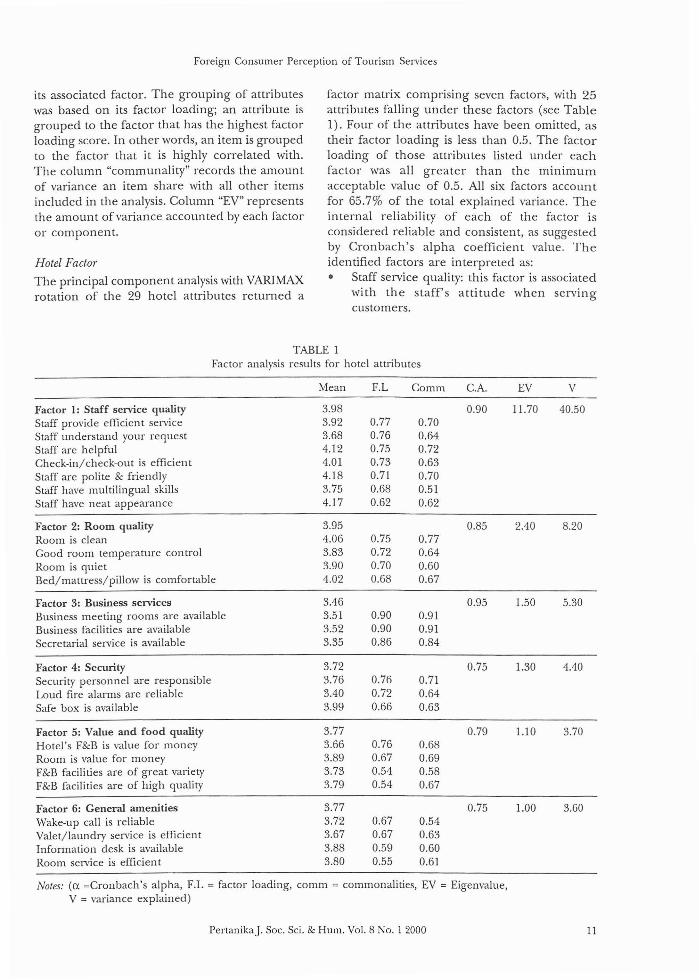
its associated factor. The grouping of attributeswas based on its factor loading; an attribute isgrouped to the factor that has the highest factorloading score. In other words, an item is groupedto the factor that it is highly correlated with.The column "communality" records the amountof variance an item share with all other itemsincluded in the analysis. Column "EV" representsthe amount of variance accounted by each factoror component.
Hotel Factor
The principal component analysis with VARIMAXrotation of the 29 hotel attributes returned a
factor matrix comprising seven factors, with 25attributes falling under these factors (see Table1). Four of the attributes have been omitted, astheir factor loading is less than 0.5. The factorloading of those attributes listed under eachfactor was all greater than the minimumacceptable value of 0.5. All six factors accountfor 65.7% of the total explained variance. Theinternal reliability of each of the factor isconsidered reliable and consistent, as suggestedby Cronbach's alpha coefficient value. Theidentified factors are interpreted as:• Staff service quality: this factor is associated
with the staff's attitude when servingcustomers.
TABLE 1Factor analysis results for hotel attributes
Mean F.L Comm GA.
Factor 1: Staff service quality 3.98 0.90Staff provide efficien t service 3.92 0.77 0.70Staff understand your request 3.68 0.76 0.64Staff are helpful 4.12 0.75 0.72Check-in/check-out is efficient 4.01 0.73 0.63Staff are polite & friendly 4.18 0.71 0.70Staff have multilingual skills 3.75 0.68 0.51Staff have neat appearance 4.17 0.62 0.62
Factor 2: Room quality 3.95 0.85Room is clean 4.06 0.75 0.77Good room temperature control 3.83 0.72 0.64Room is quiet 3.90 0.70 0.60Bed/mattress/pillow is comfortable 4.02 0.68 0.67
Factor 3: Business services 3.46 0.95Business meeting rooms are available 3.51 0.90 0.91Business facilities are available 3.52 0.90 0.91Secretarial service is available 3.35 0.86 0.84
Factor 4: Security 3.72 0.75Security personnel are responsible 3.76 0.76 0.71Loud fire alarms are reliable 3.40 0.72 0.64Safe box is available 3.99 0.66 0.63
Factor 5: Value and food quality 3.77 0.79Hotel's F&B is value for money 3.66 0.76 0.68Room is value for money 3.89 0.67 0.69F&B facilities are of great variety 3.73 0.54 0.58F&B facilities are of high quality 3.79 0.54 0.67
Factor 6: General amenities 3.77 0.75Wake-up call is reliable 3.72 0.67 0.54Valet/laundry service is efficient 3.67 0.67 0.63Information desk is available 3.88 0.59 0.60Room service is efficient 3.80 0.55 0.61
Notes: (C1. =Cronbach's alpha, F.L = factor loading, comm = commonalities, EV = Eigenvalue,V = variance explained)
PertanikaJ. Soc. Sci. & Hum. Vol. 8 No.1 2000
EV V
11.70 40.50
2.40 8.20
1.50 5.30
1.30 4.40
1.10 3.70
1.00 3.60
11
Salleh Yahya
• Room quality: this factor refers to the hotel'sperformance in terms of providing roomquality.
• Business services: this factor reflects theservices hotels provide in supportingcustomers' business needs.
• Security: this factor is related to securityfeatures or facilities offered by the hotel.
• Value and food quality: this factor refers toaspects related to monetary value for themajor services provided by the hotel, and itsability to provide quality food.
• General amenities: this factor deals withthose secondary services provided by thehotel for the convenience of customers.
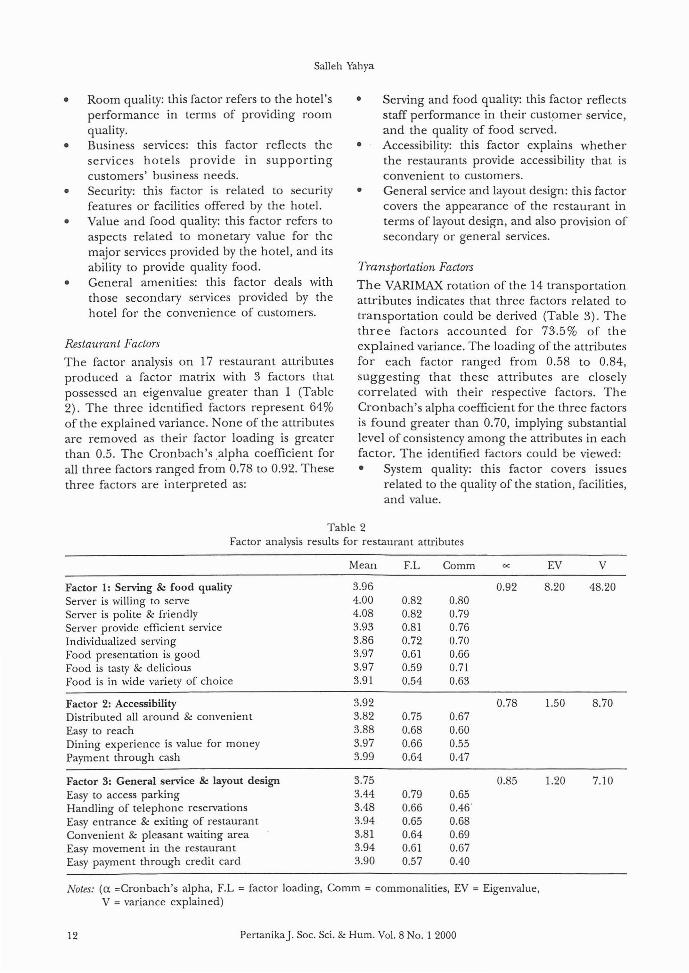
Restaurant Factors
The factor analysis on 17 restaurant attributesproduced a factor matrix with 3 factors thatpossessed an eigenvalue greater than 1 (Table2). The three identified factors represent 64%of the explained variance. None of the attributesare removed as their factor loading is greaterthan 0.5. The Cronbach's .alpha coefficient forall three factors ranged from 0.78 to 0.92. Thesethree factors are interpreted as:
• Serving and food quality: this factor reflectsstaff performance in their customer service,and the quality of food served.
• Accessibility: this factor explains whetherthe restaurants provide accessibility that isconvenient to customers.
• General service and layout design: this factorcovers the appearance of the restaurant interms of layout design, and also provision ofsecondary or general services.
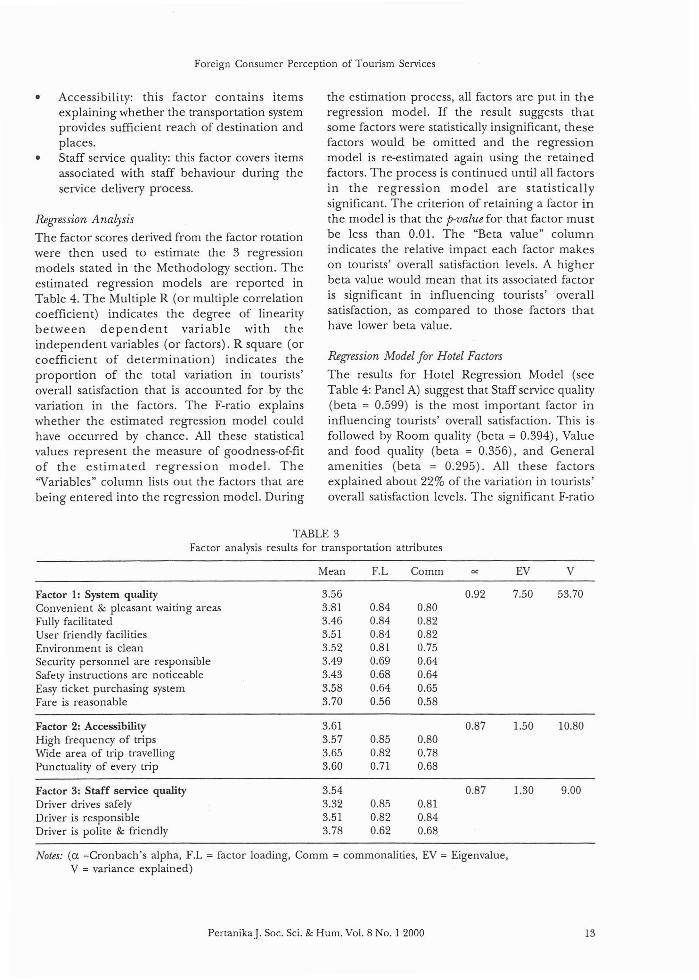
Transportation Factors
The VARlMAX rotation of the 14 transportationattributes indicates that three factors related totransportation could be derived (Table 3). Thethree factors accounted for 73.5% of theexplained variance. The loading of the attributesfor each factor ranged from 0.58 to 0.84,suggesting that these attributes are closelycorrelated with their respective factors. TheCronbach's alpha coefficient for the three factorsis found greater than 0.70, implying substantiallevel of consistency among the attributes in eachfactor. The identified factors could be viewed:• System quality: this factor covers issues
related to the quality of the station, facilities,and value.
Table 2Factor analysis results for restaurant attributes
Mean F.L Comm EV V
Factor 1: Serving & food quality 3.96 0.92 8.20 48.20Server is willing to serve 4.00 0.82 0.80Server is polite & friendly 4.08 0.82 0.79Server provide efficient service 3.93 0.81 0.76Individualized serving 3.86 0.72 0.70Food presentation is good 3.97 0.61 0.66Food is tasty & delicious 3.97 0.59 0.71Food is in wide variety of choice 3.91 0.54 0.63
Factor 2: Accessibility 3.92 0.78 1.50 8.70Distributed all around & convenient 3.82 0.75 0.67Easy to reach 3.88 0.68 0.60Dining experience is value for money 3.97 0.66 0.55Payment through cash 3.99 0.64 0.47
Factor 3: General service & layout design 3.75 0.85 1.20 7.10Easy to access parking 3.44 0.79 0.65Handling of telephone reservations 3.48 0.66 0.46Easy entrance & exiting of restaurant 3.94 0.65 0.68Convenient & pleasant waiting area 3.81 0.64 0.69Easy movement in the restaurant 3.94 0.61 0.67Easy payment through credit card 3.90 0.57 0.40
Noles: (a =Cronbach's alpha, F.L = factor loading, Comm = commonalities, EV = Eigenvalue,V = variance explained)
12 PertanikaJ. Soc. Sci. & Hum. Vol. 8 No.1 2000
Foreign Consumer Perception of Tourism Services
• Accessibility: this factor contains itemsexplaining whether the transportation systemprovides sufficient reach of destination andplaces.
• Staff service quality: this factor covers itemsassociated with staff behaviour during theservice delivery process.
Regression Analysis
The factor scores derived from the factor rotationwere then used to estimate the 3 regressionmodels stated in the Methodology section. Theestimated regression models are reported inTable 4. The Multiple R (or multiple correlationcoefficient) indicates the degree of linearitybetween dependent variable with theindependent variables (or factors). R square (orcoefficient of determination) indicates theproportion of the total variation in tourists'overall satisfaction that is accounted for by thevariation in the factors. The F-ratio explainswhether the estimated regression model couldhave occurred by chance. All these statisticalvalues represent the measure of goodness-of-fitof the estimated regression model. The"Variables" column lists out the factors that arebeing entered into the regression model. During
the estimation process, all factors are put in theregression model. If the result suggests thatsome factors were statistically insignificant, thesefactors would be omitted and the regressionmodel is re-estimated again using the retainedfactors. The process is continued until all factorsin the regression model are statisticallysignificant. The criterion of retaining a factor inthe model is that the p-value for that factor mustbe less than 0.01. The "Beta value" columnindicates the relative impact each factor makeson tourists' overall satisfaction levels. A higherbeta value would mean that its associated factoris significant in influencing tourists' overallsatisfaction, as compared to those factors thathave lower beta value.
Regression Model for Hotel Factors
The results for Hotel Regression Model (seeTable 4: Panel A) suggest that Staff service quality(beta = 0.599) is the most important factor ininfluencing tourists' overall satisfaction. This isfollowed by Room quality (beta = 0.394), Valueand food quality (beta = 0.356), and Generalamenities (beta = 0.295). All these factorsexplained about 22% of the variation in tourists'overall satisfaction levels. The significant F-ratio
TABLE 3Factor analysis results for transportation attributes
Mean F.L Comm EV V
Factor 1: System quality 3.56 0.92 7.50 53.70Convenient & pleasant waiting areas 3.81 0.84 0.80Fully facilitated 3.46 0.84 0.82User friendly facilities 3.51 0.84 0.82Environment is clean 3.52 0.81 0.75Security personnel are responsible 3.49 0.69 0.64Safety instructions are noticeable 3.43 0.68 0.64Easy ticket purchasing system 3.58 0.64 0.65Fare is reasonable 3.70 0.56 0.58
Factor 2: Accessibility 3.61 0.87 1.50 10.80High frequency of trips 3.57 0.85 0.80Wide area of trip travelling 3.65 0.82 0.78Punctuality of every trip 3.60 0.71 0.68
Factor 3: Staff service quality 3.54 0.87 1.30 9.00Driver drives safely 3.32 0.85 0.81Driver is responsible 3.51 0.82 0.84Driver is polite & friendly 3.78 0.62 0.68
Notes: (a =Cronbach's alpha, F.L = factor loading, Comm = commonalities, EV = Eigenvalue,V = variance explained)
PertanikaJ. Soc. Sci. & Hum. Vol. 8 No.1 2000 13