development of reduced calorie chocolate cake with ... (02) 2012/(20)ifrj-2012 siti.pdfdevelopment...
TRANSCRIPT
© All Rights Reserved*Corresponding author.
Email: [email protected]: +60 19 9424073; Fax: +6088 320259
International Food Research Journal 19(2): 515-519 (2012)
1*Siti Faridah, M. A. and 2Noor Aziah, A. A.
1School of Food Science and Nutrition, Universiti Malaysia Sabah, 88400, Kota Kinabalu, Sabah, Malaysia.
2School of Industrial Technology, Department of Food Technology, Universiti Sains Malaysia, 11800 Minden, Penang, Malaysia.
Development of reduced calorie chocolate cake with jackfruit seed (Artocarpus heterophyllus Lam.) flour and polydextrose using
response surface methodology (RSM)
Abstract: Response Surface Methodology (RSM) with Central Composite Rotatable Design (CCRD) was performed in this study to develop an acceptable reduced calorie chocolate cake. The range of the independent variables, namely Jackfruit Seed (JFS) flour (20-25% replacement of wheat flour) and polydextrose (10-15% replacement of sucrose) were identified which affect the volume, specific volume, symmetry and uniformity of the chocolate cake. The coefficient of determination, R2 values for volume, specific volume, symmetry and uniformity were greater than 0.900. The optimum level for replacement of sugar with polydextrose was at 11% and wheat flour with JFS flour was at 16% with calorie reduction approximately 34% from the control cake formulation.
Keywords: Responses surface methodology, polydextrose, jackfruit seed flour
Introduction
High ratio cakes contain more sugar than flour and widely used in the baking industry (Rosenthal, 1995). However, due to its high caloric content, over consumption of cake may contribute to obesity. With the current trend in food industry, foods that contain low-calorie sugar- and fat-replacers are popular due to increase in nutritional and health awareness in the calorie reduction in the diet (Dilek et al., 2007). However, altering the ingredients and their levels, so as to reduce the calorie and increase the fiber content of the product, causes readily detectable losses in appearance, mouthfeel and texture (Amanda and Carole, 1991).
JFS flour has been successfully incorporated into bread at 25% level and was accepted by sensory panel (Hasidah and Noor Aziah, 2003). Thus, JFS flour can be substituted at a certain level for wheat flour to satisfy consumer demands for increased fibre content in cakes. The seed of jackfruit which is a waste from the fruit industry has commercial potential for application as a cheap source of fiber replacing wholemeal.
Sucrose acts as a tenderizer by retarding and restricting gluten formation, increase the temperature of eggs protein denaturation and starch gelatinization (Osman, 1975). Polydextrose (Litesse® from Danisco Sweeteners Ltd.) can be used as a sugar- and fat- replacer. Polydextrose is low in calorie (1 kcal/g) because it is poor gastrointestinal absorption and high resistance to microbial degradation in the colon
(Figdor and Bianchine, 1983). The lack of sweetness of polydextrose would be an advantage in sucrose based food (Anibal and Raul, 1981). Polydextrose has similar technological properties to sugar and functions in food as humectants, bulking agent, stabilizer and texturiser. Polydextrose (Litesse®) is non-glycemic; hence it does not create insulin demand. Previous Study has shown that Litesse® promotes the growth of intestinal Lactobacillus and bifidus and their fermentation in the large intestine yields short-chain fatty acids (Danisco, 2003).
In recent years, the response surface methodology (RSM) has become the most popular optimization methods for optimizing a process when the independent variables have an interaction effects on the response (Tang et al., 2010). It had been used in many food researches and product developments such as in bread formulation (McCarthy et al., 2005), cookies (Lee et al., 2011) and cake (Neville and Setser, 1986). The purpose of this study are 1) to optimize the levels of polydextrose and JFS flour to partially replace sucrose in and wheat flour in producing reduced calorie chocolate cake and 2) to compare the physical chemical characteristics of optimized formulation with the control cake.
Materials and Methods
MaterialsPolydextrose (Litesse® Ultra) was supplied by
Danisco Sweeteners (M) Co., Ltd. The emulsifier, sucrose ester F-160 was obtained from Dai-Ichi
516 Siti Faridah, M. A. and Noor Aziah, A. A.
International Food Research Journal 19(2): 515-519
Kogyo Seiyaku Co., Ltd. (Kyoto, Japan). The dry ingredients were purchased from Sunshine Trading Company, Penang. The jackfruit seed were supplied from Tropical Farm, Penang and processed into flour.
Jackfruit seed (JFS) flour preparationThe seeds were cleaned under running water and
then boiled for 15 min. The seeds were cooled before the outer skin (hilum) was peeled off manually. The seeds were sliced and dried in air drying oven (model Afos Dryer). The dried seeds were then grounded into flour with 60 mesh of particle size.
Cake preparationFormulation for chocolate cakes was prepared by
a single bowl mixing method according to modified formulation from Neville and Setsar (1986) as shown in Table 1. The eggs, sugars, sucrose ester were mixed up for 2 and 5 min at the speed of 4 and 6 (Kitchen Aid Mixer, model 5-C, Hobart, IN), respectively. The mixture was then mixed at speed 8 for 2 min to form lighter, creamier and ‘floppy’ batter. After mixing, the sifted self-raising flour, JFS flour and cocoa powder were then added into a mixing bowl and mix at speed 2 for 2 min. Milk, margarine and polydextrose were heated together in saucepan until melted. The mixture was poured into bowl and mix at speed 2 for 1 minute. The batter (250 g) was then transferred to 12 cm x 5 cm x 4 cm greased tin cake pan and baked in an electric oven (model Salva Modular) at 1800C for 35 min. The cakes were then removed from the oven and allowed to cool for 2 hours and were later packed in a 25 cm x 15 cm low-density polyethylene packages at room temperature for 24 hours prior to physical quality analysis. Data reported were based on the mean of three replications.
Experimental design RSM was employed to determine the optimal
combination of polydextrose and JFS flour replacement in development of reduced calorie cake using Stat-Ease software (Design Expert version 5.0.7, Corp., MN). Two independent variables namely polydextrose (ß1) and JFS flour (ß2) were chosen. At 5 levels and
a total of 13 different combinations including five replicates of the centre point were chosen in random order according to a central composite rotatable design configuration for two factors (Cochran and Cox, 1957). The experimental design in the coded (x) and actual (X) levels of independent variables were related to the coded variables (xi, i = 1 and 2) by a second degree polynomial using the equation below.
Responses,Y = ß0 + ß1 (X1) + ß2 (X2) + ß12 (X1) (X2) + ß12 (X1) + ß2
2 (X2)
The coefficients of the polynomial were represented by:
Responses, Y = scores of each physical properties evaluatedß0 = interceptß1 = coefficient for polydextrose (poly) level at the first order termß2 = coefficient for JFS flour level at the first orderß12 = coefficient for interaction among poly and JSF levelß1
2 = coefficient for poly level at the second order termß2
2 = coefficient for JFS flour level at the second order level
(X1) = % poly replacement of sucrose(X2) = % JFS replacement of wheat flour
The analysis of variance (ANOVA) tables were generated and the effect and regression coefficients of individual linear, quadratic and interaction terms were determined. The significances of all terms in the polynomial were judged statistically by computing the F-value at a probability (p) of 0.001, 0.01 or 0.05. The regression coefficients were then used to make statistical calculation to generate contour maps from the regression models.
Physical measurement of cakesThe volume of cake was determined by rapeseed
displacement method according to Lin and Lin (2001). Proximate analyses of fat, ash, protein (N x 6.25), crude fibre, moisture and carbohydrate were conducted according to AOAC (1990) methods. The calorie value was determined according to Basil and Sandra (1983) method. Cake uniformity and symmetry was determined from the cross-sectioned cake tracing by AACC method 10-91 (2000). Specific volume (ml/g) was computed by dividing the cake volume by weight.
Statistical analysisData were analyzed by using SPSS version 11.0
(Illinois, US) using analyses of variance (ANOVA). Significant differences were tested using Duncan Multiple Range test.
Results and Discussion
Statistical analysisEffect of replacement level of polydextrose
Table 1. Formulation of control and reduced calorie (RC) chocolate cake
Ingredients Control cake (g) RC cake (g)SugarMargarineSucrose esterNon fat milkEggCocoa powderSelf-raising flourPolydextrosea
JFS flourb
130458
12510025115
--
115.84351214010025
96.714.1518.32
a % replacement of sucrose b % replacement of wheat flour
Development of reduced calorie chocolate cake with jackfruit seed (Artocarpus heterophyllus Lam.) flour and polydextrose using response surface methodology (RSM)
517
International Food Research Journal 19(2): 515-519
and JFS flour on four dependent variables (volume, specific volume, symmetry and uniformity) of the cake are shown in Table 2. The estimated regression coefficients, R2 and probability values for all dependent variables are tabulated in Table 3. The P-values were used as a tool for checking the significance of each coefficient, which indicated the interaction patterns between the variables (Chun et al., 2007). The smaller the P-value, the more significant was the corresponding coefficient (Karthikeyan et al., 1996). Table 3 showed that both the linear and quadratic term of all parameters (polydextrose, ß1 and JFS flour, ß2) had significant (at least at p<0.05) effect on all dependent variables. The R2 values obtained were 0.9498, 0.9092, 0.9788 and 0.9678 for volume, specific volume, symmetry and uniformity, respectively. The closer the R2 value to unity the better the empirical model fits the actual data, which supported by the lack of fit test. This meant that R2 of more than 0.75 were satisfactory and considered accurate enough for prediction purposes (Irwandi et al., 2000).
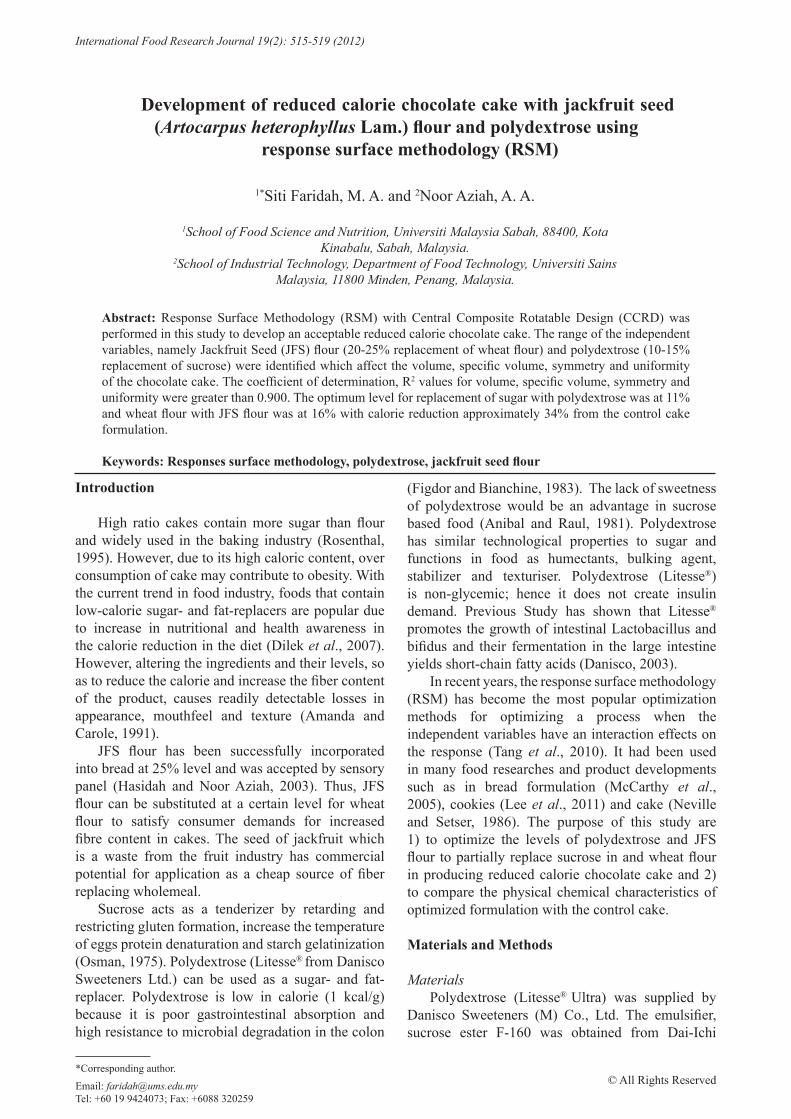
Effect on the volume Figure 1 shows the response surface for the effect
of independent variables on the volume of RC cake. As shown in Table 3, volume was negatively related to the linear effect of polydextrose (p<0.001) and JFS flour (p<0.001). The volume was significantly decreased with the increase level of polydextrose and JFS flour (Figure 1). Sugar delayed the starch gelatinization during cake baking and its allowed the air bubbles to expand by carbon dioxide and water vapour before the cake sets (Kim and Walker, 1992). As a result the cake structure was highly aerated and higher in volume. Delayed gelatinization of starch in sugar solution was attributed to the abilities of sugar to limit availability of water to starch granule, lowered the water activity, formation of sugar bridges between starch chains and formation of an anti plasticizing effect, relative to water (Kim and Walker, 1992). Therefore, lowering sugar by substituting
polydextrose resulted in early gelatinization of starch during baking process and restricted the volume of cake. It was shown that substitution of JFS flour into the formulation resulted in a progressive decreased in loaf volume. To overcome the problem, prolong beating was carried out to incorporate air, and make the resultant batter was thicker than traditional batter.
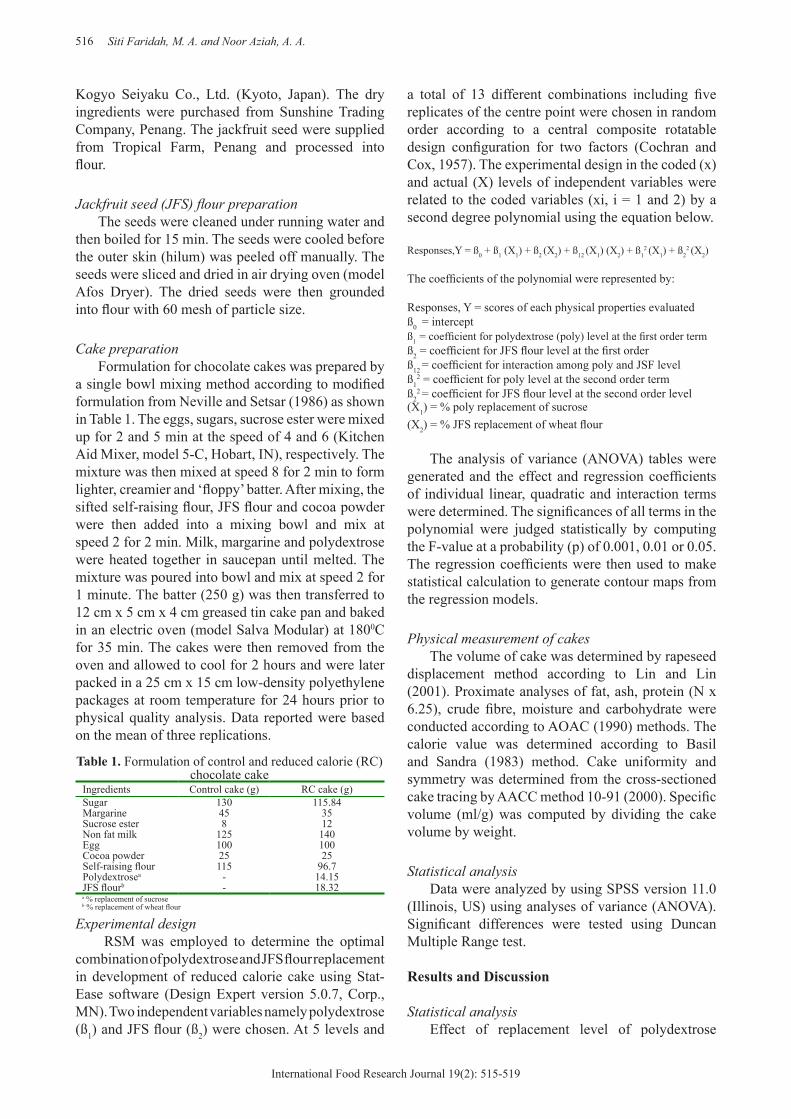
Effect on the specific volume Figure 2 shows the response surface plot at
different replacement level of polydextrose and JFS flour on specific volume. Table 3 indicated that specific volume was affected by polydextrose, with positive linear (p<0.05) and negative quadratic effects at p<0.01. However, the linear and quadratic effects of JFS flour were negative at p<0.01 and p<0.05, respectively (Table 3). As the JFS flour replacement level increased the specific volume decreased. Hence, an increased in polydextrose and decreased in JFS flour might increased the specific volume of the RC cake (Figure 2).
Table 2. Effect of replacement level of polydextrose and JFS flour on four dependent variables
Run
Independent variables Dependent variables
X1(x1)Polydextrosea (%)
X2 (x2)JFS flourb (%)
Y1Volumec (ml)
Y2Specific volume (ml/g)
Y3Symmetryc (cm)
Y4Uniformityc (cm)
12345678910111213
15.00 (+1) 8.96 (-α) 12.50 (0) 10.00 (-1) 16.04 (+α) 12.50 (0) 12.50 (0) 12.50 (0) 12.50 (0) 15.00 (+1) 12.50 (0) 10.00 (-1) 12.50 (0)
25.00 (+1)20.00 (0) 20.00 (0) 25.00 (+1) 20.00 (0) 20.00 (0) 12.93 (-α) 20.00 (0) 20.00 (0) 15.00 (-1) 27.07 (+α) 15.00 (-1) 20.00 (0)
550 560 560 560 550 560 565 560 560 555 555 570 560
2.5 2.5 2.6 2.52 2.55 2.65 2.592.6 2.6 2.65 2.5 2.55 2.6
1.01.51.70.70.61.71.651.71.71.00.52.21.7
00.1500.150.100.1000.150.10.10
a % replacement of sucrose b % replacement of wheat flour c Mean of triplicate measurements
Figure 1. Response surface plot of the effects of polydextrose (% replacement of sucrose) and JFS flour (% replacement of wheat flour) on volume of reduced calorie (RC) cake
Table 3. Estimated regression coefficient, R2 and P or probability values, P for volume, specific volume,
symmetry and uniformity
Coefficient Volume (ml)
Specific volume (ml/g)
Symmetry (cm)
Uniformity (cm)
ß0ß1
560-4.89***
2.610.019*
1.70-0.27***
0-0.021**
ß2 -3.64*** -0.038** -0.39*** -0.012ß1ß2 1.25 -0.038* 0.38*** -0.05ß1
2 -2.19** -0.028** -0.28*** 0.059***
ß22 0.31 -0.03* -0.27*** 0.047***
P-value 0.0002 0.0016 0.0001 0.0001R2 0.9498 0.9092 0.9788 0.9678
ß1 = Polydextroseß2 = JFS flour* Significant at 0.05 level ** Significant at 0.01 level *** Significant at 0.001 level
Figure 2. Response surface plot of the effects of polydextrose (% replacement of sucrose) and JFS flour (% replacement of wheat flour) on specific volume of reduced calorie (RC) cake
518 Siti Faridah, M. A. and Noor Aziah, A. A.
International Food Research Journal 19(2): 515-519
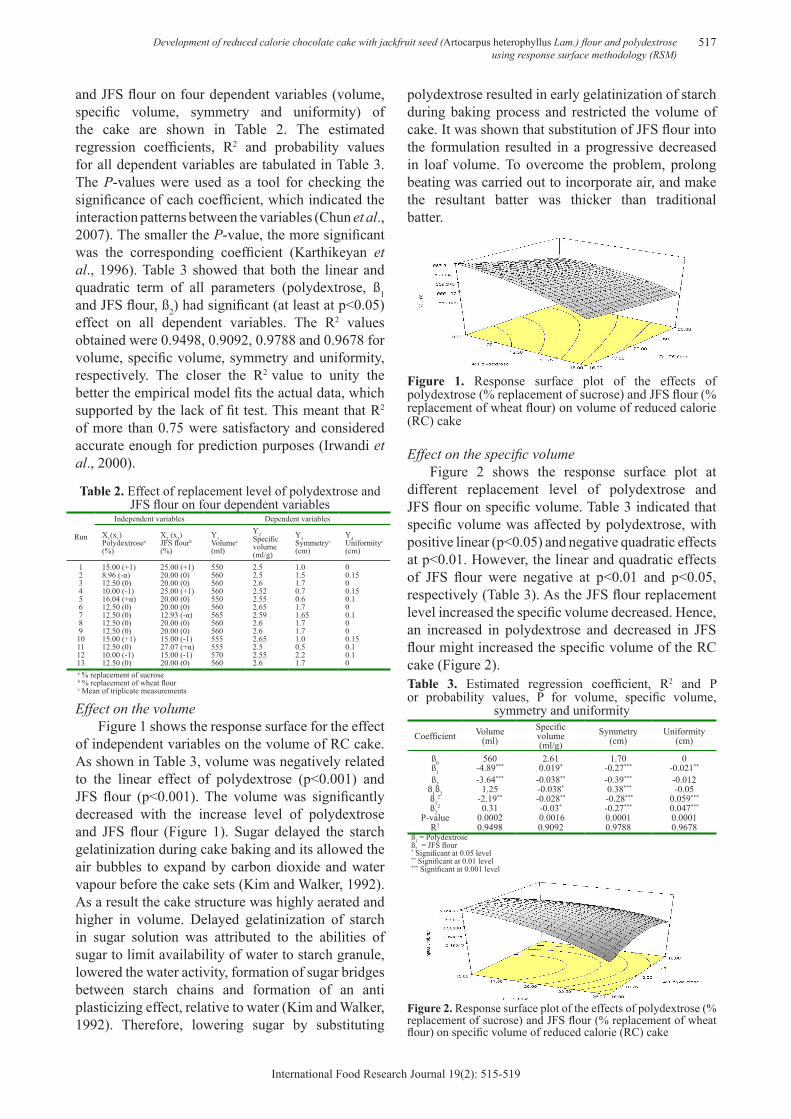
Effect on the symmetryReplacement of polydextrose had a negative
effect on the symmetry indices at linear and quadratic terms, showing significant levels at p<0.001 and p<0.001, respectively (Table 3). The same pattern also can be observed on the negative effect of JFS flour on the symmetry at linear (p<0.001) and quadratic (p<0.001) term (Table 3). Positive symmetry indices are desirable because they indicated peaked cake, whereas negative values indicate collapsed cakes (Shelke et al., 1992). Thus decreasing the replacement level of polydxtrose and JFS flour would increase the symmetry indices to positive values.
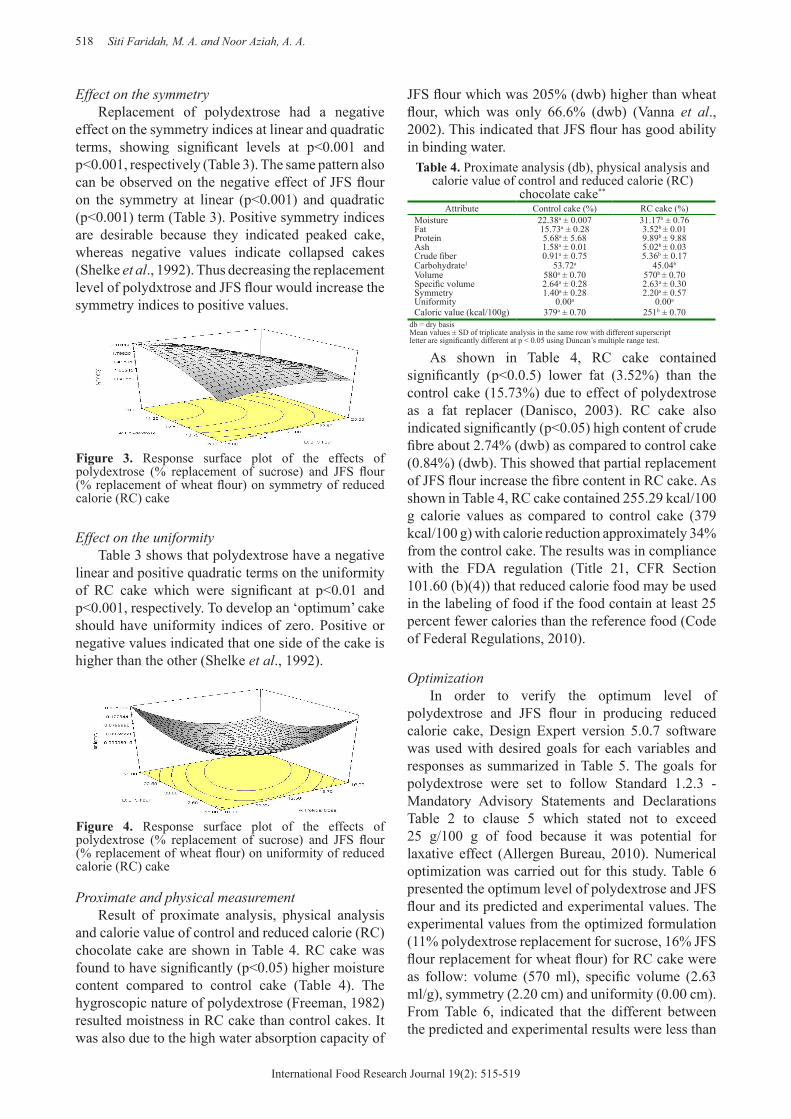
Effect on the uniformityTable 3 shows that polydextrose have a negative
linear and positive quadratic terms on the uniformity of RC cake which were significant at p<0.01 and p<0.001, respectively. To develop an ‘optimum’ cake should have uniformity indices of zero. Positive or negative values indicated that one side of the cake is higher than the other (Shelke et al., 1992).
Proximate and physical measurement Result of proximate analysis, physical analysis
and calorie value of control and reduced calorie (RC) chocolate cake are shown in Table 4. RC cake was found to have significantly (p<0.05) higher moisture content compared to control cake (Table 4). The hygroscopic nature of polydextrose (Freeman, 1982) resulted moistness in RC cake than control cakes. It was also due to the high water absorption capacity of
JFS flour which was 205% (dwb) higher than wheat flour, which was only 66.6% (dwb) (Vanna et al., 2002). This indicated that JFS flour has good ability in binding water.
As shown in Table 4, RC cake contained significantly (p<0.0.5) lower fat (3.52%) than the control cake (15.73%) due to effect of polydextrose as a fat replacer (Danisco, 2003). RC cake also indicated significantly (p<0.05) high content of crude fibre about 2.74% (dwb) as compared to control cake (0.84%) (dwb). This showed that partial replacement of JFS flour increase the fibre content in RC cake. As shown in Table 4, RC cake contained 255.29 kcal/100 g calorie values as compared to control cake (379 kcal/100 g) with calorie reduction approximately 34% from the control cake. The results was in compliance with the FDA regulation (Title 21, CFR Section 101.60 (b)(4)) that reduced calorie food may be used in the labeling of food if the food contain at least 25 percent fewer calories than the reference food (Code of Federal Regulations, 2010).
Optimization In order to verify the optimum level of
polydextrose and JFS flour in producing reduced calorie cake, Design Expert version 5.0.7 software was used with desired goals for each variables and responses as summarized in Table 5. The goals for polydextrose were set to follow Standard 1.2.3 - Mandatory Advisory Statements and Declarations Table 2 to clause 5 which stated not to exceed 25 g/100 g of food because it was potential for laxative effect (Allergen Bureau, 2010). Numerical optimization was carried out for this study. Table 6 presented the optimum level of polydextrose and JFS flour and its predicted and experimental values. The experimental values from the optimized formulation (11% polydextrose replacement for sucrose, 16% JFS flour replacement for wheat flour) for RC cake were as follow: volume (570 ml), specific volume (2.63 ml/g), symmetry (2.20 cm) and uniformity (0.00 cm). From Table 6, indicated that the different between the predicted and experimental results were less than
Table 4. Proximate analysis (db), physical analysis and calorie value of control and reduced calorie (RC)
chocolate cake**
Attribute Control cake (%) RC cake (%)Moisture 22.38a ± 0.007 31.17b ± 0.76Fat 15.73a ± 0.28 3.52b ± 0.01Protein 5.68a ± 5.68 9.89b ± 9.88Ash 1.58a ± 0.01 5.02b ± 0.03Crude fiber 0.91a ± 0.75 5.36b ± 0.17Carbohydrate1 53.72a 45.04b
Volume 580a ± 0.70 570b ± 0.70Specific volume 2.64a ± 0.28 2.63a ± 0.30Symmetry 1.40a ± 0.28 2.20a ± 0.57Uniformity 0.00a 0.00a
Caloric value (kcal/100g) 379a ± 0.70 251b ± 0.70db = dry basisMean values ± SD of triplicate analysis in the same row with different superscript letter are significantly different at p < 0.05 using Duncan’s multiple range test.
Figure 3. Response surface plot of the effects of polydextrose (% replacement of sucrose) and JFS flour (% replacement of wheat flour) on symmetry of reduced calorie (RC) cake
Figure 4. Response surface plot of the effects of polydextrose (% replacement of sucrose) and JFS flour (% replacement of wheat flour) on uniformity of reduced calorie (RC) cake
Development of reduced calorie chocolate cake with jackfruit seed (Artocarpus heterophyllus Lam.) flour and polydextrose using response surface methodology (RSM)
519
International Food Research Journal 19(2): 515-519
10%. Thus, showed the response model was adequate in prediction.
Conclusion
The optimization for the development of reduced calorie chocolate cake was successful in partially replacing sucrose with polydextrose at 11% and JFS flour at 16% by using Responses Surface Methodology (RSM). Final optimized cake formulations resulted in approximately 34% calorie reduction as compared to the control cake.
References
AACC. 2000. American Association of Cereal Chemist. The Association: St. Paul, MN.
Allergen Bureau. 2010. Standard 1.2.3 Mandatory Warning and Advisory Statements and Declarations. Downloaded from: http://www.allergenbureau.net/downloads/projects-and resources/Food_Std_1.2.3.pdf on 3/6/2010.
Amanda M. Frye and Carole, S. Setser. 1991. Optimizing texture of reduced calorie yellow layer cakes. Cereal chemistry 69 (3): 338-343.
Anibal, T. and Raul, D. T. 1981. Polydextrose and its application in food. Food Technology July: 44-49.
AOAC. 1990. Official Methods Of Analysis 12th Ed. Association Of Official Analytical Chemist, Washington D. C.
Basil, S.K. and Sandra, W. 1983. Composition and sensory quality of shortening free yellow layer cakes. Cereal Food World 28 (12): 731-733
Chun, C.g, Peilin, C. and Xiaojian, M. 2007. Levulinic acid production from wheat straw. Bioresource Technology 98: 1448-1453.
Cochran, W. G. and Cox, G. M. 1975. Experimental Designs, 2nd. John Wiley and Sons, Inc., New York.
Code of Federal Regulations. 2010. Nutrient content claims for the calorie content of foods. Title 21, Volume 2 (21CFR101.60). downloaded from: http://www.eccessdata.fda.gov/scripts/cdrh/cfdocs/cfcfr/CFRSearch.cfm?fr=101.60 on 6/6/2010.
Danisco. 2003. Polydextrose: Littesse® Ultra. Downloaded from www.daniscosweeteners.com on 12/3/2003.
Figdor, S. K. and Bianchine, J. R. 1983. Caloric utilization and disposition of 14C-polydextrose in man. Journal of Agriculture Food Chemistry 31: 389–393.
Freeman, T. M. 1982. Polydextrose for reduced calorie foods. Cereal Food World 27: 515-518.
Hasidah, M. Y. and Noor Aziah, A. A. 2003. Organoleptic and physico-chemical evaluation of breads supplemented with jackfruit seed (Artocarpus heterophyllus) flour. Proceeding Malaysian Science and Technology Congree (MSTC). Kuala Lumpur. Malaysia.
Irwandi, J., Che Man, Y. B. and David, D. K. 2000. Optimization of physicochemical changes of palm olein with phytochemical antioxidants during deep fat frying. Journal of Oil Chemists’ Society 77: 1161-1168.
Karthikeyan, R.S., Rakshit, S.K., Baradarajan, A. 1996. Optimization of batch fermentation conditions for dextran production. Bioprocess Engineering 15: 247–251.
Kim, C. S. and Walker, C. E. 1992. Effect of sugars and emulsifiers on starch gelatinization evaluated by differential scanning calorimetry. Cereal Chemistry 69 (2): 212-217
Dilek, K., Zeynep, H., Alev, B. and Sinan, K. 2007. Buble and pore formation of the high-ratio cake formulation with polydextrose as a sugar and fat replacer. Journal of food engineering 78: 953-964.
Lin, S. D. and Lin, S. N. 2001. Studies on the application of isomaltooligo saccharide syrup / sucrose in chiffon cake. Taiwan Journal Agriculture Chemistry Food Science 39: 76-86.
Neville, N. E. and Setser, C. S. 1986. Textural optimization of reduced calorie layer cakes using response surface methodology. Cereal Foods World 31(10): 744-749
Osman, E. M. 1975. Interaction of starch with other components of food systems. Food Technology 29 (4): 30-35
McCarthy, D. F., Gallagher, E., Gormley, T. R., Schober, T. J. and Arendt, E. K. 2005. Application of response methodology in the development of gluten free bread. Cereal Chemistry 82 (5): 609-615.
Rosenthal, A. J. 1995. application of aged egg in enabling increased substitution of sucrose by litesse (polydextrose) in high ratio cakes. Journal of science food and agriculture 68: 127-131.
Shelke, K., Hoseney, R.C., Faubion, J.M. and Curban, S.P. 1992. Age related changes in the cake baking quality o flour milled from freshly harvested soft wheat. Cereal Chemistry 69 (2): 141-144.
Tang, D. S., Tian, Y. J., He, Y. Z., Li, L., Hu, S. Q. and Li, B. 2010. Optimization of ultrasonic-assisted protein extraction from brewer’s spent grain. Czech Journal of Food Science 28: 9-17.
Vanna, T., Kanitha, T., Prapa, S. and Nongnuj, J. 2002. Some physicochemical properties of jackfruit (Artocarpus heterophyllus Lam) seed flour and starch. Science Asia 28: 37-41
Table 5. Criteria and outputs for numerical optimization of reduced calorie (RC) chocolate cake
Criteria Goal Limit outputPolydextrosea (%) In the range 10-15 11.10JFS flourb (%) In the range 15-25 16.00Volume (ml) maximum 550-570 566.73Specific volume (ml/g) In the range 2.5-2.65 2.59Symmetry (cm) maximum 0.5-2.2 2.07Uniformity (cm) minimum 0-0.15 0.05Desirability - - 0.78
a % replacement of sucrose b % replacement of wheat flour
Table 6. Predicted and experimental values of the response variables at optimum formulation
Response variablesOptimum product Difference
(%)Predicted values
Experimental valuesa
Volume (ml)Specific volume (ml/g)Symmetry (cm)Uniformity (cm)
566.732.592.070.05
570 ± 0.702.63 ± 0.302.20 ± 0.57
0.00
0.571.525.91.00
a Mean ± SD of triplicate analysis