universiti teknikal malaysia melakaeprints.utem.edu.my/12333/1/value_stream_mapping... · digunakan...
TRANSCRIPT
UNIVERSITI TEKNIKAL MALAYSIA MELAKA
VALUE STREAM MAPPING USING SIMULATION TOWARDS
LEAN MANUFACTURING AT MANUFACTURING COMPANY
This report submitted in accordance with requirement of the Universiti Teknikal
Malaysia Melaka (UTeM) for the Bachelor Degree of Manufacturing Engineering
(Manufacturing Management) (Hons.)
by
MUHAMMAD IQBAL BIN SAZALI
B051010022
880228-10-5043
FACULTY OF MANUFACTURING ENGINEERING
2013
i
ABSTRAK
Laporan ini telah memberi tumpuan kepada penggunaan Value Stream Mapping (VSM)
dalam industri pembuatan. VSM adalah satu cara visual yang mewakili aliran maklumat
dan proses dalam pengeluaran produk. VSM membantu pengurusan untuk
menggambarkan maklumat untuk melihat hubungan antara maklumat dan aliran
material. Ia membantu untuk mengenal pasti berdasarkan tujuh sisa yang berlaku dalam
proses pengeluaran. Oleh itu, skop projek ini adalah untuk mewujudkan Negeri semasa
Nilai Stream Mapping (CVSM) dan dianalisis menggunakan model simulasi untuk
melaksanakan Negeri Masa Depan Nilai Stream Mapping (FVSM) di Pusat Perniagaan
A (BCA). Untuk menjalankan projek ini beberapa kaedah yang dirancang kaitan dengan
objektif. Data yang diperlukan seperti masa kitaran proses, berubah mengikut masa dan
downtime yang dikumpul dan hasil ini berkumpul dan analisis sebelum pernyataan
masalah yang dilakukan dan telah dibincangkan. Analisis dilakukan adalah ditentukan
oleh peratusan nilai masa ditambah kepada nilai bukan masa tambahan dan
menghubungkannya dengan sisa. Daripada analisis di sana untuk menentukan punca sisa
digunakan menggunakan sebab dan kesan gambarajah, Pareto dan mengapa analisis.
Penemuan ini adalah peluang untuk meningkatkan masa pemprosesan adalah
kebanyakannya dari nilai bukan aktiviti dan peningkatan itu menunjukkan berdasarkan
sisa dikenal pasti. Selain itu, masa proses mixing 2 juga diperbaiki dengan menggunakan
garis imbangan. Dari hasil yang dicadangkan, draf FVSM dilakukan dan simulasi yang
dicipta untuk menyokong dapatan. Berdasarkan Perlaksanaan FVSM dan simulasi
menunjukkan masa membawa jumlah boleh dikurangkan sehingga 30 peratus iaitu
sebanyak 18.46 jam. Akhir sekali, kesimpulan berdasarkan kajian yang telah dilakukan
dan cadangan yang telah dinyatakan.
ii
ABSTRACT
This report has focused on the application of Value Stream Mapping (VSM) in the
manufacturing industry. VSM is a visual way of representing the flow of information
and materials in the production of a product. VSM help management to visualize
information and material flow also can see the relationship between information and
material flow. It helps to identify the seven wastes that occur in production processes.
Hence, the scope of this project is to create Current State Value Stream Mapping
(CVSM) and analyze using the simulation model to implement the Future State Value
Stream Mapping (FVSM) at Business Centre A (BCA). For conduct this project some
methodologies are planned correlate to the objectives. The data required such as process
cycle time, change over time and its downtime is collected and the result was gathered
and analysis prior to the problem statement are done and was discussed. The analysis
done is by determining the percentage of value added time towards non value added
time and correlates it with the waste. Then analysis to determine root causes of waste are
done by using cause and effect diagram, Pareto and why analysis. The finding is the
opportunity to improve lead time is mostly from non value added activity and the
improvement was suggested based on the waste identify. Besides, the process of mixing
2 also were improved by using line balancing. From the proposed result, the draft for
FVSM is done and the simulation is created to support the finding. Based on the
implement of FVSM and in simulation show the total lead time can be reduced up to 30
percent which is about 18.46 hours. Last but not least, the conclusion based on the
studies was done and the recommendation was stated.
iii
DEDICATION
This thesis is dedicated to my parents,
Sazali Bin Che Amat and Rodziyah Bt. Mohamad
For their endless love, support and encouragement
iv
ACKNOWLEDGEMENT
First of all, all praises and thanks to Allah, Lord of the worlds for His guidance and will,
for the revelation of some of His knowledge for me in the successful of completing my
Final Year Project.
Secondly, I would like to express my deepest appreciation to my supervisor, Mr. Al
Amin Bin Mohamed Sultan for his guidance and lesson that lead me in completing this
FYP. I will never forget the contribution that he gave to me, with support,
encouragement, advice, assisting and providing information that very useful to me.
Not forget my special gratitude towards my beloved parents and my siblings for their
patient and everlasting support and advice during my up and down as student. Last but
not least, special thanks to all my lecturers, friend, and my colleague who supported me
directly or indirectly in completing this thesis.
v
TABLE OF CONTENT
Abstrak i
Abstract ii
Dedication iii
Acknowledgement iv
Table of Content v
List of Tables viii
List of Figures ix
List of Abbreviations, Symbol and Nomenclature xi
CHAPTER 1 INTRODUCTION 1
1.1 Background 1
1.2 History Background 2
1.3 Problem Statement 3
1.4 Objective 4
1.5 Scope of Study 4
1.6 Layout of Thesis 5
1.7 Conclusion 6
CHAPTER 2: LITERATURE REVIEW 7
2.1 History and Overview of Lean Manufacturing 7
2.2 Leans Principles 9
2.2.1 Identify Value 9
2.2.2 Map the Value Stream 10
2.2.3 Create Flow 10
2.2.4 Establish Pull 11
2.2.5 Seeking Perfection 11
2.3 Lean Manufacturing Tools and Techniques 11
2.3.1 Value Stream Mapping (VSM) 12
2.3.2 Kaizen 17
2.3.3 5S 18
vi
2.3.4 Kanban 20
2.3.5 Time Studies 21
2.4 Waste 22
2.5 Simulation Modeling 23
2.6 Comparison on Previous Case Study 26
2.7 Conclusion 33
CHAPTER 3: METHODOLOGY 34
3.1 Introduction to PSM 1 34
3.1.1 Background Study 37
3.1.2 Define Problem Statement 37
3.1.3 Objective and Scope 37
3.1.4 Literature Review 37
3.1.5 Determine Methodology 38
3.1.6 Create the Gantt chart 38
3.1.7 Data Gathering 41
3.1.8 Data Analysis 41
3.1.9 Current Map Value Stream Mapping 41
3.1.10 Analyze CVSM using Simulation 42
3.1.11 Future map Value Stream Mapping 42
3.1.12 Discussion and Conclusion 42
3.2 Company Background 43
3.2.1 Manufacturing Department 44
3.2.2 Tire Manufacturing Process 45
CHAPTER 4: RESULT AND DISCUSSION 46
4.1 Product Selection 46
4.1.1 Production Flow Process 47
4.1.2 Data Collection 52
4.2 Define Current State Map 62
4.2.1 Cycle Time (C/T) 62
4.2.2 Changeover Time (C/O) 62
4.2.3 Uptime 62
vii
4.3 Current Value Stream Mapping 64
4.3.1 Analysis of Current Value Stream Map 65
4.3.2 Calculation of Takt Time 66
4.4 Root Cause Analysis 68
4.4.1 High Non Value Added Time 68
4.4.2 Identification and Analysis of Waste 73
4.5 Suggestion for Improving Current Value Stream Mapping 75
4.5.1 Overproduction 75
4.5.2 Transportation 76
4.5.3 Inventory 76
4.6 Develop Draft for Future Value Stream Mapping 77
4.6.1 Pull Kanban System 77
4.6.2 FIFO system 78
4.6.3 Standardize Work 78
4.6.4 Improve Mixing 2 79
4.6.5 Proposed draft for FVSM 85
4.7 Simulation Model Using Simul8 86
4.7.1 Verification 86
4.7.2 Model Translation 87
4.7.3 Validation 88
4.7.4 Simulation Analysis 89
CHAPTER 5: CONCLUSION AND RECOMMENDATION 93
5.1 Conclusion 93
5.2 Recommendation 95
REFERENCE 96
viii
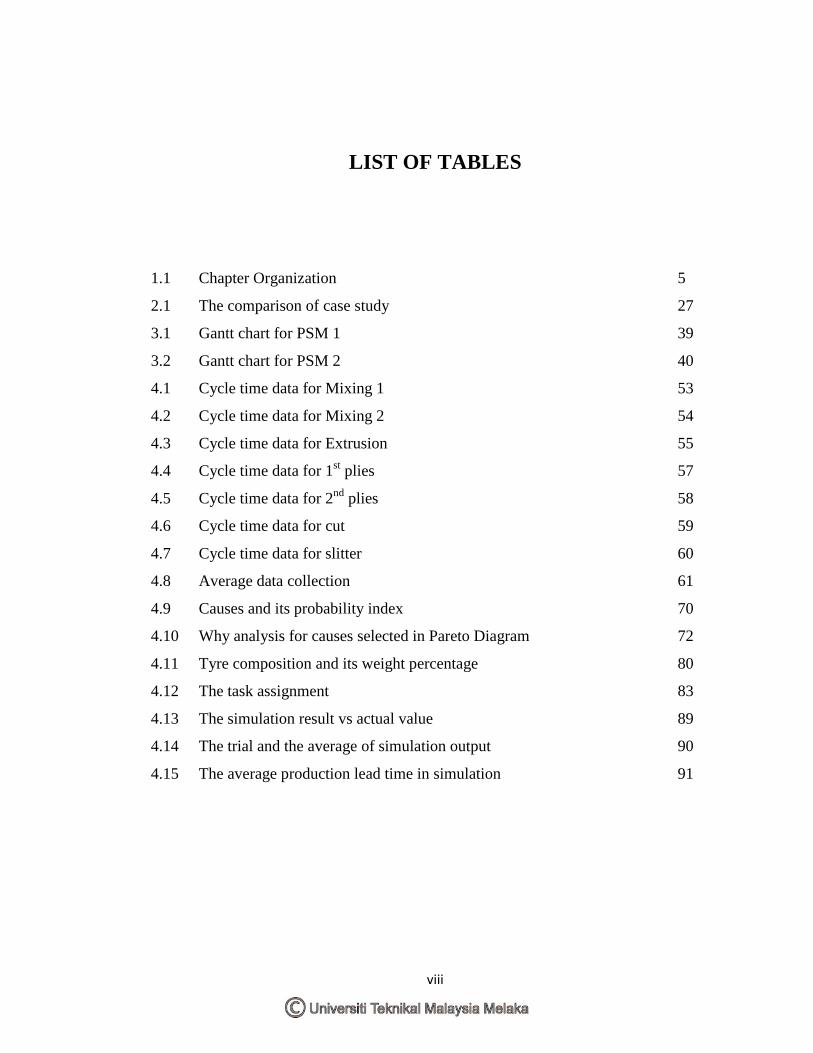
LIST OF TABLES
1.1 Chapter Organization 5
2.1 The comparison of case study 27
3.1 Gantt chart for PSM 1 39
3.2 Gantt chart for PSM 2 40
4.1 Cycle time data for Mixing 1 53
4.2 Cycle time data for Mixing 2 54
4.3 Cycle time data for Extrusion 55
4.4 Cycle time data for 1st plies 57
4.5 Cycle time data for 2nd
plies 58
4.6 Cycle time data for cut 59
4.7 Cycle time data for slitter 60
4.8 Average data collection 61
4.9 Causes and its probability index 70
4.10 Why analysis for causes selected in Pareto Diagram 72
4.11 Tyre composition and its weight percentage 80
4.12 The task assignment 83
4.13 The simulation result vs actual value 89
4.14 The trial and the average of simulation output 90
4.15 The average production lead time in simulation 91
ix
LIST OF FIGURES
2.1 The five key principles of lean thinking 9
2.2 Example of CVSM 14
2.3 Example of FVSM 15
2.4 Basic icon in VSM 17
3.1 Overall project flow chart 35
3.2 Overall report planning flow chart 36
3.3 BCA process and machine involved 44
3.4 Tire manufacturing process 45
4.1 Process flowchart for WBR radial 47
4.2 Raw material is waiting to be mixed 48
4.3 Non productive compound before mixing 2 48
4.4 Productive compound is inserted 49
4.5 Fabric is stretched 50
4.6 Process applies coating into fabric 50
4.7 The treatment that been cut 51
4.8 Process to slitter into the overlay 52
4.9 Current value stream map 64
4.10 Inventory time and processing time 65
4.11 Graph cycle time vs takt time 66
4.12 Cause and effect diagram for high WIP time 69
4.13 Pareto diagram plotted 71
4.14 Overproduction happen in BCA 74
x
4.15 Queuing time for inventory at mixing 2 75
4.16 Pull Kanban system at BCA 78
4.17 The sub processes of mixing 2 80
4.18 Time loss during sub process of mixing 2 81
4.19 The workstation separation in line balancing 83
4.20 Draft suggestion for FVSM 85
4.21 The running snapshot of simulation model 87
xi
LIST OF ABBREVIATIONS, SYMBOLS AND
NOMENCLATURE
VSM - Value Stream Mapping
CVSM - Current State Value Stream Mapping
FVSM - Future State Value Stream Mapping
PSM - Projek Sarjana Muda
JIT - Just In Time
WIP - Work In Progress
MRP - Material Requirement Planning
NUMMI - New United Motor Manufacturing Inc
FPV - Final Value Plant
AOP - Annual Operating Plan
MTD - Month to Date
WBR - Wire breaker radial
FIFO - First in first out
BCA - Business Centre A
SOP - Standard of procedure
1
CHAPTER 1
INTRODUCTION
Overview
This introductory chapter has provided some background to the research and also
explain the objective or purpose of this research based on the problem statement. Then it
also gives an overview and structure of this report and lastly conclusion from the
content.
1.1 Background
Currently, manufacturing industry has become tougher and a competitive market ever
since. Most of the company is trying hard to make sure that their business can sustain in
this situation. To sustain their business, the company used many methods to keep them
competitive and one of the methods is lean manufacturing. According to Womack et al
(1996), the lean manufacturing is a philosophy that used to improve the manufacturing
system by eliminating waste or non added value activity along the process flow.
One of the lean tools is value stream mapping (VSM) which is a tool that drawn in order
to evaluate process flow and identify the value added and non value added activities.
Then based on the current VSM, the improvement to eliminate the non value added
activity is done and future VSM is drawn based on improvement. Although in recent
years, the VSM has been used widely due to its simplicity that ease in determining the
2
loophole in the process flow, however the VSM also has the limitation which will not
reliable due to the complexity of process on the system.
That is why the researcher has included the use of simulation in enhancing the VSM
ability. This computer simulation is basically a tool that can help companies in finding
the best possible outcome based on changes done. The result of simulation can be a tool
that predicts prior the changes are implemented. By using the VSM that enhance with
simulation tool, ideal process flow of product can be achieved and thus will place the
manufacturing company keeps the competence to survive in the industry.
1.2 History Background
The history of tire industry started with metal tires and after the discovery of rubber has
led to vulcanization process by Charles Goodyear on 1839. Later begin the use of rubber
as the pneumatic bicycle tire by Robert William Thompson in 1846 and in the automobile
industry by the Michelin brothers in 1895 (Charles et al, 2011). Since that era, the tire
industry has grown tremendously ever since and estimated the tire industry encompasses
around 400 factories worldwide producing more than 1 billion profit annually.
Basically, the tire industry is divided into two markets which is the original equipment
manufacturer (OEM) market and also the replacement market. The OEM’s tires are
supplied to auto makers for the new vehicle production meanwhile the replacement
market is supplied to the tire retailer in the country. Based on the article of “Tire Trade
News” (2009), it said that despite the market volumes growing for OEM and replacement
tire are 2.3% over the seven years from 2003-2008, but it has only affected in financial
growth for just 2.1%. This situation has made the tire manufacturer are trying to find an
efficient ways to cut cost and increase efficiency by reducing waste to survive.
In this situation, this project is done based on XYZ tire manufacturing company. Like
every other big organization, the XYZ tire manufacture company has realized that the
3
world manufacturing has become tougher and challenging. That's why the XYZ tire
manufacture always looking for process improvement that will reduce their operating cost
but still produce a good quality product.
1.3 Problem Statement
As mentioned before, the automotive industry is a challenging industry since this sector
keeps on radically changes due to customer requirement for the automotive product. Day
by day new automotive product and rumours about the product are coming out. This
scenario has dragged along the XYZ tire manufacture as original equipment
manufacturer (OEM) for the automotive industry and replacement tire to become more
competent to keep competing with others tire manufacture. This situation has brought
the importance of lean manufacturing to increase production and in mean time reducing
the cost of producing a high quality tire.
The problem faced by the XYZ tire manufacturing centre is in the beginning process, the
beginning process is an important step before proceeding to another process. This is
because the raw materials are changes to product part that will assemble in becoming
radial tire. There are lots of wastes happen in the early stage of production that can
reduce the quality of assembly product before curing. Making thing worse, after curing
the final product of radial tire are scrapped because of unfamiliarities that occurs in the
early process lead to product defect.
The scenario of this problem can be eliminated by implementing the lean tool which can
eliminate the waste happen in the early process. The value stream mapping is the ideal
tool to have an overview of the process, the add value refer for process that create value
for money and the non value added that related to waste. Thus non value added need to
eliminate by having lean improvement in the system.
4
But the implementation of lean improvement such as Kaizen in manufacturing centre
can direct to high risk and make managers afraid to make changes. This situation has
brought the need of using simulation of discrete event package to analyze for future
improvement. Although by creating of current and proposed for future value stream
mapping may seem enough. But the simulation may give more understanding and
visualization towards the after implementing lean and directly lead to confidence in
positive improvement for production line.
1.4 Objective
The purpose of this study is to reduce waste in the production line by having a lean
manufacturing apply toward the process line. In order to so, the things need to be done
is:
1. To establish current state Value Stream Mapping (VSM) at Business Centre A.
2. To identify waste and analyze the VSM and opportunities for Kaizen Proposal
3. To suggest on the future state VSM and perform a simulation.
1.5 Scope of study
Basically the scope of this study is focused on the early process which is at Business
Centre A (BCA) production line. The value stream mapping will be done at BCA and
with analyzing its current value stream mapping state (CVSM) to find the non-value
added activities and waste along the process flow. Then to perform data collection that
possible and relate to be stimulated and experiment by using discrete event simulation
package. The subsequent from the result of experiment in simulation will lead to
proposal to the lean techniques to reduce waste and finally perform the future state of
value stream mapping based on the proposed improvement.
5
1.6 Layout of Thesis
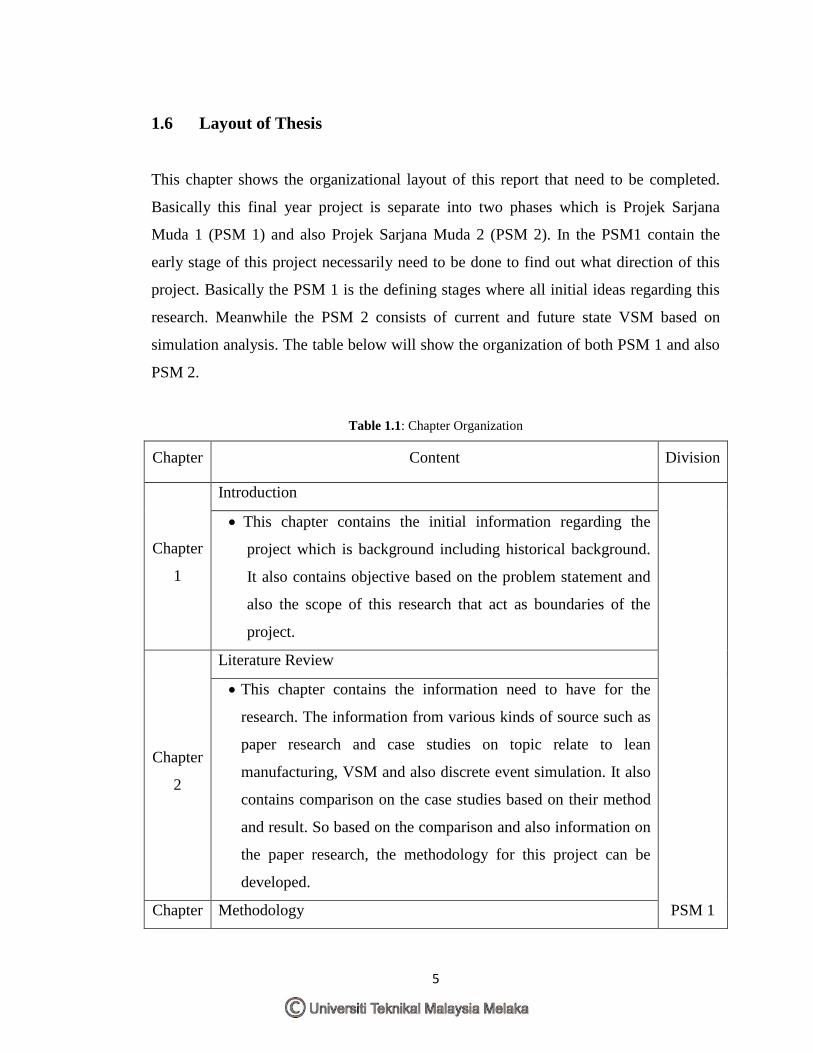
This chapter shows the organizational layout of this report that need to be completed.
Basically this final year project is separate into two phases which is Projek Sarjana
Muda 1 (PSM 1) and also Projek Sarjana Muda 2 (PSM 2). In the PSM1 contain the
early stage of this project necessarily need to be done to find out what direction of this
project. Basically the PSM 1 is the defining stages where all initial ideas regarding this
research. Meanwhile the PSM 2 consists of current and future state VSM based on
simulation analysis. The table below will show the organization of both PSM 1 and also
PSM 2.
Table 1.1: Chapter Organization
Chapter Content Division
Chapter
1
Introduction
PSM 1
This chapter contains the initial information regarding the
project which is background including historical background.
It also contains objective based on the problem statement and
also the scope of this research that act as boundaries of the
project.
Chapter
2
Literature Review
This chapter contains the information need to have for the
research. The information from various kinds of source such as
paper research and case studies on topic relate to lean
manufacturing, VSM and also discrete event simulation. It also
contains comparison on the case studies based on their method
and result. So based on the comparison and also information on
the paper research, the methodology for this project can be
developed.
Chapter Methodology
6
3 This chapter is the methodology that is done based on the
finding in the literature review. The methodology is for the
procedure guideline that needs to be done during the PSM 2
later. It also contains the company background and information
regarding the manufacturing flow in the study area.
Chapter
4
Result and Discussion
PSM 2
This chapter contains all the data collection that is needed, it is
conducted during the conducted research in the XYZ tire
manufacture. This chapter also will contain the current value
stream mapping (CVSM) at the research target area.
This section contains the result and explanation regarding data
analysis and the analysis done to achieve the objective of the
research. It includes the simulation and also the future state of
value stream mapping (FVSM).
Chapter
5
Conclusion and Recommendation
This section consists of overall concluding comment on the
study in term of approach and also result. The shortcoming or
finding of the research will also be addressed as well as the
recommendation for the improvement.
1.7 Conclusion
This chapter concludes the overview of this study by stating the objective, scope of the
study, and methodology. The objective has addressed the direction of the study while
from the scope of study and the critical parameter was specified. Lastly the arrangement
of the study was briefly explained that also act as guideline for the study done.
7
CHAPTER 2
LITERATURE REVIEW
Overview
This chapter is made based on reviews of the existing research that related to project title
such as lean manufacturing, value stream mapping, simulation and others important
factor that correlate to project title. Besides, in this chapter also contain information and
discussion that were relevant and need to consider before beginning the project.
2.1 History and Overview of Lean Manufacturing
The lean manufacturing begins when the westerner has realized the potential of Japanese
car maker in producing a car with a mass production of high quality product at a lower
cost. Lean is derived from the Toyota Production System and been adapted by the
western in their work culture called lean manufacturing and was famously studied with
them for that. The produce of the book relates to lean by to Womack et al (1991) title
“The machine that changed the world, the story of lean production” that has made the
mindset of US manufacturer to change.
Previously, there is a huge gap between Japanese and Western automotive industry. But
the study based on Toyota great success at NUMMI (New United Motor Manufacturing
Inc.) That made a Western automotive industry gap with the Japanese to become closed.
8
It is important because the Japanese companies have already developed their
manufacturing system to a level of production at less human effort, less capital
investment, less flooring space, tool, material and time that conclude to a less overall
expense (Womack et al, 1991).
The meaning of lean represents a whole system that makes use of fewer inputs in order
to create the same output compared to those created by the traditional mass production
system. Meanwhile Marchwinski et al (2004) clarifies that lean is a production system
for managing and organizing the product development, operations, suppliers and
customer related by reducing the 7 waste. When compared to the previous system of
mass production, then lean in manufacturing will make products with fewer defects that
achieved the demand require.
The usage of this lean philosophy can be done with focus on reducing waste in
manufacturing by operation management control. The 7 types of waste that need to be
eliminated is transportation, inappropriate process, motion, waiting, over processing,
unnecessary inventory and also defect. Lean also can be understood to a concept of
value which refers value in customer perspective that differs from the traditional
production point of view (Carreira, 2005).
In explanation, the value is divided into two which is value added and non value added.
Activity that customer willing to pay is referred as value added where the product or
service undergo a process which transform them into a more complex state towards
finish product. Meanwhile the non value added literally activity that the customer does
not want to pay because the activity does not change the product or service into another
thing but remain same for example inventory stage. To understand better on lean
manufacturing, first one need to be acquainted with the basic principle and techniques as
listed below.
9
2.2 Lean Principle
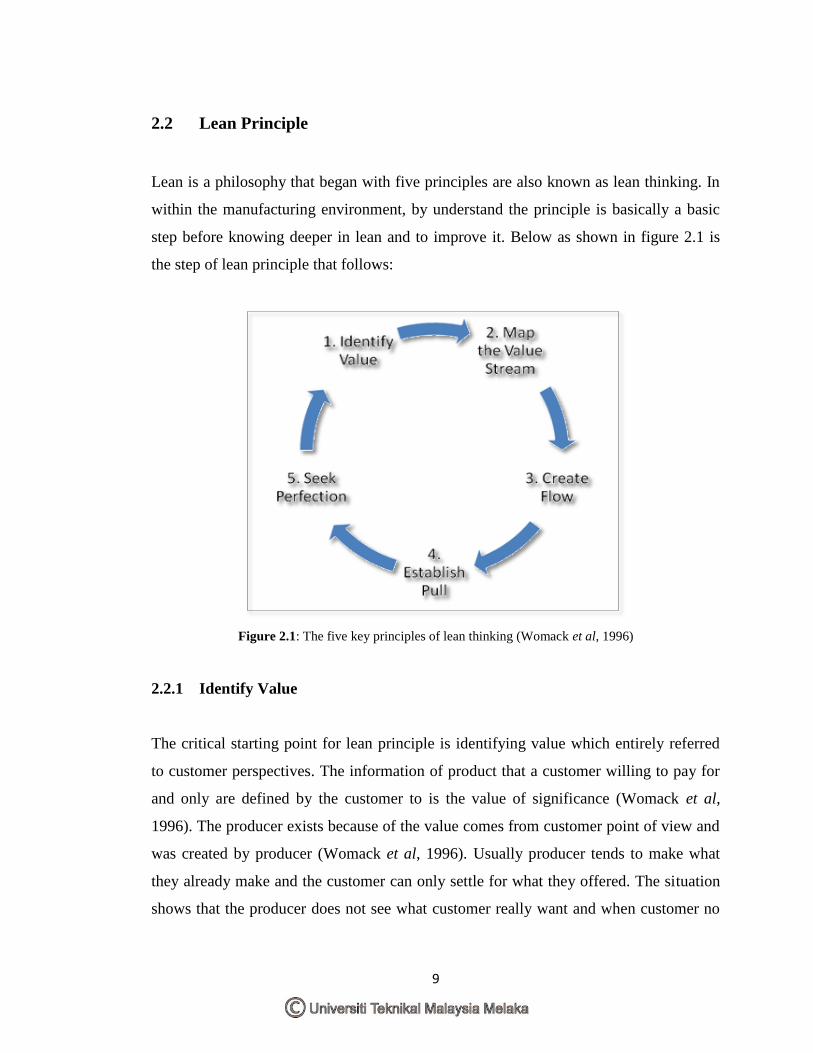
Lean is a philosophy that began with five principles are also known as lean thinking. In
within the manufacturing environment, by understand the principle is basically a basic
step before knowing deeper in lean and to improve it. Below as shown in figure 2.1 is
the step of lean principle that follows:
Figure 2.1: The five key principles of lean thinking (Womack et al, 1996)
2.2.1 Identify Value
The critical starting point for lean principle is identifying value which entirely referred
to customer perspectives. The information of product that a customer willing to pay for
and only are defined by the customer to is the value of significance (Womack et al,
1996). The producer exists because of the value comes from customer point of view and
was created by producer (Womack et al, 1996). Usually producer tends to make what
they already make and the customer can only settle for what they offered. The situation
shows that the producer does not see what customer really want and when customer no