universiti teknikal malaysia...
TRANSCRIPT

UNIVERSITI TEKNIKAL MALAYSIA MELAKA
DEVELOPING A METHODOLOGY FOR PRODUCTIVITY
IMPROVEMENT IN A MANUFACTURING COMPANY
This report submitted in accordance with requirement of the Universiti Teknikal
Malaysia Melaka (UTeM) for the Bachelor Degree of Manufacturing Engineering
(Manufacturing Management)
by
GOH MERYIN
B050710017
FACULTY OF MANUFACTURING ENGINEERING
2011
UNIVERSITI TEKNIKAL MALAYSIA MELAKA
BORANG PENGESAHAN STATUS LAPORAN PROJEK SARJANA MUDA
TAJUK: DEVELOPING A METHODOLOGY FOR PRODUCTIVITY IMPROVEMENT IN A MANUFACTURING COMPANY
SESI PENGAJIAN: 2010/11 Semester 2
Saya GOH MERYIN
mengaku membenarkan Laporan PSM ini disimpan di Perpustakaan Universiti Teknikal Malaysia Melaka (UTeM) dengan syarat-syarat kegunaan seperti berikut:
1. Laporan PSM adalah hak milik Universiti Teknikal Malaysia Melaka dan penulis. 2. Perpustakaan Universiti Teknikal Malaysia Melaka dibenarkan membuat salinan
untuk tujuan pengajian sahaja dengan izin penulis. 3. Perpustakaan dibenarkan membuat salinan laporan PSM ini sebagai bahan
pertukaran antara institusi pengajian tinggi.
4. **Sila tandakan (√)
SULIT
TERHAD
TIDAK TERHAD
(Mengandungi maklumat yang berdarjah keselamatan atau kepentingan Malaysia yang termaktub di dalam
AKTA RAHSIA RASMI 1972)
(Mengandungi maklumat TERHAD yang telah ditentukan
oleh organisasi/badan di mana penyelidikan dijalankan)
Disahkan oleh:
** Jika Laporan PSM ini SULIT atau TERHAD, sila lampirkan surat daripada pihak berkuasa/organisasi berkenaan dengan menyatakan sekali sebab dan tempoh laporan PSM ini perlu dikelaskan sebagai
SULIT atau TERHAD.
Alamat Tetap:
NO. 19 Jalan Emas 2,
Off Jalan Raya Barat,
41000 Klang, Selangor.
Tarikh: _________________________
Cop Rasmi: Tarikh: _______________________

DECLARATION
I hereby declare that this report entitled “Developing A Methodology For
Productivity Improvement In A Manufacturing Company” is the result of my
own research except as cited in the references.
Signature :
Author’s Name : GOH MERYIN
Date : 14th
April 2011
APPROVAL
This report is submitted to the Faculty of Manufacturing Engineering of UTeM as a
partial fulfillment of the requirements for the degree of Bachelor of Manufacturing
Engineering (Manufacturing Management). The member of the supervisory
committee is as follow:
…………………………….............
Supervisor
i
ABSTRAK
Produktiviti dalam sesebuah syarikat adalah penting untuk menentukan keseluruhan
prestasi syarikat tersebut. Untuk menetapkan atau memperbaik produktiviti prestasi
dalam keadaan yang memuaskan, sesetengah syarikat contohnya “Multinational
Companies (MNCs)” mengadakan perbaikan produktiviti activiti untuk mengenali
punca-punca yang menyumbang kepada keburukan produktiviti prestasi. Walau
bagaimanupun, syarikat-syarikat tempatan (SMEs) tidak mempunyai kebolehan and
peluang untuk memperbaik produktiviti syarikat-syarikatnya akibat daripada
kekurangan sumber kepakaran and pengetahuan. Oleh itu, kajian ini member focus
dalam membina metodologi yang betul untuk memperbaik produktiviti di dalam
syarikat pembuatan. Tujuan kajian ini juga untuk membina prosedur langkah demi
langkah mengenai penggunaan alat memperbaik produktiviti. Teras kajian ini juga
untuk membina satu buku panduan mengenai cara penggunaan alat memperbaik
produktiviti berdasar kepada alat memperbaik produktiviti yang telah dicadangkan.
Kajian terhadap alat ini dijalankan berdasar kepada informasi diperoleh daripada
“journals” dan laman web. Metodologi dalam laporan ini menunjukkan aliran
integrasi alat memperbaik produktiviti yang akan digunakan oleh SMEs. Metodologi
ini akan membantu SMEs dengan memberi pengetahuan kepada syarikat-syarikat
tersebut mengenai cara-cara untuk memperbaik produktiviti sejak alat-alat ini telah
berjaya memperbaik produktiviti syarikat-syarikat MNCs.

ii
ABSTRACT
Productivity in a company is essential due to determine the overall performance of
the company. In order to maintain or improve the performance of productivity at
good condition, some companies such as Multinational Companies (MNCs)
conducted productivity improvement activities to identify the root causes that
contribute to the poor productivity performance. However, small and medium
enterprises (SMEs) do not have the capabilities and chances to improve their
productivity due to lack of expertise and knowledge. Hence, this study focuses on
developing a proper methodology for productivity improvement in a manufacturing
company. The aim of this study is to develop the step-by-step procedures on how to
use the productivity improvement tools. The essence of this study is to develop a
handbook or manual instruction of productivity improvement methodology using the
proposed productivity improvement tools. The research on the tools will be carried
out through findings from journals and websites. The methodology presented in the
report shows the flow of integrated productivity improvement tools that will be used
by the SMEs. The methodology will help the SMEs by giving them the knowledge
on how to improve the productivity since the tools have successfully improved the
productivity in MNCs.
iii
ACKNOWLEDGEMENT
First and foremost, I would like to heartily thankful to my supervisor, Associate
Professor Chong Kuan Eng, whose invaluable guidance, advice, and assistance from
the initial to the final level enabled me to develop an understanding of this project.
He inspired me greatly to work on this project. His willingness to motivate me
contributed tremendously to my project. I appreciate the knowledge and advices that
has gained from my supervisor. He has given me valuable cooperation, assistance,
support and suggestion during this completion of project.
Lastly, I would like to thank my family and friends who have giving me the supports
and motivation to carry on from the beginning of this project until the completion of
this project submission.

iv
DEDICATION
I would like to convey my appreciation to my parents, siblings, and
friends who have been giving me their moral supports continuously
throughout my entire life.
Thank you for the undivided loves and supports.
May God bless them for their positive supports which give me
motivation to excellence in my future undertakings.
v
TABLE OF CONTENT
Abstrak i
Abstract ii
Acknowledgement iii
Dedication iv
Table of Content v
List of Tables ix
List of Figures xi
List of Abbreviations xiii
1. INTRODUCTION 1
1.1 Problem Statement 2
1.2 Objectives 3
1.3 Scope 3
2. LITERATURE REVIEW 4
2.1 Work Measurement 5
2.1.1 Stopwatch Time Study 5
2.1.1.1 Observed Time (OT) 7
2.1.1.2Normal Time (NT) 8
2.1.1.3 Standard Time (ST) 8
2.2 Standardized Work 9
2.2.1 Takt Time 10
2.2.2 Work Sequence 12
2.2.3 In-Process Stock 12
2.2.4 Production Capacity Chart 13
2.2.5 Standardized Work Combination Table 14
2.2.6 Standardized Work Chart 18
2.2.7 Job Element Sheets 19
2.2.8 Manpower Reduction 21

vi
2.3 Statistical Process Control (SPC) 23
2.3.1 Pareto Chart 23
2.4 Application in Industry 25
2.5 Challenges Face by the SMEs in Malaysia 27
2.6 Summary of Literature Review 29
3. METHODOLOGY 31
3.1 Define Problem, Scope of Project and Objectives 32
3.2 Literature Review 32
3.3 Design the Project Methodology 32
3.4 Identify Productivity Improvement Tools 33
3.4.1 Statistical Process Control (SPC) 33
3.4.2 Work Measurement 33
3.4.3 Standardized Work 34
3.5 Develop Procedures on How to Apply the Tools 34
3.5.1 Statistical Process Control (SPC) 34
3.5.2 Work Measurement 34
3.5.3 Standardized Work 35
3.6 Develop Software 35
3.7 Compile All Procedures and Software 36
3.8 Discussion and Conclusion 36
4. DEVELOPING A PRODUCTIVITY IMPROVEMENT
METHODOLOGY 37
4.1 Choose an Assembly Line 39
4.2 Identify Family of Products 39
4.3 Pareto Chart 39
4.4 Takt Time 49
4.5 Stopwatch Time Study 51
4.6 Standardized Work Chart 72
4.7 Standardized Work Combination Table 76
4.8 Operator Balance Chart 84
4.9 Production Capacity Chart 92
vii
4.10 Kaizen Activities 100
4.11 Summary 102
5. RESULTS AND DISCUSSION 103
5.1 Example of Data from Automotive Industry to Test the Productivity
Improvement Tools 103
6. CONCLUSIONS AND RECOMMENDATIONS 111
6.1 Conclusion 111
6.2 Limitations 113
6.3 Recommendations 113
REFERENCES 114
BIBLIOGRAPHY 117
APPENDICES
A PSM 1 Gantt Chart
B PSM 2 Gantt Chart
C Stopwatch Time Study – Piston Rod Assembly
D Stopwatch Time Study – Final Seam Welding and Gas Filling
E Stopwatch Time Study – Damping Force Checking and Outer Shell Welding
F Stopwatch Time Study – Bush Fitting
G Standardized Work Chart – Piston Rod Assembly
H Standardized Work Chart – Final Seam Welding and Gas Filling
I Standardized Work Chart – Damping Force Checking and Outer Shell
Welding
J Standardized Work Chart – Bush Fitting
K Standardized Work Combination Table – Piston Rod Assembly
L Standardized Work Combination Table – Final Seam Welding and Gas
Filling
viii
M Standardized Work Combination Table – Damping Force Checking and
Outer Shell Welding
N Standardized Work Combination Table – Bush Fitting

ix
LIST OF TABLES
2.1 Standard symbols used in Standardized Work Combination Table 16
4.1 Quantity of each product for March 40
4.2 A table with Model, Quantity and Cumulative Volume column 40
4.3 Complete cumulative volume table 41
4.4 Description for Figure 4.3 42
4.5 Description for Figure 4.5 44
4.6 Description for Figure 4.8 46
4.7 Description for Figure 4.10 47
4.8 Description for Figure 4.11 48
4.9 Total time of each break per day 49
4.10 Types of processes in each workstation 51
4.11 Description for Figure 4.13 54
4.12 Steps to simplified the defined tasks and fill the tasks into Microsoft
Excel 2007 54
4.13 Time recording of each defined step 56
4.14 Summary of time taken for each defined step and total one cycle time 58
4.15 Description about Figure 4.14 60
4.16 Description about Figure 4.15 60
4.17 Summary of three machine cycle times for AA, BB and CC machines 62
4.18 Minimum formula at column M16 64
4.19 Minimum formula at column M18 to M26 64
4.20 Range formula 65
4.21 Allowance factor formula at column P16 66
4.22 Standard time calculation 66
4.23 Compute standard time at column O 67
4.24 Formula inputting for final cycle time 68
4.25 Average formula for machine AA, BB and CC 68
4.26 Description about Complete Time Study Sheet 72
4.27 Description about Standardized Work Chart 73
x
4.28 Description about the Standardized Work Combination Table 78
4.29 Description about the illustration in Figure 4.22 81
4.30 Description about the Figure 4.23 83
4.31 Description about the Figure 4.24 85
4.32 Time Study for each workstation in assembly line 86
4.33 Description about the Figure 4.26 87
4.34 Description about the Figure 4.27 88
4.35 Description about developing Takt time chart 89
4.36 Description about the Figure 4.30 90
4.37 Description about Production Capacity Chart 93
4.38 Time Study for every process 94
4.39 Set-up time for every machine in Assembly Line 1 95
4.40 Formula inputting at Excel for every machine 97
4.41 Description to change fraction into integer 99
5.1 5 workstations with 9 processes 106
xi
LIST OF FIGURES
2.1 One of the examples of Time Study sheet 6
2.2 Work sequence 12
2.3 One of the examples of Production Capacity Chart 14
2.4 One of the examples of Standardized Work Combination Table 17
2.5 One of the examples of Standardized Work Chart 18
2.6 One of the examples of Job Element Sheet 20
2.7 One of the examples of Operator Balance Chart to compare Cycle
Time to Takt Time in unstable state 22
2.8 One of the examples of Operator Balance Chart to compare Cycle
Time to Takt Time in stable state 23
2.9 One of the examples of Pareto Chart 24
2.10 Pareto Chart used to identify root causes 25
2.11 Standard Work as one of the improvement tools being applied in
Royal Bolton Hospital 26
3.1 Flowchart of project planning 31
4.1 Flow of productivity improvement 38
4.2 Cumulative volume calculation 41
4.3 Build Pareto Chart in Microsoft Excel 2007 42
4.4 Bar graph of Pareto Chart 42
4.5 Change the graph details in Select Data Source 43
4.6 Final display of Select Data Source Window 44
4.7 Quantity bar graph of Pareto Chart 45
4.8 Build cumulative volume graph 45
4.9 Cumulative volume graph (red) with quantity graph (blue) 46
4.10 Change bar graph to line graph 47
4.11 Change the chart type from bar to line 47
4.12 Final Pareto Chart 48
4.13 Time Study Sheet in Microsoft Excel 2007 53

xii
4.14 One Cycle Time for AA, BB, Assy, and CC processes 59
4.15 10 cycle times in a Time Study Sheet 61
4.16 Machine cycle times for AA, BB and CC machines 63
4.17 Complete Stopwatch Time Study Sheet in Microsoft Excel 2007 71
4.18 Build Standardized Work Chart in Microsoft Excel 2007 73
4.19 Illustration of machine layout with movement of worker in the
assembly line 74
4.20 Standardized Work Combination Table in Microsoft Excel 2007 77
4.21 Defined steps, manual time, automatic time (machine), and walking time 79
4.22 Illustration of manual time, automatic time and walking time 80
4.23 Final Standardized Work Combination Table 82
4.24 Build table in Microsoft Excel 2007 85
4.25 Table with complete information 86
4.26 Steps to build Operator Balance Chart 87
4.27 Change the details of displayed chart 88
4.28 Build Takt time on Operator Balance Chart 89
4.29 Takt time chart with Operator Balance Chart 90
4.30 Change bar to line chart 90
4.31 Final Operator Balance Chart 91
4.32 Build a table in Microsoft Excel 2007 92
4.33 Manual time and machine time in Production Capacity Chart 94
4.34 Interval between changes (column H) and time taken for set-up
(column I) 96
4.35 Change fraction values to integer values in Microsoft Excel 2007 98
4.36 Final Production Capacity Chart 99
5.1 Family of products and respective quantity for one month 104
5.2 Pareto Chart for SA Line 2 104
5.3 Stopwatch Time Study sheet for Workstation 1 106
5.4 Layout of machines and motion of worker in Workstation 1 107
5.5 Standardized Work Combination Table for Workstation 1 108
5.6 Operator Balance Chart for SA Line 2 108
5.7 Production Capacity Chart for SA Line 2 109
xiii
LIST OF ABBREVIATIONS
2-D - 2-Dimensional
APEC - Asia-Pacific Economic Cooperation
ASSY - Assembly
BF - Bush Fitting
BPS - Boeing Production System
BSW - Base Seam Welding
CT - Cycle Time
DFC - Damping Force Checking
FSW - Final Seam Welding
GUI - Graphical User Interface
HPC - High Pressure Cleaning
JES - Job Element Sheets
MNC - Multinational Company
MRS - Manufacturing-Related Services
NT - Normal Time
OEE - Overall Equipment Effectiveness
OSW - Outer Shell Welding
OT - Observed Time
PPE - Personal Protective Equipment
PRA - Piston Rod Assembly
QC - Quality Control
SA - Shock Absorber
SIPS - Standard In Process Stock
SME - Small and Medium Enterprises
SMED - Single Minute Exchange Die
SMI - Small and Medium Industries
SMIDEC - Small and Medium Industries Development Corporation
SMIDP - Small and Medium Industries Development Plan
SPC - Statistical Process Control
ST - Standard Time

xiv
TPM - Total Preventive Maintenance
TPM - Total Production Maintenance
TQC - Total Quality Control
TQM - Total Quality Management
WIP - Work-In-Process

1
CHAPTER 1
INTRODUCTION
Productivity is a measure of the ratio between the output of a process and the input of
resources needed for it. It is usually expressed as output divided by input. The more
productive each of those resources can be manufactured, the lower the final cost of
the product because cost of any product or service is the sum of the costs of
resources used in manufacturing it. In a free market, the lower the cost of a product,
the higher the demand of products will generate and more profitable the enterprise
will generate. There are four ways to improve productivity by maintaining input but
increasing output, decreasing input but maintaining output, and decreasing input but
increasing output.
Today, no organization or enterprise can bear the ignorance of constant need to
improve productivity and no any employee can evade his/ her responsibility for
playing their part in the work of productivity improvement. It is not difficult to do
the productivity improvement once the basic of measurement, standard setting, and
method improvement is known.
Productivity improvement is significant to manufacturing company in order to
optimize the operations, use fewer resources and eliminate wastes. By optimizing the
operations using fewer resources, it helps the company to reduce the cost of a
product as well as eliminate wastes. It is imperative for any manufacturing company
to optimize their operations to compete in an ever-increasing competitive economy.
In Multinational Corporations (MNCs) especially Japan, has been widely practicing
the productivity improvement concept by manufacturing products according to
number of orders rather than mass production. Although manufacture in a low

2
quantity, it able to fulfill the demand of the customers and successfully to build its
brand name worldwide. According to Kikuchi (2006), Japan has developed a number
of methods and approaches for improving the quality and productivity of industry
such as Five S’s (5S), Quality Control (QC) circle, Total Quality Control and Total
Quality Management (TQC/ TQM), Kaizen, and Toyota’s Production System (Just-
In-Time system and Kanban system) have attracted the Western countries and
developing countries.
The purpose of this project is about developing a methodology for productivity
improvement in a manufacturing company. This project focuses on improving the
productivity of an assembly line at a manufacturing company by using productivity
improvement tools. A methodology comprises of systematic procedures on using the
productivity improvement tools is developed as a reference for implementation in
manufacturing companies.
The purpose of developing this methodology is to help the manufacturing companies
to stay competitive and improve their productivity. This methodology will consist of
productivity improvement procedures such as problem identification in an assembly
line, methods for pilot study, and applying improvement tools to eliminate wastes,
and increase the productivity and profits. The proposed methodology is the basic
productivity improvement procedure which has been mostly applied by the Japanese
Multinational Corporations.
1.1 Problem Statement
Many manufacturing companies in Malaysia comprise of small and medium
enterprises (SMEs). For Malaysia’s future development, these SMEs play an
important role to contribute to the country’s economy by providing the foundation
for the growth of new industries while strengthening existing ones. To achieve
sustainable growth, it is imperative for these SMEs to improve the quality and
productivity to remain competitive in the global market. However, the small size and
limited resources remain obstacles to productivity improvement in small and medium
3
sized enterprises in Malaysia. The companies may not have the expertise and
knowledge to identify and implement suitable strategies, concepts and methods to
improve their operations.
The development of a methodology will provide some guidelines for these
companies to implement a systematic approach to improve their quality of their
products and productivity of the operations.
1.2 Objectives
The objectives of this project are:
1. To understand various methods and tools used for productivity improvement.
2. Develop a productivity improvement methodology for a generic
manufacturing company.
3. To test the proposed methodology with sample data.
4. To develop user instruction manual and software for the proposed
methodology.
1.3 Scope
The scope of this project is to develop a productivity improvement methodology for
a semi-automated or manual assembly line in a manufacturing company. In this
project, several productivity improvement tools are employed and explained in detail
using some examples. Application of the tools will be explained step-by-step and
software for the tools will be developed using Microsoft Excel 2007. Other aspects
such as production planning, scheduling, financial analysis, forecast, material flow,
value stream, lean, simulation, and optimization will not be covered in this project.

4
CHAPTER 2
LITERATURE REVIEW
In Malaysia, an enterprise will be classified as a small and medium enterprise (SME)
based on the number of employees or annual sales turnover (Secretariat to National
SME Development Council, 2005). The definitions of SME can be applied for the
following sectors such as Primary Agriculture, Manufacturing (including agro-based),
Manufacturing-Related Services (MRS), and Services (including Information and
Communications Technology). Based on the studies carried out by Saleh and
Ndubisi (2006), Malaysian SMEs still face many domestic and global challenges in
achieving economies of scale and competing internationally.
In this chapter, it will review about the Work Measurement, Standardized Work, and
Statistical Process Control that contribute to the incremental of productivity level in a
SME. Productivity improvement has become an essential aspect for a company to
strive into international markets. Productivity improvement in a company is a
function and a result of management efficiency, and is synonymous with good
management. Productivity improvement recognizes interrelationship between the
elements of the system and its environment. Thus, productivity improvement needs
strategies in decisions and plans to achieve long-term productivity improvement
goals. However, there are no productivity tools that are right. The tools may work for
the one organization at a time but inappropriate for another organization. Lastly, this
chapter will review the application of productivity improvement tools which have
been applied in the MNCs and the challenges face by the SMEs in Malaysia.
5
2.1 Work Measurement
Work measurement is the use of accurate observation and recording to determine the
time it would take for a qualified worker to complete a specific job to a required
level of performance. These are also time studies. Times can be measured by
synthetic timing; the time for each component of a job is measured, pre-determined
motion time study; the times for different human motions required for the job are
added up to arrive at an overall time, and analytical estimating; used when there are
non-repetitive one-off jobs. Time measurement entails breaking a process into its
procedures and measuring the instant each procedure starts and ends. The required
steps are:
Familiar with the process area and environments.
Draft the process area layout.
Show the work sequence.
Write the work procedures.
Measure the total cycle time (at least ten times).
Measure the time for each work procedure (at least ten times).
Identify and measure irregular work (unusual task occurrence).
Write the Standardized Work Analysis Chart and Standardized Work
Combination Table.
The times are calculated from knowledge of the operations and skills required.
2.1.1 Stopwatch Time Study
According to Fred E. Mayers (1992), time study was developed by Frederick W.
Taylor in about 1880 which he is the first person to use a stopwatch to study and
measure work content with his purpose to define “a fair day’s work”. Stopwatch time
study is the work measurement to determine the baseline for future improvement and
used to analyze a specific process by qualified workers in an effort to find the most
efficient ways in terms of time. The equipment used is stopwatch due to accuracy in
developing data of time.
6
Time Study has been widely used to determine the productivity levels and production
job schedules. In Time Study, performance rating is needed for equitably
determining the time required to perform a task by the normal operator after the
observed values of the operation under study have been recorded. Allowance factor
in Time Study is calculated as an addition of an allowance to take care of the many
interruptions, delays, and slowdowns brought on by fatigue which enters into every
work assignment.
A normal operator’s Time Study is recorded due to as a qualified, thoroughly
experienced operator who is working under conditions as they customarily prevail at
the workstation, at a pace that is neither fast nor slow, but representative of average.
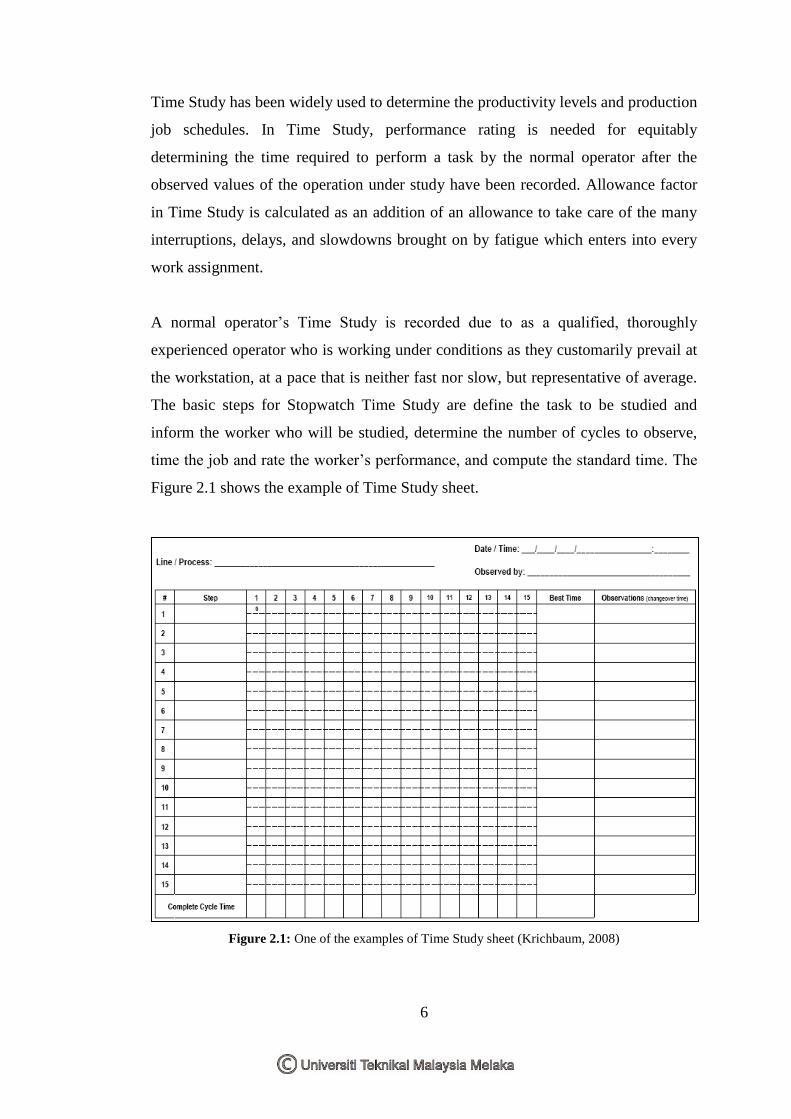
The basic steps for Stopwatch Time Study are define the task to be studied and
inform the worker who will be studied, determine the number of cycles to observe,
time the job and rate the worker’s performance, and compute the standard time. The
Figure 2.1 shows the example of Time Study sheet.
Figure 2.1: One of the examples of Time Study sheet (Krichbaum, 2008)