the study of polymer material characterisation …journalarticle.ukm.my/10211/1/2.pdfjurnal...
TRANSCRIPT
Jurnal Kejuruteraan 28(2016): 9-18
The Study of Polymer Material Characterisation UsingM-Z-N Statistical Analysis Method
(Kajian Pencirian Bahan Polimer Menggunakan Kaedah Analisis Statistik M-Z-N)
Muhamad Arif Fadli Ahmad, Mohd Zaki Nuawi*, Nadia F. Mohamed, Zaliha Wahid & M. Dirhamsyah
ABSTRACT
This paper proposes an implementation of alternative statistical signal analysis method in characterising material properties of polymer using impulse excitation technique (IET) in accordance with ASTM E1876 standard. Five types of cylindrical shape polymer specimens are used, namely acrylics (AC), poly vinyl chloride (PVC), polyethylene (PE), cast nylon (MC), and polyoxymethylene (POM). Experimental procedure is done based on non-destructive testing (NDT) concept by tapping the specimens using an impact hammer within a specific range of impact force, while accelerometer sensor Endevco 751-100 is used to detect the vibration produced. The detected vibration and the impact force signal which is triggered by impact hammer are captured using NI 9234 data acquisition device and computer. The signal is interpreted and statistically analysed using Mesokurtosis Zonal Non-parametric (M-Z-N) analysis method. As a result, mathematical model equations for determining two material properties which are tensile strength and thermal conductivity have been successfully developed. They are derived through correlation between the signal data and M-Z-N coefficient. Verification of the equation is done and the calculated errors to be in the range of 5.55% to 9.74%. Hence, this proves that the correlation can be used as a standard for determining these material properties through M-Z-N method, which is efficient and low cost.
Keywords: M-Z-N; impulse excitation technique; non-destructive testing; material characterisation; vibration signal
ABSTRAK
Kertas kerja ini membincangkan pelaksanaan kaedah analisis statistik alternatif dalam mencirikan sifat-sifat bahan polimer dengan menggunakan teknik pengujaan impulsif (IET) berasaskan piawaian ASTM E1876. Lima jenis spesimen polimer berbentuk silinder digunakan iaitu akrilik (AC), poli vinil klorida (PVC), polietilena (PE), nilon tuang (MC), dan polioksimetilena (POM). Prosedur eksperimen dilakukan berdasarkan konsep ujian tanpa musnah dengan mengetuk specimen-spesimen tersebut menggunakan tukul impak mengikut julat daya impak yang tertentu, manakala penderia meter pecut Endevco 751-100 pula digunakan untuk mengesan getaran yang terhasil. Getaran yang dikesan dan juga isyarat daya impak yang dicetuskan oleh tukul impak ditangkap dengan menggunakan pemeroleh data NI 9234 dan komputer. Isyarat itu kemudiannya ditafsir dan dianalisis secara statistik menggunakan kaedah Mesokurtosis Zonal Nonparametric, M-Z-N. Hasilnya, persamaan model matematik bagi memperolehi dua sifat bahan iaitu kekuatan tegangan dan kekonduksian terma telah berjaya dikenalpasti. Ia diperolehi melalui kolerasi antara data isyarat dengan pekali M-Z-N. Pengesahan persamaan tersebut telah dilakukan dan kiraan ralat berada dalam julat 5.55% hingga 9.74%. Oleh itu, ini membuktikan bahawa proses kolerasi boleh digunakan sebagai satu piawai dalam menentukan sifat-sifat bahan tersebut melalui kaedah analisis M-Z-N, di mana ianya cekap dan berkos rendah.
Kata kunci: M-Z-N; teknik pengujaan impulsif; ujian tanpa musnah; pencirian bahan; isyarat getaran
INTRODUCTION
Knowledge on the properties and behaviour of materials is fundamental for engineers, as the compatibility of the materials with certain applications must be met before used. The study of material characterisation is important in knowing more about the behaviour of materials so that the utilisation of the materials could be varied and used to the utmost potential (Tan et al. 2011). Material characterisation is widely applied in the area of failure analysis to prevent engineering breakdown especially undesirable catastrophic
and cascading ones. In the area where safety, reliability and quality control are highly considered, the continuous development of analysis technique and measurement technology for materials characterisation becomes inevitable.
Characterisation of material refers to a description of the composition and structure a certain kind of material that involves the study and usage of the material properties, along with sufficient of material reproduction of the material (Groves & Wachtman 1985). Among the factors,
10
the success of this process is the availability of material characterisation in various techniques for carrying out the scope and knowledge so that it can be applied and implement efficiently in the field of materials engineering.
Materials properties and their behaviour are generally determined using 2 testing methods, which are destructive and non-destructive test (NDT). For destructive test, the behaviour of the sample is tested under different loads until material is ultimately fail or broken. Meanwhile, NDT concept is used to define or accessed the properties or behaviour of the material without failing, broken or damaging the sample. Therefore, non-destructive method is preferred by the researchers as the same sample can be re-used time after time for further test without fail. Besides, the test can be done with low cost, precise and no constraint in size and geometry. (Alfano & Pagnotta 2007)
Impulsive excitation technique (IET) is one of the NDT methods that used to measure the natural frequency, based on the vibration analysis of specimens by gently tapping using small hammer or any automated tapping device. By using this technique, researchers can measure the elastic properties of materials such as elastic modulus, shear modulus and Poisson’s ratio. (dos Santos et al. 2013; Węglewski et al. 2013)
Generally, material properties can be measured using conventional methods on certain industrial machines. For example, tensile or yield strength can be obtained by universal testing machine, while transient plane source methods can be used to identified thermal conductivity of certain materials. (Dupleix et al. 2013; Ramesh et al. 2013) However, these conventional methods require expensive equipment and experimental set-up. The limitation of shape and dimensions of specimens for each types of machine for experiment as well as the complex working principle of the experimental methods also contribute to increase of cost and time. (Tognana et al. 2010)
The paperwork describes an alternative method for characterising tensile strength and thermal conductivity of materials based on impulsive excitation technique. It is carried out on polymer materials to obtain the vibration data signal and alternative statistical analysis method, Mesokurtosis Zonal Nonparametric (M-Z-N) have been applied for further investigation. The past studies had also using the same technique, where they used M-Z-N analysis method combining with Integrated Kurtosis-Based Algorithm for Z-filter (I-kazTM) technique to characterise the fatigue strength and young modulus properties of metallic materials, by correlating the M-Z-N and I-kazTM coefficients with vibration and acoustic signal. (Nuawi et al. 2013; Nuawi et al. 2014)
METHODOLOGY
EXPERIMENTAL SETUP
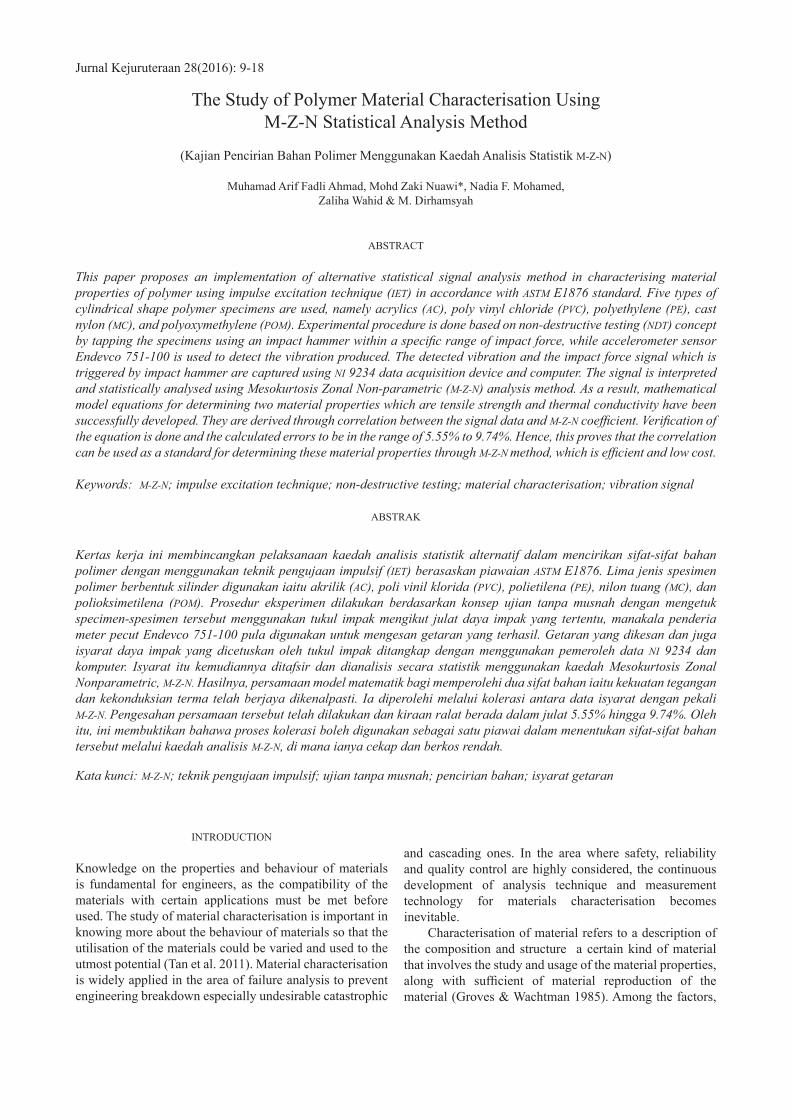
The set-up of experiment is schematically shown in Figure 1. It consists of PCB model 086C03 impact hammer, Endevco 751-100 accelerometer sensor, National
Instruments NI 9234 data acquisition device, computer with LabVIEW software, support system and polymer specimens. The specimens being used are Acrylics (AC), Poly vinyl chloride (PVC), Polyethylene (PE), Cast Nylon (MC), and Polyoxymethylene (POM), with 21 cm length and 3 cm diameter of size. ASTM E1876 standard is used as a guide and reference for this experiment as it is a standard test method conducted to find dynamic young modulus, shear modulus, and poisson’s ratio by impulse excitation of vibration. Table 1 below shows the theoretical value of tensile strength and thermal conductivity for all specimens using Cambridge Engineering Selector (CES Edupack) software. This software provides a comprehensive database of materials and process information, and can be used as a powerful materials software tools.
FIGURE 1. Schematic illustration of experiment preparatory
The experiment is conducted in UKM semi-anechoic chamber to ensure clean signal recording without noise and unwanted reverberation. Support pad is fixed on the rectangular plate base where it is firmly placed on the floor. Specimen is fixed on the support pad and the accelerometer sensor is placed on the outer edge of the specimen. Impulse excitation test is done by triggering each of the specimen with an impact hammer ranging from 200 to 950 N of impact force.
Material Tensile Strength (MPa)
Thermal Conductivity (W/m.K)
Acrylic (AC) 48.3 0.251
Polyvinylchloride (PVC)
40.7 0.293
Polyethylene (PE) 20.7 0.435
Cast nylon (MC) 90.0 0.253
Polyoxymethylene (POM)
67.0 0.350
TABLE 1. The values of tensile strength and thermal conductivity from CES Edupack
11
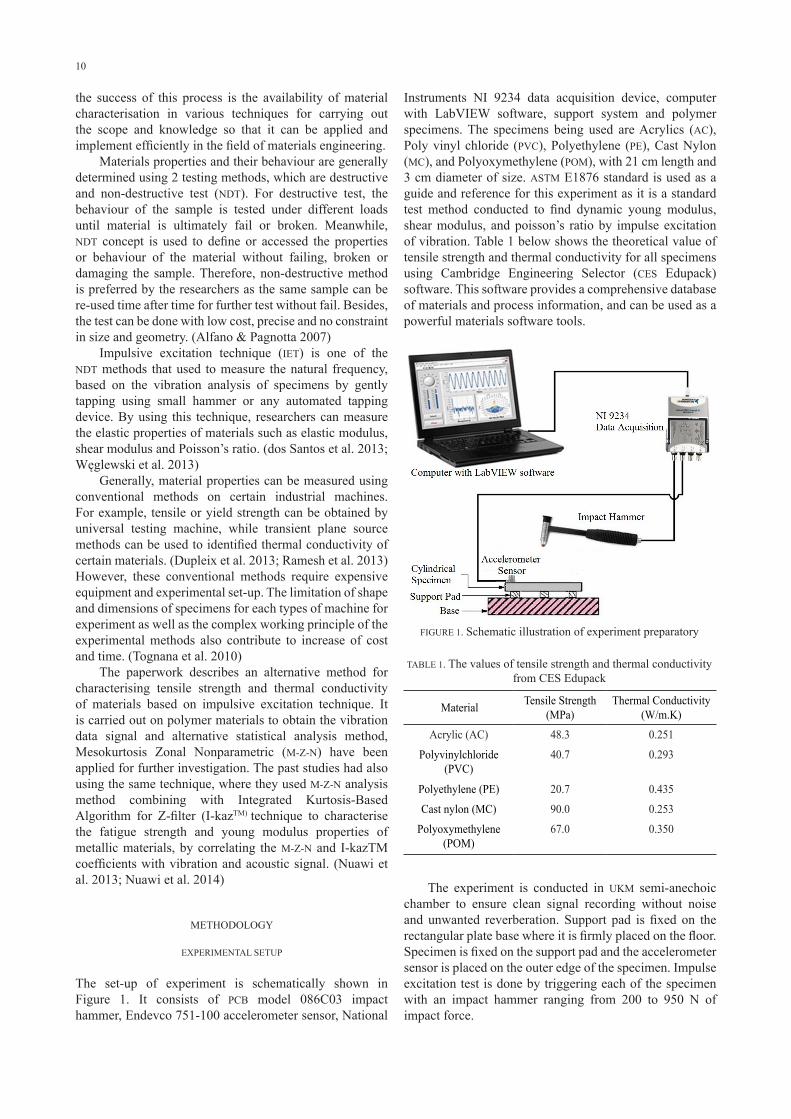
Figure 2 shows the flowchart of the whole research. The experiment is conducted based on the impulse excitation technique where the dynamic response of specimens due to the vibration when subjected to impact force is measured using accelerometer sensor, and the signal are recorded in the form of an electrical signal using LabVIEW software in computer. This technique was recognised by researchers as previous studies were done by recording or capturing signal in the form of generated electrical signal (Alfano & Pagnotta 2007; Guo & Tse 2013). Two main parameters are obtained when the signal is captured which are the acceleration and velocity data. These parameter is analysed using alternative statistical of M-Z-N methods. The determination of the material properties is done by correlating the M-Z-N coefficient values with the impact force. Tensile strength and thermal conductivity which are obtained from the correlation model equation are verified by comparing them with the theory values from CES EduPack software, and the percentage error are investigated.
FIGURE 2. Flowchart of the research
M-Z-N STATISTICAL SIGNAL ANALYSIS METHOD
The signal data resulted from the experiment are analysed using Mesokurtosis Zonal Non-parametric (M-Z-N) statistical analysis method. As stated by Nuawi et al. (2013), M-Z-N method was developed based on data scattering concept with respect to the root mean square (rms) representing the content energy of signal . The rms can be calculated using Equation 1 below:
(1)
(2)
RESULT AND DISCUSSION
In this study, there are 2 types of parameter that are measured, in which they are impact forces and vibration signal. These signal are generated during the process of impact excitation between the impact hammer and the specimen. The impact force and vibration signal of each experiment are measured in time domain.
IMPACT AND VIBRATION SIGNAL
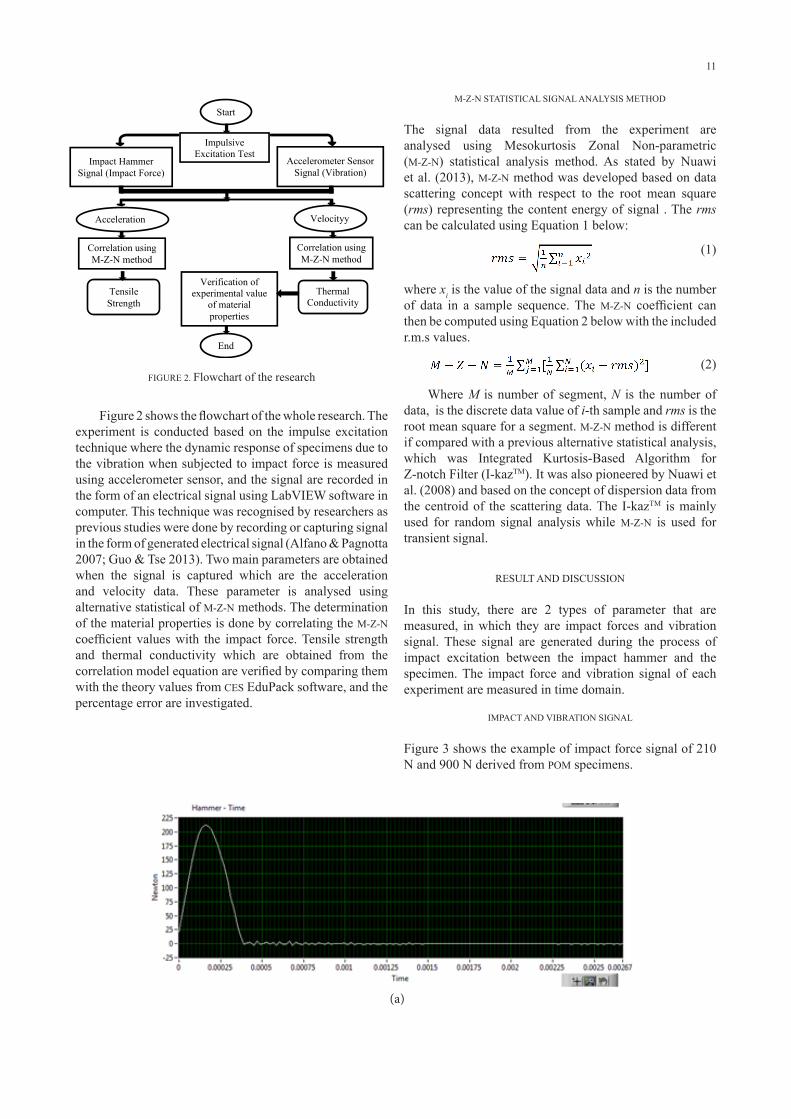
Figure 3 shows the example of impact force signal of 210 N and 900 N derived from POM specimens.
(a)
TABLE 1. The values of tensile strength and thermal conductivity from CES Edupack Material Tensile Strength (MPa) Thermal Conductivity (W/m.K) Acrylic (AC) 48.3 0.251 Polyvinylchloride (PVC) 40.7 0.293 Polyethylene (PE) 20.7 0.435 Cast nylon (MC) 90.0 0.253 Polyoxymethylene (POM) 67.0 0.350
The experiment is conducted in UKM semi-anechoic chamber to ensure clean signal
recording without noise and unwanted reverberation. Support pad is fixed on the rectangular plate base where it is firmly placed on the floor. Specimen is fixed on the support pad and the accelerometer sensor is placed on the outer edge of the specimen. Impulse excitation test is done by triggering each of the specimen with an impact hammer ranging from 200 to 950 N of impact force.
FIGURE 2. Flowchart of the research Figure 2 shows the flowchart of the whole research. The experiment is conducted based on the impulse excitation technique where the dynamic response of specimens due to the vibration when subjected to impact force is measured using accelerometer sensor, and the signal are recorded in the form of an electrical signal using LabVIEW software in computer. This technique was recognised by researchers as previous studies were done by recording or capturing signal in the form of generated electrical signal (Alfano & Pagnotta 2007; Guo & Tse 2013). Two main parameters are obtained when the signal is captured which are the acceleration and velocity data. These parameter is analysed using alternative statistical of M-Z-N methods. The determination of the material properties is done by correlating the M-Z-N coefficient values with the impact force. Tensile strength and thermal conductivity which are obtained from the correlation model equation are verified by comparing them with the theory values from CES EduPack software, and the percentage error are investigated.
Start
Impulsive Excitation Test
Impact Hammer Signal (Impact Force)
Accelerometer Sensor Signal (Vibration)
Acceleration Data D
Velocityy
Correlation using M-Z-N method
Correlation using M-Z-N method
Tensile Strength
Thermal Conductivity
Verification of experimental value
of material properties
End
M-Z-N STATISTICAL SIGNAL ANALYSIS METHOD
The signal data resulted from the experiment are analysed using Mesokurtosis Zonal Non-parametric (M-Z-N) statistical analysis method. As stated by Nuawi et al. (2013), M-Z-N method was developed based on data scattering concept with respect to the root mean square (rms) representing the content energy of signal . The rms can be calculated using Equation 1 below:
(1)
where xi is the value of the signal data and n is the number of data in a sample sequence. The M-Z-N coefficient can then be computed using Equation 2 below with the included r.m.s values.
(2)
Where M is number of segment, N is the number of data, is the discrete data value of i-
th sample and rms is the root mean square for a segment. M-Z-N method is different if compared with a previous alternative statistical analysis, which was Integrated Kurtosis-Based Algorithm for Z-notch Filter (I-kazTM). It was also pioneered by Nuawi et al. (2008) and based on the concept of dispersion data from the centroid of the scattering data. The I-kazTM is mainly used for random signal analysis while M-Z-N is used for transient signal.
RESULT AND DISCUSSION
In this study, there are 2 types of parameter that are measured, in which they are impact forces and vibration signal. These signal are generated during the process of impact excitation between the impact hammer and the specimen. The impact force and vibration signal of each experiment are measured in time domain.
IMPACT AND VIBRATION SIGNAL
Figure 3 shows the example of impact force signal of 210 N and 900 N derived from POM specimens.
(a)
where xi is the value of the signal data and n is the number of data in a sample sequence. The M-Z-N coefficient can then be computed using Equation 2 below with the included r.m.s values.
Where M is number of segment, N is the number of data, is the discrete data value of i-th sample and rms is the root mean square for a segment. M-Z-N method is different if compared with a previous alternative statistical analysis, which was Integrated Kurtosis-Based Algorithm for Z-notch Filter (I-kazTM). It was also pioneered by Nuawi et al. (2008) and based on the concept of dispersion data from the centroid of the scattering data. The I-kazTM is mainly used for random signal analysis while M-Z-N is used for transient signal.
12
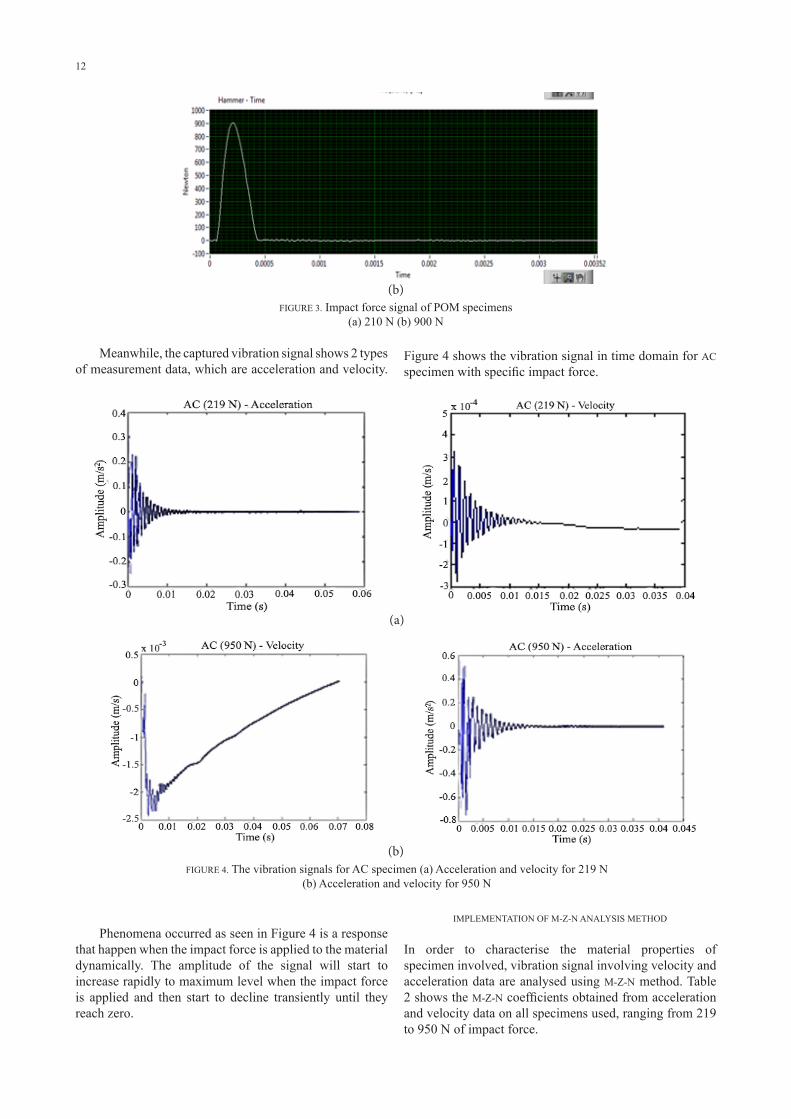
Meanwhile, the captured vibration signal shows 2 types of measurement data, which are acceleration and velocity.
(b)
(a)
FIGURE 4. The vibration signals for AC specimen (a) Acceleration and velocity for 219 N(b) Acceleration and velocity for 950 N
Figure 4 shows the vibration signal in time domain for AC specimen with specific impact force.
Phenomena occurred as seen in Figure 4 is a response that happen when the impact force is applied to the material dynamically. The amplitude of the signal will start to increase rapidly to maximum level when the impact force is applied and then start to decline transiently until they reach zero.
(b)
FIGURE 3. Impact force signal of POM specimens (a) 210 N (b) 900 N
Meanwhile, the captured vibration signal shows 2 types of measurement data, which are acceleration and velocity. Figure 4 shows the vibration signal in time domain for AC specimen with specific impact force.
(a)
(b)
FIGURE 4. The vibration signals for AC specimen (a) Acceleration and velocity for 219 N
(b) Acceleration and velocity for 950 N
Phenomena occurred as seen in Figure 4 is a response that happen when the impact force is applied to the material dynamically. The amplitude of the signal will start to increase
(b)FIGURE 3. Impact force signal of POM specimens
(a) 210 N (b) 900 N
IMPLEMENTATION OF M-Z-N ANALYSIS METHOD
In order to characterise the material properties of specimen involved, vibration signal involving velocity and acceleration data are analysed using M-Z-N method. Table 2 shows the M-Z-N coefficients obtained from acceleration and velocity data on all specimens used, ranging from 219 to 950 N of impact force.
13
Acrylic (AC)
F (N) Acceleration Velocity
(M-Z-NCoefficient)
(M-Z-NCoefficient) *10-8
0219313
476.5502.5630712810950
00.00170.00370.00380.00540.01290.01590.02450.033
00.51934.27969.897
10.30210.17116.04620.35431.503
TABLE 2. The values of M-Z-N coefficient of acceleration and velocity signal for all specimens
Cast Nylon (MC)
F (N) Acceleration Velocity
(M-Z-NCoefficient)
(M-Z-NCoefficient) *10-8
0219313
476.5502.5630712810950
00.002
0.00520.00430.00720.01450.01640.02140.024
00.273622.78973.16257.706312.11413.68117.31418.697
Polyvinylchloride (PVC)
F (N) Acceleration Velocity
(M-Z-NCoefficient)
(M-Z-NCoefficient) *10-8
0219313
476.5502.5630712810950
00.00140.00170.00990.01080.02450.02480.03060.0499
01.83436.202311.08
20.81528.85439.864
43.061647.0172
Polyethylene (PE)
F (N) Acceleration Velocity
(M-Z-NCoefficient)
(M-Z-NCoefficient) *10-8
0219313
476.5502.5630712810950
00.000510310.00059478
0.00150.00870.01820.02420.04210.0472
00.269010.5961322.76544.53650.44265.11375.56382.962
Polyoxymethylene (POM)
F (N) Acceleration Velocity
(M-Z-NCoefficient)
(M-Z-NCoefficient) *10-8
0219313
476.5502.5630712810950
00.00310.00350.01140.01190.01460.01980.021
0.0302
00.62252.9956.902
17.23819.83526.75330.18
47.364
Referring to the result obtained, a significant feature is identified where M-Z-N coefficients of both acceleration and velocity are increased when a higher impact force is applied to the specimen.
In order to characterise the material properties of materials, the changing of these M-Z-N coefficients with respect to the impact force applied on the specimens has to be examined by plotting the data from Table 2 for five different polymers. Figure 5 and 6 shows the plotted data of M-Z-N coefficient against impact force for both acceleration and velocity.
CORRELATION BETWEEN ACCELERATION SIGNAL AND
TENSILE STRENGTH
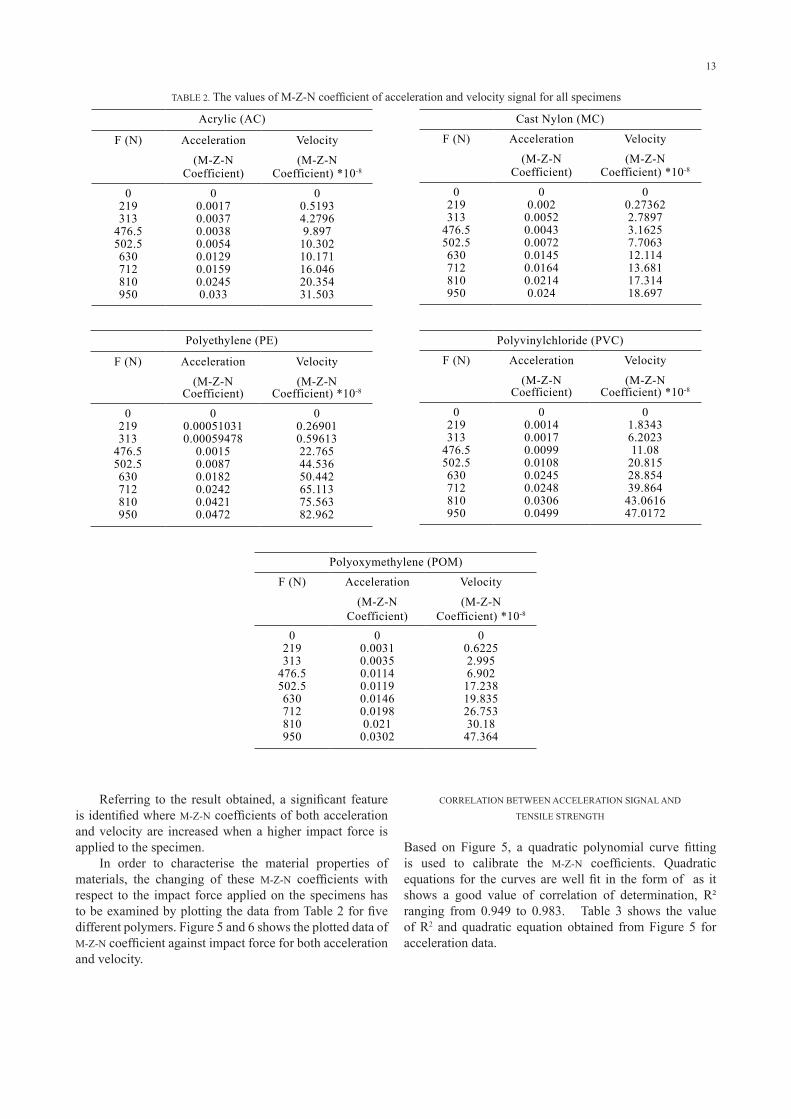
Based on Figure 5, a quadratic polynomial curve fitting is used to calibrate the M-Z-N coefficients. Quadratic equations for the curves are well fit in the form of as it shows a good value of correlation of determination, R² ranging from 0.949 to 0.983. Table 3 shows the value of R2 and quadratic equation obtained from Figure 5 for acceleration data.
14
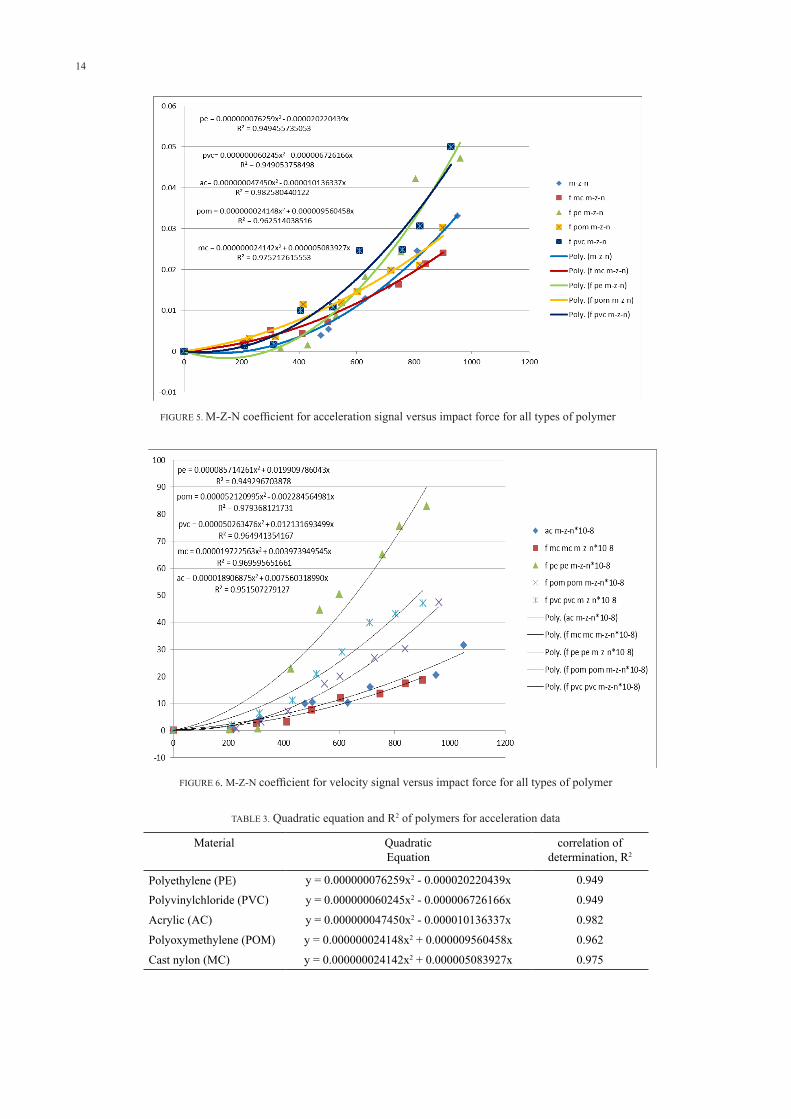
FIGURE 6. M-Z-N coefficient for velocity signal versus impact force for all types of polymer
Material QuadraticEquation
correlation of determination, R2
Polyethylene (PE) y = 0.000000076259x2 - 0.000020220439x 0.949
Polyvinylchloride (PVC) y = 0.000000060245x2 - 0.000006726166x 0.949
Acrylic (AC) y = 0.000000047450x2 - 0.000010136337x 0.982
Polyoxymethylene (POM) y = 0.000000024148x2 + 0.000009560458x 0.962
Cast nylon (MC) y = 0.000000024142x2 + 0.000005083927x 0.975
TABLE 3. Quadratic equation and R2 of polymers for acceleration data
FIGURE 6. M-Z-N coefficient for velocity signal versus impact force for all types of polymer
CORRELATION BETWEEN ACCELERATION SIGNAL AND TENSILE STRENGTH Based on Figure 5, a quadratic polynomial curve fitting is used to calibrate the M-Z-N coefficients. Quadratic equations for the curves are well fit in the form of as it shows a good value of correlation of determination, R² ranging from 0.949 to 0.983. Table 3 shows the value of R2 and quadratic equation obtained from Figure 5 for acceleration data.
TABLE 3. Quadratic equation and R2 of polymers for acceleration data
Material Quadratic Equation
correlation of determination, R2
Polyethylene (PE) y = 0.000000076259x2 - 0.000020220439x 0.949 Polyvinylchloride (PVC) y = 0.000000060245x2 - 0.000006726166x 0.949 Acrylic (AC) y = 0.000000047450x2 - 0.000010136337x 0.982 Polyoxymethylene (POM) y = 0.000000024148x2 + 0.000009560458x 0.962 Cast nylon (MC) y = 0.000000024142x2 + 0.000005083927x 0.975
The difference between these quadratic equations can be characterised clearly from its
quadratic coefficient. The quadratic coefficient refers to the degree of the curvature and it is used to find the relationship between the vibration signal and the mechanical properties of the polymer. The quadratic coefficients of M-Z-N are arranged in ascending order where Table 4 shows the coefficient from acceleration signal and tensile strength for all materials using CES Edupack software (theoretical values) as shown in Table 1 before.
FIGURE 5. M-Z-N coefficient for acceleration signal versus impact force for all types of polymer
Polyoxymethylene (POM) F (N) Acceleration Velocity
(M-Z-N Coefficient)
(M-Z-N Coefficient)
*10-8 0 0 0
219 0.0031 0.6225 313 0.0035 2.995
476.5 0.0114 6.902 502.5 0.0119 17.238 630 0.0146 19.835 712 0.0198 26.753 810 0.021 30.18 950 0.0302 47.364
Referring to the result obtained, a significant feature is identified where M-Z-N
coefficients of both acceleration and velocity are increased when a higher impact force is applied to the specimen.
In order to characterise the material properties of materials, the changing of these M-Z-N coefficients with respect to the impact force applied on the specimens has to be examined by plotting the data from Table 2 for five different polymers. Figure 5 and 6 shows the plotted data of M-Z-N coefficient against impact force for both acceleration and velocity.
FIGURE 5. M-Z-N coefficient for acceleration signal versus impact force for all types of polymer
15
CORRELATION BETWEEN VELOCITY SIGNAL ANDTHERMAL CONDUCTIVITY
As seen on Figure 6, quadratic polynomial equation in the form of is chosen for velocity signal as it shows a good value of R², ranging from 0.949 to 0.979. Table 5 shows the value of R2 and the quadratic equations obtained from Figure 6.
The mathematical model equation in identifying the tensile strength is in the form of power function as shown in Equation 3.
TABLE 4. M-Z-N quadratic coefficients and theoretical tensile strength of polymers
Material Quadratic
Coefficients of M-Z-N Tensile Strength from CES (MPa)
Cast nylon (MC) 2.4142E-08 90.0 Polyoxymethylene (POM) 2.4148E-08 67.0 Acrylic (AC) 4.745E-08 48.3 Polyvinylchloride (PVC) 6.0245E-08 40.7 Polyethylene (PE) 7.6259E-08 20.7
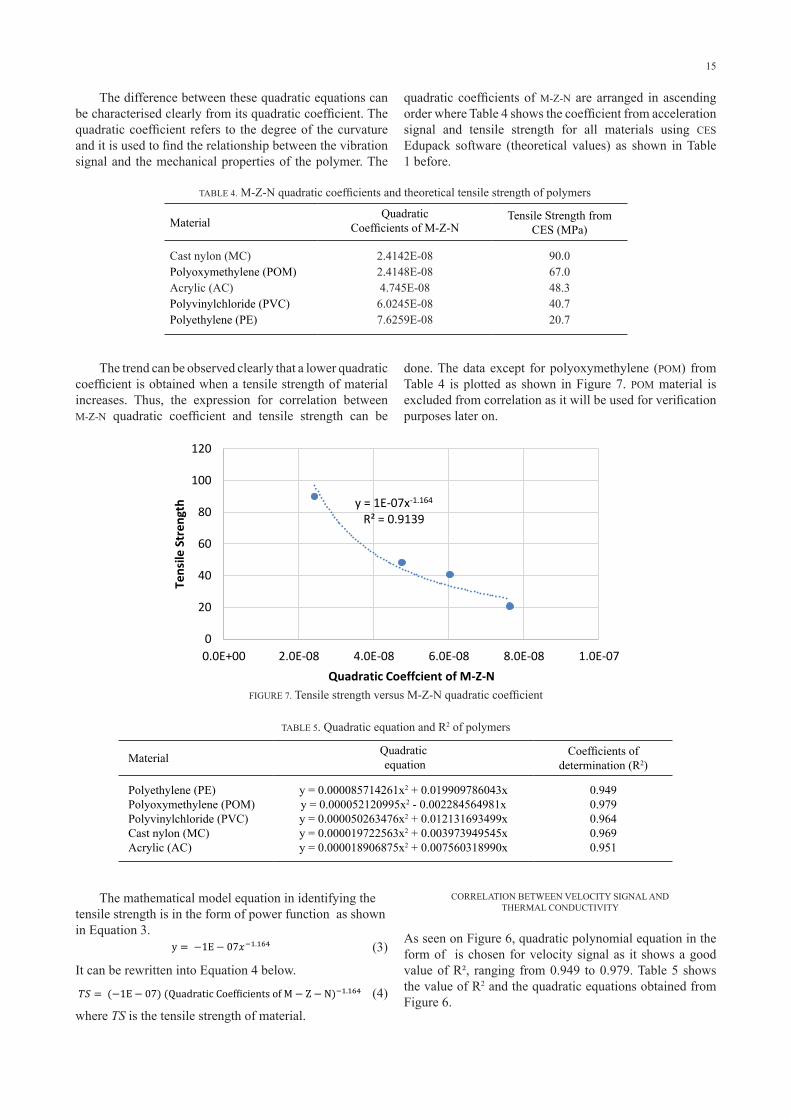
The trend can be observed clearly that a lower quadratic coefficient is obtained when a
tensile strength of material increases. Thus, the expression for correlation between M-Z-N quadratic coefficient and tensile strength can be done. The data except for polyoxymethylene (POM) from Table 4 is plotted as shown in Figure 7. POM material is excluded from correlation as it will be used for verification purposes later on.
FIGURE 7. Tensile strength versus M-Z-N quadratic coefficient
The mathematical model equation in identifying the tensile strength is in the form of power function as shown in Equation 3.
(3) It can be rewritten into Equation 4 below.
(4) where TS is the tensile strength of material.
CORRELATION BETWEEN VELOCITY SIGNAL AND THERMAL CONDUCTIVITY
As seen on Figure 6, quadratic polynomial equation in the form of is chosen for velocity signal as it shows a good value of R², ranging from 0.949 to 0.979. Table 5 shows the value of R2 and the quadratic equations obtained from Figure 6.
y = 1E-07x-1.164 R² = 0.9139
0
20
40
60
80
100
120
0.0E+00 2.0E-08 4.0E-08 6.0E-08 8.0E-08 1.0E-07
Tens
ile S
tren
gth
Quadratic Coeffcient of M-Z-N
It can be rewritten into Equation 4 below.
TABLE 4. M-Z-N quadratic coefficients and theoretical tensile strength of polymers
Material Quadratic
Coefficients of M-Z-N Tensile Strength from CES (MPa)
Cast nylon (MC) 2.4142E-08 90.0 Polyoxymethylene (POM) 2.4148E-08 67.0 Acrylic (AC) 4.745E-08 48.3 Polyvinylchloride (PVC) 6.0245E-08 40.7 Polyethylene (PE) 7.6259E-08 20.7
The trend can be observed clearly that a lower quadratic coefficient is obtained when a
tensile strength of material increases. Thus, the expression for correlation between M-Z-N quadratic coefficient and tensile strength can be done. The data except for polyoxymethylene (POM) from Table 4 is plotted as shown in Figure 7. POM material is excluded from correlation as it will be used for verification purposes later on.
FIGURE 7. Tensile strength versus M-Z-N quadratic coefficient
The mathematical model equation in identifying the tensile strength is in the form of power function as shown in Equation 3.
(3) It can be rewritten into Equation 4 below.
(4) where TS is the tensile strength of material.
CORRELATION BETWEEN VELOCITY SIGNAL AND THERMAL CONDUCTIVITY
As seen on Figure 6, quadratic polynomial equation in the form of is chosen for velocity signal as it shows a good value of R², ranging from 0.949 to 0.979. Table 5 shows the value of R2 and the quadratic equations obtained from Figure 6.
y = 1E-07x-1.164 R² = 0.9139
0
20
40
60
80
100
120
0.0E+00 2.0E-08 4.0E-08 6.0E-08 8.0E-08 1.0E-07
Tens
ile S
tren
gth
Quadratic Coeffcient of M-Z-N
where TS is the tensile strength of material.
The difference between these quadratic equations can be characterised clearly from its quadratic coefficient. The quadratic coefficient refers to the degree of the curvature and it is used to find the relationship between the vibration signal and the mechanical properties of the polymer. The
TABLE 4. M-Z-N quadratic coefficients and theoretical tensile strength of polymers
Material Quadratic
Coefficients of M-Z-NTensile Strength from
CES (MPa)
Cast nylon (MC)Polyoxymethylene (POM)Acrylic (AC)Polyvinylchloride (PVC)Polyethylene (PE)
2.4142E-082.4148E-084.745E-086.0245E-087.6259E-08
90.067.048.340.720.7
FIGURE 7. Tensile strength versus M-Z-N quadratic coefficient
quadratic coefficients of M-Z-N are arranged in ascending order where Table 4 shows the coefficient from acceleration signal and tensile strength for all materials using CES Edupack software (theoretical values) as shown in Table 1 before.
TABLE 4. M-Z-N quadratic coefficients and theoretical tensile strength of polymers
Material Quadratic
Coefficients of M-Z-N Tensile Strength from CES (MPa)
Cast nylon (MC) 2.4142E-08 90.0 Polyoxymethylene (POM) 2.4148E-08 67.0 Acrylic (AC) 4.745E-08 48.3 Polyvinylchloride (PVC) 6.0245E-08 40.7 Polyethylene (PE) 7.6259E-08 20.7
The trend can be observed clearly that a lower quadratic coefficient is obtained when a
tensile strength of material increases. Thus, the expression for correlation between M-Z-N quadratic coefficient and tensile strength can be done. The data except for polyoxymethylene (POM) from Table 4 is plotted as shown in Figure 7. POM material is excluded from correlation as it will be used for verification purposes later on.
FIGURE 7. Tensile strength versus M-Z-N quadratic coefficient
The mathematical model equation in identifying the tensile strength is in the form of power function as shown in Equation 3.
(3) It can be rewritten into Equation 4 below.
(4) where TS is the tensile strength of material.
CORRELATION BETWEEN VELOCITY SIGNAL AND THERMAL CONDUCTIVITY
As seen on Figure 6, quadratic polynomial equation in the form of is chosen for velocity signal as it shows a good value of R², ranging from 0.949 to 0.979. Table 5 shows the value of R2 and the quadratic equations obtained from Figure 6.
y = 1E-07x-1.164 R² = 0.9139
0
20
40
60
80
100
120
0.0E+00 2.0E-08 4.0E-08 6.0E-08 8.0E-08 1.0E-07
Tens
ile S
tren
gth
Quadratic Coeffcient of M-Z-N
TABLE 5. Quadratic equation and R2 of polymers
Material Quadratic equation
Coefficients of determination (R2)
Polyethylene (PE)Polyoxymethylene (POM)Polyvinylchloride (PVC)Cast nylon (MC)Acrylic (AC)
y = 0.000085714261x2 + 0.019909786043xy = 0.000052120995x2 - 0.002284564981xy = 0.000050263476x2 + 0.012131693499xy = 0.000019722563x2 + 0.003973949545xy = 0.000018906875x2 + 0.007560318990x
0.9490.9790.9640.9690.951
The trend can be observed clearly that a lower quadratic coefficient is obtained when a tensile strength of material increases. Thus, the expression for correlation between M-Z-N quadratic coefficient and tensile strength can be
done. The data except for polyoxymethylene (POM) from Table 4 is plotted as shown in Figure 7. POM material is excluded from correlation as it will be used for verification purposes later on.
(3)
(4)
16
The mathematical expression of model equation for thermal conductivity determination is well fit in the form of linear function as shown in Equation 5.
The mathematical expression of model equation for thermal conductivity determination is well fit in the form of linear function as shown in Equation 5.
(5) It can be rewritten into Equation 6 below.
(6) where k is the thermal conductivity of material.
VERIFICATION OF MATHEMATICAL MODEL EQUATIONS In order to verify the accuracy and validity of both of the model equations, the value of M-Z-N quadratic coefficient of POM material which was excluded previously in correlation from table 4 and table 6 are substituted in Equation 4 and Equation 6 to obtain the experimental tensile strength and thermal conductivity as follow: These values are compared with the theoretical value obtained from CES Edupack as shown in Table 1 which is 67 MPa and 0.35 W/m.K. The percentage error of the difference between the two values are computed as shown below: Theoretical and experimental value along with the errors for POM material are presented in Table 7.
TABLE 6. Experimental and theoretical values of tensile strength and thermal conductivity of POM material
Experimental Theory Error Tensile Strength 73.528 MPa 67.0 MPa 9.74 % Thermal Conductivity
0.330553 W/m.K 0.35 W/m.K 5.55 %
The errors as shown in the table are below 10 %, which means that the above model equations are verified and valid to be used for determining the tensile strength and thermal conductivity.
CONCLUSION In this study, material characterisation of polymer based on the impact excitation technique (IET) using M-Z-N alternative statistical analysis have been presented. The scope of material characterisation is further expanded with the implementation of Mesokurtosis Zonal Non-parametric (M-Z-N). The vibration and impact signal that are captured during experiment are
It can be rewritten into Equation 6 below.
The mathematical expression of model equation for thermal conductivity determination is well fit in the form of linear function as shown in Equation 5.
(5) It can be rewritten into Equation 6 below.
(6) where k is the thermal conductivity of material.
VERIFICATION OF MATHEMATICAL MODEL EQUATIONS In order to verify the accuracy and validity of both of the model equations, the value of M-Z-N quadratic coefficient of POM material which was excluded previously in correlation from table 4 and table 6 are substituted in Equation 4 and Equation 6 to obtain the experimental tensile strength and thermal conductivity as follow: These values are compared with the theoretical value obtained from CES Edupack as shown in Table 1 which is 67 MPa and 0.35 W/m.K. The percentage error of the difference between the two values are computed as shown below: Theoretical and experimental value along with the errors for POM material are presented in Table 7.
TABLE 6. Experimental and theoretical values of tensile strength and thermal conductivity of POM material
Experimental Theory Error Tensile Strength 73.528 MPa 67.0 MPa 9.74 % Thermal Conductivity
0.330553 W/m.K 0.35 W/m.K 5.55 %
The errors as shown in the table are below 10 %, which means that the above model equations are verified and valid to be used for determining the tensile strength and thermal conductivity.
CONCLUSION In this study, material characterisation of polymer based on the impact excitation technique (IET) using M-Z-N alternative statistical analysis have been presented. The scope of material characterisation is further expanded with the implementation of Mesokurtosis Zonal Non-parametric (M-Z-N). The vibration and impact signal that are captured during experiment are
where k is the thermal conductivity of material.
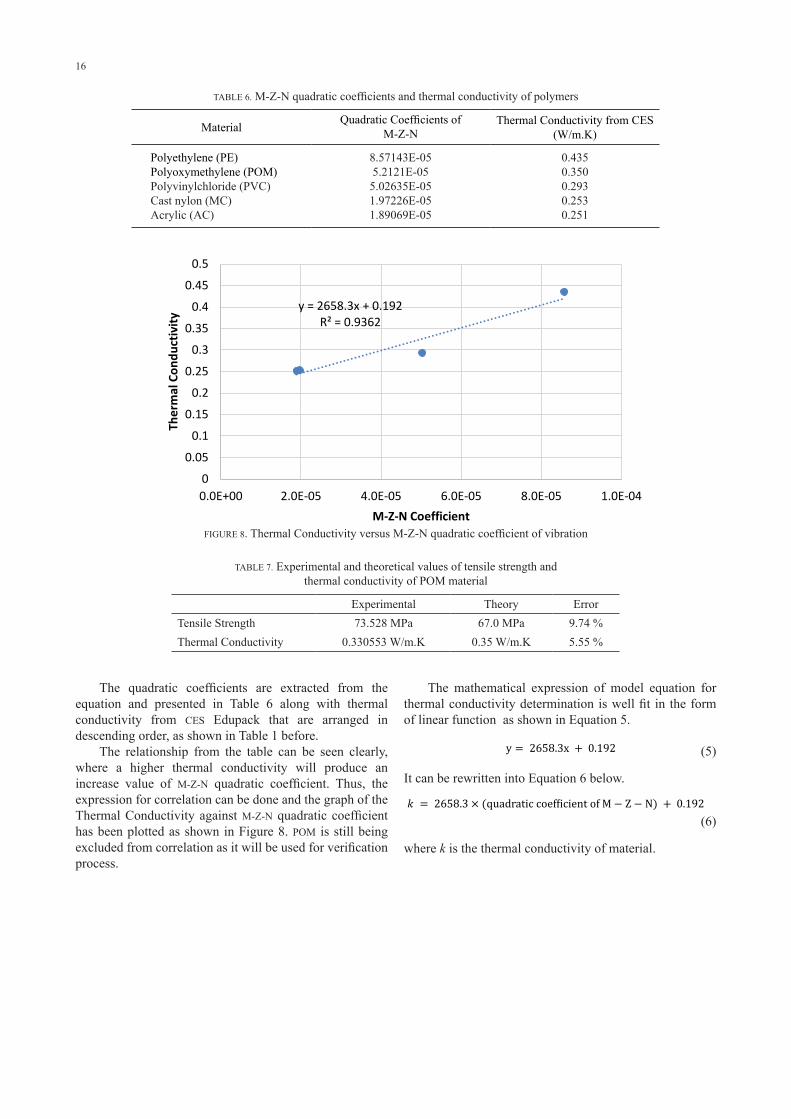
The quadratic coefficients are extracted from the equation and presented in Table 6 along with thermal conductivity from CES Edupack that are arranged in descending order, as shown in Table 1 before.
The relationship from the table can be seen clearly, where a higher thermal conductivity will produce an increase value of M-Z-N quadratic coefficient. Thus, the expression for correlation can be done and the graph of the Thermal Conductivity against M-Z-N quadratic coefficient has been plotted as shown in Figure 8. POM is still being excluded from correlation as it will be used for verification process.
TABLE 6. M-Z-N quadratic coefficients and thermal conductivity of polymers
Material Quadratic Coefficients of M-Z-N
Thermal Conductivity from CES (W/m.K)
Polyethylene (PE)Polyoxymethylene (POM)Polyvinylchloride (PVC)Cast nylon (MC)Acrylic (AC)
8.57143E-055.2121E-055.02635E-051.97226E-051.89069E-05
0.4350.3500.2930.2530.251
TABLE 5. Quadratic equation and R2 of polymers
Material Quadratic equation
Coefficients of determination (R2)
Polyethylene (PE) y = 0.000085714261x2 + 0.019909786043x 0.949 Polyoxymethylene (POM) y = 0.000052120995x2 - 0.002284564981x 0.979 Polyvinylchloride (PVC) y = 0.000050263476x2 + 0.012131693499x 0.964 Cast nylon (MC) y = 0.000019722563x2 + 0.003973949545x 0.969 Acrylic (AC) y = 0.000018906875x2 + 0.007560318990x 0.951 The quadratic coefficients are extracted from the equation and presented in Table 6 along with thermal conductivity from CES Edupack that are arranged in descending order, as shown in Table 1 before.
TABLE 6. M-Z-N quadratic coefficients and thermal conductivity of polymers
Material Quadratic Coefficients of
M-Z-N Thermal Conductivity from CES (W/m.K)
Polyethylene (PE) 8.57143E-05 0.435 Polyoxymethylene (POM) 5.2121E-05 0.350 Polyvinylchloride (PVC) 5.02635E-05 0.293 Cast nylon (MC) 1.97226E-05 0.253 Acrylic (AC) 1.89069E-05 0.251
The relationship from the table can be seen clearly, where a higher thermal conductivity will produce an increase value of M-Z-N quadratic coefficient. Thus, the expression for correlation can be done and the graph of the Thermal Conductivity against M-Z-N quadratic coefficient has been plotted as shown in Figure 8. POM is still being excluded from correlation as it will be used for verification process.
FIGURE 8. Thermal Conductivity versus M-Z-N quadratic coefficient of vibration
y = 2658.3x + 0.192 R² = 0.9362
0
0.05
0.1
0.15
0.2
0.25
0.3
0.35
0.4
0.45
0.5
0.0E+00 2.0E-05 4.0E-05 6.0E-05 8.0E-05 1.0E-04
Ther
mal
Con
duct
ivity
M-Z-N Coefficient FIGURE 8. Thermal Conductivity versus M-Z-N quadratic coefficient of vibration
TABLE 7. Experimental and theoretical values of tensile strength andthermal conductivity of POM material
Experimental Theory ErrorTensile Strength 73.528 MPa 67.0 MPa 9.74 %Thermal Conductivity 0.330553 W/m.K 0.35 W/m.K 5.55 %
(5)
(6)
17
VERIFICATION OF MATHEMATICAL MODEL EQUATIONS
In order to verify the accuracy and validity of both of the model equations, the value of M-Z-N quadratic coefficient of
POM material which was excluded previously in correlation from table 4 and table 6 are substituted in Equation 4 and Equation 6 to obtain the experimental tensile strength and thermal conductivity as follow:
The mathematical expression of model equation for thermal conductivity determination is well fit in the form of linear function as shown in Equation 5.
(5) It can be rewritten into Equation 6 below.
(6) where k is the thermal conductivity of material.
VERIFICATION OF MATHEMATICAL MODEL EQUATIONS In order to verify the accuracy and validity of both of the model equations, the value of M-Z-N quadratic coefficient of POM material which was excluded previously in correlation from table 4 and table 6 are substituted in Equation 4 and Equation 6 to obtain the experimental tensile strength and thermal conductivity as follow: These values are compared with the theoretical value obtained from CES Edupack as shown in Table 1 which is 67 MPa and 0.35 W/m.K. The percentage error of the difference between the two values are computed as shown below: Theoretical and experimental value along with the errors for POM material are presented in Table 7.
TABLE 6. Experimental and theoretical values of tensile strength and thermal conductivity of POM material
Experimental Theory Error Tensile Strength 73.528 MPa 67.0 MPa 9.74 % Thermal Conductivity
0.330553 W/m.K 0.35 W/m.K 5.55 %
The errors as shown in the table are below 10 %, which means that the above model equations are verified and valid to be used for determining the tensile strength and thermal conductivity.
CONCLUSION In this study, material characterisation of polymer based on the impact excitation technique (IET) using M-Z-N alternative statistical analysis have been presented. The scope of material characterisation is further expanded with the implementation of Mesokurtosis Zonal Non-parametric (M-Z-N). The vibration and impact signal that are captured during experiment are
These values are compared with the theoretical value obtained from CES Edupack as shown in Table 1 which is 67
MPa and 0.35 W/m.K. The percentage error of the difference between the two values are computed as shown below:
The mathematical expression of model equation for thermal conductivity determination is well fit in the form of linear function as shown in Equation 5.
(5) It can be rewritten into Equation 6 below.
(6) where k is the thermal conductivity of material.
VERIFICATION OF MATHEMATICAL MODEL EQUATIONS In order to verify the accuracy and validity of both of the model equations, the value of M-Z-N quadratic coefficient of POM material which was excluded previously in correlation from table 4 and table 6 are substituted in Equation 4 and Equation 6 to obtain the experimental tensile strength and thermal conductivity as follow: These values are compared with the theoretical value obtained from CES Edupack as shown in Table 1 which is 67 MPa and 0.35 W/m.K. The percentage error of the difference between the two values are computed as shown below: Theoretical and experimental value along with the errors for POM material are presented in Table 7.
TABLE 6. Experimental and theoretical values of tensile strength and thermal conductivity of POM material
Experimental Theory Error Tensile Strength 73.528 MPa 67.0 MPa 9.74 % Thermal Conductivity
0.330553 W/m.K 0.35 W/m.K 5.55 %
The errors as shown in the table are below 10 %, which means that the above model equations are verified and valid to be used for determining the tensile strength and thermal conductivity.
CONCLUSION In this study, material characterisation of polymer based on the impact excitation technique (IET) using M-Z-N alternative statistical analysis have been presented. The scope of material characterisation is further expanded with the implementation of Mesokurtosis Zonal Non-parametric (M-Z-N). The vibration and impact signal that are captured during experiment are
Theoretical and experimental value along with the errors for POM material are presented in Table 6.
The errors as shown in the table are below 10 %, which means that the above model equations are verified and valid to be used for determining the tensile strength and thermal conductivity.
CONCLUSION
In this study, material characterisation of polymer based on the impact excitation technique (IET) using M-Z-N alternative statistical analysis have been presented. The scope of material characterisation is further expanded with the implementation of Mesokurtosis Zonal Non-parametric (M-Z-N). The vibration and impact signal that are captured during experiment are analysed using M-Z-N analysis method. Correlation between the M-Z-N coefficient with the experimental data have been done to observe the relationship between them. As a result, the experimental value of tensile strength and thermal conductivity have been characterised by constructing the mathematical model representation. The obtained mathematical model equations are verified and found that it is valid to be used as the calculated error of these properties is only 5.55 – 9.74 %. This study can contribute to a simple characterisation process of IET based on analytical methods as it does not require the use of complex and expensive machinery to work.
ACKNOWLEDGEMENTS
The authors wish to express their gratitude to Department of Mechanical and Materials Engineering, Universiti Kebangsaan Malaysia and the Ministry of Higher Education for providing financial support under ERGS/1/2013/TK01/UKM/02/2 grant.
REFERENCES
Alfano, M. & L. Pagnotta 2007. A non-destructive technique for the elastic characterization of thin isotropic plates. NDT & E International 40(2): 112-120.
dos Santos, J. P. L., P. M. Amaral, A. C. Diogo & L. G. Rosa 2013. Comparison of Young’s Moduli of Engineered Stones Using Different Test Methods. Key Engineering Materials 548: 220-230.
Dupleix, A., A. Kusiak, M. Hughes & F. Rossi 2013. Measuring the thermal properties of green wood by the transient plane source (TPS) technique. Holzforschung 67(4): 437-445.
Groves, D. & J. Wachtman 1985. Materials characterization–vital and often successful, yet still a critical problem. Materials and Society 9(1): 45-58.
Guo, W. & P. W. Tse 2013. A novel signal compression method based on optimal ensemble empirical mode decomposition for bearing vibration signals. Journal of sound and vibration 332(2): 423-441.
Nuawi, M., A. Bahari, S. Abdullah, A. Ihsan & M. Ali 2013. Mesokurtosis zonal nonparametric signal analysis for dynamic characterisation of metallic material. Jurnal Kejuruteraan (Journal of Engineering) 24: 21-27.
Nuawi, M. Z., A. R. Bahari, S. Abdullah & A. K. Ariffin 2014. Comparison of Young’s modulus property determination of metallic materials under two statistical analysis methods. Advanced Materials Research 894: 186-191.
Nuawi, M. Z., A. R. Bahari, S. Abdullah, A. K. Ariffin & Z. M. Nopiah 2013. Time domain analysis method of the impulse vibro-acoustic signal for fatigue strength characterisation of metallic material. Procedia Engineering 66: 539-548.
18
Nuawi, M. Z., M. J. M. Nor, N. Jamaludin, S. Abdullah, F. Lamin & C. K. E. Nizwan 2008. Development of integrated kurtosis-based algorithm for z-filter technique. Journal of Applied Sciences 8(8): 1541-1547.
Ramesh, M., K. Palanikumar & K. H. Reddy 2013. Mechanical property evaluation of sisal–jute–glass fiber reinforced polyester composites. Composites Part B: Engineering 48: 1-9.
Standard, A. 1876. 09,“Standard test method for dynamic Young’s modulus, shear modulus, and Poisson’s ratio by impulse excitation of vibration,” ASTM International, West Conshohocken, PA, 2003. DOI: 10.1520/E1876-09.
Tan, M. M. A., F. Mat, I. A. Rahim, N. T. Lile & S. Yaacob 2011. Classification of materials by modal analysis and neural network. Information Technology and Multimedia (ICIM), 2011 International Conference on. pp. 1-5.
Tognana, S., W. Salgueiro, A. Somoza & A. Marzocca. 2010. Measurement of the Young’s modulus in particulate epoxy composites using the impulse excitation technique. Materials Science and Engineering: A 527(18): 4619-4623.
Węglewski, W., K. Bochenek, M. Basista, T. Schubert, U. Jehring, J. Litniewski & S. Mackiewicz. 2013. Comparative assessment of Young’s modulus measurements of metal–ceramic composites using mechanical and non-destructive tests and micro-CT based computational modeling. Computational Materials Science 77: 19-30.
Muhamad Arif Fadli Ahmad, Mohd Zaki Nuawi*, Nadia F. Mohamed, Zaliha Wahid & M. DirhamsyahDepartment of Mechanical and Materials Engineering Faculty of Engineering and Built Environment Universiti Kebangsaan Malaysia,43600 UKM Bangi, Selangor, Malaysia
*Corresponding author; email: [email protected]
Received date: 15th August 2015Accepted date: 25th February 2016