target strength of fish based on echogram …umpir.ump.edu.my/id/eprint/4927/1/cd6707_71.pdf ·...
TRANSCRIPT

TARGET STRENGTH OF FISH BASED ON ECHOGRAM
SYAZRINA BINTI AHMAD SAFAWI
This thesis is submitted as partial fulfillment of the requirements for the award of the Bachelor of
Electrical Engineering (Electronics)
Faculty of Electrical & Electronics Engineering
Universiti Malaysia Pahang
MAY, 2012
vi
ABSTRAK
Tujuan dari projek ini adalah untuk mengenalpasti target strength (TS) ikan daripada
gambar echogram yang ditunjukkan pada mesin Saintifik Echo Sounder Furuno FQ-80. Data
yang diperolehi adalah nilai TS untuk ikan kembung dengan ikan selar pada frekuensi rendah
iaitu 38 kHz. TS pada setiap ikan adalah berbeza mengikut jenis dan saiz. Dengan menggunakan
perisian MATLAB, TS pada setiap ikan juga boleh ditentukan mengikut komponen warna. Dari
nombor ping dan kedalaman air laut, posisi ikan dan nilai TS pada echogram boleh ditentukan.
Nilai TS untuk ikan selar adalah -44.486 dan nilai TS untuk ikan kembung adalah -54.13. Ikan
kembung mempunyai nilai TS yang lebih rendah berbanding ikan selar.
vii
ABSTRACT
The purpose of this project is to determine the target strength (TS) of fish based on
echogram using the Furuno FQ-80 analyzer. The data collected is the value of TS for ikan
kembung (restrelliger kanagurta) and ikan selar boops (ox-eye scad) which is in low frequency
data that is 38 kHz. TS value on fish is different according to their types and size. Using the
MATLAB software, TS value for fish also can be determined according to its color component.
From the ping numbers and the depth of the sea, the position and the TS value on echogram can
be determined. The TS value for ikan selar boops (ox-eye scad) is -44.486 and the TS value for
ikan kembung (restrelliger Kanagurta) is -54.13. Ikan kembung has the lower TS value than the
ikan selar boops.

viii
TABLE OF CONTENTS
CHAPTER TITLE PAGE
TITLE PAGE i
ACKNOWLEDGEMENT BY SUPERVISOR ii
DECLARATION iii
DEDICATION iv
ACKNOWLEDGEMENT v
ABSTRAK vi
ABSTRACT vii
TABLE OF CONTENTS viii
LIST OF APPENDICES ix
LIST OF TABLE x
LIST OF FIGURES xi
LIST OF SYMBOLS xiii
LIST OF GRAPH xiv
1 INTRODUCTION 1
1.1 Sonar Technique 1
1.2 Target Strength 3
1.3 Echogram 4
1.4 Image Processing 6
1.5 Problem Statements 6
1.6 Objectives 7
1.7 Project Scopes 7
1.8 Expected Results 8
ix
2 LITERATURE REVIEW 9
2.1 Theory of Target Strength 9
2.2 MATLAB Software 11
2.3 Color Space 12
3 METHODOLOGY 15
3.1 Data of Low Frequency TS 15
3.1.1 Echogram 20
3.1.2 MATLAB coding 23
4 RESULT AND DISCUSSION
4.1 Result 31
4.1.1 File ID 2814 Selar Boops (Ox-Eye Scad) 31
4.1.2 File ID 3636 Kembung (Restrelliger Kanagurta) 36
4.1.3 File ID 3637 Kembung (Restrelliger Kanagurta) 39
4.1.4 File ID 3638 Kembung (Restrelliger Kanagurta) 43
4.1.5 File ID 3641 Kembung (Restrelliger Kanagurta) 47
4.2 Comparisons 51
5 CONCLUSION 53
REFERENCES 54
APPENDIX A 55
APPENDIX B 56

x
LIST OF TABLES
TABLE NO. TITLE PAGE
3.1: Data Collected For File ID 2814 Ikan Selar Boops 17
3.2: Data Collected For File ID 3636 Ikan Kembung 17
3.3: Data Collected For File ID 3637 Ikan Kembung 18
3.4: Data Collected For File ID 3638 Ikan Kembung 19
3.5: Data Collected For File ID 3641 Ikan Kembung 20
4.1: File 2814, Selar Boops (Ox-Eye Scad) 34
4.2: File 3636, Ikan Kembung (Restrelliger Kanagurta) 38
4.3: File 3637, Ikan Kembung (Restrelliger Kanagurta) 42
4.4: File 3638, Ikan Kembung (Restrelliger Kanagurta) 46
4.5: File 3641, Ikan Kembung (Restrelliger Kanagurta) 49
4.6: Comparisons between Two Types of Fish 51
xi
LIST OF FIGURES
FIGURES NO. TITLE PAGE
1.1: Transmission of Echo Sounders 2
1.2: Reflected Echo Sounders 3
1.3: Calculations of Target Strength 4
1.4: Echogram 5
2.1: MATLAB R2010a version 12
2.2: The Combination of Green And Blue Color 13
2.3: The Combination of Red And Blue Color 13
2.4: The Combination of Red And Green Color 14
3.1: Top Views of TS 16
3.2: Echogram File ID 3636 Ikan Kembung 21
3.3: Echogram File ID 3637 Ikan Kembung 21
3.4: Echogram File ID 3638 Ikan Kembung 22
3.5: Echogram File ID 3641 Ikan Kembung 22
3.6: Echogram File ID 2814 Ikan Selar Boops 23
4.1: Echogram Ikan Selar Boops 32
4.2: (a) original image 33
(b) After execute 33
4.3: Echogram Ikan kembung 3636 36
4.4: (a) original image 37
(b) After execute 37
4.5: Echogram Ikan kembung 3637 40
4.6: (a) original image 41
(b) After execute 41
4.7: Echogram Ikan kembung 3638 43
4.8: (a) original image 44

xii
(b) After execute 44
4.9: Echogram Ikan kembung 3641 47
4.10: (a) original image 48
(b) After execute 48
3.4: Echogram File ID 3638 Ikan Kembung 22
3.5: Echogram File ID 3641 Ikan Kembung 22
xiii
LIST OF SYMBOL
TS - Target strength
PSM - Projek Sarjana Muda
RGB - Red, Green, Blue
xiv
LIST OF GRAPH
GRAPH NO. TITLE PAGE
4.1: Positions of Ikan Selar Boops 34
4.2: Positions of Ikan Kembung 3636 38
4.3: Positions of Ikan Kembung 3637 42
4.4: Positions of Ikan Kembung 3638 45
4.5: Positions of Ikan Kembung 3641 49
4.6: Comparison of RGB 52
CHAPTER 1
INTRODUCTION
In this chapter introduction is made on some general information about sonar
technique, target strength, echogram, image processing, problem statement, research
objectives and the scope of the project.
1.1 Sonar Technique
Sonar techniques, especially echo sounders, have been used since the beginning
of the twentieth century for the detection of fish at sea by professional fishermen and by
fishery oceanographers. A scientific echo sounder is a device which
uses sonar technology for the measurement of underwater physical and biological
components. This device is also known as scientific sonar. Applications
2
include bathymetry, substrate classification, studies of aquatic vegetation, fish,
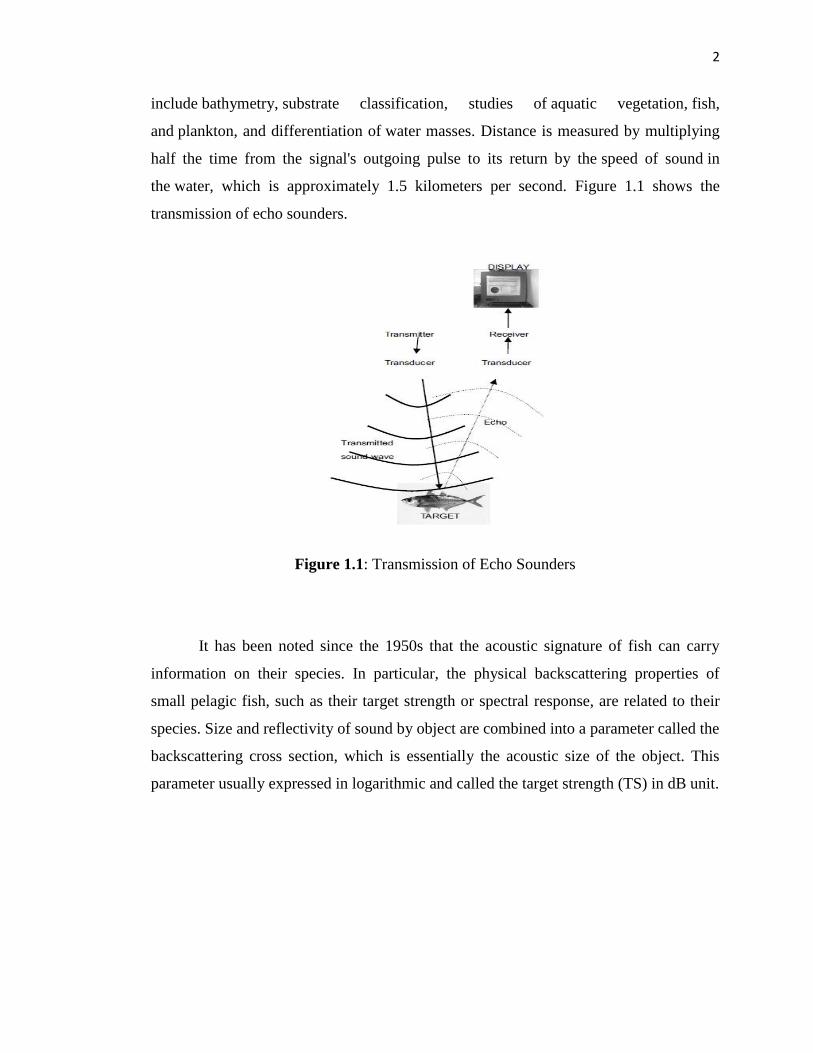
and plankton, and differentiation of water masses. Distance is measured by multiplying
half the time from the signal's outgoing pulse to its return by the speed of sound in
the water, which is approximately 1.5 kilometers per second. Figure 1.1 shows the
transmission of echo sounders.
Figure 1.1: Transmission of Echo Sounders
It has been noted since the 1950s that the acoustic signature of fish can carry
information on their species. In particular, the physical backscattering properties of
small pelagic fish, such as their target strength or spectral response, are related to their
species. Size and reflectivity of sound by object are combined into a parameter called the
backscattering cross section, which is essentially the acoustic size of the object. This
parameter usually expressed in logarithmic and called the target strength (TS) in dB unit.
3
1.2 Target Strength
The term target strength originates from naval acoustics and the simplest object
to consider as an acoustic 'target' is the sphere because it radiates its echo equally in all
directions. In order to convert data collected on acoustic survey into population
estimates it is essential to have precise estimates of fish target strength. The methods
used to obtain these are by having single fish or numbers of live fish in a cage, stunned
individuals.
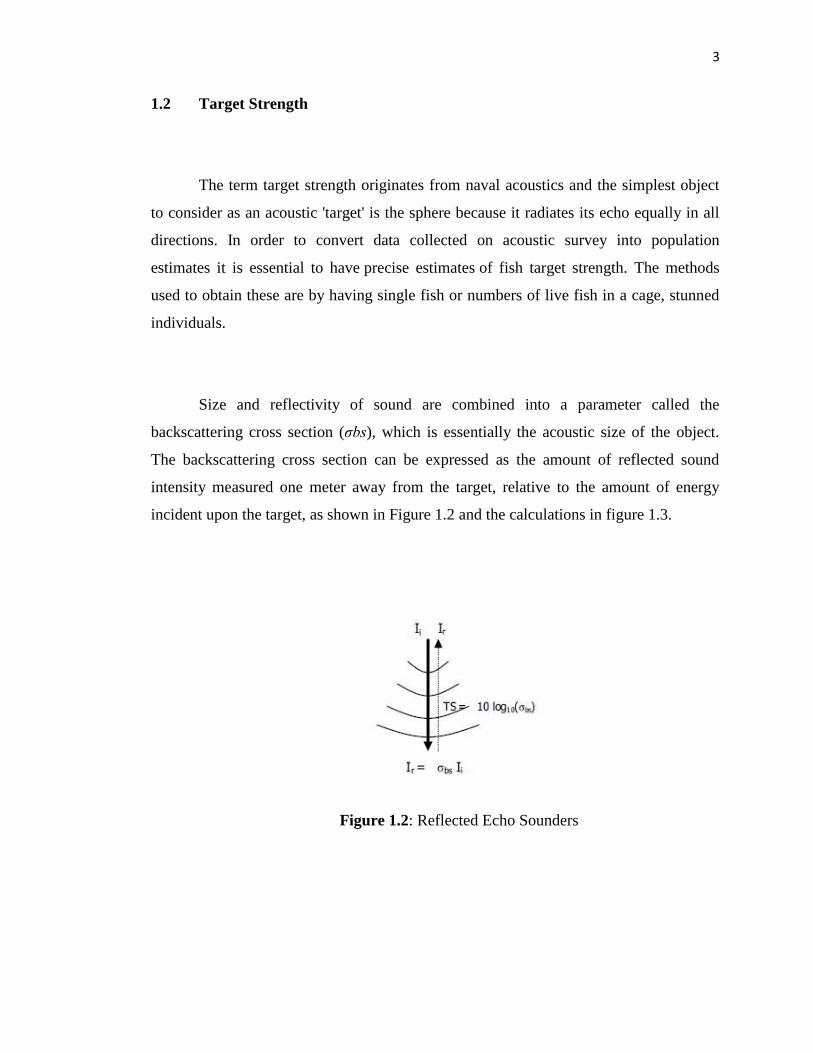
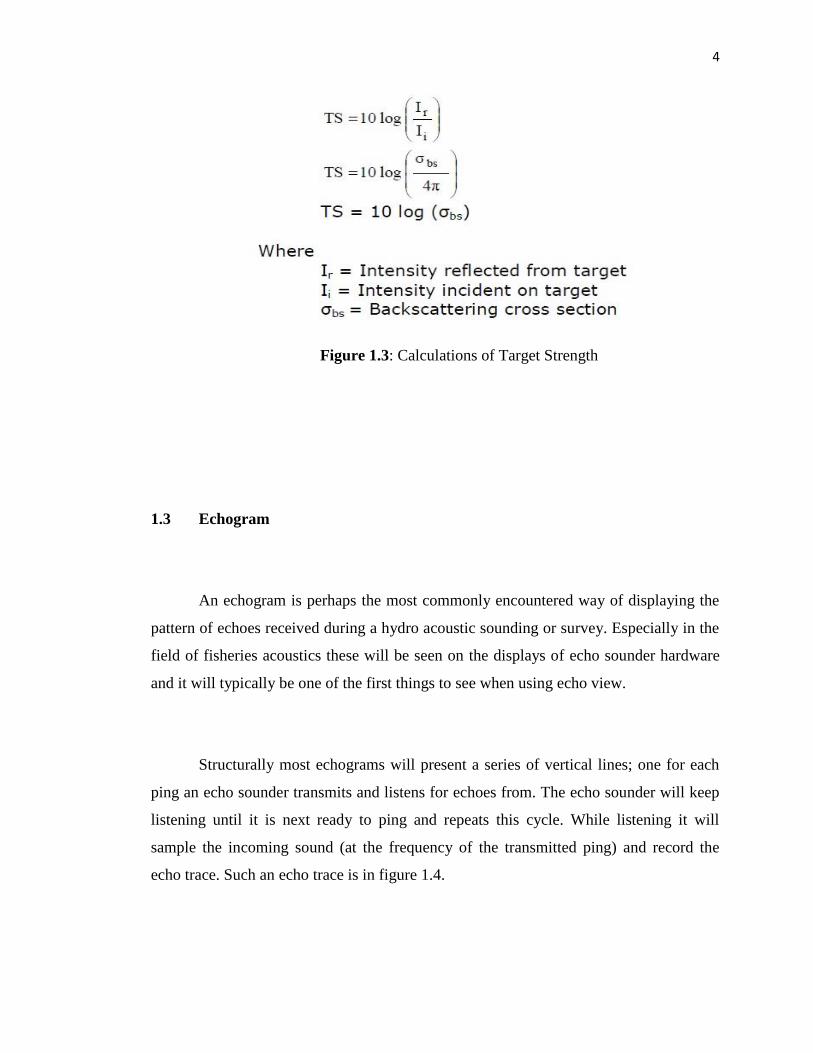
Size and reflectivity of sound are combined into a parameter called the
backscattering cross section (σbs), which is essentially the acoustic size of the object.
The backscattering cross section can be expressed as the amount of reflected sound
intensity measured one meter away from the target, relative to the amount of energy
incident upon the target, as shown in Figure 1.2 and the calculations in figure 1.3.
Figure 1.2: Reflected Echo Sounders
4
Figure 1.3: Calculations of Target Strength
1.3 Echogram
An echogram is perhaps the most commonly encountered way of displaying the
pattern of echoes received during a hydro acoustic sounding or survey. Especially in the
field of fisheries acoustics these will be seen on the displays of echo sounder hardware
and it will typically be one of the first things to see when using echo view.
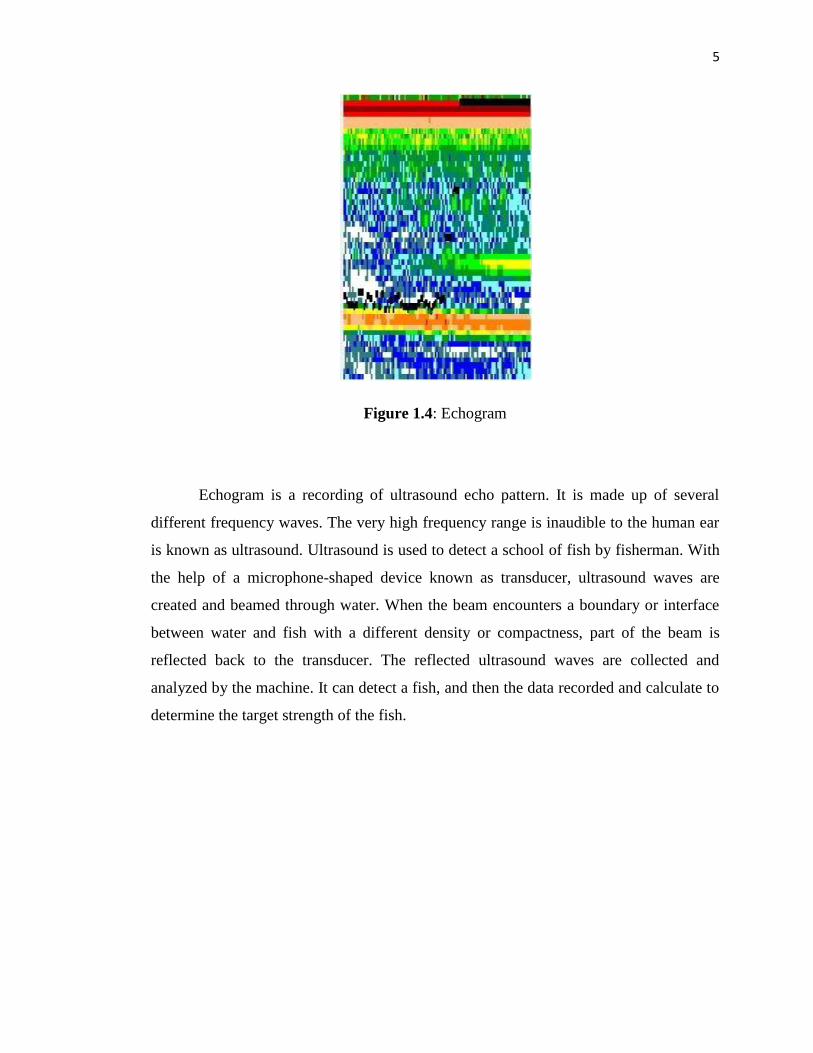
Structurally most echograms will present a series of vertical lines; one for each
ping an echo sounder transmits and listens for echoes from. The echo sounder will keep
listening until it is next ready to ping and repeats this cycle. While listening it will
sample the incoming sound (at the frequency of the transmitted ping) and record the
echo trace. Such an echo trace is in figure 1.4.
5
Figure 1.4: Echogram
Echogram is a recording of ultrasound echo pattern. It is made up of several
different frequency waves. The very high frequency range is inaudible to the human ear
is known as ultrasound. Ultrasound is used to detect a school of fish by fisherman. With
the help of a microphone-shaped device known as transducer, ultrasound waves are
created and beamed through water. When the beam encounters a boundary or interface
between water and fish with a different density or compactness, part of the beam is
reflected back to the transducer. The reflected ultrasound waves are collected and
analyzed by the machine. It can detect a fish, and then the data recorded and calculate to
determine the target strength of the fish.
6
1.4 Image Processing
In electrical engineering and computer science, image processing is any form
of signal processing for which the input is an image, such as a photograph or video
frame; the output of image processing may be either an image or a set of characteristics
or parameters related to the image. Most image-processing techniques involve treating
the image as a two-dimensional signal and applying standard signal-processing
techniques to it.
Image processing usually refers to digital image processing,
but optical and analog image processing also are possible. This article is about general
techniques that apply to all of them. The acquisition of images (producing the input
image in the first place) is referred to as imaging.
1.5 Problem Statement
It is difficult to record the data from ping numbers from top view of TS in the
echogram. The process will took a long time. From echogram, find the position of the
fish using image processing software which is MATLAB. Need image processing
approach to identify TS from echogram in a short time.
7
1.6 Objectives
1. To collect the low frequency data of TS in Furuno software for two different
type of fish.
2. To identify the color component of ping numbers with specific TS using
MATLAB.
3. To compare the color component between two types of fish.
1.7 Project Scope
1. Observe the TS of the fish using top of view TS from FQ-80 Analysers.
2. Determine TS using image processing approach.
3. Compare the result from the top view of TS.
8
1.8 Expected Results
The expected result of this project is the value of color component obtained from
echogram. The coding in MATLAB will determined the color component and identified
the TS value from the echogram.

CHAPTER 2
LITERATURE REVIEW
Target strength of fish based on echogram is improving through research. This is
driven by the needs for data collection, determined the target strength based on image
processing which several method have been developed to create the coding. In this
chapter, some works have been done and the result of these works studied and taken as
background in this project.
2.1 Theory of Target Strength
Echogram is an image of a structure that is produced by echo sounder which the
reflection of high frequency sound waves is. Echo sounder is an older instrumentation
system for indirectly determining ocean floor depth. Echo sounding is based on the
principle that water is an excellent medium for the transmission of sound waves and that
a sound pulse will bounce off a reflecting layer, returning to its source as an echo. The
10
time interval between the initiation of a sound pulse and echo returned from the bottom
can be used to determine the depth of the bottom. An echo-sounding system consists of a
transmitter, a receiver that picks up the reflected echo, electronic timing and
amplification equipment, and an indicator or graphic recorder.
This study discusses to identify the TS for any fish species. Acoustic
backscattering by fish depends on fish size, anatomical characteristics, morphology of
the body, swim bladder, and location in the acoustic beam by Jech & Horne 2002;
Sawada et al 2002 [1].In situ measurement is a method that used by researchers for any
fish, location, and conditions, such as acoustic observation in the Bay of Biscay in 1996
[2]. The usefulness of in situ target strength measurements depends largely on the
reliability of the accompanying biological data by Kenneth G. Foote, Asgeir Aglen, and
Odd Nakken 1986 [3]. Foote showed that a theoretical calculation of TS is possible
using the exact shape of the swimbladder [4].
Fish swimbladder volume will change according to Boyle’s law [5], and Ona [6]
reported the volume and area in three gadoids as a function of pressure. Indeed, the TS
factor depends on several aspects, such as the physiological state of the fish, its behavior
and the time of day by Ona, 1999 [7]. Richard klemm stated that the aim of image
enhancement is to gain an echogram display that is easy to interpret [8].
Due to distortion, noise, segmentation errors, overlap, and occlusion of objects in
color images. Recognition and classification as a technique gained a lot of attention in
the last years wherever many scientists utilize these techniques in order to enhance the
scientific fields. Digital image recognition has been extremely found and studied.
Various approaches in image processing and pattern recognition have been developed by
scientists and engineers to solve this problem [9].
Image recognition is a challenging problem researchers had been research into
this area for so long especially in the recent years, due to distortion, noise, segmentation
errors, overlap, and occlusion of objects in digital images [10].

11
2.2 MATLAB Software
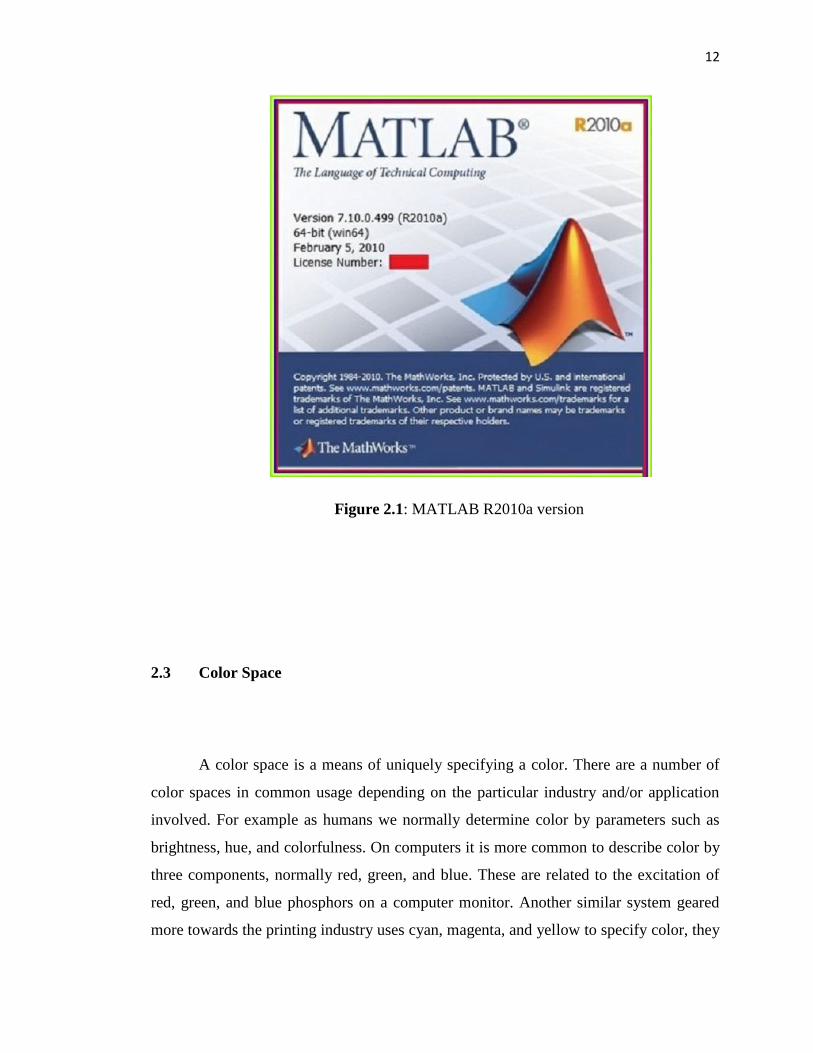
The MATLAB® shows in figure 2.1 is a high-performance language for technical
computing integrates computation, visualization, and programming in an easy-to-use
environment where problems and solutions are expressed in familiar mathematical
notation. It is a high-level technical computing language and interactive environment for
algorithm development, data visualization, data analysis, and numeric computation.
MATLAB is stands for matrix laboratory and is used in a wide range of applications.
It is was originally written to provide easy access to matrix software developed
by the LINPACK and EISPACK projects, which together represent the state-of-the-art
in software for matrix computation. It features a family of application-specific solutions
called toolboxes. Very important to most users of MATLAB, toolboxes allow people to
learn and apply specialized technology. Toolboxes are comprehensive collections of
functions (M-files) that extend the environment to solve particular classes of problems.
Areas in which toolboxes are available include signal processing, control systems, neural
networks, fuzzy logic, wavelets, simulation, and many others [L. Ljung, 2008].
12
Figure 2.1: MATLAB R2010a version
2.3 Color Space
A color space is a means of uniquely specifying a color. There are a number of
color spaces in common usage depending on the particular industry and/or application
involved. For example as humans we normally determine color by parameters such as
brightness, hue, and colorfulness. On computers it is more common to describe color by
three components, normally red, green, and blue. These are related to the excitation of
red, green, and blue phosphors on a computer monitor. Another similar system geared
more towards the printing industry uses cyan, magenta, and yellow to specify color, they
13
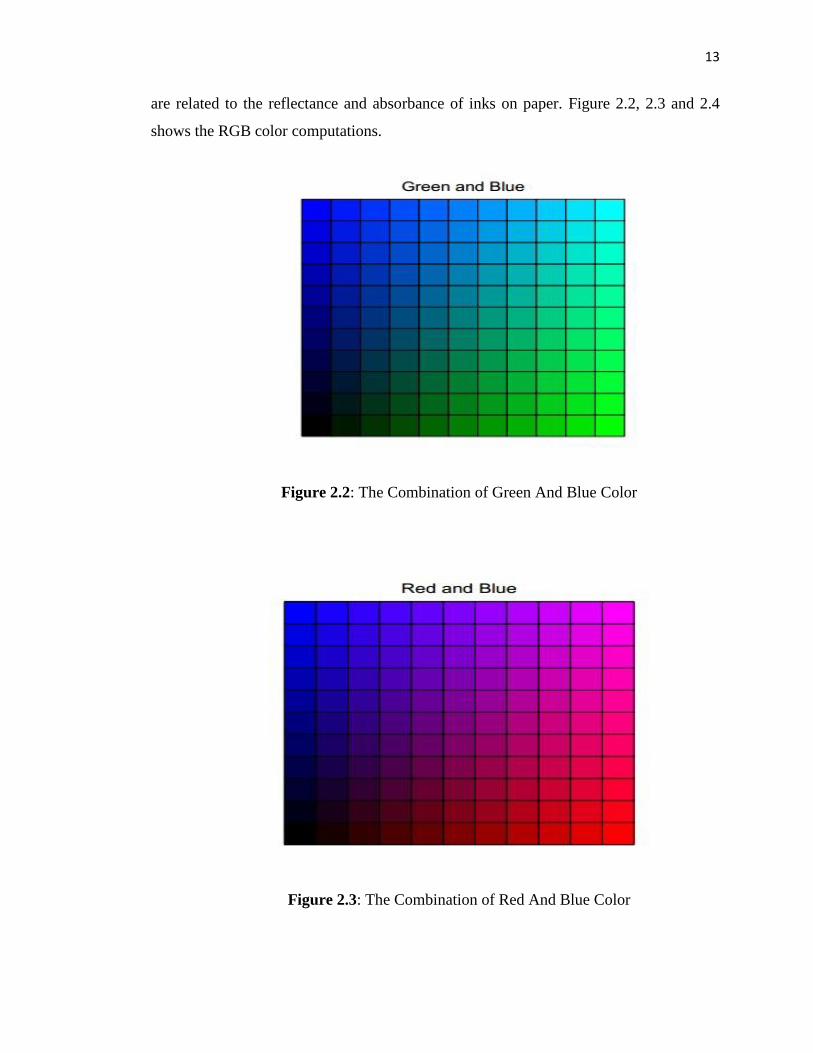
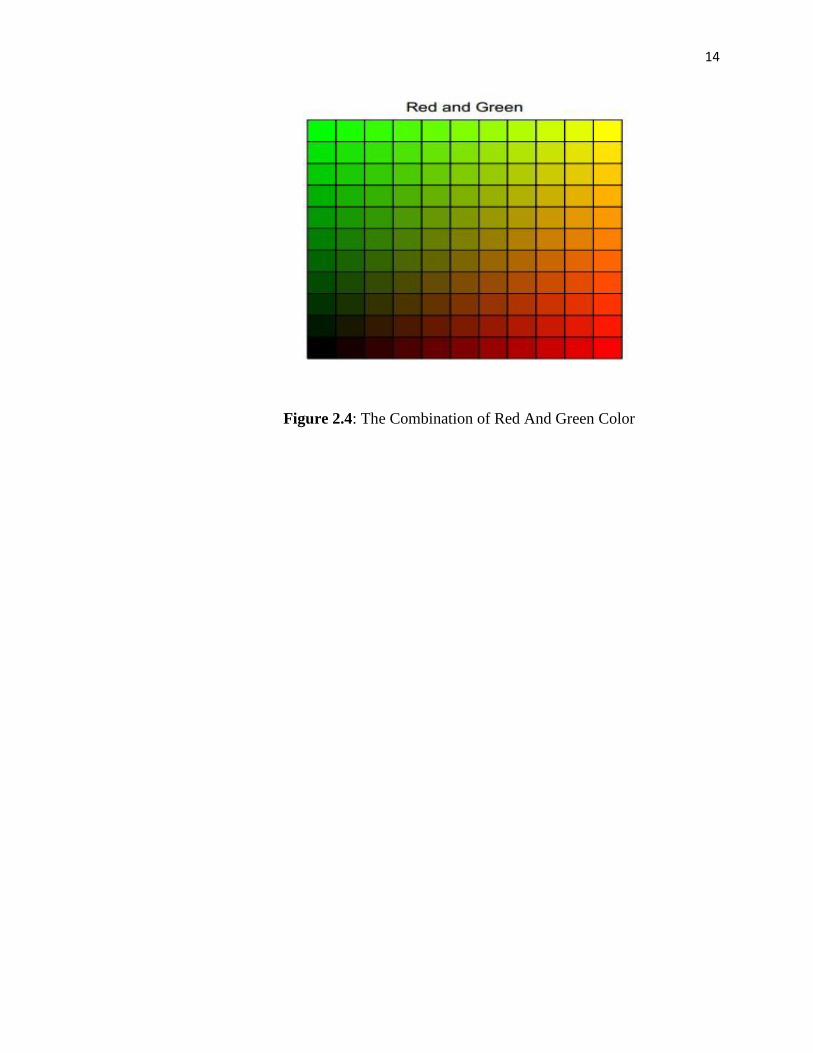
are related to the reflectance and absorbance of inks on paper. Figure 2.2, 2.3 and 2.4
shows the RGB color computations.
Figure 2.2: The Combination of Green And Blue Color
Figure 2.3: The Combination of Red And Blue Color
14
Figure 2.4: The Combination of Red And Green Color