seminar nasional teknik kimia eco-smart 2018repository.ubaya.ac.id/35241/1/rita_mass trasfer...
TRANSCRIPT
u~s UN I\ ERSITAS SEBHAS .~v\ARET
Seminar Nasional Teknik Kimia Eco-SMART
2018
''lnovasi Energi Baru dan Terbarukan
sebaga\ Pendukung Perkembangan
E konom i Nasion a I"

PROSIDING
Seminar N asional Teknik Kimia Eco-Smart 2018
"lnovasi Energi Baru dan Terbarukan sebagai Pendukung Perkembangan Ekonomi N asional"
Diselenggarakan Oleh:
Program Studi Teknik Kimia Bekerjasama dengan Himpunan Mahasiswa Teknik Kimia
F akultas Teknik
Universitas Sebelas Maret
21 Oktober 2018
SEMINAR NASIONAL TEKNIK KIMIA ECOSMART 2018 ~/ 1
""

Waktu: Minggu, 21 Oktober 2018 (07.00-16.00 WIB)
Tempat:
1. Plenary Session
a. Ruang Seminar Utama Gedung III Fakultas Teknik, Universitas Sebelas Maret
2. Parallel Session
a. RUANG I-205 Gedung I Lantai 2 FT UNS
b. RUANG I-207 Gedung I Lantai 2 FT UNS
c. RUANG I-210 Gedung I Lantai 2FT UNS
d. RUANG 1-212 Gedung I Lantai 2FT UNS
Steering Committee: Dr.Margono,S.T.,M.T.,
Ketua Panitia
Wakil Panitia
Sekretaris
Bendahara
lr. Paryanto,M.S.
·~
Dr.Sunu Herwi Pranolo,S.T.,M.Sc.
Anatta Waliyti>Budiman, S.T.,Ph.D. ,
Mujtahid Kaavessina, S.T., M.T,Ph.D.,
Ir.Arif Jumari,M.Sc. ,
Dr.Ari Diana u anti, .T., M.T.
SUSUNAN PANITIA
Dr.Fadilah,S.T.,M.T.
Affiano Akbar Nur Pratama
Dr. Joko Waluyo, S.T.,M.T.
Wakil Bendahara
Dr. Sperisa Distantina,S.T.,M.T.
Eudia Novianty Putri
Sie. Acara
Sie. Perlengkapan
Kesekretariatan
Dr.Adrian Nur,S.T.,M.T.
Muhammad N izar Aldy
Wahyu Daut Utomo
Dinda Sekar Laras
Dr.Dwi Ardiana Setyawardhani , S.T., M.T.
Heru Susanto, S.T.
Nuzila Delayaski
SEMINAR NASIONAL T£KNIK KIMIA ECOSMART 201~

Seminar N asional Teknik Kimia 2018
ISBN 978-602-53946-0-7
Tim Editor
1. Dwi Ardiana Setyawardhani
2.Fadilah
3.Heru Susanto
Tim Reviewer :
1. Dr. Joko Waluto
2. Dr. Sperisa Dtstantina
3. Dr. Adrian Nur
4. Dr. Ari Diana Susanti
5. Dr. Bregas Siswahyono
6. Wusana Agung N,M.T.
Diterbitkan Oleh:
Program Studi Teknik Kimia UNS
Jl. Ir. Sutami No.36A, Jebres, Kota Surakarta, Jawa Tengah
Web : www.sntk-ecosmart.ft.uns.ac.id
Email: [email protected]
~INAR NASIONAL TEKNIK KIMIA ECOSMART 2018

Kata Pengantar
Program Studi S1 Teknik Kimia
Universitas Sebelas Maret
Syukur Alhamdulillah saya sampaikan kepada Allah S~ T yang atas k:uuoja ya lah kegiatan Seminar Nasional Teknik Kimia Ecosmart ( TK 'co mart) ini dapat diselenggarakan. Kcgjatan seminar ini mempakan salah satu dari rangkaian kegiatan Ecodays, sebuah kegiatan tahunan yang dime tori olch Himpunan Mahasiswa Teknjk Kimia U S sebagai wujud kep duliannya tc1·hadap kelestarian lingkungan. Lebih dari iru kegiatan Ecodays juga iliselenggarakan dalam rangka mendorong pengembangan penelitian yang berbasis pada dasar pemikiran akan pencingnya kelestarian lingkungan.
Dalam kesempatan ini, seminar ,nasional SNTK EcoSmart mengundang para peneliti untuk mempresentasikan basil penelitiannya agar bermanfaat bag1 masyarakat luas dan dapat menjadi motivasi bagi Eta para peneliti untuk melakukan pengembangan keilmuan dan keahlian tanpa mengabaikan pentingnya kelestarian lingkungan. SNTK EcoSmart mengangkat sebuah tema 'In vasi Energi B~tru dan Terbarukan Sebagai Pendukung Perkembangan Ekonorni Nasional" dengan harapan dapat mendorong akselerasi penggunaan sumber energi baru da.o terbarukan sebagai pengganti sumber energi fosil yang sudah dicanangkan dalam Rencana Umum Energi Nasional (RUEN). Namun demikian, topik ini tidak bermaksud membatasi artikel hanya pada permasalahan energi tetapi diperlua ke bidang lain scbagaimana kebijakan panitia. Tentunya dengan harapan agar NTK Eco mart kali inj memiliki kemanfaatan yang lebih luas di tengah masyarakat.
Saya mewakili segenap Civitas J\kadcmika Teknik Kimia UNS mengucapkan terima kasih kepada segenap Dosen dan Mahasiswa Teknik Kimia UNS yang dengan sungguh-sungguh telah mempersiapkan penyelenggaraan SNTK EcoSmart dan semua pihak yan<r telah berpartisipasi pada seminar kali ini. Akbir kata, selamat ber"seminar" scmoga bermanfaat bagi perkembangan ilmu dan tcknologi di masyarakat.
Surakarta, 20 Oktober 2018
Kepala Program Studi
Teknik Kimia UNS
Dr. Margono, S.T., M.T
SEMINAR NASIONAL TE KN IK Kl M lA ECOSMART 201,5

Himpunan Mahasiswa Teknik Kimia
Universitas Sebelas Maret
Puji syukur bagi Tuhan Yang Maha Esa atas karunia dan anugerah-Nya sehingga Buku Abstrak Seminar Nasional Teknik Kimia ECO-SMART 2018 dapat terlaksana dengan baik. Seminar Nasional Teknik Kimia ECO-SMART 2018 memiliki tema Inovasi Energi Baru dan Terbarukan Sebagai Pendukung Perkembangan Ekonomi Nasional. Kami selaku panitia Seminar Nasional Teknik Kimia ECO-SMART 2018 mengucapkan terimakasih untuk para pemakalah yang telah berpartisipasi dan seluruh pihak yang membantu dalam pembuatan Buku Abstrak Seminar Nasional Teknik Kimia ECO-SMART 2018.
Pembuatan Buku Prosiding ini diharapkan dapat memberikan informasi dan manfaat bagi peserta yang mengikuti kegiatan Seminar Nasional Teknik Kimia ECOSMART 2018 dengan maksimal. Diharapkan Buku Prosiding ini dapat memuat materi pemakalah dan pembicara dengan baik.
Dalam pcmbuatan Buku Prosiding Seminar Nasional Teknik Kimia ECO-MART 2018 renru masih terdapat kekurangan. Kritik dan saran terhadap pembuatan
Buku Prosiding ini sangat be.rguna bagi kami untuk keberlanjutan pembuatan Buku Pro siding yang mendatang. Semoga .. J,3uku ini dapat memberikan manfaat bagi manusia dan perkembangan ilmu pengetahuan~ teknologi, dan penerapannya di kemudian hari.
~SEMINAR NASIONAL TEKNIK KlMIA ECOSMART 2018
Surakarta, 20 Oktober 2018
Ketua Umum HMTK
Bagas Cahyadi
Daftar lsi
Kata Pengantar Program Studi S1 Teknik Kimia .......................................................... .4
Kata Pengantar Himpunan Mahasiswa Teknik Kimia ................................................... S
Daftar lsi .................................... .......................................................................................... 6
Produksi Bahan Bakar Gas dari Gasifikasi Limbah Kayu Sengon .............................. 9
Sintesis Asam Oktil Lignosulfonat dan Selulosa Sulfat Sebagai Surfaktan dari Limbah Gergaji Kayu Untuk Aplikasi Enhanced Oil Recovery ................................. 16
Efisiensi Energi dalam Pemanfaatan Limbah Panas dengan Boiler Heat Recovery Steam Generator (HRS§) .................. , ........................................................... 27
':· , · <::· :-.}
Pengaruh APR Terhadap Karakterlstik Gas Produser Hasil Gasifikasi Batok Kelapa ................................... ........................................................... .................................. 35
Desain Sistem Fuel Cell Untuk Pembangkit Listrik D-.erah Terpencil ...................................................................... _. ........ L ........................................... 41
Kajian Konsumsi Energi Spesifik Sektor Industri Kimia Di Indonesia Sebagai Acuan Efisiensi Energi ..................................................................................................... 47
Biostimulan Bioremediasi dari Limbah Organik Pasar Sebagai Solusi Pencemaran Limbah Pertambangan Minyak ........... ........ ....................................................... , ............ 55
Penanganan Sampah untuk Mcndukung Pariwisata Desa Labuhan Kertasari Kecamatan Taliwang Kabupaten Sumbawa Barat ........................................................ 64
Kinerja kolom bahan isian penyerap tar hasil gasifikasi kulit buah kakao berbasis minyak pelumas bekas ...... .. ..... ...... .. .. .. ... .. ...... ................ ...... ..... .... .. .... ... ....... .. .. 70
Penurunan Kadar Pb(Ii) Dan Mn(Ii) Pada Sungai Code Dengan Adsorben Limbah Kulit Pisang .... .. ...... ........................................ ............. ........................................ 77
Pemanfaatan Asap Cair Dari Limbah Kulit Kakao Sebagai Antijamur Pada Benih Tanaman Kakao (Thcobroma Cacao L.) ..... ........................ ........................... 89
SEMINAR NASIONAL TEKNIK KfMIA ECOSMART 201 '
Pengaruh perlakuan kimia terhadap karakteristik zeolit alam aktif ............................ 98
Tinjauan Waktu Pengadukan pada Kondisi Kesetimbangan Proses Kompleksasi
Urea Min yak Biji Anggur .............................................................................................. 1 06
Nori Berbasis Rumput Laut Ulva lactuca Linnaeus dan Eucheuma cottonii
: Pengaruh I<:.omposisi ................................................................................................... 114
Pembuatan Susu Kedelai yang Tahan Lama Tanpa Bahan Pengawet .................... 121
Pengaruh J umlah Inokulum terhadag Waktu Fermentasi pad a Pembuatan "')
. . : . ~ft.;-.i;.;. . Yoghurt dan Susu Sapl ........... ~·~&~.l···,:~·········· .. ·································································· 128
.'•' '"'~''*'":.. .. · : . "''#'·'~~
Perlakuan Pendahuluan Limbah Padat Tapioka Menggunakan Natrium Karbonat
untuk Pembuatan Bioetanol melalui Fermentasi Saccharomyces cerevisiae ......... 135
Pengaruh Konsentrasi Pelarut dan Nisbah Bahan Baku dengan Pelarut
Terhadap Ekstraksi Kunyit Putih (Curcuma zcdoria.) .............................................. 142
Pengembangan Gliserol Hasil Samping Biodiesel Pada Produksi Asam Itakonat
Dengan Metode Biosintesis Aspergillus tereus ..... .. .. ......... ............ .. .......................... 151
Pengaruh Pengadukan pada Proses Produksi Alkohol Menggunakan
Saccharomyces cerevisiae ........................... .... ......................................... .. ....... .. ...... .. ... 159
Pcngaruh Penambahan Jumlah Flokulan pada Fcrmcntasi Alkohol
dari Molase Menggunakan Flok Saccharomyces cere\'isiae ...................................... 166
~INAR NASIONAL TEKNIK KIMIA ECOSMART 2018

Bead Gel Berbasis Karagenan, Carboxymethyl Cellulose (CMC), dan Glukomanan sebagai Matrik Pelepasan Pupuk Urea Terkendali .................................................... 172
STUDI PEMBUATAN SPONSS DARI TEPUNG PORANG KUNING (Amorphophallus muelleri Blume) ..................................................................................... 180
Potensi Kulit Pisang Raja (Musa sapientum) sebagai Bahan Baku Pembuatan Biodegradable Fi!Jn ............................................................................................................ 187
Sintesis Biomaterial Hidroksiapatit Porous dengan Prekursor Cangkang Keong Mas dan Porogen Pari Sukun (Artocarpus altilis) ................................................................. 195
Plastik Biodegradable Limbah Nasi .......... ............... ....... .. ................. ........ ..... ............. 203
Sincesis Nano eluJo a d::tri Batang Bambu menggunakan HidroJisis Asam dan Gel mbang Ultrasonik scbagai ad orben Logam Kadmium(IJ) dalam Limbah Industri EJekrropJacing ............................................. ........................... ............................ ...... ...... . 212
SEMINAR NASIONAL TEKNlK KIMIA ECOSMART 20:1
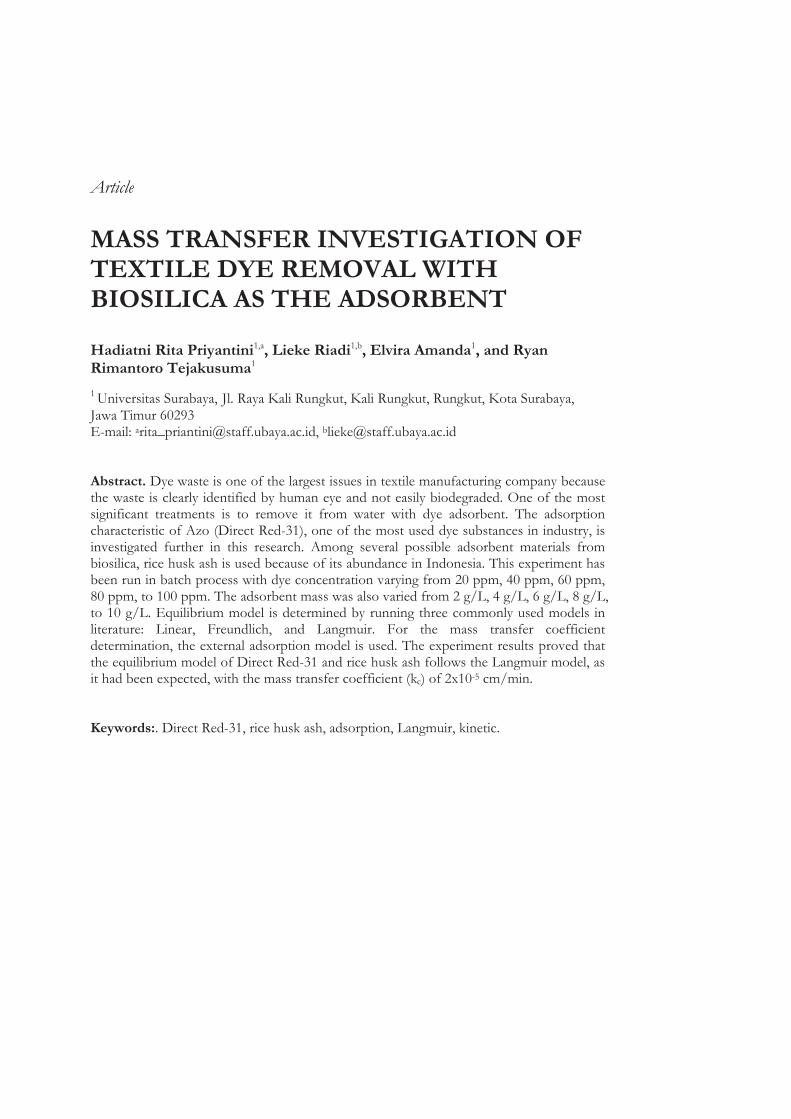
Article MASS TRANSFER INVESTIGATION OF TEXTILE DYE REMOVAL WITH BIOSILICA AS THE ADSORBENT Hadiatni Rita Priyantini1,a, Lieke Riadi1,b, Elvira Amanda1, and Ryan Rimantoro Tejakusuma1 1 Universitas Surabaya, Jl. Raya Kali Rungkut, Kali Rungkut, Rungkut, Kota Surabaya, Jawa Timur 60293 E-mail: [email protected], [email protected] Abstract. Dye waste is one of the largest issues in textile manufacturing company because the waste is clearly identified by human eye and not easily biodegraded. One of the most significant treatments is to remove it from water with dye adsorbent. The adsorption characteristic of Azo (Direct Red-31), one of the most used dye substances in industry, is investigated further in this research. Among several possible adsorbent materials from biosilica, rice husk ash is used because of its abundance in Indonesia. This experiment has been run in batch process with dye concentration varying from 20 ppm, 40 ppm, 60 ppm, 80 ppm, to 100 ppm. The adsorbent mass was also varied from 2 g/L, 4 g/L, 6 g/L, 8 g/L, to 10 g/L. Equilibrium model is determined by running three commonly used models in literature: Linear, Freundlich, and Langmuir. For the mass transfer coefficient determination, the external adsorption model is used. The experiment results proved that the equilibrium model of Direct Red-31 and rice husk ash follows the Langmuir model, as it had been expected, with the mass transfer coefficient (kc) of 2x10⁻⁵ cm/min. Keywords:. Direct Red-31, rice husk ash, adsorption, Langmuir, kinetic.
1. Introduction Indonesia is the third largest producer of Asian rice plant in the world with amount of 75.6 million ton/year (Food and Agriculture Organization of the United Nations, 2015), which has side product from rice milling called rise husks. In general, rice husk is used in ceramic production, brick production, etc. However, on the next level, the application of rice husk ash as biosorbent is not commonly found here. Burnt rice husk can be utilized as biosorbent because it contains high amount of silica. Silica is applied as biosorbent because it has a large surface area and positive charge, therefore it can adsorb dye which normally has negative charge [1]. Initially, rice husk is necessary to be treated by acid to remove the dirts as lignin, cellulose, and hemicellulose [2], as well as increase the electronegativity to improve biosorption capacity [3]. Dye substance is commonly used in several kinds of industry, such as textile, paper, food, cosmetics, and pharmacy. Dyeing process performed by textile industry will produce dye waste of 10-15% [4]. Dye compound is classified as reactive azo type (-N=N-). This dye compound will be degraded into aromatic amine which is colorless yet toxic and carcinogenic [5]. If a waste containing dye compound is thrown away directly to water bodies, it can cause a disturbance in aquatic ecosystem [1]. Waste containing dye compound is generally processed with using electrocoagulation, membrane filtration, ion exchange, ozonation, and adsorption with activated carbon [1]. Adsorbent use such as in activated carbon needs a large cost, therefore alternative use as in rice husk ash is highly demanded [6], especially in industry. Biosorption is one of preferable processes which is easy to apply and has high efficiency [7]. Material that can be used for biosorption process is side products from nature. Those side products are rice husk ash, orange peel, banana peel, wheat straw, sawdust, and bamboo charcoal [8]. In this research, we focus on biosorbent from rice husk ash, because of its abundance in Indonesia. Thus, we investigate further the characteristics of rice husk ash as biosorbent for dye substance Direct Red-31.
2. Materials and Methods This research used biosilica as its main material. Silica is one of the components which can be found in rice husk ash. To extract the silica with high purity from rice husk ash, initial treatment should be performed at the first place. Two main components to perform treatment are acid processing and combustion. The right type of acid should be selected in order to decrease the ion percentage in metal. Secondly, for combustion process, right temperature and duration should be applied in the process. In low pH, biosorbent surface will transition to positive charge and attract negative charged dye substance. Meanwhile, in neutral pH, adsorption will decrease because of hydroxyl ion existence which competes with negative charged dye substance. Decolorization will increase along with the increase of biosorbent mass, because the surface area to adsorb is also larger. A high dye substance concentration results driving force used to pass molecule resistance between liquid phase and solid phase. However, in the long run, adsorbent surface becomes saturated along with existence of adsorbate particle which reduces adsorption capacity from active side. Whereas, in the constant adsorbent mass with increasing concentration will increase the dye substance amount in the solid. From those two experiments, for various pH, adsorbent mass, and dye substance concentrate used for this research is based on the journal of previous work by other researchers [9], because the adsorbent used in this research is the same, which is white rice husk ash. 2.1. Materials 2.1.1. Rice husk ash

Rice husk is one of the materials for producing biosilica which can result silica with purity of 90%. From all components inside rice husk, the percentage of silica is 16.98% [10]. Rice husk ash has a rough physical structure with cellulosic fibers which contains silica in the form of hard fibre. Rice husk ash has density of 70-110 kg/m3 [11]. Morphological structure of rice husk can be seen from scanning electron microscope (SEM) analysis [12]. 2.1.2. Silica Silicon is the second most abundant element in earth’s crust after oxygen. Most of silica is located under the soil. Therefore, silica is an important compound for plants. Silica prevents the plants from disease, sunray, nutrient toxicity, and assists photosynthesis. Silica is a chemical compound formed by oxygen and silicon. Because oxygen and silicon are the first and the second most abundant element in earth’s crust, silica will be easily found in the nature. Silica has property to conduct thermal and electricity in high temperature and can be insulator in low temperature as already written in the silicon’s physical data [13]. It can be found in amorphous form if it originates from animals or plants and in crystalline form if it does not originate from animals or plants, such as if it originates from rocks [14]. The main trait of amorphous silica is its undefined shape and random pattern. Because of its undefined atom structure, amorphous silica structure has spherical and complicated shape. That complicated shape makes the surface area of amorphous silica become wider [14]. Amorphous silica is more reactive than crystalline silica because of hydroxyl group which is obtained after being heated until > 400 0C. Hydroxyl group is found in surface layer of silica and becomes reactive. Amorphous silica is classified as harmless material, but if it is inhaled for 12-18 months, it can cause minor pulmonary infection. Rice husk ash is made up from organic and inorganic compounds. Those organic compounds are such as carbohydrate, protein, fat, amino acid, etc., while the inorganic compounds constructing rice husk ash are from metal group I, such as Li, Na, K, etc. These organic and inorganic compounds should be removed in order to produce pure silica. Compound removal is performed in two levels which are thermal and non-thermal. Dirt removal inside rice husk ash as metal ion and organic compound can be performed with acid solution [15]. This inorganic compound should be removed before combustion because it can prevent amorphous silica formation [16]. This initial treatment will produce silica with high purity in rice husk ash. The acids used are sulfuric acid, chloric acid, nitric acid, acetic acid, and oxalic acid. Oxalic acid is capable to decrease Na composition drastically, therefore oxalic acid is better in metal ion removal and it is harmless for environment [17]. Another method besides removal with acid solution is with combustion or thermal method. Controlled combustion temperature will produce rice husk ash with larger surface area. Perfectly combusted rice husk ash will have white color and amorphous silica form [18]. Amorphous silica formation is performed by drying it, which removes water content. Based on research investigated by other researchers [18], rice husk combustion will produce white ash in temperature of 700 0C, but if the temperature is higher, crystalline silica will be formed. 2.1.3. Direct Red-31 Direct Red-31 is dye substance for textile industry and classified as anionic dye. Direct Red-31 molecule weight is 713.65 g/mol with molecular formula of C32H21N4Na2O8S2. The alternative name for Direct Red-31 is 2-Naphthalenesulfonic acid, 7,7-iminobis4-hydroxy-3-(phenylazo)-, disodium salt. 2.2. Preparation of the Materials Initially, rice husk is washed with sufficient amount of water, then dried naturally before being put in oven in temperature of 105 0C within half an hour. 30 g dry rice husk is treated with oxalic acid 1 N for an hour in temperature of 100 0C, then rinsed with water for three times, then put in oven in temperature of 105 0C

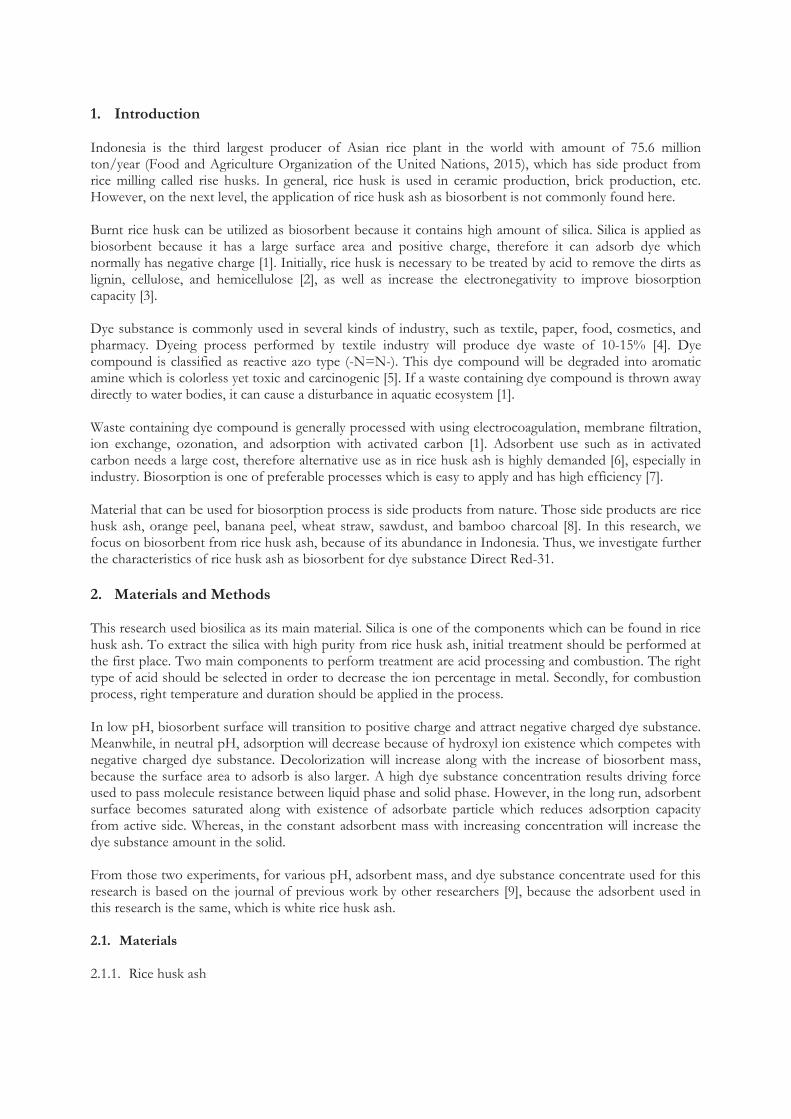
for 2 hours. After rice husk dries, it is then burned in the furnace in temperature of 700 0C for 5 hours with 20 0C increment per minute. Secondly, spectrophotometer blank is prepared. The blank contains water and rice husk ash with adjusting the ratio of each amount depending on how much rice husk ash mass and volume of solution in the adsorption process. Then, water and rice husk ash are centrifuged for 15 minutes and their supernatant is extracted as blank of water and rice husk ash. The flowchart of initial treatment can be seen in Fig. 1. 2.3. Adsorption Experiment Direct Red-31 is dissolved with distilled water of 5 ppm concentration. The solution is put in ultraviolet-visible (UV-Vis) spectrophotometer to obtain the maximum wavelength of Direct red-31. Direct Red-31 solution is made up with various concentrations, from 20 ppm, 40 ppm, 60 ppm, 80 ppm, to 100 ppm. Those solutions are put in UV-Vis spectrophotometer with maximum wavelength, obtaining absorbance value for each concentration. The obtained absorbance is used for making absorbance vs concentration curve, making it as standard curve for Direct Red-31. Direct Red-31 solution with concentration of 20 ppm, 40 ppm, 60 ppm, 80 ppm, and 100 ppm for 200 mL in neutral pH is added with rice husk ash of 2 g/L, 4g/L, 6 g/L, 8 g/L, and 10 g/L to each solution and stirred with a stirrer. Solution sample is extracted with time interval of 10 minutes during 4 hours. The solution sample is diluted and centrifuged, before the absorbance is measured with UV-Vis spectrophotometer in maximum wavelength. With using standard curve, concentration data of each sample can be obtained in the specific time interval. It is performed for each sample variation. The data obtained for each sample is extracted until adsorption process reaches equilibrium. From obtained data, optimum concentration of Direct Red-31 and optimum mass of rice husk ash are determined and applied to the next pH variation experiment which optimum concentration and mass are obtained from the highest removal percentage. Direct Red-31 solution with initial concentration obtained from the previous experiment is added with rice husk ash with optimum mass. The solution is stirred with a stirrer. Variation of pH is 3, 4, 5, 8, and 9 every 10 minutes for 4 hours, where the solution sample is diluted and centrifuged before the absorbance is measured with UV-Vis spectrophotometer in maximum wavelength. With using standard curve, concentration data for each sample obtained for specific time interval can be extracted. It is performed for each sample variation. The data obtained for each sample is extracted until adsorption process reaches equilibrium. From obtained data, optimum pH of Direct Red-31 is determined and applied to the next concentration variation experiment which optimum pH is obtained from the biggest removal percentage. The adsorption experiment flowchart can be seen in Fig. 1. 2.4. Adsorption Isotherm If in dye substance adsorption process dye solution concentration is C0 g/L in V L of solution and mP g of adsorbent mass, the relations between dye concentration in the solution and adsorbed dye substance in the adsorbent’s surface are described in Eq. (1) when adsorption process is running until reaching equilibrium in Eq. (2).
P
L
mVCCq 0 (1)
mVCC
C eqeq
0 (2)
where Cμeq is the equilibrium adsorption amount of dye substance, Ceq is the concentration of equilibrium, CL is dye concentration per time unit, and q is adsorbate concentration in adsorbent per time unit.
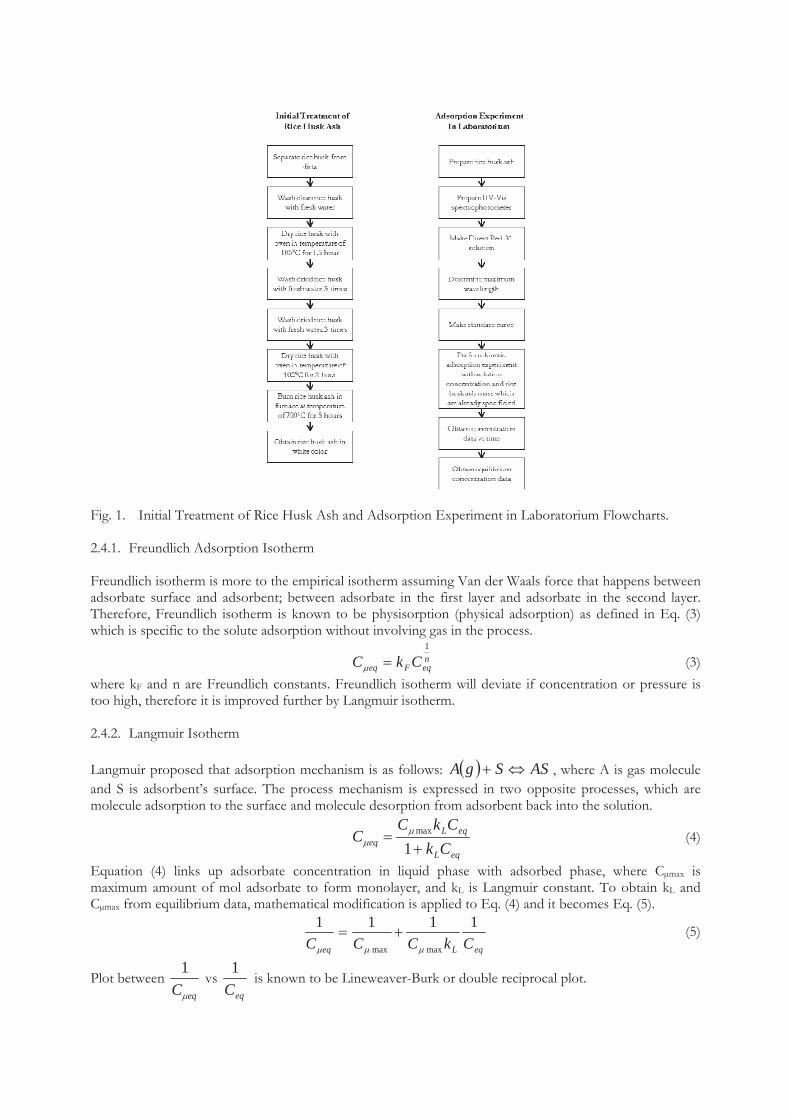
Fig. 1. Initial Treatment of Rice Husk Ash and Adsorption Experiment in Laboratorium Flowcharts. 2.4.1. Freundlich Adsorption Isotherm Freundlich isotherm is more to the empirical isotherm assuming Van der Waals force that happens between adsorbate surface and adsorbent; between adsorbate in the first layer and adsorbate in the second layer. Therefore, Freundlich isotherm is known to be physisorption (physical adsorption) as defined in Eq. (3) which is specific to the solute adsorption without involving gas in the process.
neqFeq CkC1
(3) where kF and n are Freundlich constants. Freundlich isotherm will deviate if concentration or pressure is too high, therefore it is improved further by Langmuir isotherm. 2.4.2. Langmuir Isotherm Langmuir proposed that adsorption mechanism is as follows: ASSgA , where A is gas molecule and S is adsorbent’s surface. The process mechanism is expressed in two opposite processes, which are molecule adsorption to the surface and molecule desorption from adsorbent back into the solution.
eqL
eqLeq Ck
CkCC
1max (4)
Equation (4) links up adsorbate concentration in liquid phase with adsorbed phase, where Cμmax is maximum amount of mol adsorbate to form monolayer, and kL is Langmuir constant. To obtain kL and Cμmax from equilibrium data, mathematical modification is applied to Eq. (4) and it becomes Eq. (5).
eqLeq CkCCC1111
maxmax
(5)
Plot between eqC
1vs
eqC1
is known to be Lineweaver-Burk or double reciprocal plot.

2.4.3. Linear Isotherm Referring to Henry Law, equilibrium in liquid-solid system can be approximated with linear isotherm. Adsorption isotherm with this linear approximation is limited to the low concentration equilibrium, which is below 50 ppm [19]. In this case, concentration in liquid phase is proportional to concentration in solid phase. Ratio between concentration in liquid phase and solid phase is expressed as distribution constant kD as used in Eq. (6).
eqD
eq Ck
C 1 (6)
2.5. Adsorption Kinetics Adsorption with external mass transfer phenomena assumes that adsorption only occurs on the surface of adsorbent and there is no intraparticle concentration gradient. The adsorption mechanism is adsorbate mass transfer in convection from bulk liquid phase to adsorbent’s surface from film layer on the outer surface of adsorbent and adhesion of adsorbate in adsorbent/liquid interface on the adsorbent’s surface. In liquid phase, the declining velocity of adsorbate concentration is defined as mass transfer velocity of solute convection from solution to adsorbent as shown in Eq. (7).
eqC CCV
AkdtdC
(7)
where kC is mass transfer coefficient of convection process, A is surface area of outer adsorbent, C is adsorbate concentration in liquid phase, Ceq is adsorbate concentration on the surface of adsorbent, and V is total volume of solution. Meanwhile, solute mass transfer velocity from solution to adsorbent causes an increase of adsorbate in adsorbent (q) with the same rate, hence Eq. (8).
eqP
C CCm
Akdtdq (8)
where mP is particle mass of adsorbent and q is adsorbate concentration in solid phase. The removal percentage of dye substance from the solution is described as Eq. (9).
%100%0
0
CCC
removal eq (9)
where C0 is initial concentration of dye solution and Ceq is concentration of dye solution in equilibrium point. 2.6. Modeling Mathematical equations are solved with numerical approximation method assisted by MATLAB software. The steps of the modeling are described by flowchart in Fig. 2.

Fig. 2. Flowchart for Adsorption Isotherm Modeling. 3. Results and Discussion The purpose of this research is analyzing adsorption isotherm and kinetics of Direct Red-31 dye substance with rice husk ash adsorbent. Adsorption isotherm is limited to Langmuir, Freundlich, and linear isotherm. From obtained isotherm, mass transfer coefficient for each isotherm is calculated. This research is also investigating the effect of pH in adsorption process for obtaining optimum pH which gives the biggest removal percentage. In this research, Direct Red-31 dye substance is employed as anionic dye compound where this dye substance possesses OH- ion around active site. Meanwhile, rice husk ash has Si4+ ion which gives positive attraction on the surface of adsorbent initiating the adsorption process. Equilibrium curve in Direct Red-31 adsorption process with rice husk ash using UV-Vis spectrophotometer blank containing water and rice husk ask is expressed in Fig. 3.
Fig. 3. Equilibrium Curve for 20 ppm of Direct Red-31 and 10 g/L of Rice Husk Ash Adsorbent.
From Fig. 3, it can be concluded that the data have a strong similarity with Langmuir approximation. It is also supported by these isotherm data in Table 1. Table 1. Equilibrium parameters of Direct Red-31 and rice husk ash.
Isotherm Model Parameter Regression
Langmuir Cμmax 4.59559 mg/g 0.9059 kL 0.11988 L/mg
Freundlich kF 1.16288 0.899 N 0.3539
Linear kD 13.787 g/L 0.8898 From Table 1, it can be seen that the square of regression value of Langmuir isotherm model has the highest value among all, approximately 1, compared to the Freundlich and linear isotherm model. In Langmuir isotherm model, adsorption process follows these assumptions [20].
a. Adsorbent has homogeneous active site and can only adsorb one layer of adsorbate molecule (monolayer)
b. No interaction between adsorbed molecules c. Same mechanism for every adsorption process
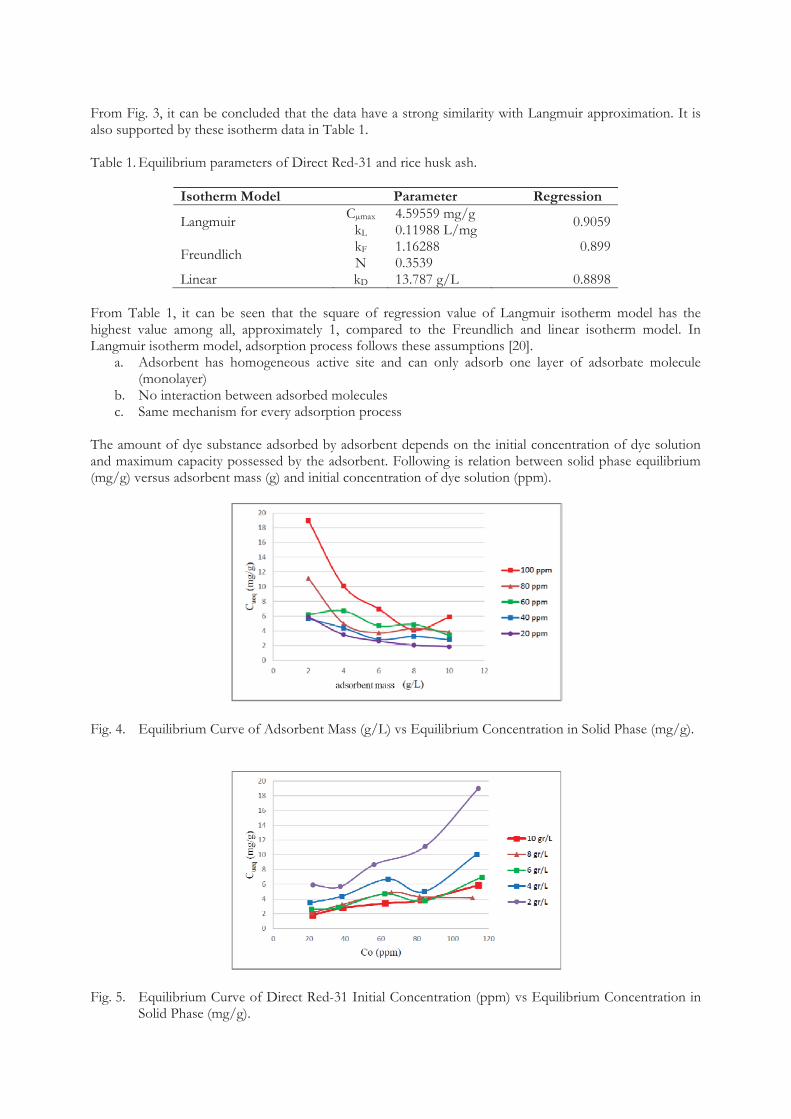
The amount of dye substance adsorbed by adsorbent depends on the initial concentration of dye solution and maximum capacity possessed by the adsorbent. Following is relation between solid phase equilibrium (mg/g) versus adsorbent mass (g) and initial concentration of dye solution (ppm).
Fig. 4. Equilibrium Curve of Adsorbent Mass (g/L) vs Equilibrium Concentration in Solid Phase (mg/g).
Fig. 5. Equilibrium Curve of Direct Red-31 Initial Concentration (ppm) vs Equilibrium Concentration in Solid Phase (mg/g).

From Fig. 4, it can be seen that Cμeq values happen to decrease when adsorbent mass is increasing in the constant dye solution concentration. The larger the adsorbent mass, the more even the adsorbate is distributed following the amount of the adsorbent. From Fig. 5, it can be seen that Cμeq values are increasing when dye solution concentration increases. With constant adsorbent mass and higher dye solution concentration, it is possible that the amount of adsorbed adsorbate is also increasing. Table 2. Cμeq value (mg adsorbate/g adsorbent) for each adsorbent mass variation.
Adsorbent Mass
Dye Solution Concentration 20 ppm 40 ppm 60 ppm 80 ppm 100 ppm
2 g/L 5.9200 5.6818 8.6650 11.1365 19.0011 4 g/L 3.5049 4.3920 6.7058 5.0186 10.1129 6 g/L 2.6257 2.8520 4.6849 3.7476 6.9720 8 g/L 2.0725 3.2548 4.8795 4.3291 4.1350 10 g/L 1.8568 2.7987 3.4100 3.8476 5.8712
From Table 2, the biggest Cμeq value is in the concentration of 100 ppm and adsorbent mass of 2 g/L with value of 19.0011 mg substance/g adsorbent. It means that 19.0011 mg dye substance is adsorbed by 1 g adsorbent. However, Cμeq value in the adsorbent does not indicate that adsorption process is maximum, it can be seen from removal percentage instead. Table 3. Removal percentage (%) for each adsorbent mass variation.
Adsorbent Mass
Dye Solution Concentration 20 ppm 40 ppm 60 ppm 80 ppm 100 ppm
2 g/L 53.5089 30.4125 28.3780 26.3161 33.2588 4 g/L 68.1658 45.8303 41.8697 23.8443 35.6190 6 g/L 73.9857 47.1132 45.1714 26.6059 35.9796 8 g/L 77.7678 67.9895 59.1936 42.4659 29.7866 10 g/L 83.8801 72.0943 54.5589 46.7135 53.9128
From Table 3, the biggest removal percentage is attained in concentration of 20 ppm and adsorbent mass of 10 g/L, which is 83.8801%. Removal percentage describes that 83.88001% is from adsorbed dye substance concentration in the overall adsorbent, not very 1 g of adsorbent. Therefore, initial concentration of dye solution and adsorbent used for next experiments of pH variation are 20 ppm and 10 g/L, respectively. From the experiment, it can be inferred that for linear isotherm model, only adsorbent mass variation gives effect to the linear kinetics. Meanwhile, in the same model with concentration variation, all regression lines are coincident, meaning that initial concentration of dye solution has no effect to the kinetic model. On the other hand, Langmuir and Freundlich isotherm model can approach the experiment data more precisely than linear isotherm model. For each concentration and mass variation, those isotherm models show different curve. Figure 6. shows the accuracy of each isotherm model by plotting the experimental data vs. the modeling. The Fig. 6(b), which is Langmuir model, shows the best fit to the curve. Because the difference of the error is so small that it is not visible from the graphs, the numerical calculation is performed to get the quantitative error, which is provided in Table 4.

Fig. 6. Comparison between Experimental Concentration Data and Concentration Data from Modeling
of Three Models: (a) Linear; (b) Langmuir; and (c) Freundlich. Table 4. Average error (%) for each isotherm model.
Average Error (%)
Isotherm Model Langmuir Freundlich Linear 17.45331 18.02507 31.69087
From the Table 4, it can be seen that the average error of Langmuir isotherm model is the smallest of all, although the difference with Freundlich is not significant. Since Freundlich isotherm is more to the empirical method, which the correlation between equation’s variable and physical parameter is not completely proven yet, Langmuir isotherm model is more preferable to approximate the experimental data. The analysis of pH is performed at the variation which results the best removal percentage. In this case, the initial concentration is 20 ppm and adsorbent mass is 10 g/L with pH varies from 3, 4, 5, 8, to 9 with 0.1 N HCl and 0.1 N NaOH increment. Initially, the solution has the pH of 6. Table 5. Removal percentage (%) for each variation of pH.
Removal
Percentage (%)
pH 3 4 5 6 8 9
87.0904 85.6401 84.3658 83.8801 77.8359 69.4028 From Table 5, the more alkaline the solution, the lower the removal percentage. When the solution pH is acidic, silica molecule with positive charge will be more positive because the surface of the silica is

surrounded by formed H+ ion. This case makes the silica will adsorb more anionic dye substance. On the other hand, if adsorption process occurs in alkaline ambient, OH- ion will be formed and can prevent adsorption process, because of the attraction between OH- molecule and Si4+ molecule. The mass transfer velocity constant (kC) can be calculated based on Eq. (7) with some mathematical work, such as integration in Eq. (8) and numerical method, until the fittest regression curve is obtained. Figure 7. shows the regression method for cuve-fitting with satisfying result. From the regression, the slope is calculated as -0.0133, resulting kC of 1.78x10⁻⁵ cm/min.
tC
C
C eq
tV
AkCC
dC
00
tV
AkCCCC C
eq
eq
0
ln (8)
Fig. 7. Curve-fitting by Linear Regression of Experimental Data.
Fig. 8. Comparison of Experimental Data, Regression Data, and Matlab Modeling. Figure 8 shows the accuracy of each isotherm model compared to experimental data and regression data. Matlab model results kc value of 2x10⁻⁵ cm/min, having the difference of 10.6% from the regression data.
4. Conclusions

Based on this work, it is demonstrated that from pH analysis, maximum adsorption occurred in pH 3. The highest removal percentage is 83.88% with dye solution concentration of 20 ppm and 2 g/L rice husk ash. Direct Red-31 adsorption with rice husk ash satisfied the Langmuir isotherm model with kL is 0.11988 L/mg and Cμmax is 4.59559 mg/g. Mass transfer velocity constant (kC) is 0.00002 cm/minute with Matlab and 0.0000178 cm/minute with regression method. References [1] Safa, Y., Bhatti, H.N. (2011). Kinetic and thermodynamic modeling for the removal of Direct Red-31
and Direct Orange-26 dyes from aqueous solutions by rice husk. Desalination, 272(2011), 313-322. [2] Zhang, Y., Zheng, R., Zhao, J., Ma, F., Zhang, Y., Meng, Q. (2013). Characterization of H3PO4-
Treated Rice Husk Adsorbent and Adsorption of Copper(II) from Aqueous Solution. BioMed Research International, (2011), 496878.
[3] Jalil, A.A., Triwahyono, S., Yakoob, M.R., Azmi, Z.Z.A., Sapawe, N., Kamarudin, N.H.N., Setiabudi, H.D., Jaafar, N.F., Sidik, S.M., Adam, S.H., Hameed, B.H. (2012). Utilization of bivalve shell-treated Zea mays L. (maize) husk leaf as a low-cost biosorbent for enhanced adsorption of malachite green. Bioresource Technology, 120 (2012), 218-244.
[4] Gajera, H.P., Bambharolia, R.P., Hirpara, G.D., Patel, S.V., Golakiya, B.A. (2015). Molecular identification and characterization ofnovel Hypocrea koningii associated with azo dyes decolorization and biodegradation of textile dye effluents. Process Safety and Environmental Protection, 98 (2015), 406-416.
[5] Cripps, C., Bumpus, J.A., Aust, S.D. (1990). Biodegradation of azo and heterocyclic dyes by Phanerochaete chrysosporium. Appl. Environ. Microbiol., 56(4)(1990), 1114-1118.
[6] Sharma, P., Kaur, R., Baskar, C., Chung, W.J. (2010). Removal of methylene blue from aqueous waste using rice husk and rice husk ash. Desalination, 259 (2010), 249-257.
[7] Chakraborty, S., Chowdhury, S., Saha, P.D. (2011). Adsorption of Crystal Violet from aqueous solution onto NaOH-modified rice husk. Carbohydrate Polymers, 86(2011), 1533-1541.
[8] Gupta, V.K., Suhas, J. (2009). Application of low-cost adsorbent for dye removal-A Review. Journal Environment Management, 90(2009),2313-2342.
[9] Tavlieva, M., Genieva, S.D., Georgieva, V.G., Vlaev, L.T. (2012). Application of natural and modified sugar cane bagasse for the removal of dye from aqueous solution. Journal of Saudi Chemical Society.
[10] Luh., B.S., Lu, S. (1991). Properties of The Rice Caryopsis. In Rice Production. 2nd ed. Vol. 1. Luh, B.S. (ed). AVI Publishing Co., Westport, CT. pp 389-314.
[11] Fessenden, R. J., & Fessenden, J. S. (1982). Organic chemistry. Boston, Mass: W. Grant Press. [12] Krishnarao, R.V., Godkhindi, M.M., Chakraborty, M. (1992). J Mater Sci 27: 1227.
https://doi.org/10.1007/BF01142027. [13] Sunardi. (2006). Chemical Element. Yrama Widya, Jakarta. [14] Kirk, R.E., and Othmer. (1984). Encyclopedia of Chemical Technology, Fourth Edition,Vol. 21. John
Wiley and Sons, Inc., New York. [15] Chakraverty, A., Mishra, P., Banerjee, H.D. (1988). Investigation of combustion of raw and acid-
leached rice husk for production of pure amorphous white silica. Journal of Material Science, 23(1988), 21-24.
[16] Chandrasekhar, S., Satyanarayana. K. G., Pramada, P.N., and Raghavan,P. (2003). Review Processing, Properties and Applications of Reactive Silica from Rice Husk—An Overview. Journal of Materials Science, 38(2003), 3159 – 3168.
[17] Chandrasekhar, S., Pramada, P.N, Praveen, L. (2005). Effect of organic acid treatment on the properties of rice husk silica. Journal of Material Science, 40(2005), 6535-6544.
[18] Chakraverty, A., Mishra, P., Banerjee, H.D. (1988). Investigation of combustion of raw and acid-leached rice husk for production of pure amorphous white silica. Journal of Material Science, 23(1988), 21-24.
[19] Duong, D. Do. 1998. Adsorption analysis: equilibria and kinetics. London: Imperial College Press.[20] Atkins, P. (2006). Atkins Physical Chemistry 8th ed. New York: W. H. Freeman and Company.

Seminar Nasional Teknik KimiaEco-SMART
111111111111111111 II I II I 9 786025 394607

. ! j ' . . r ' i r
i : . i i : . ; r t ,
i\1
.oE!c
(u"Eo(L(uf€oY:
ctg
5
t+{f+{
F]
l<
FElA
(5o)o-ooa
ofl(1H
. l{-,At|I(g
. tkF{G
{-tor{
&r l
(1H
{-JG
op{
EG
Frtl
;o(0oolzc$lut-o
€15 E
5{-,cDEEo)e(L