rhb dana islam annual report 2018 - fundsupermart.com malaysia · berhad (“the external...
TRANSCRIPT
RHB Asset Management Sdn Bhd (174588-X)
Head OfficeLevel 8, Tower 2 & 3, RHB Centre Jalan Tun Razak50400 Kuala Lumpur, Malaysia
Tel : +603 9205 8000
Fax : +603 9205 8100
www.rhbgroup.com
RHB DANA ISLAM
ANNUAL REPORT 2018
For the financial year ended 31 March 2018

11
GENERAL INFORMATION ABOUT THE FUND
Name, Category and Type
Fund Name - RHB Dana Islam
Fund Category - Equity fund (Shariah-compliant)
Fund type - Growth fund
Investment Objective, Policy and Strategy
Objective
The Fund aims to provide investors with above average capital growth over a medium to long term* period by investing in a carefully selected portfolio of stocks which complies with the Shariah principles.
*Note: “medium to long term” in this context refers to a period of between 3 – 7 years.
Strategy
The Fund seeks to achieve its objective by structuring a portfolio as follow:
90% - 98% of Net Asset Value
- Investments in Shariah-compliant equity and equity related securities of companies that have good growth potential.
2% - 10% of Net Asset Value
- Investments in Shariah-compliant liquid assets comprising of cash and Islamic deposits with financial institutions, Islamic accepted bills, sukuk, Cagamas Sukuk, GovernmentInvestment Issues and any other Shariah-compliant instrument capable of being converted into cash within seven (7) days.
Subject to the range stipulated above, the asset allocation will be reviewed from time to time depending on the judgement of RHB Islamic International Asset Management Berhad (“the External Investment Manager”) as to the general market and economic conditions.

22
Investment Approach
Our investment philosophy describes the approach that the investment team will adhere to when constructing a Shariah-compliant equities or sukuk portfolio. The fund managers invest in well-managed companies with strong balance sheets that possess competitive advantages that should enable them to outperform their peers over economic cycles. The fund managers are active investors that make high conviction security selection decisions, but at the same time do not take unnecessary or excessive risks nor take speculative positions. The fund managers seek to outperform their peers and beat their benchmark by buying mispriced or cheap securities. Following our disciplined sell strategy, they would then exit positions when our target price is reached. Concurrently, the fund managers understand theFund’s risk profile and act within the Fund’s mandate.

33
Investment Approach
Whenever a Fund invests in Shariah-compliant equities and/or sukuk, the Manager’s investment approach will evolve around the following principles:-
Shariah-compliant equities
Sukuk

44
Performance Benchmark
The performance of the Fund is benchmarked against the FTSE Bursa Malaysia EMAS Shariah Index.
Permitted Investments
This Fund may invest or participate in Shariah-compliant securities trade on the Bursa Malaysia or any other market considered as an eligible market, unlisted Shariah-compliant securities, Islamic collective investment schemes, Islamic financial derivatives, Islamic structured products, Shariah-compliant liquid assets (including Islamic money market instruments and Islamic deposits with any financial institutions), participate in the lending of Shariah-compliant securities that complieswith Shariah requirements, and any other Shariah-compliant investments permittedby the SACSC and/or the Shariah adviser from time to time. Consequently, all investments for this Fund are to be designated as Shariah-compliant and in this regard, the Shariah adviser will advise on the selection of investments to ensure compliance with Shariah requirements.
Distribution Policy
Consistent with the Fund’s objective to achieve capital growth, distributions will therefore be of secondary importance. Distributions, if any, after deduction of taxation and expenses, are generally declared annually and will be reinvested.

55
MANAGER’S REPORT
EQUITIES MARKET REVIEW
It was a mix period for Malaysian equities as we saw investors turning more cautious as investors move away towards defensive big capitalization stocks from higher growth small capitalization stocks. The FTSE Bursa Malaysia Kuala Lumpur Composite Index (“FBM KLCI”) which is the main index for Malaysia closed the period with +7.09% return. Throughout the year, FBM KLCI reached its lowest point of 1,713.13 on 4th of December 2017 and closed its highest point of 1,876.87 on 22nd
March 2018. Other main local indices that registered a good run was FTSE Bursa Malaysia Emas Shariah Index with 3.27% whilst FTSE Bursa Malaysia Small Cap Index and FTSE Bursa Malaysia Small Cap Shariah Index registered negative returns of 13.02% and 16.27% respectively. For the FBM KLCI, bulk of the return happened in the first quarter of year 2018 as uncertainties lingers on implementation on President Trump new tax policies, slowing down of earnings revision by consensus and diminishing anticipation of the 14th General Election happening in second half of year 2017. Malaysia continues to lag behind its regional peers as the KLCI return of +7.09% was weaker against other regional markets like Vietnam which chalked up the highest return of +61.57%, followed by MSCI China with +37.59%. Sectors that outperformed for the period for local equity market are; financial sector via Malayan Banking Berhad (+25.89%) and Public Bank Berhad (+23.78%), broad-based consumer via Nestle Malaysia Berhad (+101.89%), Fraser & Neave Holdings Berhad (+37.08%) and QL Resources Berhad (+46.69%). Property counters are mostly the underperformers as they suffered from weak consumer sentiment on big ticket items as well as abundant of supply of unsold inventories.
Year 2017 calendar year saw a sizeable foreign fund inflow for Malaysian equities market with Malaysian Ringgit (“MYR”) 10.6 billion net buying versus net selling of MYR 29.7 billion by foreigners in year 2014 to year 2016 period. This is the highest value of foreign net buy within the emerging the Association of Southeast Asian Nations (“ASEAN”), followed by Vietnam and Philippines. This pushes the foreign holdings in Malaysia equities to 23.1% at the end of November 2017 from 22.3% in December 2016. However, this is lower compared to 25.2% at the end of May 2013.
ECONOMIC REVIEW & OUTLOOK In the January 2018 update of the World Economic Outlook, International Monetary Fund (“IMF”) had raised global economic growth forecast to 3.7% for year 2017 and 3.9% for year 2018, compared to 3.6% for year 2017 and 3.7% for year 2018 in the October 2017 report. The positive revision mainly from the broad-based upward
66
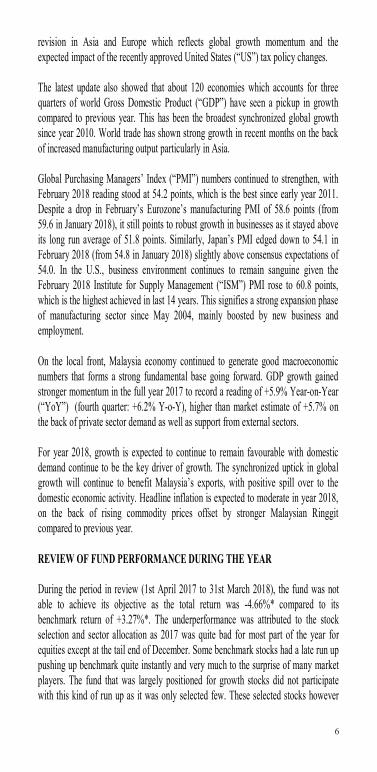
revision in Asia and Europe which reflects global growth momentum and the expected impact of the recently approved United States (“US”) tax policy changes.
The latest update also showed that about 120 economies which accounts for three quarters of world Gross Domestic Product (“GDP”) have seen a pickup in growth compared to previous year. This has been the broadest synchronized global growth since year 2010. World trade has shown strong growth in recent months on the back of increased manufacturing output particularly in Asia.
Global Purchasing Managers’ Index (“PMI”) numbers continued to strengthen, with February 2018 reading stood at 54.2 points, which is the best since early year 2011. Despite a drop in February’s Eurozone’s manufacturing PMI of 58.6 points (from 59.6 in January 2018), it still points to robust growth in businesses as it stayed above its long run average of 51.8 points. Similarly, Japan’s PMI edged down to 54.1 in February 2018 (from 54.8 in January 2018) slightly above consensus expectations of 54.0. In the U.S., business environment continues to remain sanguine given the February 2018 Institute for Supply Management (“ISM”) PMI rose to 60.8 points, which is the highest achieved in last 14 years. This signifies a strong expansion phase of manufacturing sector since May 2004, mainly boosted by new business and employment.
On the local front, Malaysia economy continued to generate good macroeconomic numbers that forms a strong fundamental base going forward. GDP growth gained stronger momentum in the full year 2017 to record a reading of +5.9% Year-on-Year (“YoY”) (fourth quarter: +6.2% Y-o-Y), higher than market estimate of +5.7% on the back of private sector demand as well as support from external sectors.
For year 2018, growth is expected to continue to remain favourable with domestic demand continue to be the key driver of growth. The synchronized uptick in global growth will continue to benefit Malaysia’s exports, with positive spill over to the domestic economic activity. Headline inflation is expected to moderate in year 2018, on the back of rising commodity prices offset by stronger Malaysian Ringgit compared to previous year.
REVIEW OF FUND PERFORMANCE DURING THE YEAR
During the period in review (1st April 2017 to 31st March 2018), the fund was not able to achieve its objective as the total return was -4.66%* compared to its benchmark return of +3.27%*. The underperformance was attributed to the stock selection and sector allocation as 2017 was quite bad for most part of the year for equities except at the tail end of December. Some benchmark stocks had a late run up pushing up benchmark quite instantly and very much to the surprise of many market players. The fund that was largely positioned for growth stocks did not participate with this kind of run up as it was only selected few. These selected stocks however
77
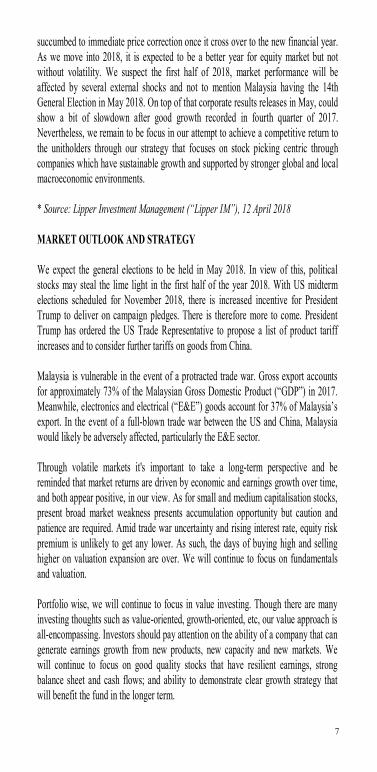
succumbed to immediate price correction once it cross over to the new financial year. As we move into 2018, it is expected to be a better year for equity market but not without volatility. We suspect the first half of 2018, market performance will be affected by several external shocks and not to mention Malaysia having the 14th General Election in May 2018. On top of that corporate results releases in May, could show a bit of slowdown after good growth recorded in fourth quarter of 2017. Nevertheless, we remain to be focus in our attempt to achieve a competitive return to the unitholders through our strategy that focuses on stock picking centric through companies which have sustainable growth and supported by stronger global and local macroeconomic environments.
* Source: Lipper Investment Management (“Lipper IM”), 12 April 2018
MARKET OUTLOOK AND STRATEGY
We expect the general elections to be held in May 2018. In view of this, political stocks may steal the lime light in the first half of the year 2018. With US midterm elections scheduled for November 2018, there is increased incentive for President Trump to deliver on campaign pledges. There is therefore more to come. President Trump has ordered the US Trade Representative to propose a list of product tariff increases and to consider further tariffs on goods from China.
Malaysia is vulnerable in the event of a protracted trade war. Gross export accounts for approximately 73% of the Malaysian Gross Domestic Product (“GDP”) in 2017. Meanwhile, electronics and electrical (“E&E”) goods account for 37% of Malaysia’s export. In the event of a full-blown trade war between the US and China, Malaysia would likely be adversely affected, particularly the E&E sector.
Through volatile markets it's important to take a long-term perspective and be reminded that market returns are driven by economic and earnings growth over time, and both appear positive, in our view. As for small and medium capitalisation stocks, present broad market weakness presents accumulation opportunity but caution and patience are required. Amid trade war uncertainty and rising interest rate, equity risk premium is unlikely to get any lower. As such, the days of buying high and selling higher on valuation expansion are over. We will continue to focus on fundamentals and valuation.
Portfolio wise, we will continue to focus in value investing. Though there are many investing thoughts such as value-oriented, growth-oriented, etc, our value approach is all-encompassing. Investors should pay attention on the ability of a company that can generate earnings growth from new products, new capacity and new markets. We will continue to focus on good quality stocks that have resilient earnings, strong balance sheet and cash flows; and ability to demonstrate clear growth strategy that will benefit the fund in the longer term.
88
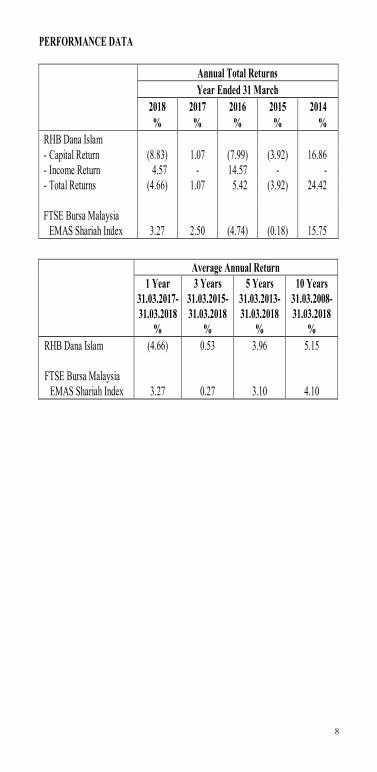
PERFORMANCE DATA
Annual Total ReturnsYear Ended 31 March
2018 2017 2016 2015 2014% % % % %
RHB Dana Islam - Capital Return (8.83) 1.07 (7.99) (3.92) 16.86- Income Return 4.57 - 14.57 - -- Total Returns (4.66) 1.07 5.42 (3.92) 24.42
FTSE Bursa Malaysia EMAS Shariah Index 3.27 2.50 (4.74) (0.18) 15.75
Average Annual Return1 Year
31.03.2017-31.03.2018
%
3 Years31.03.2015-31.03.2018
%
5 Years31.03.2013-31.03.2018
%
10 Years31.03.2008-31.03.2018
%RHB Dana Islam (4.66) 0.53 3.96 5.15
FTSE Bursa Malaysia EMAS Shariah Index 3.27 0.27 3.10 4.10
99
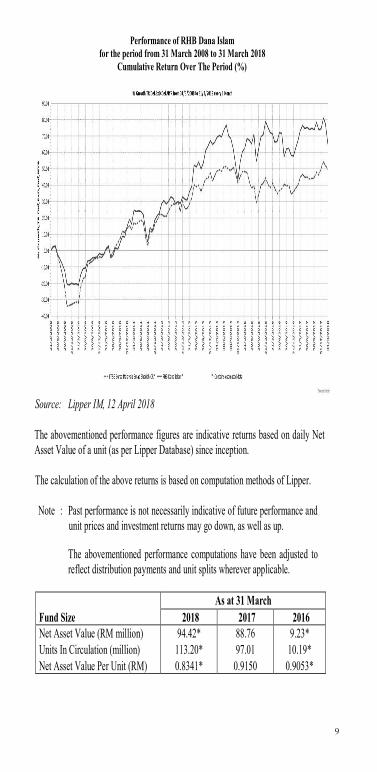
Performance of RHB Dana Islam for the period from 31 March 2008 to 31 March 2018
Cumulative Return Over The Period (%)
Source: Lipper IM, 12 April 2018
The abovementioned performance figures are indicative returns based on daily Net Asset Value of a unit (as per Lipper Database) since inception.
The calculation of the above returns is based on computation methods of Lipper.
Note : Past performance is not necessarily indicative of future performance and unit prices and investment returns may go down, as well as up.
The abovementioned performance computations have been adjusted to reflect distribution payments and unit splits wherever applicable.
Fund SizeAs at 31 March
2018 2017 2016Net Asset Value (RM million) 94.42* 88.76 9.23*Units In Circulation (million) 113.20* 97.01 10.19*Net Asset Value Per Unit (RM) 0.8341* 0.9150 0.9053*
1010
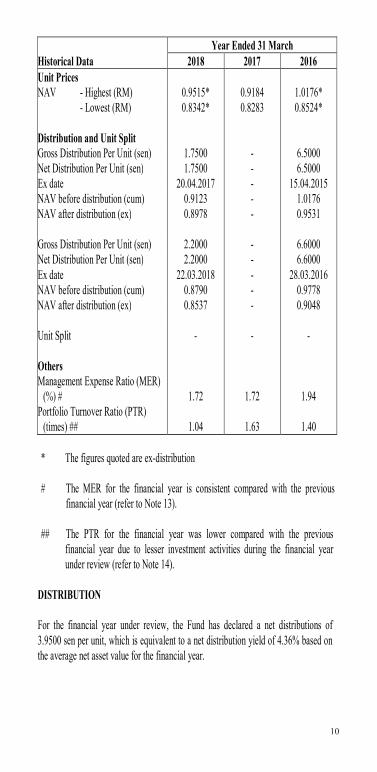
Year Ended 31 MarchHistorical Data 2018 2017 2016Unit PricesNAV - Highest (RM) 0.9515* 0.9184 1.0176*NAV - Lowest (RM) 0.8342* 0.8283 0.8524*
Distribution and Unit SplitGross Distribution Per Unit (sen) 1.7500 - 6.5000Net Distribution Per Unit (sen) 1.7500 - 6.5000Ex date 20.04.2017 - 15.04.2015NAV before distribution (cum) 0.9123 - 1.0176NAV after distribution (ex) 0.8978 - 0.9531
Gross Distribution Per Unit (sen) 2.2000 - 6.6000Net Distribution Per Unit (sen) 2.2000 - 6.6000Ex date 22.03.2018 - 28.03.2016NAV before distribution (cum) 0.8790 - 0.9778NAV after distribution (ex) 0.8537 - 0.9048
Unit Split - - -
OthersManagement Expense Ratio (MER)
(%) # 1.72 1.72 1.94Portfolio Turnover Ratio (PTR)
(times) ## 1.04 1.63 1.40
* The figures quoted are ex-distribution
# The MER for the financial year is consistent compared with the previous financial year (refer to Note 13).
## The PTR for the financial year was lower compared with the previous financial year due to lesser investment activities during the financial year under review (refer to Note 14).
DISTRIBUTION
For the financial year under review, the Fund has declared a net distributions of 3.9500 sen per unit, which is equivalent to a net distribution yield of 4.36% based on the average net asset value for the financial year.
1111
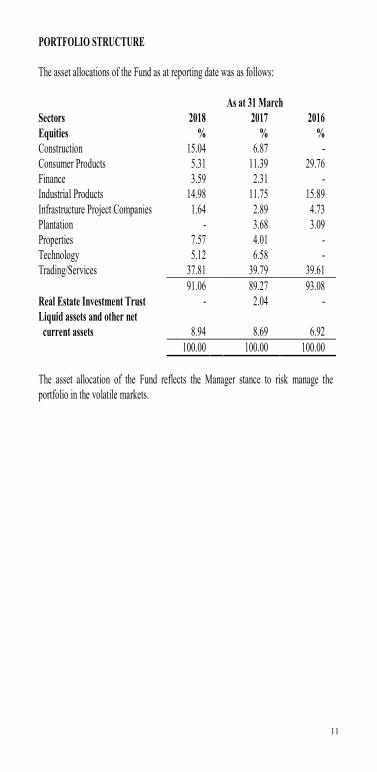
PORTFOLIO STRUCTURE
The asset allocations of the Fund as at reporting date was as follows:
As at 31 MarchSectors 2018 2017 2016Equities % % %Construction 15.04 6.87 -Consumer Products 5.31 11.39 29.76Finance 3.59 2.31 -Industrial Products 14.98 11.75 15.89Infrastructure Project Companies 1.64 2.89 4.73Plantation - 3.68 3.09Properties 7.57 4.01 -Technology 5.12 6.58 -Trading/Services 37.81 39.79 39.61
91.06 89.27 93.08Real Estate Investment Trust - 2.04 -Liquid assets and other net
current assets 8.94 8.69 6.92100.00 100.00 100.00
The asset allocation of the Fund reflects the Manager stance to risk manage the portfolio in the volatile markets.
1212
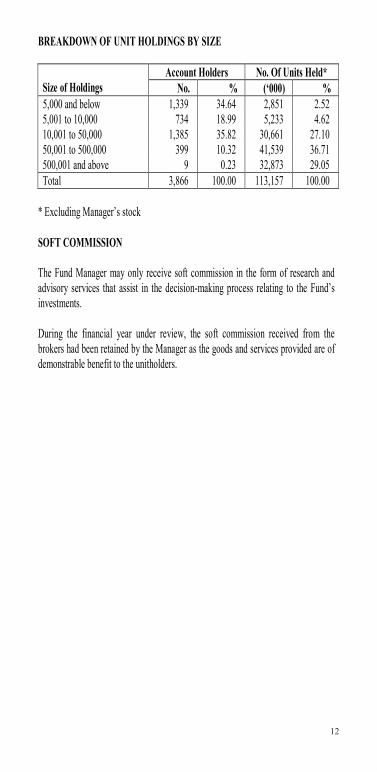
BREAKDOWN OF UNIT HOLDINGS BY SIZE
Size of HoldingsAccount Holders No. Of Units Held*
No. % (‘000) % 5,000 and below 1,339 34.64 2,851 2.52
5,001 to 10,000 734 18.99 5,233 4.6210,001 to 50,000 1,385 35.82 30,661 27.1050,001 to 500,000 399 10.32 41,539 36.71500,001 and above 9 0.23 32,873 29.05Total 3,866 100.00 113,157 100.00
* Excluding Manager’s stock
SOFT COMMISSION
The Fund Manager may only receive soft commission in the form of research and advisory services that assist in the decision-making process relating to the Fund’s investments.
During the financial year under review, the soft commission received from the brokers had been retained by the Manager as the goods and services provided are of demonstrable benefit to the unitholders.

1313
RHB DANA ISLAMSTATEMENT OF FINANCIAL POSITION AS AT 31 MARCH 2018
Note 2018 2017RM RM
ASSETSInvestments 5 85,977,988 81,045,509Islamic deposits with licensed financial
institution 6 4,752,322 7,356,836Bank balances 6 3,759,922 8,045,235Amount due from stockbrokers - 2,931,402Amount due from Manager - 298,179Dividends receivable 188,529 91,983Tax recoverable 364 364TOTAL ASSETS 94,679,125 99,769,508
LIABILITIESAmount due to stockbrokers - 10,874,508Amount due to Manager 100,681 -Accrued management fee 132,068 118,197Amount due to Trustee 5,283 4,728Other payables and accruals 20,129 11,325TOTAL LIABILITIES 258,161 11,008,758
NET ASSET VALUE 94,420,964 88,760,750
EQUITYUnitholders’ capital 97,851,658 82,443,705(Accumulated losses)/retained earnings (3,430,694) 6,317,045
94,420,964 88,760,750
UNITS IN CIRCULATION (UNITS) 8 113,198,739 97,007,000
NET ASSET VALUE PER UNIT (EX-DISTRIBUTION*) (RM) 0.8341* 0.9150
The accompanying notes are an integral part of the financial statements.
16
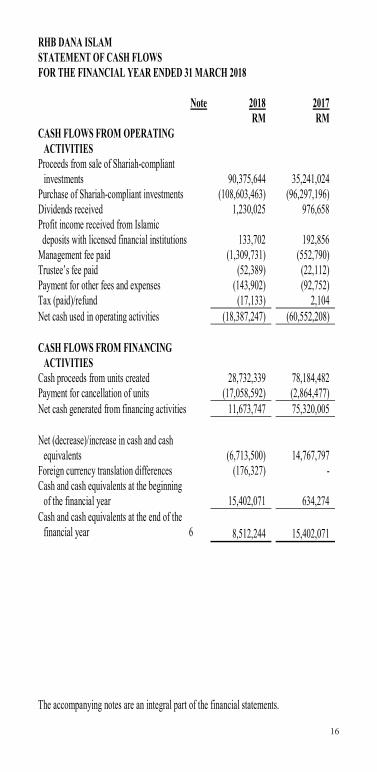
RHB DANA ISLAMSTATEMENT OF CASH FLOWS FOR THE FINANCIAL YEAR ENDED 31 MARCH 2018
Note 2018RM
2017RM
CASH FLOWS FROM OPERATING ACTIVITIES
Proceeds from sale of Shariah-compliant investments 90,375,644 35,241,024
Purchase of Shariah-compliant investments (108,603,463) (96,297,196)Dividends received 1,230,025 976,658Profit income received from Islamic
deposits with licensed financial institutions 133,702 192,856Management fee paid (1,309,731) (552,790)Trustee’s fee paid (52,389) (22,112)Payment for other fees and expenses (143,902) (92,752)Tax (paid)/refund (17,133) 2,104Net cash used in operating activities (18,387,247) (60,552,208)
CASH FLOWS FROM FINANCING ACTIVITIES
Cash proceeds from units created 28,732,339 78,184,482Payment for cancellation of units (17,058,592) (2,864,477)Net cash generated from financing activities 11,673,747 75,320,005
Net (decrease)/increase in cash and cash equivalents (6,713,500) 14,767,797
Foreign currency translation differences (176,327) -Cash and cash equivalents at the beginning
of the financial year 15,402,071 634,274Cash and cash equivalents at the end of the
financial year 6 8,512,244 15,402,071
The accompanying notes are an integral part of the financial statements.
1414
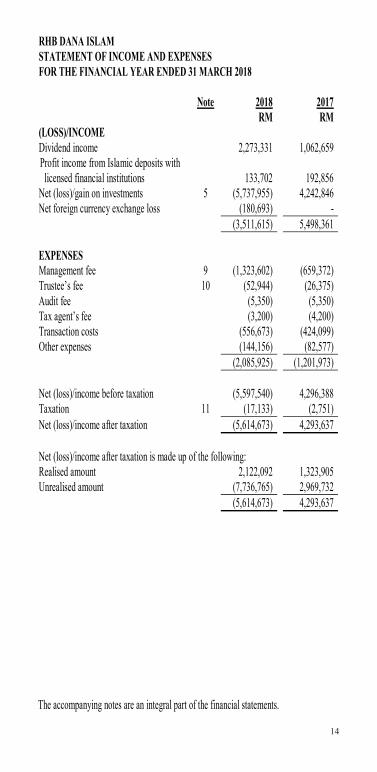
RHB DANA ISLAMSTATEMENT OF INCOME AND EXPENSESFOR THE FINANCIAL YEAR ENDED 31 MARCH 2018
Note 2018 2017RM RM
(LOSS)/INCOMEDividend income 2,273,331 1,062,659
Profit income from Islamic deposits with licensed financial institutions 133,702 192,856
Net (loss)/gain on investments 5 (5,737,955) 4,242,846Net foreign currency exchange loss (180,693) -
(3,511,615) 5,498,361
EXPENSESManagement fee 9 (1,323,602) (659,372)Trustee’s fee 10 (52,944) (26,375)Audit fee (5,350) (5,350)Tax agent’s fee (3,200) (4,200)Transaction costs (556,673) (424,099)Other expenses (144,156) (82,577)
(2,085,925) (1,201,973)
Net (loss)/income before taxation (5,597,540) 4,296,388Taxation 11 (17,133) (2,751)Net (loss)/income after taxation (5,614,673) 4,293,637
Net (loss)/income after taxation is made up of the following:Realised amount 2,122,092 1,323,905Unrealised amount (7,736,765) 2,969,732
(5,614,673) 4,293,637
The accompanying notes are an integral part of the financial statements.
16
RHB DANA ISLAMSTATEMENT OF CASH FLOWS FOR THE FINANCIAL YEAR ENDED 31 MARCH 2018
Note 2018RM
2017RM
CASH FLOWS FROM OPERATING ACTIVITIES
Proceeds from sale of Shariah-compliant investments 90,375,644 35,241,024
Purchase of Shariah-compliant investments (108,603,463) (96,297,196)Dividends received 1,230,025 976,658Profit income received from Islamic
deposits with licensed financial institutions 133,702 192,856Management fee paid (1,309,731) (552,790)Trustee’s fee paid (52,389) (22,112)Payment for other fees and expenses (143,902) (92,752)Tax (paid)/refund (17,133) 2,104Net cash used in operating activities (18,387,247) (60,552,208)
CASH FLOWS FROM FINANCING ACTIVITIES
Cash proceeds from units created 28,732,339 78,184,482Payment for cancellation of units (17,058,592) (2,864,477)Net cash generated from financing activities 11,673,747 75,320,005
Net (decrease)/increase in cash and cash equivalents (6,713,500) 14,767,797
Foreign currency translation differences (176,327) -Cash and cash equivalents at the beginning
of the financial year 15,402,071 634,274Cash and cash equivalents at the end of the
financial year 6 8,512,244 15,402,071
The accompanying notes are an integral part of the financial statements.

1515
RHB DANA ISLAMSTATEMENT OF CHANGES IN NET ASSET VALUEFOR THE FINANCIAL YEAR ENDED 31 MARCH 2018
Unitholders’ capital
Retained earnings
Total netasset value
RM RM RM
Balance as at 1 April 2016 7,203,371 2,023,408 9,226,779Movement in net asset value:
Net income after taxation - 4,293,637 4,293,637Creation of units arising from
applications 78,104,811 - 78,104,811Cancellation of units (2,864,477) - (2,864,477)
Balance as at 31 March 2017 82,443,705 6,317,045 88,760,750
Balance as at 1 April 2017 82,443,705 6,317,045 88,760,750Movement in net asset value:
Net loss after taxation - (5,614,673) (5,614,673)Creation of units arising from
applications 28,434,160 - 28,434,160Creation of units arising from
distribution 4,133,066 - 4,133,066Cancellation of units (17,159,273) - (17,159,273)Distributions (Note 12) - (4,133,066) (4,133,066)
Balance as at 31 March 2018 97,851,658 (3,430,694) 94,420,964
The accompanying notes are an integral part of the financial statements.
16
RHB DANA ISLAMSTATEMENT OF CASH FLOWS FOR THE FINANCIAL YEAR ENDED 31 MARCH 2018
Note 2018RM
2017RM
CASH FLOWS FROM OPERATING ACTIVITIES
Proceeds from sale of Shariah-compliant investments 90,375,644 35,241,024
Purchase of Shariah-compliant investments (108,603,463) (96,297,196)Dividends received 1,230,025 976,658Profit income received from Islamic
deposits with licensed financial institutions 133,702 192,856Management fee paid (1,309,731) (552,790)Trustee’s fee paid (52,389) (22,112)Payment for other fees and expenses (143,902) (92,752)Tax (paid)/refund (17,133) 2,104Net cash used in operating activities (18,387,247) (60,552,208)
CASH FLOWS FROM FINANCING ACTIVITIES
Cash proceeds from units created 28,732,339 78,184,482Payment for cancellation of units (17,058,592) (2,864,477)Net cash generated from financing activities 11,673,747 75,320,005
Net (decrease)/increase in cash and cash equivalents (6,713,500) 14,767,797
Foreign currency translation differences (176,327) -Cash and cash equivalents at the beginning
of the financial year 15,402,071 634,274Cash and cash equivalents at the end of the
financial year 6 8,512,244 15,402,071
The accompanying notes are an integral part of the financial statements.
1616
RHB DANA ISLAMSTATEMENT OF CASH FLOWS FOR THE FINANCIAL YEAR ENDED 31 MARCH 2018
Note 2018RM
2017RM
CASH FLOWS FROM OPERATING ACTIVITIES
Proceeds from sale of Shariah-compliant investments 90,375,644 35,241,024
Purchase of Shariah-compliant investments (108,603,463) (96,297,196)Dividends received 1,230,025 976,658Profit income received from Islamic
deposits with licensed financial institutions 133,702 192,856Management fee paid (1,309,731) (552,790)Trustee’s fee paid (52,389) (22,112)Payment for other fees and expenses (143,902) (92,752)Tax (paid)/refund (17,133) 2,104Net cash used in operating activities (18,387,247) (60,552,208)
CASH FLOWS FROM FINANCING ACTIVITIES
Cash proceeds from units created 28,732,339 78,184,482Payment for cancellation of units (17,058,592) (2,864,477)Net cash generated from financing activities 11,673,747 75,320,005
Net (decrease)/increase in cash and cash equivalents (6,713,500) 14,767,797
Foreign currency translation differences (176,327) -Cash and cash equivalents at the beginning
of the financial year 15,402,071 634,274Cash and cash equivalents at the end of the
financial year 6 8,512,244 15,402,071
The accompanying notes are an integral part of the financial statements.
16
RHB DANA ISLAMSTATEMENT OF CASH FLOWS FOR THE FINANCIAL YEAR ENDED 31 MARCH 2018
Note 2018RM
2017RM
CASH FLOWS FROM OPERATING ACTIVITIES
Proceeds from sale of Shariah-compliant investments 90,375,644 35,241,024
Purchase of Shariah-compliant investments (108,603,463) (96,297,196)Dividends received 1,230,025 976,658Profit income received from Islamic
deposits with licensed financial institutions 133,702 192,856Management fee paid (1,309,731) (552,790)Trustee’s fee paid (52,389) (22,112)Payment for other fees and expenses (143,902) (92,752)Tax (paid)/refund (17,133) 2,104Net cash used in operating activities (18,387,247) (60,552,208)
CASH FLOWS FROM FINANCING ACTIVITIES
Cash proceeds from units created 28,732,339 78,184,482Payment for cancellation of units (17,058,592) (2,864,477)Net cash generated from financing activities 11,673,747 75,320,005
Net (decrease)/increase in cash and cash equivalents (6,713,500) 14,767,797
Foreign currency translation differences (176,327) -Cash and cash equivalents at the beginning
of the financial year 15,402,071 634,274Cash and cash equivalents at the end of the
financial year 6 8,512,244 15,402,071
The accompanying notes are an integral part of the financial statements.
1717
RHB DANA ISLAMNOTES TO THE FINANCIAL STATEMENTSFOR THE FINANCIAL YEAR ENDED 31 MARCH 2018
1. THE FUND, THE MANAGER AND THEIR PRINCIPAL ACTIVITIES
RHB Dana Islam (hereinafter referred to as “the Fund”) was constituted pursuant to the execution of a Deed dated 11 September 2001 as amended via its First Supplemental Deed dated 24 December 2007, Supplemental Master Deed dated 1 June 2009, Second Supplemental Deed dated 4 September 2013, Third Supplemental Deed dated 2 March 2015 and Fourth Supplemental Deed dated 25 May 2015(collectively referred to as “the Deeds”) between RHB Asset Management Sdn Bhd (“the Manager”) and HSBC (Malaysia) Trustee Berhad (“the Trustee”).
The Fund commenced operations on 26 October 2001 and will continue its operations until terminated according to the condition provided in the Deed.
The principal activity of the Fund is to invest in Authorised Investments as defined under the Deed, which includes Shariah-compliant securities traded on Bursa Malaysia and short-term Islamic money market instruments.
All investments will be subject to the Securities Commission Malaysia’s (“SC”) Guidelines on Unit Trust Funds, SC requirements, the Deeds, except where exemptions or variations have been approved by the SC, internal policies and procedures and objective of the Fund.
The main objective of the Fund is to provide investors with above average capital growth over a medium to long term period by investing in a carefully selected portfolio of stocks which complies with the Shariah Principles.
The Manager is a company incorporated in Malaysia and is a wholly-owned subsidiary of RHB Investment Bank Berhad, effective 6 January 2003. Its principal activities include rendering of investment management services, management of unit trust funds, private retirement schemes and provision of investment advisory services.
These financial statements were authorised for issue by the Manager on 25 May 2018.
1818
2. SUMMARY OF SIGNIFICANT ACCOUNTING POLICIES
2.1 Basis of preparation of the financial statements
The financial statements have been prepared under the historical cost convention, as modified by financial assets and financial liabilities (including derivative instruments) at fair value through profit or loss, except as disclosed in the summary of significant accounting policies, and in accordance with Malaysian Financial Reporting Standards (“MFRS”) and International Financial Reporting Standards (“IFRS”).
The preparation of financial statements in conformity with MFRS and IFRS requires the use of certain critical accounting estimates and assumptions that affect the reported amounts of assets and liabilities and disclosure of contingent assets and liabilities at the date of the financial statements, and the reported amounts of revenues and expenses during the financial year. It also requires the Manager to exercise its judgement in the process of applying the Fund’s accounting policies. Although these estimates and judgement are based on the Manager’s best knowledge of current events and actions, actual results may differ.
(a) The Fund has applied the following amendments for the first time for the financial year beginning on 1 April 2017:
Amendments to MFRS 107 “Statement of Cash Flows – Disclosure Initiative” (effective from 1 January 2017) introduce an additional disclosure on changes in liabilities arising from financing activities.
The adoption of these amendments did not have any impact on the current year or any prior period and is not likely to affect future periods.
1919
2. SUMMARY OF SIGNIFICANT ACCOUNTING POLICIES(CONTINUED)
2.1 Basis of preparation of the financial statements (continued)
(b) The new standards and amendments to published standards which are relevant to the Fund but not yet effective and have not been early adopted are as follows:
(i) Financial year beginning on/after 1 April 2018
MFRS 9 “Financial Instruments” (effective from 1 January 2018) will replace MFRS 139 “Financial Instruments: Recognition and Measurement”.
MFRS 9 retains but simplifies the mixed measurement model in MFRS 139 and establishes three primary measurement categories for financial assets: amortised cost, fair value through profit or loss and fair value through other comprehensive income (“OCI”). The basis of classification depends on the entity’s business model and the contractual cash flow characteristics of the financial asset. Investments in equity instruments are always measured at fair value through profit or loss with an irrevocable option at inception to present changes in fair value in OCI (provided the instrument is not held for trading). A debt instrument is measured at amortised cost only if the entity is holding it to collect contractual cash flows and the cash flows represent principal and profit.
For liabilities, the standard retains most of the MFRS 139 requirements. These include amortised cost accounting for most financial liabilities, with bifurcation of embedded derivatives. The main change is that, in cases where the fair value option is taken for financial liabilities, the part of a fair value change due to an entity’s own credit risk is recorded in other comprehensive income rather than in profit or loss, unless this creates an accounting mismatch.
MFRS 9 introduces an expected credit loss model on impairment that replaces the incurred loss impairment model used in MFRS 139. The expected credit loss model is forward-looking and eliminates the need for a trigger event to have occurred before credit losses are recognised.
The above standards and amendments to published standards are not expected to have a significant impact on the Fund’s financial statements.
2020
2. SUMMARY OF SIGNIFICANT ACCOUNTING POLICIES (CONTINUED)
2.2 Financial assets
Classification
Financial assets are designated as fair value through profit or loss when they are managed and their performance are evaluated on a fair value basis.
The Fund designates its investments in quoted Shariah-compliant investments as financial assets at fair value through profit or loss at inception.
Financing and receivables are non-derivative financial assets with fixed or determinable payments that are not quoted in an active market and have been included in current assets. The Fund’s financing and receivables comprise cash and cash equivalents, amount due from stockbrokers, amount due from Manager and dividend receivable which are all due within 12 months.
Recognition and measurement
Regular purchases and sales of financial assets are recognised on the trade date, the date on which the Fund commits to purchase or sell the asset. Investments are initially recognised at fair value. Subsequent to initial recognition, financial assets at fair value through profit or loss are measured at fair value.
Transaction costs are costs incurred to acquire or dispose financial assets or liabilities at fair value through profit or loss. They include fees and commissions paid to agents, advisors, brokers and dealers. Transaction costs, when incurred, are immediately recognised in the statement of comprehensive income as expenses.
Financial assets are derecognised when the rights to receive cash flows from the investments have expired or have been transferred and the Fund has transferred substantially all risks and rewards of ownership.
Unrealised gains or losses arising from changes in the fair value of the financialassets at fair value through profit or loss are presented in profit or loss within net gain on financial assets at fair value through profit or loss in the financial year which they arise.
2121
2. SUMMARY OF SIGNIFICANT ACCOUNTING POLICIES (CONTINUED)
2.2 Financial assets (continued)
Recognition and measurement (continued)
Quoted Shariah-compliant investments is initially recognised at fair value and subsequently re-measured at fair value based on the market price quoted on the relevant stock exchanges at the close of the business on the valuation day, where the close price falls within the bid-ask spread. In circumstances where the close price is not within the bid-ask spread, the Manager will determine the point within the bid-ask spread that is most representative of the fair value.
If a valuation based on the market price does not represent the fair value of the securities, for example during abnormal market conditions or when no market price is available, including in the event of a suspension in the quotation of the securities for a period exceeding 14 days, or such shorter period as agreed by the Trustee, then the securities are valued as determined in good faith by the Manager, based on the methods or bases approved by the Trustee after appropriate technical consultation.
Islamic deposits with licensed financial institutions are stated at cost plus accrued profit calculated on the effective profit method over the period from the date of placement to the date of maturity of the respective deposits.
Financing and receivables are subsequently carried at amortised cost using the effective profit method.
Impairment of financial assets
For assets carried at amortised cost, the Fund assesses at the end of the financial yearwhether there is objective evidence that a financial asset or group of financial assets is impaired. A financial asset or a group of financial assets is impaired and impairment losses are incurred only if there is objective evidence of impairment as a result of one or more events that occurred after the initial recognition of the asset (a ‘loss event’) and that loss event (or events) has an impact on the estimated future cash flows of the financial asset or group of financial assets that can be reliably estimated.
2222
2. SUMMARY OF SIGNIFICANT ACCOUNTING POLICIES (CONTINUED)
2.3 Financial liabilities
Financial liabilities are classified according to the substance of the contractual arrangements entered into and the definitions of a financial liability.
Financial liabilities, within the scope of MFRS 139 “Financial Instruments: Recognition and Measurement”, are recognised in the statement of financial position when, and only when, the Fund becomes a party to the contractual provisions of the financial instrument.
The Fund’s financial liabilities which include amount due to stockbrokers, amount due to Manager, accrued management fee, amount due to Trustee and other payables and accruals are recognised initially at fair value plus directly attributable transaction costs, and subsequently measured at amortised cost using the effective profit method.
A financial liability is derecognised when the obligation under the liability is extinguished. Gains and losses are recognised in profit or loss when the liabilities are derecognised, and through the amortisation process.
2.4 Unitholders’ capital
The unitholders’ contributions to the Fund meet the criteria of the definition of puttable instruments to be classified as equity instruments under MFRS 132 “Financial Instruments: Presentation”. Those criteria include:
the units entitle the holder to a proportionate share of the Fund’s net assets value; the units are the most subordinated class and class features are identical; there is no contractual obligations to deliver cash or another financial asset other
than the obligation on the Fund to repurchase; and the total expected cash flows from the units over its life are based substantially on
the profit or loss of the Fund.
The outstanding units are carried at the redemption amount that is payable at each financial year if unitholder exercises the right to put the unit back to the Fund.
Units are created and cancelled at prices based on the Fund’s net asset value per unit at the time of creation or cancellation. The Fund’s net asset value per unit is calculated by dividing the net assets attributable to unitholders with the total number of outstanding units.
2323
2. SUMMARY OF SIGNIFICANT ACCOUNTING POLICIES (CONTINUED)
2.5 Distribution
Distribution to the Fund’s unitholders is accounted for as a deduction from realised reserves. A proposed distribution is recognised as a liability in the period in which it is approved by the Trustee.
2.6 Income recognition
Dividend income from quoted Shariah-compliant investments is recognised when the Fund’s right to receive payment is established.
Profit income from Islamic deposits with licensed financial institutions is recognised on an accrual basis using the effective profit method.
Realised gain or loss on sale of quoted Shariah-compliant investments is arrived at after accounting for cost of investments, determined on the weighted average cost method.
Net income or loss is the total of income less expenses.
2.7 Taxation
Current tax expense is determined according to Malaysian tax laws and includes all taxes based upon the taxable income earned during the financial year.
Tax on dividend income from foreign quoted securities is based on the tax regime of the respective countries that the Fund invests in.
2.8 Cash and cash equivalents
For the purpose of the statement of cash flows, cash and cash equivalents comprise bank balance and Islamic deposits with licensed financial institutions which are subject to an insignificant risk of changes in value.
These amounts are recognised initially at fair value and subsequently measured atamortised cost using the effective profit method, less impairment for amounts duefrom brokers. See Note 2.2 on impairment of financial assets.
2424
2. SUMMARY OF SIGNIFICANT ACCOUNTING POLICIES (CONTINUED)
2.9 Amount due from/to stockbrokers
Amounts due from and due to stockbrokers represent receivables for securities sold and payables for securities purchased that have been contracted for but not yet settled or delivered on the date of the statement of financial position respectively.
2.10 Presentation and functional currency
Items included in the financial statements of the Fund are measured using the currency of the primary economic environment in which the Fund operates (the “functional currency”). The financial statements are presented in Ringgit Malaysia, which is the Fund’s presentation and functional currency.
Due to mixed factors in determining the functional currency of the Fund, the Manager has used its judgement to determine the functional currency that most faithfully represents the economic effects of the underlying transactions, events and conditions and have determined the functional currency to be in RM primarily due to the following factors:
• The Fund’s cash is denominated in RM for the purpose of making settlement of the creation and cancellation.
• The Fund’s units are denominated in RM.• The Fund’s expenses are denominated in RM.
2.11 Foreign currency translation
Foreign currency transactions are translated into the functional currency using the exchange rates prevailing at the dates of the transactions or valuation where items are remeasured. Foreign exchange gains and losses resulting from the settlement of such transactions and from the translation at period end exchange rates of monetary assets and liabilities denominated in foreign currencies are recognised in profit or loss.
2.12 Segmental information
Operating segments are reported in a manner consistent with the internal reporting used by the chief operating decision-maker. The operating results are regularly reviewed by the Manager and the Investment Committee. The Investment Committee assumes the role of chief operating decision maker, for performance assessment purposes and to make decisions about resources allocated to the investment segment based on the recommendation by the Investment & Security Selection Committee.
2525
3. FINANCIAL RISK MANAGEMENT OBJECTIVES AND POLICIES
The Fund is exposed to a variety of risks, which include market risk, price risk, profit rate risk, currency risk, credit risk, liquidity risk, Shariah specific risk and capital risk.
Financial risk management is carried out through internal control processes adopted by the Manager and adherence to the investment restrictions as stipulated in the Securities Commission Malaysia Guidelines on Unit Trust Funds.
Market risk
Securities may decline in value due to factors affecting securities markets generally or particular industries represented in the securities markets. The value of a security may decline due to general market conditions which are not specifically related to a particular company, such as real or perceived adverse economic conditions, changes in the general outlook for corporate earnings, changes in profit or currency rates or adverse investors’ sentiment generally. They may also decline due to factors that affect a particular industry or industries, such as labour shortages or increased production costs and competitive conditions within an industry. Equity securities generally have greater price volatility than fixed income securities. The market price of securities owned by a unit trust fund might go down or up, sometimes rapidly or unpredictably.
Price risk
Price risk is the risk that the fair value of the investments of the Fund will fluctuatebecause of changes in market prices.
The Fund is exposed to equity security price risk for it investments of RM85,977,988 (2017: RM81,045,509) in quoted Shariah-compliant investments.
The sensitivity analysis is based on the assumption that the price of the quoted securities investments fluctuate by +/(-) 5% with all other variables held constant, the impact on the net income/loss is +/(-) RM4,298,899 (2017: RM4,052,275).

2626
3. FINANCIAL RISK MANAGEMENT OBJECTIVES AND POLICIES (CONTINUED)
Profit rate risk
Profit rate risk is the risk that cost or the value of the financial instruments will fluctuate due to changes in market profit rates. The Fund’s exposure to the profit rate risk is mainly from short term placements with financial institutions. The Manager overcomes the exposure by way of maintaining Islamic deposits on short-term basis. Therefore, exposure to profit rate fluctuation is minimal.
Currency risk
Currency risk is associated with financial instruments that are quoted and/or priced in foreign currency denomination. Malaysian based investor should be aware that if the Ringgit Malaysia appreciates against the currencies in which the portfolio of the investment is denominated, this will have an adverse effect on the net asset value of the fund and vice versa. Investors should note any gains or losses arising from the movement of foreign currencies against its home currency may therefore increase or decrease the capital gains of the financial instruments. Nevertheless, investors should realise that currency risk is considered as one of the major risks to financial instruments in foreign assets due to the volatile nature of the foreign exchange market.
The sensitivity of the Fund’s net asset value attributable to unitholders as at reporting date to changes in foreign exchange movements at the end of each financial year. The analysis is based on the assumption that the foreign exchange rate fluctuates by +/(-) 5%, with all other variables remain constants, is +/(-) RM741,644 (2017: Nil).
2727
3. FINANCIAL RISK MANAGEMENT OBJECTIVES AND POLICIES (CONTINUED)
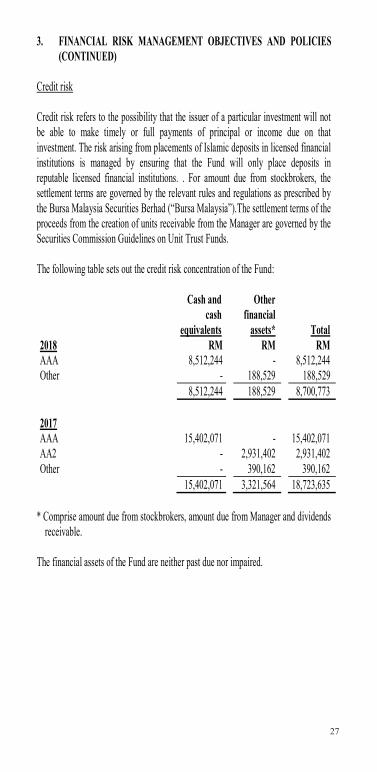
Credit risk
Credit risk refers to the possibility that the issuer of a particular investment will not be able to make timely or full payments of principal or income due on that investment. The risk arising from placements of Islamic deposits in licensed financial institutions is managed by ensuring that the Fund will only place deposits in reputable licensed financial institutions. . For amount due from stockbrokers, the settlement terms are governed by the relevant rules and regulations as prescribed by the Bursa Malaysia Securities Berhad (“Bursa Malaysia”).The settlement terms of the proceeds from the creation of units receivable from the Manager are governed by the Securities Commission Guidelines on Unit Trust Funds.
The following table sets out the credit risk concentration of the Fund:
Cash andcash
equivalents
Otherfinancial
assets* Total2018 RM RM RMAAA 8,512,244 - 8,512,244Other - 188,529 188,529
8,512,244 188,529 8,700,773
2017AAA 15,402,071 - 15,402,071AA2 - 2,931,402 2,931,402Other - 390,162 390,162
15,402,071 3,321,564 18,723,635
* Comprise amount due from stockbrokers, amount due from Manager and dividendsreceivable.
The financial assets of the Fund are neither past due nor impaired.
2828
3. FINANCIAL RISK MANAGEMENT OBJECTIVES AND POLICIES (CONTINUED)
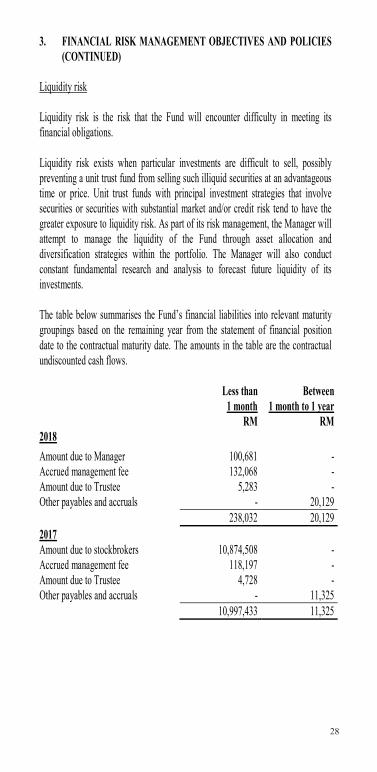
Liquidity risk
Liquidity risk is the risk that the Fund will encounter difficulty in meeting its financial obligations.
Liquidity risk exists when particular investments are difficult to sell, possibly preventing a unit trust fund from selling such illiquid securities at an advantageous time or price. Unit trust funds with principal investment strategies that involve securities or securities with substantial market and/or credit risk tend to have the greater exposure to liquidity risk. As part of its risk management, the Manager will attempt to manage the liquidity of the Fund through asset allocation and diversification strategies within the portfolio. The Manager will also conduct constant fundamental research and analysis to forecast future liquidity of its investments.
The table below summarises the Fund’s financial liabilities into relevant maturity groupings based on the remaining year from the statement of financial position date to the contractual maturity date. The amounts in the table are the contractual undiscounted cash flows.
Less than 1 month
Between 1 month to 1 year
RM RM2018Amount due to Manager 100,681 -Accrued management fee 132,068 -Amount due to Trustee 5,283 -Other payables and accruals - 20,129
238,032 20,1292017Amount due to stockbrokers 10,874,508 -Accrued management fee 118,197 -Amount due to Trustee 4,728 -Other payables and accruals - 11,325
10,997,433 11,325
2929
3. FINANCIAL RISK MANAGEMENT OBJECTIVES AND POLICIES (CONTINUED)
Shariah specific risk
The risk that the investments do not conform to the principle of Shariah may result in those investments being not Shariah-compliant. Should the situation arise, necessary steps shall be taken to dispose of such investments in accordance with the rules of divestments of non Shariah-compliant investments. If this occurs, the Fund could suffer losses from the disposal and thus, adversely affecting the value of the Fund.
Capital risk
The capital of the Fund is represented by equity consisting of unitholders’ capital of RM97,851,658 (2017: RM82,443,705) and (accumulated losses)/retained earnings of RM3,430,694 (2017: RM6,317,045). The amount of equity can change significantly on a daily basis as the Fund is subject to daily subscriptions and redemptions at the discretion of unitholders. The Fund’s objective when managing capital is to safeguard the Fund’s ability to continue as a going concern in order to provide returns for unitholders and benefits for other stakeholders and to maintain a strong capital base to support the development of the investment activities of the Fund.
3030
4. FAIR VALUE ESTIMATION
Fair value is defined as the price that would be received to sell an asset or paid to transfer a liability in an orderly transaction between market participants at the measurement date (i.e. an exit price).
The fair value of financial assets and liabilities traded in an active market (such as publicly traded derivatives and trading securities) are based on quoted market prices at the close of trading on the financial year end date.
An active market is a market in which transactions for the assets or liabilities take place with sufficient frequency and volume to provide pricing information on an ongoing basis.
The fair value of financial assets that are not traded in an active market is determined by using valuation techniques. The Fund uses a variety of methods and makes assumptions that are based on market conditions existing at each financial year end date. Valuation techniques used for non-standardised financial instruments such as options, currency swaps and other over-the-counter derivatives, include the use of comparable recent transactions, reference to other instruments that are substantially the same, discounted cash flow analysis, option pricing models and other valuation techniques commonly used by market participants making the maximum use of market inputs and relying as little as possible on entity-specific inputs.
The fair values are based on the following methodologies and assumptions:
(i) For bank balances, deposit with a licensed financial institution with maturities less than 1 year, the carrying value is a reasonable estimate of fair value.
(ii) The carrying value less impairment of receivables and payables are assumed to approximate their fair values due to their short term nature.

3131
4. FAIR VALUE ESTIMATION (CONTINUED)
Fair value hierarchy
The Fund adopted MFRS 13 “Fair Value Measurement” in respect of disclosures about the degree of reliability of fair value measurement. This requires the Fund to classify fair value measurements using a fair value hierarchy that reflects the significance of the inputs used in making the measurements. The fair value hierarchy has the following levels:
Level 1: Quoted prices (unadjusted) in active market for identical assets or liabilities
Level 2: Inputs other than quoted prices included within level 1 that are observable for the asset or liability, either directly (that is, as prices) or indirectly (that is, derived from prices)
Level 3: Inputs for the asset and liability that are not based on observable market data (that is, unobservable inputs)
The following table analyses within the fair value hierarchy the Fund’s financial assets at fair value through profit or loss (by class) measured at fair value:
Level 1 Level 2 Level 3 TotalRM RM RM RM
2018Investments: - Quoted Shariah-
compliant investments 85,977,988 - - 85,977,988
Level 1 Level 2 Level 3 TotalRM RM RM RM
2017Investments: - Quoted Shariah-compliant
investments 81,045,509 - - 81,045,509
Investments in active listed equities, i.e. quoted Shariah-compliant investments whose values are based on quoted market prices in active markets are classified within Level 1. The Fund does not adjust the quoted prices for these instruments. The Fund’s policies on valuation of these financial assets are stated in Note 2.2.
3232
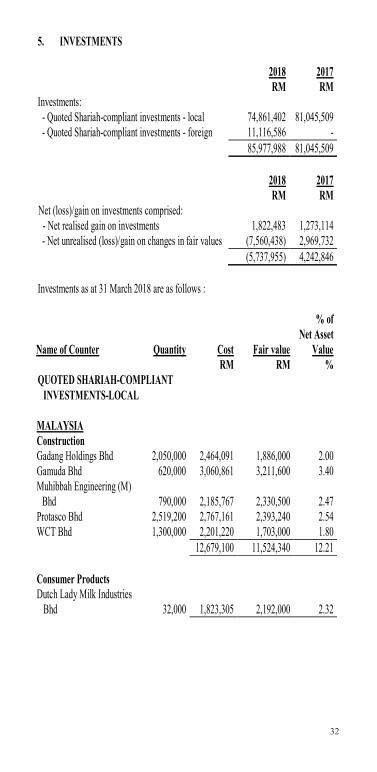
5. INVESTMENTS
2018 2017RM RM
Investments: - Quoted Shariah-compliant investments - local 74,861,402 81,045,509 - Quoted Shariah-compliant investments - foreign 11,116,586 -
85,977,988 81,045,509
2018 2017RM RM
Net (loss)/gain on investments comprised: - Net realised gain on investments 1,822,483 1,273,114 - Net unrealised (loss)/gain on changes in fair values (7,560,438) 2,969,732
(5,737,955) 4,242,846
Investments as at 31 March 2018 are as follows :
Name of Counter Quantity Cost Fair value
% of Net Asset
ValueRM RM %
QUOTED SHARIAH-COMPLIANT INVESTMENTS-LOCAL
MALAYSIAConstructionGadang Holdings Bhd 2,050,000 2,464,091 1,886,000 2.00Gamuda Bhd 620,000 3,060,861 3,211,600 3.40Muhibbah Engineering (M)
Bhd 790,000 2,185,767 2,330,500 2.47Protasco Bhd 2,519,200 2,767,161 2,393,240 2.54WCT Bhd 1,300,000 2,201,220 1,703,000 1.80
12,679,100 11,524,340 12.21
Consumer ProductsDutch Lady Milk Industries
Bhd 32,000 1,823,305 2,192,000 2.32
3333
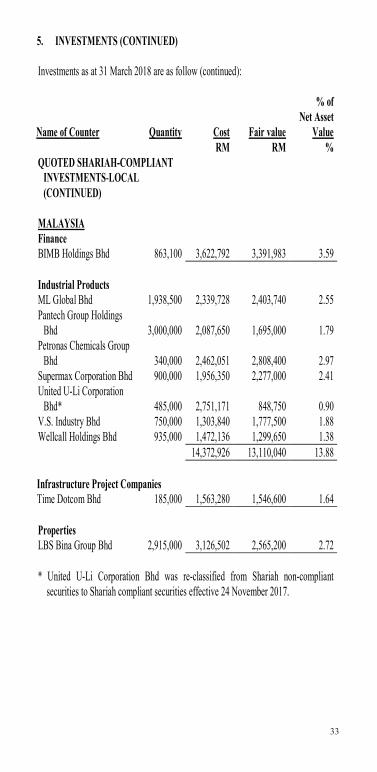
5. INVESTMENTS (CONTINUED)
Investments as at 31 March 2018 are as follow (continued):
Name of Counter Quantity Cost Fair value
% of Net Asset
ValueRM RM %
QUOTED SHARIAH-COMPLIANT INVESTMENTS-LOCAL(CONTINUED)
MALAYSIAFinanceBIMB Holdings Bhd 863,100 3,622,792 3,391,983 3.59
Industrial ProductsML Global Bhd 1,938,500 2,339,728 2,403,740 2.55Pantech Group Holdings
Bhd 3,000,000 2,087,650 1,695,000 1.79Petronas Chemicals Group
Bhd 340,000 2,462,051 2,808,400 2.97Supermax Corporation Bhd 900,000 1,956,350 2,277,000 2.41United U-Li Corporation
Bhd* 485,000 2,751,171 848,750 0.90V.S. Industry Bhd 750,000 1,303,840 1,777,500 1.88Wellcall Holdings Bhd 935,000 1,472,136 1,299,650 1.38
14,372,926 13,110,040 13.88
Infrastructure Project CompaniesTime Dotcom Bhd 185,000 1,563,280 1,546,600 1.64
PropertiesLBS Bina Group Bhd 2,915,000 3,126,502 2,565,200 2.72
* United U-Li Corporation Bhd was re-classified from Shariah non-compliant securities to Shariah compliant securities effective 24 November 2017.
3434
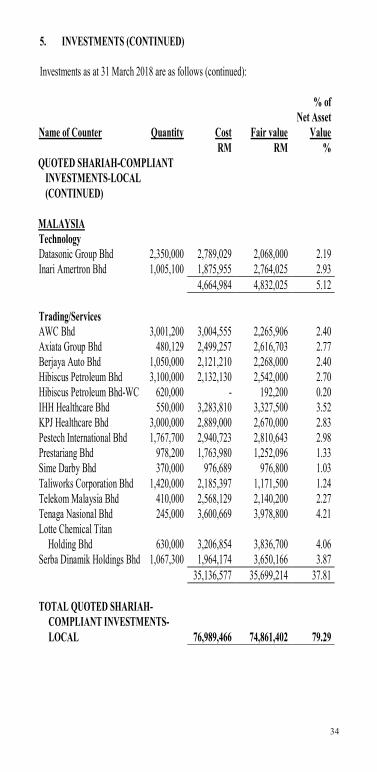
5. INVESTMENTS (CONTINUED)
Investments as at 31 March 2018 are as follows (continued):
Name of Counter Quantity Cost Fair value
% of Net Asset
ValueRM RM %
QUOTED SHARIAH-COMPLIANT INVESTMENTS-LOCAL (CONTINUED)
MALAYSIATechnologyDatasonic Group Bhd 2,350,000 2,789,029 2,068,000 2.19Inari Amertron Bhd 1,005,100 1,875,955 2,764,025 2.93
4,664,984 4,832,025 5.12
Trading/ServicesAWC Bhd 3,001,200 3,004,555 2,265,906 2.40Axiata Group Bhd 480,129 2,499,257 2,616,703 2.77Berjaya Auto Bhd 1,050,000 2,121,210 2,268,000 2.40Hibiscus Petroleum Bhd 3,100,000 2,132,130 2,542,000 2.70Hibiscus Petroleum Bhd-WC 620,000 - 192,200 0.20IHH Healthcare Bhd 550,000 3,283,810 3,327,500 3.52KPJ Healthcare Bhd 3,000,000 2,889,000 2,670,000 2.83Pestech International Bhd 1,767,700 2,940,723 2,810,643 2.98Prestariang Bhd 978,200 1,763,980 1,252,096 1.33Sime Darby Bhd 370,000 976,689 976,800 1.03Taliworks Corporation Bhd 1,420,000 2,185,397 1,171,500 1.24Telekom Malaysia Bhd 410,000 2,568,129 2,140,200 2.27Tenaga Nasional Bhd 245,000 3,600,669 3,978,800 4.21Lotte Chemical Titan
Holding Bhd 630,000 3,206,854 3,836,700 4.06Serba Dinamik Holdings Bhd 1,067,300 1,964,174 3,650,166 3.87
35,136,577 35,699,214 37.81
TOTAL QUOTED SHARIAH-COMPLIANT INVESTMENTS-LOCAL 76,989,466 74,861,402 79.29
3535
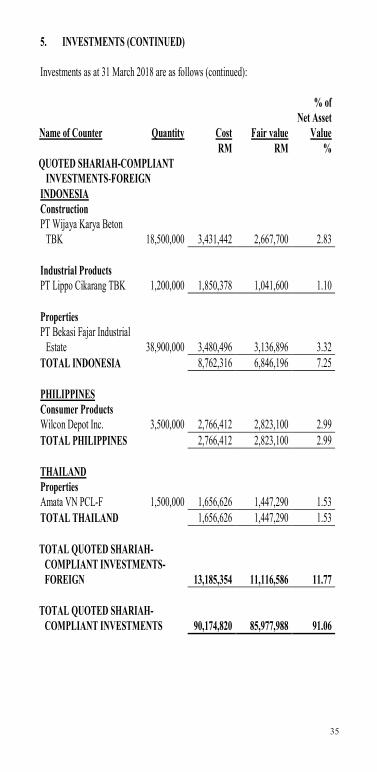
5. INVESTMENTS (CONTINUED)
Investments as at 31 March 2018 are as follows (continued):
Name of Counter Quantity Cost Fair value
% of Net Asset
ValueRM RM %
QUOTED SHARIAH-COMPLIANT INVESTMENTS-FOREIGN
INDONESIAConstructionPT Wijaya Karya Beton
TBK 18,500,000 3,431,442 2,667,700 2.83
Industrial ProductsPT Lippo Cikarang TBK 1,200,000 1,850,378 1,041,600 1.10
PropertiesPT Bekasi Fajar Industrial
Estate 38,900,000 3,480,496 3,136,896 3.32TOTAL INDONESIA 8,762,316 6,846,196 7.25
PHILIPPINESConsumer ProductsWilcon Depot Inc. 3,500,000 2,766,412 2,823,100 2.99TOTAL PHILIPPINES 2,766,412 2,823,100 2.99
THAILANDPropertiesAmata VN PCL-F 1,500,000 1,656,626 1,447,290 1.53TOTAL THAILAND 1,656,626 1,447,290 1.53
TOTAL QUOTED SHARIAH-COMPLIANT INVESTMENTS-FOREIGN 13,185,354 11,116,586 11.77
TOTAL QUOTED SHARIAH- COMPLIANT INVESTMENTS 90,174,820 85,977,988 91.06

3636
5. INVESTMENTS (CONTINUED)
Investments as at 31 March 2017 are as follows:
Name of Counter Quantity Cost Fair value
% of Net Asset
ValueRM RM %
QUOTED SHARIAH-COMPLIANT INVESTMENTS
MALAYSIAConstructionGadang Holdings Bhd 1,350,000 1,336,835 1,687,500 1.90Kimlun Corporation Bhd 1,000,000 2,263,604 2,240,000 2.53Protasco Bhd 1,969,200 2,170,661 2,166,120 2.44
5,771,100 6,093,620 6.87
Consumer ProductsDutch Lady Milk Industries
Bhd 32,000 1,823,305 1,837,440 2.07Federal Furniture Holdings
Bhd 905,400 873,636 701,685 0.79Fraser & Neave Holdings
Bhd 90,000 2,161,838 2,221,200 2.50Hong Leong Industries Bhd 160,000 1,500,592 1,499,200 1.69Nestle (Malaysia) Bhd 24,000 1,881,600 1,905,120 2.15Pecca Group Bhd 331,300 543,394 520,141 0.59SLP Resources Bhd 300,000 690,419 777,000 0.87Yoong Onn Corporation Bhd 574,000 689,054 648,620 0.73
10,163,838 10,110,406 11.39
3737
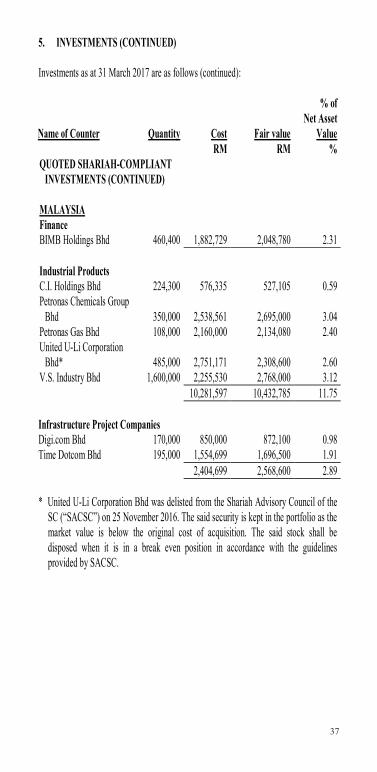
5. INVESTMENTS (CONTINUED)
Investments as at 31 March 2017 are as follows (continued):
Name of Counter Quantity Cost Fair value
% of Net Asset
ValueRM RM %
QUOTED SHARIAH-COMPLIANT INVESTMENTS (CONTINUED)
MALAYSIAFinanceBIMB Holdings Bhd 460,400 1,882,729 2,048,780 2.31
Industrial ProductsC.I. Holdings Bhd 224,300 576,335 527,105 0.59Petronas Chemicals Group
Bhd 350,000 2,538,561 2,695,000 3.04Petronas Gas Bhd 108,000 2,160,000 2,134,080 2.40United U-Li Corporation
Bhd* 485,000 2,751,171 2,308,600 2.60V.S. Industry Bhd 1,600,000 2,255,530 2,768,000 3.12
10,281,597 10,432,785 11.75
Infrastructure Project CompaniesDigi.com Bhd 170,000 850,000 872,100 0.98Time Dotcom Bhd 195,000 1,554,699 1,696,500 1.91
2,404,699 2,568,600 2.89
* United U-Li Corporation Bhd was delisted from the Shariah Advisory Council of the SC (“SACSC”) on 25 November 2016. The said security is kept in the portfolio as the market value is below the original cost of acquisition. The said stock shall be disposed when it is in a break even position in accordance with the guidelines provided by SACSC.

3838
5. INVESTMENTS (CONTINUED)
Investments as at 31 March 2017 are as follows (continued):
Name of Counter Quantity Cost Fair value
% of Net Asset
ValueRM RM %
QUOTED SHARIAH-COMPLIANT INVESTMENTS (CONTINUED)
MALAYSIAPlantationIOI Corporation Bhd 450,000 2,024,595 2,092,500 2.36TSH Resources Bhd 625,000 1,191,448 1,168,750 1.32
3,216,043 3,261,250 3.68
PropertiesMatrix Concepts Holdings
Bhd 700,000 1,780,765 1,778,000 2.00UEM Sunrise Bhd 1,405,000 1,730,265 1,784,350 2.01
3,511,030 3,562,350 4.01
Real Estate Investment Trust
Axis Reit Managers Bhd 1,100,000 1,878,800 1,815,000 2.04
TechnologyGHL Systems Bhd 400,000 472,800 440,000 0.50Globetronics Technology
Bhd 730,000 3,100,094 3,766,800 4.24Inari Amertron Bhd 800,000 1,334,560 1,632,000 1.84
4,907,454 5,838,800 6.58
Trading/ServicesAWC Bhd 2,451,200 2,494,245 2,549,248 2.87Axiata Group Bhd 600,000 2,879,790 3,036,000 3.42Berjaya Auto Bhd 1,000,000 2,010,000 2,000,000 2.25IQ Group Holdings Bhd 113,700 349,648 397,950 0.45

3939
5. INVESTMENTS (CONTINUED)
Investments as at 31 March 2017 are as follows (continued):
Name of Counter Quantity Cost Fair value
% of Net Asset
ValueRM RM %
QUOTED SHARIAH-COMPLIANT INVESTMENTS (CONTINUED)
MALAYSIATrading/Services(continued)Kawan Food Bhd 673,000 2,333,147 2,813,140 3.17Malakoff Corporation Bhd 2,000,000 2,439,000 2,420,000 2.73Mikro MSC Bhd 1,777,500 857,415 1,066,500 1.20MY E.G. Services Bhd 812,500 1,260,725 1,503,125 1.69Pestech International Bhd 1,157,700 1,929,058 1,910,205 2.15Salcon Bhd 2,610,000 1,584,802 1,787,850 2.01Sasbadi Holdings Bhd 650,000 825,472 1,014,000 1.14SCGM Bhd 300,000 919,685 1,176,000 1.33SKP Resouces Bhd 2,900,000 3,839,934 3,683,000 4.15Taliworks Corporation Bhd 1,520,000 2,321,001 2,447,200 2.76Telekom Malaysia Bhd 250,000 1,489,500 1,605,000 1.81Tenaga Nasional Bhd 230,000 3,272,590 3,155,600 3.56Tex Cycle Technology
Malaysia Bhd 590,000 748,155 643,100 0.73Westports Holdings Bhd 520,000 2,110,446 2,106,000 2.37
33,664,613 35,313,918 39.79
TOTAL QUOTED SHARIAH-COMPLIANT INVESTMENTS 77,681,903 81,045,509 91.31
4040
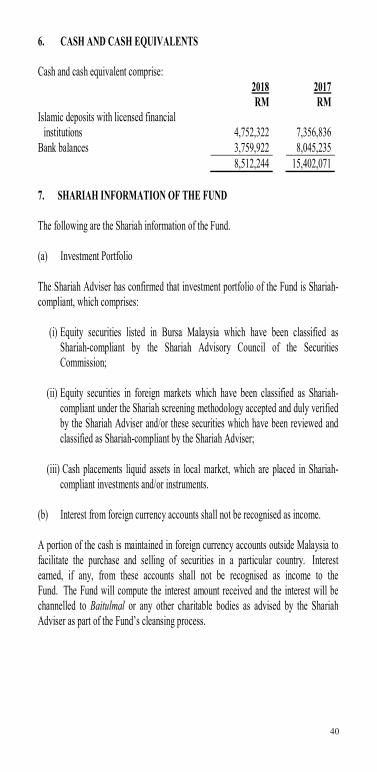
6. CASH AND CASH EQUIVALENTS
Cash and cash equivalent comprise:2018 2017RM RM
Islamic deposits with licensed financial institutions 4,752,322 7,356,836
Bank balances 3,759,922 8,045,2358,512,244 15,402,071
7. SHARIAH INFORMATION OF THE FUND
The following are the Shariah information of the Fund.
(a) Investment Portfolio
The Shariah Adviser has confirmed that investment portfolio of the Fund is Shariah-compliant, which comprises:
(i) Equity securities listed in Bursa Malaysia which have been classified as Shariah-compliant by the Shariah Advisory Council of the Securities Commission;
(ii) Equity securities in foreign markets which have been classified as Shariah-compliant under the Shariah screening methodology accepted and duly verified by the Shariah Adviser and/or these securities which have been reviewed and classified as Shariah-compliant by the Shariah Adviser;
(iii) Cash placements liquid assets in local market, which are placed in Shariah-compliant investments and/or instruments.
(b) Interest from foreign currency accounts shall not be recognised as income.
A portion of the cash is maintained in foreign currency accounts outside Malaysia to facilitate the purchase and selling of securities in a particular country. Interest earned, if any, from these accounts shall not be recognised as income to the Fund. The Fund will compute the interest amount received and the interest will be channelled to Baitulmal or any other charitable bodies as advised by the Shariah Adviser as part of the Fund’s cleansing process.
4141
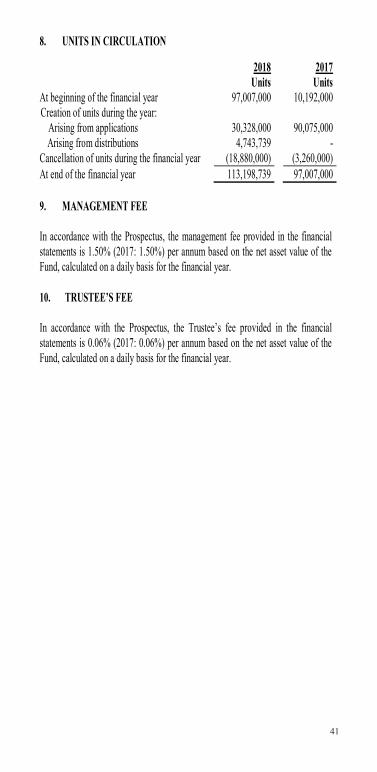
8. UNITS IN CIRCULATION
2018 2017Units Units
At beginning of the financial year 97,007,000 10,192,000Creation of units during the year:
Arising from applications 30,328,000 90,075,000 Arising from distributions 4,743,739 -Cancellation of units during the financial year (18,880,000) (3,260,000)At end of the financial year 113,198,739 97,007,000
9. MANAGEMENT FEE
In accordance with the Prospectus, the management fee provided in the financial statements is 1.50% (2017: 1.50%) per annum based on the net asset value of the Fund, calculated on a daily basis for the financial year.
10. TRUSTEE’S FEE
In accordance with the Prospectus, the Trustee’s fee provided in the financial statements is 0.06% (2017: 0.06%) per annum based on the net asset value of the Fund, calculated on a daily basis for the financial year.

4242
11. TAXATION
(a) Tax charge for the financial year
2018 2017RM RM
Current taxation 17,133 2,751
(b) Numerical reconciliation of income tax expense
The numerical reconciliation between the net (loss)/income before taxation multiplied by the Malaysian statutory income tax rate and the tax expense of the Fund is as follows:
2018 2017RM RM
Net (loss)/income before taxation (5,597,540) 4,296,388
Tax calculated at statutory tax rate of 24% (1,343,410) 1,031,133Tax effects of:- Investment loss not deductible for tax purpose/ (investment income not subject to tax) 842,788 (1,313,004)- Expenses not deductible for tax purpose 173,614 127,627- Restriction on tax deductible expenses for unit
trust funds 327,008 160,846-Income subject to different tax rate 4,477 (3,851)-Foreign tax expense 12,656 -Tax expense 17,133 2,751

4343
12. DISTRIBUTIONS
Distributions to unitholders is derived from the following sources:
2018RM
Prior financial year’s realised income 5,794,677Less : Expenses (1,661,611)Distributions for the financial year 4,133,066
Distribution during the financial yearGross
sen per unitNet
sen per unit20 April 2017 1.7500 1.750022 March 2018 2.2000 2.2000
3.9500 3.95000
Included in the above distribution is an amount of RM5,794,677 (2017: Nil) derived from the previous financial year’s realised income.
There is no distribution for the previous financial year ended 31 March 2017.
13. MANAGEMENT EXPENSE RATIO (“MER”)
2018%
2017%
MER 1.72 1.72
The MER ratio is calculated based on total expenses (excluding Goods and Services tax) of the Fund to the average net asset value of the Fund calculated on a daily basis.
14. PORTFOLIO TURNOVER RATIO (“PTR”)
2018 2017
PTR (times) 1.04 1.63
The PTR ratio is calculated based on average of acquisition and disposals of the Fund for the financial year to the average net asset value of the Fund calculated on a daily basis.
4444
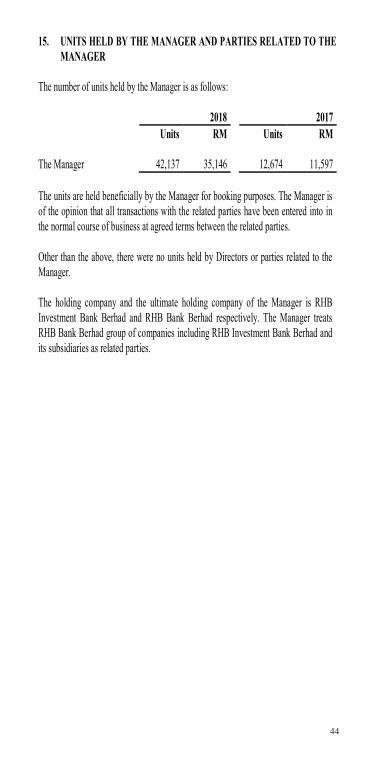
15. UNITS HELD BY THE MANAGER AND PARTIES RELATED TO THE MANAGER
The number of units held by the Manager is as follows:
2018 2017 Units RM Units RM
The Manager 42,137 35,146 12,674 11,597
The units are held beneficially by the Manager for booking purposes. The Manager is of the opinion that all transactions with the related parties have been entered into in the normal course of business at agreed terms between the related parties.
Other than the above, there were no units held by Directors or parties related to theManager.
The holding company and the ultimate holding company of the Manager is RHBInvestment Bank Berhad and RHB Bank Berhad respectively. The Manager treatsRHB Bank Berhad group of companies including RHB Investment Bank Berhad and its subsidiaries as related parties.

4545
16. TRANSACTIONS BY THE FUND
Details of transactions by the Fund for the financial year ended 31 March 2018 are as follows:
Broker/financial institutionValue of
trades
Percentageof totaltrades
Brokeragefees
Percentage of total
brokeragefees
RM % RM %RHB Investment Bank Bhd* 39,279,801 21.22 117,839 26.36TA Securities Holdings Bhd 22,540,516 12.18 45,081 10.09Maybank Investment Bank
Bhd 14,963,631 8.08 44,891 10.04RHB Securities Hong Kong
Ltd* 12,770,375 6.90 26,041 5.83Alliance Investment Bank Bhd 11,946,630 6.45 23,893 5.35Kenanga Investment Bank Bhd 11,945,411 6.45 23,891 5.34Hong Leong Investment Bank
Bhd 11,305,942 6.11 22,612 5.06CIMB Investment Bank Bhd 10,908,091 5.89 26,884 6.01MIDF Amanah Investment
Bank Bhd 9,078,445 4.90 18,157 4.06Public Investment Bank Bhd 8,514,117 4.60 17,028 3.81Others 31,872,661 17.22 80,693 18.05
185,125,620 100.00 447,010 100.00
4646
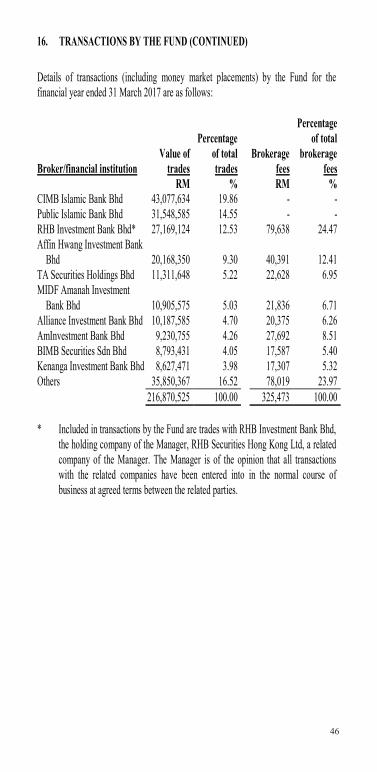
16. TRANSACTIONS BY THE FUND (CONTINUED)
Details of transactions (including money market placements) by the Fund for the financial year ended 31 March 2017 are as follows:
* Included in transactions by the Fund are trades with RHB Investment Bank Bhd, the holding company of the Manager, RHB Securities Hong Kong Ltd, a related company of the Manager. The Manager is of the opinion that all transactions with the related companies have been entered into in the normal course of business at agreed terms between the related parties.
Broker/financial institutionValue of
trades
Percentageof totaltrades
Brokeragefees
Percentage of total
brokeragefees
RM % RM %CIMB Islamic Bank Bhd 43,077,634 19.86 - -Public Islamic Bank Bhd 31,548,585 14.55 - -RHB Investment Bank Bhd* 27,169,124 12.53 79,638 24.47Affin Hwang Investment Bank
Bhd 20,168,350 9.30 40,391 12.41TA Securities Holdings Bhd 11,311,648 5.22 22,628 6.95MIDF Amanah Investment
Bank Bhd 10,905,575 5.03 21,836 6.71Alliance Investment Bank Bhd 10,187,585 4.70 20,375 6.26AmInvestment Bank Bhd 9,230,755 4.26 27,692 8.51BIMB Securities Sdn Bhd 8,793,431 4.05 17,587 5.40Kenanga Investment Bank Bhd 8,627,471 3.98 17,307 5.32Others 35,850,367 16.52 78,019 23.97
216,870,525 100.00 325,473 100.00
4747
17. SEGMENT INFORMATION
The Investment & Security Selection Committee of the Manager recommends strategic resource allocations of the Fund to the Investment Committee of the Manager (collectively referred to as “Committee”).
The internal reporting provided to the Committee for the Fund’s assets, liabilities and performance is prepared on a consistent basis with the measurement and recognition principles of MFRS and IFRS. The Committee considers the business from both geographic and investment perspective. Geographically, the Committee considers the performance of investments in an overall basis.
The reportable operating segments derive their income by seeking investments to achieve investment objectives commensurate with an acceptable level of risk within each portfolio. These returns consist of dividend, profit and gains on the appreciation in the value of investments and derived from Malaysia and outside Malaysia.
There were no changes in the reportable segments during the financial year.
48
48
STATEMENT BY MANAGERMANAGERWe, Abdul Aziz Peru Mohamed and Chin Yoong Kheong, two of the Directors of RHB Asset Management Sdn Bhd, do hereby state that in the opinion of the Directors of the Manager, the accompanying statement of financial position, statement of income and expenses, statement of changes in net asset value, statement of cash flows and the accompanying notes, are drawn up in accordance with Malaysian Financial Reporting Standards and International Financial Reporting Standards so as to give a true and fair view of the financial position of the Fund as of 31 March 2018 and of its financial performance and cash flows for the financial year then ended and comply provisions of the Deeds.
On behalf of the Manager
ABDUL AZIZ PERU MOHAMED CHIN YOONG KHEONGDirector Director
Kuala Lumpur 25 May 2018
4949
TRUSTEE’S REPORT TO THE UNITHOLDERS OF RHB DANA ISLAM
We have acted as Trustee of RHB Dana Islam (“the Fund”) for the financial year ended 31 March 2018. To the best of our knowledge, RHB Asset Management Sdn Bhd (“the Management Company”), has operated and managed the Fund in accordance with the following:
a) limitations imposed on the investment powers of the Management Company and the Trustee under the Deeds, the Securities Commission’s Guidelines on Unit Trust Funds, the Capital Markets and Services Act 2007 and other applicable laws;
b) valuation/pricing is carried out in accordance with the Deeds and any regulatory requirements; and
c) creation and cancellation of units are carried out in accordance with the Deeds and any regulatory requirements.
During the financial year, a total distribution of 3.9500 sen per unit has been distributed to the unitholders of the Fund. We are of the view that the distribution is not inconsistent with the objective of the Fund.
For HSBC (Malaysia) Trustee Berhad
Tan Bee NieHead, Trustee Operations
Kuala Lumpur25 May 2018
5050
REPORT OF THE SHARIAH ADVISER
We have acted as the Shariah Adviser of RHB Dana Islam. Our responsibility is to ensure that the procedures and processes employed by RHB Asset Management Sdn Bhd and that the provisions of the Deed dated 11 September 2001 (hereinafter referred to as the “Deed”) are in accordance with Shariah principles.
In our opinion, RHB Asset Management Sdn Bhd has managed and administered RHB Dana Islam in accordance with Shariah principles and complied with the applicable guidelines, rulings and decisions issued by the Securities CommissionMalaysia pertaining to Shariah matters for the financial year ended 31 March 2018.
In addition, we also confirm that the investment portfolio of RHB Dana Islam comprises securities which have been classified as Shariah-compliant by the Shariah Advisory Council of the Securities Commission Malaysia (“SACSC”). As for the securities which are not certified by the SACSC, we have reviewed the said securities and opine that these securities are designated as Shariah-compliant.
I, Dr. Ghazali Jaapar, hereby confirm that all members of the Shariah Committee have been consulted and made aware of all the Shariah issues in relation to this report.
For and on behalf of RHB Islamic Bank Berhad
Dr. Ghazali JaaparChairman,Shariah Committee of RHB Islamic Bank Berhad
Kuala Lumpur, Malaysia25 May 2018
5151
INDEPENDENT AUDITORS’ REPORT TO THE UNITHOLDERS OFRHB DANA ISLAM
I REPORT ON THE AUDIT OF THE FINANCIAL STATEMENTS
Our opinion
In our opinion, the financial statements of RHB Dana Islam (“the Fund”) give a true and fair view of the financial position of the Fund as at 31 March 2018 and of its financial performance and cash flows for the financial year then ended in accordance with Malaysian Financial Reporting Standards and International Financial Reporting Standards.
What we have audited
We have audited the financial statements of the Fund, which comprise the statement of financial position as at 31 March 2018, and the statement of income and expenses, statement of changes in net asset value and statement of cash flows for the financial year then ended, and notes to the financial statements, including a summary of significant accounting policies, as set out on pages 13 to 47.
Basis for opinion
We conducted our audit in accordance with approved standards on auditing in Malaysia and International Standards on Auditing. Our responsibilities under those standards are further described in the “Auditors’ responsibilities for the audit of the financial statements” section of our report.
We believe that the audit evidence we have obtained is sufficient and appropriate to provide a basis for our opinion.
Independence and other ethical responsibilities
We are independent of the Fund in accordance with the By-Laws (on Professional Ethics, Conduct and Practice) of the Malaysian Institute of Accountants (“By-Laws”) and the International Ethics Standards Board for Accountants’ Code of Ethics for Professional Accountants (“IESBA Code”), and we have fulfilled our other ethical responsibilities in accordance with the By-Laws and the IESBA Code.DEPENDENT AUDITORS’ REPORT TO THE UNITHOLDERS OFKIDSAVE TRUS
5252
INDEPENDENT AUDITORS’ REPORT TO THE UNITHOLDERS OFRHB DANA ISLAM (CONTINUED)
REPORT ON THE AUDIT OF THE FINANCIAL STATEMENTS (CONTINUED)
Information other than the financial statements and auditors’ report thereon
The Manager of the Fund is responsible for the other information. The other information comprises Manager’s report, but does not include the financial statements of the Fund and our auditors’ report thereon.
Our opinion on the financial statements of the Fund does not cover the other information and we do not express any form of assurance conclusion thereon.
In connection with our audit of the financial statements of the Fund, our responsibility is to read the other information and, in doing so, consider whether the other information is materially inconsistent with the financial statements of the Fund or our knowledge obtained in the audit or otherwise appears to be materially misstated.
If, based on the work we have performed, we conclude that there is a material misstatement of this other information, we are required to report that fact. We have nothing to report in this regard.
Responsibilities of the Manager for the financial statements
The Manager of the Fund is responsible for the preparation of the financial statements of the Fund that give a true and fair view in accordance with Malaysian Financial Reporting Standards and International Financial Reporting Standards. The Manager is also responsible for such internal control as the Manager determines is necessary to enable the preparation of financial statements of the Fund that are free from material misstatement, whether due to fraud or error.
In preparing the financial statements of the Fund, the Manager is responsible for assessing the Fund’s ability to continue as a going concern, disclosing, as applicable, matters related to going concern and using the going concern basis of accounting unless the Manager either intends to liquidate the Fund or to terminate the Fund, or has no realistic alternative but to do so.
5353
INDEPENDENT AUDITORS’ REPORT TO THE UNITHOLDERS OFRHB DANA ISLAM (CONTINUED)
REPORT ON THE AUDIT OF THE FINANCIAL STATEMENTS (CONTINUED)
Auditors’ responsibilities for the audit of the financial statements
Our objectives are to obtain reasonable assurance about whether the financial statements of the Fund as a whole are free from material misstatement, whether due to fraud or error, and to issue an auditors’ report that includes our opinion. Reasonable assurance is a high level of assurance, but is not a guarantee that an audit conducted in accordance with approved standards on auditing in Malaysia and International Standards on Auditing will always detect a material misstatement when it exists. Misstatements can arise from fraud or error and are considered material if, individually or in the aggregate, they could reasonably be expected to influence the economic decisions of users taken on the basis of these financial statements.
As part of an audit in accordance with approved standards on auditing in Malaysia and International Standards on Auditing, we exercise professional judgement and maintain professional scepticism throughout the audit. We also:
(a) Identify and assess the risks of material misstatement of the financial statements of the Fund, whether due to fraud or error, design and perform audit procedures responsive to those risks, and obtain audit evidence that is sufficient and appropriate to provide a basis for our opinion. The risk of not detecting a material misstatement resulting from fraud is higher than for one resulting from error, as fraud may involve collusion, forgery, intentional omissions, misrepresentations, or the override of internal control.
(b) Obtain an understanding of internal control relevant to the audit in order to design audit procedures that are appropriate in the circumstances, but not for the purpose of expressing an opinion on the effectiveness of Fund’s internal control.
(c) Evaluate the appropriateness of accounting policies used and the reasonableness of accounting estimates and related disclosures made by the Manager.
5454
INDEPENDENT AUDITORS’ REPORT TO THE UNITHOLDERS OFRHB DANA ISLAM (CONTINUED)
REPORT ON THE AUDIT OF THE FINANCIAL STATEMENTS (CONTINUED)
Auditors’ responsibilities for the audit of the financial statements (continued)
(d) Conclude on the appropriateness of the Manager’s use of the going concern basis of accounting and, based on the audit evidence obtained, whether a material uncertainty exists related to events or conditions that may cast significant doubt on the Fund’s ability to continue as a going concern. If we conclude that a material uncertainty exists, we are required to draw attention in our auditors’ report to the related disclosures in the financial statements of the Fund or, if such disclosures are inadequate, to modify our opinion. Our conclusions are based on the audit evidence obtained up to the date of our auditors’ report. However, future events or conditions may cause the Fund to cease to continue as a going concern.
(e) Evaluate the overall presentation, structure and content of the financial statements of the Fund, including the disclosures, and whether the financial statements represent the underlying transactions and events in a manner that achieves fair presentation.
We communicate with the Manager regarding, among other matters, the planned scope and timing of the audit and significant audit findings, including any significant deficiencies in internal control that we identify during our audit.
OTHER MATTERS
This report is made solely to the unitholders of the Fund and for no other purpose. We do not assume responsibility to any other person for the content of this report.
PRICEWATERHOUSECOOPERS PLT(LLP0014401-LCA & AF 1146)Chartered Accountants
Kuala Lumpur25 May 2018

5555
CORPORATE INFORMATIONMANAGERRHB Asset Management Sdn Bhd
PRINCIPAL AND REGISTERED OFFICELevel 8, Tower Two & Three, RHB Centre, Jalan Tun Razak, 50400 Kuala Lumpur
BUSINESS OFFICELevel 8, Tower Two & Three, RHB Centre, Jalan Tun Razak, 50400 Kuala Lumpur
Email address: [email protected]: 03-9205 8000Fax: 03-9205 8100Website: www.rhbgroup.com
BOARD OF DIRECTORSMr Yap Chee Meng (Independent Non-Executive Chairman, appointed on 24 April 2018)Encik Abdul Aziz Peru Mohamed (Senior Independent Non-Executive Director)Mr Chin Yoong Kheong (Independent Non-Executive Director)Ms Ong Yin Suen (Managing Director)Dr. Ngo Get Ping (Independent Non-Executive Director)Mr Patrick Chin Yoke Chung (Non-Independent Non-Executive Chairman, retired on 24
April 2018)Ms Choo Shan (Independent Non-Executive Director, retired on 24 April 2018)
INVESTMENT COMMITTEE MEMBERS Mr Yap Chee Meng (Independent Chairman, appointed on 24 April 2018)Encik Abdul Aziz Peru Mohamed (Appointed on 1 November 2017)YBhg Dato’ Darawati Hussain (Appointed on 1 December 2017)YBhg Dato’ Khairussaleh Ramli (Chairman, resigned on 1 November 2017)Mr Ong Seng Pheow (Resigned on 1 November 2017)YBhg Datuk Haji Faisal Siraj (Resigned on 1 December 2017)Mr Patrick Chin Yoke Chung (Chairman, retired on 24 April 2018)Ms Choo Shan (Retired on 24 April 2018)
CHIEF EXECUTIVE OFFICER Ms Ong Yin Suen (Appointed on 28 February 2018)Mr Ho Seng Yee (Retired on 1 January 2018)
SECRETARYEncik Azman Shah Md Yaman (LS No. 0006901)
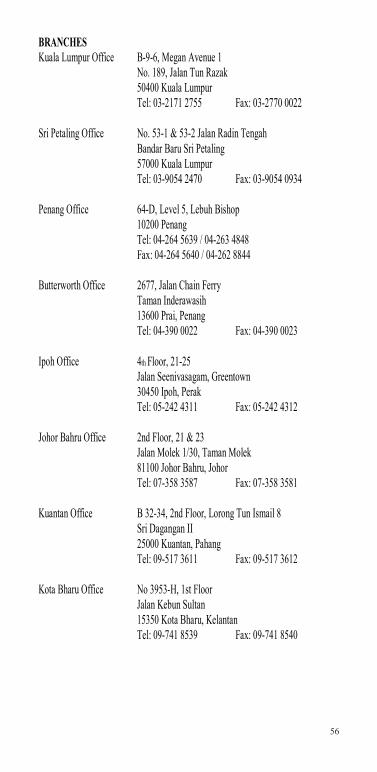
5656
BRANCHESKuala Lumpur Office B-9-6, Megan Avenue 1
No. 189, Jalan Tun Razak50400 Kuala LumpurTel: 03-2171 2755 Fax: 03-2770 0022
Sri Petaling Office No. 53-1 & 53-2 Jalan Radin TengahBandar Baru Sri Petaling57000 Kuala LumpurTel: 03-9054 2470 Fax: 03-9054 0934
Penang Office 64-D, Level 5, Lebuh Bishop10200 PenangTel: 04-264 5639 / 04-263 4848Fax: 04-264 5640 / 04-262 8844
Butterworth Office 2677, Jalan Chain FerryTaman Inderawasih13600 Prai, PenangTel: 04-390 0022 Fax: 04-390 0023
Ipoh Office 4th Floor, 21-25Jalan Seenivasagam, Greentown30450 Ipoh, PerakTel: 05-242 4311 Fax: 05-242 4312
Johor Bahru Office 2nd Floor, 21 & 23Jalan Molek 1/30, Taman Molek81100 Johor Bahru, JohorTel: 07-358 3587 Fax: 07-358 3581
Kuantan Office B 32-34, 2nd Floor, Lorong Tun Ismail 8Sri Dagangan II25000 Kuantan, PahangTel: 09-517 3611 Fax: 09-517 3612
Kota Bharu Office No 3953-H, 1st FloorJalan Kebun Sultan15350 Kota Bharu, KelantanTel: 09-741 8539 Fax: 09-741 8540
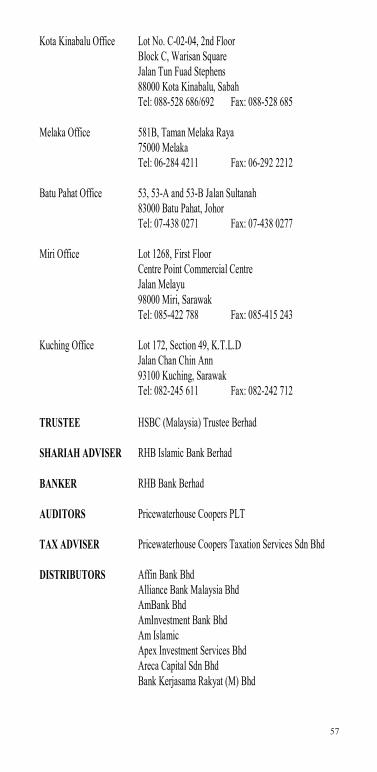
5757
Kota Kinabalu Office Lot No. C-02-04, 2nd FloorBlock C, Warisan SquareJalan Tun Fuad Stephens88000 Kota Kinabalu, SabahTel: 088-528 686/692 Fax: 088-528 685
Batu Pahat Office 53, 53-A and 53-B Jalan Sultanah83000 Batu Pahat, JohorTel: 07-438 0271 Fax: 07-438 0277
Miri Office Lot 1268, First FloorCentre Point Commercial CentreJalan Melayu98000 Miri, SarawakTel: 085-422 788 Fax: 085-415 243
Kuching Office Lot 172, Section 49, K.T.L.DJalan Chan Chin Ann93100 Kuching, SarawakTel: 082-245 611 Fax: 082-242 712
TRUSTEE HSBC (Malaysia) Trustee Berhad
SHARIAH ADVISER RHB Islamic Bank Berhad
BANKER RHB Bank Berhad
AUDITORS Pricewaterhouse Coopers PLT
TAX ADVISER Pricewaterhouse Coopers Taxation Services Sdn Bhd
DISTRIBUTORS Affin Bank BhdAlliance Bank Malaysia BhdAmBank BhdAmInvestment Bank BhdAm IslamicApex Investment Services BhdAreca Capital Sdn BhdBank Kerjasama Rakyat (M) Bhd
Melaka Office 581B, Taman Melaka Raya75000 MelakaTel: 06-284 4211 Fax: 06-292 2212
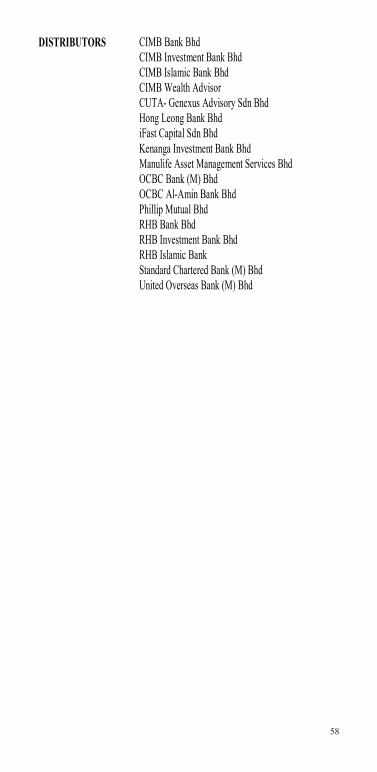
5858
DISTRIBUTORS CIMB Bank BhdCIMB Investment Bank BhdCIMB Islamic Bank BhdCIMB Wealth AdvisorCUTA- Genexus Advisory Sdn BhdHong Leong Bank BhdiFast Capital Sdn BhdKenanga Investment Bank BhdManulife Asset Management Services BhdOCBC Bank (M) BhdOCBC Al-Amin Bank BhdPhillip Mutual BhdRHB Bank BhdRHB Investment Bank BhdRHB Islamic BankStandard Chartered Bank (M) BhdUnited Overseas Bank (M) Bhd