regresi dan korelasi suatu produk dan sebaliknya harga suatu produk ditentukan juga oleh banyaknya...
TRANSCRIPT

REGRESIDAN KORELASI
STATISTIK & PROBABILITASCopyright © 2017 By. Ir. Arthur Daniel Limantara, MM, MT.
2
CONTOH DATA DUA VARIABEL
Permintaan terhadap suatu produk berhubungan denganharga suatu produk dan sebaliknya harga suatu produkditentukan juga oleh banyaknya permintaan terhadap produktersebut
Permintaan terhadap suatu produk dipengaruhi olehmeningkatnya pendapatan masyarakat
Hasil penjualan produk suatu perusahaan ditentukan olehkeberhasilan perusahaan tersebut dalam mengiklankanproduk tersebut
Berat badan seseorang berkaitan dengan tinggi badan orangtersebut
Persentase kelahiran menurun yang disebabkan olehmeningkatnya peserta KB dan membaiknya kesehatan ibu.
STATISTIK & PROBABILITASCopyright © 2017 By. Ir. Arthur Daniel Limantara, MM, MT.
3
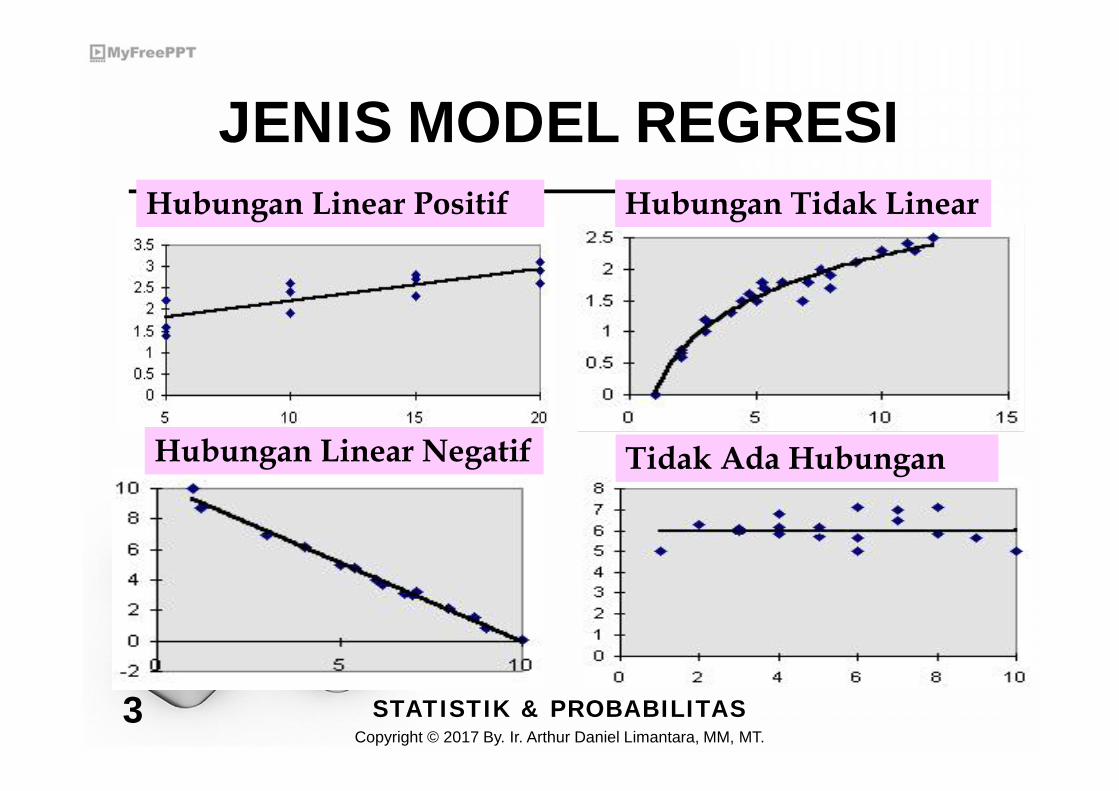
JENIS MODEL REGRESIHubungan Linear Positif
Hubungan Linear Negatif
Hubungan Tidak Linear
Tidak Ada Hubungan

STATISTIK & PROBABILITASCopyright © 2017 By. Ir. Arthur Daniel Limantara, MM, MT.
4
REGRESI LINEARSEDERHANA
ii iY X
= Random Error
Y
X
(Observed Value of Y) =
Observed Value of Y
|Y X iX
i
(Conditional Mean)
STATISTIK & PROBABILITASCopyright © 2017 By. Ir. Arthur Daniel Limantara, MM, MT.
5
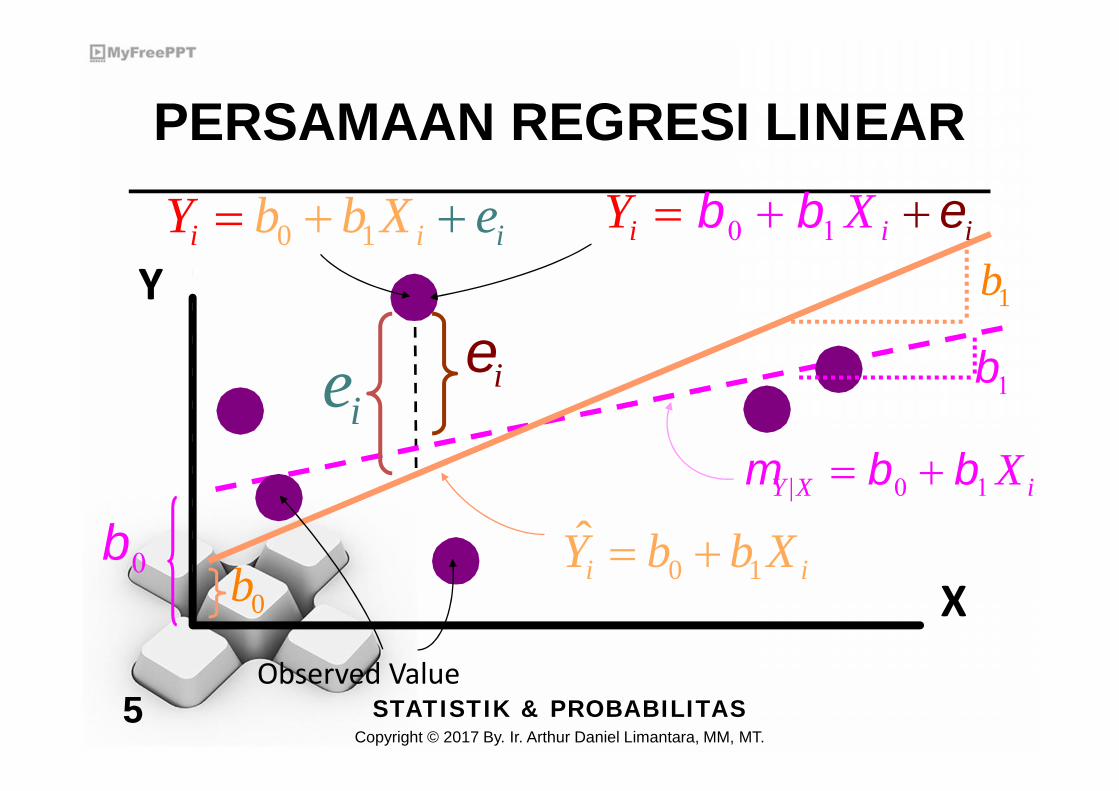
PERSAMAAN REGRESI LINEAR
Y
XObserved Value
|Y X iX
i
ii iY X
0 1i iY b b X
ie
0 1i iib bY X e 1b
0b
STATISTIK & PROBABILITASCopyright © 2017 By. Ir. Arthur Daniel Limantara, MM, MT.
6
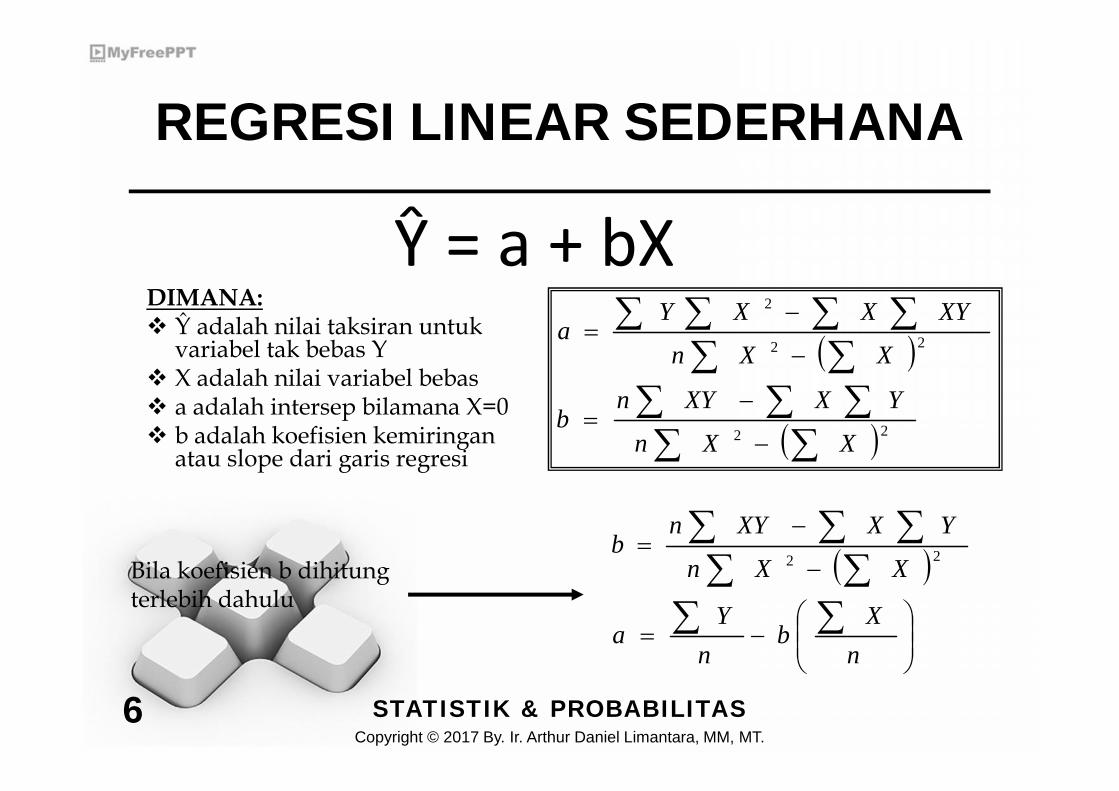
REGRESI LINEAR SEDERHANA
Ŷ = a + bX
22
22
2
XXn
YXXYnb
XXn
XYXXYa
n
Xb
n
Ya
XXn
YXXYnb 22Bila koefisien b dihitung
terlebih dahulu
DIMANA: Ŷ adalah nilai taksiran untuk
variabel tak bebas Y X adalah nilai variabel bebas a adalah intersep bilamana X=0 b adalah koefisien kemiringan
atau slope dari garis regresi

STATISTIK & PROBABILITASCopyright © 2017 By. Ir. Arthur Daniel Limantara, MM, MT.
7
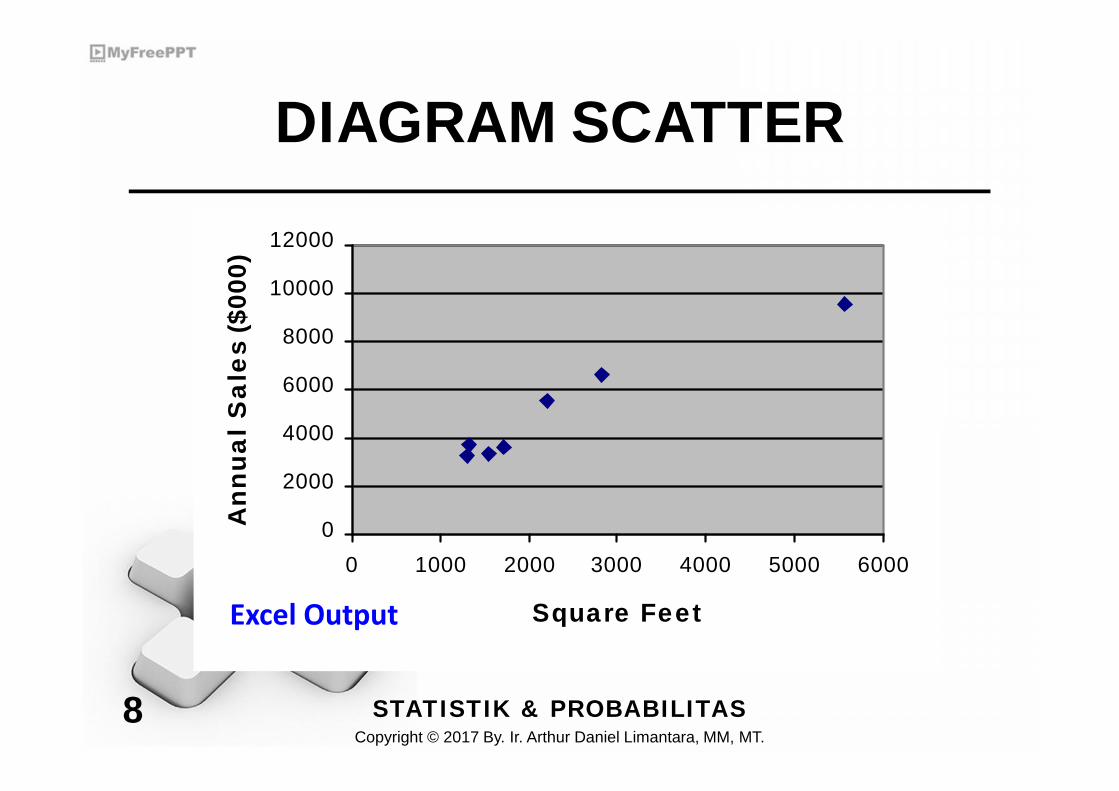
CONTOH REGRESISEDERHANA
Anda ingin mengujiketergantungan linierhasil penjualan tokotahunan atas ukurantoko. Data sampleuntuk 7 toko telahdiperoleh. Temukanpersamaan garis lurusyang sesuai dengandata itu.
AnnualStore Square Sales
Feet($1000)1 1,726 3,6812 1,542 3,3953 2,816 6,6534 5,555 9,5435 1,292 3,3186 2,208 5,5637 1,313 3,760
STATISTIK & PROBABILITASCopyright © 2017 By. Ir. Arthur Daniel Limantara, MM, MT.
8
DIAGRAM SCATTER
0
2000
4000
6000
8000
10000
12000
0 1000 2000 3000 4000 5000 6000
Square Feet
Ann
ual S
ales
($00
0)
Excel Output
STATISTIK & PROBABILITASCopyright © 2017 By. Ir. Arthur Daniel Limantara, MM, MT.
9
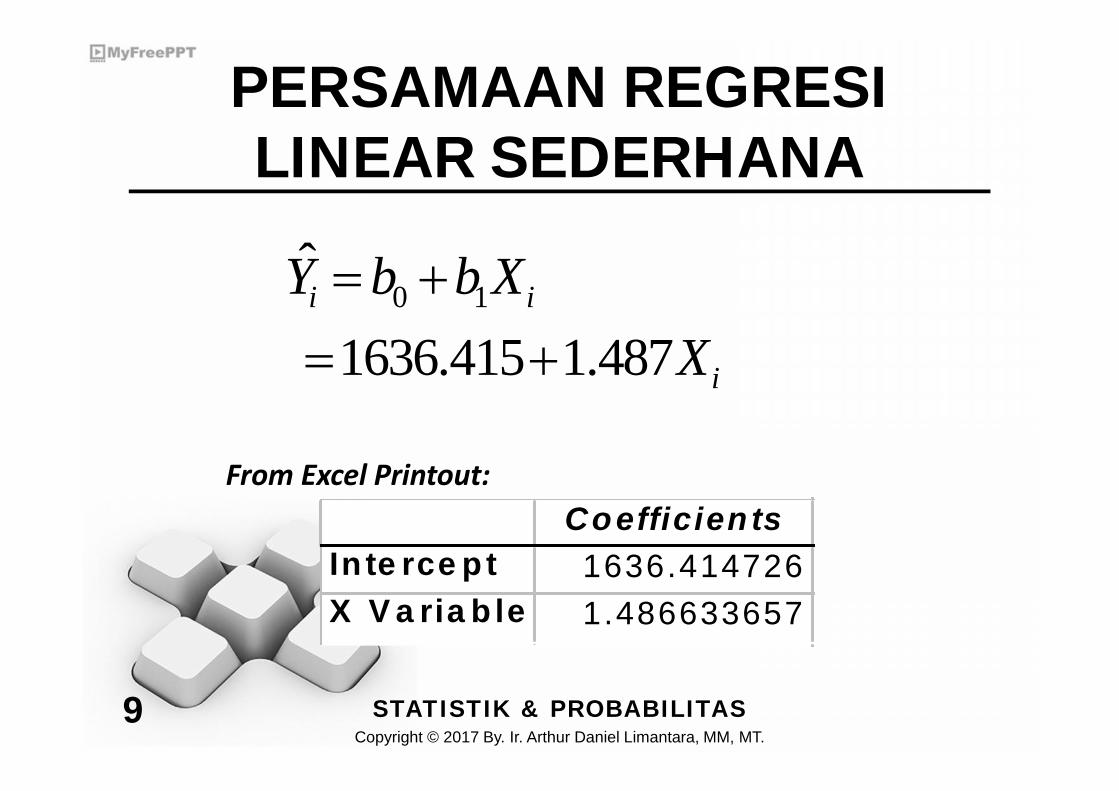
PERSAMAAN REGRESILINEAR SEDERHANA
0 1ˆ
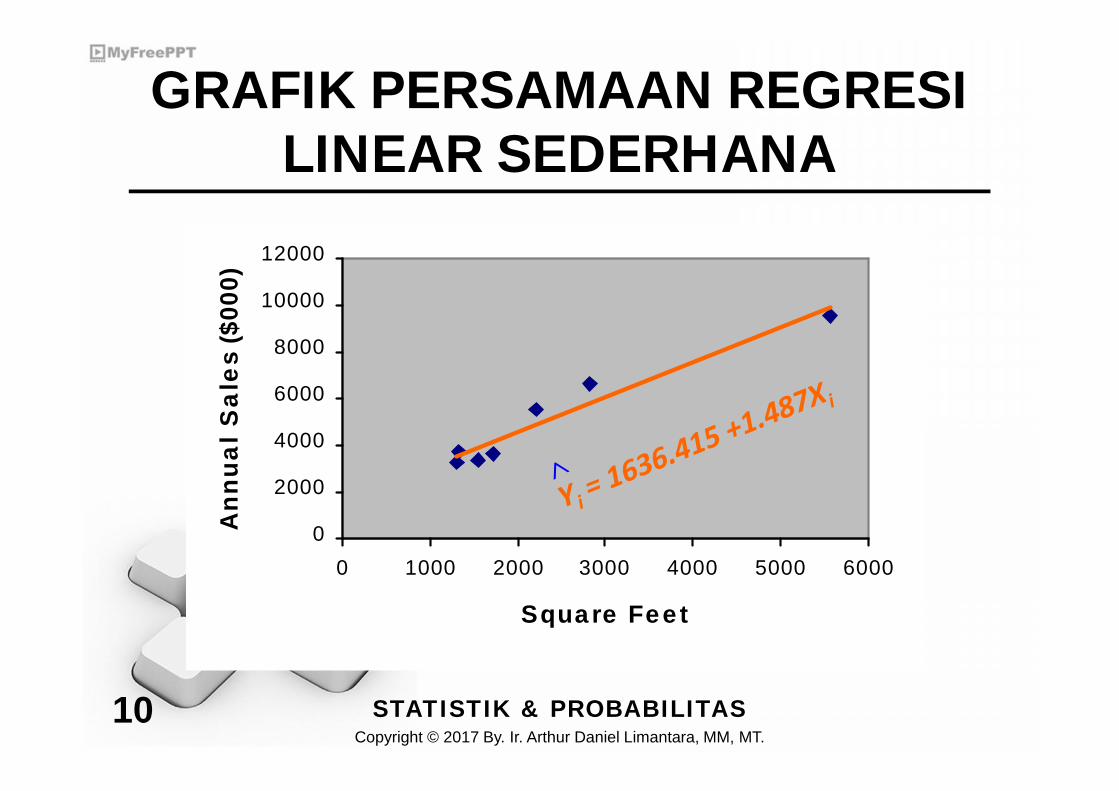
1636.415 1.487i i
i
Y b b X
X
From Excel Printout:Coefficien ts
In te rce pt 1636.414726X V a ria b le 1 1.486633657
STATISTIK & PROBABILITASCopyright © 2017 By. Ir. Arthur Daniel Limantara, MM, MT.
10
GRAFIK PERSAMAAN REGRESILINEAR SEDERHANA
0
2000
4000
6000
8000
10000
12000
0 1000 2000 3000 4000 5000 6000
Square Fee t
Ann
ual S
ales
($00
0)

ANGKAINDEKS
STATISTIK & PROBABILITASCopyright © 2017 By. Ir. Arthur Daniel Limantara, MM, MT.
12
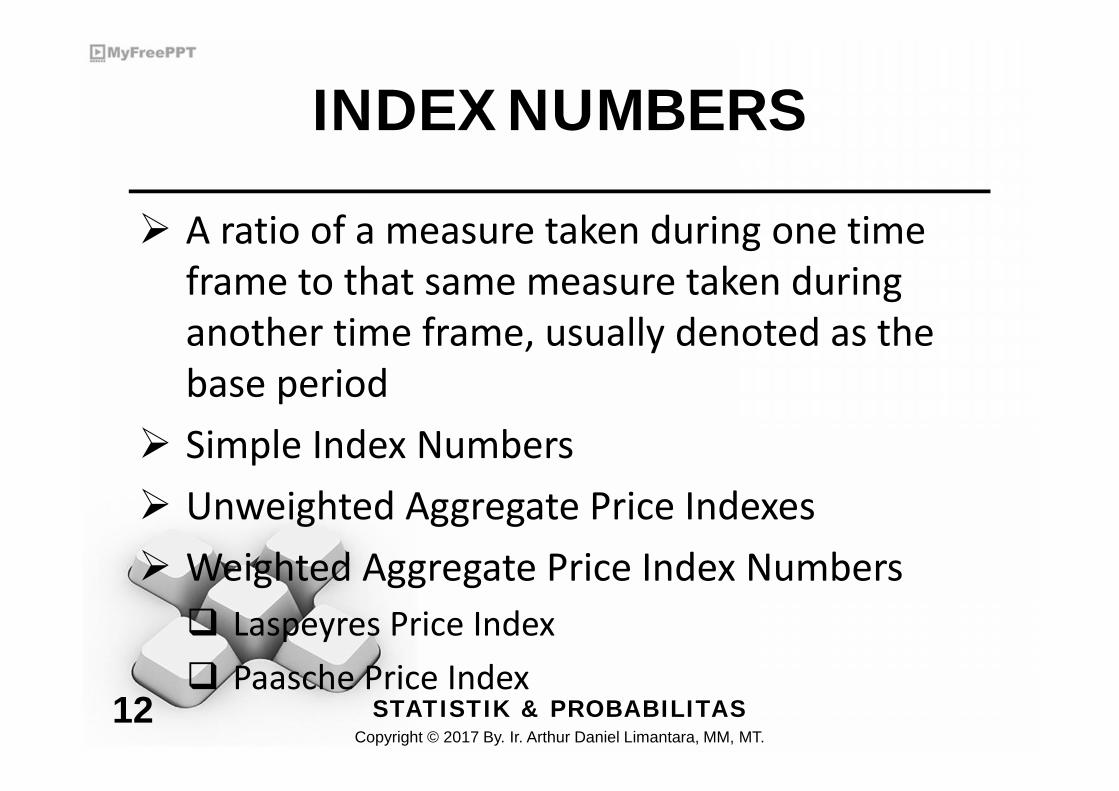
INDEX NUMBERS
A ratio of a measure taken during one timeframe to that same measure taken duringanother time frame, usually denoted as thebase period
Simple Index Numbers Unweighted Aggregate Price Indexes Weighted Aggregate Price Index Numbers Laspeyres Price Index Paasche Price Index
STATISTIK & PROBABILITASCopyright © 2017 By. Ir. Arthur Daniel Limantara, MM, MT.
13
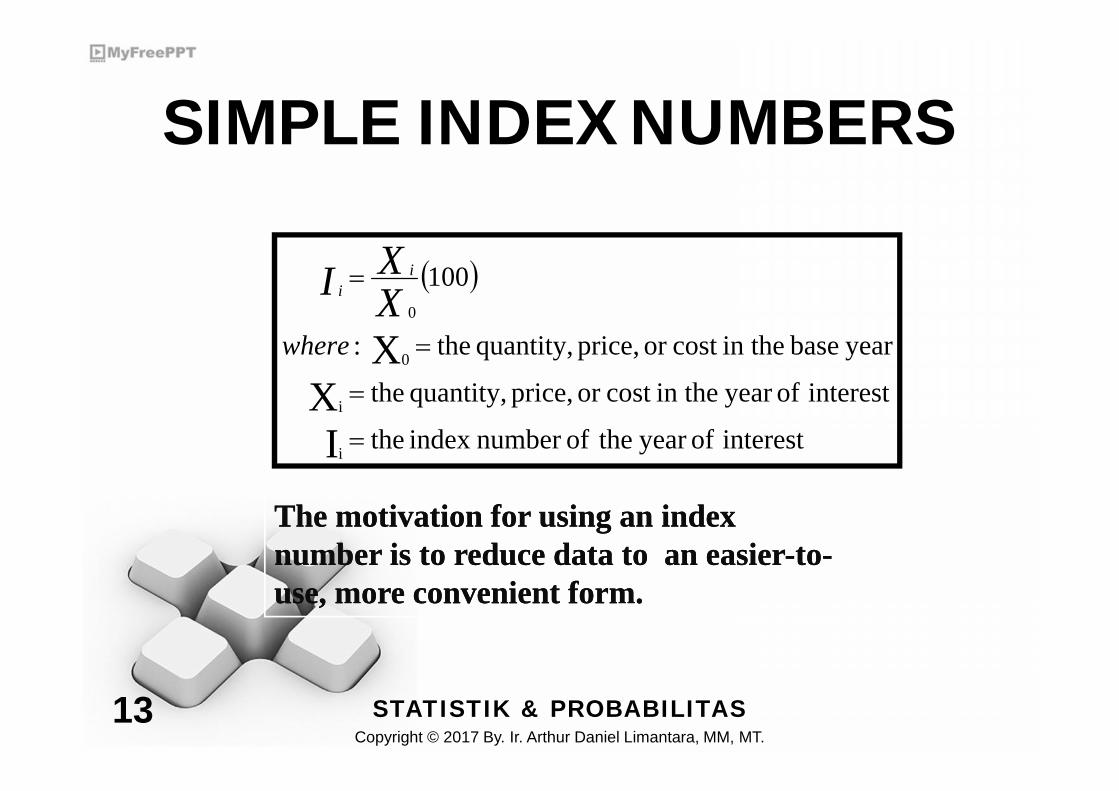
SIMPLE INDEX NUMBERS
interestofyear theofnumberindex the
interestofyearin thecostorprice,quantity, the
yearbasein thecostorprice,quantity, the:
100
IX
X
i
i
0
0
where
XXI i
i
The motivation for using an indexnumber is to reduce data to an easier-to-use, more convenient form.
The motivation for using an indexnumber is to reduce data to an easier-to-use, more convenient form.
STATISTIK & PROBABILITASCopyright © 2017 By. Ir. Arthur Daniel Limantara, MM, MT.
14
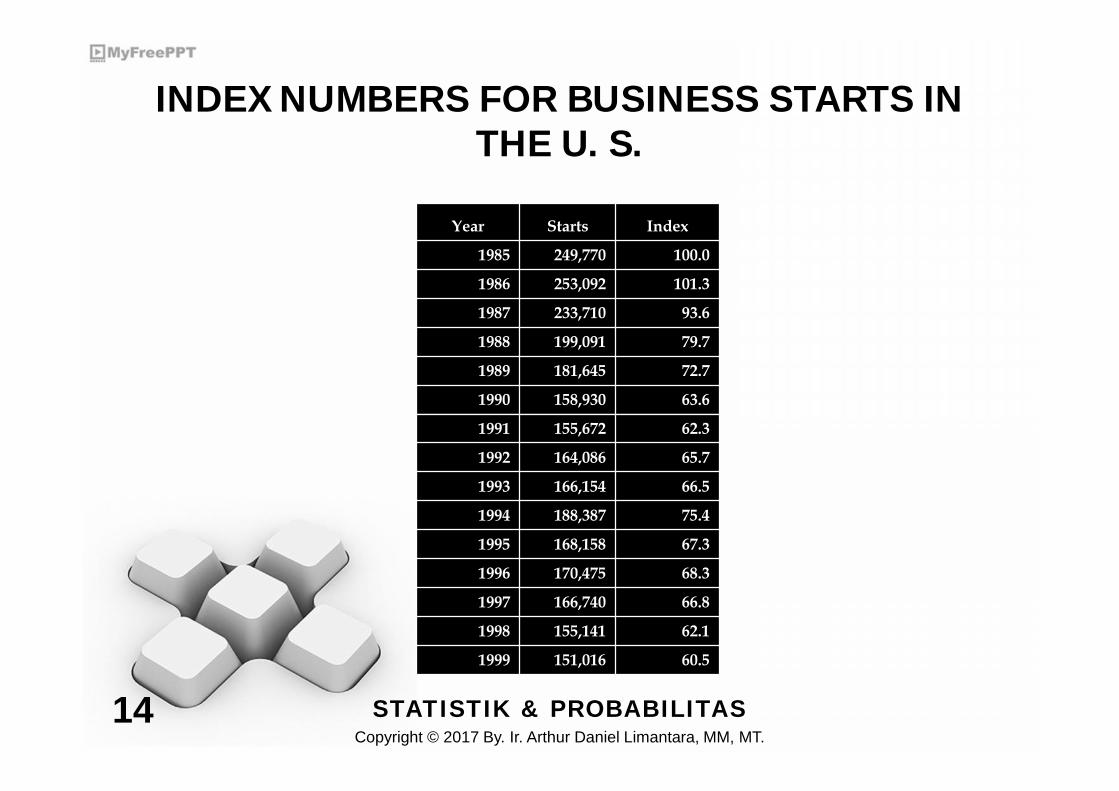
INDEX NUMBERS FOR BUSINESS STARTS INTHE U. S.
Year Starts Index
1985 249,770 100.0
1986 253,092 101.3
1987 233,710 93.6
1988 199,091 79.7
1989 181,645 72.7
1990 158,930 63.6
1991 155,672 62.3
1992 164,086 65.7
1993 166,154 66.5
1994 188,387 75.4
1995 168,158 67.3
1996 170,475 68.3
1997 166,740 66.8
1998 155,141 62.1
1999 151,016 60.5

STATISTIK & PROBABILITASCopyright © 2017 By. Ir. Arthur Daniel Limantara, MM, MT.
15
UNWEIGHTED AGGREGATEPRICE INDEX NUMBERS
i
i
i
i
I PP
PPI
where i
i
0
0
100
0
: the price of an item in the year of interest ( )
the price of an item in the base year ( )
the index number for the year of interest ( )
STATISTIK & PROBABILITASCopyright © 2017 By. Ir. Arthur Daniel Limantara, MM, MT.
16
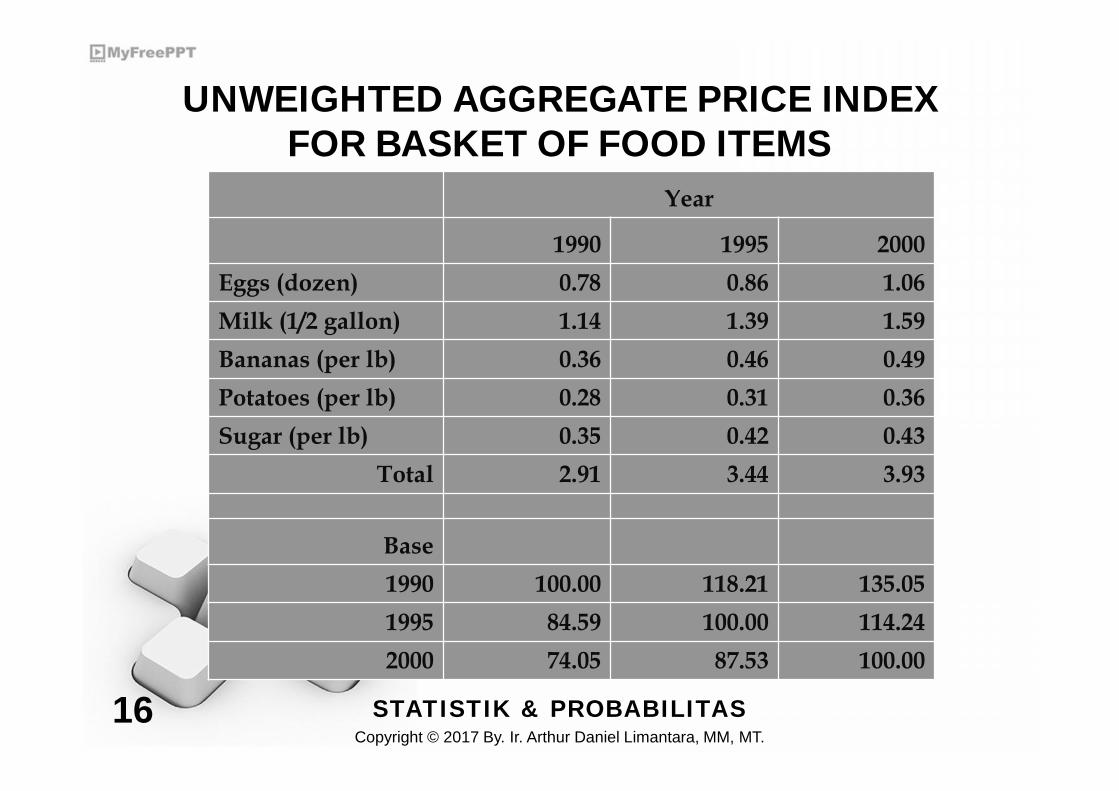
UNWEIGHTED AGGREGATE PRICE INDEXFOR BASKET OF FOOD ITEMS
Year
1990 1995 2000Eggs (dozen) 0.78 0.86 1.06Milk (1/2 gallon) 1.14 1.39 1.59Bananas (per lb) 0.36 0.46 0.49Potatoes (per lb) 0.28 0.31 0.36Sugar (per lb) 0.35 0.42 0.43
Total 2.91 3.44 3.93
Base1990 100.00 118.21 135.051995 84.59 100.00 114.242000 74.05 87.53 100.00
STATISTIK & PROBABILITASCopyright © 2017 By. Ir. Arthur Daniel Limantara, MM, MT.
17
WEIGHTED AGGREGATEPRICE INDEX NUMBERS
Computed by multiplying quantity weightsand item prices in determining the marketbasket worth for a given year
Also called value indexes Laspeyres - uses base period weights Paasche - use current period weights
STATISTIK & PROBABILITASCopyright © 2017 By. Ir. Arthur Daniel Limantara, MM, MT.
18
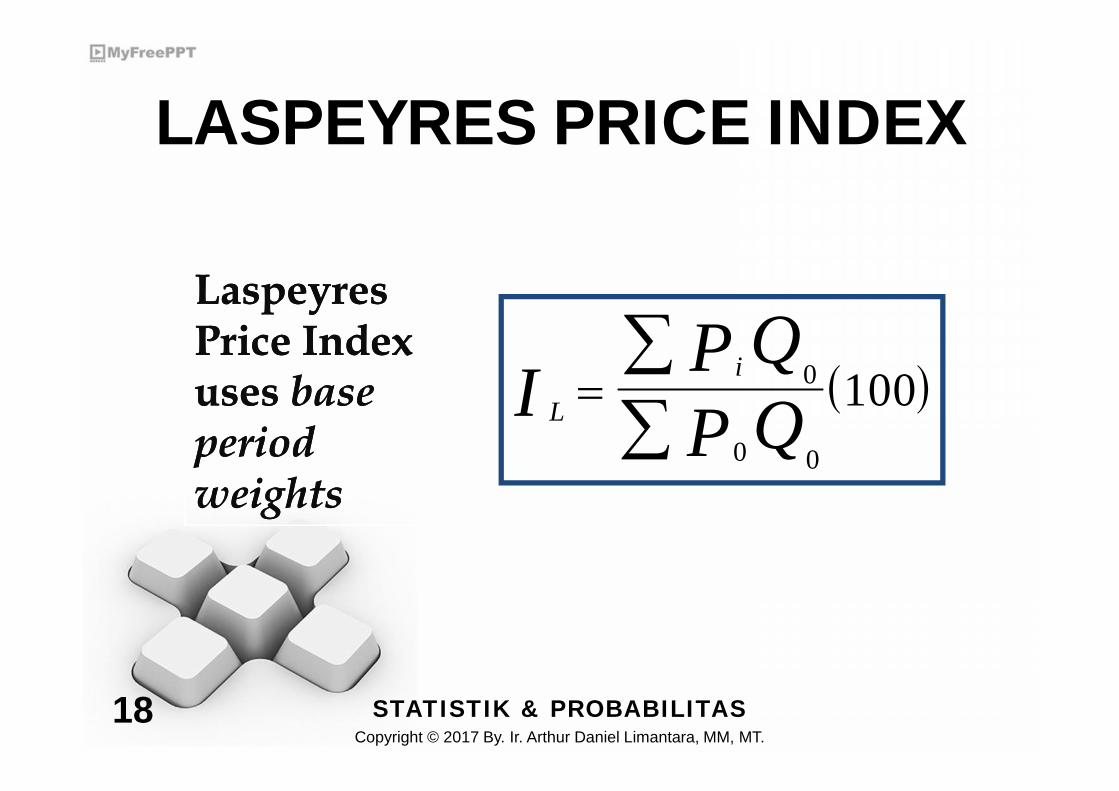
LASPEYRES PRICE INDEX
L
i
IP QP Q
0
0 0
100
LaspeyresPrice Indexuses baseperiodweights
LaspeyresPrice Indexuses baseperiodweights
STATISTIK & PROBABILITASCopyright © 2017 By. Ir. Arthur Daniel Limantara, MM, MT.
19
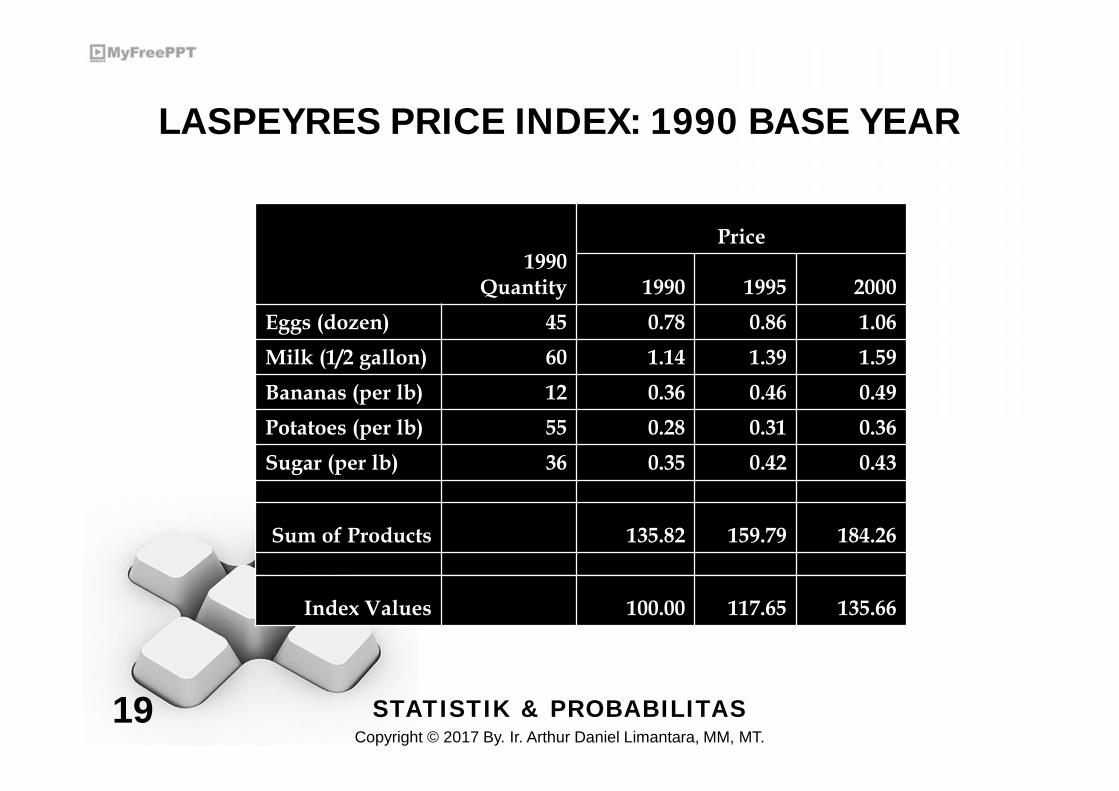
LASPEYRES PRICE INDEX: 1990 BASE YEAR
1990Quantity
Price
1990 1995 2000Eggs (dozen) 45 0.78 0.86 1.06Milk (1/2 gallon) 60 1.14 1.39 1.59Bananas (per lb) 12 0.36 0.46 0.49Potatoes (per lb) 55 0.28 0.31 0.36Sugar (per lb) 36 0.35 0.42 0.43
Sum of Products 135.82 159.79 184.26
Index Values 100.00 117.65 135.66
STATISTIK & PROBABILITASCopyright © 2017 By. Ir. Arthur Daniel Limantara, MM, MT.
20
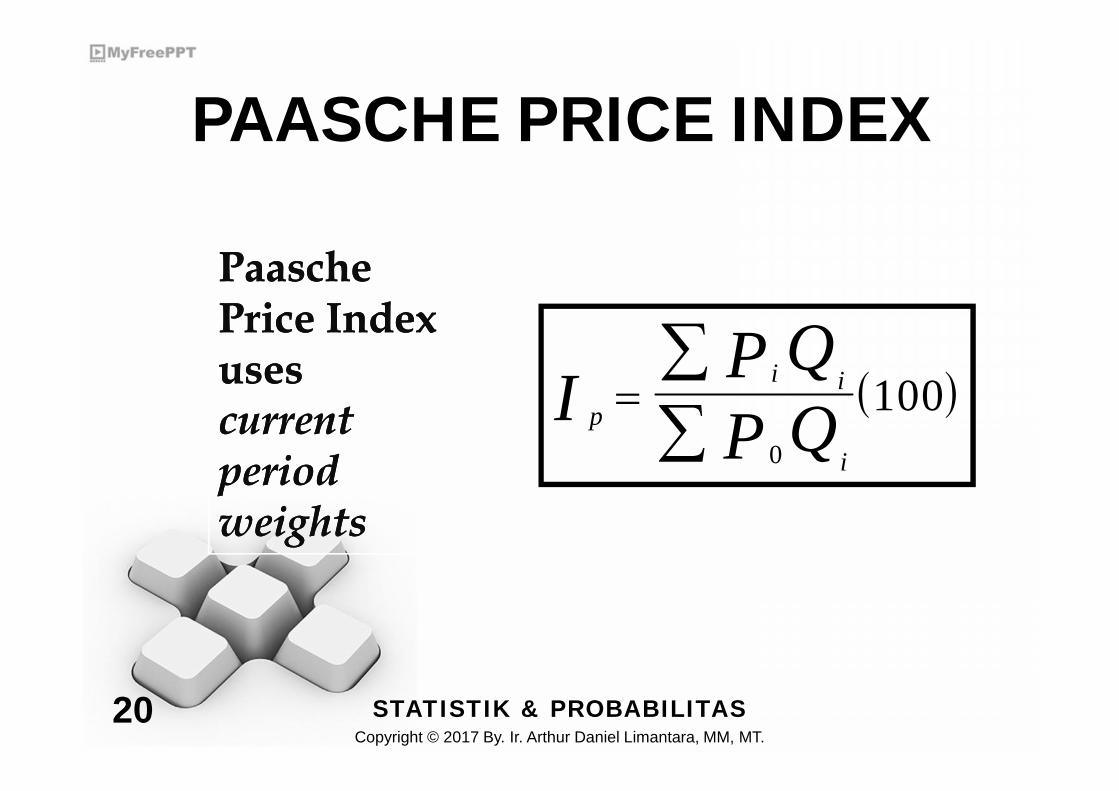
PAASCHE PRICE INDEX
p
i i
i
IP QP Q
0
100
PaaschePrice Indexusescurrentperiodweights
PaaschePrice Indexusescurrentperiodweights

STATISTIK & PROBABILITASCopyright © 2017 By. Ir. Arthur Daniel Limantara, MM, MT.
21
PAASCHE PRICE INDEX:199 BASE YEAR
1999 2000Price Quantity Price Quantity
Syringes (dozen) 6.70 150 6.95 135Cotton swabs (box) 1.35 60 1.45 65Patient record forms (pad) 5.10 8 6.25 12Children's Tylenol (bottle) 4.50 25 4.95 30Computer paper (box) 11.95 6 13.20 8Thermometers 7.90 4 9.00 2
Numerator 1342.60 1379.60
Denominator 1342.60 1299.85
Index 100.00 106.14
STATISTIK & PROBABILITASCopyright © 2017 By. Ir. Arthur Daniel Limantara, MM, MT.
22
IMPORTANT INDEXES
Consumer Price Index (CPI) Producer Price Index (PPI) Dow Jones Industrial Average (DJIA)

KONSEP DASARPROBABILITAS