physico-chedlicalattributes ofhudlic acid extracted frodl
TRANSCRIPT
Pertanika J. Trop. Agric. Sci. 19(2/3): 189-196 (1996)ISSN: 0126-6128
© Penerbit Universiti Pertanian Malaysia
Physico-cheDlical Attributes of HUDlic Acid Extracted froDlTropical Pect
M.H.A HUSNI, SHANTI DEVI, ABD.RAHMAN MANAS l and K.B. SIVADepartment of Soil Science
Faculty of AgricultureUniversiti Pertanian Malaysia
43400 Serdang, Selangor, Malaysia
1Department of ChemistryFaculty of Science and Environmental Studies
Universiti Pertanian Malaysia43400 Serdang, Selangor, Malaysia
Keywords: humic acid, tropical peat, infrared spectra
ABSTRAK
KaJian asas mengenai asid humik pada gambut tropika adalaiz terhad. Satu kaJian mengenai ciri-ciri asid humikyang diekstrak dari gambut tropika telah diJalankan dengan menganalisis elemen dan kumpulan berfungsi, spektruminframerah dan uJian terus pada asid humik dengan menggunakan mikroskop elektron imbasan. Berdasarkan kepadaanalisis elemen, Jumlah Cyang didapati adalah 40.26 - 53.26%, H 4.84 - 6.36%, 038.39 - 51.62%, N 1.51 2.64%, dan P 0.02 - 0.06%. KaJian dalam kumpulan berfungsi menunJukkan kumpulan karboksil yang wuJuddalam asid humik di gambut tropika adalah dua kali ganda lebih banyak daripada kumpulan hidroksil fenolik.Daripada spektrum inframerah, asid humik didapati mempunyai ciri-ciri aromatik. Analisis inframerah JugamenunJukkan spektrum yang sama dan selaras tanpa mengira perbezaan tempat asalnya, kompaun humik yangdiekstrak mempunyai struktur dan komposisi kumpulan berfungsi yang sama. Pemeriksaan menerusi mikroskopelektron pada asid humik kering menunJukkan bentuk yang berblok dan separa berliku dengan saiz yang berbeza.Semua asid humik yang diekstrak menunJukkan bentuk yang sama.
ABSTRACT
Basic research conducted on humic acid (HA) in tropical soils is limited. A study was conducted to characterize HAextracted from tropical peat by elemental and functional group analyses, infrared (IR) spectra and by directexamination on HA using scanning electron microscopy (SEM). From the elemental analysis it was found that Crangedfrom 40.26 - 53.26%, H 4.84 - 6.36%,038.39 - 51.62%, N 1.51- 2.64%, and P 0.02 - 0.06%. Studies offunctional groups indicated that the carboxyl group present in HA of tropical peat was about twice as high as that ofphenolic hydroxyl groups. From IR spectra, the HA had an aromatic character. Results ofIR analysis also exhibitedconsistently similar spectra, demonstrating that regardless ofplace of origin, the extracted humic compound had asimilar structure and was composed of the same functional groups. Electron microscopic examination of dried HAshowed a sub-angular blocky shape which varied in size. All extracted HA exhibited similar form.
INTRODUCTION
Humic acid (HA), defined as the fractionthat is soluble in dilute base and coagulatedupon acidification of the alkaline extract, isthe main component of humic fraction inboth temperate and tropical peat (Norhayati 1989; Garcia et ai. 1991). HA is
comprised of highly reactive polymericcompounds of varying molecular weight,containing C, H, 0, and N, and itsreactivity is influenced by the nature andamount of oxygen-containing functionalgroups (Stevenson and Goh 1972).
According to Cheshire et ai. (1967) ,
M.HA HUSNI, SHANTI OEVI, ABO.RAHMAN MANAS AND K.B. SIVA
peat humic acids have 52% C, 5.1 % H,2.2% Nand 40.3% 0 content. A study byVisser (1987) on humic acids extractedfrom decomposing plant and peat coresamples showed content of 34-55% C, 511 % Hand 40-55% 0, different from thevalues of mineral soils 55-60% C, 3-5% H,2-6% Nand 30-40% 0 (Kononova 1961).HA extracted from Sphagnum and Carexpeat showed 49.7 and 55.4% C, 6.0 and5.0% H, 42.0 and 35.5% 0, 2.3 and 3.5% Ncontent, respectively (Garcia et at. 1991).
IR spectra of HA extracted fromtemperate peat showed aromatic characterand great similarity among different samples ofHA (Visser 1987; Garcia et at. 1991).Studies by Norhayati (1989) also indicatedthat the HA extracted from tropical peatexhibited very similar IR spectra.
SEM provides a non-destructive method for direct recording of the shape of tinyhumic particles (Bohr and Hughes 1971;Orlov and Glebova 1972). Ghosh andSchnitzer (1982) found under SEM, humicacids to consist of small discrete sphenoid,flattened aggregates, linear chain assemblies of these aggregates and flattenedfilaments.
There is a dearth of information on thestudy of elemental composition and reactivity of HA, and its structure under SEM.This study was therefore carried out tocharacterize the HA extracted from tropical peat by elemental and functional groupanalyses, its IR spectra and its structure bySEM.
MATERIALS AND METHODS
Fourteen samples from major peat areas ofMalaysia were used in this experiment,twelve from the west coast of PeninsularMalaysia and two from Sarawak (peatsamples 5 and 6). Percentage of organicmatter was determined as loss on ignitionfrom sample maintained at 500°C for 4 h(Storer 1984).
Humic acid was extracted with 0.2 MN aOH using a soil to extractant ratio of1: 10. The mixture was shaken continuouslyon a mechanical shaker for 24 h and thesoluble organic matter was separated fromthe peat soil by centrifugation at 10,000rpm for 15 min. The residue was washedwith distilled water in a ratio of 1:5 andwashing water separated from the residueby centrifugation. The combined supernatants were acidified with concentratedH 2S04 to pH 1.0 and allowed to stand for24 h. The coagulated humic acid (HA)precipitate was purified by re-precipitationand re-dissolution using H 2S04 andN aOH, respectively. The alkaline extractwas then shaken for 48 h with excess HClHF mixture (0.5%, v/v). The acid mixturewas removed by centrifugation and theresidue thoroughly washed with distilledwater until the filtrate became free ofchloride. The humic acid was then dialyzed against distilled water until there wasno colour change in the outer solution(distilled water) and finally frozen anddried at ambient temperature (Schnitzer1982; Norhayati and Verloo 1984).
Carbon, Hand N were determined bydry combustion using a CHN analyser(VARIO-EL), 0 was calculated by difference and P by dry ashing at 500°C anddetermined colorimetrically at 882 nm(Murphy and Riley 1962). Carboxylgroups were measured by Ca(OAch method (Schnitzer and Gupta 1965) and thephenolic hydroxyl groups by the colorimetric method using Folin Cicocalteu'sreagent (Tsutsuki and Kuwatsuka 1978).These determinations were represented asthe average result of two duplicate samples.
IR spectra were recorded on a Beckman Fourier transfer IR spectrophotometerusing the KBr pellet technique. Prior to theanalyses, the HA with the KBr was storedfor at least 48 h in a desiccator to preventabsorption of atmospheric moisture.
190 PERTANlKA J. TROP. AGRIC. SCI. VOL. 19 NO. 2/3, 1996
PHYSICO-CHEMICAL ATTRIBUTES OF HUMIC ACID EXTRACTED FROM TROPICAL PECT
For SEM examination, the dried HAobtained directly after extraction wasattached to AI-stubs with the aid ofcolloidal silver paint. To make the specimens surface conducting, they were coatedwith a layer of gold-palladium. Theprepared specimen were examined on aSEM aOEL 35C) operated at 25kV.
RESULTS AND DISCUSSION
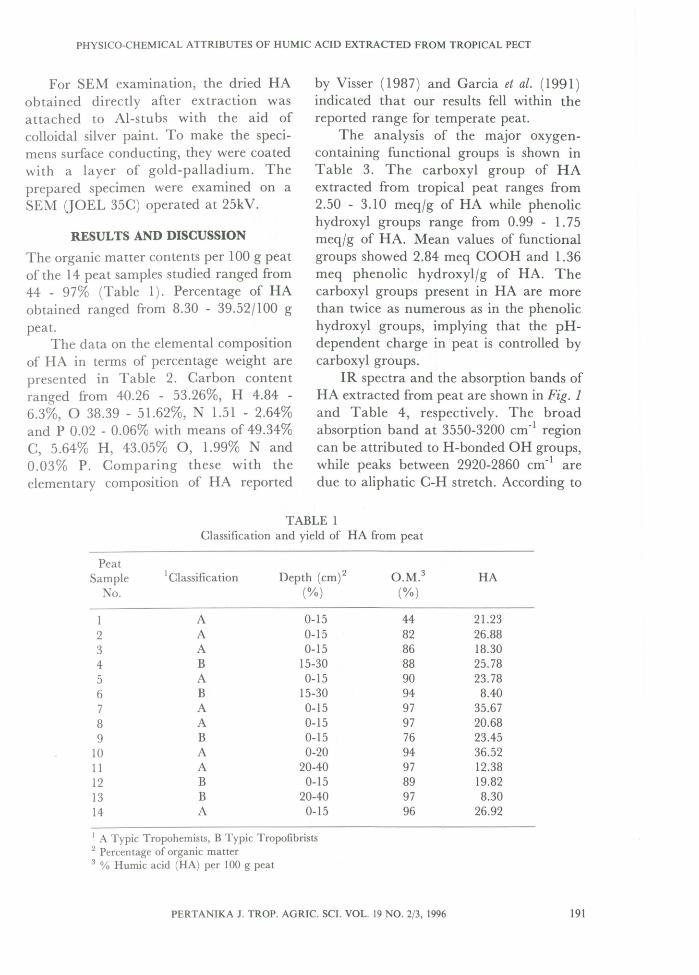
The organic matter contents per 100 g peatof the 14 peat samples studied ranged from44 - 97% (Table 1). Percentage of HAobtained ranged from 8.30 - 39.52/100 gpeat.
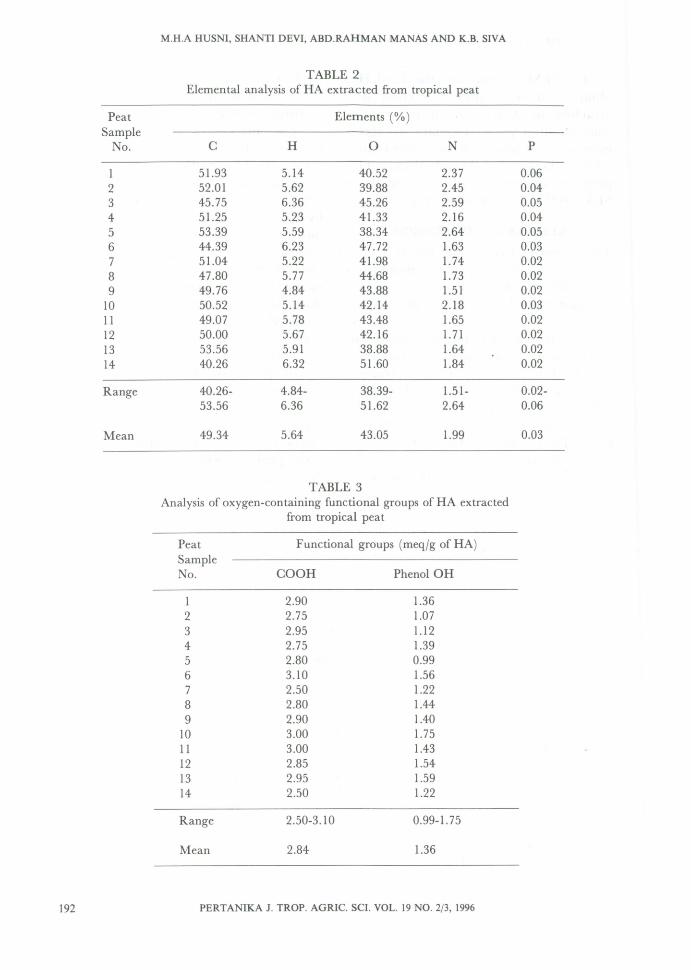
The data on the elemental compositionof HA in terms of percentage weight arepresented in Table 2. Carbon contentranged from 40.26 - 53.26%, H 4.84 6.3%, 0 38.39 - 51.62%, N 1.51 - 2.64%and P 0.02 - 0.06% with means of 49.34%C, 5.64% H, 43.05% 0, 1.99% Nand0.03% P. Comparing these with theelementary composition of HA reported
by Visser (1987) and Garcia et at. (1991)indicated that our results fell within thereported range for temperate peat.
The analysis of the major oxygencontaining functional groups is shown inTable 3. The carboxyl group of HAextracted from tropical peat ranges from2.50 - 3.10 meq/g of HA while phenolichydroxyl groups range from 0.99 - 1. 75meq/g of HA. Mean values of functionalgroups showed 2.84 meq COOH and 1.36meq phenolic hydroxyl/g of HA. Thecarboxyl groups present in HA are morethan twice as numerous as in the phenolichydroxyl groups, implying that the pHdependent charge in peat is controlled bycarboxyl groups.
IR spectra and the absorption bands ofHA extracted from peat are shown in Fig. 1and Table 4, respectively. The broadabsorption band at 3550-3200 cm-1 regioncan be attributed to H-bonded OH groups,while peaks between 2920-2860 cm-1 aredue to aliphatic C-H stretch. According to
TABLE 1Classification and yield of HA from peat
PeatSample 1C1assification Depth (cm)2 O.M.3 HA
o. (%) (%)
1 A 0-15 44 21.232 A 0-15 82 26.883 A 0-15 86 18.304 B 15-30 88 25.785 A 0-15 90 23.786 B 15-30 94 8.407 A 0-15 97 35.678 A 0-15 97 20.689 B 0-15 76 23.45
10 A 0-20 94 36.5211 A 20-40 97 12.3812 B 0-15 89 19.8213 B 20-40 97 8.3014 A 0-15 96 26.92
1 A Typic Tropohemists, B Typic Tropofibrists2 Percentage of organic matter3 % Humic acid (HA) per 100 g peat
PERTANIKA J. TROP. AGRIC. SCI. VOL. 19 NO. 2/3, 1996 191
192
M.H.A HUSNI, SHANTI DEVI, ABD.RAHMAN MANAS AND K.B. SIVA
TABLE 2Elemental analysis of HA extracted from tropical peat
Peat Elements (%)Sample
No. C H 0 N P
I 51.93 5.14 40.52 2.37 0.062 52.01 5.62 39.88 2.45 0.043 45.75 6.36 45.26 2.59 0.054 51.25 5.23 41.33 2.16 0.045 53.39 5.59 38.34 2.64 0.056 44.39 6.23 47.72 1.63 0.037 51.04 5.22 41.98 1.74 0.028 47.80 5.77 44.68 1. 73 0.029 49.76 4.84 43.88 1.51 0.02
10 50.52 5.14 42.14 2.18 0.0311 49.07 5.78 43.48 1.65 0.0212 50.00 5.67 42.16 1. 71 0.0213 53.56 5.91 38.88 1.64 0.0214 40.26 6.32 51.60 1.84 0.02
Range 40.26- 4.84- 38.39- 1.51- 0.02-53.56 6.36 51.62 2.64 0.06
Mean 49.34 5.64 43.05 1.99 0.03
TABLE 3Analysis of oxygen-containing functional groups of HA extracted
from tropical peat
Peat Functional groups (meqjg of HA)SampleNo. COOH PhenolOH
1 2.90 1.362 2.75 1.073 2.95 1.124 2.75 1.395 2.80 0.996 3.10 1.567 2.50 1.228 2.80 1.449 2.90 1.40
10 3.00 1.7511 3.00 1.4312 2.85 1.5413 2.95 1.5914 2.50 1.22
Range 2.50-3.10 0.99-1. 75
Mean 2.84 1.36
PERTANIKA J. TROP. AGRIC. SCI. VOL. 19 NO. 2/3, 1996
PHYSICO-CHEMICAL ATTRIBUTES OF HUMIC ACID EXTRACTED FROM TROPICAL PECT
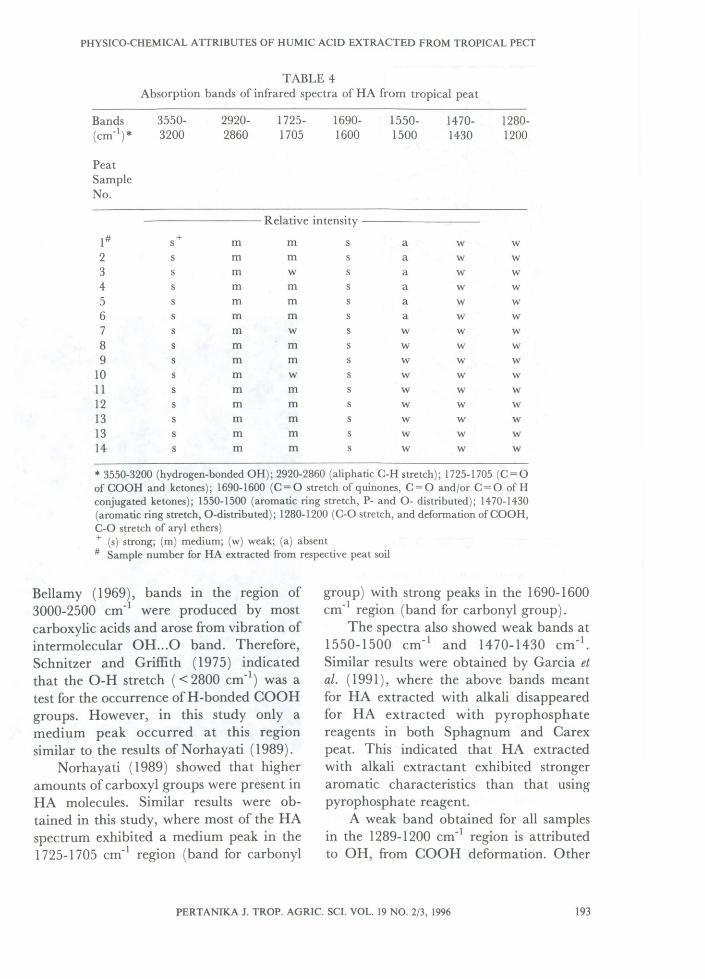
TABLE 4Absorption bands of infrared spectra of HA from tropical peat
Bands 3550- 2920- 1725- 1690- 1550- 1470- 1280-(cm- 1)* 3200 2860 1705 1600 1500 1430 1200
PeatSampleNo.
Relative intensity
1# +s m m a w w2 m m a w w3 m w a w w4 m m a w w5 m m a w w6 m m a w w7 m w w w w8 m m w w w9 m m w w w
10 m w w w w11 m m w w w12 m m w w w13 m m w w w13 m m w w w14 m m w w w
* 3550-3200 (hydrogen-bonded OH); 2920-2860 (aliphatic C-H stretch); 1725-1705 (C = 0ofCOOH and ketones); 1690-1600 (C=O stretch of quinones, C=O and/or C=O ofHconjugated ketones); 1550-1500 (aromatic ring stretch, P- and 0- distributed); 1470-1430(aromatic ring stretch, O-distributed); 1280-1200 (C-O stretch, and deformation ofCOOH,CoO stretch of aryl ethers)+ (s) strong; (m) medium; (w) weak; (a) absent# Sample number for HA extracted from respective peat soil
Bellamy (1969), bands in the region of3000-2500 cm-1 were produced by mostcarboxylic acids and arose from vibration ofintermolecular OR...O band. Therefore,Schnitzer and Griffith (1975) indicatedthat the O-H stretch « 2800 em-I) was atest for the occurrence ofH-bonded GOOHgroups. However, in this study only amediurn peak occurred at this regionsimilar to the results of Norhayati (1989).
Norhayati (1989) showed that higheramounts of carboxyl groups were present inHA molecules. Similar results were obtained in this study, where most of the RAspectrum exhibited a medium peak in the1725-1705 cm-1 region (band for carbonyl
group) with strong peaks in the 1690-1600cm-1 region (band for carbonyl group).
The spectra also showed weak bands at1550-1500 cm- 1 and 1470-1430 em-I.Similar results were obtained by Garcia etai. (1991), where the above bands meantfor HA extracted with alkali disappearedfor HA extracted with pyrophosphatereagents in both Sphagnum and Garexpeat. This indicated that HA extractedwith alkali extractant exhibited strongeraromatic characteristics than that usingpyrophosphate reagent.
A weak band obtained for all samplesin the 1289-1200 cm-1 region is attributedto OH, from GOOH deformation. Other
PERTANIKA J. TROP. AGRIC. SCI. VOL. 19 NO. 2/3, 1996 193
M.H.A HUSNI, SHANTI DEVI, ABD.RAHMAN MANAS AND K.B. SIVA
HA ofSoil
12
3
45
4000 3000 2000 1600 1200 800 400cm-1
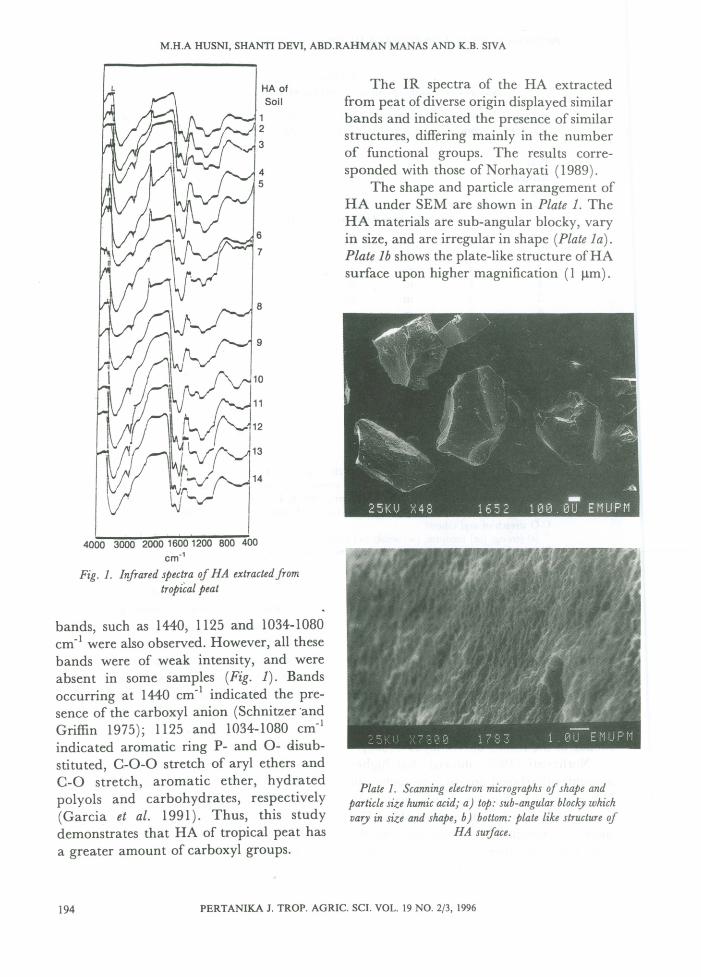
Fig. 1. Infrared spectra of HA extracted fromtropical peat
bands, such as 1440, 1125 and 1034-1080cm- l were also observed. However, all thesebands were of weak intensity, and wereabsent in some samples (Fig. 1). Bandsoccurring at 1440 cm- l indicated the presence of the carboxyl anion (Schnitzer 'andGriffin 1975); 1125 and 1034-1080 cm- l
indicated aromatic ring P- and 0- disubstituted, c-o-o stretch of aryl ethers andC-O stretch, aromatic ether, hydratedpolyols and carbohydrates, respectively(Garcia et al. 1991). Thus, this studydemonstrates that HA of tropical peat hasa greater amount of carboxyl groups.
The IR spectra of the HA extractedfrom peat ofdiverse origin displayed similarbands and indicated the presence of similarstructures, diff~ring mainly in the numberof functional groups. The results corresponded with those of Norhayati (1989).
The shape and particle arrangement ofHA under SEM are shown in Plate 1. TheHA materials are sub-angular blocky, varyin size, and are irregular in shape (Plate 1a).Plate 1b shows the plate-like structure ofHAsurface upon higher magnification (1 ~m).
Plate 1. Scanning electron micrographs of shape andparticle size humic acid)' a) top: sub-angular blocky whichvary in size and shape) b) bottom: plate like structure of
HA surface.
194 PERTANlKA J. TROP. AGRIC. SCI. VOL. 19 NO. 2/3, 1996
PHYSICO-CHEMICAL ATIRIBUTES OF HUMIC ACID EXTRACTED FROM TROPICAL PEeT
CONCLUSION
The elemental analysis of HA showed Cranged from 40.26 - 53.26%, H 4.84 - 6.36%,o 38.39 - 51.62%, N 1.51 - 2.64% and P0.02 - 0.06%. Studies of the functionalgroups indicated that carboxyl groupspresent in HA of tropical peat are abouttwo times more numerous than phenolichydroxyl groups. From IR spectra, the HAobtained is of aromatic character. The IRanalyses also exhibited consistently similarspectra, demonstrating the possibility thatregardless of sample site, the extracted HAhas a similar structure and is composed ofthe same functional groups. SEM examination of dried HA showed sub-angularblocky shape of varying size was similarfor all the HA extracted. These resultssupport those obtained by Norhayati(1989) for Malaysian peat, and demonstrate the similarity between tropical andtemperate peats regardless of plant originor climate.
ACKNOWLEDGEMENT
The authors wish to thank the NationalCouncil for Scientific Research and Development, Malaysia, Program 1-07-05-047for financial support, and Mr. Mohd FuziMohd. Sharifof Soil Fertility Section for histechnical assistance.
REFERENCES
BELLAMY, LJ. 1969. Advances in Infrared GroupFrequencies. London: Methuen.
BOHR, B.F. and R.E. HUGHES. 1971. Scanningelectron microscopy of clays and clay minerals. Clays and Clay Minerals 19: 49-53.
CHESHIRE, M.V., P.A. CRANWELL, C.P.FALSHAW, A.]. FLOYD and R.D.HOWARTH. 1967. Humic acid. Tetrahedron23: 1669-1682.
GARCIA, D., j. CEGARRA. M.P. BERNAL and A.NAVARRO. 1991. Comparative evaluation ofmethods employing alkali and sodium pyrophosphate to extract humic substances frompeat. Commun. Soil Sci. Plant Anal. 24(13/14):
1481-1494.
GHOSH, K. and M. SCHNITZER. 1975. Analyticalcharacteristics of humic acid and fulvic acidsextracted from tropical volcanic soils. Soil Sci.Soc. Am. Proc. 39: 1961-867.
KO ONOVA, M.M. 1961. Soil Organic Matter. NewYork: Pergamon Press.
MURPHY, J. and PJ. RILEY. 1962. A modifiedsingle solution method for the determinationof phosphate in natural waters. Anal. Chem.Acta 27: 31-36.
NORHAYATI, M. 1989. Composition of organicmaterials of peat soils in Peninsular Malaysia.p. 81-87. In Recent Development in SoilGenesis and Classification. ]. Rubber InstituteResearch Malaysia 32(1): 40-49.
NORHAYATI, M. and M. VERLOO, 1984. Characterization of organic matter in four soils ofPeninsular Malaysia. II. Physical and chemical analysis of humic substances. ]. RubberResearch Institute Malaysia 32(1): 40-49.
ORLOV, D.S. and G.I. GLEBOVA. 1972. Electronmicroscopic investigations of humic acids.Agrochemistry 7: 131-136 [Russian].
SCHNITZER, M. 1982. Organic matter characterization p. 581-594. In Methods of Soil Ana!Jsis.ed. A.A. Page et al. Part 2, 2nd edn.Agronomy Monograph 9. Madison, WI:ASA.
SCHNITZER, M. and S.M. GRIFFITH. 1975.ovel methods for estimating hydrogen
bonded C02H groups in humic substances.Can. ]. Soil Sci. 55: 491-493.
SCHNITZER, M. and D.C. GUPTA. 1965. Determination of acidity in soil organic matter. SoilSci. Soc. Am. Proc. 29: 274-277.
STEVENSON, F.j. and K.M. GOH. 1972. Infraredspectra of humic and fulvic acids and theirmethylated derivatives. Evidence for nonspecificity of analytical methods for oxygencontaining functional groups. Soil Sci. 113(5):334-345.
STORER, D.A. 1984. A simple high samplevolume ashing procedure for determinationof soil organic matter. Commun. Soil Sci. PlantAnal. 15(7): 759-772.
TSUTSUKI, K. and S. KUWATSUKA. 1978. Chemical studies on soil humic acids. II. Composition of oxygen-containing functionalgroups of humic acids. Soil Sci. Plant Nutr.24: 547-560.
PERTANIKA J. TROP. AGRIC. SCI. VOL. 19 NO. 2/3, 1996 195
M.H.A HUSNI, SHANTI OEVI, ABO.RAHMAN MANAS AND K.B. SlYA
VISSER, S.A. 1987. Crystal formation by lowmolecular weight fulvic avid and humic acids.Sci. Total Environment 62: 129-138.
(Received 1 August 1996)(Accepted 31 January 1997)
196 PERTANIKA J. TROP. AGRIC. SCI. VOL. 19 NO. 2/3, 1996