getview vol.2 no.4 april 2012
DESCRIPTION
GETview Global Engineers and Technologists ReviewTRANSCRIPT


Committee of the Global Engineers & Technologists Review Chief Editor
Ahmad Mujahid Ahmad Zaidi, MALAYSIA Managing Editor Mohd Zulkifli Ibrahim, MALAYSIA
Editorial Board
Dr. Arsen Adamyan Yerevan State University ARMENIA
Assoc. Prof. Dr. Gasham Zeynalov Khazar University AZERBAIJAN
Assistant Prof. Dr. Tatjana Konjić University of Tuzla Bosnia and Herzegovina BOSNIA and HERZEGOVINA
Assistant Prof. Dr. Muriel de Oliveira Gavira State University of Campinas (UNICAMP) BRAZIL
Assoc. Prof. Dr. Plamen Mateev Sofia University of St. Kliment Ohridsky BULGARIA
Dr. Zainab Fatimah Syed The University of Calgary CANADA
Assistant Prof. Dr. Jennifer Percival University of Ontario Institute of Technology CANADA
Prof. Dr. Sc. Igor Kuzle University of Zagreb CROATIA
Assoc. Prof. Dr. Milan Hutyra VŠB - Technical University of Ostrava CZECH
Prof. Dr. Mohamed Abas Kotb Arab Academy for Science, Technology and Maritime Transport EGYPT
Prof. Dr. Laurent Vercouter INSA de Rouen FRANCE
Prof. Dr. Ravindra S. Goonetilleke The Hong Kong University of Science and Technology HONG KONG
Prof. Dr. Qeethara Kadhim Abdulrahman Al-Shayea Al-Zaytoonah University of Jordan JORDAN
Prof. Yousef S.H. Najjar Jordan University of Science and Technology JORDAN
Assoc. Prof. Dr. Al-Tahat D. Mohammad University of Jordan JORDAN
Assoc. Prof. Dr. John Ndichu Nder Jomo Kenyatta University of Agriculture and Technology- (JKUAT) KENYA
Prof. Dr. Megat Mohamad Hamdan Megat Ahmad The National Defence University of Malaysia MALAYSIA
Prof. Dr. Rachid Touzani Université Mohammed 1er MOROCCO
Prof. Dr. José Luis López-Bonilla Instituto Politécnico Nacional MEXICO
Assoc. Prof. Dr. Ramsés Rodríguez-Rocha IPN Avenida Juan de Dios Batiz MEXICO
Dr. Bharat Raj Pahari Tribhuvan University
NEPAL Prof. Dr. Abdullah Saand Quaid-e-Awam University College of Eng. Sc. & Tech.
PAKISTAN

Prof. Dr. Naji Qatanani An-Najah National University
PALESTINE
Prof. Dr. Anita Grozdanov University Ss Cyril and Methodius REPUBLIC OF MACEDONIA
Prof. Dr. Vladimir A. Katić University of Novi Sad SERBIA
Prof. Dr. Aleksandar M. Jovović Belgrade University SERBIA
Prof. Dr. A.K.W. Jayawardane University of Moratuwa SRI LANKA
Prof. Dr. Gunnar Bolmsjö University West SWEDEN
Prof. Dr. Peng S. Wei National Sun Yat-sen University at Kaohsiung. TAIWAN
Prof. Dr. Ing. Alfonse M. Dubi University of Dar es Salaam TANZANIA
Assoc. Prof. Chotchai Charoenngam Asian Institut of Tecnology THAILAND
Prof. Dr. Hüseyin Çimenoğlu Instanbul Technical University (İTÜ) TURKEY
Assistant Prof. Dr. Zeynep Eren Ataturk University TURKEY
Dr. Mahmoud Chizari The University of Manchester UNITED KINGDOM Prof. Dr. David Hui University of New Orleans
USA
Prof. Dr. Pham Hung Viet Hanoi University of Science VIETNAM
Prof. Dr. Raphael Muzondiwa Jingura Chinhoyi University of Technology ZIMBABWE

Dear the Seeker of Truth and Knowledge, Journal writing. It is rather like keeping a diary; some consider, but it is actually we have to take far more seriously. Therefore, you might prefer to present your unpublished work as a poster or a talk, as a easier way rather than writing it through scientific manuscripts forms. However, the 5 times nominated Nobel Prize, Fritz Schaefer, who have published 1300 scientific publications said, “if it isn’t published, it doesn’t exist.”. This is means, that only through a publication, they will elevate it to the status of a legitimate; completed project worthy of discussion. By the increasing competition for the publication of scientific research that has led to an increased emphasis on determining the perceived "quality" or "status" of a specific journal, then scientists, like everyone else, want to publish papers in journals, especially in where their work is likely to have the highest impact. On this, over the past two decades there has been a marked shift in the way scientific journals are published and disseminated; shifted the reliance from the print versions of most journals; everything is now available on-line. Many journals are available from more than one source, and sometimes one source is free while the other is restricted-access and very expensive. All of this would be a matter of the interest, were it not for the now pervasive and inappropriate practice to the quality of an individual's research. Considering on this, journals like Getview are also certainly only want to publish original research that will have a significant impact and therefore it necessary to explain how your paper differs from previous work, why your paper is important, and what new insights it presents. This journal has been nearly two years in the making. It was a natural outgrowth of the expansion and it was decided that the journal should be published as an open-access online journal. It was also decided that we would endeavour to publish twelve issues a year. Since the Getview is also an online initiative designed to provide a platform for the disciplines of the engineering and technology sciences where students and professionals alike can engage in provoking and engaging explorations of knowledge that push the boundaries of disciplinary lines, by opening space for cross-disciplinary discussions, this journal hopefully can inspires an intersectional investigation and consideration of the issues that scholars in the early part of the 21st century recognize as most compelling in our changing world. This is due to throughout engineering and technology science have had profound impacts, positive and negative, on humankind, other species and the environment. Hence, in an ongoing effort to acquaint our readers with the prominent scholars making up the editorial board that advises and serves the Getview, we are honoured to provide the independent's evidence-based and authoritative information also the advice concerning engineering, technology, and science to policy makers, professionals, leaders in every sector of society, and the public at large. Certainly, involving yours; with the interest and expertise, through paper submitted and published in the Getview. Prof. Ahmad Mujahid Ahmad Zaidi, PhD. Chief Editor The Global Engineers and Technologists Review

©PUBLISHED 2012 Global Engineers and Technologists Review GETview ISSN: 2231-9700 (ONLINE) Volume 2 Number 4 April 2012 All rights reserved. No part of this publication may be reproduced, stored in a retrieval system, or transmitted, electronic, mechanical photocopying, recording or otherwise, without the prior permission of the Publisher. Printed and Published in Malaysia
Vol.2, No.4, 2012 1. THE INTEGER PROGRAMMING FORMULATION OF THE COARSENEE AND
THICKNESS PROBLEMS NIK FARJAM, B. and YUNUSI, M.
5. INFLUENCE OF BIOPOLYMER DOPED WITH ECO-FILLERS AS SOUND ABSORPTION MATERIALS ANIKA ZAFIAH, M.R., NIK NORMUNIRA, M.H. and NURULSAIDATULSYIDA, S.
11. TRACE METALS ACCUMULATION IN SOME IRRIGATED VEGETABLES GROWN
AROUND HEIPANG VILLAGE PLATEAU STATE DANIEL VICTOR NENMAN, NIMYEL DANBOYI NANVEN and DANIANG ISHAYA EZEKIEL
16. SOLID FUEL FROM EMPTY FRUIT BUNCH FIBER AND WASTE PAPERS PART 4: COMPRESSION TEST AT LATERAL POSITION
YUHAZRI, M.Y., HAERYIP SIHOMBING, YAHAYA, S.H., SAID, M.R., UMAR NIRMAL, SAIJOD LAU and PHONGSAKORN PRAK TOM
23. SUITABILITY OF AGGREGATION METHODS OF INDUCTION MOTOR MODELS
FOR VOLTAGE STABILITY ANALYSIS MURIUKI, J.K., MURIITHI, C.M. and KINYUA, D.M.
© 2012 GETview Limited. All right reserved
CONTENTS
ISSN 2231-9700 (online)
GLOBAL ENGINEERS & TECHNOLOGISTS REVIEW www.getview.org
G.L.O.B.A.L E.N.G.I.N.E.E.R.S. .& .-.T.E.C.H.N.O.L.O.G.I.S.T.S R.E.V.I.E.W 1
NIK FARJAM1, B. and YUNUSI2, M.
1, 2 Department of Mathematics Tajik National University
Dushanbe, 40, Rudaki Ave, TAJIKISTAN [email protected]
1.0 INTRODUCTION The thickness problem, asking for the thickness of a given graph G, is NP-hard, so there is little hope to find a polynomial – time algorithm for the thickness problem a general graphs. However, for some graph classes, the thickness can be determined in polynomial time. For example, the thickness is known for complete and complete bipartite graphs, the thickness problem has application in VISI design. In electronic circuits, components are joined by means of conducting strips. These may not cross, since this would lead to undesirable signals in this case, an isolated wire must be used. For that reason, circuits with a large number of crossings are decomposed into several layers without crossing, which are then pasted together. The goal is to use as few layers as possible. In this application it would be desirable to know the thickness of a hypercube whose nodes are cells to be placed and whose hyper edges correspond to the nets connecting the cells. If the thickness problem could be solved for graphs, it graphs, it would be useful engineering tool in the layout of electronic circuits. 2.0 CHARACTERIZATION OF PLANAR GRAPHS Def (2.1) A graph H is said to be homeomorphic form G if either H ≌ G or it isomorphic to a subdivision of G. A graph is homeomorphic with if there exists a graph G3 such that G1 and G2 are both homeomorphism from G3. Theorem (2.1) by Apostol (1957). A graph is planar if and only if it does not contain a sub graph which is homeomorphic from k5 or k3, 3. 3.0 THICKNESS Def (3.1) the thickness of a graph, denoted by o (G), is the minimum of planar sub graph into which the graph can be decomposed. Corollary (3.1) by Halton (1991). Lets G be a connected planar graph with n vertices, m edges and f faces, have for the plane embedding of G that n-m + f = 2. Corollary (3.2) by Apostol (1957). If L(fi) denotes the length of face fi in a plane graph G, than Ʃ L(fi) = 2E Theorem (3.1)
ABSTRACT
The thickness of a graph G = (V, E) is the minimum number of planar sub graph into which the graph can be decomposed. Therefore, the thickness is one measure of the degree of non planarity of a graph. The thickness problem is NP-hard. The thickness problem has application in VLSI design. The coarseness of soma of more frequently studied families of graphs has been calculated or estimated. The coarseness c(G) defined as the maximum number of edge-disjoint non planar sub graphs contained in G. Obviously, G is planar if and only if c(G)=0. This paper discussed an integer programming formulation of the thickness and coarseness problems. Keywords: Thickness, Coarseness.
THE INTEGER PROGRAMMING FORMULATION OF THE COARSENESS AND THICKNESS PROBLEMS

Global Engineers & Technologists Review, Vol.2 No.4 (2012)
© 2012 GETview Limited. All rights reserved 2
If G is a simple planar graph with at least three vertices, then E(G) ≤ 3n-6. If also G is triangle – free, then E(G) ≤ 2n-4. Proof. It suffices to Consider connected graphs, otherwise we could add edges. Eulers formula will relate n and E if we can dispose if f. Corollary (2.2) provides an in equality between E and f. Every face boundary in a simple contain at least three edges (if n≥3). Letting {fi} be the list of face lengths, this yields 2E = Ʃ fi ≥ 3f. But n-E+f=2 → f=2-n+E → 2E≥ 6-3n-3E →E≤ 3n-6. When G is triangle –free, the faces have length at least 4. In this case 2E= Ʃ fi ≥ 4f. But n-E+f=2 → f=2-n+E → 2E≥ 8-4n+4E →E ≤ 2n-4. Theorem (3.2) If G(V,E) is a graph with (|V|=n>2) and |E|=m, then (i) Ɵ(G) ≥ m 3n – 6 (ii) Ɵ(G) ≥ m , if G has no triangle. 2n - 4 Proof. By theorem (2.1), the denominator is the maximum size of each planar sub graph. The pigeonhole principle they yield the inequality. Theorem (3.3) by Apostol (1957). Let G be a graph with m edges, then it holds that Ɵ(G) ≤ 2m 3 3 2 Theorem (3.4) by Apostol (1957). The thickness of the complete bipartite graph kn,n is Ɵ (kn,n) = n + 5 4 Theorem (3.5) by Halton (1991) and Dean et al., (1991). The thickness of the complete graph kn is Ɵ (kn) = n + 7 , for n=9 ,10 and Ɵ (k9) = Ɵ (k10) = 3. 6 Theorem (3.6) Dean et al., (1991). Let G be a graph with minimum degree δ and maximum degree ∆. It holds that δ + 1 ≤ Ɵ(G) ≤ ∆ 4 2 4.0 THE INTEGER PROGRAMMING FORMULATION THE THICKNESS Given an integer programming formulation of the thickness problem. Consider a graph G = (V, E) with |V| = n and |E| = m and let t be a upper bound for the thicken G. The task is assign each edge – to a sub graph L∊{1, 2, .., t} in such a way that all sub graph are planar and the number of the planar sub graph is minimized. By introduce edge – variables yL,e for L = 1, 2, .., t and e=1,2,…..,m which indicate if edge e is assigned to L (yL,e=1) or not (yl,e). In addition, its need layer - variable xL for L = 1, 2, .., t which indicate if large L is required , i.e. , the layer contain at least one edge. The integer programming formulation of the thickness problem can now be as stated; Min ƩtL = 1XL
s.t ƩtL = 1YL,e = 1 for all e = 1, 2, .., m Ʃe∊FLYL,e ≤ FL - 1 for all subdivisions FL of k5 and K3,3 on larger L, for all L = 1, 2, .., t xl≥yL,e for all e = 1, 2, .., m and L = 1, 2, .., t yL,e∊{0, 1} for all e = 1, 2, .., m and L = 1, 2, .., t xL∊{0, 1} for all L = 1, 2, .., t
Global Engineers & Technologists Review, Vol.2 No.4 (2012)
© 2012 GETview Limited. All rights reserved 3
5.0 COARSENESS Def (5.1). The coarseness c(G) of a graph is the maximum of edge-disjoint nonplanar sub graph contained in G. Since the smallest number of edge which a non-planar graph can possess is 9 (and then only if the graph is k3,3). Therefore, it immediately follow that if a graph G has m edges, then C(G) ≤ m . 2 Theorem (5.1) by Beineke and Gary (1986). For the complete graph kn, r if n = 3r 2 c(kn) ≥ r r if n = 3r + 1 2 3 r 3r + 1 if n = 3r + 2 2 4 Corollary (5.1) by Beineke and Gary (1986). For the complete graph km, (i) n2 – 3n ≤ c(km) ≤ n2 – n if n 3 ≡ 0 18 18 (ii) n2 – 5n + 4 n - 1 ≤ c(km) ≤ n2 – n if n 3 ≡ 1 18 9 18 (iii) n2 – 7n + 4 n - 1 ≤ c(km) ≤ n2 – n if n 3 ≡ 2 18 4 18 Corollary (5.2). The coarseness of the complete graph kn is asymptotic to n2/18. Theorem (5.3) by Beineke and Gary (1986). For the complete bipartite graph km,n, m n ≤ c(km,n) ≤ mn 3 3 9 Corollary (5.3) by Beineke and Gary (1986). If m 3 ≡ n 3 ≡ 0, then c(km,n) = mn/9 6.0 THE INTEGER PROGRAMMING FORMULATION THE COARSENESS Given an integer programming formulation of the coarseness problem. Consider a graph G= (V, E) with |V|=n and |E|=m and let t be a upper bound for the coarseness G. The task is assign each edge – to a sub graph L∊{1, 2, .., t} in such a way that all sub graph are planar and the number of the not planar sub graph is maximized . By introduce edge – variables yL,e for L = 1, 2, .., t and e=1, 2, .., m which indicate if edge e is assigned to L (yL,e = 1) or not (yl,e). in addition , we need layer - variable xL for L = 1, 2, .., t which indicate if large L is required , i.e. , the layer contain at least one edge. The integer programming formulation of the coarseness problem can now be stated as follows: Max ƩtL = 1XL
s.t ƩtL = 1YL,e = 1 for all e = 1, 2, .., m Ʃe∊FLYL,e ≤ FL - 1 for all subdivisions FL of k5 and K3,3 on larger L, for all L = 1, 2, .., t xl≥yL,e yL,e∊{0, 1}
Global Engineers & Technologists Review, Vol.2 No.4 (2012)
© 2012 GETview Limited. All rights reserved 4
xL∊{0, 1} 4.0 CONCLUSION It seems that for every positive integer n, there exists a graph G such that c(G) – Ɵ(G) = n. This research shows that the integer programming formulation results have concerning the coarseness of a graph. in particular complete graphs k5 and complete bipartite graphs K3,3 are very important in graph theory. REFERENCES [1] Apostol, T.M. (1957): Mathematical Analysis. Addison-Wesley, Reading, Mass. p.553. [2] Beineke, W.L. and Gary, C. (1986): The Coarseness of a Graph. Compositio Mathematica, Vol.19, No.4, pp.290-298. [3] Dean, A.M., Hutchinson, J.P. and Scheinerman, E.R. (1991): On the Thickness and Arboricity of a Graph.
Journal of Combinatorial Theory, Series B, Vol.52, Iss.1, pp.147-151. [4] Halton, J.H. (1991): On the Thickness of Graphs of Given Degree. Information Sciences, Vol.54, Iss.3, pp. 219-238.
GLOBAL ENGINEERS & TECHNOLOGISTS REVIEW www.getview.org
G.L.O.B.A.L E.N.G.I.N.E.E.R.S. .& .-.T.E.C.H.N.O.L.O.G.I.S.T.S R.E.V.I.E.W 5
ANIKA ZAFIAH1, M.R., NIK NORMUNIRA2, M.H. and NURULSAIDATULSYIDA3, S.
1, 2, 3 Department of Materials and Design Engineering Faculty of Mechanical and Manufacturing Engineering
Universiti Tun Hussein Onn Malaysia 86400, Parit Raja, Batu Pahat, Johor, MALAYSIA
1.0 INTRODUCTION Natural oils are considered to be the most important class of renewable sources. They can be obtained from naturally occurring plants, such as sunflower, cotton, and linseed. They consist predominantly of triglycerides. Among the triglyceride oils, linseed, sunflower, castor, soybean, oiticica, palm, tall and rapseed oils are commonly used for synthesis of oil-modified polymers. Although fatty acid pattern varies between crops, growth conditions, seasons, and purification methods, each of triglyceride oils has special fatty acid distribution (Guner et al., 2006). Crop-based feedstocks have the advantages over petroleum-based in that the resources are renewable, the products are biodegradable and their processes result in reduced emissions of greenhouse and harmful gases (Yuhazri et al., 2012) and (Marvey, 2008).
Currently, both starting materials are mostly derived from petrochemical resources. As natural resources become scarce, many researchers and industries are beginning to investigate and utilize various renewable resources such as the abundant and cheap vegetable oils (Anika Zafiah, 2008). Vegetable oils are becoming extremely important as renewable resources for the preparation of polyols required for the polyurethane industry. Polyols from natural oils, such as soybean, castor, and palm oils are increasingly being viewed by industry as a viable alternative to hydrocarbon based feedstocks. These oils are annually renewable, and are cost-competitive as well as environment friendly.
In polymer industry, vegetable oils which represent a major potential source of chemicals have been utilized as an alternative feedstock for monomers (Suresh et al., 2007) and (Anika Zafiah, 2009a). Polyurethane foams composites made from palm oil were synthesized, crosslink and doped with eco natural fillers of rubber waste or saw dust powder (Anika Zafiah, 2010) and (Anika Zafiah, 2009b). According to a market summary published by the United Soybean Board in February 2000, vegetable oil-based polyurethanes are best suited to three markets namely: polyurethane foams, polyurethane binders and agricultural films (Sharma and Kundu, 2008).
Meanwhile, Industrial applications of sound insulation, generally includes the use of materials such as glass wool, foam, mineral fibres and their composites. As the problem of undesirable and potentially hazardous noise has become much more complex and serious, the demands for a better environment and more diversified life styles are increased. Therefore, the thin, lightweight and low-cost materials that will absorb sound waves in
ABSTRACT
Plant oils and oleochemicals and its derivatives can be used as an alternative source to substitute petroleum based product and as chemical feedstocks. Waste oils were supplied from Small Medium Entrepreneurs (SMEs) and fatty acid was chemically manipulated started with catalyst preparation to generate the epoxies from the unsaturated fatty compound. Second reaction is the acid-catalyst ring opening of the epoxies to form bio monomer. This bio monomer were named as virgin oil monomer (VOM), ‘popia’ oil monomer (POM), mixed oil monomer (MOM) and waste oil monomer (WOM). MOM has been identified to gives lowest OH index with 0.093 as compared to VOM with 0.123 by means of Fourier Transform Infrared (FTIR). Thus, MOM was selected and fabricated as bio-polymer composites to measure the acoustic property of sound absorption coefficient, α. Bio-polymer composite doped with both types of filler without foaming agent shows remarkable characteristic of efficient sound absorbent materials with α approximately equal to 1.0 at high frequency level from 3000 to 4000Hz. Meanwhile, composites without foaming agent gives lower α at lower frequency from 2000 to 3000Hz. Realistically, abundance and low cost, with relatively simple processing materials provides a good solution to the society of hazardous noise that became more complex and gives serious problems nowadays. Keywords: Oleochemicals, Fatty Acid, Catalyst, Acid-catalyst Ring Opening, Epoxies, FTIR.
INFLUENCE OF BIOPOLYMER DOPED WITH ECO-FILLERS AS SOUND ABSORPTION MATERIALS
Global Engineers & Technologists Review, Vol.2 No.4 (2012)
© 2012 GETview Limited. All rights reserved
6
wider frequency regions are strongly desired (Yuhazri et al., 2010) and (Hong et al., 2007). Sound absorption constitutes one of the major requirements for human comfort today. Sound insulation requirements in automobiles, manufacturing environments, and equipment, generating higher sound pressure drive the need to develop more efficient and economical ways of producing sound absorption materials. Sound absorption is the property possessed by materials, structures and objects of converting sound energy to heat due to either propagation in a medium or dissipation when sound strikes a surface. Sound is the organized superposition of particle motion on the random thermal motion of the molecules. Damping is the dissipation of energy with time or distance (Singal, 2000; Ersoy and Kucuk, 2009; Ver and Beranek, 2006).
The absorption coefficient is a useful concept when using geometrical acoustic theory to evaluate the growth and decay of sound energy in a room. Any material absorbs sound to some extent. However, when sound is considered as a wave motion, it is necessary to use the concept of acoustic impedance based on below characteristic; porous absorption, membrane absorption and resonator absorption. Porous absorption is when sound wave impinges on a porous material containing capillaries/continuous airways such as found in glass wool, rock wool, and porous foam, they propagate into the interstices in which a part of the sound energy is dissipated by frictional and by vibration of small fibres of the materials. The absorption is large at high frequencies and small at low frequencies (Maekawa and Lord, 1994).
Membrane absorption is when sound strikes an air-tight material such as thin plywood or canvas panel; it excites membrane types of vibration of the materials. Part of the sound energy is the lost due to the internal friction in the materials. The absorption characteristic shows a peak in the low-frequency range which coincides with resonant frequency of the membrane through the absorption coefficient is usually no so large. Resonator absorption is sound incident on the resonator consisting of a cavity with an opening excites large amplitude air vibrations at the opening in the resonant frequency range, dissipating the sound energy at the resonant frequency range, dissipating the sound energy by means of viscous losses. Thus, the absorption can be very large at the resonant frequency (Maekawa and Lord, 1994). 2.0 EXPERIMENTAL PROCEDURE Four types of oils were supplied locally from Small Medium Entrepreneurs (SMEs) and local superstore. Four types of original and waste cooking oil were used namely as Virgin Oil (VO), ‘Popia’ Oil (PO), Mixed Oil (MO) and Waste Oil (WO) for the synthesis of bio-monomer. PO and MO are waste oils produce from Syarikat Hj. Salleh Food Supplier and Syarikat MdShah & Asiah at Parit Raja respectively. WO is from the combination of varies types of waste cooking oil of different types of cooking crisps and was supplied from Syarikat MK Berkat Industries.
The preparation of the hydroxylated monomer was divided into two stages, beginning with the preparation of the catalyst to generate the epoxides from the unsaturated fatty compounds, while the second stage comprised the acid-catalysed ring-opening of the epoxides to form polyols (Anika Zafiah, 2010). The prepared catalyst was mixed with different types of oils; VO, PO, MO, WO and condensation polymerization of the monomer was conducted by using lab scale less than two liter per running. Each type of oil that were VO, PO, MO, and WO was converted to bio-monomer known as Virgin Oil Monomer (VOM), ‘Popia’ Oil Monomer (POM), Mixed Oil Monomer (MOM), and Waste Oil Monomer (WOM) respectively. Fourier Transform Infrared (FTIR) spectrometer was used to identify the functional groups of monomers and its polymer derivatives.
The level of cross-linking influences the mechanical properties of the resulting polymer. Such a highly crosslinked polymer is useful for applications of insulation materials e.g. for surface coatings in the corrosion protection of optical cables or as automotive internal components when a highly stiff structural composite can be obtained. Two types of organic fillers were used such as waste tyre rubber dust filler and wood dust fillers to produce bio-polymer composites. Different percent loading of fillers in the polymer such as 2.5 %, 5 %, 7.5 %, and 10 % with and without addition of foaming agent was prepared. Samples foam of 28 mm and 100 mm diameter with 10 mm thickness were fabricated by simple open casting method. The acoustic study based on Impedance Tube test; type SSC 9020 B/K were conducted from low to high frequency range.
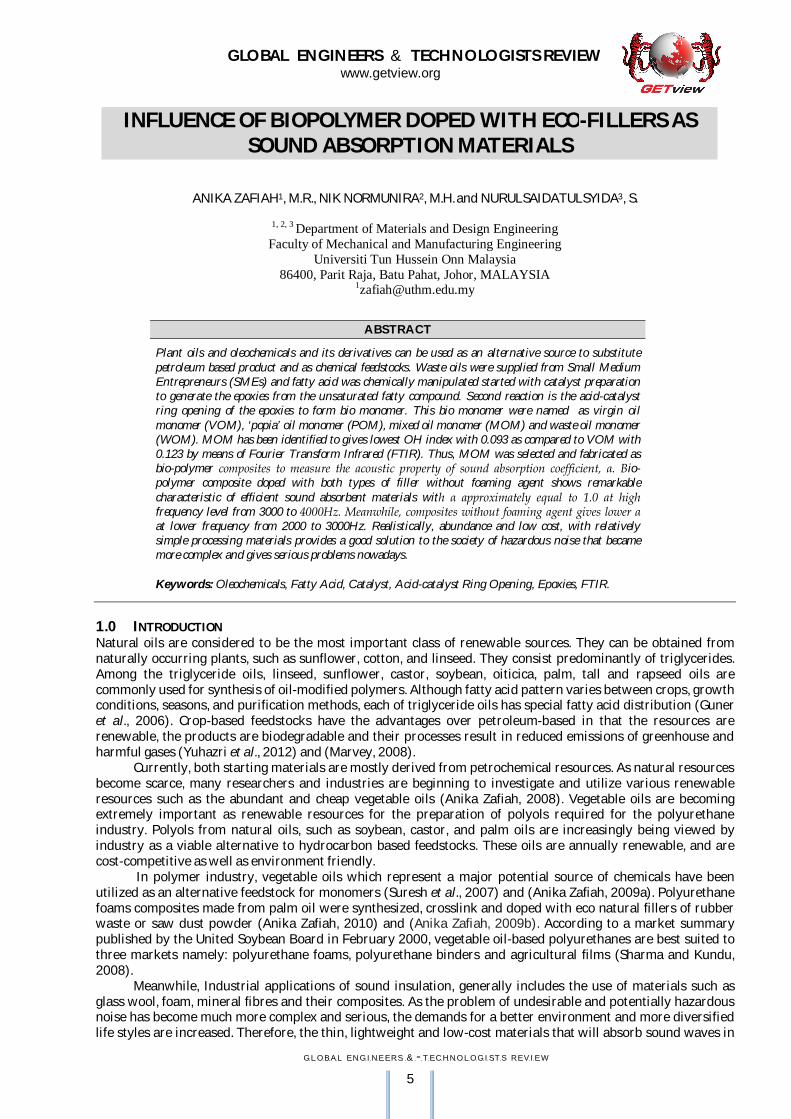
3.0 RESULTS AND DISCUSSION Referring to Figure 1 of Hydroxyl Index (HI) calculated from the intensity of hydroxyl group indicated by means of FTIR as formulated below (Fabiyi et al., 2005).
HYDROXYL INDEX (HI) = A3340 / A2916 (1)
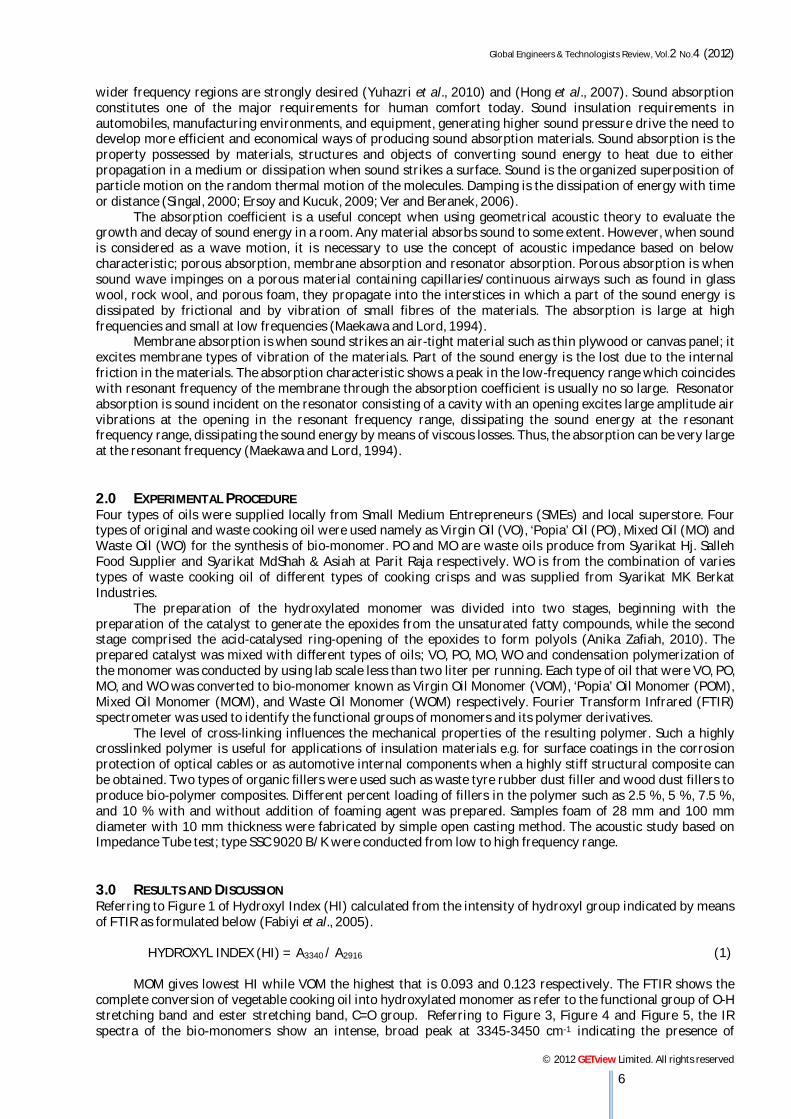
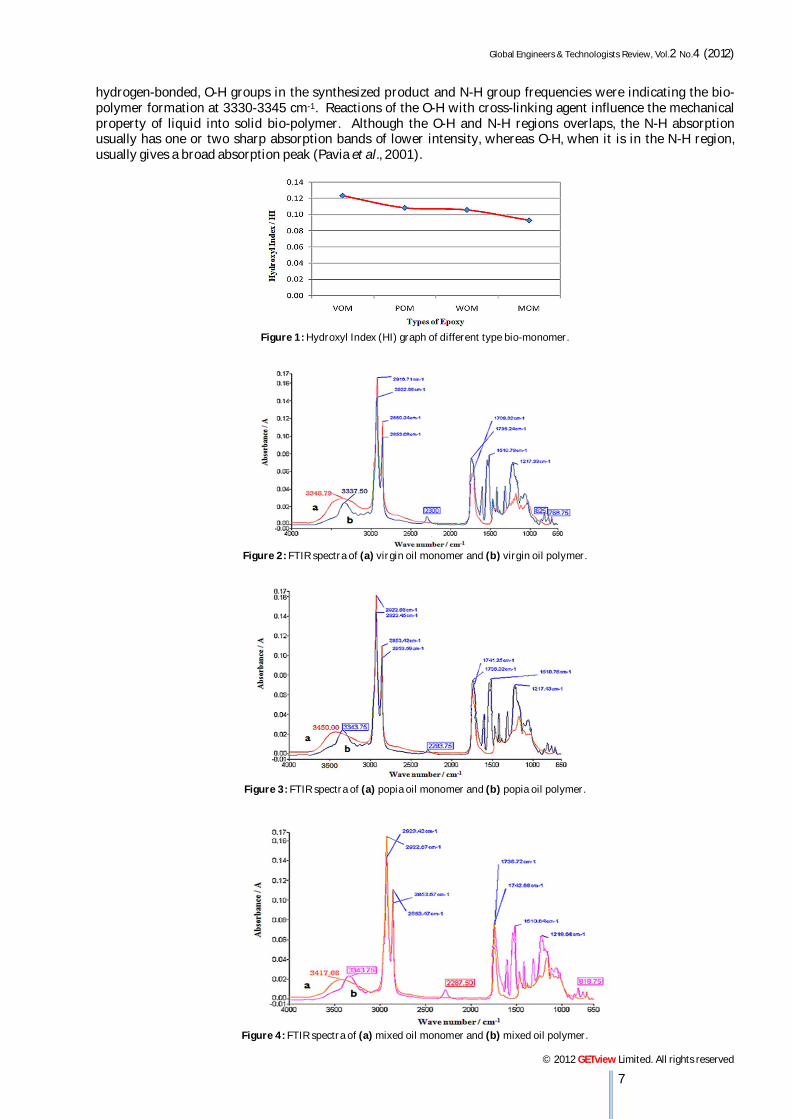
MOM gives lowest HI while VOM the highest that is 0.093 and 0.123 respectively. The FTIR shows the complete conversion of vegetable cooking oil into hydroxylated monomer as refer to the functional group of O-H stretching band and ester stretching band, C=O group. Referring to Figure 3, Figure 4 and Figure 5, the IR spectra of the bio-monomers show an intense, broad peak at 3345-3450 cm-1 indicating the presence of
Global Engineers & Technologists Review, Vol.2 No.4 (2012)
© 2012 GETview Limited. All rights reserved
7
hydrogen-bonded, O-H groups in the synthesized product and N-H group frequencies were indicating the bio-polymer formation at 3330-3345 cm-1. Reactions of the O-H with cross-linking agent influence the mechanical property of liquid into solid bio-polymer. Although the O-H and N-H regions overlaps, the N-H absorption usually has one or two sharp absorption bands of lower intensity, whereas O-H, when it is in the N-H region, usually gives a broad absorption peak (Pavia et al., 2001).
Figure 1: Hydroxyl Index (HI) graph of different type bio-monomer.
Figure 2: FTIR spectra of (a) virgin oil monomer and (b) virgin oil polymer.
Figure 3: FTIR spectra of (a) popia oil monomer and (b) popia oil polymer.
Figure 4: FTIR spectra of (a) mixed oil monomer and (b) mixed oil polymer.
Global Engineers & Technologists Review, Vol.2 No.4 (2012)
© 2012 GETview Limited. All rights reserved
8
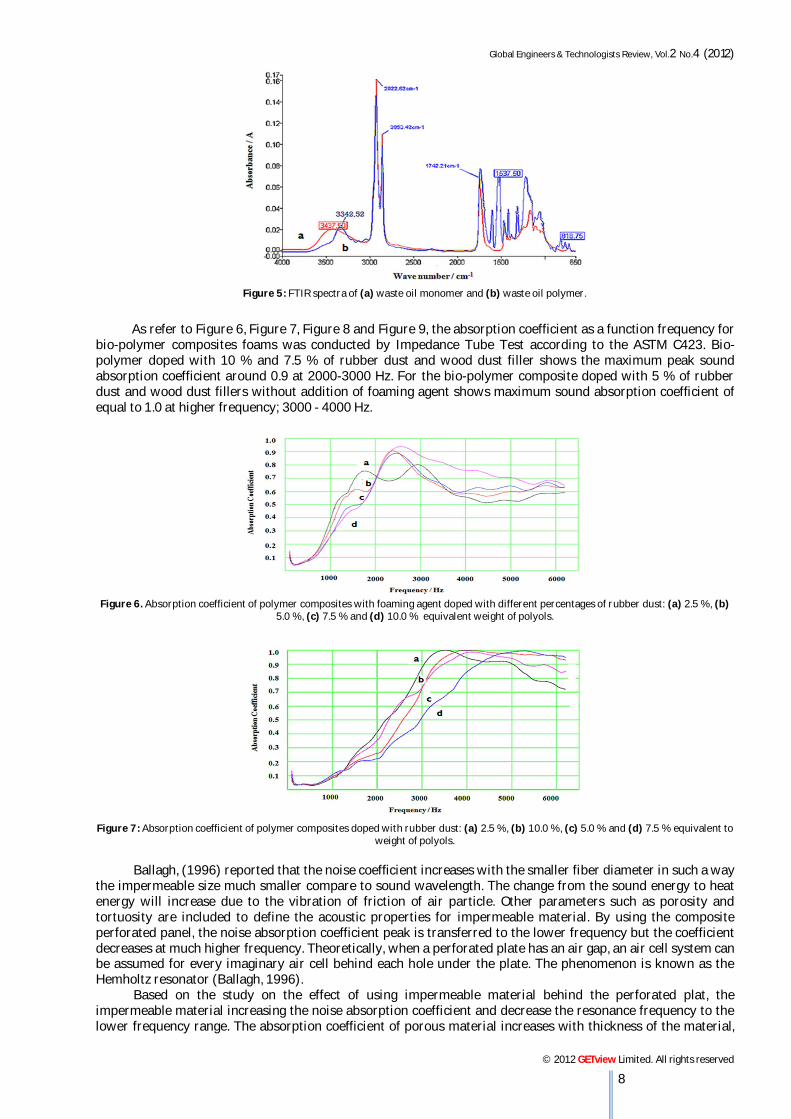
Figure 5: FTIR spectra of (a) waste oil monomer and (b) waste oil polymer.
As refer to Figure 6, Figure 7, Figure 8 and Figure 9, the absorption coefficient as a function frequency for
bio-polymer composites foams was conducted by Impedance Tube Test according to the ASTM C423. Bio-polymer doped with 10 % and 7.5 % of rubber dust and wood dust filler shows the maximum peak sound absorption coefficient around 0.9 at 2000-3000 Hz. For the bio-polymer composite doped with 5 % of rubber dust and wood dust fillers without addition of foaming agent shows maximum sound absorption coefficient of equal to 1.0 at higher frequency; 3000 - 4000 Hz.
Figure 6. Absorption coefficient of polymer composites with foaming agent doped with different percentages of rubber dust: (a) 2.5 %, (b) 5.0 %, (c) 7.5 % and (d) 10.0 % equivalent weight of polyols.
Figure 7: Absorption coefficient of polymer composites doped with rubber dust: (a) 2.5 %, (b) 10.0 %, (c) 5.0 % and (d) 7.5 % equivalent to
weight of polyols.
Ballagh, (1996) reported that the noise coefficient increases with the smaller fiber diameter in such a way the impermeable size much smaller compare to sound wavelength. The change from the sound energy to heat energy will increase due to the vibration of friction of air particle. Other parameters such as porosity and tortuosity are included to define the acoustic properties for impermeable material. By using the composite perforated panel, the noise absorption coefficient peak is transferred to the lower frequency but the coefficient decreases at much higher frequency. Theoretically, when a perforated plate has an air gap, an air cell system can be assumed for every imaginary air cell behind each hole under the plate. The phenomenon is known as the Hemholtz resonator (Ballagh, 1996).
Based on the study on the effect of using impermeable material behind the perforated plat, the impermeable material increasing the noise absorption coefficient and decrease the resonance frequency to the lower frequency range. The absorption coefficient of porous material increases with thickness of the material,
Global Engineers & Technologists Review, Vol.2 No.4 (2012)
© 2012 GETview Limited. All rights reserved
9
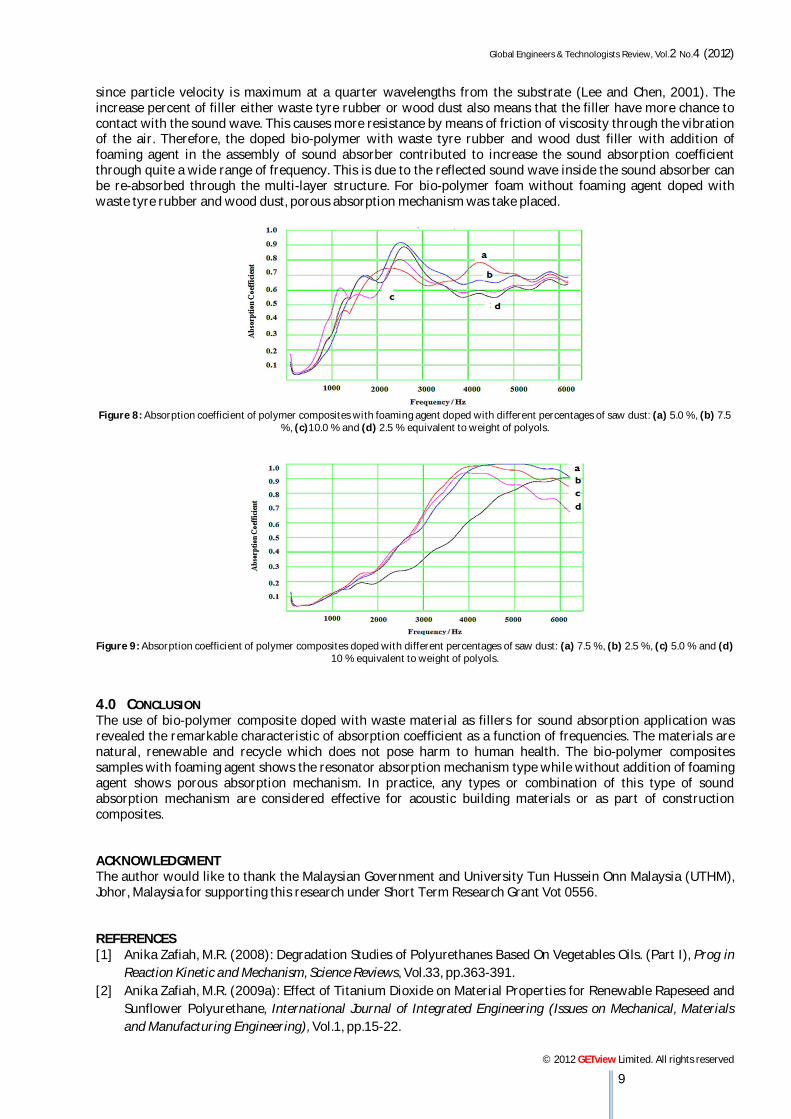
since particle velocity is maximum at a quarter wavelengths from the substrate (Lee and Chen, 2001). The increase percent of filler either waste tyre rubber or wood dust also means that the filler have more chance to contact with the sound wave. This causes more resistance by means of friction of viscosity through the vibration of the air. Therefore, the doped bio-polymer with waste tyre rubber and wood dust filler with addition of foaming agent in the assembly of sound absorber contributed to increase the sound absorption coefficient through quite a wide range of frequency. This is due to the reflected sound wave inside the sound absorber can be re-absorbed through the multi-layer structure. For bio-polymer foam without foaming agent doped with waste tyre rubber and wood dust, porous absorption mechanism was take placed.
Figure 8: Absorption coefficient of polymer composites with foaming agent doped with different percentages of saw dust: (a) 5.0 %, (b) 7.5
%, (c)10.0 % and (d) 2.5 % equivalent to weight of polyols.
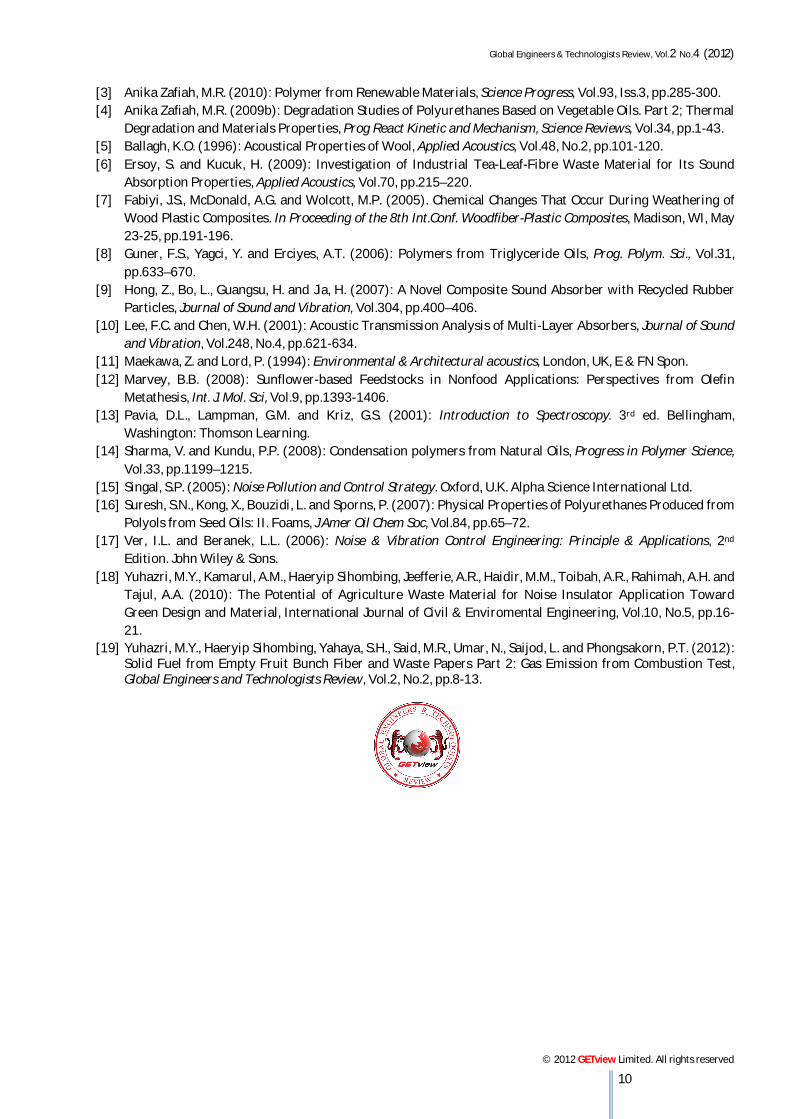
Figure 9: Absorption coefficient of polymer composites doped with different percentages of saw dust: (a) 7.5 %, (b) 2.5 %, (c) 5.0 % and (d)
10 % equivalent to weight of polyols. 4.0 CONCLUSION The use of bio-polymer composite doped with waste material as fillers for sound absorption application was revealed the remarkable characteristic of absorption coefficient as a function of frequencies. The materials are natural, renewable and recycle which does not pose harm to human health. The bio-polymer composites samples with foaming agent shows the resonator absorption mechanism type while without addition of foaming agent shows porous absorption mechanism. In practice, any types or combination of this type of sound absorption mechanism are considered effective for acoustic building materials or as part of construction composites. ACKNOWLEDGMENT The author would like to thank the Malaysian Government and University Tun Hussein Onn Malaysia (UTHM), Johor, Malaysia for supporting this research under Short Term Research Grant Vot 0556. REFERENCES [1] Anika Zafiah, M.R. (2008): Degradation Studies of Polyurethanes Based On Vegetables Oils. (Part I), Prog in
Reaction Kinetic and Mechanism, Science Reviews, Vol.33, pp.363-391. [2] Anika Zafiah, M.R. (2009a): Effect of Titanium Dioxide on Material Properties for Renewable Rapeseed and
Sunflower Polyurethane, International Journal of Integrated Engineering (Issues on Mechanical, Materials and Manufacturing Engineering), Vol.1, pp.15-22.
Global Engineers & Technologists Review, Vol.2 No.4 (2012)
© 2012 GETview Limited. All rights reserved
10
[3] Anika Zafiah, M.R. (2010): Polymer from Renewable Materials, Science Progress, Vol.93, Iss.3, pp.285-300. [4] Anika Zafiah, M.R. (2009b): Degradation Studies of Polyurethanes Based on Vegetable Oils. Part 2; Thermal
Degradation and Materials Properties, Prog React Kinetic and Mechanism, Science Reviews, Vol.34, pp.1-43. [5] Ballagh, K.O. (1996): Acoustical Properties of Wool, Applied Acoustics, Vol.48, No.2, pp.101-120. [6] Ersoy, S. and Kucuk, H. (2009): Investigation of Industrial Tea-Leaf-Fibre Waste Material for Its Sound
Absorption Properties, Applied Acoustics, Vol.70, pp.215–220. [7] Fabiyi, J.S., McDonald, A.G. and Wolcott, M.P. (2005). Chemical Changes That Occur During Weathering of
Wood Plastic Composites. In Proceeding of the 8th Int.Conf. Woodfiber-Plastic Composites, Madison, WI, May 23-25, pp.191-196.
[8] Guner, F.S., Yagci, Y. and Erciyes, A.T. (2006): Polymers from Triglyceride Oils, Prog. Polym. Sci., Vol.31, pp.633–670.
[9] Hong, Z., Bo, L., Guangsu, H. and Jia, H. (2007): A Novel Composite Sound Absorber with Recycled Rubber Particles, Journal of Sound and Vibration, Vol.304, pp.400–406.
[10] Lee, F.C. and Chen, W.H. (2001): Acoustic Transmission Analysis of Multi-Layer Absorbers, Journal of Sound and Vibration, Vol.248, No.4, pp.621-634.
[11] Maekawa, Z. and Lord, P. (1994): Environmental & Architectural acoustics, London, UK, E & FN Spon. [12] Marvey, B.B. (2008): Sunflower-based Feedstocks in Nonfood Applications: Perspectives from Olefin
Metathesis, Int. J. Mol. Sci, Vol.9, pp.1393-1406. [13] Pavia, D.L., Lampman, G.M. and Kriz, G.S. (2001): Introduction to Spectroscopy. 3rd ed. Bellingham,
Washington: Thomson Learning. [14] Sharma, V. and Kundu, P.P. (2008): Condensation polymers from Natural Oils, Progress in Polymer Science,
Vol.33, pp.1199–1215. [15] Singal, S.P. (2005): Noise Pollution and Control Strategy. Oxford, U.K. Alpha Science International Ltd. [16] Suresh, S.N., Kong, X., Bouzidi, L. and Sporns, P. (2007): Physical Properties of Polyurethanes Produced from
Polyols from Seed Oils: II. Foams, J Amer Oil Chem Soc, Vol.84, pp.65–72. [17] Ver, I.L. and Beranek, L.L. (2006): Noise & Vibration Control Engineering: Principle & Applications, 2nd
Edition. John Wiley & Sons. [18] Yuhazri, M.Y., Kamarul, A.M., Haeryip Sihombing, Jeefferie, A.R., Haidir, M.M., Toibah, A.R., Rahimah, A.H. and
Tajul, A.A. (2010): The Potential of Agriculture Waste Material for Noise Insulator Application Toward Green Design and Material, International Journal of Civil & Enviromental Engineering, Vol.10, No.5, pp.16-21.
[19] Yuhazri, M.Y., Haeryip Sihombing, Yahaya, S.H., Said, M.R., Umar, N., Saijod, L. and Phongsakorn, P.T. (2012): Solid Fuel from Empty Fruit Bunch Fiber and Waste Papers Part 2: Gas Emission from Combustion Test, Global Engineers and Technologists Review, Vol.2, No.2, pp.8-13.
GLOBAL ENGINEERS & TECHNOLOGISTS REVIEW www.getview.org
G.L.O.B.A.L E.N.G.I.N.E.E.R.S. .& .-.T.E.C.H.N.O.L.O.G.I.S.T.S R.E.V.I.E.W 11
DANIEL VICTOR NENMAN1, NIMYEL DANBOYI NANVEN2 and DANIANG ISHAYA EZEKIEL3
1, 2, 3 Department of Science School of Science and Technology
Plateau State Polytechnic Barkin Ladi, PMB 02023, Bukuru, Plateau State, NIGERIA
[email protected] [email protected]
1.0 INTRODUCTION Substantial amount of irrigated vegetables is produced in some Local Government Areas (e.g. Bokkos, Jos North and Jos South etc.) of Plateau State and sold in all Local markets, but mostly in vegetable markets like ‘Farina Gada’, ‘Yan-Dankali’, ‘Mararaban Foron’ and Building Material’s Markets etc. that are in and around the State Capital, Jos. The vegetables are then transported to the different parts of the Country and probably to some neighboring countries like Cameroun and Benin Republic. Irrigated agriculture supports world growing population by increasing crop yield, offering employment, business opportunities and ameliorating the standard of living of the populace (Ani and Donye, 2005). However, the implications of irrigated agriculture are that; lands no longer enjoy fallow periods, increased salinity, soil erosion, compaction etc, thus degenerating the soil resource base where remedial management practice are not instituted (Nwa, 1991) and (Ogunwole et al., 2001). Salinity favors the up-take of some metals e.g. cadmium by some vegetables (in Environmental Protection and Heritage Council, 2003). In order to prevent the build-up of salts within the soil by irrigation, large (and usually unavailable) amount of water is required to leach the soil of salts or grow salt tolerable plants (in National Research Council, 1990). The leaching of the soil however, contaminates the ground water resource (Botkin and Edward, 1999). Consumption of vegetable has increased in recent years due to the awareness that vegetables contain certain nutritionally important compounds necessary for human survival. They are often called protective food due to their functions of preventing disease of human body (Maleki and Masoud, 2008) and (Gimba et al., 2012). Vegetable uptake of metals from soil is one of the major pathways that metals enter into food chain and are subsequently accumulated to high concentrations causing serious risk to human health when plants’ based food stuffs are consumed (Islam et al., 2007). The health risks will depend on the chemical composition of the waste material, its physical characteristics, the vegetables cultivated and the consumption rate (Khariah et al., 2004). Various health effects of trace metals include: damage to lymphatic, hematological, neuromuscular, reproductive, and renal and central nervous system (Arora et al., 2008).
ABSTRACT
Irrigation and mining could be responsible for the accumulation of heavy metals in vegetables. The concentrations of iron (Fe), cobalt (Co), nickel (Ni) and cadmium (Cd) in six irrigated vegetables (tomatoes, green pepper, green beans, cabbage, red pepper and spinach) from a mined area (Heipang) was determined using flame atomic absorption spectrophotometer (FAAS). Spinach accumulated the highest concentrations of all the metals among the six vegetables studied. The concentrations of most of the metals were below the maximum allowed levels of FAO/WHO except for Fe and Cd in spinach. The concentrations of the metals were; Iron, (17.46mg/kg – 546mg/kg), Nickel, (1.952mg/kg – 4.42mg/kg), Cobalt, (5.55mg/kg – 16.28mg/kg) and cadmium (0.85mg/kg in spinach). The order of accumulation of the metals in the vegetables as shown by the concentration factors was Co>Ni>>Fe. The speciation of the available fractions (soluble, exchangeable and carbonate) in the sediment of the streams used for irrigation was also determined. The concentrations of the metals studied in these fractions were low. Hence, the result did not show any unusual increase in the concentrations of metals in the soil, sediment and vegetables as a result of the irrigation or mining activities. Keywords: Heavy Metals, Irrigated Vegetables, Speciation, Accumulation, FASS.
TRACE METALS ACCUMULATION IN SOME IRRIGATED VEGETABLES GROWN AROUND HEIPANG VILLAGE
PLATEAU STATE
Global Engineers & Technologists Review, Vol.2 No.4 (2012)
© 2012 GETview Limited. All rights reserved 12
The sources of water used for irrigation are enormous, but in Barkin Ladi, streams and mining ponds are dominant. As a mining area, the soil inherited heavy metals from parent materials augmented by the use of organic and inorganic fertilizers and/or atmospheric deposition (Kachenko and Singh, 2006). The age long mining activities in the area could affect the bioavailability of the metals due to the formation of strong bonds of soil particles and/or incorporation into resistant secondary mineral of low availability e.g. iron oxides (Peterson et al., 2002). However, irrigation may increase the availability of these metals when the water levels are low. On mixing and re suspension of sediment, heavy metals that were bonded to the sediment at the bottom of the stream become available and are then transported to agricultural parcels (Mendosa et al., 1996). Other factors that affect metals bioavailability include the speciation, biotransformation, availability of complexing agents, pH, Redox, sorption sediment and soil physiochemical properties and hydrology (Islam et al., 2007). The aim of this research is to provide data for total and specie concentrations of four trace metals in sediment, soil and in some irrigated vegetables grown in a mining area of Plateau State, Nigeria. 2.0 MATERIALS AND METHODS
2.1 Study Area Heigpang is a District in Barkin Ladi L.G.A of Plateau State, Nigeria. The irrigation farms are located between Plateau State Polytechnic and the Airport. Part of the stream used for the irrigation is being used by the Polytechnic as Dam. Tin was mined in the area in the early twenties. 2.2 Vegetable Samples and Treatment Six irrigated vegetables comprising of leaves and fruits were collected from irrigation site of Heipang District of Barkin Ladi Local Government Area of Plateau State. The vegetables were spinach, and cabbage for leaves vegetables; tomatoes, pepper, green pepper and green beans for fruits vegetables. Samplings were done randomly, in all the farmlands along the entire lengths of the stream used for the irrigation. The same type of vegetables was mixed to give the representative fraction of each of the vegetable. The vegetables harvested were washed with the steam water to remove soil particles. The vegetables were cut with plastic knives before oven drying at 70 °C until stable weights were obtained. Samples were then ground in a mortar. The ground vegetables were digested in concentrated HNO3 until clear solutions were obtained. Digested samples were filtered into a 100 ml volumetric flask and made up to the mark with distilled water. Heavy metals in the vegetables were determined by Flame Atomic Absorption spectrophotometer (Pye Unicam Model 969, AAS). 2.3 Soil Sampling and Treatment Soil samples were collected at each place and time the vegetables were uprooted and the soil mixed thoroughly to give a representative fraction. The soil samples were air dried ground and sieved though 200 mm mesh size. The total metal concentrations in the soil were determined as with the vegetables. 2.4 Sediment Sampling and Treatment The surface sediments of the stream were collected at different points along the stream by a plastic spoon. These were mixed, dried, ground in a mortar and sieved through a 200 mm mesh, one gram of sample was digested and total metals were determined as with the vegetables. The sequential extraction method was used to extract the available fractions (soluble, extractible and carbonate) from the sediment. One gram of the sediment was transferred into a 100 ml Erlenger flask and 5 ml of previously centrifuged water was added to obtain water – sediment ratio of 5:1. The filtrate volume was made to the mark with distilled water and stored for the determination of the soluble fraction (Egila and Daniel, 2011). 8 ml of 1M MgCl2 were added to the residue of the first soluble fraction and suspension was shaken in a mechanical shaker for one hour and then centrifuged (20 minutes at 3000 rpm). The solution filtered and the extract examined for exchangeable fraction. A washed sub-sample from the previous step was washed with distilled water and supernatant discarded. The residue was extracted with sodium acetate, acetic acid added to maintain the pH at 5. The extract was centrifuged, filtered into a 100 ml flask and made up to the mark and stored for carbonate fraction examination (Egila and Daniel, 2011).
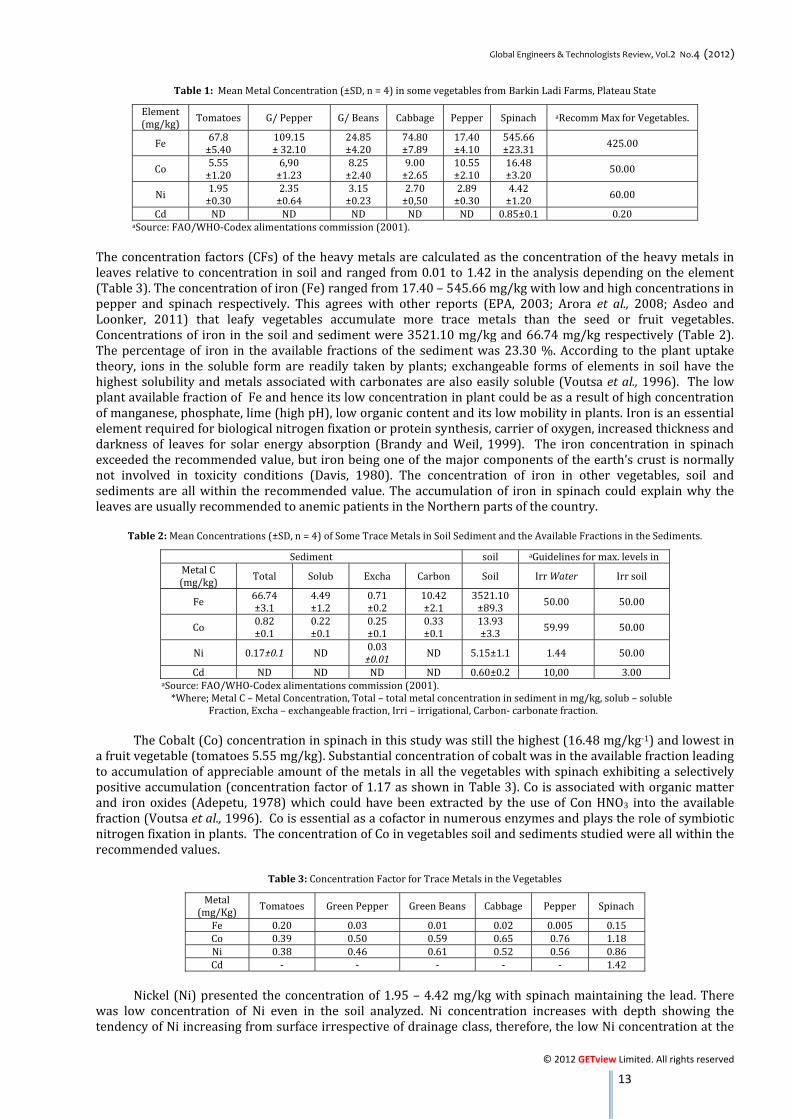
3.0 RESULTS AND DISCUSSION The distribution of iron (Fe) cobalt (Co) Cadium (Cd) and Nickel (Ni) with their maximum limits in irrigated vegetables are presented in Table 1. The mean concentrations of Fe, Co, Ni, and Cd in different vegetable samples from irrigated sites of Barkin Ladi are listed in Tables 1 and mean concentrations of the metals in the soil and the available fractions in the sediment are recorded in Table 2.
Global Engineers & Technologists Review, Vol.2 No.4 (2012)
© 2012 GETview Limited. All rights reserved 13
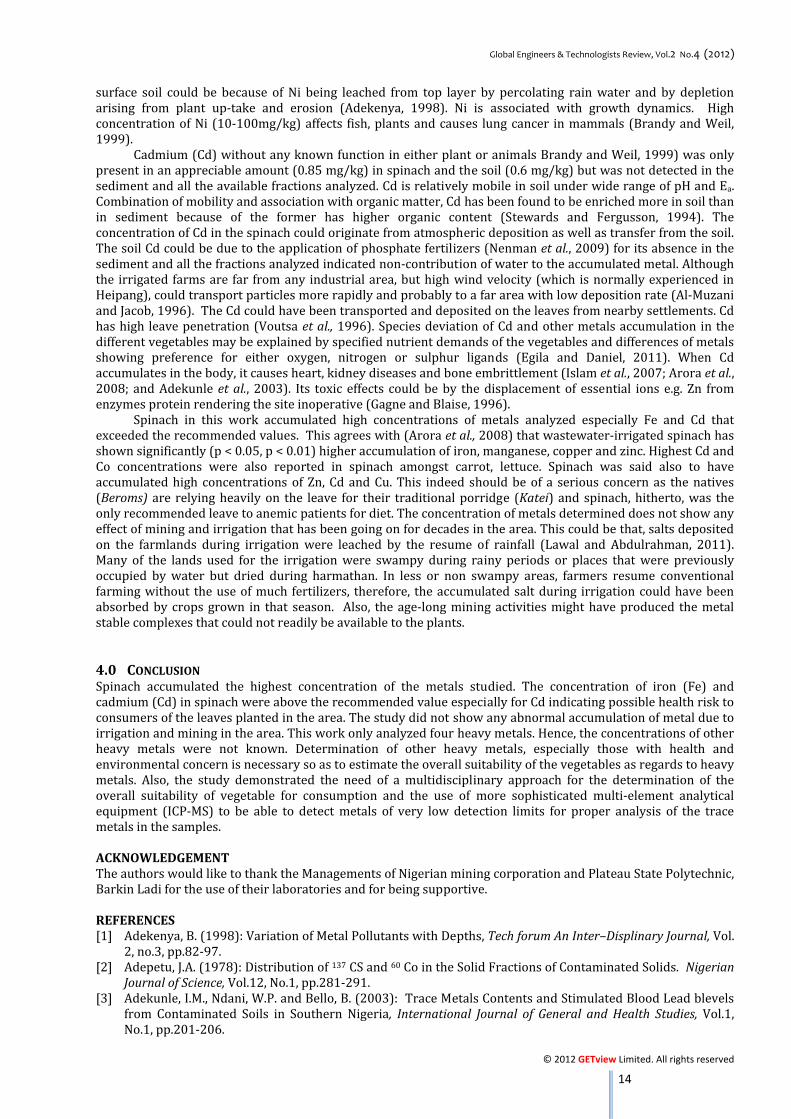
Table 1: Mean Metal Concentration (±SD, n = 4) in some vegetables from Barkin Ladi Farms, Plateau State Element (mg/kg) Tomatoes G/ Pepper G/ Beans Cabbage Pepper Spinach aRecomm Max for Vegetables. Fe 67.8 ±5.40 109.15 ± 32.10 24.85±4.20 74.80±7.89 17.40±4.10 545.66±23.31 425.00 Co 5.55 ±1.20 6,90 ±1.23 8.25±2.40 9.00±2.65 10.55±2.10 16.48±3.20 50.00 Ni 1.95 ±0.30 2.35 ±0.64 3.15±0.23 2.70±0,50 2.89±0.30 4.42±1.20 60.00 Cd ND ND ND ND ND 0.85±0.1 0.20 aSource: FAO/WHO-Codex alimentations commission (2001). The concentration factors (CFs) of the heavy metals are calculated as the concentration of the heavy metals in leaves relative to concentration in soil and ranged from 0.01 to 1.42 in the analysis depending on the element (Table 3). The concentration of iron (Fe) ranged from 17.40 – 545.66 mg/kg with low and high concentrations in pepper and spinach respectively. This agrees with other reports (EPA, 2003; Arora et al., 2008; Asdeo and Loonker, 2011) that leafy vegetables accumulate more trace metals than the seed or fruit vegetables. Concentrations of iron in the soil and sediment were 3521.10 mg/kg and 66.74 mg/kg respectively (Table 2). The percentage of iron in the available fractions of the sediment was 23.30 %. According to the plant uptake theory, ions in the soluble form are readily taken by plants; exchangeable forms of elements in soil have the highest solubility and metals associated with carbonates are also easily soluble (Voutsa et al., 1996). The low plant available fraction of Fe and hence its low concentration in plant could be as a result of high concentration of manganese, phosphate, lime (high pH), low organic content and its low mobility in plants. Iron is an essential element required for biological nitrogen fixation or protein synthesis, carrier of oxygen, increased thickness and darkness of leaves for solar energy absorption (Brandy and Weil, 1999). The iron concentration in spinach exceeded the recommended value, but iron being one of the major components of the earth’s crust is normally not involved in toxicity conditions (Davis, 1980). The concentration of iron in other vegetables, soil and sediments are all within the recommended value. The accumulation of iron in spinach could explain why the leaves are usually recommended to anemic patients in the Northern parts of the country. Table 2: Mean Concentrations (±SD, n = 4) of Some Trace Metals in Soil Sediment and the Available Fractions in the Sediments. Sediment soil aGuidelines for max. levels inMetal C (mg/kg) Total Solub Excha Carbon Soil Irr Water Irr soil Fe 66.74 ±3.1 4.49±1.2 0.71±0.2 10.42±2.1 3521.10±89.3 50.00 50.00 Co 0.82 ±0.1 0.22±0.1 0.25±0.1 0.33±0.1 13.93±3.3 59.99 50.00 Ni 0.17±0.1 ND 0.03
±0.01 ND 5.15±1.1 1.44 50.00 Cd ND ND ND ND 0.60±0.2 10,00 3.00 aSource: FAO/WHO-Codex alimentations commission (2001). *Where; Metal C – Metal Concentration, Total – total metal concentration in sediment in mg/kg, solub – soluble Fraction, Excha – exchangeable fraction, Irri – irrigational, Carbon- carbonate fraction. The Cobalt (Co) concentration in spinach in this study was still the highest (16.48 mg/kg-1) and lowest in a fruit vegetable (tomatoes 5.55 mg/kg). Substantial concentration of cobalt was in the available fraction leading to accumulation of appreciable amount of the metals in all the vegetables with spinach exhibiting a selectively positive accumulation (concentration factor of 1.17 as shown in Table 3). Co is associated with organic matter and iron oxides (Adepetu, 1978) which could have been extracted by the use of Con HNO3 into the available fraction (Voutsa et al., 1996). Co is essential as a cofactor in numerous enzymes and plays the role of symbiotic nitrogen fixation in plants. The concentration of Co in vegetables soil and sediments studied were all within the recommended values. Table 3: Concentration Factor for Trace Metals in the Vegetables Metal (mg/Kg) Tomatoes Green Pepper Green Beans Cabbage Pepper Spinach Fe 0.20 0.03 0.01 0.02 0.005 0.15 Co 0.39 0.50 0.59 0.65 0.76 1.18 Ni 0.38 0.46 0.61 0.52 0.56 0.86 Cd - - - - - 1.42 Nickel (Ni) presented the concentration of 1.95 – 4.42 mg/kg with spinach maintaining the lead. There was low concentration of Ni even in the soil analyzed. Ni concentration increases with depth showing the tendency of Ni increasing from surface irrespective of drainage class, therefore, the low Ni concentration at the
Global Engineers & Technologists Review, Vol.2 No.4 (2012)
© 2012 GETview Limited. All rights reserved 14
surface soil could be because of Ni being leached from top layer by percolating rain water and by depletion arising from plant up-take and erosion (Adekenya, 1998). Ni is associated with growth dynamics. High concentration of Ni (10-100mg/kg) affects fish, plants and causes lung cancer in mammals (Brandy and Weil, 1999). Cadmium (Cd) without any known function in either plant or animals Brandy and Weil, 1999) was only present in an appreciable amount (0.85 mg/kg) in spinach and the soil (0.6 mg/kg) but was not detected in the sediment and all the available fractions analyzed. Cd is relatively mobile in soil under wide range of pH and Ea. Combination of mobility and association with organic matter, Cd has been found to be enriched more in soil than in sediment because of the former has higher organic content (Stewards and Fergusson, 1994). The concentration of Cd in the spinach could originate from atmospheric deposition as well as transfer from the soil. The soil Cd could be due to the application of phosphate fertilizers (Nenman et al., 2009) for its absence in the sediment and all the fractions analyzed indicated non-contribution of water to the accumulated metal. Although the irrigated farms are far from any industrial area, but high wind velocity (which is normally experienced in Heipang), could transport particles more rapidly and probably to a far area with low deposition rate (Al-Muzani and Jacob, 1996). The Cd could have been transported and deposited on the leaves from nearby settlements. Cd has high leave penetration (Voutsa et al., 1996). Species deviation of Cd and other metals accumulation in the different vegetables may be explained by specified nutrient demands of the vegetables and differences of metals showing preference for either oxygen, nitrogen or sulphur ligands (Egila and Daniel, 2011). When Cd accumulates in the body, it causes heart, kidney diseases and bone embrittlement (Islam et al., 2007; Arora et al., 2008; and Adekunle et al., 2003). Its toxic effects could be by the displacement of essential ions e.g. Zn from enzymes protein rendering the site inoperative (Gagne and Blaise, 1996). Spinach in this work accumulated high concentrations of metals analyzed especially Fe and Cd that exceeded the recommended values. This agrees with (Arora et al., 2008) that wastewater-irrigated spinach has shown significantly (p < 0.05, p < 0.01) higher accumulation of iron, manganese, copper and zinc. Highest Cd and Co concentrations were also reported in spinach amongst carrot, lettuce. Spinach was said also to have accumulated high concentrations of Zn, Cd and Cu. This indeed should be of a serious concern as the natives (Beroms) are relying heavily on the leave for their traditional porridge (Katei) and spinach, hitherto, was the only recommended leave to anemic patients for diet. The concentration of metals determined does not show any effect of mining and irrigation that has been going on for decades in the area. This could be that, salts deposited on the farmlands during irrigation were leached by the resume of rainfall (Lawal and Abdulrahman, 2011). Many of the lands used for the irrigation were swampy during rainy periods or places that were previously occupied by water but dried during harmathan. In less or non swampy areas, farmers resume conventional farming without the use of much fertilizers, therefore, the accumulated salt during irrigation could have been absorbed by crops grown in that season. Also, the age-long mining activities might have produced the metal stable complexes that could not readily be available to the plants. 4.0 CONCLUSION Spinach accumulated the highest concentration of the metals studied. The concentration of iron (Fe) and cadmium (Cd) in spinach were above the recommended value especially for Cd indicating possible health risk to consumers of the leaves planted in the area. The study did not show any abnormal accumulation of metal due to irrigation and mining in the area. This work only analyzed four heavy metals. Hence, the concentrations of other heavy metals were not known. Determination of other heavy metals, especially those with health and environmental concern is necessary so as to estimate the overall suitability of the vegetables as regards to heavy metals. Also, the study demonstrated the need of a multidisciplinary approach for the determination of the overall suitability of vegetable for consumption and the use of more sophisticated multi-element analytical equipment (ICP-MS) to be able to detect metals of very low detection limits for proper analysis of the trace metals in the samples. ACKNOWLEDGEMENT The authors would like to thank the Managements of Nigerian mining corporation and Plateau State Polytechnic, Barkin Ladi for the use of their laboratories and for being supportive. REFERENCES [1] Adekenya, B. (1998): Variation of Metal Pollutants with Depths, Tech forum An Inter–Displinary Journal, Vol. 2, no.3, pp.82-97. [2] Adepetu, J.A. (1978): Distribution of 137 CS and 60 Co in the Solid Fractions of Contaminated Solids. Nigerian
Journal of Science, Vol.12, No.1, pp.281-291. [3] Adekunle, I.M., Ndani, W.P. and Bello, B. (2003): Trace Metals Contents and Stimulated Blood Lead blevels from Contaminated Soils in Southern Nigeria, International Journal of General and Health Studies, Vol.1, No.1, pp.201-206.
Global Engineers & Technologists Review, Vol.2 No.4 (2012)
© 2012 GETview Limited. All rights reserved 15
[4] American Environmental Protection Agency, AEPA (2003): EPA Framework for Metal Document, File Bethen/Cyber Volume/EPA Framework for Metals. [5] Al-Muzari, S. and Jacob, P.G. (1996): The Distribution of V, Ni, Cr, Cd and Pb in Top Soils of Shuaibu Industrial area of Kuwait, An International Journal of Environmental Toxicology of water quality, Vol.11, pp.285-292. [6] Ani, A.O. and Donye, A.O. (2005): Irrigated Vegetables Production among Small-Scale Farmers in Lamurde in Adamawa State of Nigeria, International Journal of Food & Agricultural Research, Vol.2, No.1, pp.97-102. [7] Arora, M., Bala, K., Shweta, R., Anchal, R., Barinder, K. and Neeraj, M. (2008): Heavy Metalaccumulation in Vegetables Irrigated with Water from Different Sources, Food Chemistry, Vol.111, pp.811–815. [8] Asdeo, A. and Loonker, S. (2011): A Comparative Analysis of Trace Metals in Vegetables. Research Journal of Environmental Toxicology, Vol.5, pp.125-132. [9] Botkin, B.D. and Edward, K. (1999): Environmental Science Earth as A Living Planet, 2nd Edition John Willey & Sons Inc New-York. [10] Brandy, C.N. and Weil, R.R. (1999): The Properties of Soils, 12th Edition Prentice Hall, Inc, Upper saddle River, New Jersey, pp.741-748. [11] Codex Alimentarius Commission of FAO/WHO (2001): Food Additives and Contaminants Joint FAO/WHO Food Standards Programme, ALINORM 01/12A, pp.1-289. [12] Davis, B.E. (1980): Applied Soil Trace Elements, John Wiley and Sons, New York, pp.287-351. [13] Egila, J.N. and Daniel, V.N. (2011): Trace Metals Accumulation in Fresh & Sediment Insect of Liberty Dam. International Journal of Basic and Applied Sciences, Vol.11, No.6, pp.128-146. [14] Environmental Protection and Heritage Council (2003): Uptake of Copper, Lead, Cadmium, Arsenic and Dichlorodiphenyltrichlorothane (DDT) By Vegetables Grown In Urban Environments; 5th National Workshop on Assessment of Site Contamination. [15] Gagne, F. and Blaise, C. (1996): Available Intracellular Zinc as Potential Indicator of Heavy Metal Exposure in Rainbow Trout Hepacytes, An International Journal of Environmental Toxicology And Water Quality, Vol.11, pp. 1-6. [16] Gimba, J.D., Daniel, V.N., Chundusu, E.S. and Oyigabo, A. (2012): Effects of Blanching Time on Anti Oxidant (Vitamin C) Status in Some Fresh Vegetables (Carrot, Cabbage, and Green Beans). Continental J. Food Science and Technology, Vol.6, No.1, pp.1-3. [17] Islam, E., Xiao-e, Y., Zhen-li, H. and Qaisar, M. (2007): Assessing Potential Dietary Toxicity of Heavy Metals in Selected Vegetables and Food Crops, J Zhejiang Univ Sci B, Vol.8, No.1, pp.1-13. [18] Kachenko, A.G. and Singh, B. (2006): Heavy Metals Contamination in Vegetables Grown in Urban and Metal Smelter Contaminated Sites in Australia, Water, Air and Soil Pollution, Vol.169, pp.101–123. [19] Khariah, J., Zalifa, M.K., Yin, H.Y. and Amina, A. (2004): The Uptake of Heavy Metals by Fruit Type Vegetables in Selected Agricultural Areas Of Malasya. Pakistan Journal of Biological Sciences, Vol.7, No.8, pp.1438-1442. [20] Lawal, A.O. and Abdulrahman, A.A. (2011): Analysis of Heavy Metals Found Invegetables from Some Cultivated Irrigated Gardens in the Kano Metropolis, Nigeria Journal of Environmental Chemistry and Ecotoxicology, Vol.3, No.6, pp.142-148. [21] Maleki, A. and Masoud, A.Z. (2008): Heavy Metals in Selected Edible Vegetables and Estimation of Their Daily Intake in Sanandaj, Iran Southeast Asian J Trop Med Public Health, Vol.39, p.2. [22] Mendosa, C.A., Cortes, G. and Monuz, D. (1996): Heavy Metals Pollution in Soils and Sediments in Rural Development District 063; Mexico, An international Journal of Environmental Toxicology Ad Water Quality, Vol.11, pp.293-300. [23] National Research Council (1990): Reports of a Panel of the Board on Sciences and Technology, International Research, National Academic Press. [24] Nenman, D.V., Nimyel, N.D. and Gimba, J.D. (2009): Some Physiochemical Properties of Waters Obtained in The Main Campus Of Plateau State Polytechnic, Barkin Ladi, Plateau – Hills, The Journal of Science and Engineering, Vol.1, No.1, pp.58-63. [25] Nwa, E.U. (1991): Irrigation in Nigeria: Some Contemporary Issues Nigeria, Journal of Water Resources, Vol.1, No.1, pp.1-8. [26] Ogunwole, J.O., Yaro, D.T, Mike, S. and Abubakar, I.K. (2001): Changes in Soil Properties under Different Cultural Practices at an Irrigation Sites at Kadawa Nigeria, Science Forum; Journal of Pure and Applied Science, Vol.4, No.1, pp.32–35. [27] Peterson, L.S., Larsen, E.H. and Larsen, P.B. (2002): Uptake of Trace Elements PAHS by Fruits and Vegetables from Contaminated Soils. Environ. Sci. Techno., Vol.36, No.14, pp.3057-3063. [28] Stewards, C. and Fergusson, J.E. (1994): The Use of Peat in the Historical Monitoring of Trace Metals in the Atmosphere, Environmental Pollution, Vol.86, pp.245-249. [29] Voutsa, D., Grimanis, A. and Samara, C. (1996): Trace Elements in Vegetables Grown in an Industrial Area In Relation To Air Soil Particulate Matter, Environmental Pollution, Vol.94, No.3, pp.325-327.
GLOBAL ENGINEERS & TECHNOLOGISTS REVIEW www.getview.org
G.L.O.B.A.L E.N.G.I.N.E.E.R.S. .& .-.T.E.C.H.N.O.L.O.G.I.S.T.S R.E.V.I.E.W 16
YUHAZRI1, M.Y., HAERYIP SIHOMBING2, YAHAYA3, S.H., SAID4, M.R., UMAR NIRMAL5, SAIJOD LAU6 and PHONGSAKORN PRAK TOM7
1, 2, 3 Faculty of Manufacturing Engineering 4 Faculty of Mechanical Engineering Universiti Teknikal Malaysia Melaka
Hang Tuah Jaya, 76100 Durian Tunggal, Melaka, MALAYSIA [email protected] 2iphaery@ utem.edu.my
5, 6 Faculty of Engineering and Technology
Multimedia University Jalan Ayer Keroh Lama, 75450, Melaka, MALAYSIA
[email protected] [email protected]
7 Nuclear Power Division Malaysia Nuclear Agency
Bangi, 43000, Kajang, MALAYSIA [email protected]
1.0 INTRODUCTION Producing energy from renewable biomass is only one of the various ways of responding to the challenges of the energy crisis. Since the oil crisis in 1970’s the use of biomass as a source of energy is a topic of growing interest and debate as agreed by Gómez-Loscos (2012), Tong and Li (2012), Arias (2011), Vaclav (2010), Fernando (2009), Kaygusuz and Keles (2008). Corley and Tinker (2008) in their book discuss in detail about oil palm in Malaysia. In 2004, Malaysia had about 3.87 million hectares of land under oil palm cultivation. Currently, more than 80 percent of the oil palm produced is used for food applications like cooking oil, frying oil and many others. Oil palm is a perennial crop. It has an economic life span of about 25 years. Traditionally, oil palm is grown for its oil example like palm oil, palm kernel oil, and palm kernel cake as the community products. Besides palm oil and palm kernel, oil palm industry generates large quantity of biomass residue which is side products as stated before like fronds, trunks, EFB, palm oil mill effluent, palm fibre and shell that have not been fully commercially exploited. Through concerted research and development efforts by many research organizations including Malaysian Oil Palm Board, this co – products from palm oil industry have been found to be good resources for many application such as palm oil fuel ash a biomass residue (Brown et al., 2011), oil palm as a viable concrete pozzalanic material (Foo and Hameed, 2009), Oil palm ash as partial replacement of cement for solidification/stabilization of nickel hydroxide sludge (Chun et al., 2008), oil palm ash in concrete (Tangchirapat et al., 2007).There are many competitive uses of these materials. One of them is to utilize them as a fuel for energy production but in term of biodiesel fuel. In fact, Malaysian government has identified biomass as fifth fuel resource to compliment the petroleum, gas, coal, and hydro as energy resources, while palm biomass has been identified as a single most important energy source as stated by Sumiani (2006). On the other hands, the main
ABSTRACT
This research discussed on the results obtained for each sample that have been conducted to the solid fuel briquettes made of empty fruit bunch fiber and waste papers from view of mechanical performance which is compression test at lateral position test. This solid fuel prepared by manual compression technique and tested using universal testing machine. This analysis important to know the capability of solid fuel to sustained external force because of mechanical activities. Experimental work shows that, the larger amount of paper in the ratio, the higher the maximum load it can withstand before failure, therefore briquette S/N 6 gives the highest compressive strength. Keywords: Empty Fruit Bunch Fiber, Waste Papers, Ash Content.
SOLID FUEL FROM EMPTY FRUIT BUNCH FIBER AND WASTE PAPERS PART 4: COMPRESSION TEST AT LATERAL POSITION
Global Engineers & Technologists Review, Vol.2 No.4 (2012)
© 2012 GETview Limited. All rights reserved 17
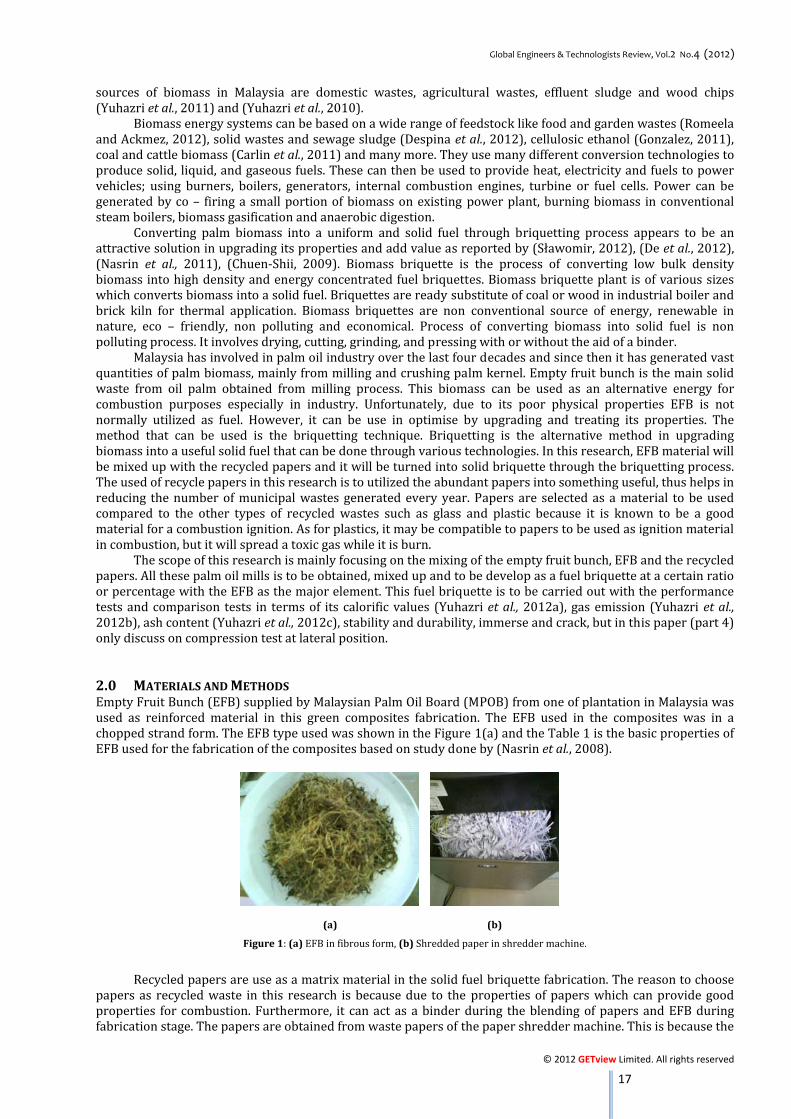
sources of biomass in Malaysia are domestic wastes, agricultural wastes, effluent sludge and wood chips (Yuhazri et al., 2011) and (Yuhazri et al., 2010). Biomass energy systems can be based on a wide range of feedstock like food and garden wastes (Romeela and Ackmez, 2012), solid wastes and sewage sludge (Despina et al., 2012), cellulosic ethanol (Gonzalez, 2011), coal and cattle biomass (Carlin et al., 2011) and many more. They use many different conversion technologies to produce solid, liquid, and gaseous fuels. These can then be used to provide heat, electricity and fuels to power vehicles; using burners, boilers, generators, internal combustion engines, turbine or fuel cells. Power can be generated by co – firing a small portion of biomass on existing power plant, burning biomass in conventional steam boilers, biomass gasification and anaerobic digestion. Converting palm biomass into a uniform and solid fuel through briquetting process appears to be an attractive solution in upgrading its properties and add value as reported by (Sławomir, 2012), (De et al., 2012), (Nasrin et al., 2011), (Chuen-Shii, 2009). Biomass briquette is the process of converting low bulk density biomass into high density and energy concentrated fuel briquettes. Biomass briquette plant is of various sizes which converts biomass into a solid fuel. Briquettes are ready substitute of coal or wood in industrial boiler and brick kiln for thermal application. Biomass briquettes are non conventional source of energy, renewable in nature, eco – friendly, non polluting and economical. Process of converting biomass into solid fuel is non polluting process. It involves drying, cutting, grinding, and pressing with or without the aid of a binder. Malaysia has involved in palm oil industry over the last four decades and since then it has generated vast quantities of palm biomass, mainly from milling and crushing palm kernel. Empty fruit bunch is the main solid waste from oil palm obtained from milling process. This biomass can be used as an alternative energy for combustion purposes especially in industry. Unfortunately, due to its poor physical properties EFB is not normally utilized as fuel. However, it can be use in optimise by upgrading and treating its properties. The method that can be used is the briquetting technique. Briquetting is the alternative method in upgrading biomass into a useful solid fuel that can be done through various technologies. In this research, EFB material will be mixed up with the recycled papers and it will be turned into solid briquette through the briquetting process. The used of recycle papers in this research is to utilized the abundant papers into something useful, thus helps in reducing the number of municipal wastes generated every year. Papers are selected as a material to be used compared to the other types of recycled wastes such as glass and plastic because it is known to be a good material for a combustion ignition. As for plastics, it may be compatible to papers to be used as ignition material in combustion, but it will spread a toxic gas while it is burn. The scope of this research is mainly focusing on the mixing of the empty fruit bunch, EFB and the recycled papers. All these palm oil mills is to be obtained, mixed up and to be develop as a fuel briquette at a certain ratio or percentage with the EFB as the major element. This fuel briquette is to be carried out with the performance tests and comparison tests in terms of its calorific values (Yuhazri et al., 2012a), gas emission (Yuhazri et al., 2012b), ash content (Yuhazri et al., 2012c), stability and durability, immerse and crack, but in this paper (part 4) only discuss on compression test at lateral position. 2.0 MATERIALS AND METHODS Empty Fruit Bunch (EFB) supplied by Malaysian Palm Oil Board (MPOB) from one of plantation in Malaysia was used as reinforced material in this green composites fabrication. The EFB used in the composites was in a chopped strand form. The EFB type used was shown in the Figure 1(a) and the Table 1 is the basic properties of EFB used for the fabrication of the composites based on study done by (Nasrin et al., 2008). (a) (b)
Figure 1: (a) EFB in fibrous form, (b) Shredded paper in shredder machine. Recycled papers are use as a matrix material in the solid fuel briquette fabrication. The reason to choose papers as recycled waste in this research is because due to the properties of papers which can provide good properties for combustion. Furthermore, it can act as a binder during the blending of papers and EFB during fabrication stage. The papers are obtained from waste papers of the paper shredder machine. This is because the
Global Engineers & Technologists Review, Vol.2 No.4 (2012)
© 2012 GETview Limited. All rights reserved 18
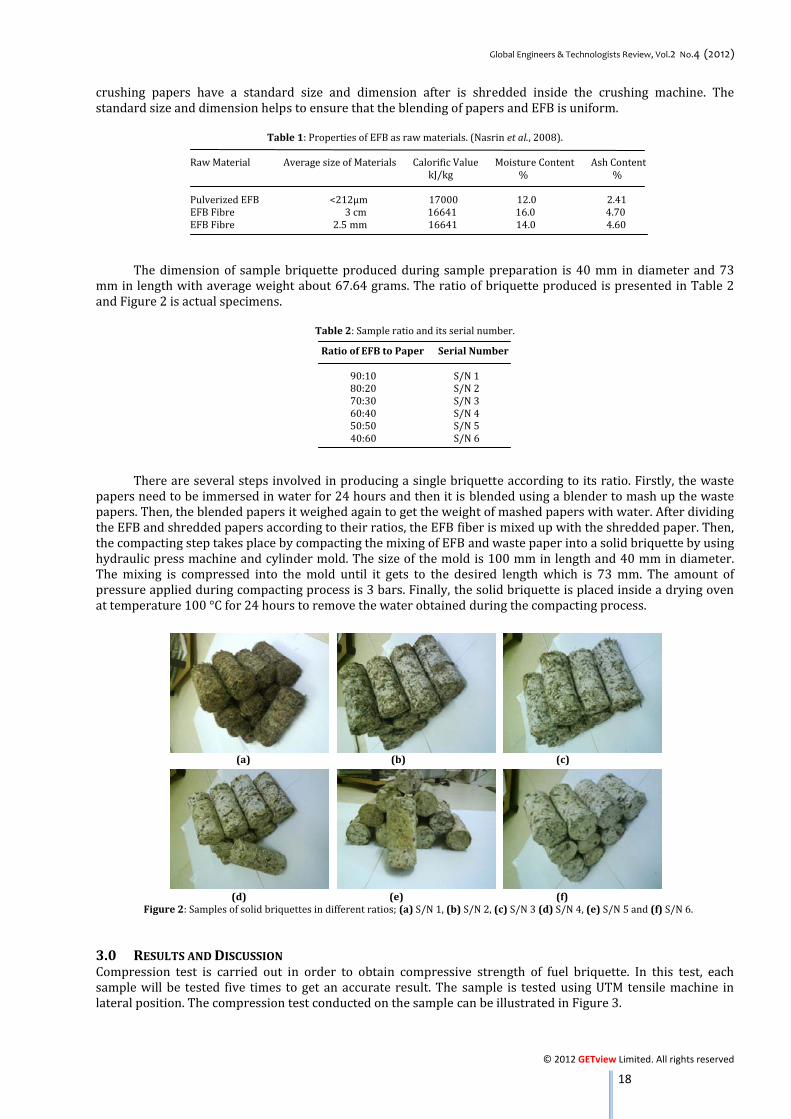
crushing papers have a standard size and dimension after is shredded inside the crushing machine. The standard size and dimension helps to ensure that the blending of papers and EFB is uniform. Table 1: Properties of EFB as raw materials. (Nasrin et al., 2008). Raw Material Average size of Materials Calorific Value Moisture Content Ash Content kJ/kg % % Pulverized EFB <212µm 17000 12.0 2.41 EFB Fibre 3 cm 16641 16.0 4.70 EFB Fibre 2.5 mm 16641 14.0 4.60 The dimension of sample briquette produced during sample preparation is 40 mm in diameter and 73 mm in length with average weight about 67.64 grams. The ratio of briquette produced is presented in Table 2 and Figure 2 is actual specimens.
Table 2: Sample ratio and its serial number. Ratio of EFB to Paper Serial Number
90:10 S/N 1 80:20 S/N 2 70:30 S/N 3 60:40 S/N 4 50:50 S/N 5 40:60 S/N 6 There are several steps involved in producing a single briquette according to its ratio. Firstly, the waste papers need to be immersed in water for 24 hours and then it is blended using a blender to mash up the waste papers. Then, the blended papers it weighed again to get the weight of mashed papers with water. After dividing the EFB and shredded papers according to their ratios, the EFB fiber is mixed up with the shredded paper. Then, the compacting step takes place by compacting the mixing of EFB and waste paper into a solid briquette by using hydraulic press machine and cylinder mold. The size of the mold is 100 mm in length and 40 mm in diameter. The mixing is compressed into the mold until it gets to the desired length which is 73 mm. The amount of pressure applied during compacting process is 3 bars. Finally, the solid briquette is placed inside a drying oven at temperature 100 °C for 24 hours to remove the water obtained during the compacting process. (a) (b) (c) (d) (e) (f) Figure 2: Samples of solid briquettes in different ratios; (a) S/N 1, (b) S/N 2, (c) S/N 3 (d) S/N 4, (e) S/N 5 and (f) S/N 6.
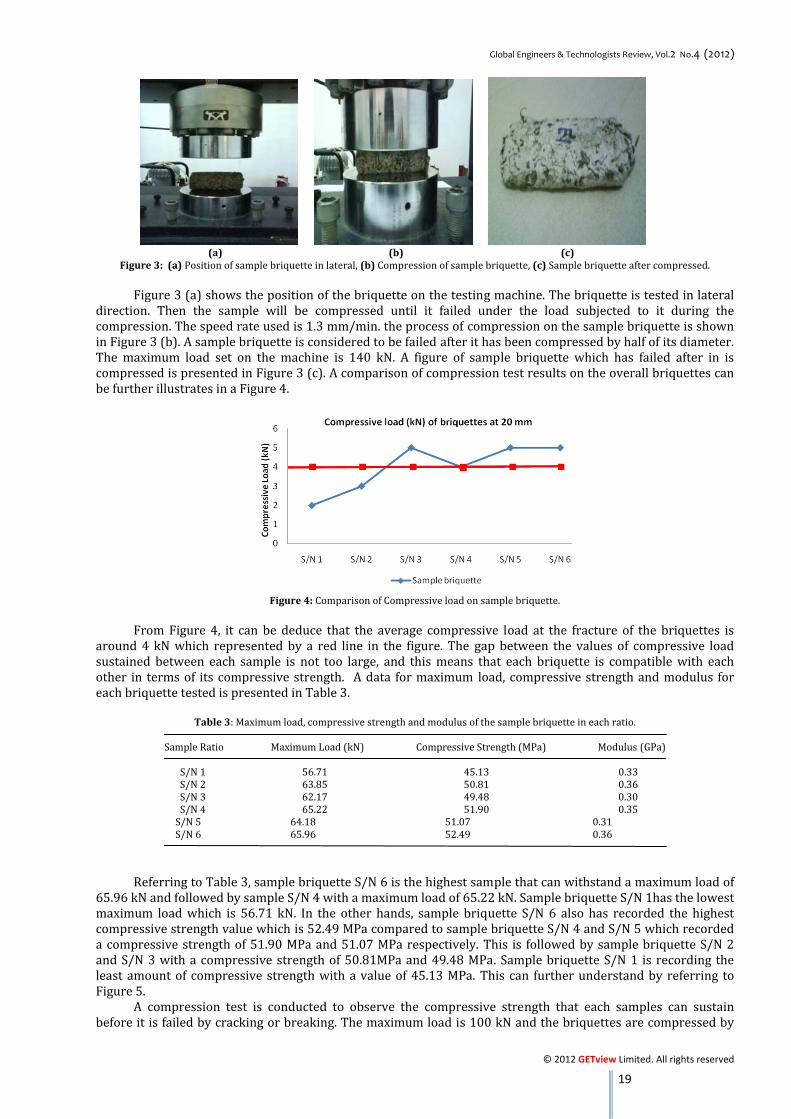
3.0 RESULTS AND DISCUSSION Compression test is carried out in order to obtain compressive strength of fuel briquette. In this test, each sample will be tested five times to get an accurate result. The sample is tested using UTM tensile machine in lateral position. The compression test conducted on the sample can be illustrated in Figure 3.
Global Engineers & Technologists Review, Vol.2 No.4 (2012)
© 2012 GETview Limited. All rights reserved 19
(a) (b) (c) Figure 3: (a) Position of sample briquette in lateral, (b) Compression of sample briquette, (c) Sample briquette after compressed. Figure 3 (a) shows the position of the briquette on the testing machine. The briquette is tested in lateral direction. Then the sample will be compressed until it failed under the load subjected to it during the compression. The speed rate used is 1.3 mm/min. the process of compression on the sample briquette is shown in Figure 3 (b). A sample briquette is considered to be failed after it has been compressed by half of its diameter. The maximum load set on the machine is 140 kN. A figure of sample briquette which has failed after in is compressed is presented in Figure 3 (c). A comparison of compression test results on the overall briquettes can be further illustrates in a Figure 4.
Figure 4: Comparison of Compressive load on sample briquette. From Figure 4, it can be deduce that the average compressive load at the fracture of the briquettes is around 4 kN which represented by a red line in the figure. The gap between the values of compressive load sustained between each sample is not too large, and this means that each briquette is compatible with each other in terms of its compressive strength. A data for maximum load, compressive strength and modulus for each briquette tested is presented in Table 3. Table 3: Maximum load, compressive strength and modulus of the sample briquette in each ratio. Sample Ratio Maximum Load (kN) Compressive Strength (MPa) Modulus (GPa) S/N 1 56.71 45.13 0.33 S/N 2 63.85 50.81 0.36 S/N 3 62.17 49.48 0.30 S/N 4 65.22 51.90 0.35 S/N 5 64.18 51.07 0.31 S/N 6 65.96 52.49 0.36
Referring to Table 3, sample briquette S/N 6 is the highest sample that can withstand a maximum load of 65.96 kN and followed by sample S/N 4 with a maximum load of 65.22 kN. Sample briquette S/N 1has the lowest maximum load which is 56.71 kN. In the other hands, sample briquette S/N 6 also has recorded the highest compressive strength value which is 52.49 MPa compared to sample briquette S/N 4 and S/N 5 which recorded a compressive strength of 51.90 MPa and 51.07 MPa respectively. This is followed by sample briquette S/N 2 and S/N 3 with a compressive strength of 50.81MPa and 49.48 MPa. Sample briquette S/N 1 is recording the least amount of compressive strength with a value of 45.13 MPa. This can further understand by referring to Figure 5. A compression test is conducted to observe the compressive strength that each samples can sustain before it is failed by cracking or breaking. The maximum load is 100 kN and the briquettes are compressed by
Global Engineers & Technologists Review, Vol.2 No.4 (2012)
© 2012 GETview Limited. All rights reserved 20
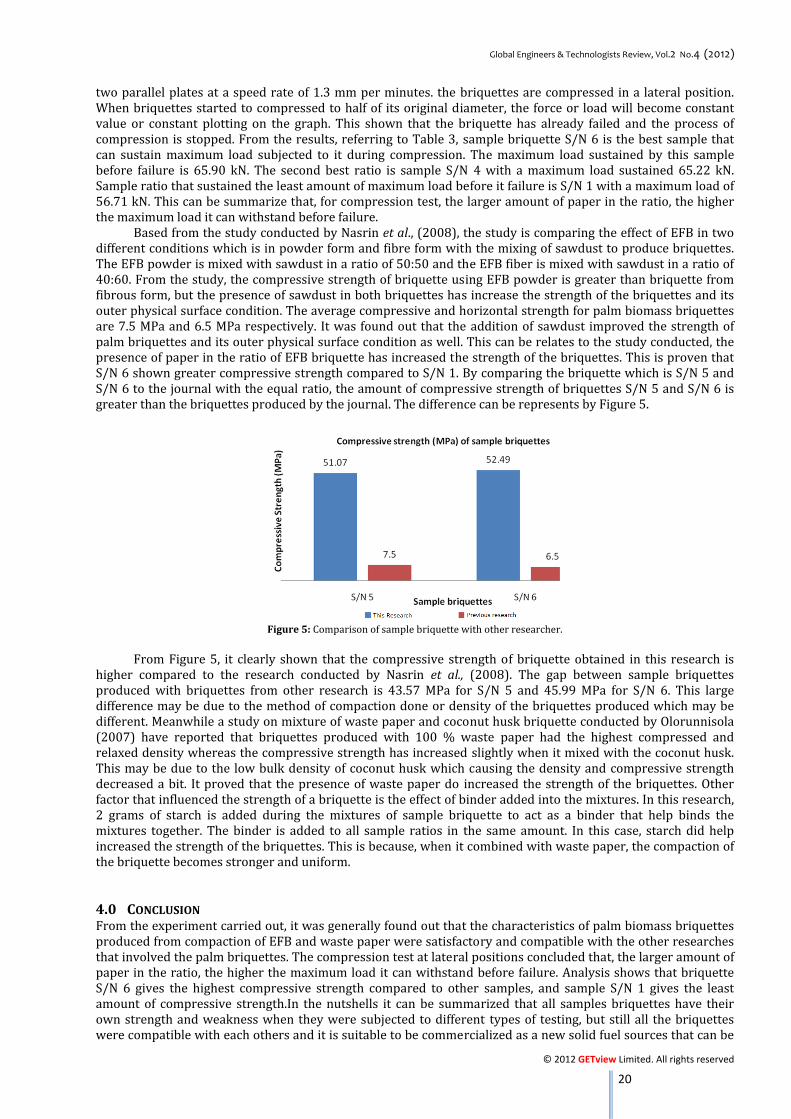
two parallel plates at a speed rate of 1.3 mm per minutes. the briquettes are compressed in a lateral position. When briquettes started to compressed to half of its original diameter, the force or load will become constant value or constant plotting on the graph. This shown that the briquette has already failed and the process of compression is stopped. From the results, referring to Table 3, sample briquette S/N 6 is the best sample that can sustain maximum load subjected to it during compression. The maximum load sustained by this sample before failure is 65.90 kN. The second best ratio is sample S/N 4 with a maximum load sustained 65.22 kN. Sample ratio that sustained the least amount of maximum load before it failure is S/N 1 with a maximum load of 56.71 kN. This can be summarize that, for compression test, the larger amount of paper in the ratio, the higher the maximum load it can withstand before failure. Based from the study conducted by Nasrin et al., (2008), the study is comparing the effect of EFB in two different conditions which is in powder form and fibre form with the mixing of sawdust to produce briquettes. The EFB powder is mixed with sawdust in a ratio of 50:50 and the EFB fiber is mixed with sawdust in a ratio of 40:60. From the study, the compressive strength of briquette using EFB powder is greater than briquette from fibrous form, but the presence of sawdust in both briquettes has increase the strength of the briquettes and its outer physical surface condition. The average compressive and horizontal strength for palm biomass briquettes are 7.5 MPa and 6.5 MPa respectively. It was found out that the addition of sawdust improved the strength of palm briquettes and its outer physical surface condition as well. This can be relates to the study conducted, the presence of paper in the ratio of EFB briquette has increased the strength of the briquettes. This is proven that S/N 6 shown greater compressive strength compared to S/N 1. By comparing the briquette which is S/N 5 and S/N 6 to the journal with the equal ratio, the amount of compressive strength of briquettes S/N 5 and S/N 6 is greater than the briquettes produced by the journal. The difference can be represents by Figure 5. Figure 5: Comparison of sample briquette with other researcher. From Figure 5, it clearly shown that the compressive strength of briquette obtained in this research is higher compared to the research conducted by Nasrin et al., (2008). The gap between sample briquettes produced with briquettes from other research is 43.57 MPa for S/N 5 and 45.99 MPa for S/N 6. This large difference may be due to the method of compaction done or density of the briquettes produced which may be different. Meanwhile a study on mixture of waste paper and coconut husk briquette conducted by Olorunnisola (2007) have reported that briquettes produced with 100 % waste paper had the highest compressed and relaxed density whereas the compressive strength has increased slightly when it mixed with the coconut husk. This may be due to the low bulk density of coconut husk which causing the density and compressive strength decreased a bit. It proved that the presence of waste paper do increased the strength of the briquettes. Other factor that influenced the strength of a briquette is the effect of binder added into the mixtures. In this research, 2 grams of starch is added during the mixtures of sample briquette to act as a binder that help binds the mixtures together. The binder is added to all sample ratios in the same amount. In this case, starch did help increased the strength of the briquettes. This is because, when it combined with waste paper, the compaction of the briquette becomes stronger and uniform.
4.0 CONCLUSION From the experiment carried out, it was generally found out that the characteristics of palm biomass briquettes produced from compaction of EFB and waste paper were satisfactory and compatible with the other researches that involved the palm briquettes. The compression test at lateral positions concluded that, the larger amount of paper in the ratio, the higher the maximum load it can withstand before failure. Analysis shows that briquette S/N 6 gives the highest compressive strength compared to other samples, and sample S/N 1 gives the least amount of compressive strength.In the nutshells it can be summarized that all samples briquettes have their own strength and weakness when they were subjected to different types of testing, but still all the briquettes were compatible with each others and it is suitable to be commercialized as a new solid fuel sources that can be
Global Engineers & Technologists Review, Vol.2 No.4 (2012)
© 2012 GETview Limited. All rights reserved 21
utilized in many application such as camping, barbeque and for residence utilization energy. The blending of EFB fiber with waste paper can improve its physical, mechanical, and combustion properties REFERENCES [1] Arias, N.C. (2011): Production of Biomass From Short Rotation Coppice for Energy Use: Comparison Between Sweden and Spain, Master thesis at Department of Energy and Technology, Faculty of Natural Resources and Agricultural Science, Swedish University of Agricultural Science. [2] Brown, O.R., Yusof, M.B.B.M., Salim, M.R.B. and Ahmed, K. (2011): Physico-chemical Properties of Palm Oil Fuel Ash As Composite Sorbent in Kaolin Clay Landfill Liner System. Clean Energy and Technology (CET),
2011 IEEE First Conference (June), pp.269-274, 27-29. [3] Carlin N.T., Annamalai, K., Oh, H., Ariza, G.G., Lawrence, B., Arcot V.U., Sweeten, J.M., Heflin, K. and Harman, W.L. (2011): Co-Combustion and Gasification of Coal And Cattle Biomass: A Review of Research and Experimentation (Green Energy - Progress in Green Energy). Springer London Publisher. Vol.1, pp.123-179. [4] Chuen-Shii, C., Sheau-Horng, L., Chun-Chieh, P., Wen-Chung, L. (2009): The Optimum Conditions for Preparing Solid Fuel Briquette of Rice Straw by a Piston-Mold Process Using the Taguchi Method. Fuel Processing Technology, Vol.90, Iss.7–8, pp.1041-1046. [5] Chun, Y.Y., Shabuddin, W.W.A. and Ying, P.L. (2008): Oil Palm Ash as Partial Replacement of Cement for Solidification/Stabilization of Nickel Hydroxide Sludge. Journal of Hazardous Materials, Vol.150, Iss.2, pp.413-418. [6] Corley, R.H.V. and Tinker, P.B.H. (2008): The Oil Palm: World Agriculture Series. Edition 4. John Wiley & Sons. [7] De, Y.T., Xu, W. and Ai, H.X. (2012): Virtual Design and Simulation for Biomass Plane-die Briquetting Machine. Advanced Material Research (Renewable and Sustainable Energy). vols.347-353, pp.2432-2437. [8] Despina, V., Evaggelia, K., Stelios, S. and Piero, S. (2012): Gasification of Waste Biomass Chars by Carbon Dioxide via Thermogravimetry : Effect of Catalysts. Combustion Science and Technology. Vol.184, Iss.1, pp.64-77. [9] Fernando, G. (2009): Synergy in Food, Fuels and Materials Production from Biomass. Energy Environ. Sci., vol.3, iss.4, pp.393-399. [10] Foo, K.Y. and Hameed, B.H. (2009): Value-Added Utilization Of Oil Palm Ash: A Superior Recycling Of The Industrial Agricultural Waste. Journal of Hazardous Materials, Vol.172, Iss.2–3, pp.523-531. [11] Gómez-Loscos, A., María, D.G. and Montañés, A. (2012): Economic Growth, Inflation and Oil Shocks: Are the 1970s Coming Back?. Applied Economics, Vol.44, Iss.35, pp.4575-4589. [12] Gonzalez, R.W. (2011): Biomass Supply Chain and Conversion Economics of Cellulosic Ethanol. Ph.D. Thesis at North Carolina State University. USA. [13] Kaygusuz, K. and Keleş, S. (2008): Use of Biomass as a Transitional Strategy to a Sustainable and Clean Energy System. Energy Sources, Part A: Recovery, Utilization, and Environmental Effects, Vol.31, Iss.1, pp.86-97. [14] Nasrin, A.B., Choo, Y.M., Lim, W.S., Joseph, L., Michael, S., Rohaya, M.H. and Astimar, A.A. (2011): Briquetting of Empty Fruit Bunch Fibre and Palm Shell as a Renewable Energy Fuel. Journal of Engineering and Applied Sciences, Vol.6, No.6, pp.446-451. [15] Nasrin, A.B., Ma, A.N., Choo, Y.M., Mohamad, S., Rohaya, M.H., Azali, A. and Zainal, Z. (2008): Oil Palm Biomass as Potential Subtituition Raw Materials for Commercial Biomass Briquettes Production. American Journal of Applied Sciences. [16] Olorunnisola, A. (2007): Production of Fuel Briquettes from Waste Paper and Coconut Husk Admixtures. Agriculture Engeneering International: the CIGR Ejournal. Vol.IX. pp.1-11. [17] Romeela, M. and Ackmez, M. (2012): Energy from Biomass in Mauritius: Overview of Research and Applications, (Waste to Energy). Springer London Publisher. ISBN: 978-1-4471-2306-4. [18] Sławomir, O. (2012): Analysis of Usability of Potato Pulp as Solid Fuel, Fuel Processing Technology, Vol.94, Iss.1, pp.67-74. [19] Sumiani, Y. (2006): Renewable Energy From Palm Oil – Innovation on Effective Utilization of Waste. Journal of Cleaner Production, Vol.14, Iss.1, pp.87-93. [20] Tangchirapat, W., Saeting, T., Jaturapitakkul, C., Kiattikomol, K. and Siripanichgorn, A. (2007): Use of Waste Ash From Palm Oil Industry In Concrete. Waste Management, vol.27, pp.81–88. [21] Tong, Z. and Feng, T. (2012): A Study On Energy Saving of LEED-NC Green Building Rating System From Point Analysis. Advanced Materials Research, Vols.374-377, pp.122-126. [22] Vaclav, S. (2010): Energy Myths and Realities: Bringing Science to the Energy Policy Debate. Government Institutes Publisher. [23] Yuhazri, M.Y., Sihombing, H., Jeefferie, A.R., Ahmad Mujahid, A.Z., Balamurugan, A.G., Norazman, M.N. and Shohaimi, A. (2011): Optimazation of Coconut Fibers Toward Heat Insulator Applications. Global Engineers & Technologists Review, Vol.1, No.1, pp.35-40.
Global Engineers & Technologists Review, Vol.2 No.4 (2012)
© 2012 GETview Limited. All rights reserved 22
[24] Yuhazri, M.Y., Kamarul, A.M., Haeryip Sihombing, Jeefferie, A.R., Haidir, M.M., Toibah, A.R. and Rahimah, A.H. (2010): The Potential of Agriculture Waste Material for Noise Insulator Application Toward Green Design and Material, International Journal of Civil & Environmental Engineering, Vol.10, No.5, pp.16-21. [25] Yuhazri, M.Y., Haeryip Sihombing, Umar, N., Saijod, L. and Phongsakorn, P.T. (2012a): Solid Fuel from Empty Fruit Bunch Fiber and Waste Papers Part 1: Heat Released from Combustion Test, Global Engineers and Technologists Review, Vol.2, No.1, pp.7-13. [26] Yuhazri, M.Y., Haeryip Sihombing, Yahaya, S.H., Said, M.R., Umar, N., Saijod, L. and Phongsakorn, P.T. (2012b): Solid Fuel from Empty Fruit Bunch Fiber and Waste Papers Part 2: Gas Emission from Combustion Test, Global Engineers and Technologists Review, Vol.2, No.2, pp.8-13. [27] Yuhazri, M.Y., Haeryip Sihombing, Yahaya, S.H., Said, M.R., Umar, N., Saijod, L. and Phongsakorn, P.T. (2012c): Solid Fuel from Empty Fruit Bunch Fiber and Waste Papers Part 3: Ash Content from Combustion Test, Global Engineers and Technologists Review, Vol.2, No.3, pp.26-32.
GLOBAL ENGINEERS & TECHNOLOGISTS REVIEW www.getview.org
G.L.O.B.A.L E.N.G.I.N.E.E.R.S. .& .-.T.E.C.H.N.O.L.O.G.I.S.T.S R.E.V.I.E.W 23
MURIUKI1, J.K., MURIITHI2, C.M. and KINYUA3, D.M.
1, 2, 3 School of Electrical, Electronic and Information Engineering Department of Electrical and Electronics Engineering
Jomo Kenyatta University of Agriculture & Technology P.O. Box 62000-00200, Nairobi, KENYA
[email protected] / [email protected] [email protected]
1.0 INTRODUCTION Different aggregation methods have been applied for induction motor load representation by several researchers such as Hakim and Berg (1976); Franklin and Morelato (1994); Lem and Alden (1994); Pillay et al., (1998); Bing et al., (2010); Karakas et al., (2009) and Abdalla, et al., (2008) as a single equivalent model for ease and speed of power system analysis. However, comparison on the accuracy of these methods has not been meticulous. The induction motor modelling is paramount in the dynamic analysis of a power system since they contribute the biggest percentage of power system loads. In light of the above, they may cause delay during normal voltage recovery under fault conditions. Nevertheless, it is not practical to model every individual induction motors and especially large number of individual IM during the simulation studies because this can be highly time-consuming. Thus being the reason for aggregating several IM as a single equivalent model. Therefore, aggregate models (single-unit equivalent models) are often employed. The accuracy of the results obtained with aggregate models depends in part on the assumptions made when deriving the aggregate motor and vary from method to method. Grouping criterion is also used to classify homogeneous motors as introduced by Pillay et al., (1998). Further, the accuracy of the results depends on how good the models are and the number of components involved. It is well known that load modelling on system dynamics is crucial; however it is still a big challenge. This complexity is brought by the fact that load consists of various components with various characteristics, which have to be represented as an equivalent single model. Under fault condition, there is increased demand for reactive power by the IM due to reduced voltages and increased current. This high reactive power demand by the loads may cause the generators to lose their ability to act as a constant voltage source because of the field current limitation. For such a case the generator terminal voltage reduces gradually and may eventually cause the motor to stall. The dynamic stability of a system can be improved by providing suitably tuned power system stabilizers (PSS) on selected generators to provide damping to power swings as implemented by Kundur (1994). Suitably tuned Power System Stabilizers will introduce a component of electrical torque in phase with generator rotor speed deviations resulting in damping of low frequency power oscillations in which the generators are participating. The PSS design is based on the linearized model of the power system. The input to stabilizer signal may be one of the locally available signals such as changes in rotor speed, rotor frequency, accelerating power or
ABSTRACT
This paper focusses on the aggregation of multiple induction motors (IM) connected in parallel on the same bus into a single equivalent model using aggregation based on transfomer equivalent-circuit (method 1) and on no-load and locked rotor (method 2).This has been necessitated by the strong effects that the non linear loads have on power system characteristics and therefore erroneous modeling of these devices continues to be an area of greater uncertainty. Though various methods of aggregations have been used, comparison on their suitablity and accuracy has not been extensively explored. Also investigated is the suitability of multi-band power system stabilizer (MB-PSS) on the aggregate motor under a fault.The accuracy of these methods is compared to dentify the most appropriate. Their performance is validated by evaluating the results obtained from individual and aggregate IM on IEEE 16 Bus test system. The results shows that method 2 is accurate than method 1 in identification of the motor parameters both under steady-state and under fault condition. The MB-PSS gives better damping of the oscillatory modes with method 2 than method 1. The former method can therefore be used for accurate analysis of voltage stability in a complex power system. Keywords: Aggregation Methods, Induction Motor, Voltage Stability, Power System Stabilizers.
SUITABILITY OF AGGREGATION METHODS OF INDUCTION MOTOR MODELS FOR VOLTAGE STABILITY ANALYSIS
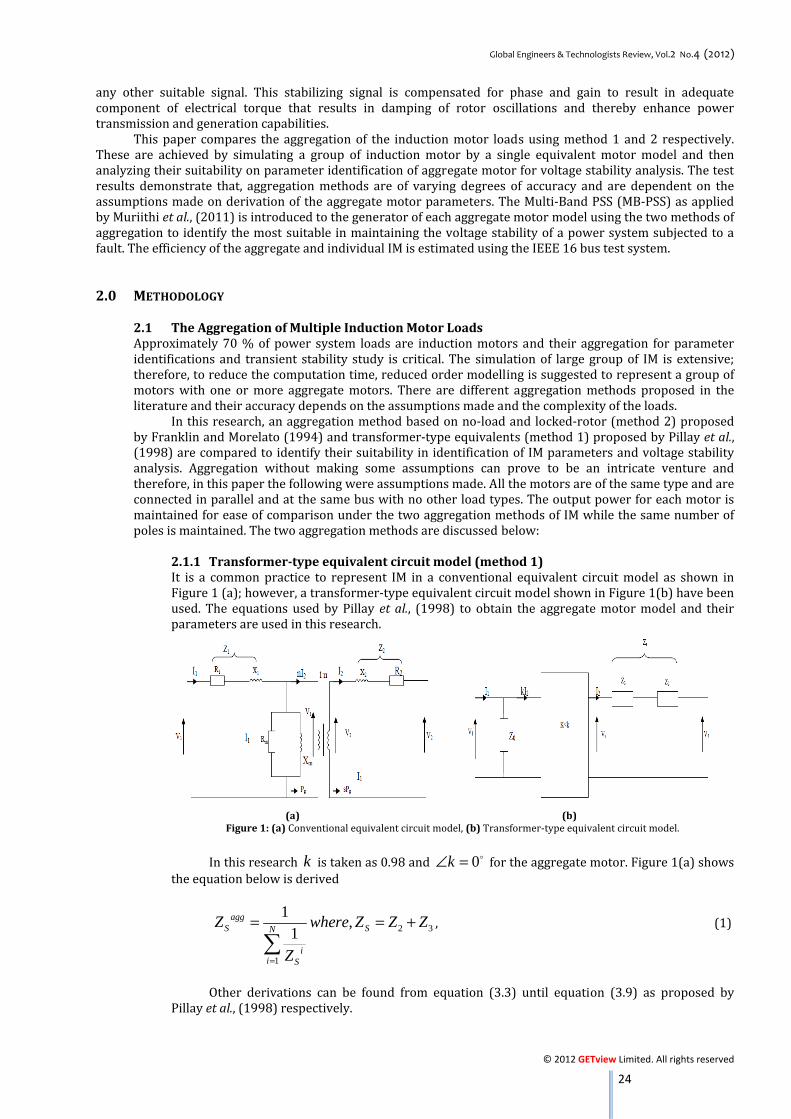
Global Engineers & Technologists Review, Vol.2 No.4 (2012)
© 2012 GETview Limited. All rights reserved 24
any other suitable signal. This stabilizing signal is compensated for phase and gain to result in adequate component of electrical torque that results in damping of rotor oscillations and thereby enhance power transmission and generation capabilities. This paper compares the aggregation of the induction motor loads using method 1 and 2 respectively. These are achieved by simulating a group of induction motor by a single equivalent motor model and then analyzing their suitability on parameter identification of aggregate motor for voltage stability analysis. The test results demonstrate that, aggregation methods are of varying degrees of accuracy and are dependent on the assumptions made on derivation of the aggregate motor parameters. The Multi-Band PSS (MB-PSS) as applied by Muriithi et al., (2011) is introduced to the generator of each aggregate motor model using the two methods of aggregation to identify the most suitable in maintaining the voltage stability of a power system subjected to a fault. The efficiency of the aggregate and individual IM is estimated using the IEEE 16 bus test system. 2.0 METHODOLOGY
2.1 The Aggregation of Multiple Induction Motor Loads Approximately 70 % of power system loads are induction motors and their aggregation for parameter identifications and transient stability study is critical. The simulation of large group of IM is extensive; therefore, to reduce the computation time, reduced order modelling is suggested to represent a group of motors with one or more aggregate motors. There are different aggregation methods proposed in the literature and their accuracy depends on the assumptions made and the complexity of the loads. In this research, an aggregation method based on no-load and locked-rotor (method 2) proposed by Franklin and Morelato (1994) and transformer-type equivalents (method 1) proposed by Pillay et al., (1998) are compared to identify their suitability in identification of IM parameters and voltage stability analysis. Aggregation without making some assumptions can prove to be an intricate venture and therefore, in this paper the following were assumptions made. All the motors are of the same type and are connected in parallel and at the same bus with no other load types. The output power for each motor is maintained for ease of comparison under the two aggregation methods of IM while the same number of poles is maintained. The two aggregation methods are discussed below: 2.1.1 Transformer-type equivalent circuit model (method 1) It is a common practice to represent IM in a conventional equivalent circuit model as shown in Figure 1 (a); however, a transformer-type equivalent circuit model shown in Figure 1(b) have been used. The equations used by Pillay et al., (1998) to obtain the aggregate motor model and their parameters are used in this research. (a) (b)
Figure 1: (a) Conventional equivalent circuit model, (b) Transformer-type equivalent circuit model. In this research k is taken as 0.98 and 0k∠ = o for the aggregate motor. Figure 1(a) shows the equation below is derived
2 3
1
1 ,1
aggS SN
ii S
Z where Z Z Z
Z=
= = +∑
, (1) Other derivations can be found from equation (3.3) until equation (3.9) as proposed by Pillay et al., (1998) respectively.
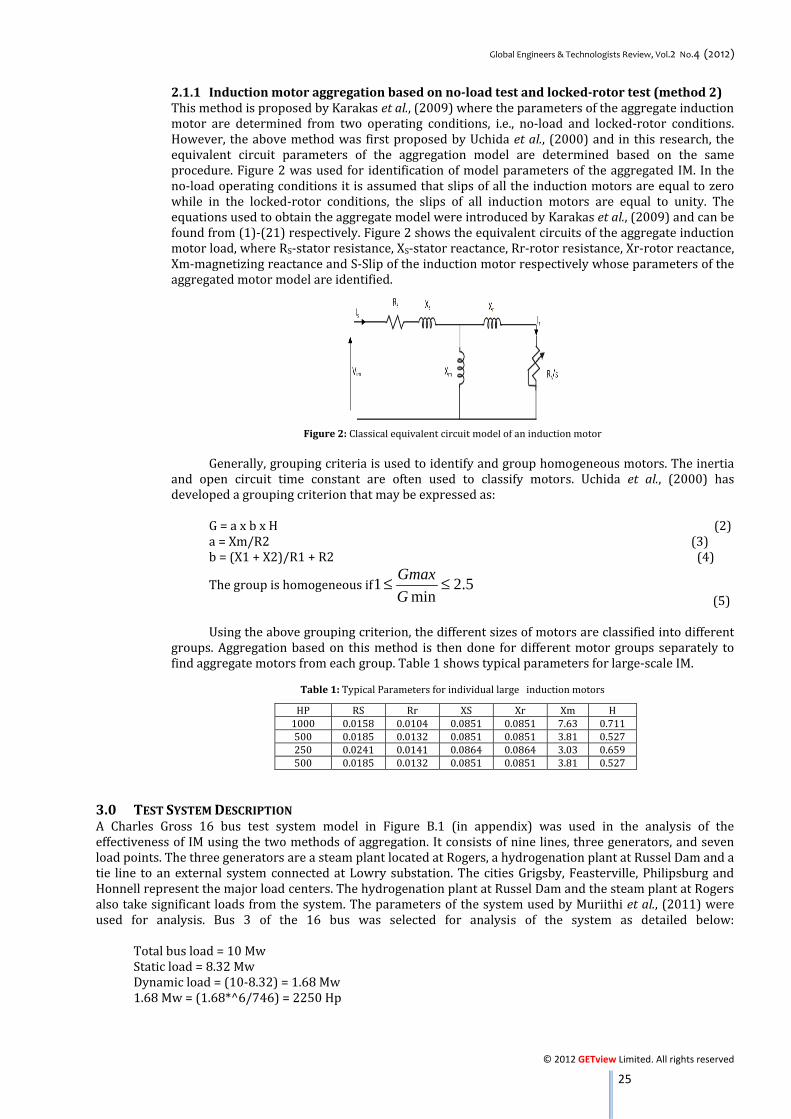
Global Engineers & Technologists Review, Vol.2 No.4 (2012)
© 2012 GETview Limited. All rights reserved 25
2.1.1 Induction motor aggregation based on no-load test and locked-rotor test (method 2) This method is proposed by Karakas et al., (2009) where the parameters of the aggregate induction motor are determined from two operating conditions, i.e., no-load and locked-rotor conditions. However, the above method was first proposed by Uchida et al., (2000) and in this research, the equivalent circuit parameters of the aggregation model are determined based on the same procedure. Figure 2 was used for identification of model parameters of the aggregated IM. In the no-load operating conditions it is assumed that slips of all the induction motors are equal to zero while in the locked-rotor conditions, the slips of all induction motors are equal to unity. The equations used to obtain the aggregate model were introduced by Karakas et al., (2009) and can be found from (1)-(21) respectively. Figure 2 shows the equivalent circuits of the aggregate induction motor load, where RS-stator resistance, XS-stator reactance, Rr-rotor resistance, Xr-rotor reactance, Xm-magnetizing reactance and S-Slip of the induction motor respectively whose parameters of the aggregated motor model are identified. Figure 2: Classical equivalent circuit model of an induction motor Generally, grouping criteria is used to identify and group homogeneous motors. The inertia and open circuit time constant are often used to classify motors. Uchida et al., (2000) has developed a grouping criterion that may be expressed as: G = a x b x H (2) a = Xm/R2 (3) b = (X1 + X2)/R1 + R2 (4) The group is homogeneous if1 2.5
minGmaxG
≤ ≤ (5) Using the above grouping criterion, the different sizes of motors are classified into different groups. Aggregation based on this method is then done for different motor groups separately to find aggregate motors from each group. Table 1 shows typical parameters for large-scale IM. Table 1: Typical Parameters for individual large induction motors HP RS Rr XS Xr Xm H 1000 0.0158 0.0104 0.0851 0.0851 7.63 0.711 500 0.0185 0.0132 0.0851 0.0851 3.81 0.527 250 0.0241 0.0141 0.0864 0.0864 3.03 0.659 500 0.0185 0.0132 0.0851 0.0851 3.81 0.527
3.0 TEST SYSTEM DESCRIPTION A Charles Gross 16 bus test system model in Figure B.1 (in appendix) was used in the analysis of the effectiveness of IM using the two methods of aggregation. It consists of nine lines, three generators, and seven load points. The three generators are a steam plant located at Rogers, a hydrogenation plant at Russel Dam and a tie line to an external system connected at Lowry substation. The cities Grigsby, Feasterville, Philipsburg and Honnell represent the major load centers. The hydrogenation plant at Russel Dam and the steam plant at Rogers also take significant loads from the system. The parameters of the system used by Muriithi et al., (2011) were used for analysis. Bus 3 of the 16 bus was selected for analysis of the system as detailed below: Total bus load = 10 Mw Static load = 8.32 Mw Dynamic load = (10-8.32) = 1.68 Mw 1.68 Mw = (1.68*^6/746) = 2250 Hp
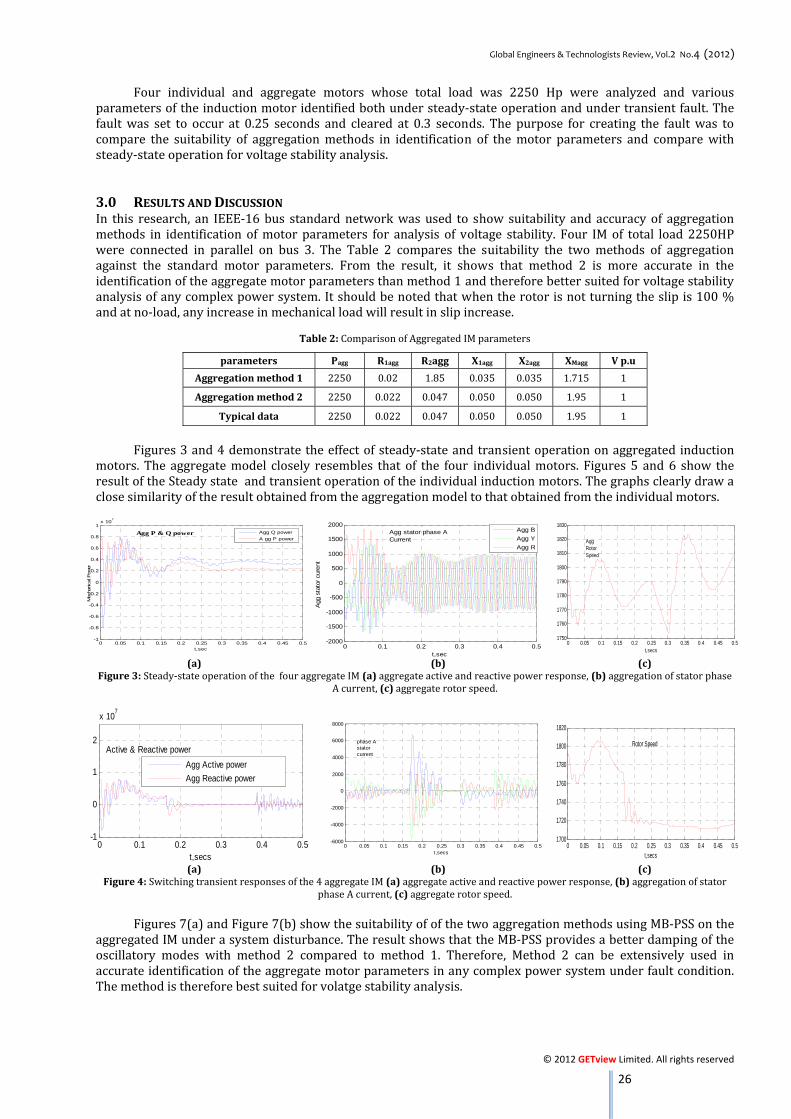
Global Engineers & Technologists Review, Vol.2 No.4 (2012)
© 2012 GETview Limited. All rights reserved 26
Four individual and aggregate motors whose total load was 2250 Hp were analyzed and various parameters of the induction motor identified both under steady-state operation and under transient fault. The fault was set to occur at 0.25 seconds and cleared at 0.3 seconds. The purpose for creating the fault was to compare the suitability of aggregation methods in identification of the motor parameters and compare with steady-state operation for voltage stability analysis.
3.0 RESULTS AND DISCUSSION In this research, an IEEE-16 bus standard network was used to show suitability and accuracy of aggregation methods in identification of motor parameters for analysis of voltage stability. Four IM of total load 2250HP were connected in parallel on bus 3. The Table 2 compares the suitability the two methods of aggregation against the standard motor parameters. From the result, it shows that method 2 is more accurate in the identification of the aggregate motor parameters than method 1 and therefore better suited for voltage stability analysis of any complex power system. It should be noted that when the rotor is not turning the slip is 100 % and at no-load, any increase in mechanical load will result in slip increase.
Table 2: Comparison of Aggregated IM parameters
parameters Pagg R1agg R2agg X1agg X2agg XMagg V p.u Aggregation method 1 2250 0.02 1.85 0.035 0.035 1.715 1 Aggregation method 2 2250 0.022 0.047 0.050 0.050 1.95 1
Typical data 2250 0.022 0.047 0.050 0.050 1.95 1 Figures 3 and 4 demonstrate the effect of steady-state and transient operation on aggregated induction motors. The aggregate model closely resembles that of the four individual motors. Figures 5 and 6 show the result of the Steady state and transient operation of the individual induction motors. The graphs clearly draw a close similarity of the result obtained from the aggregation model to that obtained from the individual motors. (a) (b) (c) Figure 3: Steady-state operation of the four aggregate IM (a) aggregate active and reactive power response, (b) aggregation of stator phase A current, (c) aggregate rotor speed. (a) (b) (c)
Figure 4: Switching transient responses of the 4 aggregate IM (a) aggregate active and reactive power response, (b) aggregation of stator phase A current, (c) aggregate rotor speed. Figures 7(a) and Figure 7(b) show the suitability of of the two aggregation methods using MB-PSS on the aggregated IM under a system disturbance. The result shows that the MB-PSS provides a better damping of the oscillatory modes with method 2 compared to method 1. Therefore, Method 2 can be extensively used in accurate identification of the aggregate motor parameters in any complex power system under fault condition. The method is therefore best suited for volatge stability analysis.
0 0.05 0.1 0.15 0.2 0.25 0.3 0.35 0.4 0.45 0.5-1
-0.8
-0.6
-0.4
-0.2
0
0.2
0.4
0.6
0.8
1x 10
7
t,sec
Mec
hani
cal P
ower
Agg Q powerA gg P power
Agg P & Q power
0 0.1 0.2 0.3 0.4 0.5-2000
-1500
-1000
-500
0
500
1000
1500
2000
t,sec
Agg
sta
tor c
uren
t
Agg BAgg YAgg R
Agg stator phase ACurrent
0 0.05 0.1 0.15 0.2 0.25 0.3 0.35 0.4 0.45 0.51750
1760
1770
1780
1790
1800
1810
1820
1830
t,secs
AggRotorSpeed
0 0.1 0.2 0.3 0.4 0.5-1
0
1
2
x 107
t,secs
Agg Active powerAgg Reactive power
Active & Reactive power
0 0.05 0.1 0.15 0.2 0.25 0.3 0.35 0.4 0.45 0.5-6000
-4000
-2000
0
2000
4000
6000
8000
t,secs
phase Astatorcurrent
0 0.05 0.1 0.15 0.2 0.25 0.3 0.35 0.4 0.45 0.51700
1720
1740
1760
1780
1800
1820
t,secs
Rotor Speed
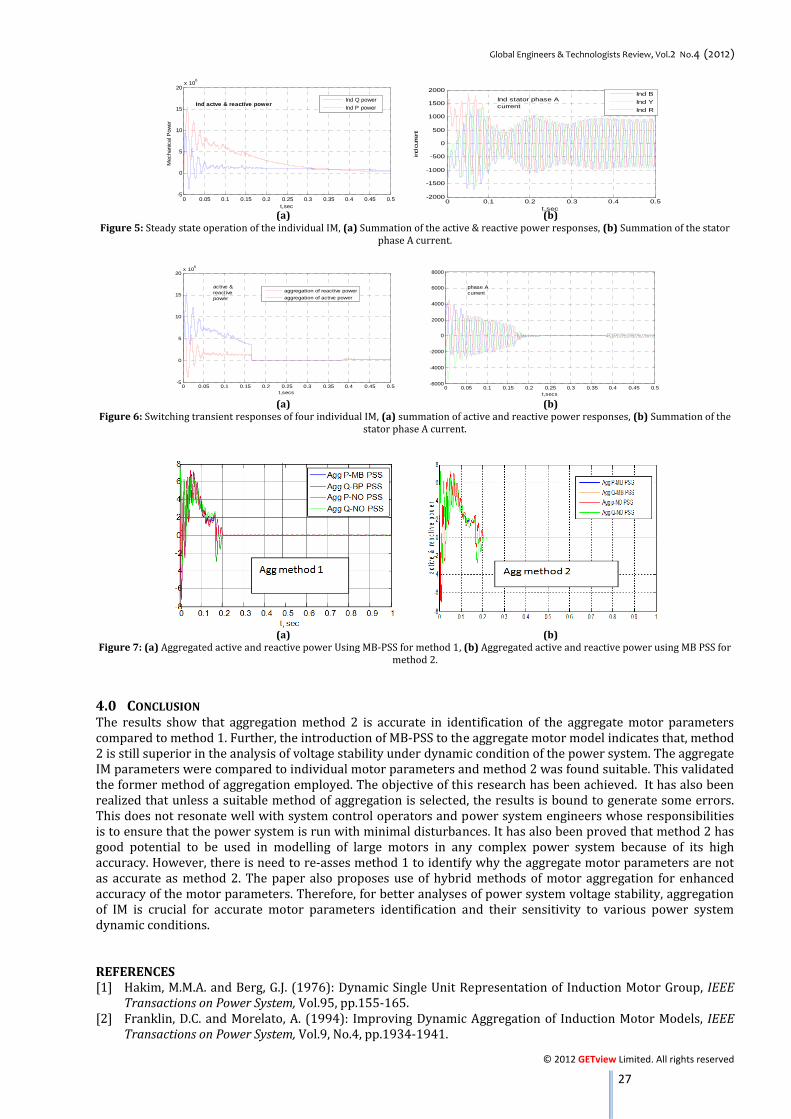
Global Engineers & Technologists Review, Vol.2 No.4 (2012)
© 2012 GETview Limited. All rights reserved 27
(a) (b) Figure 5: Steady state operation of the individual IM, (a) Summation of the active & reactive power responses, (b) Summation of the stator phase A current. (a) (b) Figure 6: Switching transient responses of four individual IM, (a) summation of active and reactive power responses, (b) Summation of the stator phase A current. (a) (b) Figure 7: (a) Aggregated active and reactive power Using MB-PSS for method 1, (b) Aggregated active and reactive power using MB PSS for method 2. 4.0 CONCLUSION The results show that aggregation method 2 is accurate in identification of the aggregate motor parameters compared to method 1. Further, the introduction of MB-PSS to the aggregate motor model indicates that, method 2 is still superior in the analysis of voltage stability under dynamic condition of the power system. The aggregate IM parameters were compared to individual motor parameters and method 2 was found suitable. This validated the former method of aggregation employed. The objective of this research has been achieved. It has also been realized that unless a suitable method of aggregation is selected, the results is bound to generate some errors. This does not resonate well with system control operators and power system engineers whose responsibilities is to ensure that the power system is run with minimal disturbances. It has also been proved that method 2 has good potential to be used in modelling of large motors in any complex power system because of its high accuracy. However, there is need to re-asses method 1 to identify why the aggregate motor parameters are not as accurate as method 2. The paper also proposes use of hybrid methods of motor aggregation for enhanced accuracy of the motor parameters. Therefore, for better analyses of power system voltage stability, aggregation of IM is crucial for accurate motor parameters identification and their sensitivity to various power system dynamic conditions. REFERENCES [1] Hakim, M.M.A. and Berg, G.J. (1976): Dynamic Single Unit Representation of Induction Motor Group, IEEE
Transactions on Power System, Vol.95, pp.155-165. [2] Franklin, D.C. and Morelato, A. (1994): Improving Dynamic Aggregation of Induction Motor Models, IEEE Transactions on Power System, Vol.9, No.4, pp.1934-1941.
0 0.05 0.1 0.15 0.2 0.25 0.3 0.35 0.4 0.45 0.5-5
0
5
10
15
20x 106
t,sec
Mec
hani
cal P
ower
Ind Q powerInd P powerInd actve & reactive power
0 0.1 0.2 0.3 0.4 0.5-2000
-1500
-1000
-500
0
500
1000
1500
2000
t,sec
ind
curre
nt
Ind BInd YInd R
Ind stator phase Acurrent
0 0.05 0.1 0.15 0.2 0.25 0.3 0.35 0.4 0.45 0.5-5
0
5
10
15
20x 106
t,secs
aggregation of reactive poweraggregation of active power
active &reactivepower
0 0.05 0.1 0.15 0.2 0.25 0.3 0.35 0.4 0.45 0.5-6000
-4000
-2000
0
2000
4000
6000
8000
t,secs
phase Acurrent
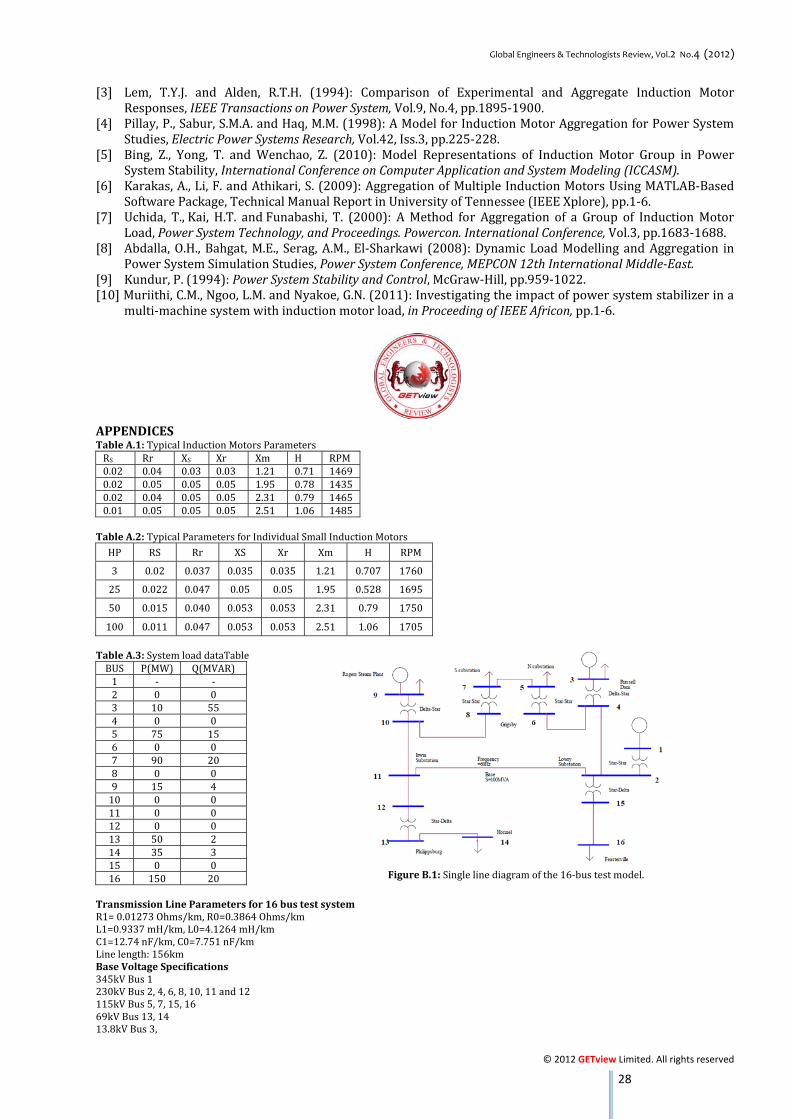
Global Engineers & Technologists Review, Vol.2 No.4 (2012)
© 2012 GETview Limited. All rights reserved 28
[3] Lem, T.Y.J. and Alden, R.T.H. (1994): Comparison of Experimental and Aggregate Induction Motor Responses, IEEE Transactions on Power System, Vol.9, No.4, pp.1895-1900. [4] Pillay, P., Sabur, S.M.A. and Haq, M.M. (1998): A Model for Induction Motor Aggregation for Power System Studies, Electric Power Systems Research, Vol.42, Iss.3, pp.225-228. [5] Bing, Z., Yong, T. and Wenchao, Z. (2010): Model Representations of Induction Motor Group in Power System Stability, International Conference on Computer Application and System Modeling (ICCASM). [6] Karakas, A., Li, F. and Athikari, S. (2009): Aggregation of Multiple Induction Motors Using MATLAB-Based Software Package, Technical Manual Report in University of Tennessee (IEEE Xplore), pp.1-6. [7] Uchida, T., Kai, H.T. and Funabashi, T. (2000): A Method for Aggregation of a Group of Induction Motor Load, Power System Technology, and Proceedings. Powercon. International Conference, Vol.3, pp.1683-1688. [8] Abdalla, O.H., Bahgat, M.E., Serag, A.M., El-Sharkawi (2008): Dynamic Load Modelling and Aggregation in Power System Simulation Studies, Power System Conference, MEPCON 12th International Middle-East. [9] Kundur, P. (1994): Power System Stability and Control, McGraw-Hill, pp.959-1022. [10] Muriithi, C.M., Ngoo, L.M. and Nyakoe, G.N. (2011): Investigating the impact of power system stabilizer in a multi-machine system with induction motor load, in Proceeding of IEEE Africon, pp.1-6.
APPENDICES Table A.1: Typical Induction Motors Parameters RS Rr XS Xr Xm H RPM0.02 0.04 0.03 0.03 1.21 0.71 14690.02 0.05 0.05 0.05 1.95 0.78 14350.02 0.04 0.05 0.05 2.31 0.79 14650.01 0.05 0.05 0.05 2.51 1.06 1485 Table A.2: Typical Parameters for Individual Small Induction Motors HP RS Rr XS Xr Xm H RPM 3 0.02 0.037 0.035 0.035 1.21 0.707 1760 25 0.022 0.047 0.05 0.05 1.95 0.528 1695 50 0.015 0.040 0.053 0.053 2.31 0.79 1750 100 0.011 0.047 0.053 0.053 2.51 1.06 1705 Table A.3: System load dataTable BUS P(MW) Q(MVAR)1 - - 2 0 0 3 10 55 4 0 0 5 75 15 6 0 0 7 90 20 8 0 0 9 15 4 10 0 0 11 0 0 12 0 0 13 50 2 14 35 3 15 0 0 16 150 20 Transmission Line Parameters for 16 bus test system R1= 0.01273 Ohms/km, R0=0.3864 Ohms/km L1=0.9337 mH/km, L0=4.1264 mH/km C1=12.74 nF/km, C0=7.751 nF/km Line length: 156km Base Voltage Specifications 345kV Bus 1 230kV Bus 2, 4, 6, 8, 10, 11 and 12 115kV Bus 5, 7, 15, 16 69kV Bus 13, 14 13.8kV Bus 3,
Figure B.1: Single line diagram of the 16-bus test model.

No 1-1, Jalan KNMP 2A, Kompleks Niaga Melaka Perdana, 75450, Ayer Keroh, Melaka, MALAYSIA.