diversification of brunei darussalam’s economy: the challenges and opportunities prepared by:...
TRANSCRIPT
Diversification of Brunei Darussalam’s Economy:The Challenges and Opportunities
Prepared by:
Awang Haji Nairul Anawar bin Haji Abu Lahai
Awang Haji Zakaria bin Haji Ahmad
Pg. Abd Haris bin Pg. Haji Shabudin
Lt. Col(U) Mohd. Sallehin bin Haji Mohd. Taib
Why Need Economic Diversification?
To reduce dependency on oil and gas
To create more and more jobs
To create more resources of revenue
Brunei began to adopt policy on economic diversification since early
1970 Implementation of the Investment Incentive Act 1975 Formation of the Ministry of Industry and Primary
Resources 1st January 1989 Formation of Brunei Darussalam Economic Council
(BDEC)and the Formation of Brunei Darussalam Economic Development Board (BEDB) November 2001
Government Linked Companies
YEARGDP
Value %contrOIL SECTORValue %contr
NON OIL SECTOR
GOVT PRIVATE
Value %contr Value %contr
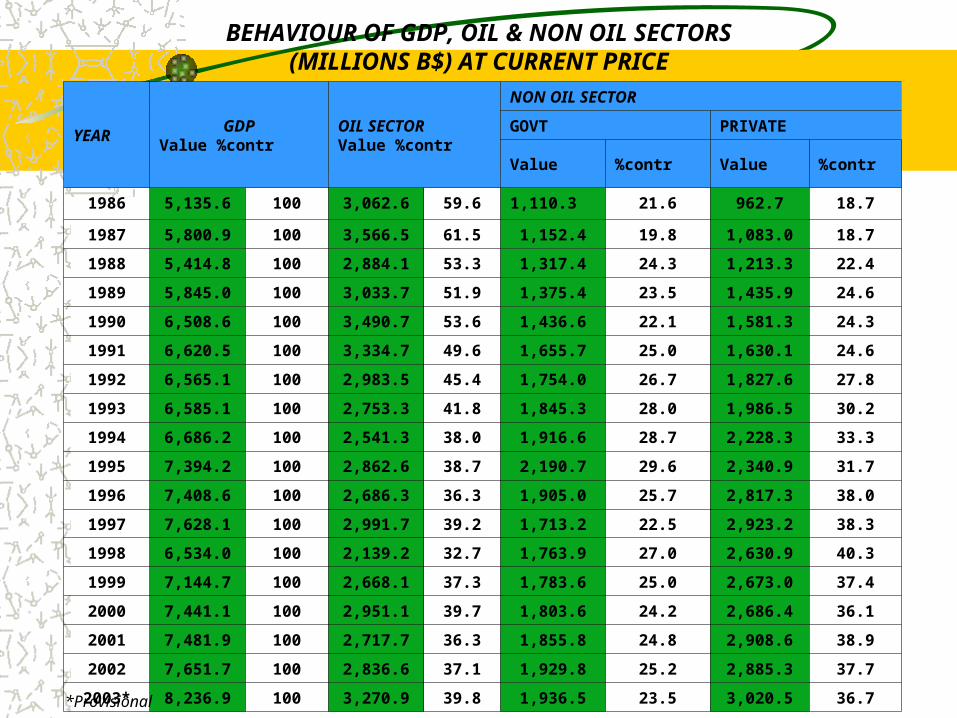
1986 5,135.6 100 3,062.6 59.6 1,110.3 21.6 962.7 18.7
1987 5,800.9 100 3,566.5 61.5 1,152.4 19.8 1,083.0 18.7
1988 5,414.8 100 2,884.1 53.3 1,317.4 24.3 1,213.3 22.4
1989 5,845.0 100 3,033.7 51.9 1,375.4 23.5 1,435.9 24.6
1990 6,508.6 100 3,490.7 53.6 1,436.6 22.1 1,581.3 24.3
1991 6,620.5 100 3,334.7 49.6 1,655.7 25.0 1,630.1 24.6
1992 6,565.1 100 2,983.5 45.4 1,754.0 26.7 1,827.6 27.8
1993 6,585.1 100 2,753.3 41.8 1,845.3 28.0 1,986.5 30.2
1994 6,686.2 100 2,541.3 38.0 1,916.6 28.7 2,228.3 33.3
1995 7,394.2 100 2,862.6 38.7 2,190.7 29.6 2,340.9 31.7
1996 7,408.6 100 2,686.3 36.3 1,905.0 25.7 2,817.3 38.0
1997 7,628.1 100 2,991.7 39.2 1,713.2 22.5 2,923.2 38.3
1998 6,534.0 100 2,139.2 32.7 1,763.9 27.0 2,630.9 40.3
1999 7,144.7 100 2,668.1 37.3 1,783.6 25.0 2,673.0 37.4
2000 7,441.1 100 2,951.1 39.7 1,803.6 24.2 2,686.4 36.1
2001 7,481.9 100 2,717.7 36.3 1,855.8 24.8 2,908.6 38.9
2002 7,651.7 100 2,836.6 37.1 1,929.8 25.2 2,885.3 37.7
2003* 8,236.9 100 3,270.9 39.8 1,936.5 23.5 3,020.5 36.7
BEHAVIOUR OF GDP, OIL & NON OIL SECTORS(MILLIONS B$) AT CURRENT PRICE
*Provisional
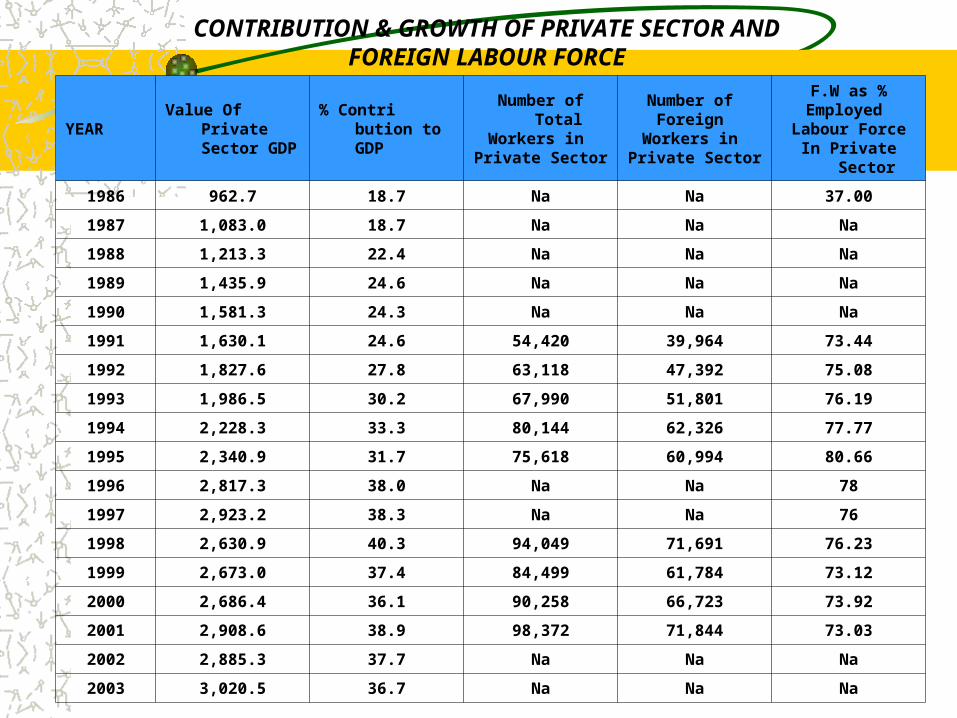
YEARValue Of Private
Sector GDP% Contri bution to
GDP
Number of TotalWorkers in
Private Sector
Number of Foreign
Workers in Private Sector
F.W as %Employed
Labour ForceIn Private Sector
1986 962.7 18.7 Na Na 37.00
1987 1,083.0 18.7 Na Na Na
1988 1,213.3 22.4 Na Na Na
1989 1,435.9 24.6 Na Na Na
1990 1,581.3 24.3 Na Na Na
1991 1,630.1 24.6 54,420 39,964 73.44
1992 1,827.6 27.8 63,118 47,392 75.08
1993 1,986.5 30.2 67,990 51,801 76.19
1994 2,228.3 33.3 80,144 62,326 77.77
1995 2,340.9 31.7 75,618 60,994 80.66
1996 2,817.3 38.0 Na Na 78
1997 2,923.2 38.3 Na Na 76
1998 2,630.9 40.3 94,049 71,691 76.23
1999 2,673.0 37.4 84,499 61,784 73.12
2000 2,686.4 36.1 90,258 66,723 73.92
2001 2,908.6 38.9 98,372 71,844 73.03
2002 2,885.3 37.7 Na Na Na
2003 3,020.5 36.7 Na Na Na
CONTRIBUTION & GROWTH OF PRIVATE SECTOR ANDFOREIGN LABOUR FORCE
Achievement and performance of economic diversification is not very encouraging so far.
According to the latest official figures, the oil and gas industries accounts for 90% of the total exports, 88% of government revenue and 40% of GDP.
Unemployment rate is increasing, currently 8,600 were unemployed (10.98%). The rate was only 3.6% in 1981 and 7% in 1992.
Current population 340,800 and more than 101,900 is under 14.
Current estimates are that oil will last around 15 years at current production level and gas a further 30.
Our group had looked into the performance of thevarious sectors :
fishing industry
tourism industry
the industry under Brunei Industrial Development Authority (BINA)
Direction towards privatization
Fishing Industry
There are three important areas in fishing industry.
i. Marineii. Aquacultureiii. Food processing
Brunei fisheries potentials are estimated to be worth at least B$200 million a year since the last few years. However, every year the industry has not generated even 50% of the estimated value.
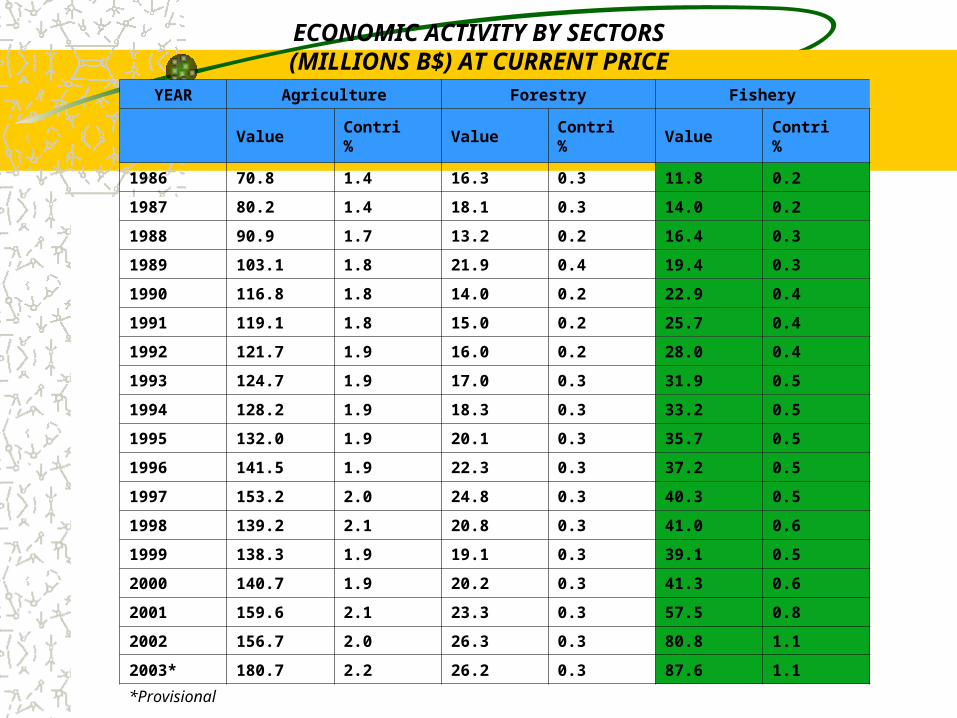
YEAR Agriculture Forestry Fishery
ValueContri%
ValueContri%
ValueContri%
1986 70.8 1.4 16.3 0.3 11.8 0.2
1987 80.2 1.4 18.1 0.3 14.0 0.2
1988 90.9 1.7 13.2 0.2 16.4 0.3
1989 103.1 1.8 21.9 0.4 19.4 0.3
1990 116.8 1.8 14.0 0.2 22.9 0.4
1991 119.1 1.8 15.0 0.2 25.7 0.4
1992 121.7 1.9 16.0 0.2 28.0 0.4
1993 124.7 1.9 17.0 0.3 31.9 0.5
1994 128.2 1.9 18.3 0.3 33.2 0.5
1995 132.0 1.9 20.1 0.3 35.7 0.5
1996 141.5 1.9 22.3 0.3 37.2 0.5
1997 153.2 2.0 24.8 0.3 40.3 0.5
1998 139.2 2.1 20.8 0.3 41.0 0.6
1999 138.3 1.9 19.1 0.3 39.1 0.5
2000 140.7 1.9 20.2 0.3 41.3 0.6
2001 159.6 2.1 23.3 0.3 57.5 0.8
2002 156.7 2.0 26.3 0.3 80.8 1.1
2003* 180.7 2.2 26.2 0.3 87.6 1.1
ECONOMIC ACTIVITY BY SECTORS(MILLIONS B$) AT CURRENT PRICE
*Provisional
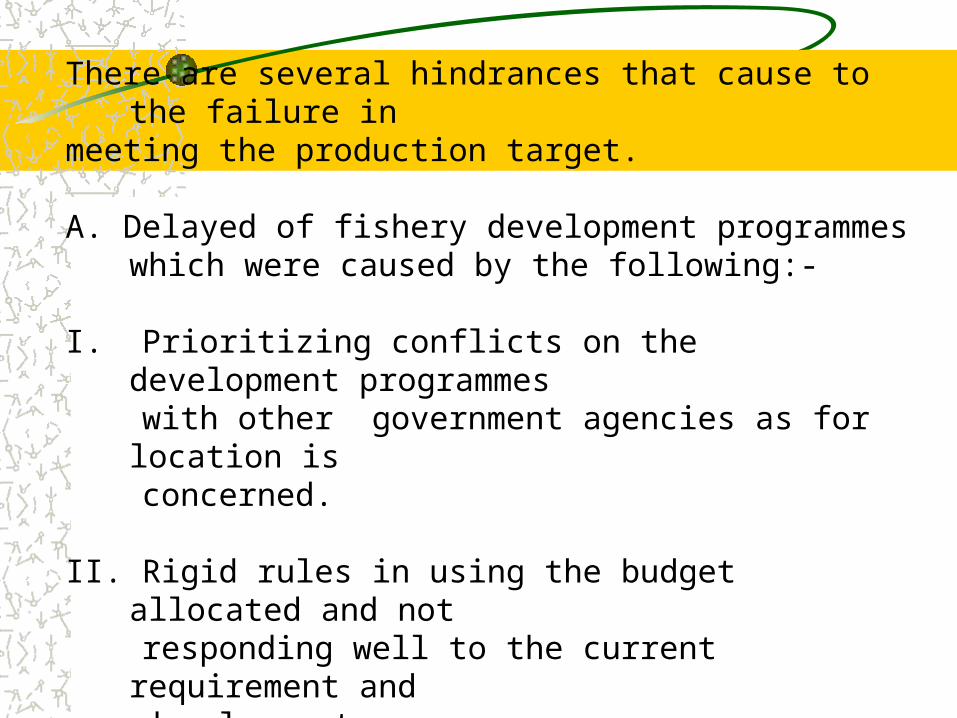
There are several hindrances that cause to the failure inmeeting the production target.
A. Delayed of fishery development programmes which were caused by the following:-
I. Prioritizing conflicts on the development programmes with other government agencies as for location is concerned.
II. Rigid rules in using the budget allocated and not responding well to the current requirement and development.
III.Conflicts in prioritizing the development programmes by the developer such as the Public Work Department.
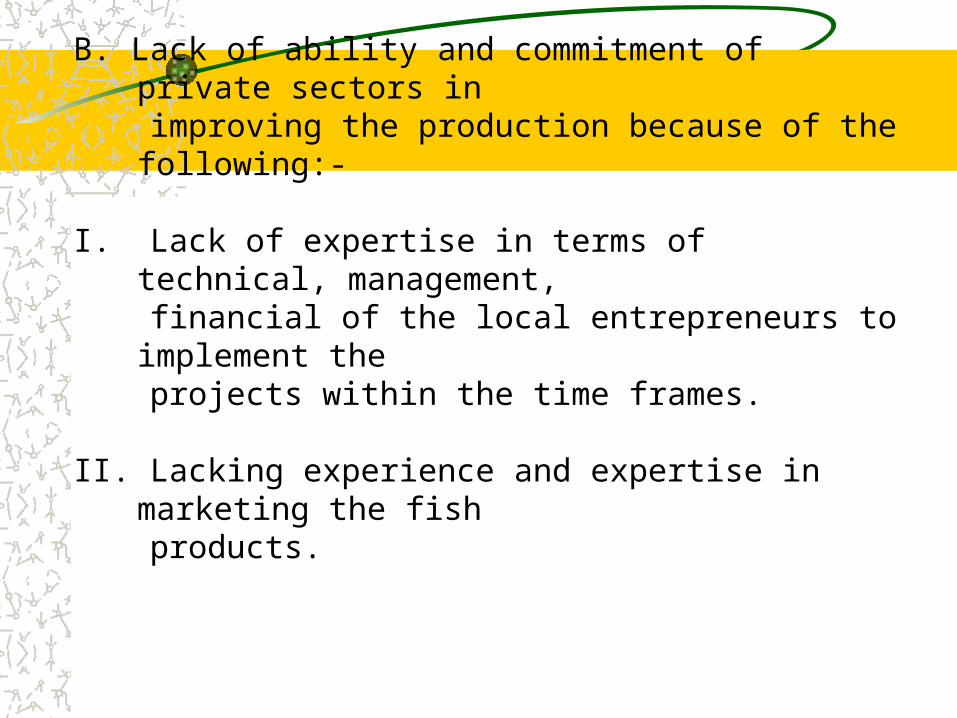
B. Lack of ability and commitment of private sectors in improving the production because of the following:-
I. Lack of expertise in terms of technical, management, financial of the local entrepreneurs to implement the projects within the time frames.
II. Lacking experience and expertise in marketing the fish products.
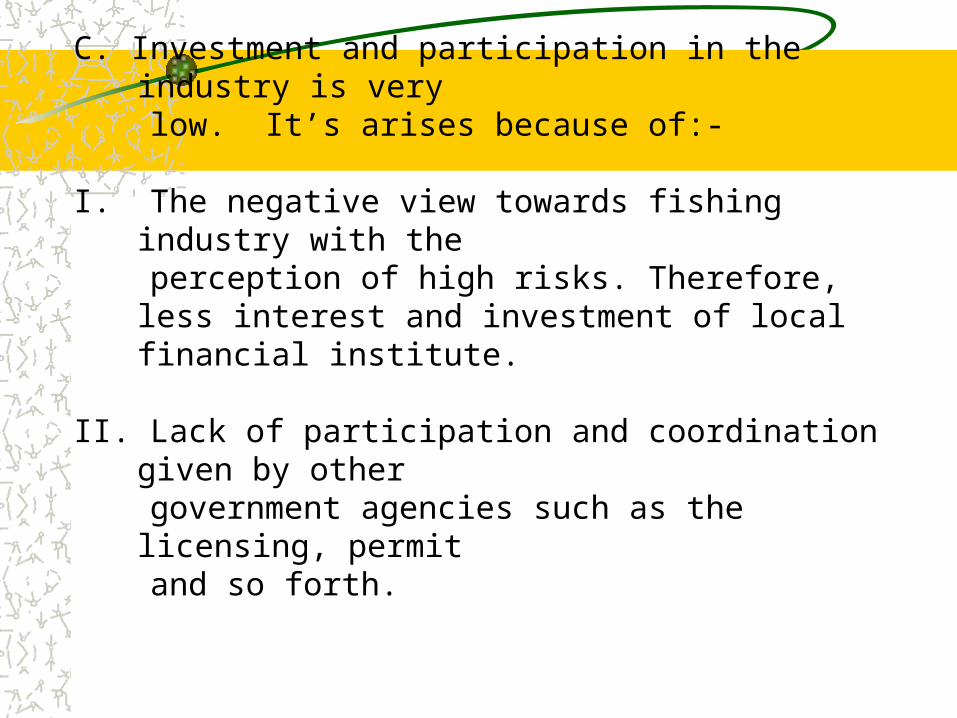
C. Investment and participation in the industry is very low. It’s arises because of:-
I. The negative view towards fishing industry with the perception of high risks. Therefore, less interest and
investment of local financial institute.
II. Lack of participation and coordination given by other government agencies such as the licensing, permit and so forth.
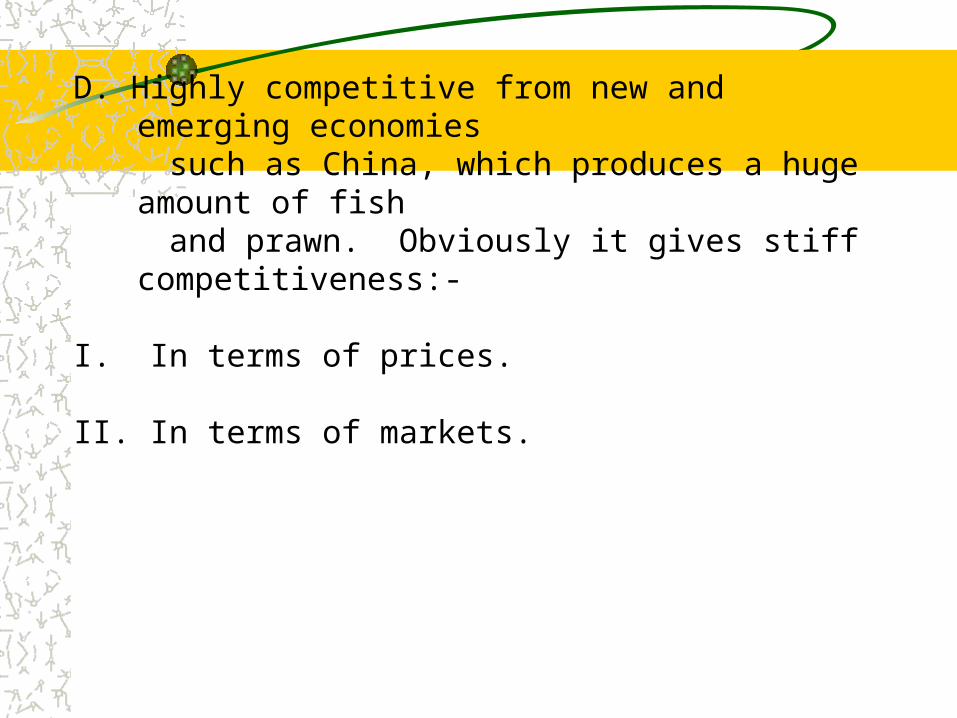
D. Highly competitive from new and emerging economies such as China, which produces a huge amount of fish and prawn. Obviously it gives stiff competitiveness:-
I. In terms of prices.
II. In terms of markets.
YEAR TOTALRETURNINGRESIDENTS
INTENDING RESIDENTS
VISITORS
TOTAL TOURIST BUSINESS RELATIVES TRANSIT OTHERS
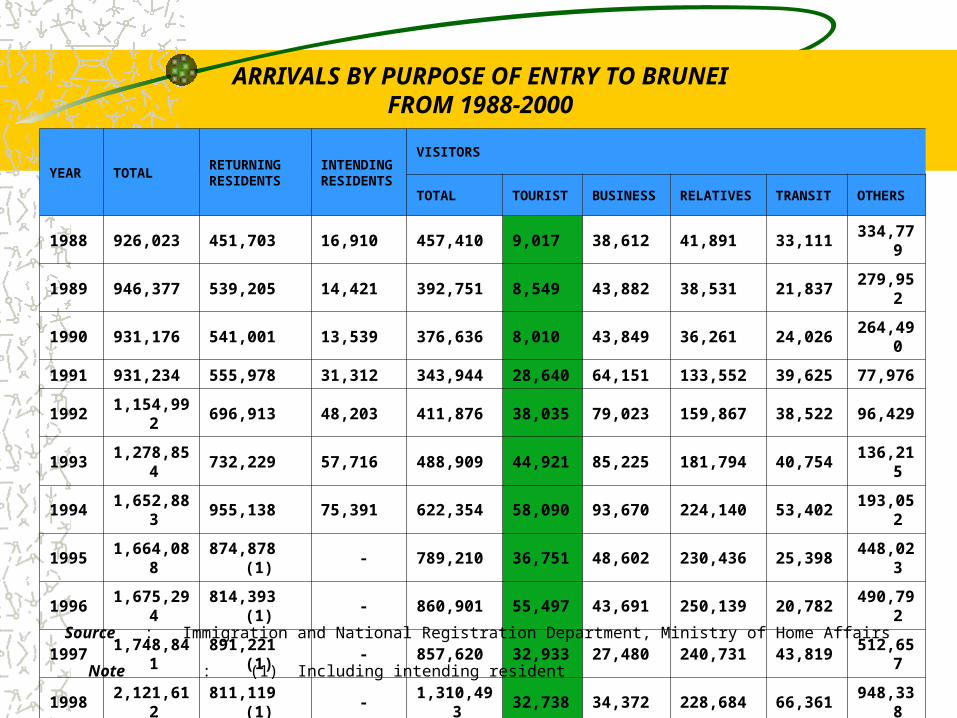
1988 926,023 451,703 16,910 457,410 9,017 38,612 41,891 33,111 334,779
1989 946,377 539,205 14,421 392,751 8,549 43,882 38,531 21,837 279,952
1990 931,176 541,001 13,539 376,636 8,010 43,849 36,261 24,026 264,490
1991 931,234 555,978 31,312 343,944 28,640 64,151 133,552 39,625 77,976
1992 1,154,992 696,913 48,203 411,876 38,035 79,023 159,867 38,522 96,429
1993 1,278,854 732,229 57,716 488,909 44,921 85,225 181,794 40,754 136,215
1994 1,652,883 955,138 75,391 622,354 58,090 93,670 224,140 53,402 193,052
1995 1,664,088 874,878 (1) - 789,210 36,751 48,602 230,436 25,398 448,023
1996 1,675,294 814,393 (1) - 860,901 55,497 43,691 250,139 20,782 490,792
1997 1,748,841 891,221 (1) - 857,620 32,933 27,480 240,731 43,819 512,657
1998 2,121,612 811,119 (1) - 1,310,493 32,738 34,372 228,684 66,361 948,338
1999 1,997,227 697,211 (1) - 1,300,016 38,440 29,997 247,034 75,756 908,788
2000 2,118,250 811,486 (1) - 1,306,764 41,241 27,303 258,836 75,381 904,003
Source : Immigration and National Registration Department, Ministry of Home Affairs
Note : (1) Including intending resident
ARRIVALS BY PURPOSE OF ENTRY TO BRUNEIFROM 1988-2000

YEAR
Construction Wholesale Retail Restaurant and HotelTransport, Storage &
Communication
Value%Contribution
Value %Contri bution
Value%Contri bution
Value %Contribution
Value%Contribution
1986 170.1 3.3 71.3 1.4 155.5 3.0 40.1 0.8 123.2 2.4
1987 183.1 3.2 90.1 1.6 179.7 3.1 45.9 0.8 150.4 2.6
1988 195.7 3.6 91.9 1.7 207.6 3.8 52.1 1.0 170.8 3.2
1989 254.6 4.4 116.2 2.0 239.8 4.1 59.4 1.0 196.4 3.4
1990 277.4 4.3 122.0 1.9 257.3 4.0 67.7 1.0 214.1 3.3
1991 302.8 4.6 128.0 1.9 272.8 4.1 72.5 1.1 235.2 3.6
1992 315.8 4.8 136.6 2.1 285.4 4.3 77.9 1.2 252.0 3.8
1993 334.0 5.1 142.4 2.2 295.6 4.5 85.8 1.3 264.9 4.0
1994 364.4 5.5 152.6 2.3 307.2 4.6 96.1 1.4 278.3 4.2
1995 404.7 5.5 162.6 2.2 324.7 4.4 108.0 1.5 298.5 4.0
1996 487.2 6.6 171.9 2.3 399.0 5.4 127.8 1.7 304.6 4.1
1997 523.4 6.9 152.7 2.4 405.7 5.3 135.3 1.8 347.0 4.5
1998 539.2 7.7 192.6 2.7 418.7 6.0 148.4 2.1 372.5 5.3
1999 442.5 6.2 203.2 2.8 332.0 4.6 144.9 2.0 382.7 5.4
2000 428.2 5.8 205.6 2.8 320.3 4.3 148.6 2.0 413.5 5.6
2001 428.8 5.7 201.9 2.7 339.5 4.5 141.2 1.9 396.8 5.3
2002 408.8 5.3 221.0 2.9 425.6 5.6 155.1 2.0 368.8 4.8
2003* 334.0 4.1 231.9 2.8 407.5 4.9 164.3 2.0 431.9 5.2
ECONOMIC ACTIVITY BY SECTORS(MILLIONS B$) AT CURRENT PRICE
*Provisional
Tourism Industry
The problem frequently encountered in development oftourism industry are :
I. Uncoordinated effort in the implementation of tourism and hospitality.
II. Lack of places of interest including public facilities.
III. Ineffective promotion.
IV. Lack of activities for tourists in the country, and V. Stiff competition from the neighboring countries.
SITES YEAR
89 90 91 92
93
94 95 96 97 98 99 00 01 02 03 04 TOT
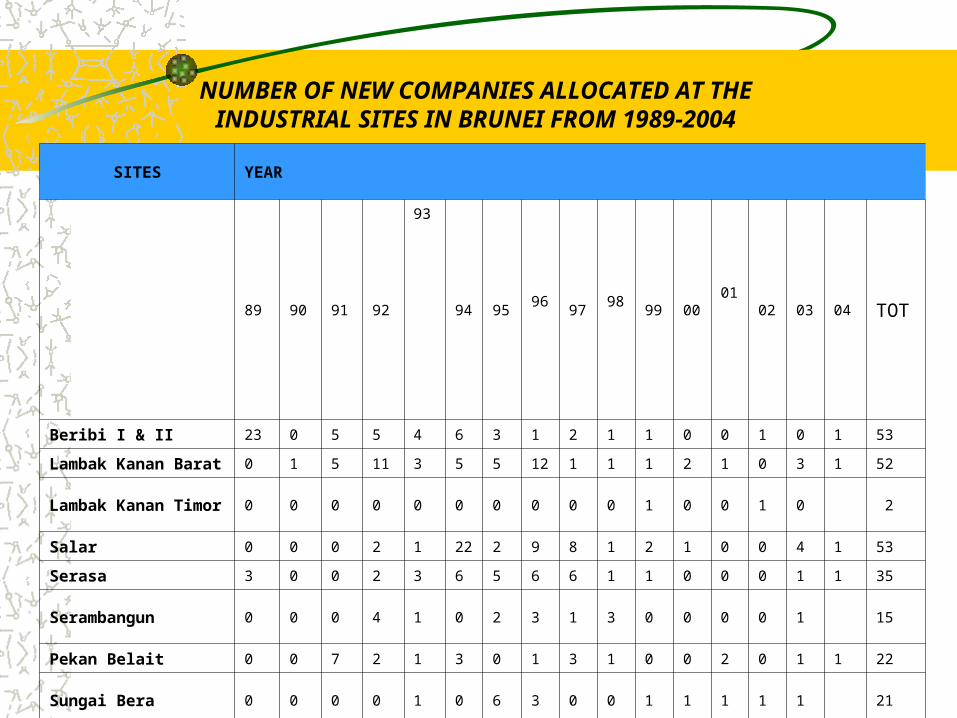
Beribi I & II 23 0 5 5 4 6 3 1 2 1 1 0 0 1 0 1 53
Lambak Kanan Barat 0 1 5 11 3 5 5 12 1 1 1 2 1 0 3 1 52
Lambak Kanan Timor 0 0 0 0 0 0 0 0 0 0 1 0 0 1 0 2
Salar 0 0 0 2 1 22 2 9 8 1 2 1 0 0 4 1 53
Serasa 3 0 0 2 3 6 5 6 6 1 1 0 0 0 1 1 35
Serambangun 0 0 0 4 1 0 2 3 1 3 0 0 0 0 1 15
Pekan Belait 0 0 7 2 1 3 0 1 3 1 0 0 2 0 1 1 22
Sungai Bera 0 0 0 0 1 0 6 3 0 0 1 1 1 1 1 21
Batu Apoi 0 0 0 0 0 0 0 0 1 0 0 0 0 0 0 1
TOTAL 26 1 17 26 14 42 18 38 25 8 12 4 4 3 11 5 254
NUMBER OF NEW COMPANIES ALLOCATED AT THEINDUSTRIAL SITES IN BRUNEI FROM 1989-2004
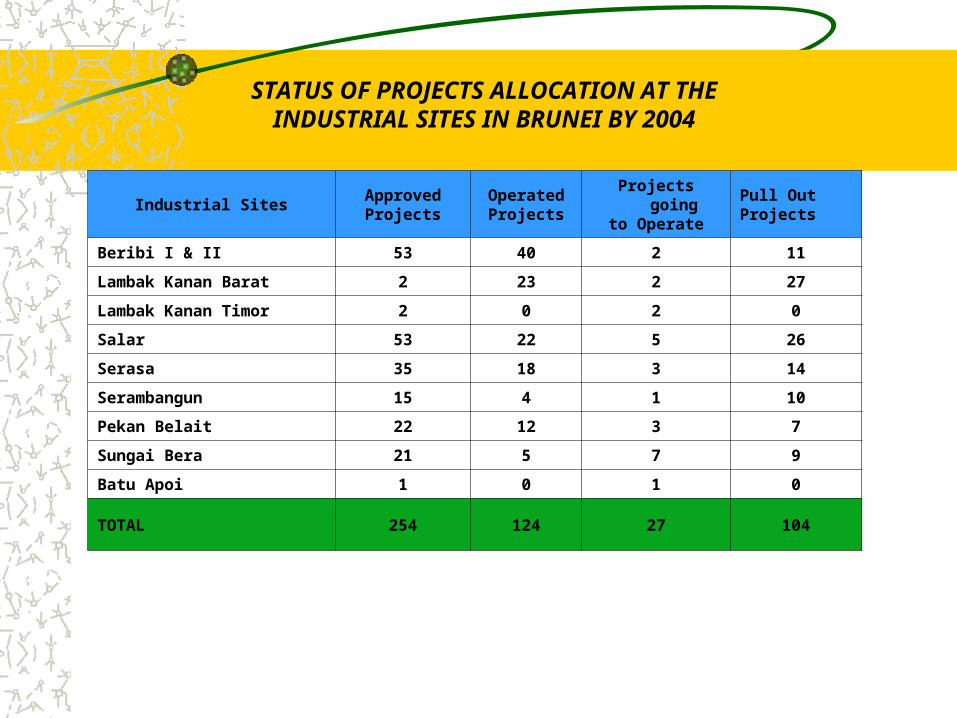
Industrial SitesApprovedProjects
OperatedProjects
Projects goingto Operate
Pull OutProjects
Beribi I & II 53 40 2 11
Lambak Kanan Barat 2 23 2 27
Lambak Kanan Timor 2 0 2 0
Salar 53 22 5 26
Serasa 35 18 3 14
Serambangun 15 4 1 10
Pekan Belait 22 12 3 7
Sungai Bera 21 5 7 9
Batu Apoi 1 0 1 0
TOTAL 254 124 27 104
STATUS OF PROJECTS ALLOCATION AT THEINDUSTRIAL SITES IN BRUNEI BY 2004
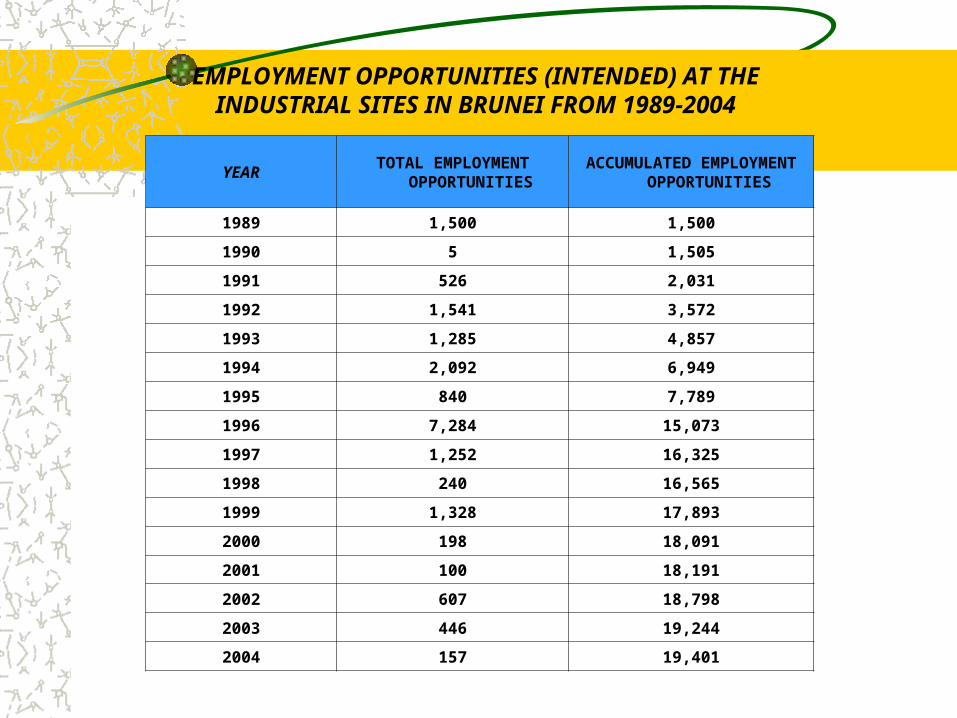
YEARTOTAL EMPLOYMENT
OPPORTUNITIESACCUMULATED EMPLOYMENT
OPPORTUNITIES
1989 1,500 1,500
1990 5 1,505
1991 526 2,031
1992 1,541 3,572
1993 1,285 4,857
1994 2,092 6,949
1995 840 7,789
1996 7,284 15,073
1997 1,252 16,325
1998 240 16,565
1999 1,328 17,893
2000 198 18,091
2001 100 18,191
2002 607 18,798
2003 446 19,244
2004 157 19,401
EMPLOYMENT OPPORTUNITIES (INTENDED) AT THEINDUSTRIAL SITES IN BRUNEI FROM 1989-2004
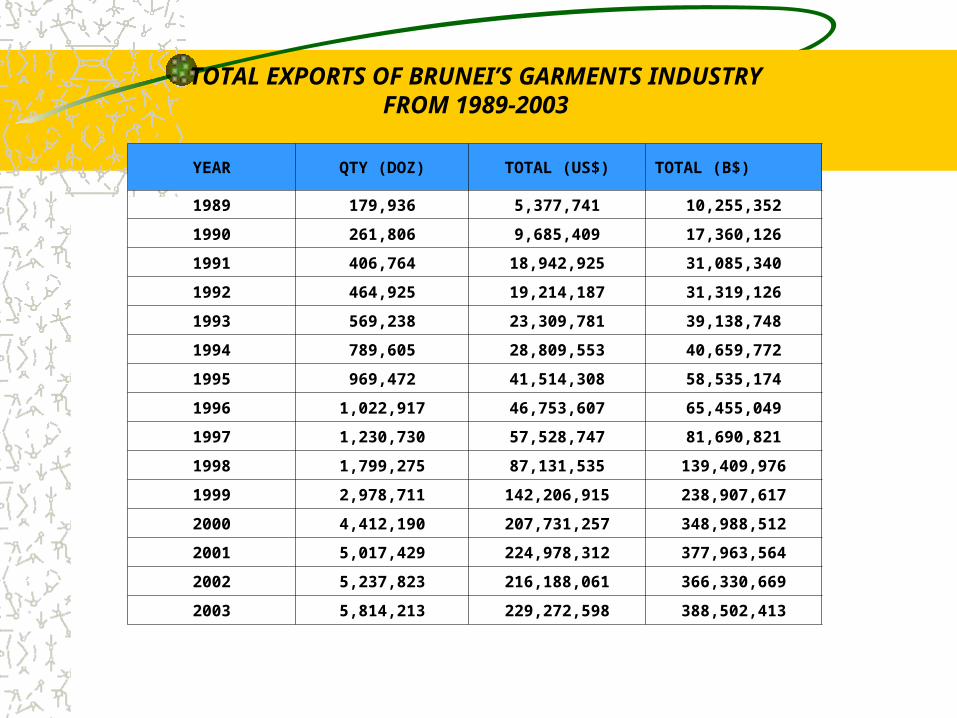
TOTAL EXPORTS OF BRUNEI’S GARMENTS INDUSTRYFROM 1989-2003
YEAR QTY (DOZ) TOTAL (US$) TOTAL (B$)
1989 179,936 5,377,741 10,255,352
1990 261,806 9,685,409 17,360,126
1991 406,764 18,942,925 31,085,340
1992 464,925 19,214,187 31,319,126
1993 569,238 23,309,781 39,138,748
1994 789,605 28,809,553 40,659,772
1995 969,472 41,514,308 58,535,174
1996 1,022,917 46,753,607 65,455,049
1997 1,230,730 57,528,747 81,690,821
1998 1,799,275 87,131,535 139,409,976
1999 2,978,711 142,206,915 238,907,617
2000 4,412,190 207,731,257 348,988,512
2001 5,017,429 224,978,312 377,963,564
2002 5,237,823 216,188,061 366,330,669
2003 5,814,213 229,272,598 388,502,413
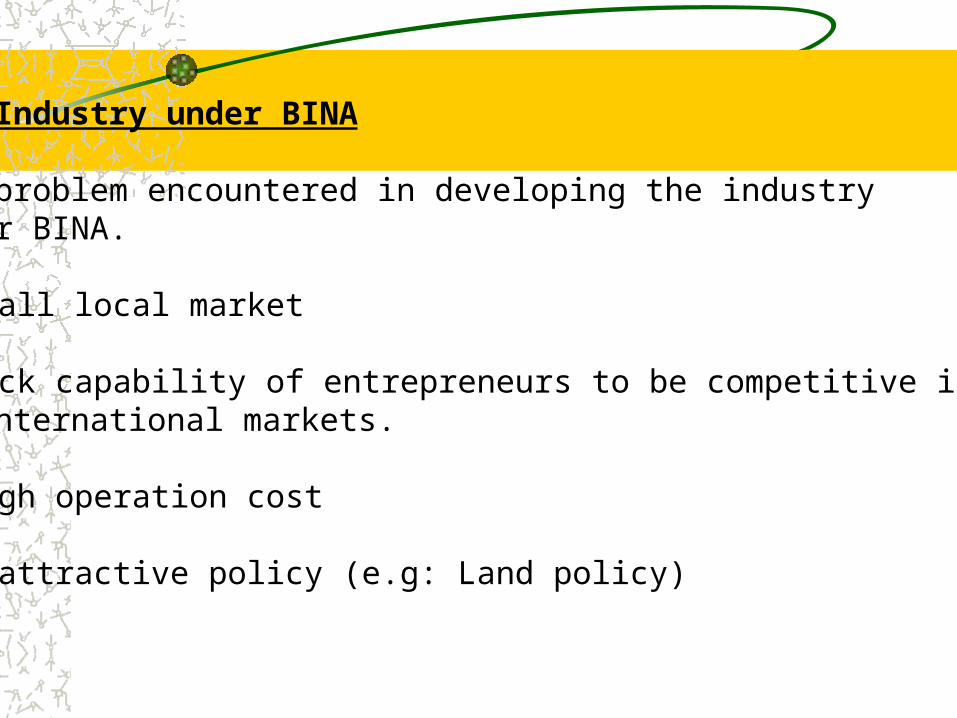
The Industry under BINA
The problem encountered in developing the industryunder BINA.
Small local market
Lack capability of entrepreneurs to be competitive in the international markets.
High operation cost
Unattractive policy (e.g: Land policy)
The Direction towards Privatization
The problem encountered to privatization:
slowness in decision making
slowness in implementing projects

In general to speed up the economic diversification theGovernment has to play a vital role as follows:
I. Provide the necessary physical infrastructure
II. Formulate a policy to facilitate and create a conducive business such as tax, land policy and so forth.
III. Change the mindsets, attitudes, perception, knowledge and skills of the individual stakeholders either the public sectors, private sectors and the community on the importance and urgency of economic diversification. Such for example in the administrative efficiency viz faster in decision making, faster in implementation of infrastructural projects and so forth.
IV. All the ministries and department should coordinate the activities to ensure more efficient and effective implementation of the economic diversification policy.
V. Focus and align any viable sector which Brunei got the competitive advantage.
VI. Brunei has got to be proactive and react very fast to the international changes.
VII. Able to compete regionally and internationally.
BEDB to develop Pulau Muara Besar into a Global Mega Port and Sungai Liang Industrial Park.
This is in line with the objective of BEDB to create 6,000 new permanent jobs and attract US$4.5 billion in investments by 2008.
What is our opportunities?
What will happen to us if Brunei cannot diversify its economy ‘successfully’ the next 15 years?