cocoaland holdings bhd rr 3q fy2015 factset
DESCRIPTION
Quarterly Results Report for Cocoaland Holdings Bhd - 3Q FY 2015TRANSCRIPT
WILSON & YORK 25/11/2015
Copyright 2015, Wilson & York Global Advisers Sdn Bhd | See important disclosures at end of this report
RESULTS REPORT
INVESTMENT RISKS
RECOMMENDATION
ANNUAL RESULTS AND METRICS (MYR mn)
Page 1 of 3
YTD 3Q FY15 total revenue increased 0.1% vs YTD 3Q FY14; exports
are slowing down, but local sales are increasing. YTD 3Q FY15 net
profits increased 83.3% vs YTD 3Q FY14. YTD 3Q FY15 operating
margins came in at 16.1% vs 9.3% in YTD 3Q 2014. We expect operating
margins of 14-17% to prevail over the next several quarters. Cocoaland
continues to open new markets and is making good progress under
challenging trading conditions. Exports account for about 57% of
Cocoaland sales currently, and are expected to rise to about 60% of
sales in FY 2016. Low commodity prices and the lower value of the
MYR has been a beneficial factor for margins.
Risks to our recommendation and target price include: i) rising trends in
material costs, ii) an increase in the general level of interest rates, and iii)
a sharp slowdown in the general level of economic activity in Malaysia
or in the economies of the company’s major ‘own brand’ export markets
- China/HK and the Middle East.
We maintain our BUY recommendation on Cocoaland Holdings Bhd, and
raise our fair value estimate to MYR 2.40. It is possible that the share
price will surprise on the upside; sales growth and capacity utilisation
may accelerate more quickly than we expect. Cocoaland has very little
debt on the balance sheet as well as plenty of cash.
Cocoaland has a clean balance sheet and a proven record of growing
export sales. Exports are likely to account for 60% or more of total
revenue by year end 2016. In terms of ‘own brand’ China/HK remains in
the top spot as the company’s largest export market, followed by Saudi
Arabia in importance. Management has been very diligent in developing
new markets that more than compensate for OEM beverage business
lost in the Thai market in 2014.
Cocoaland Holdings Bhd is ranked approximately in the middle of the
thirty listed companies in the Malaysian snack food industry. The com-
pany is one of the few home grown Malaysian consumer firms that have
successfully penetrated regional markets. Cocoaland Holding’s pred-
ecessor company, MFESB, was formed in 1980. This company and
others were consolidated and converted to a public limited company in
2000 under the name Cocoaland Holdings Bhd, prior to listing in 2005.
FTSE-BURSA INDEX MEMBERSHIP
REPORT INDEX
COMPANY PROFILE
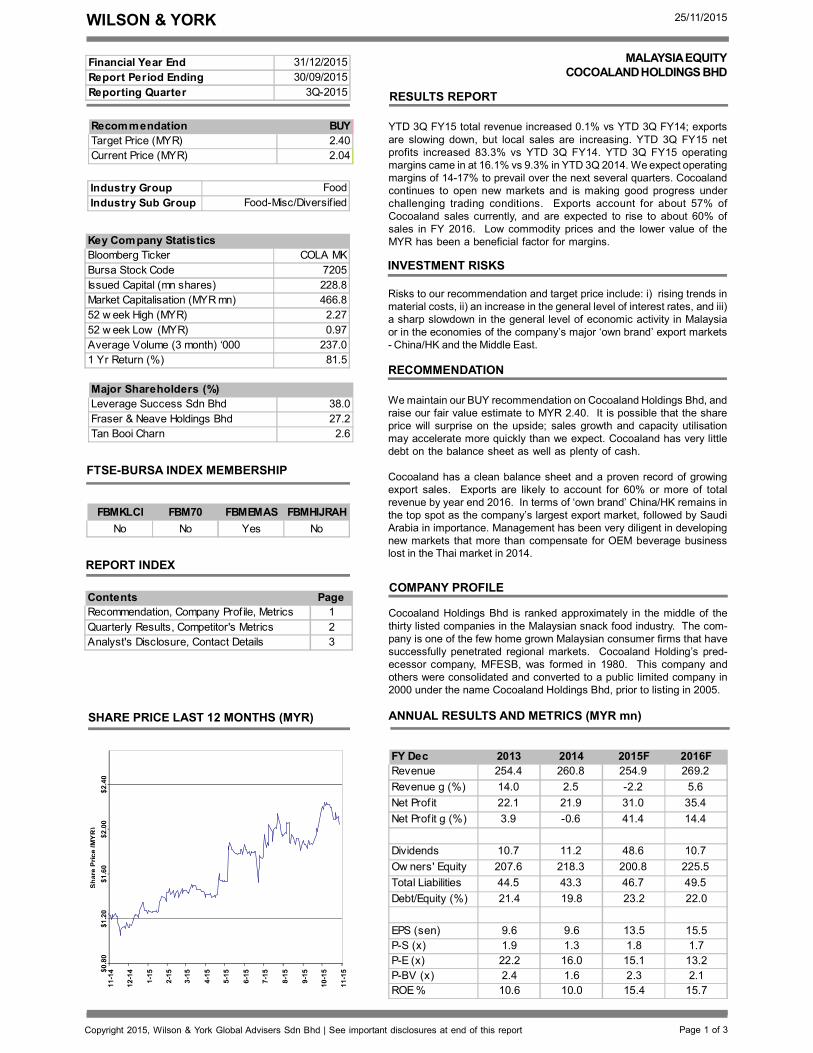
SHARE PRICE LAST 12 MONTHS (MYR)
MALAYSIA EQUITY
COCOALAND HOLDINGS BHD
Industry Group Food
Industry Sub Group Food-Misc/Diversified
FBMKLCI FBM70 FBMEMAS FBMHIJRAH
No No Yes No
Recommendation BUY
Target Price (MYR) 2.40
Current Price (MYR) 2.04
Key Company Statistics
Bloomberg Ticker COLA MK
Bursa Stock Code 7205
Issued Capital (mn shares) 228.8
Market Capitalisation (MYR mn) 466.8
52 w eek High (MYR) 2.27
52 w eek Low (MYR) 0.97
Average Volume (3 month) ‘000 237.0
1 Yr Return (%) 81.5
Major Shareholders (%)
Leverage Success Sdn Bhd 38.0
Fraser & Neave Holdings Bhd 27.2
Tan Booi Charn 2.6
FY Dec 2013 2014 2015F 2016F
Revenue 254.4 260.8 254.9 269.2
Revenue g (%) 14.0 2.5 -2.2 5.6
Net Prof it 22.1 21.9 31.0 35.4
Net Prof it g (%) 3.9 -0.6 41.4 14.4
Dividends 10.7 11.2 48.6 10.7
Ow ners' Equity 207.6 218.3 200.8 225.5
Total Liabilities 44.5 43.3 46.7 49.5
Debt/Equity (%) 21.4 19.8 23.2 22.0
EPS (sen) 9.6 9.6 13.5 15.5
P-S (x) 1.9 1.3 1.8 1.7
P-E (x) 22.2 16.0 15.1 13.2
P-BV (x) 2.4 1.6 2.3 2.1
ROE % 10.6 10.0 15.4 15.7
Financial Year End 31/12/2015
Report Period Ending 30/09/2015
Reporting Quarter 3Q-2015
Contents Page
Recommendation, Company Prof ile, Metrics 1
Quarterly Results, Competitor's Metrics 2
Analyst's Disclosure, Contact Details 3
WILSON & YORK 25/11/2015
Copyright 2015, Wilson & York Global Advisers Sdn Bhd | See important disclosures at end of this report
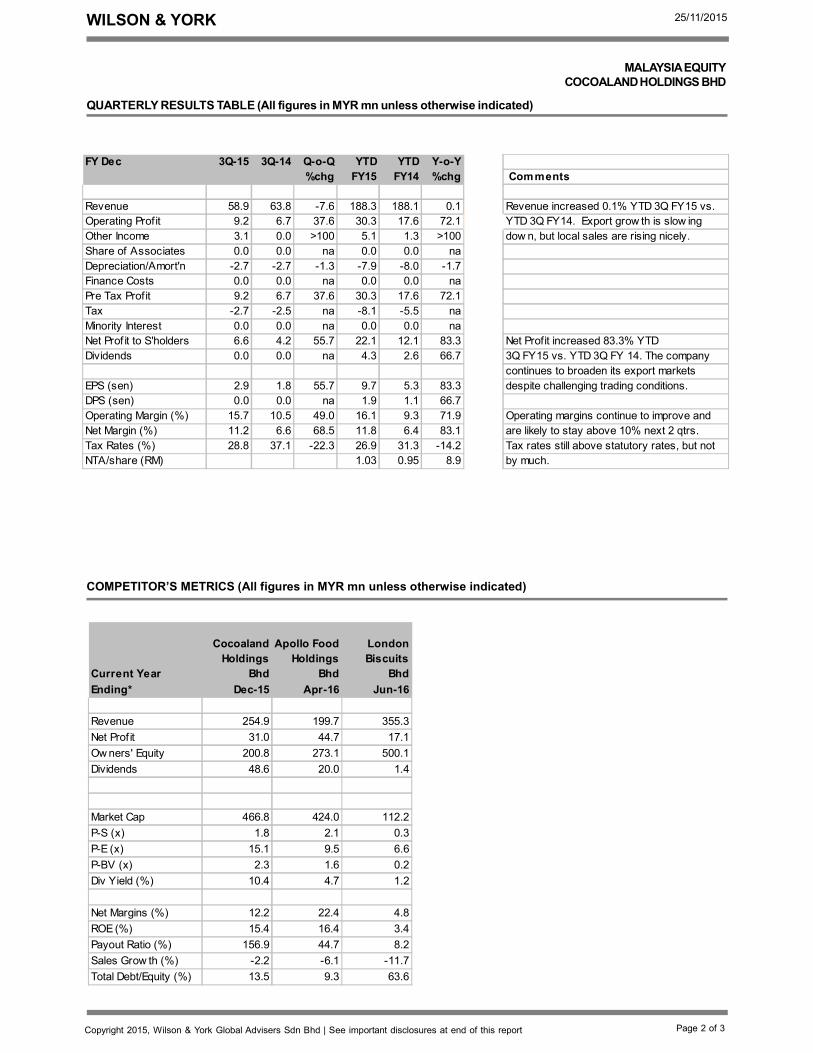
QUARTERLY RESULTS TABLE (All figures in MYR mn unless otherwise indicated)
FY Dec 3Q-15 3Q-14 Q-o-Q YTD YTD Y-o-Y
%chg FY15 FY14 %chg
Revenue 58.9 63.8 -7.6 188.3 188.1 0.1
Operating Profit 9.2 6.7 37.6 30.3 17.6 72.1
Other Income 3.1 0.0 >100 5.1 1.3 >100
Share of Associates 0.0 0.0 na 0.0 0.0 na
Depreciation/Amort'n -2.7 -2.7 -1.3 -7.9 -8.0 -1.7
Finance Costs 0.0 0.0 na 0.0 0.0 na
Pre Tax Profit 9.2 6.7 37.6 30.3 17.6 72.1
Tax -2.7 -2.5 na -8.1 -5.5 na
Minority Interest 0.0 0.0 na 0.0 0.0 na
Net Prof it to S'holders 6.6 4.2 55.7 22.1 12.1 83.3
Dividends 0.0 0.0 na 4.3 2.6 66.7
EPS (sen) 2.9 1.8 55.7 9.7 5.3 83.3
DPS (sen) 0.0 0.0 na 1.9 1.1 66.7
Operating Margin (%) 15.7 10.5 49.0 16.1 9.3 71.9
Net Margin (%) 11.2 6.6 68.5 11.8 6.4 83.1
Tax Rates (%) 28.8 37.1 -22.3 26.9 31.3 -14.2
NTA/share (RM) 1.03 0.95 8.9
COMPETITOR’S METRICS (All figures in MYR mn unless otherwise indicated)
Page 2 of 3
Comments
Revenue increased 0.1% YTD 3Q FY15 vs.
YTD 3Q FY14. Export grow th is slow ing
dow n, but local sales are rising nicely.
Net Profit increased 83.3% YTD
3Q FY15 vs. YTD 3Q FY 14. The company
continues to broaden its export markets
despite challenging trading conditions.
Operating margins continue to improve and
are likely to stay above 10% next 2 qtrs.
Tax rates still above statutory rates, but not
by much.
MALAYSIA EQUITY
COCOALAND HOLDINGS BHD
Current Year
Cocoaland
Holdings
Bhd
Apollo Food
Holdings
Bhd
London
Biscuits
Bhd
Ending* Dec-15 Apr-16 Jun-16
Revenue 254.9 199.7 355.3
Net Prof it 31.0 44.7 17.1
Ow ners' Equity 200.8 273.1 500.1
Dividends 48.6 20.0 1.4
Market Cap 466.8 424.0 112.2
P-S (x) 1.8 2.1 0.3
P-E (x) 15.1 9.5 6.6
P-BV (x) 2.3 1.6 0.2
Div Yield (%) 10.4 4.7 1.2
Net Margins (%) 12.2 22.4 4.8
ROE (%) 15.4 16.4 3.4
Payout Ratio (%) 156.9 44.7 8.2
Sales Grow th (%) -2.2 -6.1 -11.7
Total Debt/Equity (%) 13.5 9.3 63.6
WILSON & YORK 25/11/2015
Copyright 2015, Wilson & York Global Advisers Sdn Bhd | See important disclosures on this page. Page 3 of 3
ANALYST’S DISCLOSURE
MALAYSIA EQUITY
COCOALAND HOLDINGS BHD
BUY: Share price may exceed 10% over the next 12 months
TRADING BUY: Share price may exceed 15% over the next 3 months, however longer-term outlook remains uncertain
HOLD: Share price may fall within the range of +/- 10% over the next 12 months
TAKE PROFIT: Target price has been attained. Look to accumulate at lower levels
SELL: Share price may fall by more than 10% over the next 12 months
NOT RATED (NR): Stock is not within regular research coverage
All research is based on materials compiled from data considered to be reliable at the time of writing. However, information and opinions
expressed are subject to change at short notice, and no part of this report is to be construed as an offer or solicitation of an offer to transact
any securities or financial instruments whether referred to herein or otherwise.
We do not accept any liability directly or indirectly that may arise from investment decision-making based on this report. The company, its
directors, officers, employees and/or connected persons may periodically hold an interest and/or underwriting commitments in the secu-
rities mentioned.
All Rights Reserved. No part of this publication may be used or re-produced without expressed permission from Wilson & York Global
Advisers Sdn Bhd.
J Charles Wilson
Head of Research
QUESTIONS?
CONTACT THE INVESTMENT ADVISER:
Wilson & York Global Advisers Sdn Bhd
Suite B-11-3A, Level 11, Block B, Plaza Mont’ Kiara
2, Jalan Kiara, Mont’ Kiara
50480 Kuala Lumpur
Malaysia
Tel: +603 6203 2280
Fax: +603 6203 2281
E-mail [email protected]
Website: www.wygainvestments.com