bimb-arabesque malaysia shariah-esg equity fund … · laporan tahunan bagi tempoh kewangan dari 9...
TRANSCRIPT
MANAGER:BIMB INVESTMENT MANAGEMENT BERHAD (276246-X)
BIMB-ARABESQUE MALAYSIASHARIAH-ESG EQUITY FUND (“BMSEF”)
ANNUAL REPORT FORTHE FINANCIAL PERIOD FROM 9 MARCH 2017(DATE OF COMMENCEMENT) TO 31 MAY 2018
LAPORAN TAHUNAN BAGITEMPOH KEWANGAN DARI 9 MAC 2017
(TARIKH PELANCARAN) HINGGA 31 MEI 2018
2
TABLE OF CONTENT
No. Particulars Page
1.0 Manager‟s Report 3
1.1 Fund Name/ Fund Type/ Fund Category/ Fund Investment Objective/
Fund Performance Benchmark/ Fund Distribution Policy 3
1.2 Performance for the Financial Year Ended 31 May 2018 4
1.3 Economic and Market Review 6
1.4 Market Outlook and Strategy 7
1.5 Asset Allocation as at 31 May 2018 8
1.6 Other Performance Data for the Financial Year Ended 31 May 2018 9
1.7 Unit Holdings as at 31 May 2018 12
1.8 Policy on Rebate and Soft Commission 14
2.0 Trustee‟s Report 28
3.0 Shariah Committee‟s Report 29
4.0 Directors‟ Declaration Report 30
5.0 Independent Auditors‟ Report 31
6.0 Financial Statements (Audited) 34
7.0 Corporate Directory 61
3
1.0 Manager’s Report
Dear Unit Holders,
We are pleased to present the Manager‟s report of BIMB-Arabesque Malaysia Shariah-
ESG Equity Fund for the financial period from 9 March 2017 (date of commencement) to
31 May 2018.
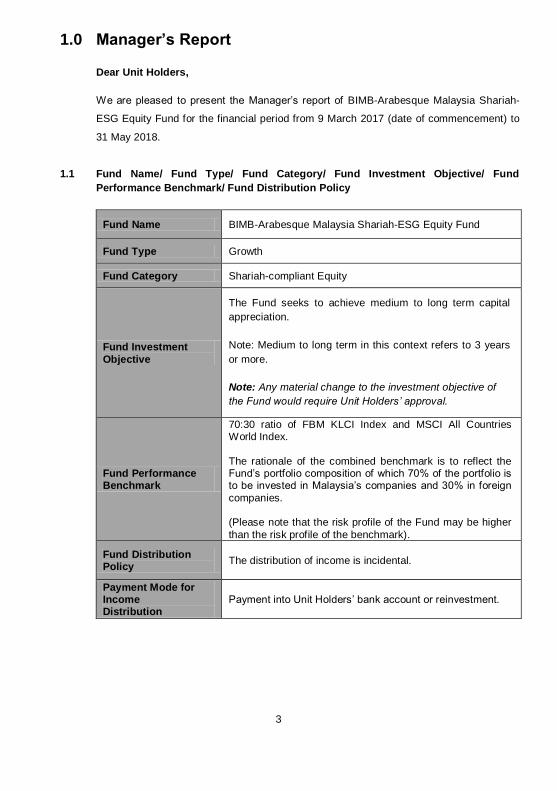
1.1 Fund Name/ Fund Type/ Fund Category/ Fund Investment Objective/ Fund
Performance Benchmark/ Fund Distribution Policy
Fund Name BIMB-Arabesque Malaysia Shariah-ESG Equity Fund
Fund Type Growth
Fund Category Shariah-compliant Equity
Fund Investment
Objective
The Fund seeks to achieve medium to long term capital
appreciation.
Note: Medium to long term in this context refers to 3 years
or more.
Note: Any material change to the investment objective of
the Fund would require Unit Holders’ approval.
Fund Performance Benchmark
70:30 ratio of FBM KLCI Index and MSCI All Countries World Index.
The rationale of the combined benchmark is to reflect the Fund‟s portfolio composition of which 70% of the portfolio is to be invested in Malaysia‟s companies and 30% in foreign
companies. (Please note that the risk profile of the Fund may be higher
than the risk profile of the benchmark).
Fund Distribution Policy
The distribution of income is incidental.
Payment Mode for Income Distribution
Payment into Unit Holders‟ bank account or reinvestment.
4
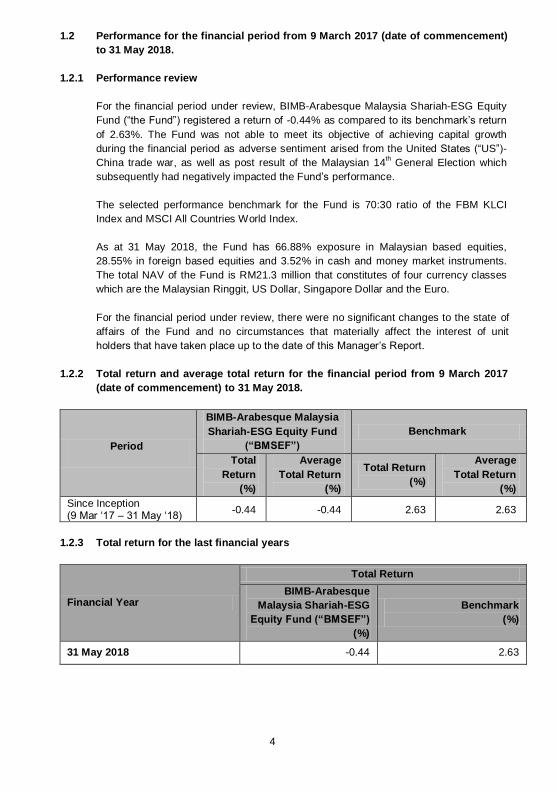
1.2 Performance for the financial period from 9 March 2017 (date of commencement)
to 31 May 2018.
1.2.1 Performance review
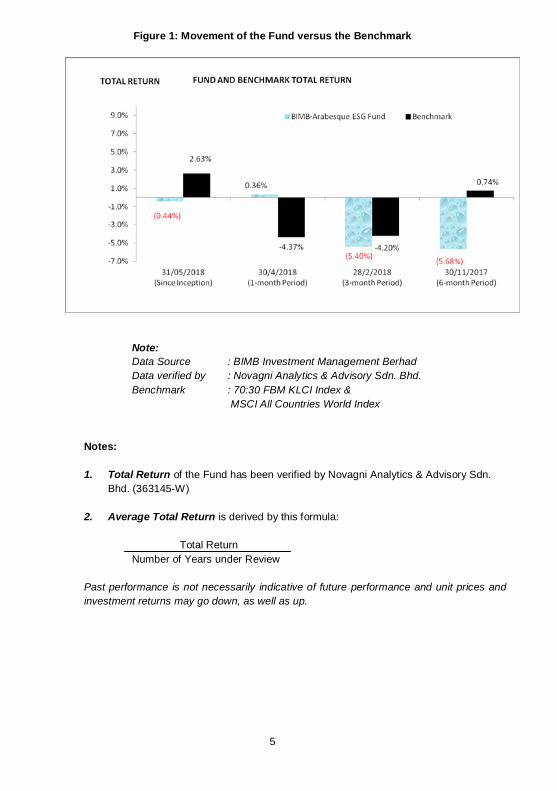
For the financial period under review, BIMB-Arabesque Malaysia Shariah-ESG Equity
Fund (“the Fund”) registered a return of -0.44% as compared to its benchmark‟s return
of 2.63%. The Fund was not able to meet its objective of achieving capital growth
during the financial period as adverse sentiment arised from the United States (“US”)-
China trade war, as well as post result of the Malaysian 14th General Election which
subsequently had negatively impacted the Fund‟s performance.
The selected performance benchmark for the Fund is 70:30 ratio of the FBM KLCI
Index and MSCI All Countries World Index.
As at 31 May 2018, the Fund has 66.88% exposure in Malaysian based equities,
28.55% in foreign based equities and 3.52% in cash and money market instruments.
The total NAV of the Fund is RM21.3 million that constitutes of four currency classes
which are the Malaysian Ringgit, US Dollar, Singapore Dollar and the Euro.
For the financial period under review, there were no significant changes to the state of
affairs of the Fund and no circumstances that materially affect the interest of unit
holders that have taken place up to the date of this Manager‟s Report.
1.2.2 Total return and average total return for the financial period from 9 March 2017
(date of commencement) to 31 May 2018.
Period
BIMB-Arabesque Malaysia
Shariah-ESG Equity Fund
(“BMSEF”)
Benchmark
Total
Return
(%)
Average
Total Return
(%)
Total Return
(%)
Average
Total Return
(%)
Since Inception (9 Mar „17 – 31 May „18)
-0.44 -0.44 2.63 2.63
1.2.3 Total return for the last financial years
Financial Year
Total Return
BIMB-Arabesque
Malaysia Shariah-ESG
Equity Fund (“BMSEF”)
(%)
Benchmark
(%)
31 May 2018 -0.44 2.63
5
Figure 1: Movement of the Fund versus the Benchmark
Note:
Data Source : BIMB Investment Management Berhad
Data verified by : Novagni Analytics & Advisory Sdn. Bhd.
Benchmark : 70:30 FBM KLCI Index &
MSCI All Countries World Index
Notes:
1. Total Return of the Fund has been verified by Novagni Analytics & Advisory Sdn.
Bhd. (363145-W)
2. Average Total Return is derived by this formula:
Total Return
Number of Years under Review
Past performance is not necessarily indicative of future performance and unit prices and
investment returns may go down, as well as up.
6
1.3 Economic and Market Review
Economy
a) Global
US Gross Domestic Product (GDP) grew by 2.3% in the first quarter of 2018 as
compared to 2.9% in the fourth quarter of 2017 and 1.2% in the first quarter of
2017. The weaker first quarter result was due to the slower pace of consumer
spending and lower fixed residential investment. US inflation rate stood at at 2.8%
in May 2018 compared to 2.4% in March 2017. US unemployment rate continues to
improve to 3.8% in May 2018 as compared to 4.5% in March 2017.
The Euro zone economy grew by 0.4% in the first quarter 2018 as compared to
0.7% in the fourth quarter of 2017 and the third quarter of 2017. The weaker growth
for the quarter was attributed to lower exports and stagnating government spending.
The Euro zone inflation rate was at 1.9% in May 2018 and was higher compared to
1.5% in March 2017. Unemployment in the Euro zone has fallen to 8.4% in May
2018 from 9.4% in March 2017.
The Chinese economy grew by 6.8% for the first quarter of 2018, unchanged
compared to the fourth quarter of 2017 and also the third quarter of 2017. During
the first quarter of 2018, GDP performance was supported by strong consumer
demand rising from strong wage growth in urban areas and robust property
investment market.
(Source: Bloomberg, Eurostats, RHB Investment Bank and Maybank Investment Bank)
b) Local
The Malaysian economy grew at 5.4% in the first quarter of 2018 as compared to
5.9% in the fourth quarter of 2017 and 6.2% in third quarter of 2017. The GDP
result for the period was the weakest growth since the fourth quarter 2016, as
private consumption, investment, exports, and government spending increased at a
softer pace.
Bank Negara Malaysia (“BNM”) has decided to maintain the Overnight Policy Rate
(OPR) at 3.25% during the Monetary Policy Committee (MPC) meeting on 10 May
2018. The degree of monetary accommodativeness is consistent with the policy
stance to ensure that the domestic economy continues on a steady growth path
amid lower inflation. The international reserves of Bank Negara Malaysia amounted
to USD108.5 billion as at 31 May 2018. The reserves position is sufficient to
finance 7.6 months of retained imports and is 1.1 times the short-term external
debt.
(Source: Bloomberg, Department of Statistics Malaysia and Bank Negara Malaysia)
7
Market Review
Equity
FTSE Bursa Malaysia Emas Shariah Index (“FBM Shariah”) commenced the period
under review at 12,550.40 points on 9 March 2017 and rose to the highest level of
13,898.17 points on 9 January 2018 and subsequently fell to the lowest point of
11,963.99 on 30 May 2018 and closed the period under review at 12,026.14 points on
30 May 2018 on the same day. For the year under review, the FBM Shariah was down
by 524.26 points or -4.17%. Among the key factors that contributed to the movement of
the index are highlighted below:
In August 2017, the North Korea and U.S dispute escalated to new heights post of
North Korea‟s missile testing exercise that had prompted US President Trump to
issue a retaliation warning. Also during the month, the Federal Reserve planned to
retire USD3.6 trillion or 50% of its quantitative easing money in the market within
three years time.
In February 2018, US Commerce Department recommended steep tariffs on
foreign steel and aluminum while declaring these imports as national security
threat. Trade sanctions between U.S. and China potentially worsen global trade
issues and hurt the recovering momentum of the economy.
In March 2018, the US Federal Reserve raised the target range for the federal
funds rate by a quarter point from 1.5% to 1.75% percent and in line with market
expectations, on the basis US economic outlook has strengthened in recent
months.
(Source: Bloomberg and Bank Negara Malaysia)
1.4 Market Outlook and Strategy
Equity
• The Fund employs a quantitative approach. Given the quantitative and
momentum-based nature of the strategy, the Manager does not manage the Fund
based on macro analysis, views and expected outlook. The Fund invests through
a rules-based investment process which will be rebalanced/traded monthly for the
Malaysian and foreign securities of the Fund.
8
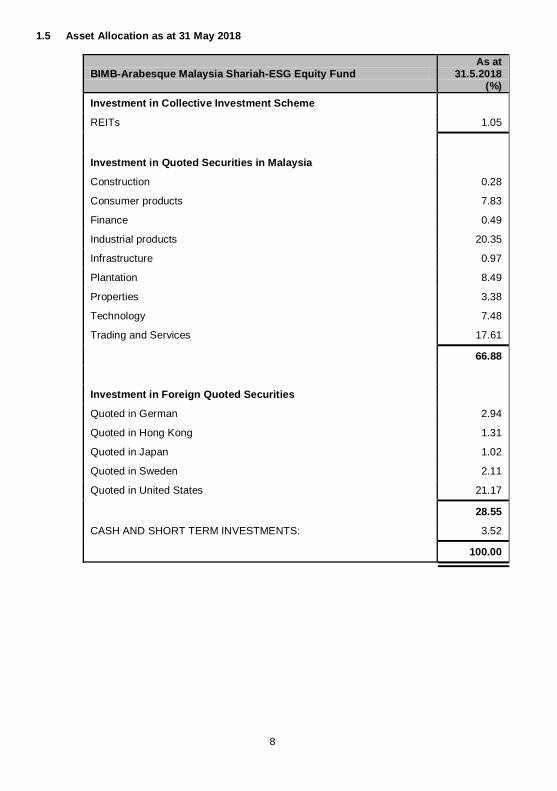
1.5 Asset Allocation as at 31 May 2018
BIMB-Arabesque Malaysia Shariah-ESG Equity Fund As at
31.5.2018 (%)
Investment in Collective Investment Scheme
REITs 1.05
Investment in Quoted Securities in Malaysia
Construction 0.28
Consumer products 7.83
Finance 0.49
Industrial products 20.35
Infrastructure 0.97
Plantation 8.49
Properties 3.38
Technology 7.48
Trading and Services 17.61
66.88
Investment in Foreign Quoted Securities
Quoted in German 2.94
Quoted in Hong Kong 1.31
Quoted in Japan 1.02
Quoted in Sweden 2.11
Quoted in United States 21.17
28.55
CASH AND SHORT TERM INVESTMENTS: 3.52
100.00
9
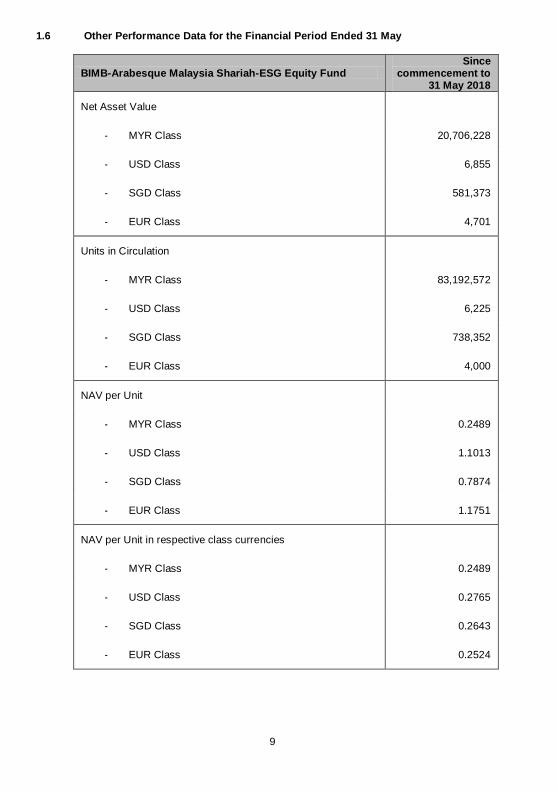
1.6 Other Performance Data for the Financial Period Ended 31 May
BIMB-Arabesque Malaysia Shariah-ESG Equity Fund Since
commencement to 31 May 2018
Net Asset Value
- MYR Class 20,706,228
- USD Class 6,855
- SGD Class 581,373
- EUR Class 4,701
Units in Circulation
- MYR Class 83,192,572
- USD Class 6,225
- SGD Class 738,352
- EUR Class 4,000
NAV per Unit
- MYR Class 0.2489
- USD Class 1.1013
- SGD Class 0.7874
- EUR Class 1.1751
NAV per Unit in respective class currencies
- MYR Class 0.2489
- USD Class 0.2765
- SGD Class 0.2643
- EUR Class 0.2524
10
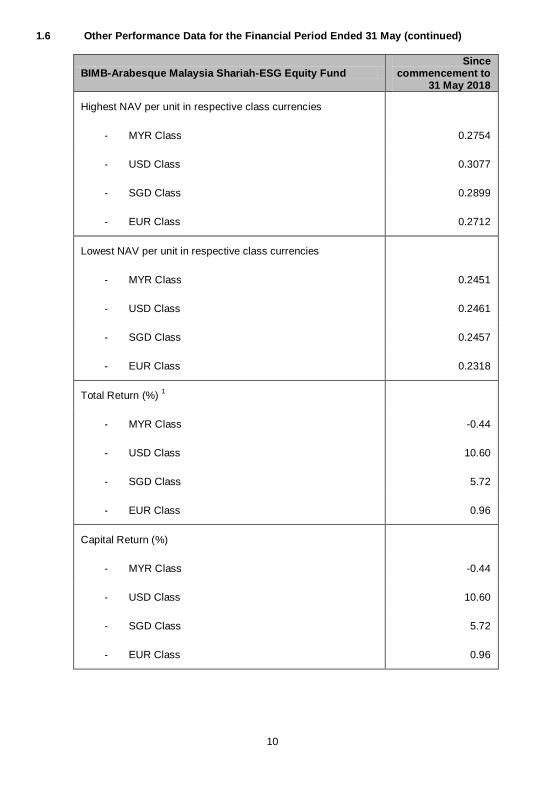
1.6 Other Performance Data for the Financial Period Ended 31 May (continued)
BIMB-Arabesque Malaysia Shariah-ESG Equity Fund Since
commencement to 31 May 2018
Highest NAV per unit in respective class currencies
- MYR Class 0.2754
- USD Class 0.3077
- SGD Class 0.2899
- EUR Class 0.2712
Lowest NAV per unit in respective class currencies
- MYR Class 0.2451
- USD Class 0.2461
- SGD Class 0.2457
- EUR Class 0.2318
Total Return (%) 1
- MYR Class -0.44
- USD Class 10.60
- SGD Class 5.72
- EUR Class 0.96
Capital Return (%)
- MYR Class -0.44
- USD Class 10.60
- SGD Class 5.72
- EUR Class 0.96
11
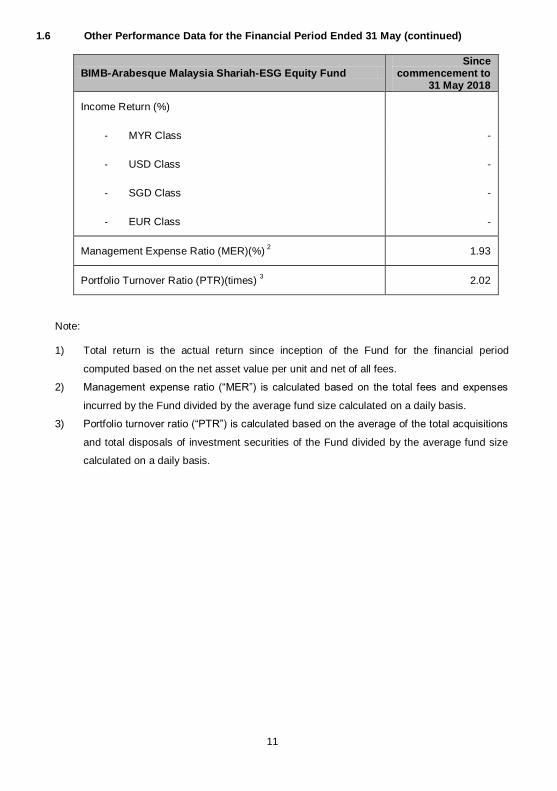
1.6 Other Performance Data for the Financial Period Ended 31 May (continued)
BIMB-Arabesque Malaysia Shariah-ESG Equity Fund Since
commencement to 31 May 2018
Income Return (%)
- MYR Class -
- USD Class -
- SGD Class -
- EUR Class -
Management Expense Ratio (MER)(%) 2 1.93
Portfolio Turnover Ratio (PTR)(times) 3 2.02
Note:
1) Total return is the actual return since inception of the Fund for the financial period
computed based on the net asset value per unit and net of all fees.
2) Management expense ratio (“MER”) is calculated based on the total fees and expenses
incurred by the Fund divided by the average fund size calculated on a daily basis.
3) Portfolio turnover ratio (“PTR”) is calculated based on the average of the total acquisitions
and total disposals of investment securities of the Fund divided by the average fund size
calculated on a daily basis.
12
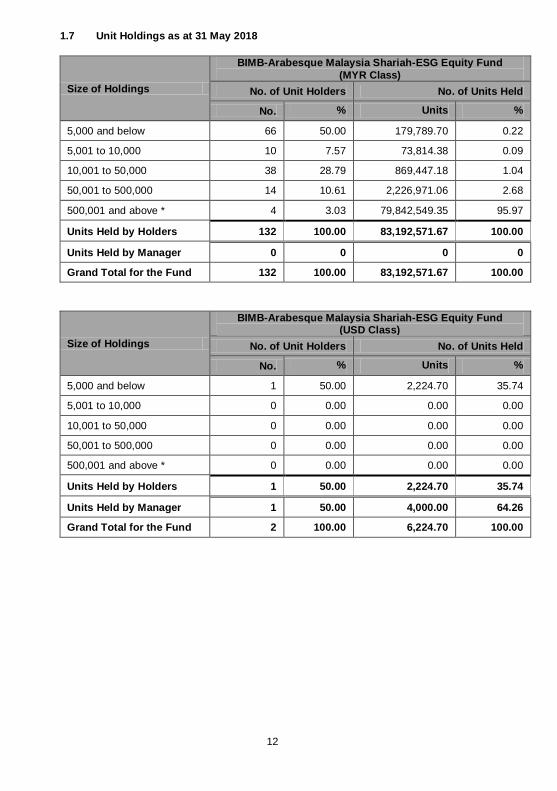
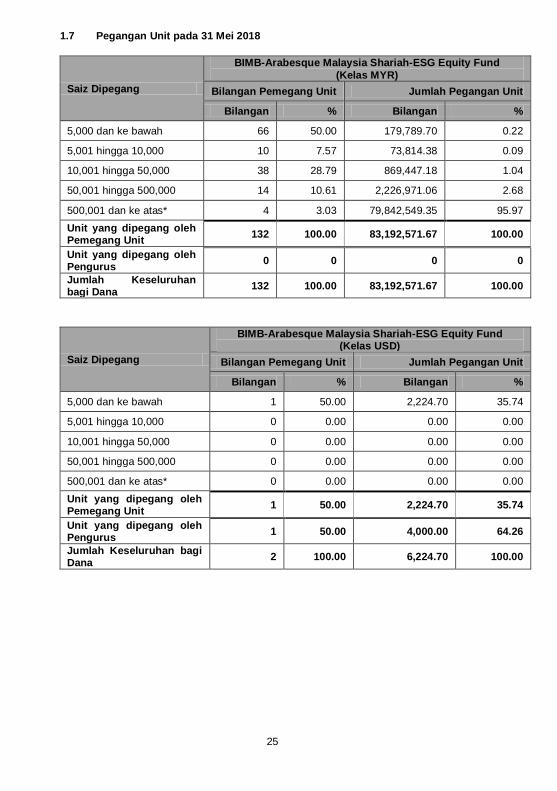
1.7 Unit Holdings as at 31 May 2018
Size of Holdings
BIMB-Arabesque Malaysia Shariah-ESG Equity Fund
(MYR Class)
No. of Unit Holders No. of Units Held
No. % Units %
5,000 and below 66 50.00 179,789.70 0.22
5,001 to 10,000 10 7.57 73,814.38 0.09
10,001 to 50,000 38 28.79 869,447.18 1.04
50,001 to 500,000 14 10.61 2,226,971.06 2.68
500,001 and above * 4 3.03 79,842,549.35 95.97
Units Held by Holders 132 100.00 83,192,571.67 100.00
Units Held by Manager 0 0 0 0
Grand Total for the Fund 132 100.00 83,192,571.67 100.00
Size of Holdings
BIMB-Arabesque Malaysia Shariah-ESG Equity Fund (USD Class)
No. of Unit Holders No. of Units Held
No. % Units %
5,000 and below 1 50.00 2,224.70 35.74
5,001 to 10,000 0 0.00 0.00 0.00
10,001 to 50,000 0 0.00 0.00 0.00
50,001 to 500,000 0 0.00 0.00 0.00
500,001 and above * 0 0.00 0.00 0.00
Units Held by Holders 1 50.00 2,224.70 35.74
Units Held by Manager 1 50.00 4,000.00 64.26
Grand Total for the Fund 2 100.00 6,224.70 100.00
13
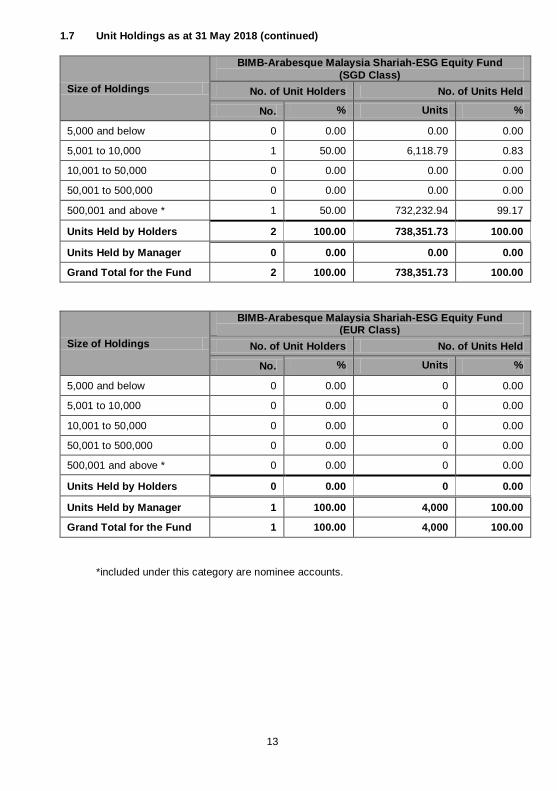
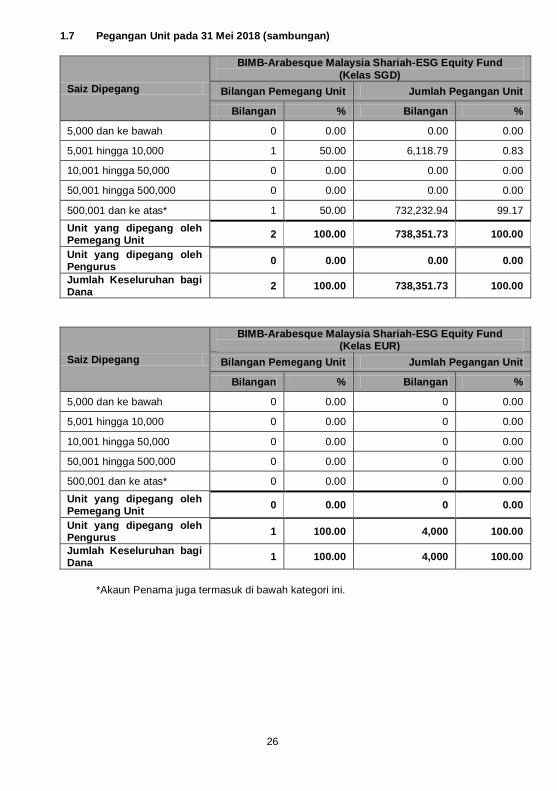
1.7 Unit Holdings as at 31 May 2018 (continued)
Size of Holdings
BIMB-Arabesque Malaysia Shariah-ESG Equity Fund
(SGD Class)
No. of Unit Holders No. of Units Held
No. % Units %
5,000 and below 0 0.00 0.00 0.00
5,001 to 10,000 1 50.00 6,118.79 0.83
10,001 to 50,000 0 0.00 0.00 0.00
50,001 to 500,000 0 0.00 0.00 0.00
500,001 and above * 1 50.00 732,232.94 99.17
Units Held by Holders 2 100.00 738,351.73 100.00
Units Held by Manager 0 0.00 0.00 0.00
Grand Total for the Fund 2 100.00 738,351.73 100.00
Size of Holdings
BIMB-Arabesque Malaysia Shariah-ESG Equity Fund (EUR Class)
No. of Unit Holders No. of Units Held
No. % Units %
5,000 and below 0 0.00 0 0.00
5,001 to 10,000 0 0.00 0 0.00
10,001 to 50,000 0 0.00 0 0.00
50,001 to 500,000 0 0.00 0 0.00
500,001 and above * 0 0.00 0 0.00
Units Held by Holders 0 0.00 0 0.00
Units Held by Manager 1 100.00 4,000 100.00
Grand Total for the Fund 1 100.00 4,000 100.00
*included under this category are nominee accounts.
14
1.8 Policy on Rebate and Soft Commission
Any stock broking rebates received by the Manager will be directed to the account of
the Fund. Any soft commissions received from the broker which are in the form of
research and advisory services that assist in the decision-making process relating to
the Fund‟s investment may be retained by the Manager.
The Manager did not receive any rebate and soft commission from broker during the financial period.
For and on behalf of
The Manager
BIMB INVESTMENT MANAGEMENT BERHAD
Date: 30 July 2018
15
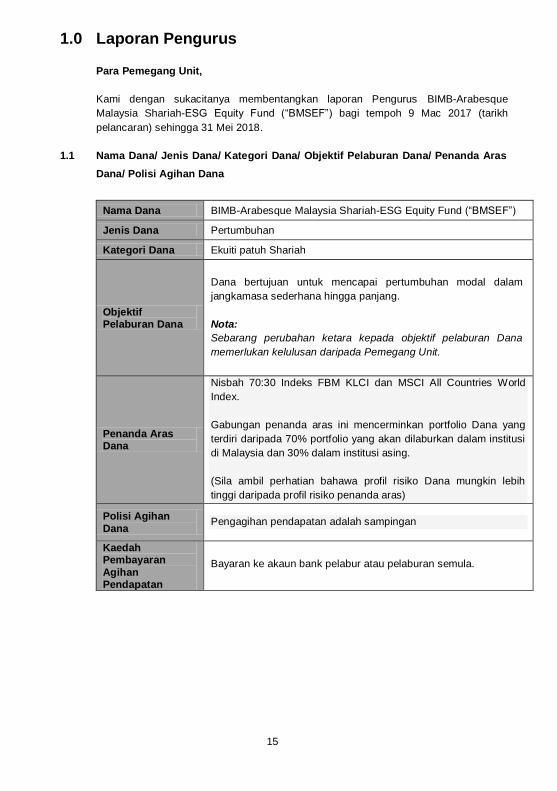
1.0 Laporan Pengurus
Para Pemegang Unit,
Kami dengan sukacitanya membentangkan laporan Pengurus BIMB-Arabesque
Malaysia Shariah-ESG Equity Fund (“BMSEF”) bagi tempoh 9 Mac 2017 (tarikh
pelancaran) sehingga 31 Mei 2018.
1.1 Nama Dana/ Jenis Dana/ Kategori Dana/ Objektif Pelaburan Dana/ Penanda Aras
Dana/ Polisi Agihan Dana
Nama Dana BIMB-Arabesque Malaysia Shariah-ESG Equity Fund (“BMSEF”)
Jenis Dana Pertumbuhan
Kategori Dana Ekuiti patuh Shariah
Objektif Pelaburan Dana
Dana bertujuan untuk mencapai pertumbuhan modal dalam
jangkamasa sederhana hingga panjang.
Nota:
Sebarang perubahan ketara kepada objektif pelaburan Dana
memerlukan kelulusan daripada Pemegang Unit.
Penanda Aras Dana
Nisbah 70:30 Indeks FBM KLCI dan MSCI All Countries World
Index.
Gabungan penanda aras ini mencerminkan portfolio Dana yang
terdiri daripada 70% portfolio yang akan dilaburkan dalam institusi
di Malaysia dan 30% dalam institusi asing.
(Sila ambil perhatian bahawa profil risiko Dana mungkin lebih
tinggi daripada profil risiko penanda aras)
Polisi Agihan
Dana Pengagihan pendapatan adalah sampingan
Kaedah Pembayaran
Agihan Pendapatan
Bayaran ke akaun bank pelabur atau pelaburan semula.
16
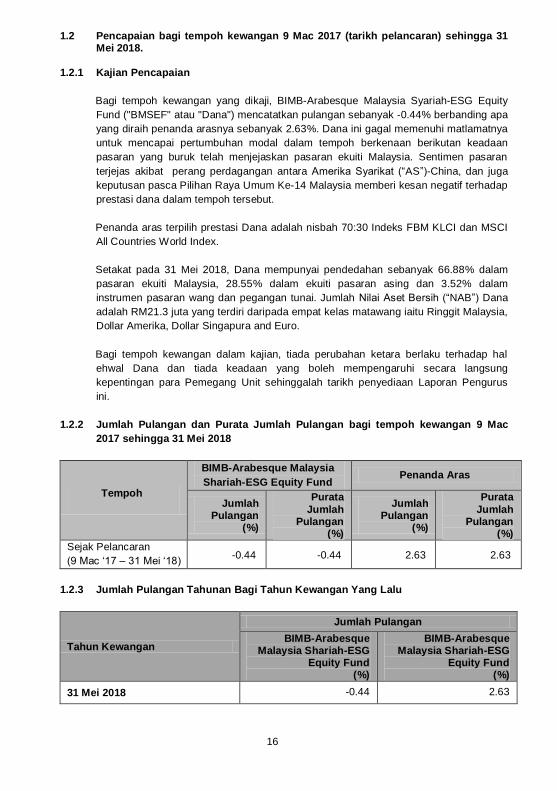
1.2 Pencapaian bagi tempoh kewangan 9 Mac 2017 (tarikh pelancaran) sehingga 31 Mei 2018.
1.2.1 Kajian Pencapaian
Bagi tempoh kewangan yang dikaji, BIMB-Arabesque Malaysia Syariah-ESG Equity
Fund ("BMSEF" atau "Dana") mencatatkan pulangan sebanyak -0.44% berbanding apa
yang diraih penanda arasnya sebanyak 2.63%. Dana ini gagal memenuhi matlamatnya
untuk mencapai pertumbuhan modal dalam tempoh berkenaan berikutan keadaan
pasaran yang buruk telah menjejaskan pasaran ekuiti Malaysia. Sentimen pasaran
terjejas akibat perang perdagangan antara Amerika Syarikat (“AS”)-China, dan juga
keputusan pasca Pilihan Raya Umum Ke-14 Malaysia memberi kesan negatif terhadap
prestasi dana dalam tempoh tersebut.
Penanda aras terpilih prestasi Dana adalah nisbah 70:30 Indeks FBM KLCI dan MSCI
All Countries World Index.
Setakat pada 31 Mei 2018, Dana mempunyai pendedahan sebanyak 66.88% dalam
pasaran ekuiti Malaysia, 28.55% dalam ekuiti pasaran asing dan 3.52% dalam
instrumen pasaran wang dan pegangan tunai. Jumlah Nilai Aset Bersih (“NAB”) Dana
adalah RM21.3 juta yang terdiri daripada empat kelas matawang iaitu Ringgit Malaysia,
Dollar Amerika, Dollar Singapura and Euro.
Bagi tempoh kewangan dalam kajian, tiada perubahan ketara berlaku terhadap hal
ehwal Dana dan tiada keadaan yang boleh mempengaruhi secara langsung
kepentingan para Pemegang Unit sehinggalah tarikh penyediaan Laporan Pengurus
ini.
1.2.2 Jumlah Pulangan dan Purata Jumlah Pulangan bagi tempoh kewangan 9 Mac
2017 sehingga 31 Mei 2018
Tempoh
BIMB-Arabesque Malaysia
Shariah-ESG Equity Fund Penanda Aras
Jumlah Pulangan
(%)
Purata
Jumlah Pulangan
(%)
Jumlah Pulangan
(%)
Purata
Jumlah Pulangan
(%)
Sejak Pelancaran
(9 Mac „17 – 31 Mei „18) -0.44 -0.44 2.63 2.63
1.2.3 Jumlah Pulangan Tahunan Bagi Tahun Kewangan Yang Lalu
Tahun Kewangan
Jumlah Pulangan
BIMB-Arabesque Malaysia Shariah-ESG
Equity Fund (%)
BIMB-Arabesque Malaysia Shariah-ESG
Equity Fund (%)
31 Mei 2018 -0.44 2.63
17
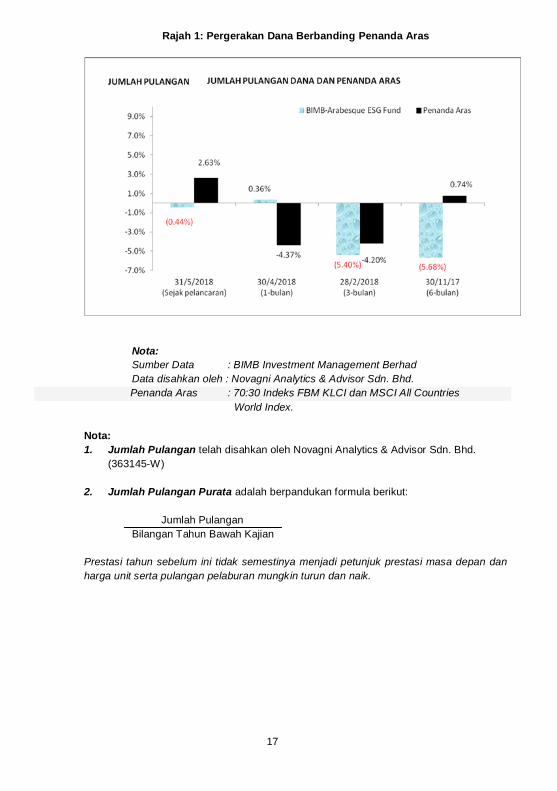
Rajah 1: Pergerakan Dana Berbanding Penanda Aras
Nota:
Sumber Data : BIMB Investment Management Berhad
Data disahkan oleh : Novagni Analytics & Advisor Sdn. Bhd.
Penanda Aras : 70:30 Indeks FBM KLCI dan MSCI All Countries
World Index.
Nota:
1. Jumlah Pulangan telah disahkan oleh Novagni Analytics & Advisor Sdn. Bhd.
(363145-W)
2. Jumlah Pulangan Purata adalah berpandukan formula berikut:
Jumlah Pulangan
Bilangan Tahun Bawah Kajian
Prestasi tahun sebelum ini tidak semestinya menjadi petunjuk prestasi masa depan dan
harga unit serta pulangan pelaburan mungkin turun dan naik.
18
1.3 Ekonomi dan Kajian Pasaran
Ekonomi
a) Global
Keluaran Dalam Negeri Kasar (KDNK) AS meningkat sebanyak 2.3% pada suku
pertama 2018 berbanding 2.9% pada suku keempat 2017 dan 1.2% pada suku
pertama 2017. Keputusan suku pertama yang lemah adalah disebabkan oleh
tahap perbelanjaan pengguna yang lebih perlahan dan pelaburan kediaman tetap
yang lebih rendah. Kadar inflasi AS berada pada paras 2.8% pada Mei 2018
berbanding 2.4% pada Mac 2017. Kadar pengangguran AS terus bertambah baik
kepada 3.8% pada bulan Mei 2018 berbanding 4.5% pada Mac 2017.
Ekonomi zon Euro meningkat 0.4% pada suku pertama 2018 berbanding 0.7%
pada suku keempat 2017 dan suku ketiga 2017. Pertumbuhan yang lebih lemah
pada suku tahun ini disebabkan oleh eksport yang lebih rendah dan perbelanjaan
kerajaan yang berkurangan. Kadar inflasi zon Euro berada pada 1.9% pada Mei
2018 dan lebih tinggi berbanding 1.5% pada Mac 2017. Pengangguran di zon
Euro berkurangan kepada 8.4% pada Mei 2018 daripada 9.4% pada Mac 2017.
Ekonomi China berkembang 6.8% pada suku pertama 2018, tidak berubah
berbanding suku keempat 2017 dan suku ketiga 2017. Sepanjang suku pertama
tahun 2018, prestasi KDNK disokong oleh permintaan pengguna yang kukuh
berikutan pertumbuhan gaji yang tinggi di kawasan bandar dan kepesatan
pasaran pelaburan hartanah.
(Sumber: Bloomberg, Eurostats, RHB Investment Bank dan Maybank Investment Bank)
19
b) Dalam Negara
Ekonomi Malaysia berkembang pada kadar 5.4% pada suku pertama 2018
berbanding 5.9% pada suku keempat 2017 dan juga 6.2% pada suku ketiga 2017.
KDNK bagi tempoh itu mewakili kadar pertumbuhan paling lemah sejak suku
keempat 2016, apabila penggunaan swasta, pelaburan, eksport, dan perbelanjaan
kerajaan meningkat pada kadar yang lebih perlahan.
Bank Negara Malaysia memutuskan untuk mengekalkan Kadar Dasar
Semalaman (OPR) pada 3.25% dalam mesyuarat Jawatankuasa Dasar Monetari
(MPC) pada 10 Mei 2018. Tahap sokongan kewangan adalah konsisten dengan
dasar memastikan ekonomi domestik terus berada pada landasan pertumbuhan
yang stabil di tengah-tengah inflasi lebih rendah. Rizab antarabangsa Bank
Negara Malaysia berjumlah AS$108.5 bilion pada 31 Mei 2018. Kedudukan rizab
ini mencukupi untuk membiayai 7.6 bulan import tertangguh dan 1.1 kali hutang
jangka pendek luar negeri.
(Sumber: Bloomberg, Jabatan Perangkaan Malaysia dan Bank Negara Malaysia)
Kajian Pasaran
Ekuiti
Indeks Syariah Emas FTSE Bursa Malaysia ("FBM Syariah") memasuki tempoh kajian
pada 9 Mac 2017 pada paras 12,550.40 mata dan meningkat ke paras tertinggi
13,898.17 mata pada 9 Januari 2018 sebelum jatuh ke paras terendah 11,963.99 pada
30 Mei 2018 dan mengakhiri tahun kajian di paras 12,026.14 mata pada 30 Mei 2018
iaitu pada hari yang sama. Bagi tahun dalam kajian, FBM Syariah jatuh sebanyak
524.26 mata atau 4.14%. Antara faktor utama yang menyumbang kepada pergerakan
indeks ini adalah seperti berikut:
Pada Ogos 2017, pertikaian antara Korea Utara dan AS mencapai ke tahap
kemuncak yang baharu selepas ujian peluru berpandu Korea Utara mendorong
Presiden Trump untuk mengeluarkan amaran untuk bertindak balas. Pada bulan
yang sama, Rizab Persekutuan merancang mengurangkan sebanyak 50 peratus
atau AS$3.6 trilion daripada jumlah program kuantitatif dalam tempoh tiga tahun.
Pada Februari 2018, Jabatan Perdagangan AS mencadangkan tarif yang tinggi
dikenakan terhadap keluli dan aluminium keluaran asing apabila import barangan
ini diisytiharkan mengancam keselamatan negara itu. Sekatan perdagangan
antara AS dan China mempunyai potensi untuk memburukkan lagi kemelut
perdagangan dunia dan menjejaskan momentum pemulihan ekonomi sejagat.
Pada Mac 2018, Rizab Persekutuan AS menaikkan julat sasaran bagi kadar dana
persekutuan sebanyak satu suku mata daripada 1.5% hingga 1.75% sejajar
dengan jangkaan pasaran bahawa prospek ekonomi AS semakin kukuh dalam
beberapa bulan kebelakangan ini.
(Sumber: Bloomberg dan Bank Negara Malaysia)
20
1.4 Tinjauan Pasaran dan Strategi
Ekuiti
Dana menggunakan pendekatan kuantitatif. Memandangkan strategi Dana
berasaskan kuantitatif dan momentum, Pengurus tidak menguruskan Dana
berdasarkan analisis makro, pandangan dan jangkaan prospek. Dana melabur
melalui proses pelaburan bagi sekuriti-sekuriti Malaysia dan asing, berasaskan
peraturan-peraturan tertentu yang akan disusun semula/ diniagakan secara
bulanan.
21
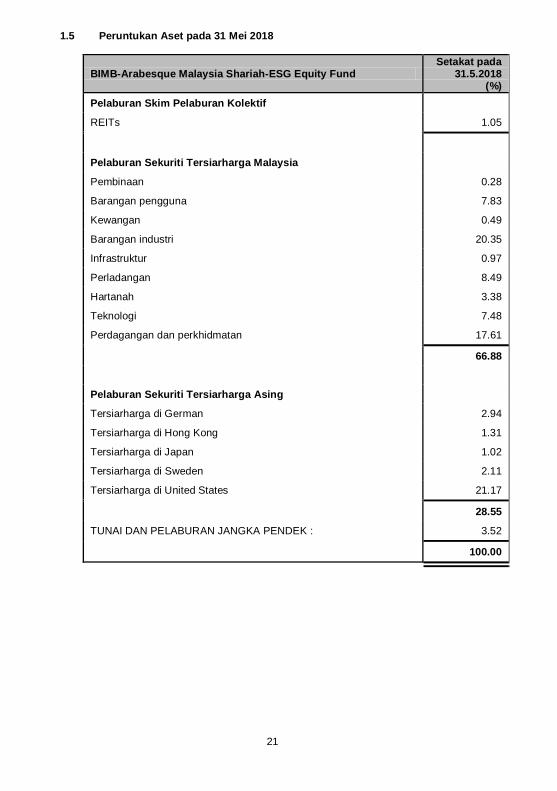
1.5 Peruntukan Aset pada 31 Mei 2018
BIMB-Arabesque Malaysia Shariah-ESG Equity Fund Setakat pada
31.5.2018 (%)
Pelaburan Skim Pelaburan Kolektif
REITs 1.05
Pelaburan Sekuriti Tersiarharga Malaysia
Pembinaan 0.28
Barangan pengguna 7.83
Kewangan 0.49
Barangan industri 20.35
Infrastruktur 0.97
Perladangan 8.49
Hartanah 3.38
Teknologi 7.48
Perdagangan dan perkhidmatan 17.61
66.88
Pelaburan Sekuriti Tersiarharga Asing
Tersiarharga di German 2.94
Tersiarharga di Hong Kong 1.31
Tersiarharga di Japan 1.02
Tersiarharga di Sweden 2.11
Tersiarharga di United States 21.17
28.55
TUNAI DAN PELABURAN JANGKA PENDEK : 3.52
100.00
22
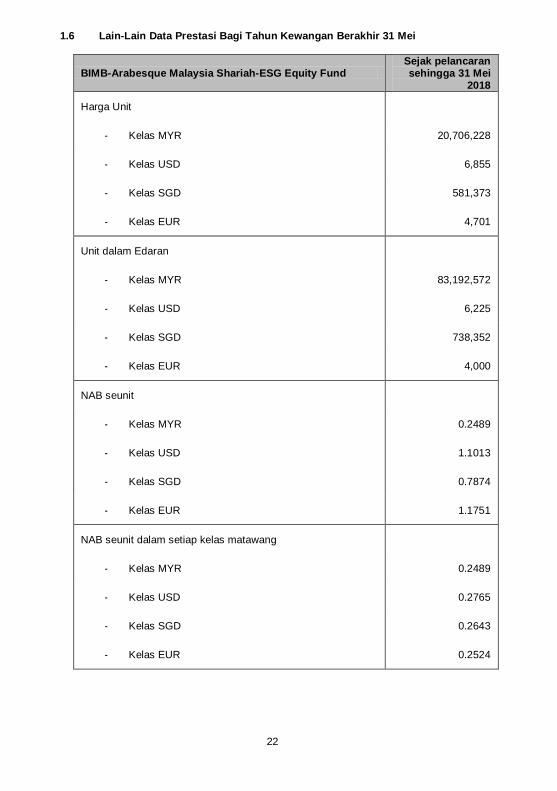
1.6 Lain-Lain Data Prestasi Bagi Tahun Kewangan Berakhir 31 Mei
BIMB-Arabesque Malaysia Shariah-ESG Equity Fund Sejak pelancaran sehingga 31 Mei
2018
Harga Unit
- Kelas MYR 20,706,228
- Kelas USD 6,855
- Kelas SGD 581,373
- Kelas EUR 4,701
Unit dalam Edaran
- Kelas MYR 83,192,572
- Kelas USD 6,225
- Kelas SGD 738,352
- Kelas EUR 4,000
NAB seunit
- Kelas MYR 0.2489
- Kelas USD 1.1013
- Kelas SGD 0.7874
- Kelas EUR 1.1751
NAB seunit dalam setiap kelas matawang
- Kelas MYR 0.2489
- Kelas USD 0.2765
- Kelas SGD 0.2643
- Kelas EUR 0.2524
23
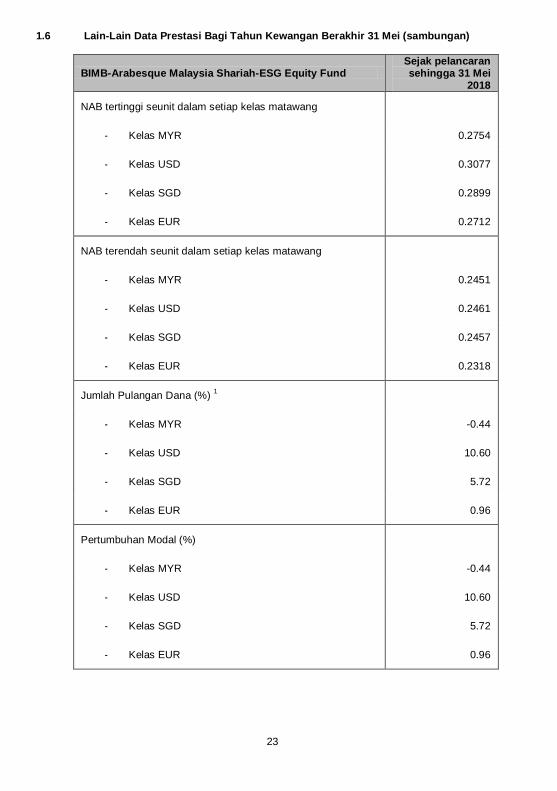
1.6 Lain-Lain Data Prestasi Bagi Tahun Kewangan Berakhir 31 Mei (sambungan)
BIMB-Arabesque Malaysia Shariah-ESG Equity Fund Sejak pelancaran sehingga 31 Mei
2018
NAB tertinggi seunit dalam setiap kelas matawang
- Kelas MYR 0.2754
- Kelas USD 0.3077
- Kelas SGD 0.2899
- Kelas EUR 0.2712
NAB terendah seunit dalam setiap kelas matawang
- Kelas MYR 0.2451
- Kelas USD 0.2461
- Kelas SGD 0.2457
- Kelas EUR 0.2318
Jumlah Pulangan Dana (%) 1
- Kelas MYR -0.44
- Kelas USD 10.60
- Kelas SGD 5.72
- Kelas EUR 0.96
Pertumbuhan Modal (%)
- Kelas MYR -0.44
- Kelas USD 10.60
- Kelas SGD 5.72
- Kelas EUR 0.96
24
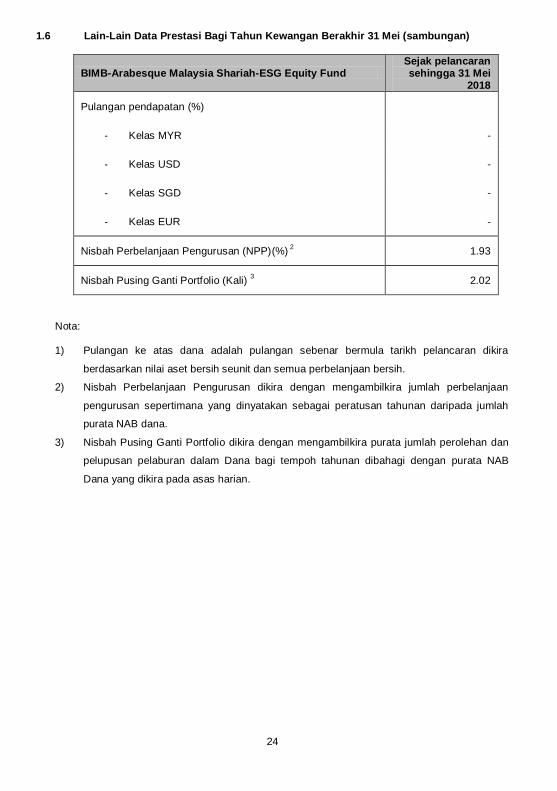
1.6 Lain-Lain Data Prestasi Bagi Tahun Kewangan Berakhir 31 Mei (sambungan)
BIMB-Arabesque Malaysia Shariah-ESG Equity Fund Sejak pelancaran sehingga 31 Mei
2018
Pulangan pendapatan (%)
- Kelas MYR -
- Kelas USD -
- Kelas SGD -
- Kelas EUR -
Nisbah Perbelanjaan Pengurusan (NPP)(%) 2
1.93
Nisbah Pusing Ganti Portfolio (Kali) 3 2.02
Nota:
1) Pulangan ke atas dana adalah pulangan sebenar bermula tarikh pelancaran dikira
berdasarkan nilai aset bersih seunit dan semua perbelanjaan bersih.
2) Nisbah Perbelanjaan Pengurusan dikira dengan mengambilkira jumlah perbelanjaan
pengurusan sepertimana yang dinyatakan sebagai peratusan tahunan daripada jumlah
purata NAB dana.
3) Nisbah Pusing Ganti Portfolio dikira dengan mengambilkira purata jumlah perolehan dan
pelupusan pelaburan dalam Dana bagi tempoh tahunan dibahagi dengan purata NAB
Dana yang dikira pada asas harian.
25
1.7 Pegangan Unit pada 31 Mei 2018
Saiz Dipegang
BIMB-Arabesque Malaysia Shariah-ESG Equity Fund
(Kelas MYR)
Bilangan Pemegang Unit Jumlah Pegangan Unit
Bilangan % Bilangan %
5,000 dan ke bawah 66 50.00 179,789.70 0.22
5,001 hingga 10,000 10 7.57 73,814.38 0.09
10,001 hingga 50,000 38 28.79 869,447.18 1.04
50,001 hingga 500,000 14 10.61 2,226,971.06 2.68
500,001 dan ke atas* 4 3.03 79,842,549.35 95.97
Unit yang dipegang oleh Pemegang Unit
132 100.00 83,192,571.67 100.00
Unit yang dipegang oleh Pengurus
0 0 0 0
Jumlah Keseluruhan bagi Dana
132 100.00 83,192,571.67 100.00
Saiz Dipegang
BIMB-Arabesque Malaysia Shariah-ESG Equity Fund (Kelas USD)
Bilangan Pemegang Unit Jumlah Pegangan Unit
Bilangan % Bilangan %
5,000 dan ke bawah 1 50.00 2,224.70 35.74
5,001 hingga 10,000 0 0.00 0.00 0.00
10,001 hingga 50,000 0 0.00 0.00 0.00
50,001 hingga 500,000 0 0.00 0.00 0.00
500,001 dan ke atas* 0 0.00 0.00 0.00
Unit yang dipegang oleh Pemegang Unit
1 50.00 2,224.70 35.74
Unit yang dipegang oleh Pengurus
1 50.00 4,000.00 64.26
Jumlah Keseluruhan bagi Dana
2 100.00 6,224.70 100.00
26
1.7 Pegangan Unit pada 31 Mei 2018 (sambungan)
Saiz Dipegang
BIMB-Arabesque Malaysia Shariah-ESG Equity Fund
(Kelas SGD)
Bilangan Pemegang Unit Jumlah Pegangan Unit
Bilangan % Bilangan %
5,000 dan ke bawah 0 0.00 0.00 0.00
5,001 hingga 10,000 1 50.00 6,118.79 0.83
10,001 hingga 50,000 0 0.00 0.00 0.00
50,001 hingga 500,000 0 0.00 0.00 0.00
500,001 dan ke atas* 1 50.00 732,232.94 99.17
Unit yang dipegang oleh Pemegang Unit
2 100.00 738,351.73 100.00
Unit yang dipegang oleh Pengurus
0 0.00 0.00 0.00
Jumlah Keseluruhan bagi Dana
2 100.00 738,351.73 100.00
Saiz Dipegang
BIMB-Arabesque Malaysia Shariah-ESG Equity Fund (Kelas EUR)
Bilangan Pemegang Unit Jumlah Pegangan Unit
Bilangan % Bilangan %
5,000 dan ke bawah 0 0.00 0 0.00
5,001 hingga 10,000 0 0.00 0 0.00
10,001 hingga 50,000 0 0.00 0 0.00
50,001 hingga 500,000 0 0.00 0 0.00
500,001 dan ke atas* 0 0.00 0 0.00 Unit yang dipegang oleh Pemegang Unit
0 0.00 0 0.00
Unit yang dipegang oleh Pengurus
1 100.00 4,000 100.00
Jumlah Keseluruhan bagi Dana
1 100.00 4,000 100.00
*Akaun Penama juga termasuk di bawah kategori ini.
27
1.8 Polisi Rebat dan Komisyen Bukan Tunai
Sebarang rebat broker saham yang diterima oleh Pengurus akan dimasukkan secara
terus ke dalam akaun Dana. Apa-apa komisyen bukan tunai yang diterima daripada
broker dalam bentuk perkhidmatan penyelidikan dan nasihat yang membantu dalam
proses membuat keputusan yang berkaitan dengan pelaburan Dana boleh disimpan
oleh Pengurus.
Pengurus tidak menerima sebarang rebat dan komisyen bukan tunai daripada broker bagi tempoh kewangan.
Bagi dan bagi pihak
Pengurus
BIMB INVESTMENT MANAGEMENT BERHAD
Tarikh: 30 Julai 2018
Nota:
Laporan ini telah diterjemahkan daripada laporan asal (dalam Bahasa Inggeris). Jika
terdapat perbezaan, sila rujuk kepada laporan Bahasa Inggeris.
28
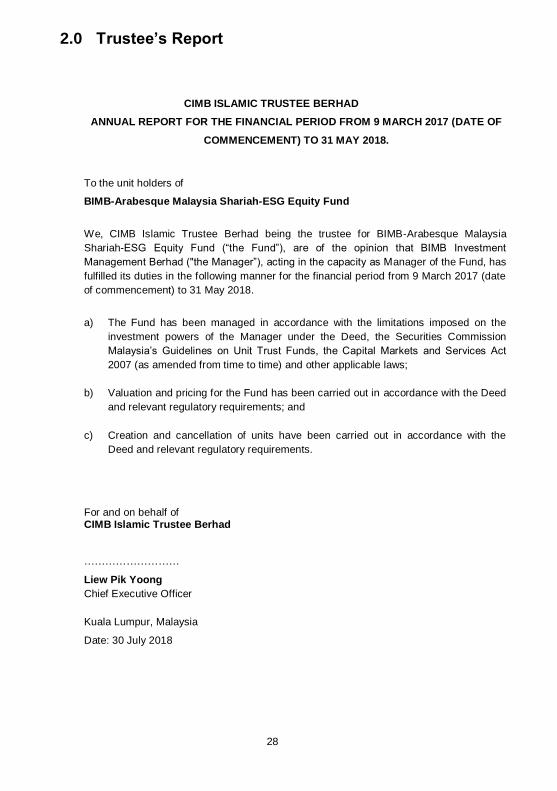
2.0 Trustee’s Report
CIMB ISLAMIC TRUSTEE BERHAD
ANNUAL REPORT FOR THE FINANCIAL PERIOD FROM 9 MARCH 2017 (DATE OF
COMMENCEMENT) TO 31 MAY 2018.
To the unit holders of
BIMB-Arabesque Malaysia Shariah-ESG Equity Fund
We, CIMB Islamic Trustee Berhad being the trustee for BIMB-Arabesque Malaysia
Shariah-ESG Equity Fund (“the Fund”), are of the opinion that BIMB Investment
Management Berhad ("the Manager”), acting in the capacity as Manager of the Fund, has
fulfilled its duties in the following manner for the financial period from 9 March 2017 (date
of commencement) to 31 May 2018.
a) The Fund has been managed in accordance with the limitations imposed on the
investment powers of the Manager under the Deed, the Securities Commission
Malaysia‟s Guidelines on Unit Trust Funds, the Capital Markets and Services Act
2007 (as amended from time to time) and other applicable laws;
b) Valuation and pricing for the Fund has been carried out in accordance with the Deed
and relevant regulatory requirements; and
c) Creation and cancellation of units have been carried out in accordance with the
Deed and relevant regulatory requirements.
For and on behalf of CIMB Islamic Trustee Berhad
………………………
Liew Pik Yoong
Chief Executive Officer
Kuala Lumpur, Malaysia
Date: 30 July 2018
29
3.0 Shariah Committee’s Report
ANNUAL REPORT FOR THE FINANCIAL PERIOD FROM 9 MARCH 2017 (DATE OF
COMMENCEMENT) TO 31 MAY 2018.
حيم ن ٱلر ـ حم بسم ٱهلل ٱلر
To the Unit Holders of
BIMB-Arabesque Malaysia Shariah-ESG Equity Fund (“BMSEF”)
We have acted as the Shariah Committee of BIMB-Arabesque Malaysia Shariah-ESG
Equity Fund.
Our responsibilities are to ensure that the procedures and processes employed by BIMB
Investment Management Berhad and that the provisions of the Deed dated 10 November
2016 are in accordance with Shariah principles.
In our opinion, BIMB Investment Management Berhad has managed BIMB-Arabesque
Malaysia Shariah-ESG Equity Fund in accordance with Shariah principles and complied
with applicable guidelines, rulings or decisions issued by the Securities Commission
pertaining to Shariah matters for the financial period from 9 March 2017 (date of
commencement) to 31 May 2018.
In addition, we also confirm that the investment portfolio of BIMB-Arabesque Malaysia
Shariah-ESG Equity Fund comprise of Shariah-compliant securities which have been
screened and passed the methodologies adopted by the Shariah Advisory Council (SAC)
of the Securities Commission and the Accounting and Auditing Organization for Islamic
Finance Institutions (AAOIFI), as the case may be and that all deposits and money
market instruments placed by the Fund are Shariah-compliant.
أعلم وهللا
For and on behalf of the Shariah Committee
………………………………………………..
USTAZ DR. AHMAD SHAHBARI@SOBRI SALAMON
(Chairman)
………………………………………………..
USTAZ DR. YUSOF RAMLI
(Committee Member)
………………………………………………..
USTAZAH DR. ASMAK AB. RAHMAN
(Committee Member)
Date: 30 July 2018
30
4.0 Directors’ Declaration
ANNUAL REPORT FOR THE FINANCIAL PERIOD FROM 9 MARCH 2017 (DATE OF
COMMENCEMENT) TO 31 MAY 2018.
To the Unit Holders of
BIMB-Arabesque Malaysia Shariah-ESG Equity Fund
We, Dato‟ Ghazali Bin Awang and Najmuddin Bin Mohd Lutfi, being two of the directors of
the Manager, BIMB Investment Management Berhad, for BIMB-Arabesque Malaysia
Shariah-ESG Equity Fund do hereby state that in our opinion, the accompanying
Statement of Financial Position, Statement of Profit or Loss and Other Comprehensive
Income, Statement of Changes in Net Asset Value and Statement of Cash Flows are
drawn up so as to give a true and fair view of the Statement of Financial Position of the
Fund as at 31 May 2018 and Statement of Profit or Loss and Other Comprehensive
Income, Statement of Changes in Net Asset Value and Statement of Cash Flows for the
period ended on that date.
For and on behalf on the Board of Directors,
……………………………………………
Dato’ Ghazali Bin Awang
(Non-Executive Independent Director)
…………………………………………..
Najmuddin Bin Mohd Lutfi
(Chief Executive Officer)
Date: 30 July 2018
31
5.0 Independent Auditors’ Report
(Established in Malaysia)
Report on the Audit of the Financial Statements Opinion
We have audited the financial statements of BIMB-Arabesque Malaysia Shariah-ESG
Equity Fund (“BMSEF”) (“the Fund”), which comprise the statement of financial position
as at 31 May 2018, and the statement of profit or loss and other comprehensive income,
statement of changes in net asset value and cash flows for the year then ended, and
notes to the financial statements, including a summary of significant accounting policies,
as set out on pages 34 to 60.
In our opinion, the accompanying financial statements give a true and fair view of the
financial position of the Fund as at 31 May 2018, and of its financial performance and its
cash flows for the year then ended in accordance with Malaysian Financial Reporting
Standards, International Financial Reporting Standards and Securities Commiss ion‟s
Guidelines on Unit Trust Funds in Malaysia.
Basis for Opinion
We conducted our audit in accordance with approved standards on auditing in Malaysia
and International Standards on Auditing. Our responsibilities under those standards are
further described in the Auditors‟ Responsibilities for the Audit of the Financial
Statements section of our report. We believe that the audit evidence we have obtained
is sufficient and appropriate to provide a basis for our opinion.
Independence and Other Ethical Responsibilities
We are independent of the Fund in accordance with the By-Laws (on Professional
Ethics, Conduct and Practice) of the Malaysian Institute of Accountants (“By-Laws”) and
the International Ethics Standards Board for Accountants‟ Code of Ethics for
Professional Accountants (“IESBA Code”), and we have fulfilled our other ethical
responsibilities in accordance with the By-Laws and the IESBA Code.
Information Other than the Financial Statements and Auditors’ Report Thereon
The Manager of the Fund is responsible for the other information. The other information
comprises the information included in the annual report, but does not include the
financial statements of the Fund and our auditors‟ report thereon.
Our opinion on the financial statements of the Fund does not cover the annual report
and we do not express any form of assurance conclusion thereon.
In connection with our audit of the financial statements of the Fund, our responsibility is
to read the annual report and, in doing so, consider whether annual report is materially
inconsistent with the financial statements of the Fund or our knowledge obtained in the
audit or otherwise appears to be materially misstated.
32
Information Other than the Financial Statements and Auditors’ Report Thereon
(continued)
If, based on the work we have performed, we conclude that there is a material
misstatement of the annual report, we are required to report that fact. We have nothing
to report in this regard.
Responsibilities of the Manager and Trustee for the Financial Statements
The Manager of the Fund is responsible for the preparation of financial statements of the
Fund that give a true and fair view in accordance with Malaysian Financial Reporting
Standards, International Financial Reporting Standards and Securities Commission‟s
Guidelines on Unit Trust Funds in Malaysia. The Manager is also responsible for such
internal control as the Manager determine is necessary to enable the preparation of
financial statements of the Fund that are free from material misstatement, whether due
to fraud or error.
In preparing the financial statements of the Fund, the Manager is responsible for
assessing the ability of the Fund to continue as a going concern, disclosing, as
applicable, matters related to going concern and using the going concern basis of
accounting unless the Manager either intend to liquidate the Fund or to cease
operations, or have no realistic alternative but to do so.
The Trustee is responsible for ensuring that the Manager maintains proper accounting
and other records as necessary to enable true and fair presentations of these financial
statements.
Auditors’ Responsibilities for the Audit of the Financial Statements
Our objectives are to obtain reasonable assurance about whether the financial
statements of the Fund as a whole are free from material misstatement, whether due to
fraud or error, and to issue an auditors‟ report that includes our opinion. Reasonable
assurance is a high level of assurance, but is not a guarantee that an audit conducted in
accordance with approved standards on auditing in Malaysia and International
Standards on Auditing will always detect a material misstatement when it exists.
Misstatements can arise from fraud or error and are considered material if, individually
or in the aggregate, they could reasonably be expected to influence the economic
decisions of users taken on the basis of these financial statements.
As part of an audit conducted in accordance with approved standards on auditing in
Malaysia and International Standards on Auditing, we exercise professional judgement
and maintain professional scepticism throughout the audit. We also:
Identify and assess the risk of material misstatement of the financial statements of
the Fund, whether due to fraud or error, design and perform audit procedures
responsive to those risks, and obtain audit evidence that is sufficient and appropriate
to provide a basis for our opinion. The risk of not detecting a material misstatement
resulting from fraud is higher than for one resulting from error, as fraud may involve
collusion, forgery, intentional omissions, misrepresentations, or the override of
internal control.
33
Auditors’ Responsibilities for the Audit of the Financial Statements (continued)
Obtain an understanding of internal control relevant to the audit in order to design
audit procedures that are appropriate in the circumstances, but not for the purpose
of expressing an opinion on the effectiveness of the Fund‟s internal control.
Evaluate the appropriateness of accounting policies used and the reasonableness of
accounting estimates and related disclosures made by the Manager.
Conclude on the appropriateness of the Manager‟s use of the going concern basis of
accounting and, based on the audit evidence obtained, whether a material
uncertainty exists related to events or conditions that may cast significant doubt on
the ability of the Fund to continue as a going concern. If we conclude that a material
uncertainty exists, we are required to draw attention in our auditors‟ report to the
related disclosures in the financial statements of the Fund or, if such disclosures are
inadequate, to modify our opinion. Our conclusions are based on the audit evidence
obtained up to the date of our auditors‟ report. However, future events or conditions
may cause the Fund to cease to continue as a going concern.
Evaluate the overall presentation, structure and content of the financial statements
of the Fund, including the disclosures, and whether the financial statements of the
Fund represents the underlying transactions and events in a manner that gives a
true and fair view.
We communicate with the Manager regarding, among other matters, the planned scope
and timing of the audit and significant audit findings, including any significant
deficiencies in internal control that we identify during our audit.
Other matter
This report is made solely to the members of the Fund, as a body, in accordance with
Securities Commission‟s Guidelines on Unit Trust Funds in Malaysia and for no other
purpose. We do not assume responsibility to any other person for the content of this
report.
KPMG Desa Megat PLT
(LLP0010082-LCA & AF 0759)
Chartered Accountant
Adrian Lee Lye Wang
Approval Number: 02679/11/2019 J
Chartered Accountants
Petaling Jaya, Selangor
Date: 30 July 2018
34
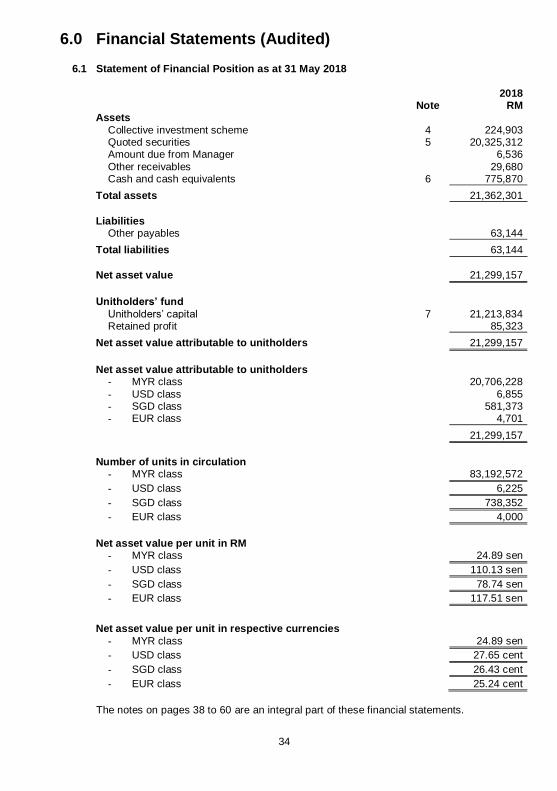
6.0 Financial Statements (Audited)
6.1 Statement of Financial Position as at 31 May 2018
2018 Note RM Assets
Collective investment scheme 4 224,903 Quoted securities 5 20,325,312
Amount due from Manager 6,536
Other receivables 29,680 Cash and cash equivalents 6 775,870
Total assets 21,362,301
Liabilities Other payables 63,144
Total liabilities 63,144
Net asset value 21,299,157
Unitholders’ fund
Unitholders‟ capital 7 21,213,834 Retained profit 85,323
Net asset value attributable to unitholders 21,299,157
Net asset value attributable to unitholders
- MYR class 20,706,228
- USD class 6,855 - SGD class 581,373 - EUR class 4,701
21,299,157
Number of units in circulation
- MYR class 83,192,572
- USD class 6,225
- SGD class 738,352
- EUR class 4,000
Net asset value per unit in RM
- MYR class 24.89 sen
- USD class 110.13 sen
- SGD class 78.74 sen
- EUR class 117.51 sen
Net asset value per unit in respective currencies
- MYR class 24.89 sen
- USD class 27.65 cent
- SGD class 26.43 cent
- EUR class 25.24 cent
The notes on pages 38 to 60 are an integral part of these financial statements.
35
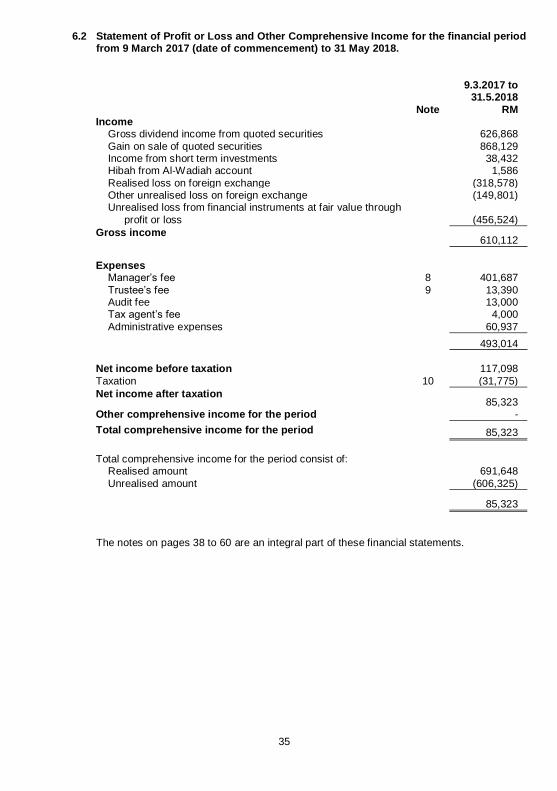
6.2 Statement of Profit or Loss and Other Comprehensive Income for the financial period from 9 March 2017 (date of commencement) to 31 May 2018.
9.3.2017 to
31.5.2018
Note RM Income Gross dividend income from quoted securities 626,868
Gain on sale of quoted securities 868,129 Income from short term investments 38,432 Hibah from Al-Wadiah account 1,586
Realised loss on foreign exchange (318,578) Other unrealised loss on foreign exchange (149,801) Unrealised loss from financial instruments at fair value through
profit or loss
(456,524)
Gross income 610,112
Expenses Manager‟s fee 8 401,687
Trustee‟s fee 9 13,390 Audit fee 13,000 Tax agent‟s fee 4,000
Administrative expenses 60,937
493,014
Net income before taxation 117,098
Taxation 10 (31,775)
Net income after taxation 85,323
Other comprehensive income for the period -
Total comprehensive income for the period 85,323
Total comprehensive income for the period consist of: Realised amount 691,648
Unrealised amount (606,325)
85,323
The notes on pages 38 to 60 are an integral part of these financial statements.
36
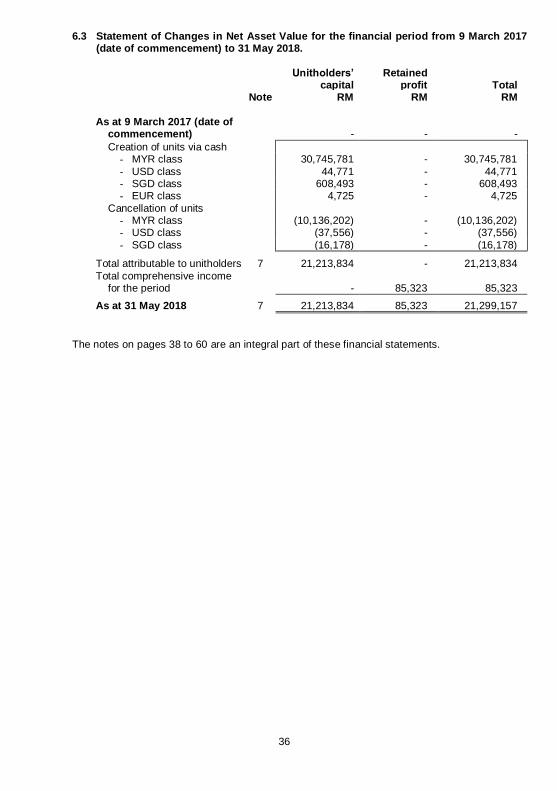
6.3 Statement of Changes in Net Asset Value for the financial period from 9 March 2017 (date of commencement) to 31 May 2018.
Unitholders’ capital
Retained profit
Total
Note RM RM RM
As at 9 March 2017 (date of commencement)
- - -
Creation of units via cash - MYR class 30,745,781 - 30,745,781
- USD class 44,771 - 44,771 - SGD class 608,493 - 608,493 - EUR class 4,725 - 4,725
Cancellation of units - MYR class (10,136,202) - (10,136,202) - USD class (37,556) - (37,556)
- SGD class (16,178) - (16,178)
Total attributable to unitholders 7 21,213,834 - 21,213,834
Total comprehensive income for the period
- 85,323 85,323
As at 31 May 2018 7 21,213,834 85,323 21,299,157
The notes on pages 38 to 60 are an integral part of these financial statements.
37
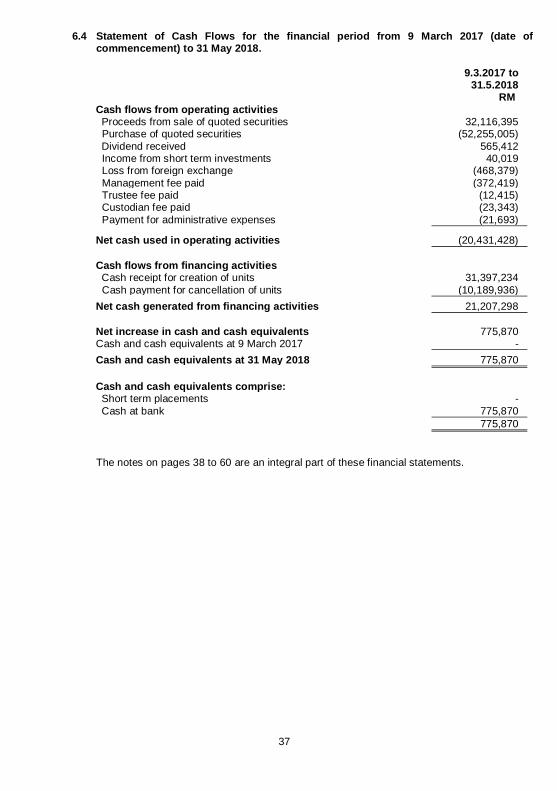
6.4 Statement of Cash Flows for the financial period from 9 March 2017 (date of commencement) to 31 May 2018.
9.3.2017 to 31.5.2018
RM
Cash flows from operating activities Proceeds from sale of quoted securities 32,116,395 Purchase of quoted securities (52,255,005)
Dividend received 565,412 Income from short term investments 40,019 Loss from foreign exchange (468,379)
Management fee paid (372,419) Trustee fee paid (12,415) Custodian fee paid (23,343)
Payment for administrative expenses (21,693)
Net cash used in operating activities (20,431,428)
Cash flows from financing activities Cash receipt for creation of units 31,397,234
Cash payment for cancellation of units (10,189,936)
Net cash generated from financing activities 21,207,298
Net increase in cash and cash equivalents 775,870 Cash and cash equivalents at 9 March 2017 -
Cash and cash equivalents at 31 May 2018 775,870
Cash and cash equivalents comprise: Short term placements -
Cash at bank 775,870
775,870
The notes on pages 38 to 60 are an integral part of these financial statements.
38
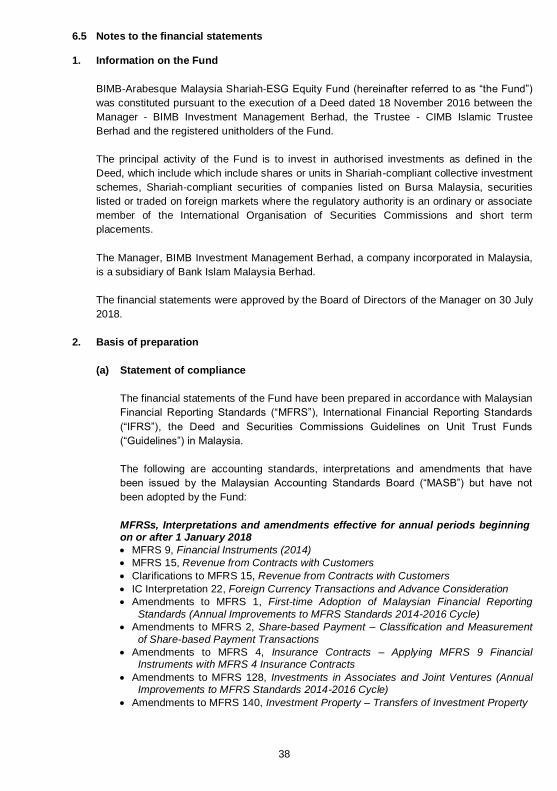
6.5 Notes to the financial statements
1. Information on the Fund
BIMB-Arabesque Malaysia Shariah-ESG Equity Fund (hereinafter referred to as “the Fund”)
was constituted pursuant to the execution of a Deed dated 18 November 2016 between the
Manager - BIMB Investment Management Berhad, the Trustee - CIMB Islamic Trustee
Berhad and the registered unitholders of the Fund.
The principal activity of the Fund is to invest in authorised investments as defined in the
Deed, which include which include shares or units in Shariah-compliant collective investment
schemes, Shariah-compliant securities of companies listed on Bursa Malaysia, securities
listed or traded on foreign markets where the regulatory authority is an ordinary or associate
member of the International Organisation of Securities Commissions and short term
placements.
The Manager, BIMB Investment Management Berhad, a company incorporated in Malaysia,
is a subsidiary of Bank Islam Malaysia Berhad.
The financial statements were approved by the Board of Directors of the Manager on 30 July
2018.
2. Basis of preparation
(a) Statement of compliance
The financial statements of the Fund have been prepared in accordance with Malaysian
Financial Reporting Standards (“MFRS”), International Financial Reporting Standards
(“IFRS”), the Deed and Securities Commissions Guidelines on Unit Trust Funds
(“Guidelines”) in Malaysia.
The following are accounting standards, interpretations and amendments that have
been issued by the Malaysian Accounting Standards Board (“MASB”) but have not
been adopted by the Fund:
MFRSs, Interpretations and amendments effective for annual periods beginning on or after 1 January 2018
MFRS 9, Financial Instruments (2014)
MFRS 15, Revenue from Contracts with Customers
Clarifications to MFRS 15, Revenue from Contracts with Customers
IC Interpretation 22, Foreign Currency Transactions and Advance Consideration
Amendments to MFRS 1, First-time Adoption of Malaysian Financial Reporting
Standards (Annual Improvements to MFRS Standards 2014-2016 Cycle)
Amendments to MFRS 2, Share-based Payment – Classification and Measurement
of Share-based Payment Transactions
Amendments to MFRS 4, Insurance Contracts – Applying MFRS 9 Financial Instruments with MFRS 4 Insurance Contracts
Amendments to MFRS 128, Investments in Associates and Joint Ventures (Annual Improvements to MFRS Standards 2014-2016 Cycle)
Amendments to MFRS 140, Investment Property – Transfers of Investment Property
39
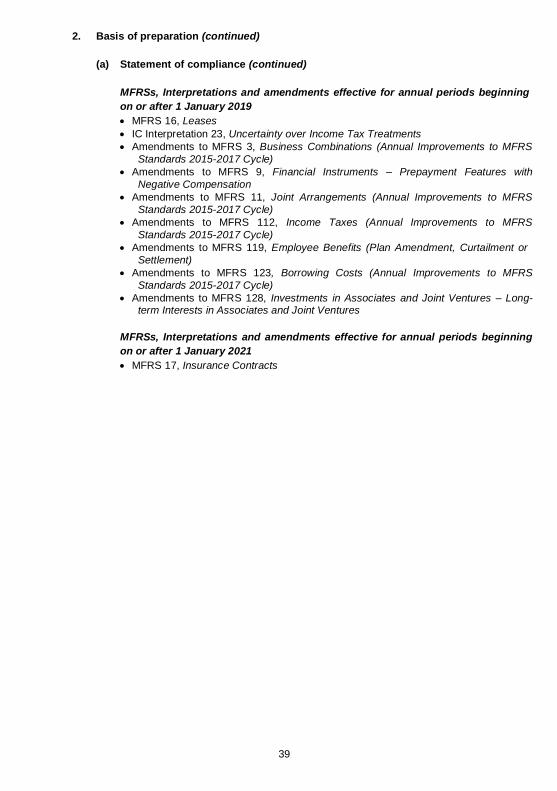
2. Basis of preparation (continued)
(a) Statement of compliance (continued)
MFRSs, Interpretations and amendments effective for annual periods beginning
on or after 1 January 2019
MFRS 16, Leases
IC Interpretation 23, Uncertainty over Income Tax Treatments
Amendments to MFRS 3, Business Combinations (Annual Improvements to MFRS
Standards 2015-2017 Cycle)
Amendments to MFRS 9, Financial Instruments – Prepayment Features with
Negative Compensation
Amendments to MFRS 11, Joint Arrangements (Annual Improvements to MFRS
Standards 2015-2017 Cycle)
Amendments to MFRS 112, Income Taxes (Annual Improvements to MFRS
Standards 2015-2017 Cycle)
Amendments to MFRS 119, Employee Benefits (Plan Amendment, Curtailment or
Settlement)
Amendments to MFRS 123, Borrowing Costs (Annual Improvements to MFRS
Standards 2015-2017 Cycle)
Amendments to MFRS 128, Investments in Associates and Joint Ventures – Long-term Interests in Associates and Joint Ventures
MFRSs, Interpretations and amendments effective for annual periods beginning
on or after 1 January 2021
MFRS 17, Insurance Contracts
40
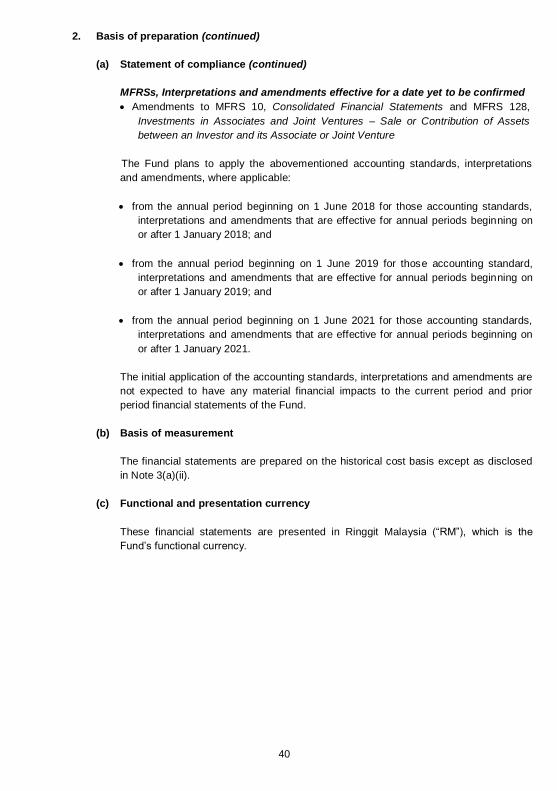
2. Basis of preparation (continued)
(a) Statement of compliance (continued)
MFRSs, Interpretations and amendments effective for a date yet to be confirmed
Amendments to MFRS 10, Consolidated Financial Statements and MFRS 128,
Investments in Associates and Joint Ventures – Sale or Contribution of Assets
between an Investor and its Associate or Joint Venture
The Fund plans to apply the abovementioned accounting standards, interpretations
and amendments, where applicable:
from the annual period beginning on 1 June 2018 for those accounting standards,
interpretations and amendments that are effective for annual periods beginning on
or after 1 January 2018; and
from the annual period beginning on 1 June 2019 for those accounting standard,
interpretations and amendments that are effective for annual periods beginning on
or after 1 January 2019; and
from the annual period beginning on 1 June 2021 for those accounting standards,
interpretations and amendments that are effective for annual periods beginning on
or after 1 January 2021.
The initial application of the accounting standards, interpretations and amendments are
not expected to have any material financial impacts to the current period and prior
period financial statements of the Fund.
(b) Basis of measurement
The financial statements are prepared on the historical cost basis except as disclosed
in Note 3(a)(ii).
(c) Functional and presentation currency
These financial statements are presented in Ringgit Malaysia (“RM”), which is the
Fund‟s functional currency.
41
2. Basis of preparation (continued)
(d) Use of estimates and judgements
The preparation of the financial statements in conformity with MFRSs requires
management to make judgements, estimates and assumptions that affect the
application of accounting policies and the reported amounts of assets, liabilities, income
and expenses. Actual results may differ from these estimates.
Estimates and underlying assumptions are reviewed on an ongoing basis. Revisions to
accounting estimates are recognised in the period in which the estimate is revised and
in any future years affected.
There are no significant areas of estimation uncertainty and critical judgements in
applying accounting policies that have significant effect on the amounts recognised in
the financial statements.
3. Significant accounting policies
The accounting policies set out below have been applied consistently to the period
presented in these financial statements, unless otherwise stated.
(a) Financial instruments
(i) Initial recognition and measurement
A financial instrument is recognised in the statement of financial position when,
and only when, the Fund becomes a party to the contractual provisions of the
instrument.
A financial instrument is recognised initially, at its fair value plus, in the case of a
financial instrument not at fair value through profit or loss, transaction costs that
are directly attributable to the acquisition or issue of the financial instrument.
(ii) Financial instrument categories and subsequent measurement
The Fund categorises financial instruments as follows:
Financial assets
(a) Financial assets at fair value through profit or loss
Fair value through profit or loss category comprises financial assets that are
held for trading, or financial assets that are specifically designated into this
category upon initial recognition.
Financial assets categorised as fair value through profit or loss are
subsequently measured at their fair values with the gain or loss recognised in
the statement of profit or loss.
42
3. Significant accounting policies (continued)
(a) Financial instruments (continued)
(ii) Financial instrument categories and subsequent measurement (continued)
Financial assets (continued)
(b) Financing and receivables
Financing and receivables category are debt instruments that are not quoted
in an active market and these comprises amount due from Manager, other
receivables and cash and cash equivalents.
Financial assets categorised as financing and receivables are subsequently
measured at amortised cost using the effective profit method.
All financial assets except for those measured at fair value through profit or loss,
are subject to review for impairment, see note 3(d).
Financial liabilities
All financial liabilities are subsequently measured at amortised cost comprises
amount due to Manager and other payables.
(iii) Derecognition
A financial asset or a part of it is derecognised when, and only when, the
contractual rights to the cash flows from the financial asset expire or the financial
asset is transferred to another party without retaining control or substantially all
risks and rewards of the asset. On derecognition of a financial asset, the
difference between the carrying amount and the sum of the consideration received
(including any new asset obtained less any new liability assumed) and any
cumulative gain or loss that had been recognised in equity is recognised in profit
or loss.
A financial liability or a part of it is derecognised when, and only when, the
obligation specified in the contract is discharged or cancelled or expires. On
derecognition of a financial liability, the difference between the carrying amount of
the financial liability extinguished or transferred to another party and the
consideration paid, including any non-cash assets transferred or liabilities
assumed, is recognised in profit or loss.
(b) Income recognition
(i) Dividend income
Dividend income is recognised in profit or loss on the date that the Fund‟s r ight to
receive payment is established, which in the case of foreign collective investment
scheme and quoted shares are the entitlement date.
43
3. Significant accounting policies (continued)
(b) Income recognition (continued)
(ii) Income from short term investments
Income from short term investments is recognised as it accrues, using the
effective profit method in profit or loss.
(iii) Gain on sale of investments
The realised gain on sale of investments is measured as the difference between
the net disposal proceeds and the carrying amount of the investments. The
carrying amount for determining the realised gain on sale of investments is based
on the weighted average cost method and where applicable adjusted for accretion
for discount and amortisation of premium.
(c) Cash and cash equivalents
Cash and cash equivalents consist of cash at bank and short term placements with
licensed financial institutions which have insignificant risk of changes in fair value with
original maturities of less than 30 days, and are used by the Fund in the management
of its short term commitments.
Cash and cash equivalents are categorised and measured as financing and receivables
in accordance with Note 3(a)(ii)(b).
(d) Impairment
Financial assets
All financial assets (except for financial assets categorised as fair value through profit or
loss) are assessed at each reporting date whether there is any objective evidence of
impairment as a result of one or more events having an impact on the estimated future
cash flows of the asset. Losses expected as a result of future events, no matter how
likely, are not recognised.
An impairment loss in respect of financing and receivables is recognised in profit or loss
and is measured as the difference between the asset‟s carrying amount and the
present value of estimated future cash flows discounted at the asset‟s original effective
profit rate. The carrying amount of the asset is reduced through the use of an allowance
account.
44
3. Significant accounting policies (continued)
(e) Income tax
Income tax expense comprise of current tax. Current tax is recognised in profit or loss
except to the extent that it relates to items recognised directly in equity or other
comprehensive income.
Current tax is the expected tax payable on the taxable income for the period, using tax
rates enacted or substantively enacted at the statement of financial position date, and
any adjustment to tax payable in respect of previous years.
(f) Unitholders’ capital
The Fund issues cancellable units, which are cancelled at the unitholder‟s option and
are classified as equity. Cancellable units can be put back to the Fund at any time for
cash equal to a proportionate share of the Fund‟s net asset value. The outstanding
units is carried at the redemption amount that is payable at the financial position date if
the unitholder exercises the right to put the unit back to the Fund.
Units are created and cancelled at the unitholder‟s option at prices based on the Fund‟s
net assets value per unit at the time of creation or cancellation. The Fund‟s net assets
value per unit is calculated by dividing the net asset attributable to unitholders with the
total number of outstanding units. In accordance with the Securities Commission‟s
Guidelines on Unit Trust Funds in Malaysia, investment positions are valued based on
the last traded market price for the purpose of determining the net asset value per unit
for creations and cancellations.
The units in the Fund are puttable instruments, classified as equity, which entitle the
unitholders to a pro-rata share of the net asset of the Fund. The units are subordinated
and have identical features. There is no contractual obligation to deliver cash or another
financial asset other than the obligation on the Fund to repurchase the units. The total
expected cash flows from the units are based on the change in the net asset of the
Fund.
(g) Distribution
Distribution is at discretion of the Fund. A distribution to the Fund‟s unitholders is
accounted for as a deduction from realised reserves. A proposed distribution is
recognised as a liability or equity in the period in which they are declared.
(h) Net Asset Value
The Net Asset Value is calculated after deducting the retained profits allocated for
distribution.
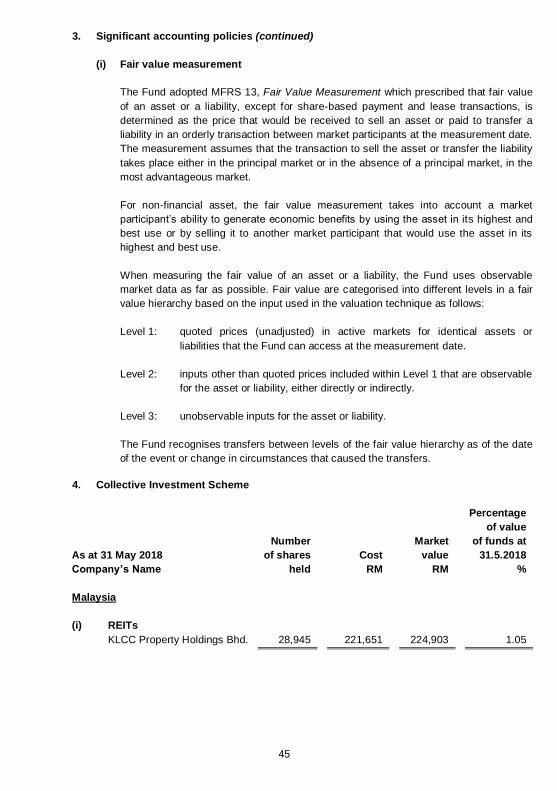
45
3. Significant accounting policies (continued)
(i) Fair value measurement
The Fund adopted MFRS 13, Fair Value Measurement which prescribed that fair value
of an asset or a liability, except for share-based payment and lease transactions, is
determined as the price that would be received to sell an asset or paid to transfer a
liability in an orderly transaction between market participants at the measurement date.
The measurement assumes that the transaction to sell the asset or transfer the liability
takes place either in the principal market or in the absence of a principal market, in the
most advantageous market.
For non-financial asset, the fair value measurement takes into account a market
participant‟s ability to generate economic benefits by using the asset in its highest and
best use or by selling it to another market participant that would use the asset in its
highest and best use.
When measuring the fair value of an asset or a liability, the Fund uses observable
market data as far as possible. Fair value are categorised into different levels in a fair
value hierarchy based on the input used in the valuation technique as follows:
Level 1: quoted prices (unadjusted) in active markets for identical assets or
liabilities that the Fund can access at the measurement date.
Level 2: inputs other than quoted prices included within Level 1 that are observable
for the asset or liability, either directly or indirectly.
Level 3: unobservable inputs for the asset or liability.
The Fund recognises transfers between levels of the fair value hierarchy as of the date
of the event or change in circumstances that caused the transfers.
4. Collective Investment Scheme
As at 31 May 2018
Number
of shares Cost
Market
value
Percentage
of value
of funds at
31.5.2018
Company’s Name held RM RM %
Malaysia
(i) REITs
KLCC Property Holdings Bhd. 28,945 221,651 224,903 1.05
46
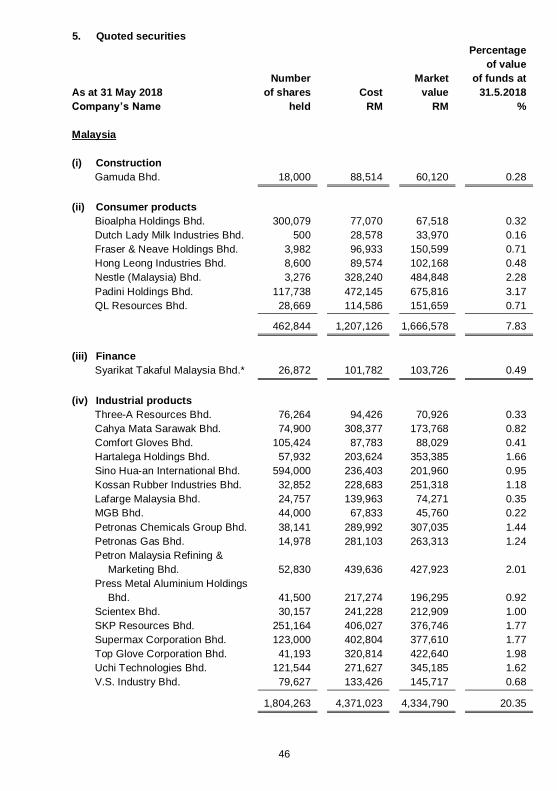
5. Quoted securities
As at 31 May 2018
Number
of shares Cost
Market
value
Percentage
of value
of funds at
31.5.2018
Company’s Name held RM RM %
Malaysia
(i) Construction
Gamuda Bhd. 18,000 88,514 60,120 0.28
(ii) Consumer products
Bioalpha Holdings Bhd. 300,079 77,070 67,518 0.32
Dutch Lady Milk Industries Bhd. 500 28,578 33,970 0.16
Fraser & Neave Holdings Bhd. 3,982 96,933 150,599 0.71
Hong Leong Industries Bhd. 8,600 89,574 102,168 0.48
Nestle (Malaysia) Bhd. 3,276 328,240 484,848 2.28
Padini Holdings Bhd. 117,738 472,145 675,816 3.17
QL Resources Bhd. 28,669 114,586 151,659 0.71
462,844 1,207,126 1,666,578 7.83
(iii) Finance
Syarikat Takaful Malaysia Bhd.* 26,872 101,782 103,726 0.49
(iv) Industrial products
Three-A Resources Bhd. 76,264 94,426 70,926 0.33
Cahya Mata Sarawak Bhd. 74,900 308,377 173,768 0.82
Comfort Gloves Bhd. 105,424 87,783 88,029 0.41
Hartalega Holdings Bhd. 57,932 203,624 353,385 1.66
Sino Hua-an International Bhd. 594,000 236,403 201,960 0.95
Kossan Rubber Industries Bhd. 32,852 228,683 251,318 1.18
Lafarge Malaysia Bhd. 24,757 139,963 74,271 0.35
MGB Bhd. 44,000 67,833 45,760 0.22
Petronas Chemicals Group Bhd. 38,141 289,992 307,035 1.44
Petronas Gas Bhd. 14,978 281,103 263,313 1.24
Petron Malaysia Refining &
Marketing Bhd. 52,830 439,636 427,923 2.01
Press Metal Aluminium Holdings
Bhd. 41,500 217,274 196,295 0.92
Scientex Bhd. 30,157 241,228 212,909 1.00
SKP Resources Bhd. 251,164 406,027 376,746 1.77
Supermax Corporation Bhd. 123,000 402,804 377,610 1.77
Top Glove Corporation Bhd. 41,193 320,814 422,640 1.98
Uchi Technologies Bhd. 121,544 271,627 345,185 1.62
V.S. Industry Bhd. 79,627 133,426 145,717 0.68
1,804,263 4,371,023 4,334,790 20.35
47
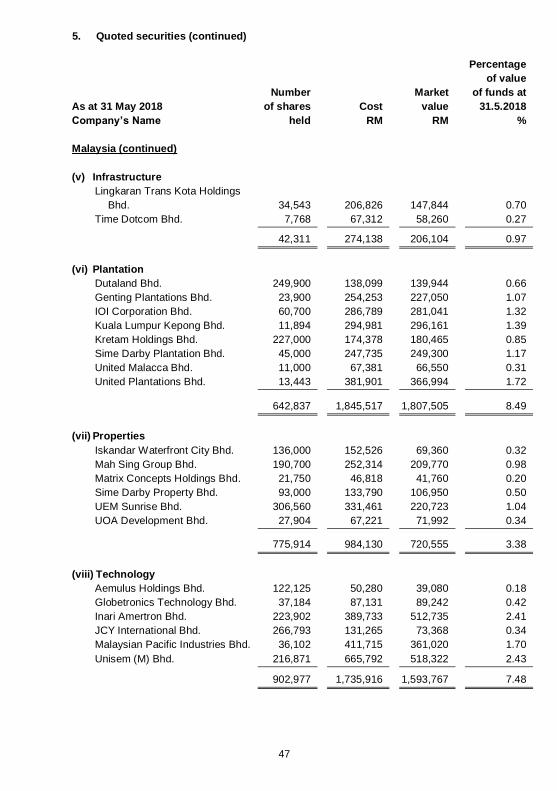
5. Quoted securities (continued)
As at 31 May 2018
Number
of shares Cost
Market
value
Percentage
of value
of funds at
31.5.2018
Company’s Name held RM RM %
Malaysia (continued)
(v) Infrastructure
Lingkaran Trans Kota Holdings
Bhd. 34,543 206,826 147,844 0.70
Time Dotcom Bhd. 7,768 67,312 58,260 0.27
42,311 274,138 206,104 0.97
(vi) Plantation
Dutaland Bhd. 249,900 138,099 139,944 0.66
Genting Plantations Bhd. 23,900 254,253 227,050 1.07
IOI Corporation Bhd. 60,700 286,789 281,041 1.32
Kuala Lumpur Kepong Bhd. 11,894 294,981 296,161 1.39
Kretam Holdings Bhd. 227,000 174,378 180,465 0.85
Sime Darby Plantation Bhd. 45,000 247,735 249,300 1.17
United Malacca Bhd. 11,000 67,381 66,550 0.31
United Plantations Bhd. 13,443 381,901 366,994 1.72
642,837 1,845,517 1,807,505 8.49
(vii) Properties
Iskandar Waterfront City Bhd. 136,000 152,526 69,360 0.32
Mah Sing Group Bhd. 190,700 252,314 209,770 0.98
Matrix Concepts Holdings Bhd. 21,750 46,818 41,760 0.20
Sime Darby Property Bhd. 93,000 133,790 106,950 0.50
UEM Sunrise Bhd. 306,560 331,461 220,723 1.04
UOA Development Bhd. 27,904 67,221 71,992 0.34
775,914 984,130 720,555 3.38
(viii) Technology
Aemulus Holdings Bhd. 122,125 50,280 39,080 0.18
Globetronics Technology Bhd. 37,184 87,131 89,242 0.42
Inari Amertron Bhd. 223,902 389,733 512,735 2.41
JCY International Bhd. 266,793 131,265 73,368 0.34
Malaysian Pacific Industries Bhd. 36,102 411,715 361,020 1.70
Unisem (M) Bhd. 216,871 665,792 518,322 2.43
902,977 1,735,916 1,593,767 7.48
48
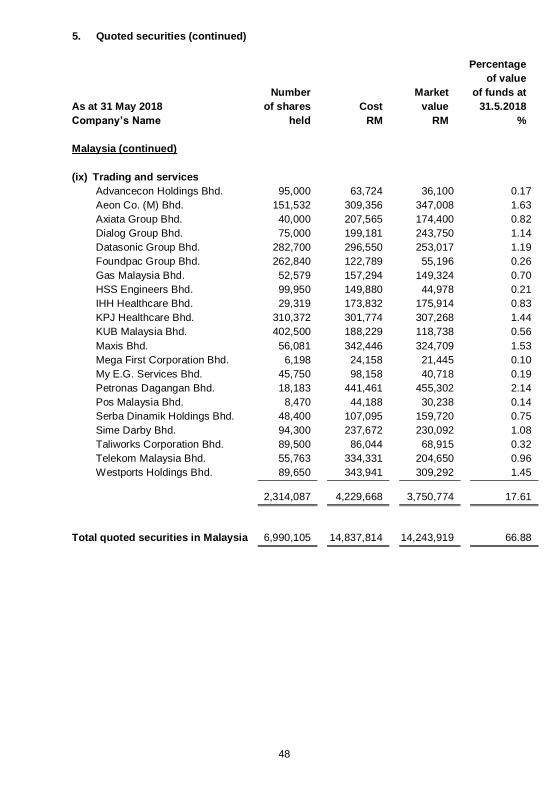
5. Quoted securities (continued)
As at 31 May 2018
Number
of shares Cost
Market
value
Percentage
of value
of funds at
31.5.2018
Company’s Name held RM RM %
Malaysia (continued)
(ix) Trading and services
Advancecon Holdings Bhd. 95,000 63,724 36,100 0.17
Aeon Co. (M) Bhd. 151,532 309,356 347,008 1.63
Axiata Group Bhd. 40,000 207,565 174,400 0.82
Dialog Group Bhd. 75,000 199,181 243,750 1.14
Datasonic Group Bhd. 282,700 296,550 253,017 1.19
Foundpac Group Bhd. 262,840 122,789 55,196 0.26
Gas Malaysia Bhd. 52,579 157,294 149,324 0.70
HSS Engineers Bhd. 99,950 149,880 44,978 0.21
IHH Healthcare Bhd. 29,319 173,832 175,914 0.83
KPJ Healthcare Bhd. 310,372 301,774 307,268 1.44
KUB Malaysia Bhd. 402,500 188,229 118,738 0.56
Maxis Bhd. 56,081 342,446 324,709 1.53
Mega First Corporation Bhd. 6,198 24,158 21,445 0.10
My E.G. Services Bhd. 45,750 98,158 40,718 0.19
Petronas Dagangan Bhd. 18,183 441,461 455,302 2.14
Pos Malaysia Bhd. 8,470 44,188 30,238 0.14
Serba Dinamik Holdings Bhd. 48,400 107,095 159,720 0.75
Sime Darby Bhd. 94,300 237,672 230,092 1.08
Taliworks Corporation Bhd. 89,500 86,044 68,915 0.32
Telekom Malaysia Bhd. 55,763 334,331 204,650 0.96
Westports Holdings Bhd. 89,650 343,941 309,292 1.45
2,314,087 4,229,668 3,750,774 17.61
Total quoted securities in Malaysia 6,990,105 14,837,814 14,243,919 66.88
49
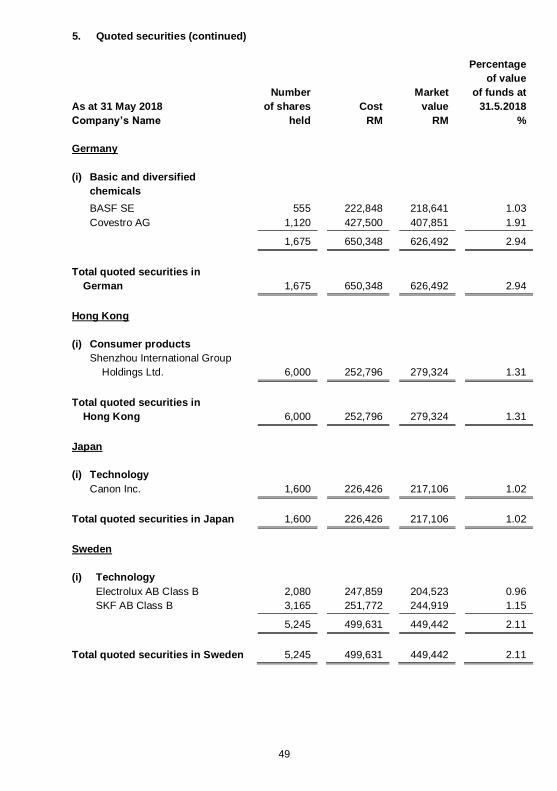
5. Quoted securities (continued)
As at 31 May 2018
Number
of shares Cost
Market
value
Percentage
of value
of funds at
31.5.2018
Company’s Name held RM RM %
Germany
(i) Basic and diversified
chemicals
BASF SE 555 222,848 218,641 1.03
Covestro AG 1,120 427,500 407,851 1.91
1,675 650,348 626,492 2.94
Total quoted securities in
German 1,675 650,348 626,492 2.94
Hong Kong
(i) Consumer products
Shenzhou International Group
Holdings Ltd. 6,000 252,796 279,324 1.31
Total quoted securities in
Hong Kong 6,000 252,796 279,324 1.31
Japan
(i) Technology
Canon Inc. 1,600 226,426 217,106 1.02
Total quoted securities in Japan 1,600 226,426 217,106 1.02
Sweden
(i) Technology
Electrolux AB Class B 2,080 247,859 204,523 0.96
SKF AB Class B 3,165 251,772 244,919 1.15
5,245 499,631 449,442 2.11
Total quoted securities in Sweden 5,245 499,631 449,442 2.11
50
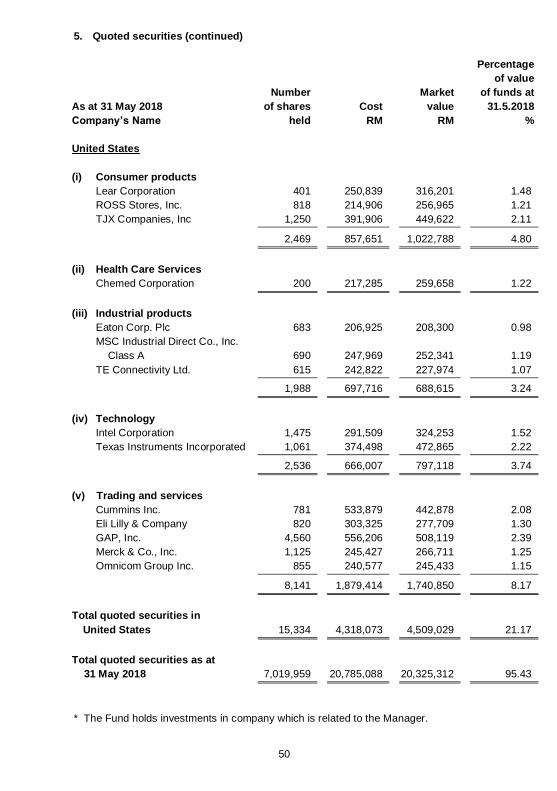
5. Quoted securities (continued)
As at 31 May 2018
Number
of shares Cost
Market
value
Percentage
of value
of funds at
31.5.2018
Company’s Name held RM RM %
United States
(i) Consumer products
Lear Corporation 401 250,839 316,201 1.48
ROSS Stores, Inc. 818 214,906 256,965 1.21
TJX Companies, Inc 1,250 391,906 449,622 2.11
2,469 857,651 1,022,788 4.80
(ii) Health Care Services
Chemed Corporation 200 217,285 259,658 1.22
(iii) Industrial products
Eaton Corp. Plc 683 206,925 208,300 0.98
MSC Industrial Direct Co., Inc.
Class A 690 247,969 252,341 1.19
TE Connectivity Ltd. 615 242,822 227,974 1.07
1,988 697,716 688,615 3.24
(iv) Technology
Intel Corporation 1,475 291,509 324,253 1.52
Texas Instruments Incorporated 1,061 374,498 472,865 2.22
2,536 666,007 797,118 3.74
(v) Trading and services
Cummins Inc. 781 533,879 442,878 2.08
Eli Lilly & Company 820 303,325 277,709 1.30
GAP, Inc. 4,560 556,206 508,119 2.39
Merck & Co., Inc. 1,125 245,427 266,711 1.25
Omnicom Group Inc. 855 240,577 245,433 1.15
8,141 1,879,414 1,740,850 8.17
Total quoted securities in
United States 15,334 4,318,073 4,509,029 21.17
Total quoted securities as at
31 May 2018 7,019,959 20,785,088 20,325,312 95.43
* The Fund holds investments in company which is related to the Manager.
51
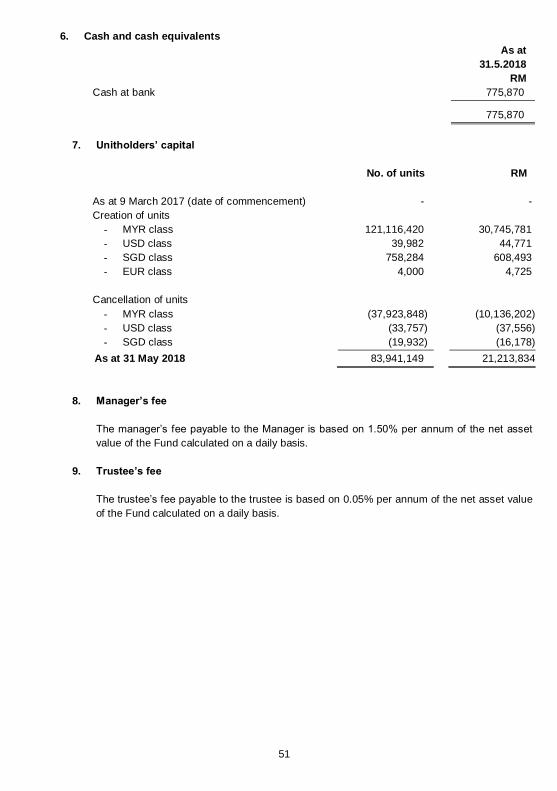
6. Cash and cash equivalents
As at
31.5.2018
RM
Cash at bank 775,870
775,870
7. Unitholders’ capital
No. of units RM
As at 9 March 2017 (date of commencement) - -
Creation of units
- MYR class 121,116,420 30,745,781
- USD class 39,982 44,771
- SGD class 758,284 608,493
- EUR class 4,000 4,725
Cancellation of units
- MYR class (37,923,848) (10,136,202)
- USD class (33,757) (37,556)
- SGD class (19,932) (16,178)
As at 31 May 2018 83,941,149 21,213,834
8. Manager’s fee
The manager‟s fee payable to the Manager is based on 1.50% per annum of the net asset
value of the Fund calculated on a daily basis.
9. Trustee’s fee
The trustee‟s fee payable to the trustee is based on 0.05% per annum of the net asset value
of the Fund calculated on a daily basis.
52
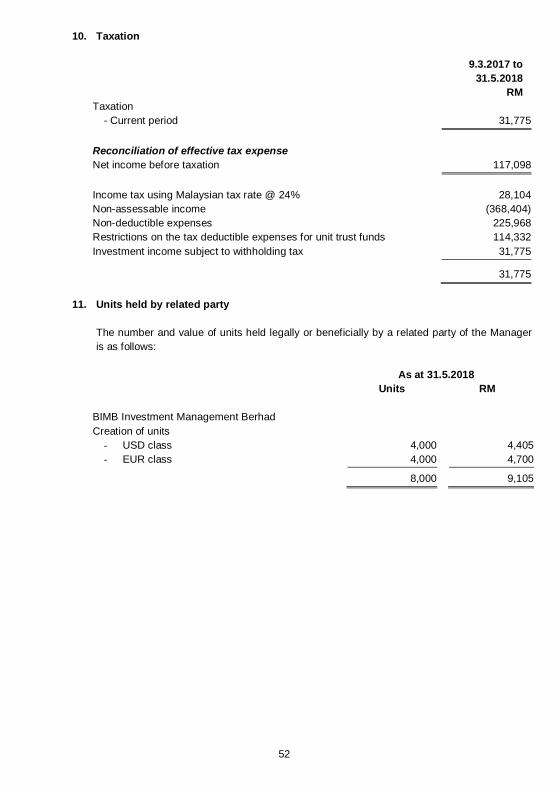
10. Taxation
9.3.2017 to
31.5.2018
RM
Taxation
- Current period 31,775
Reconciliation of effective tax expense
Net income before taxation 117,098
Income tax using Malaysian tax rate @ 24% 28,104
Non-assessable income (368,404)
Non-deductible expenses 225,968
Restrictions on the tax deductible expenses for unit trust funds 114,332
Investment income subject to withholding tax 31,775
31,775
11. Units held by related party
The number and value of units held legally or beneficially by a related party of the Manager
is as follows:
As at 31.5.2018
Units RM
BIMB Investment Management Berhad
Creation of units
- USD class 4,000 4,405
- EUR class 4,000 4,700
8,000 9,105
53
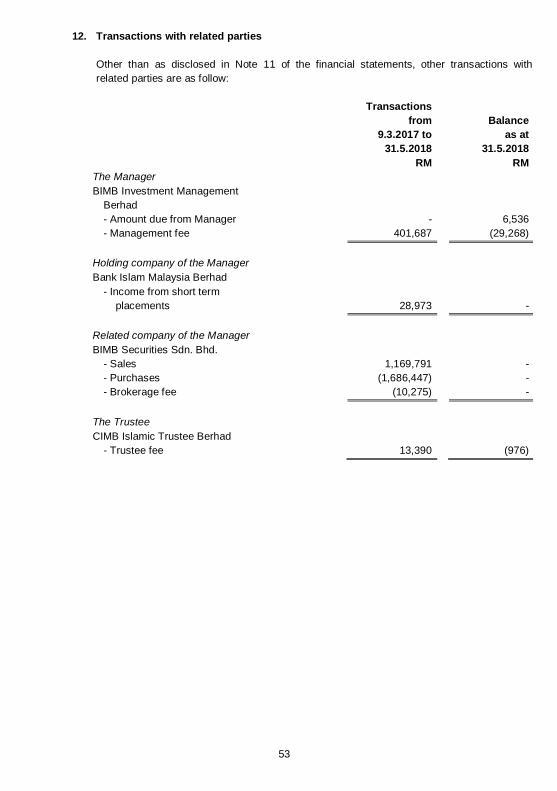
12. Transactions with related parties
Other than as disclosed in Note 11 of the financial statements, other transactions with
related parties are as follow:
Transactions
from
Balance
9.3.2017 to
31.5.2018
as at
31.5.2018
RM RM
The Manager
BIMB Investment Management
Berhad
- Amount due from Manager - 6,536
- Management fee 401,687 (29,268)
Holding company of the Manager
Bank Islam Malaysia Berhad
- Income from short term
placements 28,973
-
Related company of the Manager
BIMB Securities Sdn. Bhd.
- Sales 1,169,791 -
- Purchases (1,686,447) -
- Brokerage fee (10,275) -
The Trustee
CIMB Islamic Trustee Berhad
- Trustee fee 13,390 (976)
54
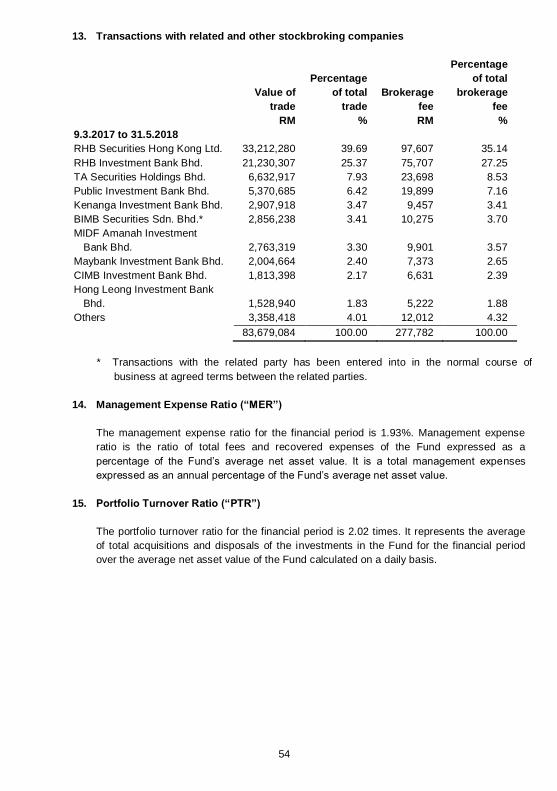
13. Transactions with related and other stockbroking companies
Value of
trade
Percentage
of total
trade
Brokerage
fee
Percentage
of total
brokerage
fee
RM % RM %
9.3.2017 to 31.5.2018
RHB Securities Hong Kong Ltd. 33,212,280 39.69 97,607 35.14
RHB Investment Bank Bhd. 21,230,307 25.37 75,707 27.25
TA Securities Holdings Bhd. 6,632,917 7.93 23,698 8.53
Public Investment Bank Bhd. 5,370,685 6.42 19,899 7.16
Kenanga Investment Bank Bhd. 2,907,918 3.47 9,457 3.41
BIMB Securities Sdn. Bhd.* 2,856,238 3.41 10,275 3.70
MIDF Amanah Investment
Bank Bhd. 2,763,319 3.30 9,901 3.57
Maybank Investment Bank Bhd. 2,004,664 2.40 7,373 2.65
CIMB Investment Bank Bhd. 1,813,398 2.17 6,631 2.39
Hong Leong Investment Bank
Bhd. 1,528,940 1.83 5,222 1.88
Others 3,358,418 4.01 12,012 4.32
83,679,084 100.00 277,782 100.00
* Transactions with the related party has been entered into in the normal course of
business at agreed terms between the related parties.
14. Management Expense Ratio (“MER”)
The management expense ratio for the financial period is 1.93%. Management expense
ratio is the ratio of total fees and recovered expenses of the Fund expressed as a
percentage of the Fund‟s average net asset value. It is a total management expenses
expressed as an annual percentage of the Fund‟s average net asset value.
15. Portfolio Turnover Ratio (“PTR”)
The portfolio turnover ratio for the financial period is 2.02 times. It represents the average
of total acquisitions and disposals of the investments in the Fund for the financial period
over the average net asset value of the Fund calculated on a daily basis.
55
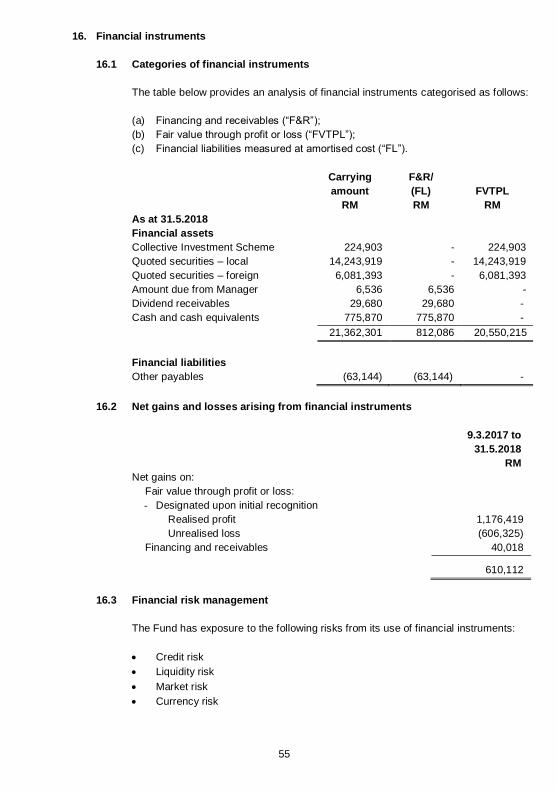
16. Financial instruments
16.1 Categories of financial instruments
The table below provides an analysis of financial instruments categorised as follows:
(a) Financing and receivables (“F&R”);
(b) Fair value through profit or loss (“FVTPL”);
(c) Financial liabilities measured at amortised cost (“FL”).
Carrying
amount
F&R/
(FL)
FVTPL
RM RM RM
As at 31.5.2018
Financial assets
Collective Investment Scheme 224,903 - 224,903
Quoted securities – local 14,243,919 - 14,243,919
Quoted securities – foreign 6,081,393 - 6,081,393
Amount due from Manager 6,536 6,536 -
Dividend receivables 29,680 29,680 -
Cash and cash equivalents 775,870 775,870 -
21,362,301 812,086 20,550,215
Financial liabilities
Other payables (63,144) (63,144) -
16.2 Net gains and losses arising from financial instruments
9.3.2017 to
31.5.2018
RM
Net gains on:
Fair value through profit or loss:
- Designated upon initial recognition
Realised profit 1,176,419
Unrealised loss (606,325)
Financing and receivables 40,018
610,112
16.3 Financial risk management
The Fund has exposure to the following risks from its use of financial instruments:
Credit risk
Liquidity risk
Market risk
Currency risk
56
16. Financial instruments (continued)
16.4 Credit risk
Credit risk is the risk of a financial loss to the Fund if counterparty to a financial
instrument fails to meet its contractual obligations. The Fund‟s exposure to credit risk
arises principally from its investment securities, receivables and cash and cash
equivalents.
Risk management objectives, policies and processes for managing the risk
The Manager manages the credit risk by setting counterparty limits and undertaking
credit evaluation to minimise the risk. The exposure to credit risk is monitored on an
ongoing basis.
Exposure to credit risk
The Fund‟s maximum credit risk exposure at the reporting date is represented by the
respective carrying amounts of the relevant financial assets in the statement of
financial position.
16.5 Liquidity risk
Liquidity risk is the risk that the Fund will not be able to meet its financial obligations
as they fall due. The Fund‟s exposure to liquidity risk arises principally from its
various payables which are due within one year.
The Fund maintains sufficient level of liquid assets, after consultation with the
Trustee, to meet anticipated payments and cancellation of units by unitholders.
Liquid assets comprise cash and other instruments, which are capable of being
converted into cash within 7 days.
16.6 Market risk
Market risk is the risk that changes in market prices, such as profit rates and market
prices will affect the Fund‟s financial position or cash flows.
57
16. Financial instruments (continued)
16.6 Market risk (continued)
Market price risk
Equity price risk arises from the Fund‟s investments in quoted securities.
Risk management objectives, policies and processes for managing the risk
The Fund is restricted to invest in securities issued by any issuer of not more than
10% of its net asset value. Under such restriction, the exposure risk to the securities
of any issuer is mitigated.
Price risk sensitivity analysis
This analysis assumes that all other variables remain constant and the Fund‟s equity
investments are positively correlated to each other.
A 10% strengthening in the collective investment schemes and equity prices at the
end of the reporting period would have increased the net asset value and
unitholders‟ fund by RM2,055,022. A 10% weakening in collective investment
schemes and equity prices would have had equal but opposite effect on the net
asset value and unitholders‟ fund respectively.
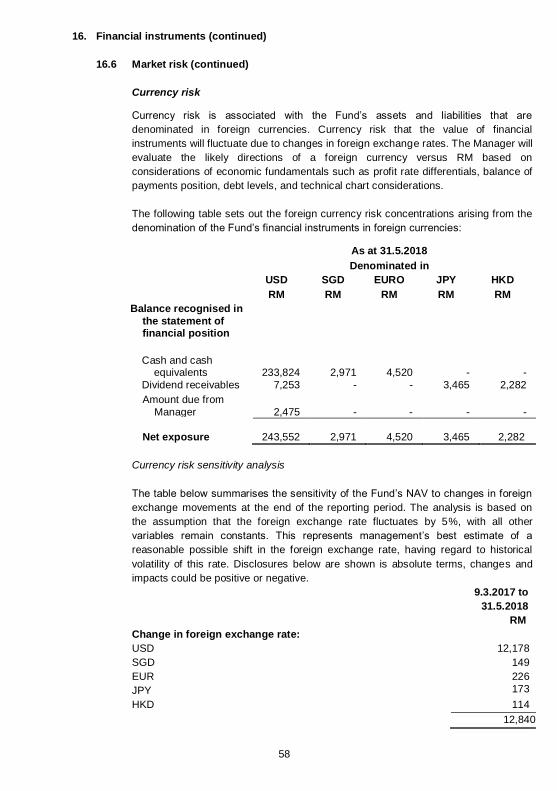
58
16. Financial instruments (continued)
16.6 Market risk (continued)
Currency risk
Currency risk is associated with the Fund‟s assets and liabilities that are
denominated in foreign currencies. Currency risk that the value of financial
instruments will fluctuate due to changes in foreign exchange rates. The Manager will
evaluate the likely directions of a foreign currency versus RM based on
considerations of economic fundamentals such as profit rate differentials, balance of
payments position, debt levels, and technical chart considerations.
The following table sets out the foreign currency risk concentrations arising from the
denomination of the Fund‟s financial instruments in foreign currencies:
As at 31.5.2018
Denominated in
USD SGD EURO JPY HKD
RM RM RM RM RM
Balance recognised in
the statement of financial position
Cash and cash equivalents
233,824
2,971
4,520
-
-
Dividend receivables 7,253 - - 3,465 2,282
Amount due from
Manager
2,475
-
-
-
-
Net exposure 243,552
2,971
4,520
3,465
2,282
Currency risk sensitivity analysis
The table below summarises the sensitivity of the Fund‟s NAV to changes in foreign
exchange movements at the end of the reporting period. The analysis is based on
the assumption that the foreign exchange rate fluctuates by 5%, with all other
variables remain constants. This represents management‟s best estimate of a
reasonable possible shift in the foreign exchange rate, having regard to historical
volatility of this rate. Disclosures below are shown is absolute terms, changes and
impacts could be positive or negative.
9.3.2017 to
31.5.2018
RM
Change in foreign exchange rate:
USD 12,178
SGD 149
EUR
JPY
226
173
HKD 114
12,840
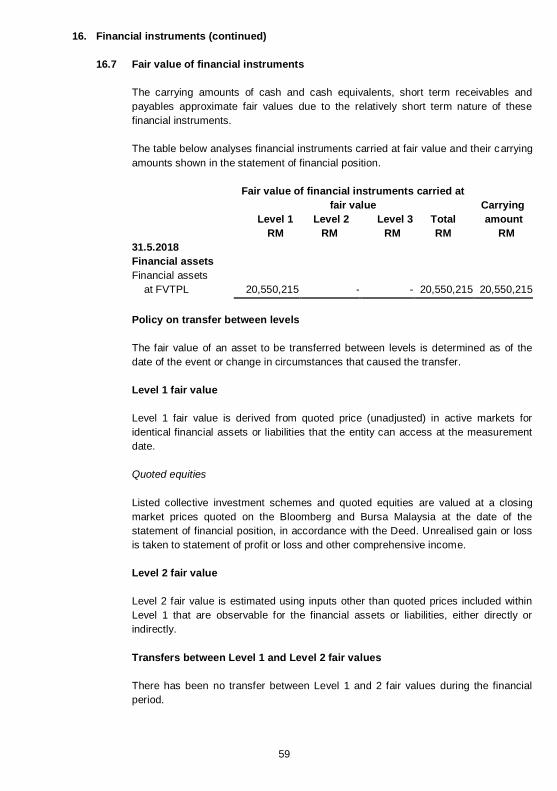
59
16. Financial instruments (continued)
16.7 Fair value of financial instruments
The carrying amounts of cash and cash equivalents, short term receivables and
payables approximate fair values due to the relatively short term nature of these
financial instruments.
The table below analyses financial instruments carried at fair value and their carrying
amounts shown in the statement of financial position.
Fair value of financial instruments carried at
fair value
Carrying
Level 1 Level 2 Level 3 Total amount
RM RM RM RM RM
31.5.2018
Financial assets
Financial assets
at FVTPL
20,550,215
-
-
20,550,215
20,550,215
Policy on transfer between levels
The fair value of an asset to be transferred between levels is determined as of the
date of the event or change in circumstances that caused the transfer.
Level 1 fair value
Level 1 fair value is derived from quoted price (unadjusted) in active markets for
identical financial assets or liabilities that the entity can access at the measurement
date.
Quoted equities
Listed collective investment schemes and quoted equities are valued at a closing
market prices quoted on the Bloomberg and Bursa Malaysia at the date of the
statement of financial position, in accordance with the Deed. Unrealised gain or loss
is taken to statement of profit or loss and other comprehensive income.
Level 2 fair value
Level 2 fair value is estimated using inputs other than quoted prices included within
Level 1 that are observable for the financial assets or liabilities, either directly or
indirectly.
Transfers between Level 1 and Level 2 fair values
There has been no transfer between Level 1 and 2 fair values during the financial
period.
60
16. Financial instruments (continued)
16.7 Fair value of financial instruments (continued)
Level 3 fair value
Level 3 fair value is estimated using unobservable inputs for the financial assets and
liabilities.
17. Capital management
The Fund‟s capital is represented by the unitholders‟ fund in the statement of financial
position. The Manager of the Fund monitors the adequacy of capital on an ongoing basis.
There is no external capital requirement imposed on the Fund.
18. Comparative
No comparative are included in the financial statements because this is the Fund‟s first set of
financial statements after the Fund commenced operations on 9 March 2017.
61
7.0 Corporate Directory
Manager
BIMB Investment Management Berhad
Registered Office Level 32, Menara Bank Islam, No. 22, Jalan Perak
50450, Kuala Lumpur Business Office
Level 19, Menara Bank Islam, No. 22, Jalan Perak 50450, Kuala Lumpur
Board of Directors Nik Mohd Hasyudeen Yusoff (Chairman – Non-Executive
Independent Director – Appointed w.e.f 13 September 2017)
Khairul Kamarudin (Chairman – Non-Executive Non Independent Director – Resigned w.e.f 13 September 2017) Dato‟ Ghazali Awang (Non-Executive Independent Director)
Datuk Noripah Kamso (Non-Executive Independent Director) Dr. Mohd Hatta Dagap (Non-Executive Independent Director) Malkiat Singh @ Malkit Singh Maan (Non-Executive Non
Independent Director) Mujibburrahman Abd Rashid (Non-Executive Non Independent Director– Appointed w.e.f. 5 December 2017)
Najmuddin Mohd Lutfi (Chief Executive Officer)
Shariah Committee
Ustaz Dr. Ahmad Shahbari @ Sobri Salamon Ustaz Dr. Yusof Ramli Ustazah Dr. Asmak Ab. Rahman
Investment Committee Khairul Muzamel Perera Abdullah (Chairman – Non
Independent Member)
Datuk Noripah Kamso (Independent Member) Mohd Radzuan Ahmad Tajuddin (Independent Member – Appointed w.e.f. 27 November 2017)
Dato‟ Darawati Hussain (Independent Member – Resigned w.e.f. 1 December 2017)
Audit Committee
Dato‟ Ghazali Awang (Chairman - Independent Member)
Dr. Mohd Hatta Dagap (Independent Member) Malkiat Singh @ Malkit Singh Maan (Non-Executive Non Independent Member)
Company Secretaries
Norhidayati Mohamat Salim (MIA 27364)
Level 32, Menara Bank Islam, No. 22, Jalan Perak, 50450 Kuala Lumpur.
Aidil Haznul Zulkifli (MEIS 01638) Level 32, Menara Bank Islam, No. 22 Jalan Perak, 50450 Kuala Lumpur.
62
Key Management
Najmuddin Mohd Lutfi (Chief Executive Officer) Badrol Ahmad Fathan (Head of Investment) Mohd Hamidullah Che Hassan (Manager, Compliance)
Principal Banker
CIMB Islamic Bank Berhad
P. Ramlee Branch, Lot 1-01 Menara Hap Seng Jalan P.Ramlee
Kuala Lumpur
Trustee
CIMB Islamic Trustee Berhad (167913-M) Level 21, Menara CIMB, Jalan Stesen Sentral 2,
Kuala Lumpur Sentral, 50470 Kuala Lumpur.
Auditors
KPMG Desa Megat PLT (LLP0010082-LCA & AF 0759) Level 10, KPMG Tower
8, First Avenue, Bandar Utama 47800 Petaling Jaya, Selangor
Federation of
Investment Managers Malaysia (FIMM)
19-06-1, 6th Floor, Wisma Tune
No.19, Lorong Dungun Damansara Heights 50490 Kuala Lumpur
Distributors
Bank Islam Malaysia Berhad Branches
IFast Capital Sdn Bhd Phillip Mutual Berhad Johor Bahru Agency Office
Bank Simpanan Nasional Berhad Registered Unit Trust Consultant with BIMB Investment Management Berhad
Toll Free Number: 1-800-88-1196

THIS PAGE INTENTIONALLY LEFT BLANK

THIS PAGE INTENTIONALLY LEFT BLANK

THIS PAGE INTENTIONALLY LEFT BLANK