2012 carbon - · pdf filekulim (malaysia) berhad carbon footprint report 2012 5 kulim ... and...
TRANSCRIPT
Kulim (Malaysia) Berhad (23370-V)
Suite 12B, Level 12, Menara Ansar65 Jalan Trus, 80000 Johor BahruJohor Darul Takzim, MALAYSIA
Tel : +607 226 7692 / +607 226 7476Fax : +607 222 3044 / +607 222 3022 Email : [email protected]
Website : www.kulim.com.my
2012 Carbon Footprint report
B
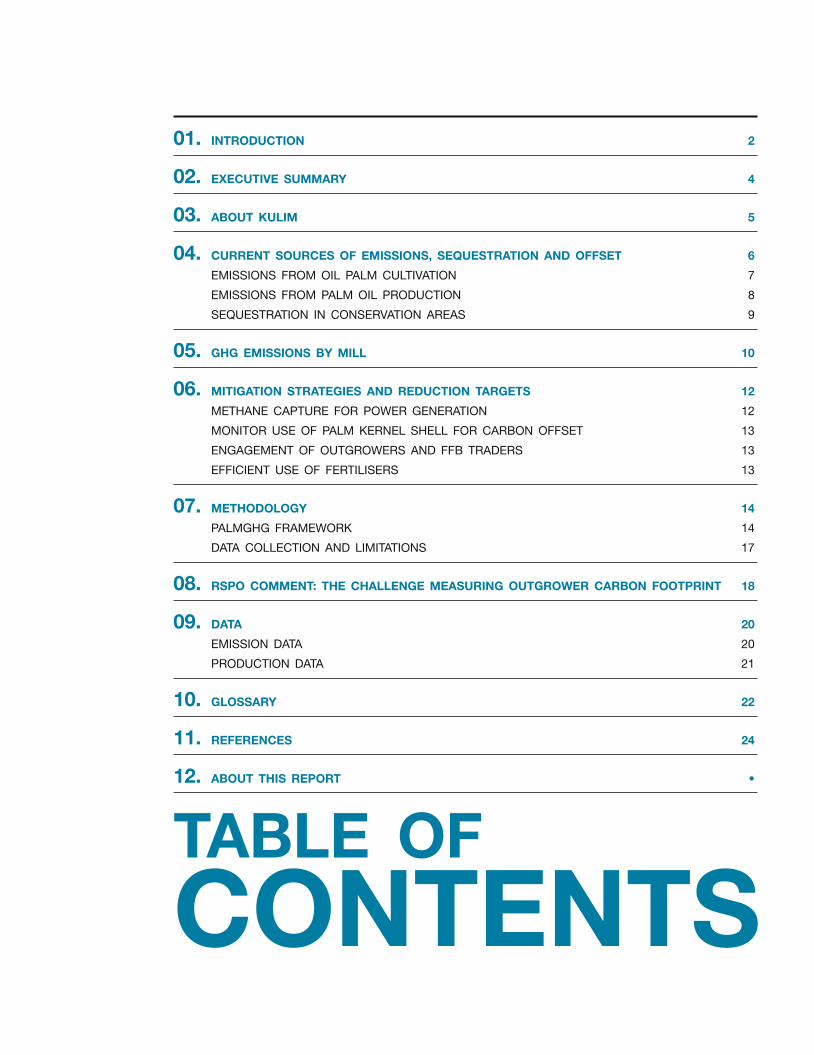
01. IntroductIon 2
02. ExEcutIvE Summary 4
03. about KulIm 5
04. currEnt SourcES of EmISSIonS, SEquEStratIon and offSEt 6
Emissions from oil Palm Cultivation 7
Emissions from Palm oil ProduCtion 8
sEquEstration in ConsErvation arEas 9
05. GHG EmISSIonS by mIll 10
06. mItIGatIon StratEGIES and rEductIon tarGEtS 12
mEthanE CaPturE for PowEr GEnEration 12
monitor usE of Palm KErnEl shEll for Carbon offsEt 13
EnGaGEmEnt of outGrowErs and ffb tradErs 13
EffiCiEnt usE of fErtilisErs 13
07. mEtHodoloGy 14
PalmGhG framEworK 14
data CollECtion and limitations 17
08. rSPo commEnt: tHE cHallEnGE mEaSurInG outGrowEr carbon footPrInt 18
09. data 20
Emission data 20
ProduCtion data 21
10. GloSSary 22
11. rEfErEncES 24
12. About this RepoRt •
tablE ofcontEntS
2
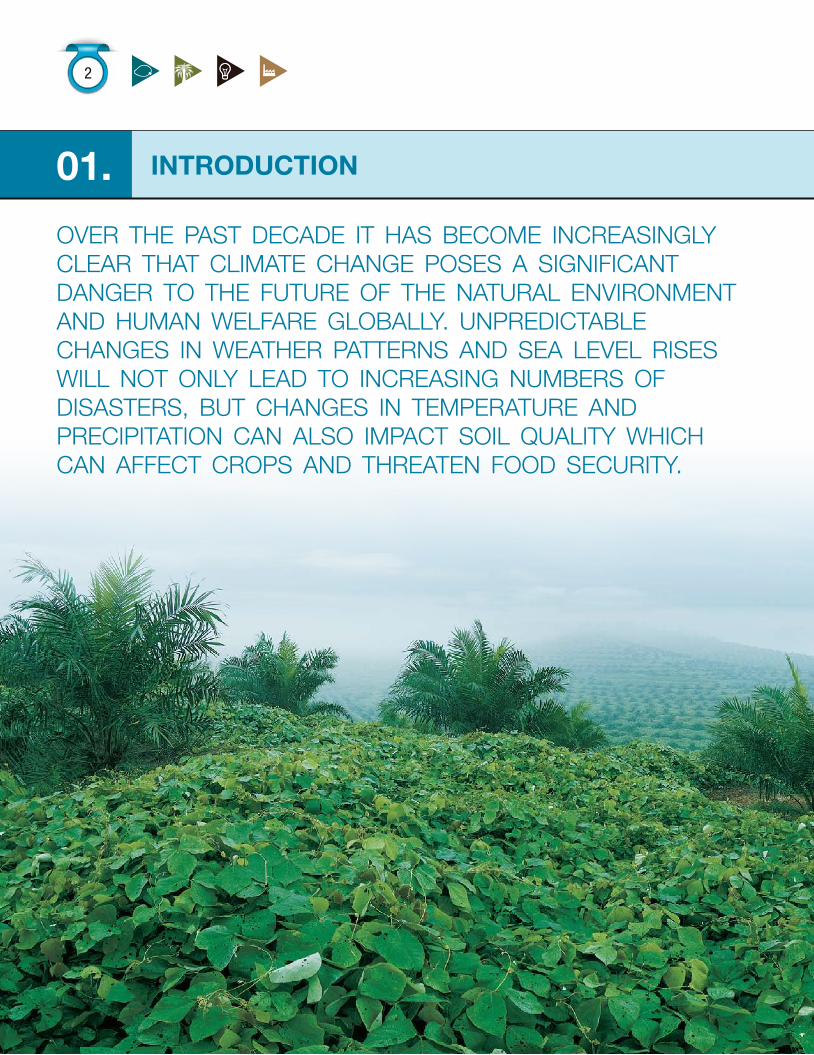
01. IntroductIon
Over the past decade it has becOme increasingly clear that climate change pOses a significantdanger tO the future Of the natural envirOnment and human welfare glObally. unpredictablechanges in weather patterns and sea level rises will nOt Only lead tO increasing numbers Ofdisasters, but changes in temperature and precipitatiOn can alsO impact sOil quality which can affect crOps and threaten fOOd security.
Kulim (Malaysia) BerhadCarbon Footprint Report 2012 3
In Malaysia, annual greenhouse gas (GHG) emissions have more than doubled in the past two decades. In 2009, the Government made a commitment on voluntary carbon and greenhouse gas emissions of up to 40 per cent from the intensity of the Gross Domestic Product (GDP) by 2020, as compared to the level in 2005.
Kulim understands that climate change constitutes the most significant environmental threat to livelihoods and the environment, and we believe that any sustainable business must contribute to reducing GHG emissions. We fully support the Malaysian Government’s commitment to reducing GHG emissions, and this report is a first step towards documenting our impact and reduction efforts.
This is the inaugural carbon footprint report for Kulim (Malaysia) Bhd. The report provides an overview of Kulim’s climate change impacts, as well as a preliminary product carbon footprint of crude palm oil (CPO) and palm kernel (PK) produced at Kulim’s mills.
The report is a new initiative in Kulim’s efforts towards sustainability and transparency. This builds on our long-term commitment to being certified by the Roundtable on Sustainable Palm Oil (RSPO), publishing a biennial sustainability report in accordance with the GRI since 2008, and attaining International Sustainability and Carbon Certification.
The report is based on the PalmGHG calculator developed by the RSPO. We know that there are still uncertainties associated with the measurement of GHG emissions from plantations, particularly with regards to emissions by smallholders and independent outgrowers. However, we believe this is the best available methodology to provide a reasonable estimate of our product carbon. We hope this report is helpful to our customers and other stakeholders wishing to understand our carbon footprint.
4
02. ExEcutIvE Summary
Kulim (Malaysia) Bhd (Kulim) is a plantation company based in Johor in Peninsula Malaysia. We have a total land area of 49,551ha, of which 46,288ha is planted with palm oil. The remaining land is used for housing, roads, or set aside for conservation.
The methodology applied in this report is based on the RSPO PalmGHG calculator. It covers the company’s oil palm cultivated on our plantation, CPO processed in our four mills and one mill that is owned by Johor Corporation. The report also includes estimated emissions from the 34.7% of external fresh fruit bunch (FFB) which is supplied by independent smallholders and outgrowers.
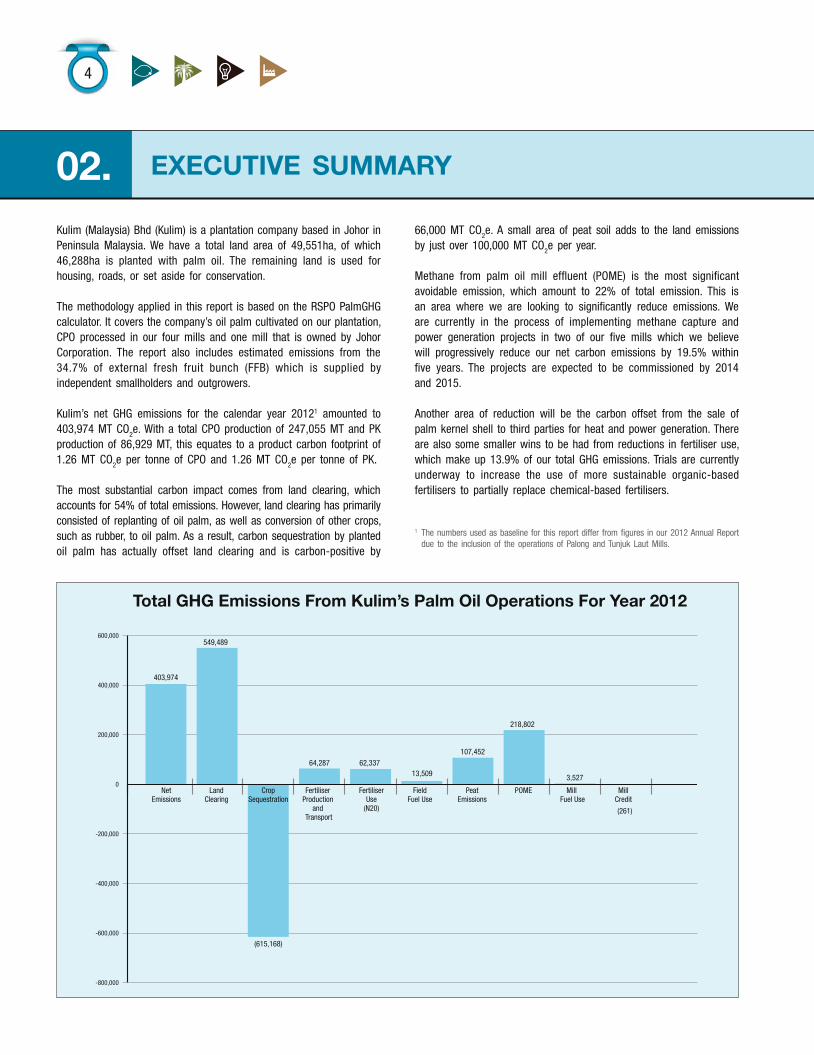
Kulim’s net GHG emissions for the calendar year 20121 amounted to 403,974 MT CO2e. With a total CPO production of 247,055 MT and PK production of 86,929 MT, this equates to a product carbon footprint of 1.26 MT CO2e per tonne of CPO and 1.26 MT CO2e per tonne of PK.
The most substantial carbon impact comes from land clearing, which accounts for 54% of total emissions. However, land clearing has primarily consisted of replanting of oil palm, as well as conversion of other crops, such as rubber, to oil palm. As a result, carbon sequestration by planted oil palm has actually offset land clearing and is carbon-positive by
66,000 MT CO2e. A small area of peat soil adds to the land emissions by just over 100,000 MT CO2e per year.
Methane from palm oil mill effluent (POME) is the most significant avoidable emission, which amount to 22% of total emission. This is an area where we are looking to significantly reduce emissions. We are currently in the process of implementing methane capture and power generation projects in two of our five mills which we believe will progressively reduce our net carbon emissions by 19.5% within five years. The projects are expected to be commissioned by 2014 and 2015.
Another area of reduction will be the carbon offset from the sale of palm kernel shell to third parties for heat and power generation. There are also some smaller wins to be had from reductions in fertiliser use, which make up 13.9% of our total GHG emissions. Trials are currently underway to increase the use of more sustainable organic-based fertilisers to partially replace chemical-based fertilisers.
1 The numbers used as baseline for this report differ from figures in our 2012 Annual Report due to the inclusion of the operations of Palong and Tunjuk Laut Mills.
403,974
549,489
64,287
(615,168)
62,33713,509
107,452
218,802
3,527
(261)
NetEmissions
LandClearing
CropSequestration
Fertiliser Production
and Transport
FertiliserUse
(N20)
FieldFuel Use
PeatEmissions
POME Mill Fuel Use
MillCredit
-800,000
-600,000
-400,000
-200,000
0
200,000
400,000
600,000
Total GHG Emissions From Kulim’s Palm Oil Operations For Year 2012
Kulim (Malaysia) BerhadCarbon Footprint Report 2012 5
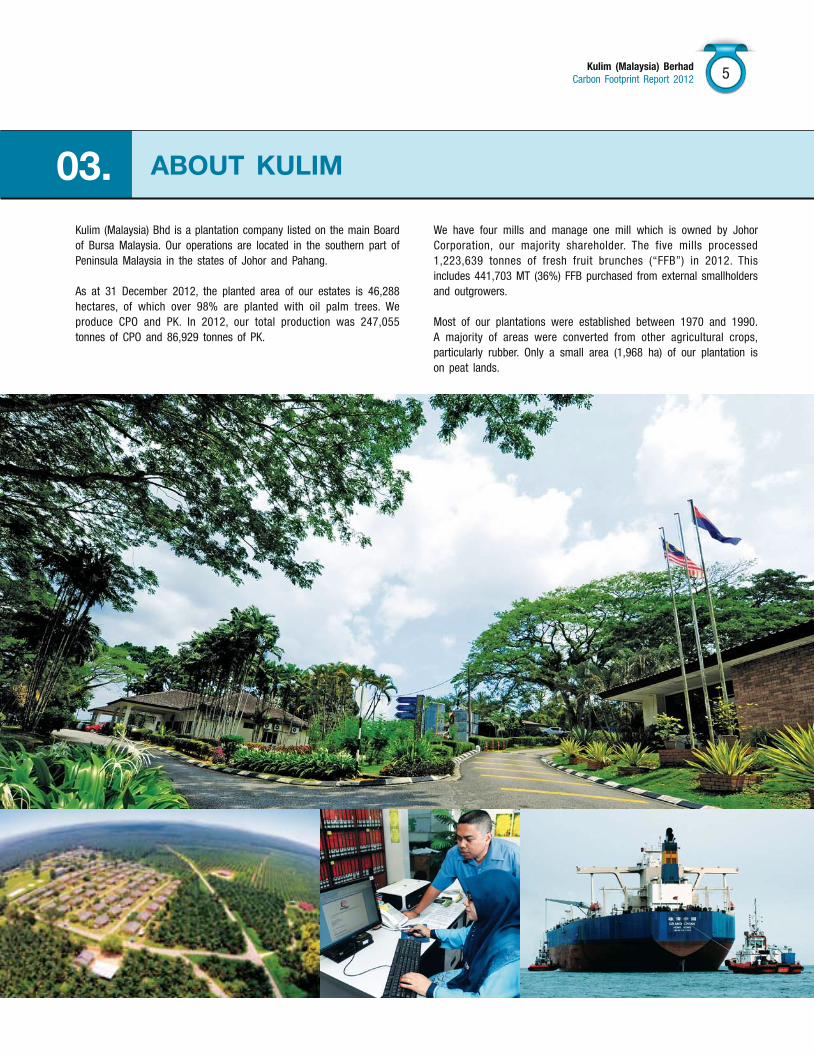
Kulim (Malaysia) Bhd is a plantation company listed on the main Board of Bursa Malaysia. Our operations are located in the southern part of Peninsula Malaysia in the states of Johor and Pahang.
As at 31 December 2012, the planted area of our estates is 46,288 hectares, of which over 98% are planted with oil palm trees. We produce CPO and PK. In 2012, our total production was 247,055 tonnes of CPO and 86,929 tonnes of PK.
We have four mills and manage one mill which is owned by Johor Corporation, our majority shareholder. The five mills processed 1,223,639 tonnes of fresh fruit brunches (“FFB”) in 2012. This includes 441,703 MT (36%) FFB purchased from external smallholders and outgrowers.
Most of our plantations were established between 1970 and 1990. A majority of areas were converted from other agricultural crops, particularly rubber. Only a small area (1,968 ha) of our plantation is on peat lands.
03. about KulIm
6
04. currEnt SourcES of EmISSIonS, SEquEStratIon and offSEt
EmISSIon and rEductIon SourcES
field - oil palm cultivation mill - palm oil production
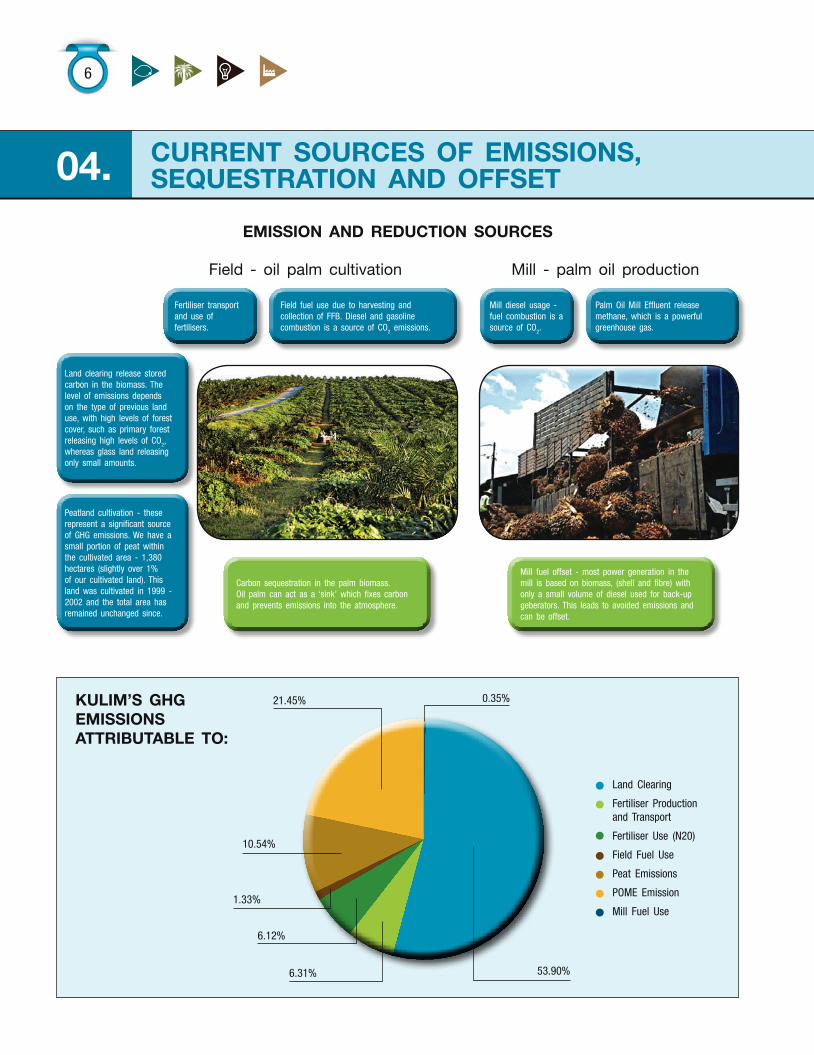
Land clearing release stored carbon in the biomass. The level of emissions depends on the type of previous land use, with high levels of forest cover, such as primary forest releasing high levels of CO2, whereas glass land releasing only small amounts.
Mill diesel usage - fuel combustion is a source of CO2.
Fertiliser transport and use of fertilisers.
Field fuel use due to harvesting and collection of FFB. Diesel and gasoline combustion is a source of CO2 emissions.
Palm Oil Mill Effluent release methane, which is a powerful greenhouse gas.
Peatland cultivation - these represent a significant source of GHG emissions. We have a small portion of peat within the cultivated area - 1,380 hectares (slightly over 1% of our cultivated land). This land was cultivated in 1999 - 2002 and the total area has remained unchanged since.
Carbon sequestration in the palm biomass. Oil palm can act as a ‘sink’ which fixes carbon and prevents emissions into the atmosphere.
Mill fuel offset - most power generation in the mill is based on biomass, (shell and fibre) with only a small volume of diesel used for back-up geberators. This leads to avoided emissions and can be offset.
KulIm’S GHG EmISSIonS attrIbutablE to:
Land Clearing
Fertiliser Production and Transport
Fertiliser Use (N20)
Field Fuel Use
Peat Emissions
POME Emission
Mill Fuel Use1.33%
53.90%6.31%
6.12%
10.54%
21.45% 0.35%
Kulim (Malaysia) BerhadCarbon Footprint Report 2012 7
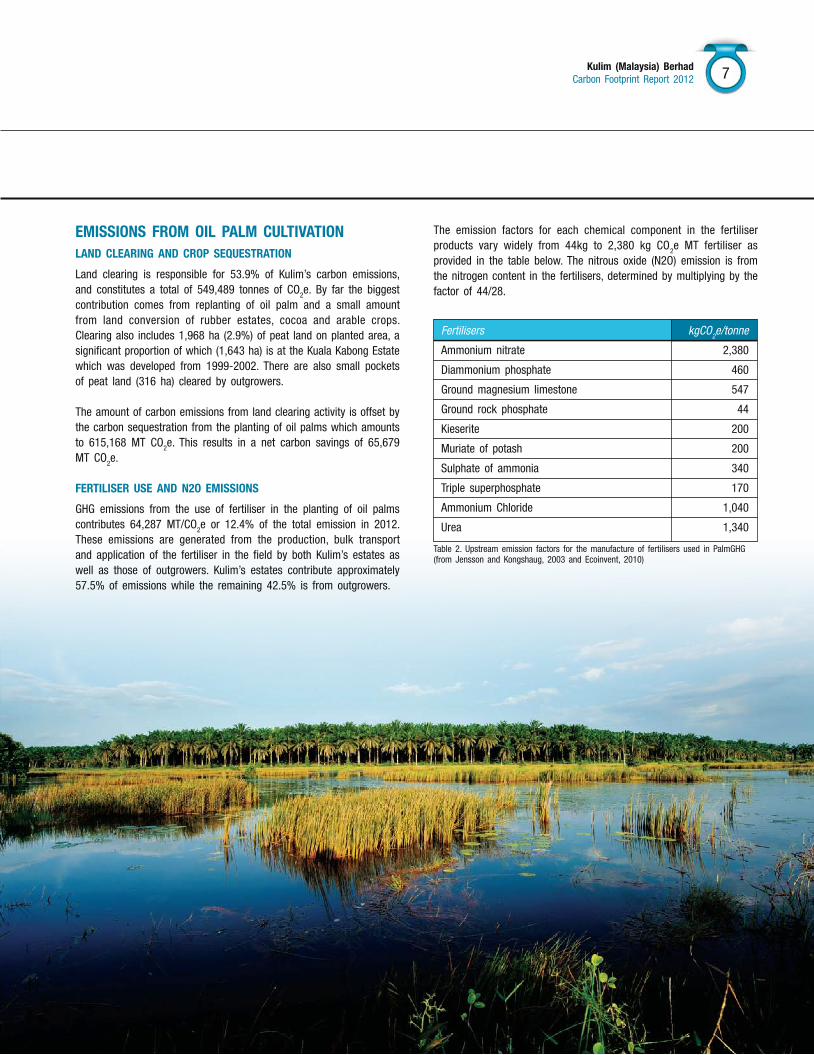
EMissions froM oil palM cultivationland clEaring and crop sEquEstration
Land clearing is responsible for 53.9% of Kulim’s carbon emissions, and constitutes a total of 549,489 tonnes of CO2e. By far the biggest contribution comes from replanting of oil palm and a small amount from land conversion of rubber estates, cocoa and arable crops. Clearing also includes 1,968 ha (2.9%) of peat land on planted area, a significant proportion of which (1,643 ha) is at the Kuala Kabong Estate which was developed from 1999-2002. There are also small pockets of peat land (316 ha) cleared by outgrowers.
The amount of carbon emissions from land clearing activity is offset by the carbon sequestration from the planting of oil palms which amounts to 615,168 MT CO2e. This results in a net carbon savings of 65,679 MT CO2e.
fErtilisEr usE and n2o EMissions
GHG emissions from the use of fertiliser in the planting of oil palms contributes 64,287 MT/CO2e or 12.4% of the total emission in 2012. These emissions are generated from the production, bulk transport and application of the fertiliser in the field by both Kulim’s estates as well as those of outgrowers. Kulim’s estates contribute approximately 57.5% of emissions while the remaining 42.5% is from outgrowers.
The emission factors for each chemical component in the fertiliser products vary widely from 44kg to 2,380 kg CO2e MT fertiliser as provided in the table below. The nitrous oxide (N2O) emission is from the nitrogen content in the fertilisers, determined by multiplying by the factor of 44/28.
Fertilisers kgCO2e/tonne
Ammonium nitrate 2,380
Diammonium phosphate 460
Ground magnesium limestone 547
Ground rock phosphate 44
Kieserite 200
Muriate of potash 200
Sulphate of ammonia 340
Triple superphosphate 170
Ammonium Chloride 1,040
Urea 1,340
Table 2. Upstream emission factors for the manufacture of fertilisers used in PalmGHG(from Jensson and Kongshaug, 2003 and Ecoinvent, 2010)
8
04. currEnt SourcES of EmISSIonS, SEquEStratIon and offSEt
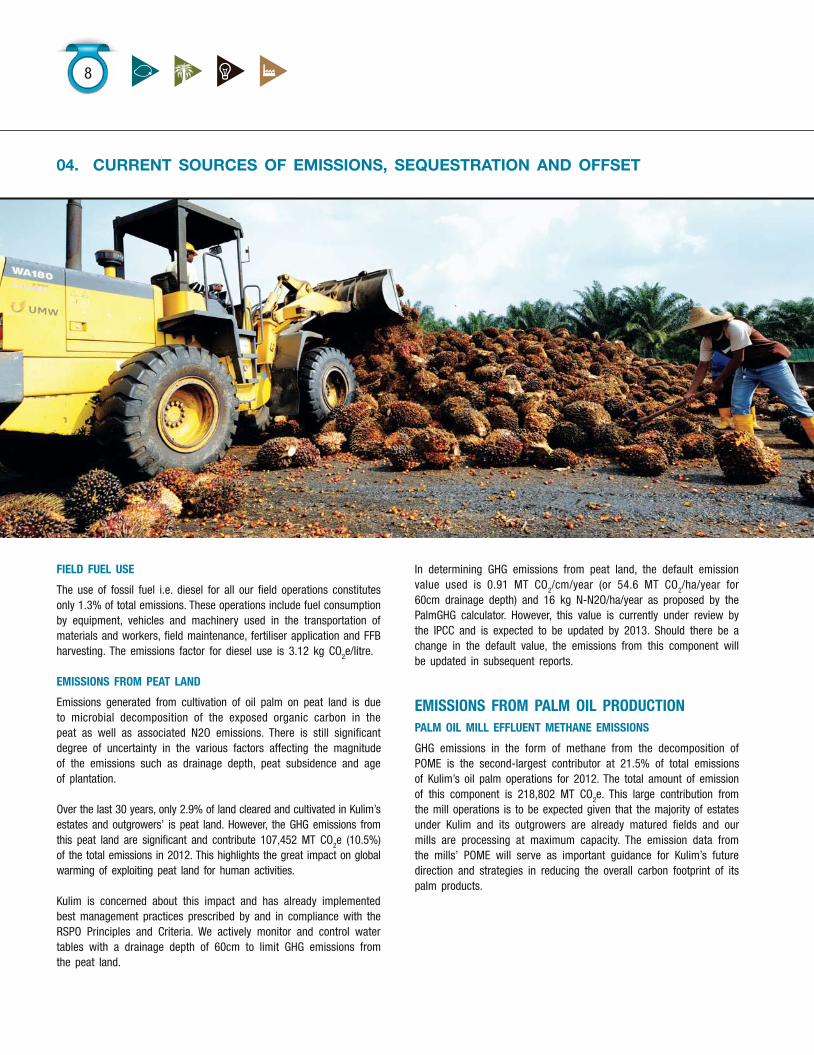
In determining GHG emissions from peat land, the default emission value used is 0.91 MT CO2/cm/year (or 54.6 MT CO2/ha/year for 60cm drainage depth) and 16 kg N-N2O/ha/year as proposed by the PalmGHG calculator. However, this value is currently under review by the IPCC and is expected to be updated by 2013. Should there be a change in the default value, the emissions from this component will be updated in subsequent reports.
EMissions froM palM oil productionpalM oil Mill EffluEnt MEthanE EMissions
GHG emissions in the form of methane from the decomposition of POME is the second-largest contributor at 21.5% of total emissions of Kulim’s oil palm operations for 2012. The total amount of emission of this component is 218,802 MT CO2e. This large contribution from the mill operations is to be expected given that the majority of estates under Kulim and its outgrowers are already matured fields and our mills are processing at maximum capacity. The emission data from the mills’ POME will serve as important guidance for Kulim’s future direction and strategies in reducing the overall carbon footprint of its palm products.
fiEld fuEl usE
The use of fossil fuel i.e. diesel for all our field operations constitutes only 1.3% of total emissions. These operations include fuel consumption by equipment, vehicles and machinery used in the transportation of materials and workers, field maintenance, fertiliser application and FFB harvesting. The emissions factor for diesel use is 3.12 kg CO2e/litre.
EMissions froM pEat land
Emissions generated from cultivation of oil palm on peat land is due to microbial decomposition of the exposed organic carbon in the peat as well as associated N2O emissions. There is still significant degree of uncertainty in the various factors affecting the magnitude of the emissions such as drainage depth, peat subsidence and age of plantation.
Over the last 30 years, only 2.9% of land cleared and cultivated in Kulim’s estates and outgrowers’ is peat land. However, the GHG emissions from this peat land are significant and contribute 107,452 MT CO2e (10.5%) of the total emissions in 2012. This highlights the great impact on global warming of exploiting peat land for human activities.
Kulim is concerned about this impact and has already implemented best management practices prescribed by and in compliance with the RSPO Principles and Criteria. We actively monitor and control water tables with a drainage depth of 60cm to limit GHG emissions from the peat land.
Kulim (Malaysia) BerhadCarbon Footprint Report 2012 9
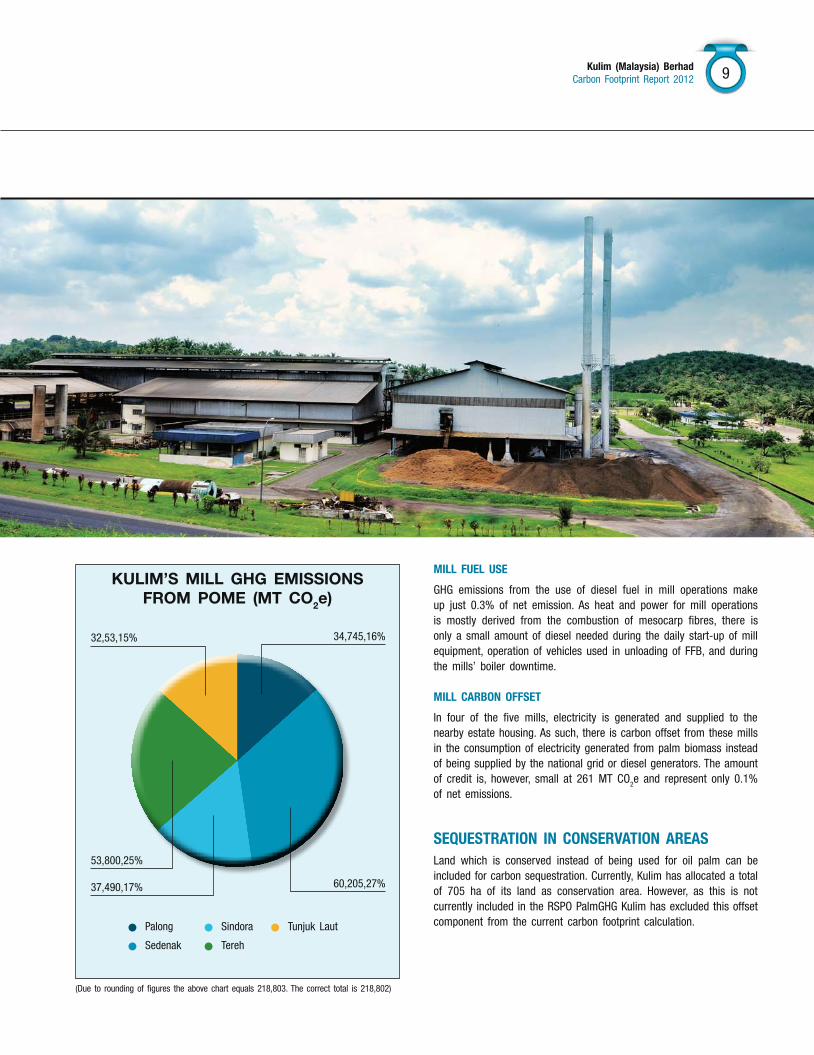
KulIm’S mIll GHG EmISSIonS from PomE (mt co2e)
Palong
Sedenak
Sindora
Tereh
Tunjuk Laut
34,745,16%
60,205,27%37,490,17%
53,800,25%
32,53,15%
Mill fuEl usE
GHG emissions from the use of diesel fuel in mill operations make up just 0.3% of net emission. As heat and power for mill operations is mostly derived from the combustion of mesocarp fibres, there is only a small amount of diesel needed during the daily start-up of mill equipment, operation of vehicles used in unloading of FFB, and during the mills’ boiler downtime.
Mill carBon offsEt
In four of the five mills, electricity is generated and supplied to the nearby estate housing. As such, there is carbon offset from these mills in the consumption of electricity generated from palm biomass instead of being supplied by the national grid or diesel generators. The amount of credit is, however, small at 261 MT CO2e and represent only 0.1% of net emissions.
sEquEstration in consErvation arEasLand which is conserved instead of being used for oil palm can be included for carbon sequestration. Currently, Kulim has allocated a total of 705 ha of its land as conservation area. However, as this is not currently included in the RSPO PalmGHG Kulim has excluded this offset component from the current carbon footprint calculation.
(Due to rounding of figures the above chart equals 218,803. The correct total is 218,802)
10
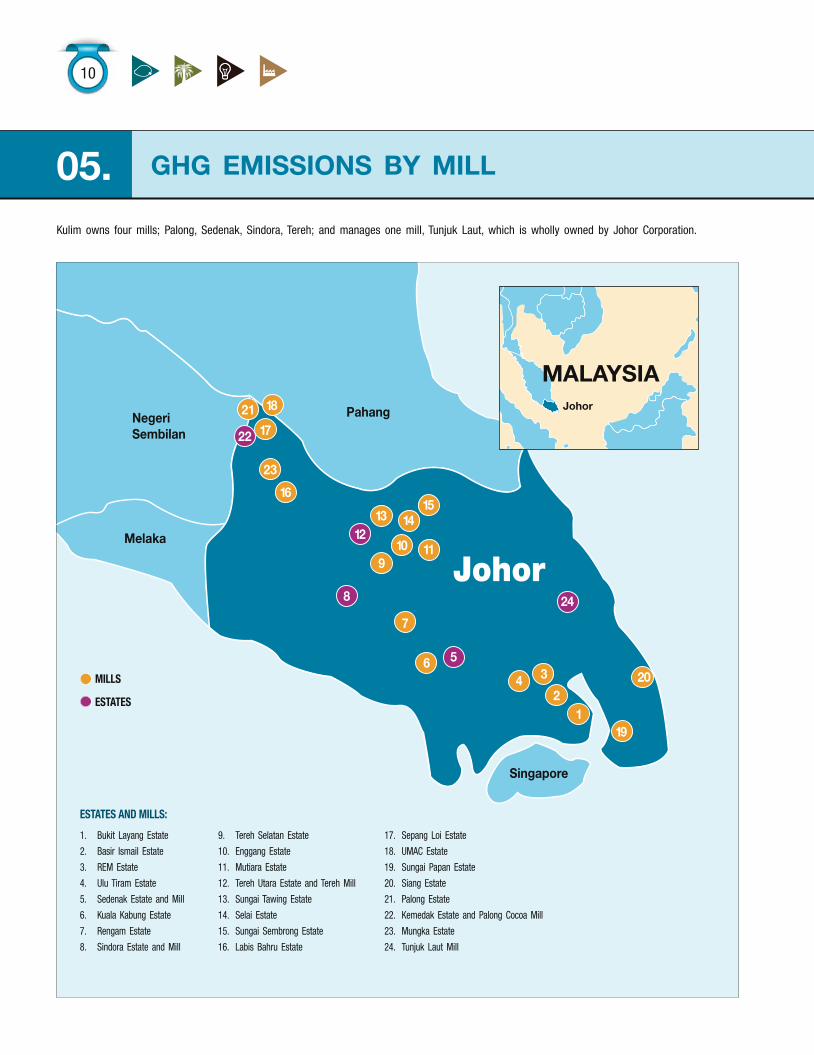
05. GHG EmISSIonS by mIll
Kulim owns four mills; Palong, Sedenak, Sindora, Tereh; and manages one mill, Tunjuk Laut, which is wholly owned by Johor Corporation.
Johor
Pahang
Singapore
NegeriSembilan
Melaka
12
34 20
19
5
24
6
7
8
910 11
1213 14
1516
23
22
21
17
18 Johor
MALAYSIA
EstatEs and Mills:
1. Bukit Layang Estate
2. Basir Ismail Estate
3. REM Estate
4. Ulu Tiram Estate
5. Sedenak Estate and Mill
6. Kuala Kabung Estate
7. Rengam Estate
8. Sindora Estate and Mill
9. Tereh Selatan Estate
10. Enggang Estate
11. Mutiara Estate
12. Tereh Utara Estate and Tereh Mill
13. Sungai Tawing Estate
14. Selai Estate
15. Sungai Sembrong Estate
16. Labis Bahru Estate
17. Sepang Loi Estate
18. UMAC Estate
19. Sungai Papan Estate
20. Siang Estate
21. Palong Estate
22. Kemedak Estate and Palong Cocoa Mill
23. Mungka Estate
24. Tunjuk Laut Mill
Mills
EstatEs
Kulim (Malaysia) BerhadCarbon Footprint Report 2012 11
total co2e EmISSIonS by mIll
Palong
Sedenak
Sindora
Tereh
Tunjuk Laut
175,823,17%
309,046,30%138,620,14%
201,243,20%
194,672,19%
In all the mills, methane from POME represents the largest portion of GHG emissions, totalling 218,802 MT CO2e. Sedenak Mill is the largest contributor and accounts for 30% (60,205 MT CO2e) followed by Tereh Mill (53,800 MT CO2e).
The second largest source of GHG emissions (107,452 MT CO2e) originates from the cultivation of oil palm on peat soil at the estates supplying FFB to Sedenak (89,689 MT CO2e) and Tereh (16,294 MT CO2e) palm oil mills. There is also a small amount of emissions from FFB cultivated on peat land at Sindora (1,470 MT CO2e).
ghg EMissions froM individual Mills
MT MT NO MILL NAME CO2e/CPO CO2e/PK
1. Palong Palm Oil Mill 1.32 1.32
2. Sedenak Palm Oil Mill 1.58 1.58
3. Sindora Palm Oil Mill 1.30 1.30
4. Tereh Palm Oil Mill 0.96 0.96
5. Tunjuk Laut Palm Oil Mill 0.75 0.75
Kulim consolidated 1.26 1.26
12
06. mItIGatIon StratEGIES and rEductIon tarGEtS
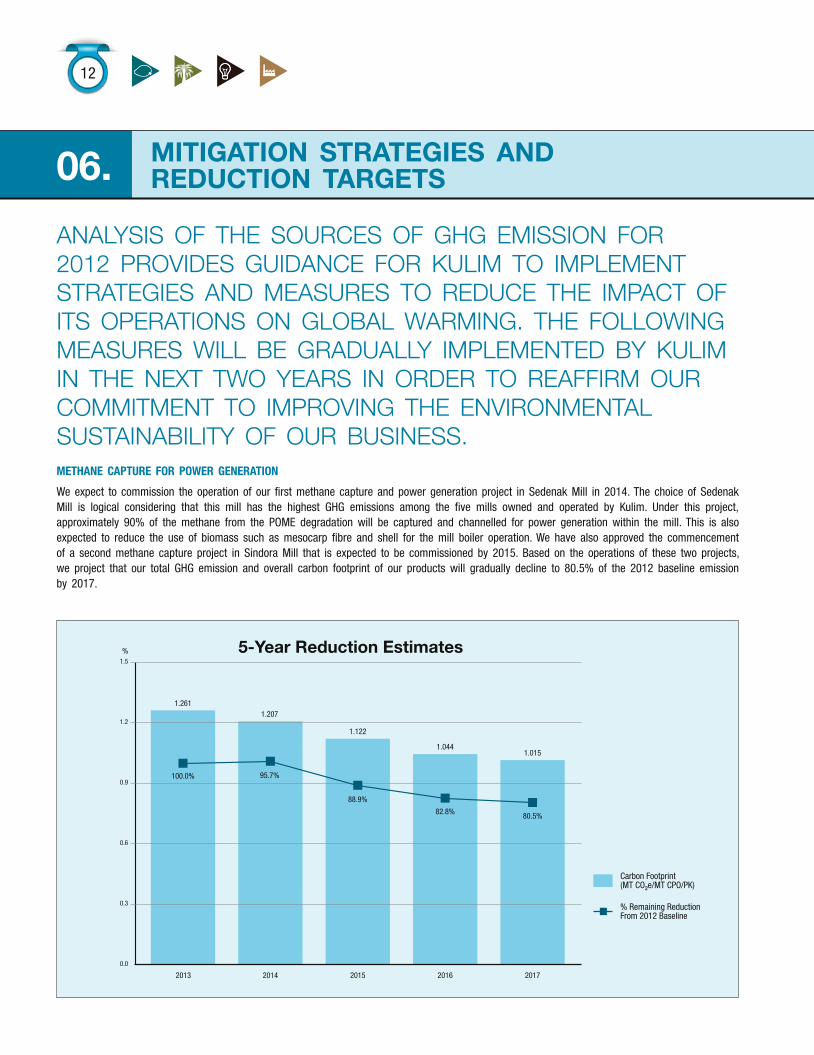
analysis Of the sOurces Of ghg emissiOn fOr 2012 prOvides guidance fOr Kulim tO implement strategies and measures tO reduce the impact Of its OperatiOns On glObal warming. the fOllOwing measures will be gradually implemented by Kulim in the next twO years in Order tO reaffirm Our cOmmitment tO imprOving the envirOnmental sustainability Of Our business.MEthanE capturE for powEr gEnEration
We expect to commission the operation of our first methane capture and power generation project in Sedenak Mill in 2014. The choice of Sedenak Mill is logical considering that this mill has the highest GHG emissions among the five mills owned and operated by Kulim. Under this project, approximately 90% of the methane from the POME degradation will be captured and channelled for power generation within the mill. This is also expected to reduce the use of biomass such as mesocarp fibre and shell for the mill boiler operation. We have also approved the commencement of a second methane capture project in Sindora Mill that is expected to be commissioned by 2015. Based on the operations of these two projects, we project that our total GHG emission and overall carbon footprint of our products will gradually decline to 80.5% of the 2012 baseline emission by 2017.
5-Year Reduction Estimates
0.0
0.3
0.6
0.9
1.2
1.5
%
2013
Carbon Footprint(MT CO²e/MT CPO/PK)
% Remaining ReductionFrom 2012 Baseline
1.261
100.0%
2014
1.207
95.7%
2015
1.122
88.9%
2016
1.044
82.8%
2017
1.015
80.5%
Kulim (Malaysia) BerhadCarbon Footprint Report 2012 13
Kulim will seek to enhance its relationship with stakeholders within this supply chain by engaging these parties to disseminate our commitment to lowering our GHG emissions and improve the accuracy of the field data collected from the outgrowers.
Special attention will be given to FFB traders who provide services to outgrowers who own land assets near primary forests and peat land. Close monitoring mechanism will be established by us to strengthen our commitment to prevent any exploitation of sensitive areas for palm cultivation.
EfficiEnt usE of fErtilisErs
GHG emissions from the production, transport and use of chemical fertilisers is also one of the concerns that Kulim will address in our effort to reduce our impact on the environment. Excessive use of chemical fertilisers will also pollute river and underground water sources.
In order to mitigate this without affecting FFB yield, Kulim has already embarked on a long-term organic fertiliser programme with field data collection underway to optimise the use of both types of fertiliser. In addition, all the five mills already have established composting projects to recycle the nutrient from the empty fruit bunch and POME back to the fields.
Monitor usE of palM KErnEl shEll for carBon offsEt
Palm kernel shell (PKS) from the operation of the mills is currently used for power generation, either within the respective mills or sold to traders for third party consumption. It is estimated that the total amount of PKS produced annually by Kulim’s mill operations amount to 60,000 MT and just over 24% or 14,500 MT are sold for external use. This latter portion translates to a carbon credit potential of 30,000 MT CO2e if the PKS is used to generate power and offset the consumption of fossil-based fuel sources. While it is acknowledged that not all the PKS will eventually be used for power generation, active monitoring and verification by Kulim on the use of the PKS purchased by third parties will provide opportunity for us to include a portion of this potential credit in our future carbon footprint.
EngagEMEnt of outgrowErs and ffB tradErs
In 2012, outgrowers contributed to 34.7% of the FFB processed by Kulim’s mills. These outgrowers consist of two groups; company-owned estates as well as family-owned smallholders. The majority of these two groups supply their FFB via FFB traders who manages, collects, aggregates and deliver the FFB to our mills. This supply chain has been in existence for decades and Kulim firmly believes that the interests of these stakeholders need to be respected and preserved as it contributes to the socio-economic well-being of rural communities.
14
07. mEtHodoloGy
palMghg fraMEworKThe calculations and definitions applied in this report is based on the PalmGHG Calculator Beta Version 1.a developed by the RSPO Greenhouse Working Group 2, which is based on the Global Warming Potential Assessment of Palm Oil Production model.
The PalmGHG framework was developed to identify GHG emission ‘hotspots’ in the life cycle of palm oil, to allow Internal monitoring of GHG emission and to assist palm oil producers in highlighting GHG emission reduction opportunities and developing reduction plans.
sourcEs of ghg EMissions includEd in thE palMghg fraMEworK:
• Land clearing
• Production and transport of fertiliser
• N2O and CO2 emissions from the application of fertilisers in the field
• Use of fossil fuels in the plantation for planting work, harvesting,collection and transport to mills
• Use of fossil fuels in the operation of mills
• Emissions of CH4 from the anaerobic degradation of POME from the mills
• CO2 and N2O emissions from cultivation on peat soil
ghg fixation and crEdits includEd in thE palMghg fraMEworK:
• CO2 fixation by the growth of palm trees
• CO2 fixation by biomass in the conservation areas
• GHG emission avoidance from the use of by-products such aspalm kernel shell as well as use of electricity generated by the biomass from the mills
Exclusion of ghg EMissions sourcEs/sinKs in this MEthodology:
• Nursery planting stage
• Pesticides manufacturing, transport and use
• Fossil fuel use during land clearing activities
• Carbon footprint of infrastructure, plant and equipment
• Carbon sequestration in palm end-products
• Work-related employees travel and commute
Kulim (Malaysia) BerhadCarbon Footprint Report 2012 15
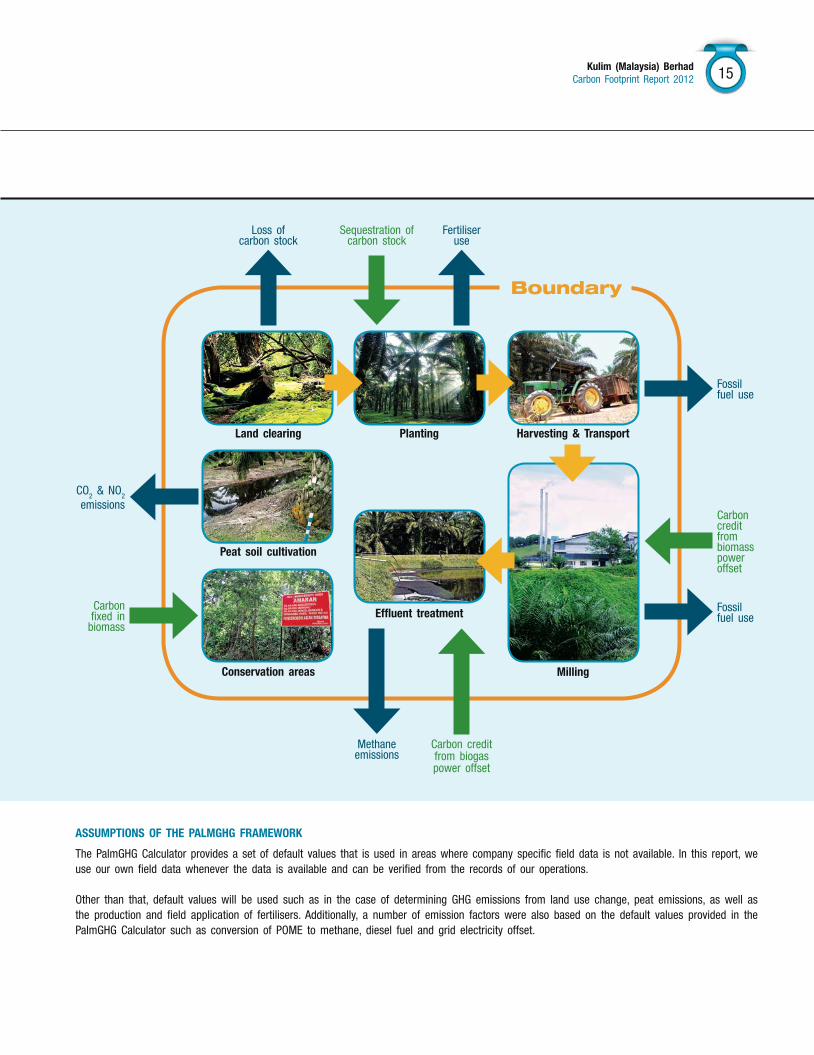
assuMptions of thE palMghg fraMEworK
The PalmGHG Calculator provides a set of default values that is used in areas where company specific field data is not available. In this report, we use our own field data whenever the data is available and can be verified from the records of our operations.
Other than that, default values will be used such as in the case of determining GHG emissions from land use change, peat emissions, as well as the production and field application of fertilisers. Additionally, a number of emission factors were also based on the default values provided in the PalmGHG Calculator such as conversion of POME to methane, diesel fuel and grid electricity offset.
Loss ofcarbon stock
land clearing planting
Effluent treatment
harvesting & transport
Milling
peat soil cultivation
conservation areas
Fossilfuel use
CO2 & NO2 emissions
Carbon fixed in
biomass
Carbon credit from biomass power offset
Fossilfuel use
Fertiliseruse
Carbon credit from biogas power offset
Sequestration ofcarbon stock
Boundary
Methaneemissions
16
07. mEtHodoloGy
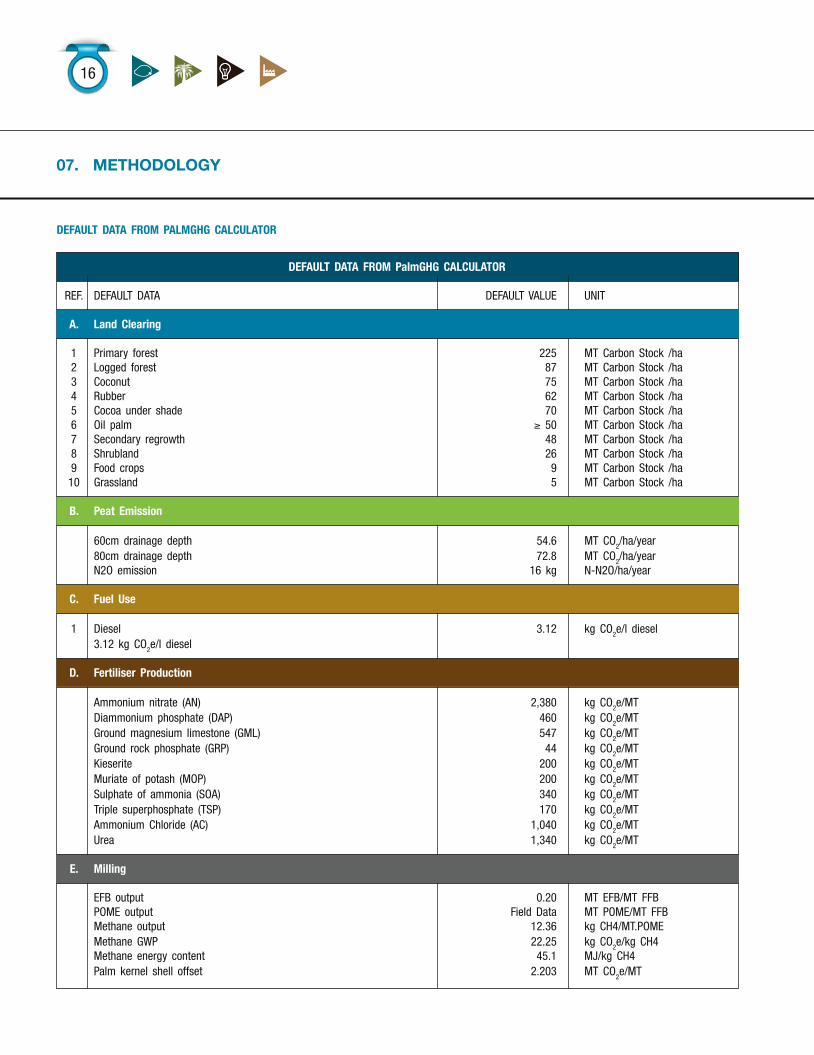
dEfault data froM palMghg calculator
dEfault data froM palmghg calculator
REF. DEFAULT DATA DEFAULT VALUE UNIT
a. land clearing
1 Primary forest 225 MT Carbon Stock /ha 2 Logged forest 87 MT Carbon Stock /ha 3 Coconut 75 MT Carbon Stock /ha 4 Rubber 62 MT Carbon Stock /ha 5 Cocoa under shade 70 MT Carbon Stock /ha 6 Oil palm ≥ 50 MT Carbon Stock /ha 7 Secondary regrowth 48 MT Carbon Stock /ha 8 Shrubland 26 MT Carbon Stock /ha 9 Food crops 9 MT Carbon Stock /ha 10 Grassland 5 MT Carbon Stock /ha
B. peat Emission
60cm drainage depth 54.6 MT CO2/ha/year 80cm drainage depth 72.8 MT CO2/ha/year N2O emission 16 kg N-N2O/ha/year
c. fuel use
1 Diesel 3.12 kg CO2e/l diesel 3.12 kg CO2e/l diesel
d. fertiliser production
Ammonium nitrate (AN) 2,380 kg CO2e/MT Diammonium phosphate (DAP) 460 kg CO2e/MT Ground magnesium limestone (GML) 547 kg CO2e/MT Ground rock phosphate (GRP) 44 kg CO2e/MT Kieserite 200 kg CO2e/MT Muriate of potash (MOP) 200 kg CO2e/MT Sulphate of ammonia (SOA) 340 kg CO2e/MT Triple superphosphate (TSP) 170 kg CO2e/MT Ammonium Chloride (AC) 1,040 kg CO2e/MT Urea 1,340 kg CO2e/MT
E. Milling
EFB output 0.20 MT EFB/MT FFB POME output Field Data MT POME/MT FFB Methane output 12.36 kg CH4/MT.POME Methane GWP 22.25 kg CO2e/kg CH4 Methane energy content 45.1 MJ/kg CH4 Palm kernel shell offset 2.203 MT CO2e/MT
Kulim (Malaysia) BerhadCarbon Footprint Report 2012 17
outgrowEr and sMallholdEr data
The second set of data relates to outgrower crop. Kulim’s external crop is primarily bought from third-party FFB traders who do not disclose the source of FFB. In order to allow some level of monitoring, data was therefore collected using interviews and questionnaires sent to FFB traders and smallholders. Kulim assigned dedicated personnel to engage these stakeholders in the process. A number of factors were found to contribute to a high margin of error:
diversity of suppliers. All the respondents replied and provided the requested data. Data supplied suggested vast differences between suppliers due to differences in previous land use profiles.
insufficient record keeping. Quality of record keeping varies significantly and may lead to a high level of uncertainty. This includes the record on previous land use for the past three decades and the identification of mineral soil versus peat land.
Emissions from non-palm related activity. It is assumed that all the fertilisers and fuels purchased by the smallholders and outgrowers are used for oil palm cultivation and harvesting activities. However, it is likely that resources may be used for other purposes such as additional crops or private transport. A more detailed methodology would therefore apportion use between palm and non-palm related activities.
Despite these shortcomings, we believe that this is still an improvement over standard assumptions that external FFB and a company’s FFB have similar carbon profiles. Our calculations so far indicates that this is not the case. In addition, we believe that external FFB data can be improved over time as engagement with traders and external suppliers continue and levels of trust and transparency increase.
data collEction and liMitationsThere are two distinct sets of data used in this report. Each set of data has associated challenges and scope for improvement.
inhousE data for Mills and own EstatEs
Primary emission data from Kulim’s estate and mills was obtained from statistics and monitoring undertaken by Kulim’s Estates and Engineering Departments. This data is assumed to have a high level of accuracy, although continuous efforts to increase robustness will be undertaken. In particular, three areas may contribute to significant improvements.
crop sequestration – Calculation of carbon sequestration from the planting of new palm trees are estimated from the default values provided in the PalmGHG calculator. These default values are obtained from the OPRODSIM and OPCABSIM models recommended in the calculator. Kulim does not presently have in place a practice of making on-site measurements of the biomass growth of its own palm trees.
peat emissions – While the peat areas within Kulim-owned estates are being actively monitored and controlled for the water table level, similar monitoring and control cannot be ascertained for cultivation by outgrowers. Kulim is in the process of identifying these outgrowers within the supply chain and will work with them to preserve the peat land from degradation.
offset from palm kernel shell – Records from the mill indicate that all the five mills sell part of their shell by-product to external parties. However, there is no compilation of additional data on the eventual use of the shell. While there is strong belief that the shell is used as substitute for coal due to high demand for the shell for this utilisation, the management has decided that this offset will not be included in this report.
18
08. rSPo commEnt: tHE cHallEnGE mEaSurInG outGrowEr carbon footPrInt
rspO commends Kulim (malaysia) bhd for being the first malaysian plantation company to use rspO’s palmghg calculator in their carbon footprint report. the palmghg was developed by the 2nd greenhouse gas working group to enable producers to estimate the net greenhouse gas emissions produced during palm oil production. collection of data from smallholders remains a challenge and Kulim has taken an important first step by engaging with their smallholders in the data collection and in including their emissions in the company’s overall carbon footprint. we hope that with increased awareness and better documentation, smallholders will also be able to play a crucial role in managing carbon emissions from the production of palm oil.
Kulim (Malaysia) BerhadCarbon Footprint Report 2012 19
20
09. data
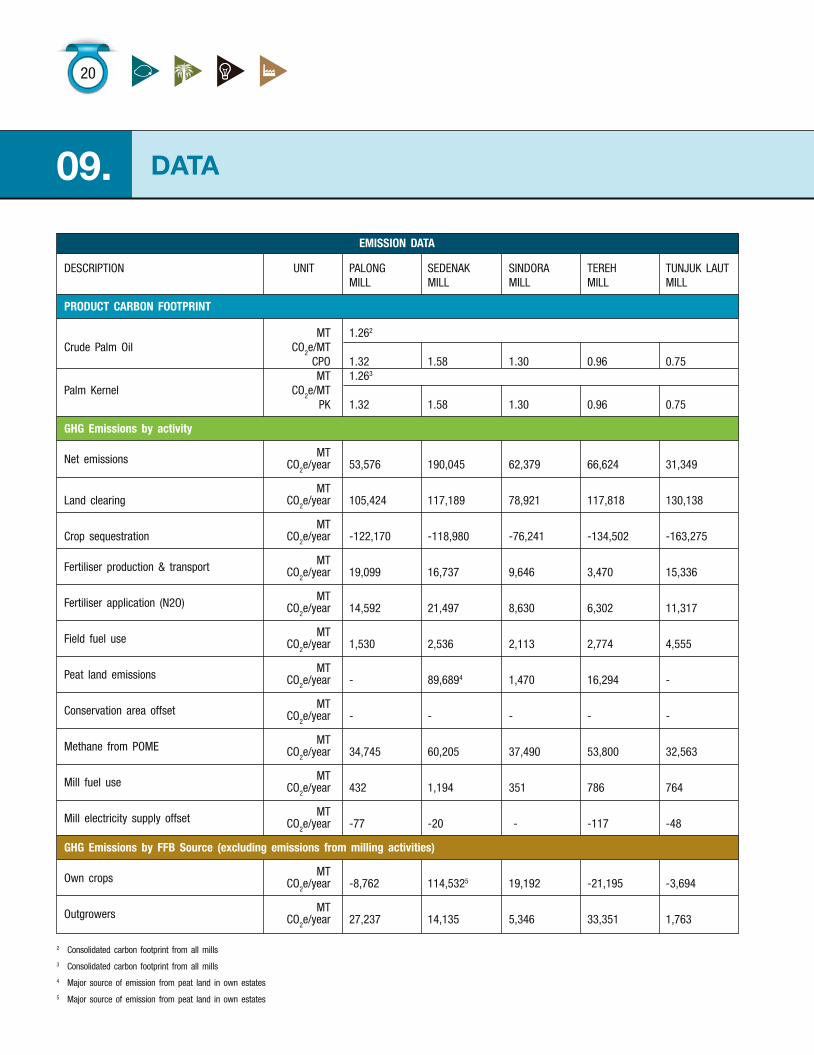
EMission data
DESCRIPTION UNIT PALONG SEDENAK SINDORA TEREH TUNJUK LAUT MILL MILL MILL MILL MILL
product carBon footprint
MT 1.262
Crude Palm Oil CO2e/MT CPO 1.32 1.58 1.30 0.96 0.75 MT 1.263
Palm Kernel CO2e/MT PK 1.32 1.58 1.30 0.96 0.75
ghg Emissions by activity
MTNet emissions CO2e/year 53,576 190,045 62,379 66,624 31,349
MTLand clearing CO2e/year 105,424 117,189 78,921 117,818 130,138
MTCrop sequestration CO2e/year -122,170 -118,980 -76,241 -134,502 -163,275
MTFertiliser production & transport CO2e/year 19,099 16,737 9,646 3,470 15,336
MTFertiliser application (N2O) CO2e/year 14,592 21,497 8,630 6,302 11,317
MTField fuel use CO2e/year 1,530 2,536 2,113 2,774 4,555
MTPeat land emissions CO2e/year - 89,6894 1,470 16,294 -
MTConservation area offset CO2e/year - - - - -
MTMethane from POME CO2e/year 34,745 60,205 37,490 53,800 32,563
MTMill fuel use CO2e/year 432 1,194 351 786 764
MTMill electricity supply offset CO2e/year -77 -20 - -117 -48
ghg Emissions by ffB source (excluding emissions from milling activities)
MTOwn crops CO2e/year -8,762 114,5325 19,192 -21,195 -3,694
MTOutgrowers CO2e/year 27,237 14,135 5,346 33,351 1,763
2 Consolidated carbon footprint from all mills
3 Consolidated carbon footprint from all mills
4 Major source of emission from peat land in own estates
5 Major source of emission from peat land in own estates
Kulim (Malaysia) BerhadCarbon Footprint Report 2012 21
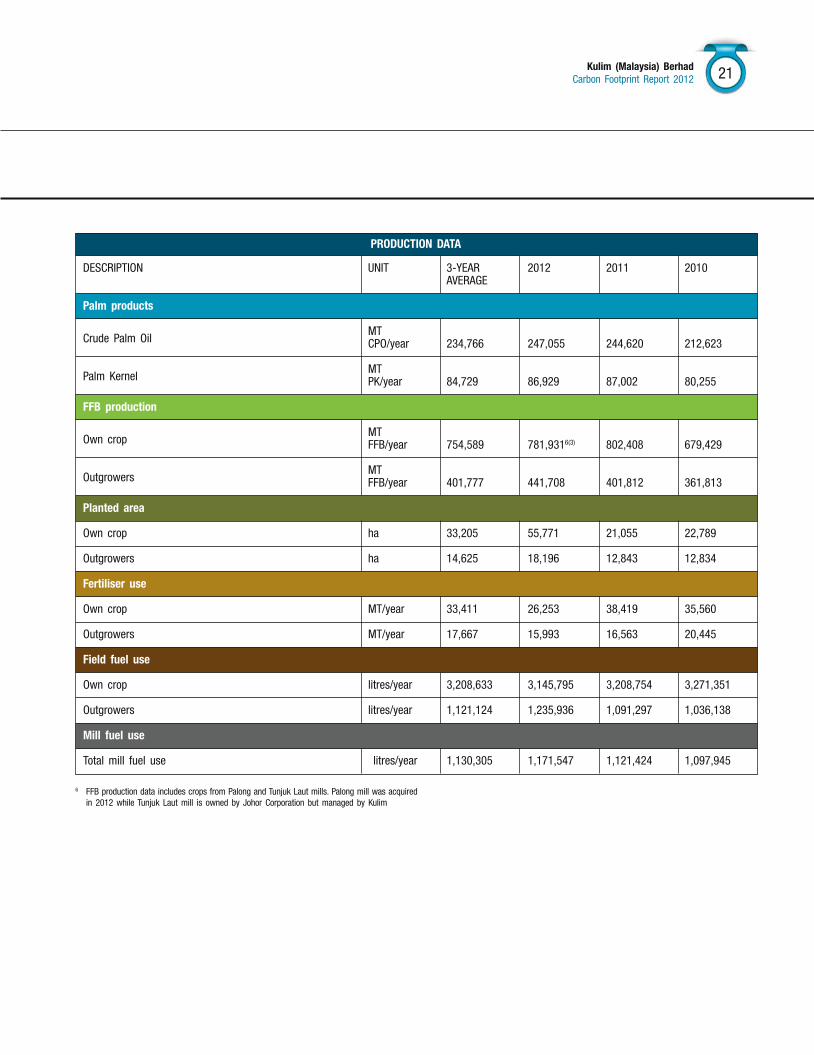
production data
DESCRIPTION UNIT 3-YEAR 2012 2011 2010 AVERAGE
palm products
MTCrude Palm Oil CPO/year 234,766 247,055 244,620 212,623
MTPalm Kernel PK/year 84,729 86,929 87,002 80,255
ffB production
MTOwn crop FFB/year 754,589 781,9316(3) 802,408 679,429
MTOutgrowers FFB/year 401,777 441,708 401,812 361,813
planted area
Own crop ha 33,205 55,771 21,055 22,789
Outgrowers ha 14,625 18,196 12,843 12,834
fertiliser use
Own crop MT/year 33,411 26,253 38,419 35,560
Outgrowers MT/year 17,667 15,993 16,563 20,445
field fuel use
Own crop litres/year 3,208,633 3,145,795 3,208,754 3,271,351
Outgrowers litres/year 1,121,124 1,235,936 1,091,297 1,036,138
Mill fuel use
Total mill fuel use litres/year 1,130,305 1,171,547 1,121,424 1,097,945
6 FFB production data includes crops from Palong and Tunjuk Laut mills. Palong mill was acquired in 2012 while Tunjuk Laut mill is owned by Johor Corporation but managed by Kulim
22
10. GloSSary
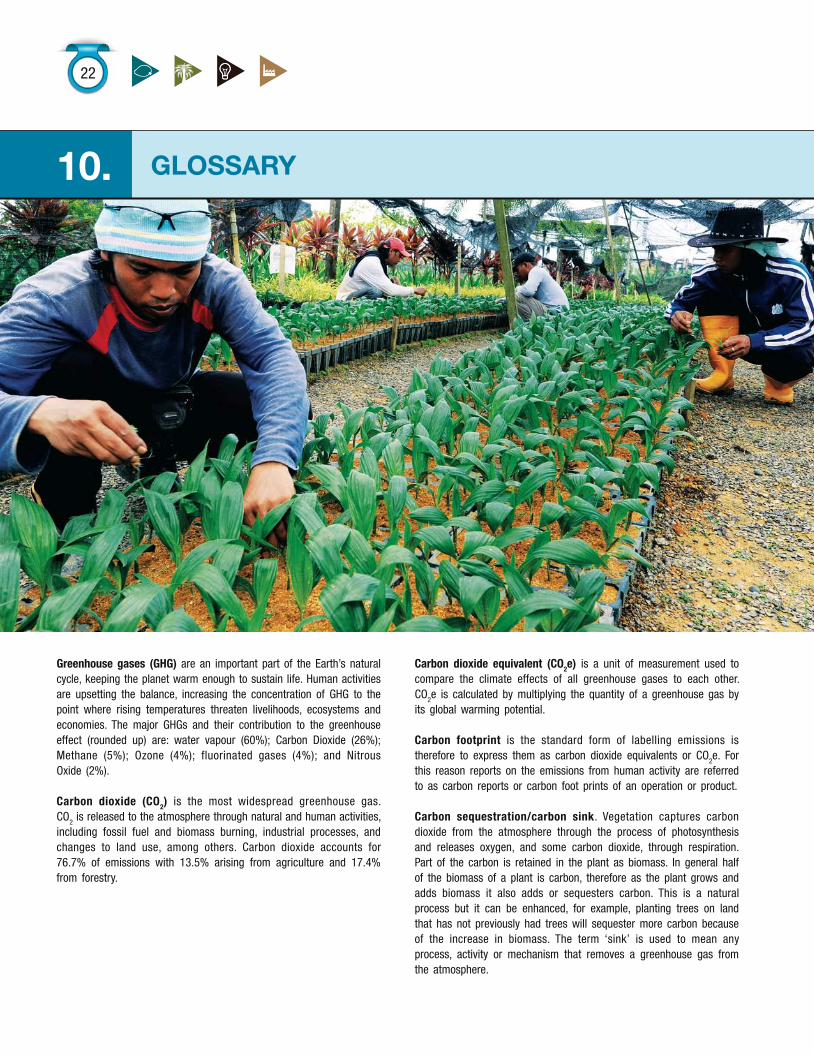
greenhouse gases (ghg) are an important part of the Earth’s natural cycle, keeping the planet warm enough to sustain life. Human activities are upsetting the balance, increasing the concentration of GHG to the point where rising temperatures threaten livelihoods, ecosystems and economies. The major GHGs and their contribution to the greenhouse effect (rounded up) are: water vapour (60%); Carbon Dioxide (26%); Methane (5%); Ozone (4%); fluorinated gases (4%); and Nitrous Oxide (2%).
carbon dioxide (co2) is the most widespread greenhouse gas. CO2 is released to the atmosphere through natural and human activities, including fossil fuel and biomass burning, industrial processes, and changes to land use, among others. Carbon dioxide accounts for 76.7% of emissions with 13.5% arising from agriculture and 17.4% from forestry.
carbon dioxide equivalent (co2e) is a unit of measurement used to compare the climate effects of all greenhouse gases to each other. CO2e is calculated by multiplying the quantity of a greenhouse gas by its global warming potential.
carbon footprint is the standard form of labelling emissions is therefore to express them as carbon dioxide equivalents or CO2e. For this reason reports on the emissions from human activity are referred to as carbon reports or carbon foot prints of an operation or product.
carbon sequestration/carbon sink. Vegetation captures carbon dioxide from the atmosphere through the process of photosynthesis and releases oxygen, and some carbon dioxide, through respiration. Part of the carbon is retained in the plant as biomass. In general half of the biomass of a plant is carbon, therefore as the plant grows and adds biomass it also adds or sequesters carbon. This is a natural process but it can be enhanced, for example, planting trees on land that has not previously had trees will sequester more carbon because of the increase in biomass. The term ‘sink’ is used to mean any process, activity or mechanism that removes a greenhouse gas from the atmosphere.
Kulim (Malaysia) BerhadCarbon Footprint Report 2012 23
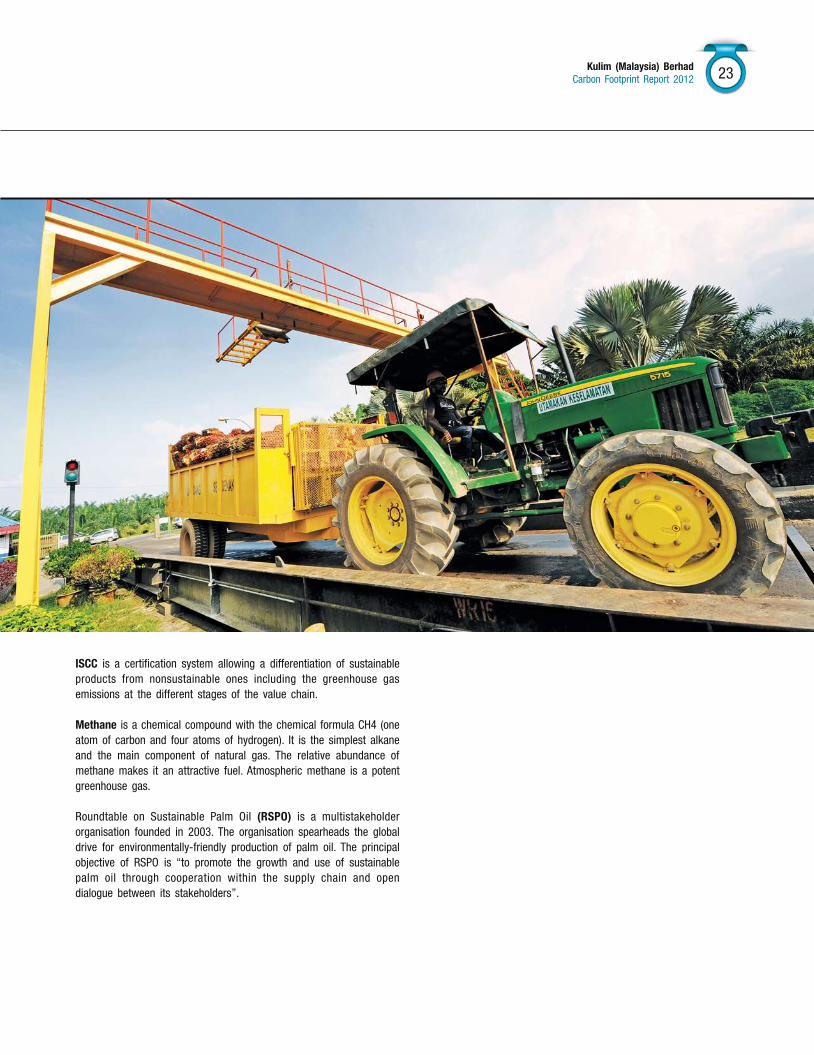
iscc is a certification system allowing a differentiation of sustainable products from nonsustainable ones including the greenhouse gas emissions at the different stages of the value chain.
Methane is a chemical compound with the chemical formula CH4 (one atom of carbon and four atoms of hydrogen). It is the simplest alkane and the main component of natural gas. The relative abundance of methane makes it an attractive fuel. Atmospheric methane is a potent greenhouse gas.
Roundtable on Sustainable Palm Oil (rspo) is a multistakeholder organisation founded in 2003. The organisation spearheads the global drive for environmentally-friendly production of palm oil. The principal objective of RSPO is “to promote the growth and use of sustainable palm oil through cooperation within the supply chain and open dialogue between its stakeholders”.
24
11. rEfErEncES
palMghg - A Greenhouse Gas Accounting Tool for Palm ProductsGreenhouse Gas Working group 2 Roundtable on Sustainable Palm Oil (RSPO) - Laurence Chase, Ian Henson, Amir Abdul-Manan, Fahmuddin Agus Cécile Bessou, Llorenç Milà i Canals, Mukesh Sharma.
pas 2050:2011 - Specification for the assessment of the life cycle greenhouse gas emissions of goods and services Carbon Trust and DEFRA UK.
abouttHIS rEPortThis report covers the Malaysia operations of Kulim (Malaysia) Bhd for the calendar year 2012. Data commitments and targets do not cover Kulim’s current or future acquisitions.
Data presented in this report is on a best-effort basis, and may be subject to change. The data was collated in-house and was screened and analysed by a third party consultant from Helikonia Advisory Sdn Bhd, but has not been subject to independent verification or assurance.
Design by Onemind Advertising Sdn Bhd
Published online and printed in a small run on FSC paper