electricity generation options for a future low carbon
TRANSCRIPT
*Corresponding author’s e-mail: [email protected]
ASM Sc. J., 12, 2019
https://doi.org/10.32802/asmscj.2019.289
Electricity Generation Options for a Future Low Carbon Energy Mix for Malaysia
Cheng Seong Khor1,2 and G. Lalchand2
1Chemical Engineering Department, Universiti Teknologi PETRONAS,
32610 Seri Iskandar, Perak Darul Ridzuan, Malaysia
2Academy of Sciences Malaysia, 20th Floor, West Wing, MATRADE Tower,
Jalan Sultan Haji Ahmad Shah off Jalan Tunku Abdul Halim, 50480 Kuala Lumpur
Malaysia’s electricity generation mix is mainly based on fossil fuels, particularly natural gas and
coal with a smaller share of large hydroelectric and non-hydroelectric renewable energy resources.
The present work aims to analyse and assess the ongoing search for alternatives to fossil fuel for
electricity generation that the country has been pursuing both environmental preservation and
national energy security considerations, thereby suggesting the way forward including potential
options to be deliberated. This paper surveys alternative, both practical and theoretical that can be
considered technically and economically attractive for Malaysia over the period to 2050. The
overall national energy supply and demand situation are first analysed to develop projections that
account for the role of renewable energy, particularly that of solar photovoltaic (PV). Next, the
paper discusses the progress achieved, and the current status of the national solar PV industry
presents the advantages or benefits offered and outlines the remaining challenges. In the same
manner, electricity generation from the biogas produced from methane recovery in treating palm
oil mill effluent (POME) is assessed. In the final analysis, the paper considers other potential low
carbon power generation options to make up the Malaysian energy mix, which include small
hydroelectricity, municipal solid waste decomposition in suitably-engineered landfills, nuclear
energy using thorium-based technology, and renewable marine energy particularly ocean thermal
energy conversion (OTEC), in tandem with savings expected from energy efficiency and
conservation (EE&C) initiatives.
Keywords: energy supply; energy demand; energy projections; energy mix; sustainable energy;
low carbon
I. INTRODUCTION
Malaysia’s primary energy supply consists of oil, gas, coal,
hydroelectric, and renewable resources. The nation’s
electricity generation mix is also largely based on fossil
fuels, particularly natural gas and coal with a small share of
renewable energy (RE) resources, including
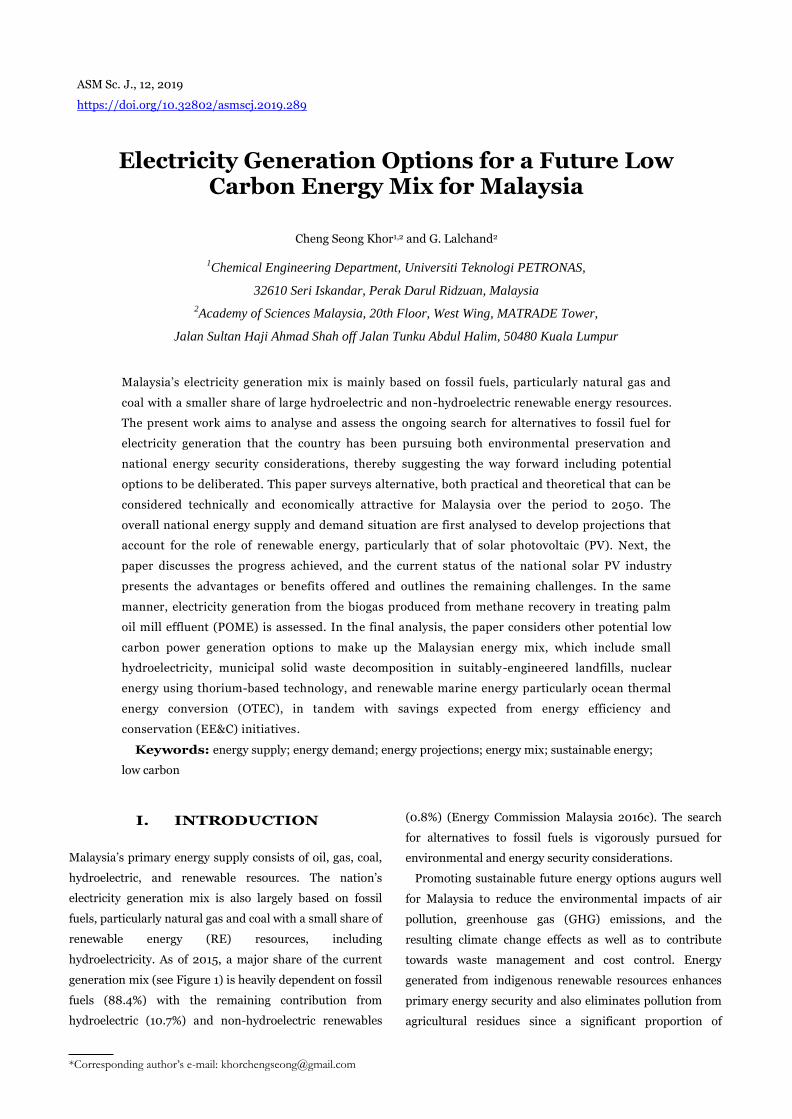
hydroelectricity. As of 2015, a major share of the current
generation mix (see Figure 1) is heavily dependent on fossil
fuels (88.4%) with the remaining contribution from
hydroelectric (10.7%) and non-hydroelectric renewables
(0.8%) (Energy Commission Malaysia 2016c). The search
for alternatives to fossil fuels is vigorously pursued for
environmental and energy security considerations.
Promoting sustainable future energy options augurs well
for Malaysia to reduce the environmental impacts of air
pollution, greenhouse gas (GHG) emissions, and the
resulting climate change effects as well as to contribute
towards waste management and cost control. Energy
generated from indigenous renewable resources enhances
primary energy security and also eliminates pollution from
agricultural residues since a significant proportion of
ASM Science Journal, Volume 12, 2019
2
renewables use such materials. A key issue in energy
production and management is how to quickly replace
fuels such as coal and petroleum products, which produce
carbon dioxide besides other toxic emissions, with other
energy sources that can be generated without producing
such emissions.
Figure 1. Malaysia: Electricity generation mix (GWh) in
Malaysia for 2015 (Energy Commission Malaysia 2016c).
(Note: “Hydro” includes mini hydro; “Oil” includes
distillate products; “Others” includes non-hydroelectric
renewables such as biomass, solar, biogas, biomass and
diesel (biodiesel), natural gas and diesel.)
A number of reviews are available covering various
aspects, issues, and perspectives related to the Malaysian
energy landscape particularly on RE (Ahmad et al., 2011;
Hashim et al., 2011; Ong et al., 2011; Shafie et al., 2011;
Mekhilef et al., 2014; Basri et al., 2015). A recent one is by
Oh et al. (2018) with a similar focus on alternative, mainly
renewable forms of energy for the Malaysian energy policy,
which serves as an update to an earlier article by the same
main author and one of the co-authors (Oh et al., 2010).
Ahmad et al. (2014) present a numerical modelling
approach for multiple-criteria decision making (called
analytic hierarchy process) to select RE sources and
technologies for developing a sustainable electricity
generation system for Malaysia. This paper’s authors have
also published a critical review on sustainable options for
electricity generation in Malaysia (Khor et al., 2014),
intended as policy advisory representing the views of the
Academy of Sciences Malaysia, which publishes this
journal.
This paper analyses the opportunities for these energy
options for Malaysia by reviewing the progress and status of
renewable energy in Malaysia. By setting the premise of the
present situation, the work aims to examine the prospect of
renewable energy development and uptake in Malaysia,
supported by quantitative analyses, and to highlight the
remaining challenges ahead in the endeavour.
II. CURRENT STATUS OF RENEWABLE ENERGY IN
MALAYSIA
Malaysia has a variety of RE resources that can be utilised
for carbon free or low carbon electricity generation to
displace reliance on fossil fuels. The available economically
viable options have been detailed in the SEDA mechanism
for the promotion of such renewable energy-powered
electricity generation (Abdul Malek 2010). These have been
restricted to small hydroelectricity, photovoltaic (PV),
biomass and biogas (especially from palm oil plantation
waste), solid waste particularly from municipals (i.e., MSW),
and geothermal energy focusing on the geothermal power
plant development project at Tawau in Sabah. In particular,
Malaysia possesses substantial hydroelectric resource,
especially in the East Malaysia state of Sarawak, which is by
far the largest renewable energy resource deployed in the
country. Large hydroelectric dams are also in operation in
West Malaysia such as in Temengor, Perak and Kenyir,
Terengganu.
The strategy of diversifying the nation’s energy mix by
including RE is aimed at increasing supply reliability and
security by relying less on imported fossil fuels while
continuing to monitor the overall reliability of the electricity
generation and supply system. As regards promoting
sustainability through renewable energy, Malaysia’s
electricity generation mix is planned to be less dependent on
fossil fuels, which currently comprises about 46.3% from
natural gas and 41.0% from coal in terms of energy (Energy
Commission Malaysia 2016c).
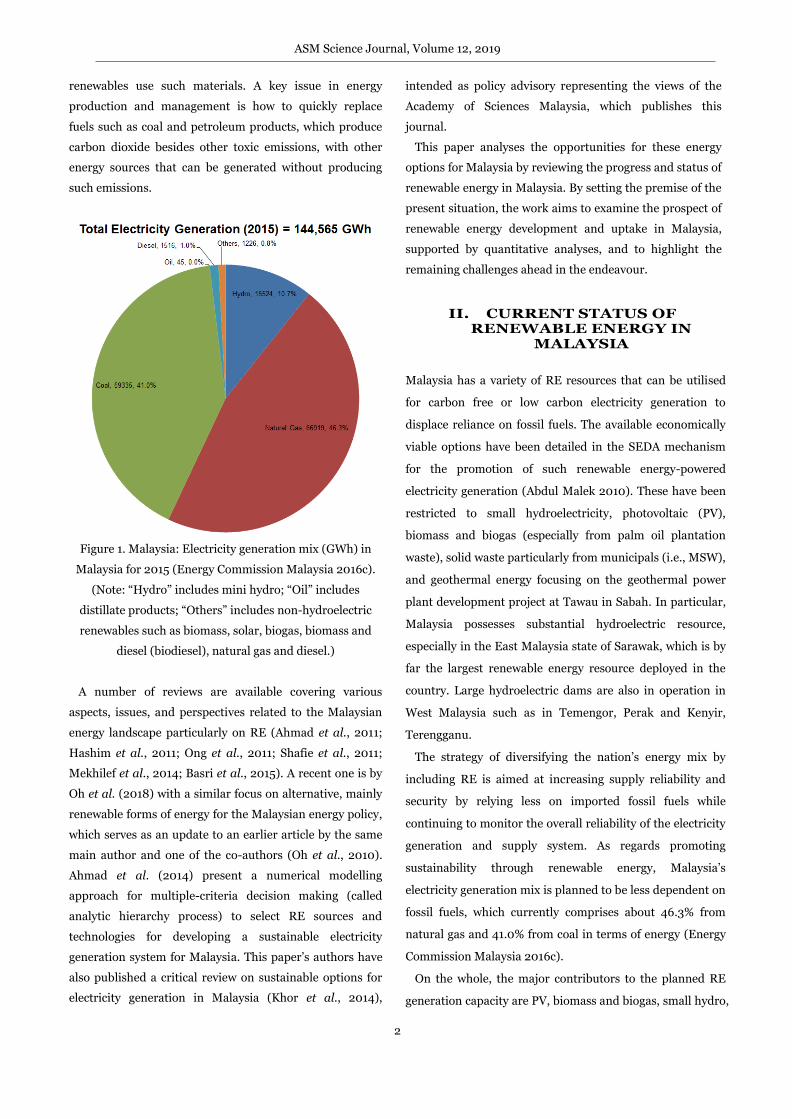
On the whole, the major contributors to the planned RE
generation capacity are PV, biomass and biogas, small hydro,
ASM Science Journal, Volume 12, 2019
3
waste to energy, and geothermal, as shown in Figure 2.
Other potential RE options that are exploited in many
countries such as marine RE (wave, tidal, and ocean
thermal energy conversion (OTEC)), as well as wind (both
onshore and offshore), have been excluded as their resource
potential in Malaysia and the equatorial zone, in general,
are found to be inadequate for commercial exploitation
(SIRIM 2013).
Figure 2. Installed power generation capacity (MW) (both
on-grid and off-grid) in Malaysia for 2015 (Energy
Commission Malaysia 2016b)
Contribution of renewables to the country’s electricity
generation mix has grown with the implementation of a
feed-in tariff (FiT) scheme under the Renewable Energy Act
2011 (RE Act). The Act was supplemented by the formation
of Sustainable Energy Development Authority (SEDA) as
the legally designated agency for its implementation,
supported by a funding mechanism to pay the increased or
“top-up” tariff under FiT by way of a 1.6% levy on the
electricity bills for affected consumers.
RE Act particularly through FiT aimed to achieve a RE
capacity share of 11% (2080MW) in 2020 and 17%
(4000MW) by 2030 for Peninsular Malaysia (i.e., excluding
Sabah and Sarawak). FiT has promoted electricity
generation from renewables, particularly from solar PV
systems as the scheme is very lucrative, and it is easy to
install PV systems quickly. The FiT regime for PV was
terminated in 2017, but FiT for the other RE technologies
remains.
Following the termination of the FiT scheme for PV,
further promotion of PV systems was modified with greater
emphasis on large scale solar (LSS) systems, which is also
called utility-scale solar (USS) systems besides through the
Net Energy Metering (NEM) scheme (see Section IV(A) for
more details) and for self-consumption (SelCo), which
aimed to maintain the high pace growth of solar PV capacity.
These systems do not qualify for any FiT incentive but are
based on NEM for SelCo and consumers’ own, typically
rooftop, installations.
The LSS/USS installations are however subject to tender
auctions by the Malaysian Energy Commission (or
Suruhanjaya Tenaga) at RE tariff rates based on the
tendered quotes. They are paid directly by the authorised
electricity suppliers (i.e., Tenaga Nasional Berhad (TNB) in
Peninsular Malaysia or Sabah Electricity Sendirian Berhad
(SESB) in the East Malaysia state of Sabah, referred to as the
single buyer off-taker) under individual power purchase
agreements.
The NEM and SelCo schemes did not take-off as well as
expected because of perceived unfavourable tariffs offered;
the “net energy” was not on actual net energy metering basis.
The apparent drawback has been rectified recently by a
decision by the Malaysian minister in charge of the energy
portfolio (under the Ministry of Energy, Science, Technology,
Environment and Climate Change or MESTECC) to make
the NEM a true net energy metering and billing system (Yeo
2018). Such change and reclassification of NEM beginning
January 2019 are anticipated to make the financial viability
more attractive to prospective consumers to take advantage
of the revised billing mechanism. Hence, going forward, the
take-up capacity of NEM and SelCo is likely to accelerate.
Also, the MESTECC Minister has announced a revised
national target for RE generating capacity share of 20% by
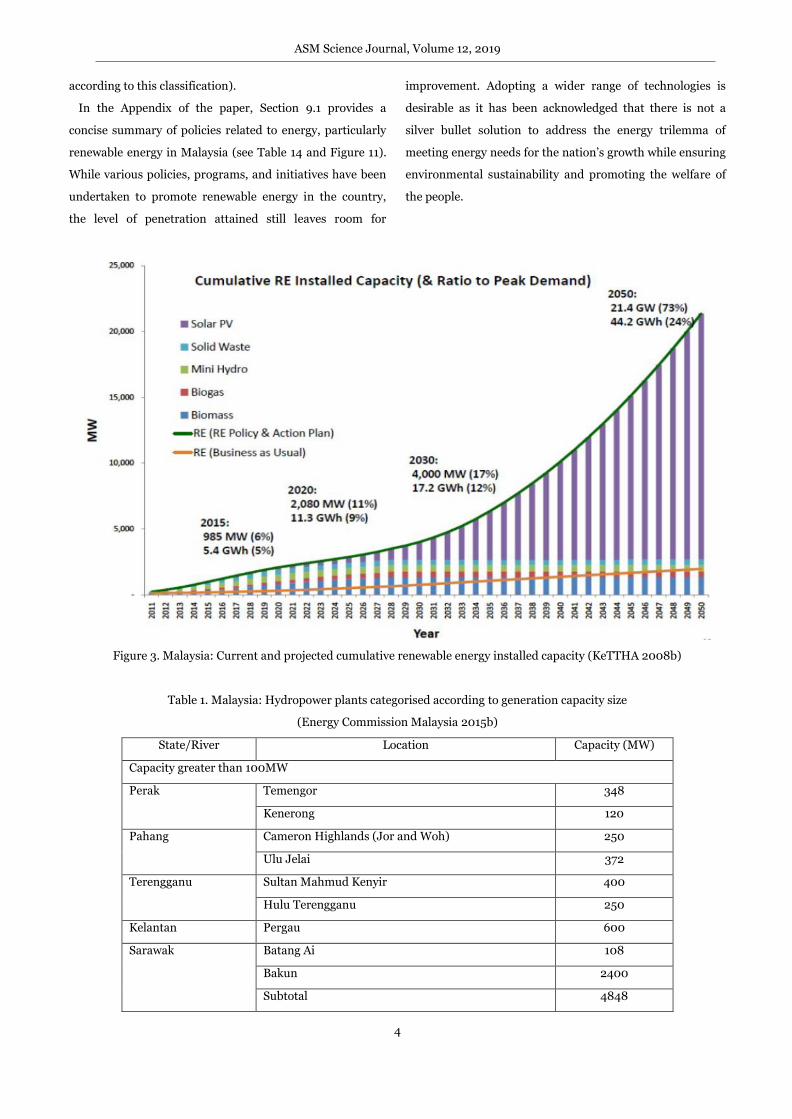
2025, which excludes large hydroelectric power plants. In
this respect, the large hydroelectric plants are defined as
those with generating capacity of over 100MW (see Table 1
for a list of hydroelectric plants in Malaysia grouped
ASM Science Journal, Volume 12, 2019
4
according to this classification).
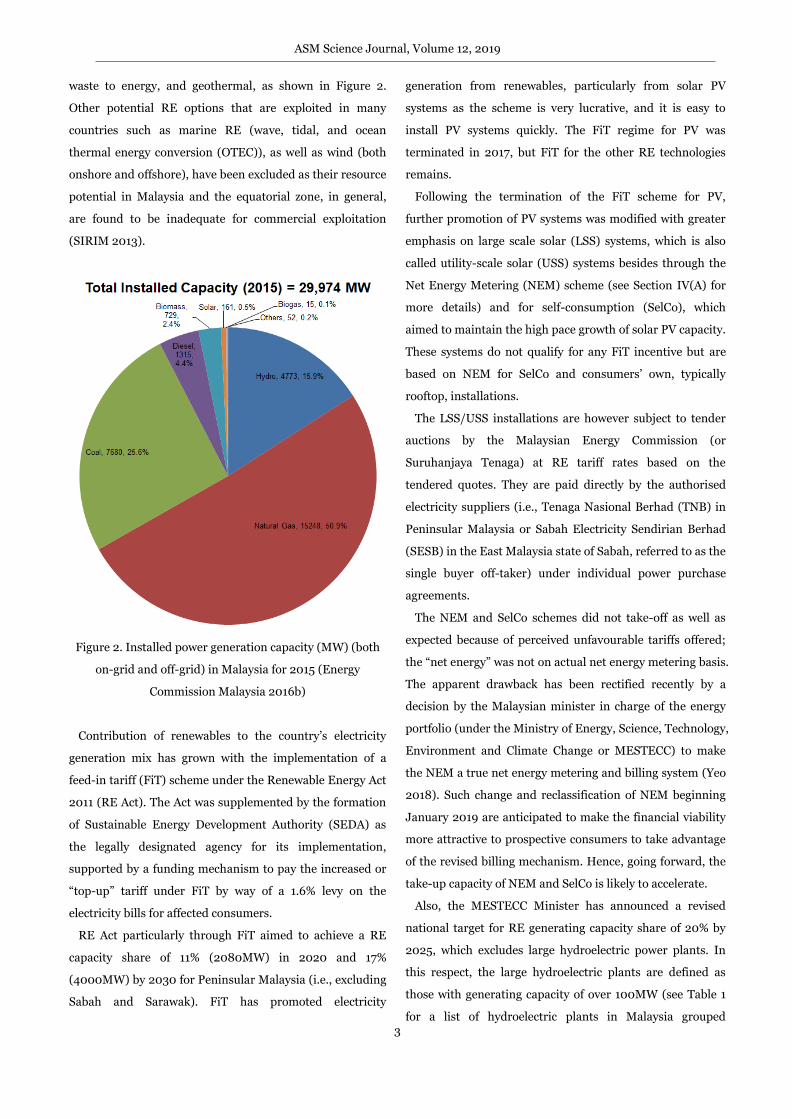
In the Appendix of the paper, Section 9.1 provides a
concise summary of policies related to energy, particularly
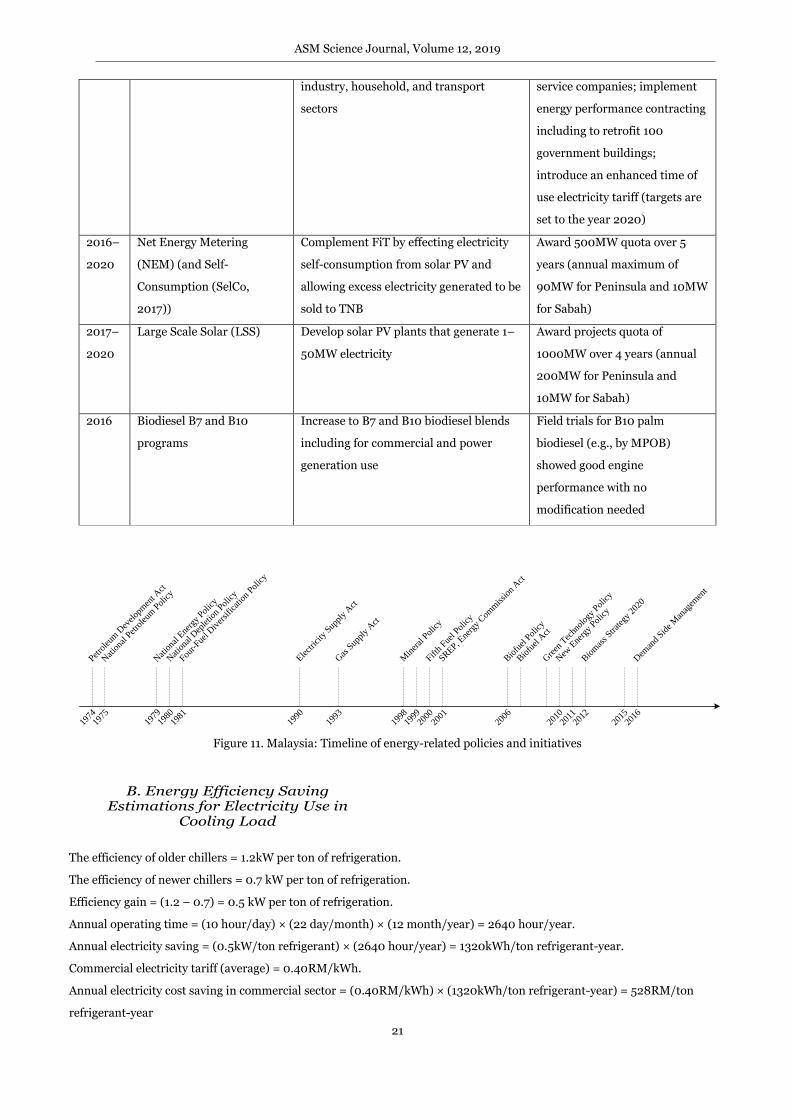
renewable energy in Malaysia (see Table 14 and Figure 11).
While various policies, programs, and initiatives have been
undertaken to promote renewable energy in the country,
the level of penetration attained still leaves room for
improvement. Adopting a wider range of technologies is
desirable as it has been acknowledged that there is not a
silver bullet solution to address the energy trilemma of
meeting energy needs for the nation’s growth while ensuring
environmental sustainability and promoting the welfare of
the people.
Figure 3. Malaysia: Current and projected cumulative renewable energy installed capacity (KeTTHA 2008b)
Table 1. Malaysia: Hydropower plants categorised according to generation capacity size
(Energy Commission Malaysia 2015b)
State/River Location Capacity (MW)
Capacity greater than 100MW
Perak Temengor 348
Kenerong 120
Pahang Cameron Highlands (Jor and Woh) 250
Ulu Jelai 372
Terengganu Sultan Mahmud Kenyir 400
Hulu Terengganu 250
Kelantan Pergau 600
Sarawak Batang Ai 108
Bakun 2400
Subtotal 4848
ASM Science Journal, Volume 12, 2019
5
Capacity less than 100MW
Perak/Sungai Perak Chenderoh 40.5
Bersia 72
Upper Piah (Sg. Piah Hulu) 14.6
Lower Piah (Sg. Piah Hilir) 54
Pahang Cameron Highlands 11.9
Kelantan Kenerong Upper 12
Kenerong Lower 8
Sabah Tenom Pangi 69
Subtotal 282.0
Mini-hydro
Perak Sungai Renyok 1.6
Sungai Perdak 0.342
Sungai Bil 0.225
Sungai Kinjang 0.325
Sungai Asap 0.11
Sungai Chempias 0.12
Sungai Tebing Tinggi 0.152
Kedah Sungai Tawar Besar 0.552
Sungai Mahang 0.454
Sungai Mempelam
Terengganu Sungai Cheralak 0.48
Sungai Berang 0.364
Subtotal 4.724
Grant Total 5134.724
III. MALAYSIA’S ENERGY SUPPLY AND DEMAND
A. Current Scenario
Based on the Malaysian Energy Commission (or
Suruhanjaya Tenaga) data as of 2015 (see Figure 2), the
current renewables installed generation capacity including
large scale hydroelectricity is 5730MW or 19.1% of the fuel
mix (Energy Commission Malaysia 2016b). The installed
capacity excluding large scale hydroelectricity is 957MW or
3.2% of the total. Note that the Energy Commission data
may have reported a higher installed biomass capacity
(801MW) than that of the SEDA data (142MW) due to the
inclusion of self-generated electricity (i.e., non-grid
connected) from palm oil mills.
In terms of 2015 energy generation, renewables including
hydroelectricity contributed 11.6% (16,750GWh) to the fuel
mix; the figure is 0.9% (1226GWh) without hydroelectricity.
While the non-large-hydroelectric renewables share is
forecast to increase to 20% by 2025 (Yeo 2018), its use is
still to complement that of fossil fuels partly due to the
intermittency effect of solar PV output and ease of access.
Overall, the installed capacity and energy generation shares
are mainly contributed by fossil fuels and large
hydroelectricity.
Data for 2011 to 2015 shows an average consumption load
factor of about 70%, which is a ratio of electricity consumed
to its maximum demand. Over the same period, an average
capacity factor (ratio of electricity generated to its installed
generation capacity) of greater than 50% is indicated for
Malaysia. A study commissioned by the Academy of Sciences
ASM Science Journal, Volume 12, 2019
6
Malaysia reports both factors within the stated range
(Akademi Sains Malaysia 2015).
B. Energy Supply and Demand Projections
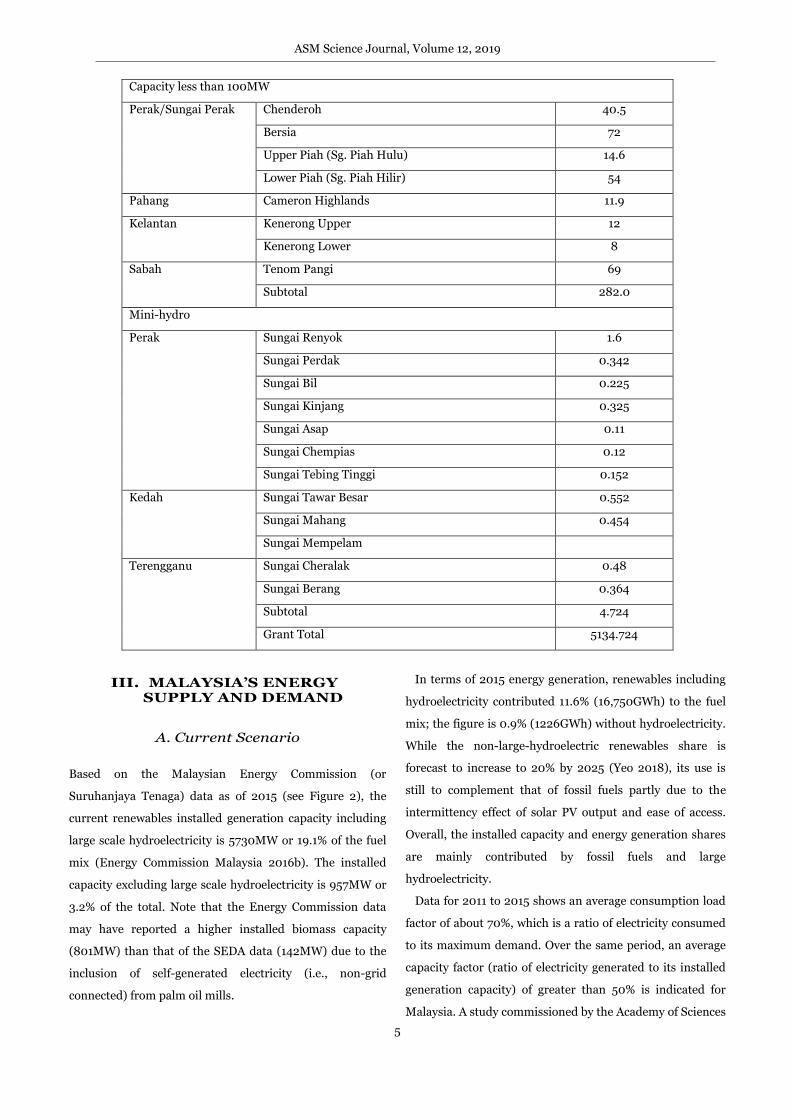
Official statistics on the power generation capacity (in MW)
mix for Peninsular Malaysia with projections to the year
2026 is shown in Figure 4. The projections show a large
capacity increase from 2019 to 2020, which then stays fairly
constant till 2024, but is then expected to decrease. No
specific strategies that can contribute to such capacity (or
demand) decline are indicated although the national energy
efficiency or demand-side management (DSM) initiatives
appear to be the main rationale for the projected demand
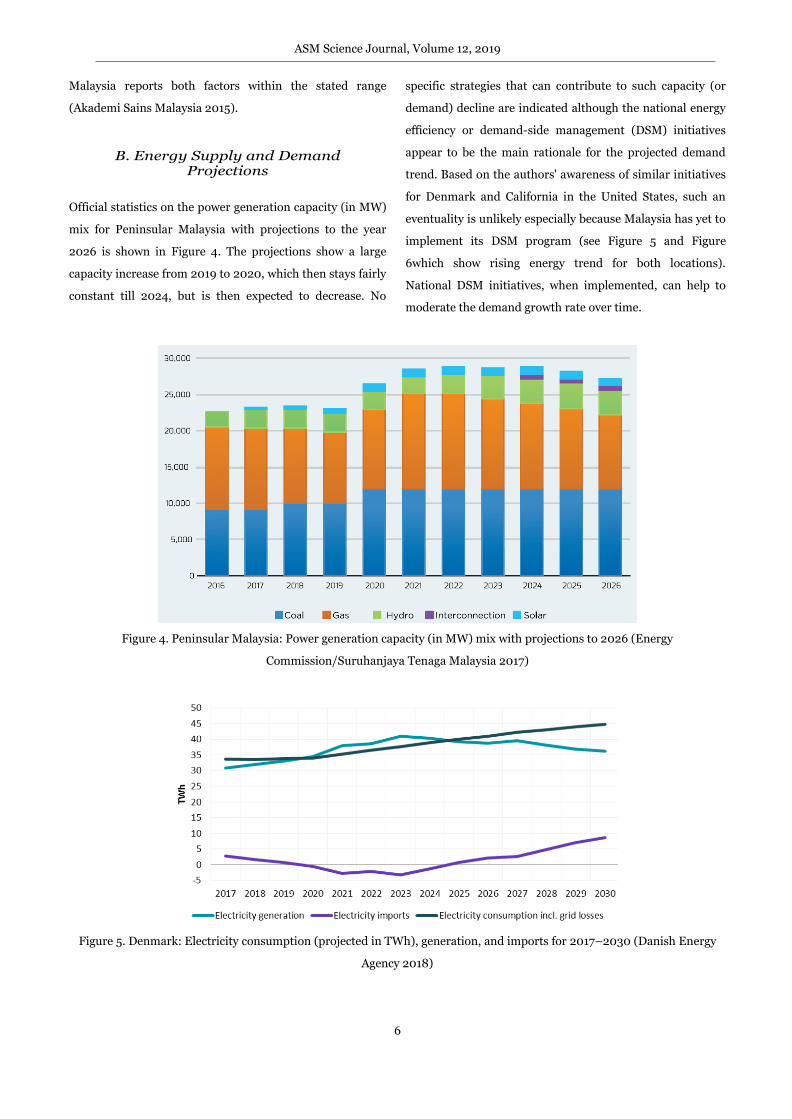
trend. Based on the authors' awareness of similar initiatives
for Denmark and California in the United States, such an
eventuality is unlikely especially because Malaysia has yet to
implement its DSM program (see Figure 5 and Figure
6which show rising energy trend for both locations).
National DSM initiatives, when implemented, can help to
moderate the demand growth rate over time.
Figure 4. Peninsular Malaysia: Power generation capacity (in MW) mix with projections to 2026 (Energy
Commission/Suruhanjaya Tenaga Malaysia 2017)
Figure 5. Denmark: Electricity consumption (projected in TWh), generation, and imports for 2017–2030 (Danish Energy
Agency 2018)
ASM Science Journal, Volume 12, 2019
7
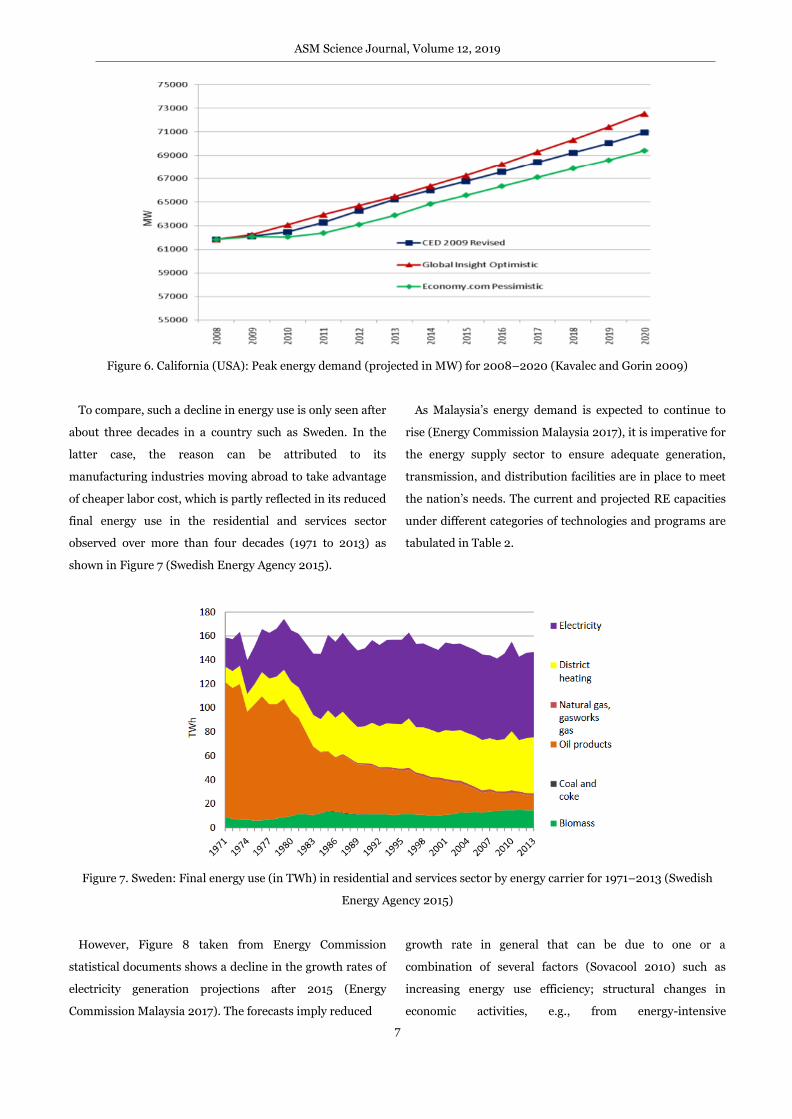
Figure 6. California (USA): Peak energy demand (projected in MW) for 2008–2020 (Kavalec and Gorin 2009)
To compare, such a decline in energy use is only seen after
about three decades in a country such as Sweden. In the
latter case, the reason can be attributed to its
manufacturing industries moving abroad to take advantage
of cheaper labor cost, which is partly reflected in its reduced
final energy use in the residential and services sector
observed over more than four decades (1971 to 2013) as
shown in Figure 7 (Swedish Energy Agency 2015).
As Malaysia’s energy demand is expected to continue to
rise (Energy Commission Malaysia 2017), it is imperative for
the energy supply sector to ensure adequate generation,
transmission, and distribution facilities are in place to meet
the nation’s needs. The current and projected RE capacities
under different categories of technologies and programs are
tabulated in Table 2.
Figure 7. Sweden: Final energy use (in TWh) in residential and services sector by energy carrier for 1971–2013 (Swedish
Energy Agency 2015)
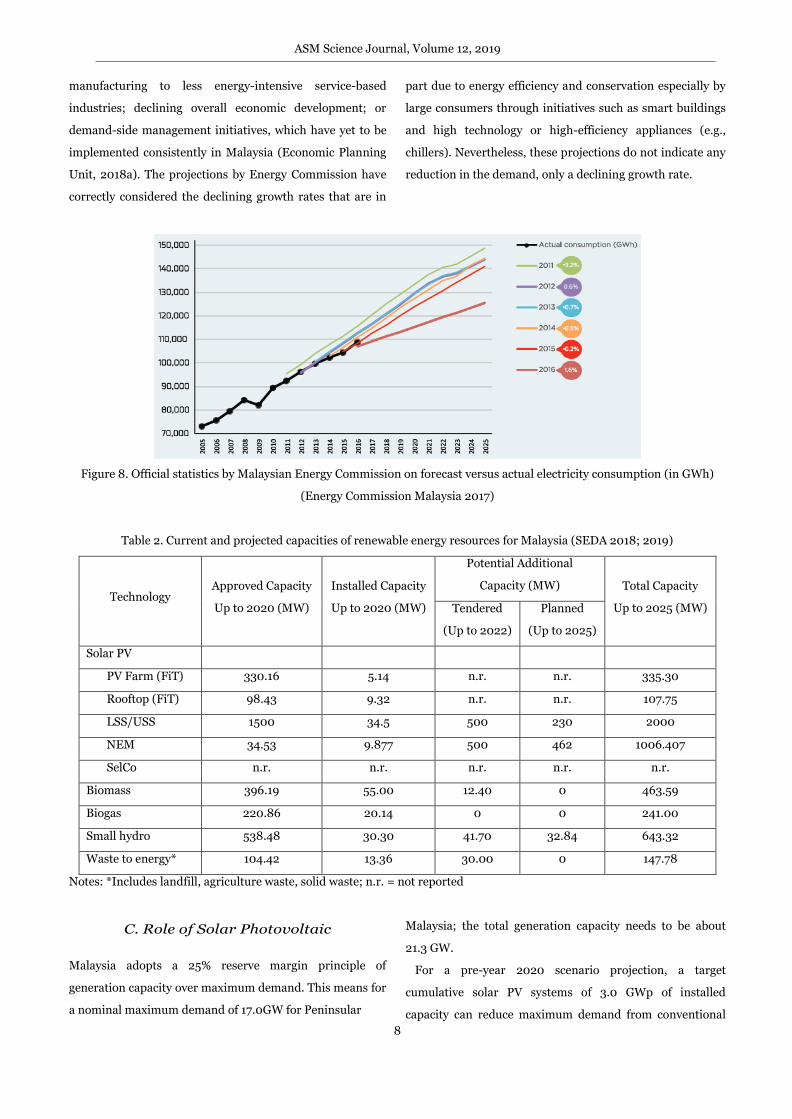
However, Figure 8 taken from Energy Commission
statistical documents shows a decline in the growth rates of
electricity generation projections after 2015 (Energy
Commission Malaysia 2017). The forecasts imply reduced
growth rate in general that can be due to one or a
combination of several factors (Sovacool 2010) such as
increasing energy use efficiency; structural changes in
economic activities, e.g., from energy-intensive
ASM Science Journal, Volume 12, 2019
8
manufacturing to less energy-intensive service-based
industries; declining overall economic development; or
demand-side management initiatives, which have yet to be
implemented consistently in Malaysia (Economic Planning
Unit, 2018a). The projections by Energy Commission have
correctly considered the declining growth rates that are in
part due to energy efficiency and conservation especially by
large consumers through initiatives such as smart buildings
and high technology or high-efficiency appliances (e.g.,
chillers). Nevertheless, these projections do not indicate any
reduction in the demand, only a declining growth rate.
Figure 8. Official statistics by Malaysian Energy Commission on forecast versus actual electricity consumption (in GWh)
(Energy Commission Malaysia 2017)
Table 2. Current and projected capacities of renewable energy resources for Malaysia (SEDA 2018; 2019)
Technology Approved Capacity
Up to 2020 (MW)
Installed Capacity
Up to 2020 (MW)
Potential Additional
Capacity (MW) Total Capacity
Up to 2025 (MW) Tendered
(Up to 2022)
Planned
(Up to 2025)
Solar PV
PV Farm (FiT) 330.16 5.14 n.r. n.r. 335.30
Rooftop (FiT) 98.43 9.32 n.r. n.r. 107.75
LSS/USS 1500 34.5 500 230 2000
NEM 34.53 9.877 500 462 1006.407
SelCo n.r. n.r. n.r. n.r. n.r.
Biomass 396.19 55.00 12.40 0 463.59
Biogas 220.86 20.14 0 0 241.00
Small hydro 538.48 30.30 41.70 32.84 643.32
Waste to energy* 104.42 13.36 30.00 0 147.78
Notes: *Includes landfill, agriculture waste, solid waste; n.r. = not reported
C. Role of Solar Photovoltaic
Malaysia adopts a 25% reserve margin principle of
generation capacity over maximum demand. This means for
a nominal maximum demand of 17.0GW for Peninsular
Malaysia; the total generation capacity needs to be about
21.3 GW.
For a pre-year 2020 scenario projection, a target
cumulative solar PV systems of 3.0 GWp of installed
capacity can reduce maximum demand from conventional
ASM Science Journal, Volume 12, 2019
9
electricity generation by approximately 2.4GW based on the
actual on-site maximum generation of about 80% of the
nominal capacity due to ambient thermal effect (Nelson,
2011).
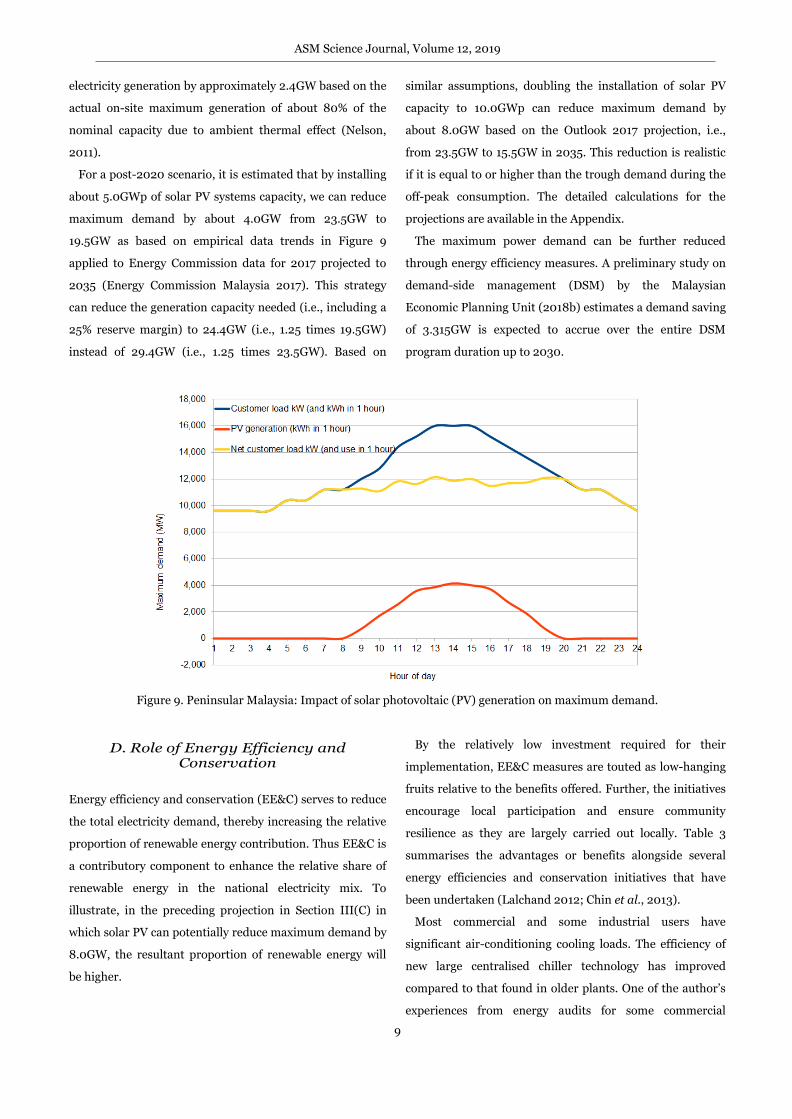
For a post-2020 scenario, it is estimated that by installing
about 5.0GWp of solar PV systems capacity, we can reduce
maximum demand by about 4.0GW from 23.5GW to
19.5GW as based on empirical data trends in Figure 9
applied to Energy Commission data for 2017 projected to
2035 (Energy Commission Malaysia 2017). This strategy
can reduce the generation capacity needed (i.e., including a
25% reserve margin) to 24.4GW (i.e., 1.25 times 19.5GW)
instead of 29.4GW (i.e., 1.25 times 23.5GW). Based on
similar assumptions, doubling the installation of solar PV
capacity to 10.0GWp can reduce maximum demand by
about 8.0GW based on the Outlook 2017 projection, i.e.,
from 23.5GW to 15.5GW in 2035. This reduction is realistic
if it is equal to or higher than the trough demand during the
off-peak consumption. The detailed calculations for the
projections are available in the Appendix.
The maximum power demand can be further reduced
through energy efficiency measures. A preliminary study on
demand-side management (DSM) by the Malaysian
Economic Planning Unit (2018b) estimates a demand saving
of 3.315GW is expected to accrue over the entire DSM
program duration up to 2030.
Figure 9. Peninsular Malaysia: Impact of solar photovoltaic (PV) generation on maximum demand.
D. Role of Energy Efficiency and Conservation
Energy efficiency and conservation (EE&C) serves to reduce
the total electricity demand, thereby increasing the relative
proportion of renewable energy contribution. Thus EE&C is
a contributory component to enhance the relative share of
renewable energy in the national electricity mix. To
illustrate, in the preceding projection in Section III(C) in
which solar PV can potentially reduce maximum demand by
8.0GW, the resultant proportion of renewable energy will
be higher.
By the relatively low investment required for their
implementation, EE&C measures are touted as low-hanging
fruits relative to the benefits offered. Further, the initiatives
encourage local participation and ensure community
resilience as they are largely carried out locally. Table 3
summarises the advantages or benefits alongside several
energy efficiencies and conservation initiatives that have
been undertaken (Lalchand 2012; Chin et al., 2013).
Most commercial and some industrial users have
significant air-conditioning cooling loads. The efficiency of
new large centralised chiller technology has improved
compared to that found in older plants. One of the author’s
experiences from energy audits for some commercial
ASM Science Journal, Volume 12, 2019
10
consumers show their air conditioning energy use share at
50 to 60% and lighting energy use share at up to 30%. The
share of air conditioning and lighting energy use for
industries are not as well known, but they may be of the
conservative order of about 10% of their respective total
consumption (KeTTHA 2009). The calculation details for
the estimated saving is given in the Appendix.
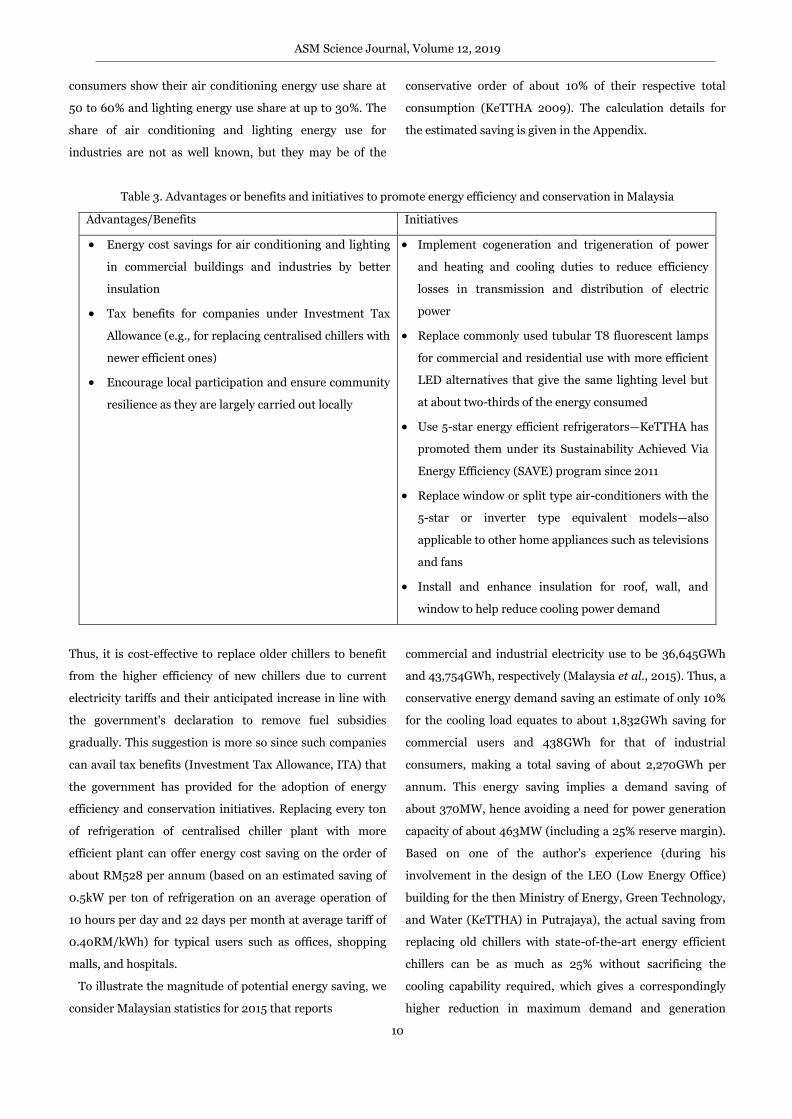
Table 3. Advantages or benefits and initiatives to promote energy efficiency and conservation in Malaysia
Advantages/Benefits Initiatives
Energy cost savings for air conditioning and lighting
in commercial buildings and industries by better
insulation
Tax benefits for companies under Investment Tax
Allowance (e.g., for replacing centralised chillers with
newer efficient ones)
Encourage local participation and ensure community
resilience as they are largely carried out locally
Implement cogeneration and trigeneration of power
and heating and cooling duties to reduce efficiency
losses in transmission and distribution of electric
power
Replace commonly used tubular T8 fluorescent lamps
for commercial and residential use with more efficient
LED alternatives that give the same lighting level but
at about two-thirds of the energy consumed
Use 5-star energy efficient refrigerators—KeTTHA has
promoted them under its Sustainability Achieved Via
Energy Efficiency (SAVE) program since 2011
Replace window or split type air-conditioners with the
5-star or inverter type equivalent models—also
applicable to other home appliances such as televisions
and fans
Install and enhance insulation for roof, wall, and
window to help reduce cooling power demand
Thus, it is cost-effective to replace older chillers to benefit
from the higher efficiency of new chillers due to current
electricity tariffs and their anticipated increase in line with
the government's declaration to remove fuel subsidies
gradually. This suggestion is more so since such companies
can avail tax benefits (Investment Tax Allowance, ITA) that
the government has provided for the adoption of energy
efficiency and conservation initiatives. Replacing every ton
of refrigeration of centralised chiller plant with more
efficient plant can offer energy cost saving on the order of
about RM528 per annum (based on an estimated saving of
0.5kW per ton of refrigeration on an average operation of
10 hours per day and 22 days per month at average tariff of
0.40RM/kWh) for typical users such as offices, shopping
malls, and hospitals.
To illustrate the magnitude of potential energy saving, we
consider Malaysian statistics for 2015 that reports
commercial and industrial electricity use to be 36,645GWh
and 43,754GWh, respectively (Malaysia et al., 2015). Thus, a
conservative energy demand saving an estimate of only 10%
for the cooling load equates to about 1,832GWh saving for
commercial users and 438GWh for that of industrial
consumers, making a total saving of about 2,270GWh per
annum. This energy saving implies a demand saving of
about 370MW, hence avoiding a need for power generation
capacity of about 463MW (including a 25% reserve margin).
Based on one of the author’s experience (during his
involvement in the design of the LEO (Low Energy Office)
building for the then Ministry of Energy, Green Technology,
and Water (KeTTHA) in Putrajaya), the actual saving from
replacing old chillers with state-of-the-art energy efficient
chillers can be as much as 25% without sacrificing the
cooling capability required, which gives a correspondingly
higher reduction in maximum demand and generation
ASM Science Journal, Volume 12, 2019
11
capacity need.
Similarly, energy efficient lighting for commercial and
industrial users would provide additional saving. Based on
shares of energy used of 20% for commercial and 10% for
industrial users, and conservative prospective saving to be
achieved of about 48% (up to 50%) for T8 fluorescent tubes
replaced with LED, changing existing lighting to the latter
more efficient alternative can save 1173GWh a year. Further,
there can be additional saving for air-conditioning due to a
lighting energy saving of about 20%, which equals to
235GWh. Thus the combined lighting and air-conditioning
energy saving would equate to a demand saving of about
229MW, implying a reduction in power generation capacity
required of about 287MW.
The total potential energy saving from using energy
efficient lighting and replacing existing older centralised
chillers with new more efficient units can be as much as
3677GWh, which would equate to a demand reduction of
600MW. Allowing for a 25% reserve margin, this would
equate to a reduction in required power generation capacity
of 750MW.
Energy-efficient air-conditioners can contribute an annual
saving of 76.65GWh per year up to a total potential saving of
919.8GWh. This estimate is made by assuming 1 million
units are changed (or installed) annually with 20% (i.e.,
200,000 units) being the energy-efficient 5-star air-
conditioners over a 12-year period (thus giving a total
replacement of 2.4 million out of 12 million units) with a
conservative 25% energy saving for an average daily use of 6
hours at 70% utilisation factor. Carrying out such
replacement of domestic air-conditioners can reduce
demand by 975MW and power generation capacity by 1.219
GW.
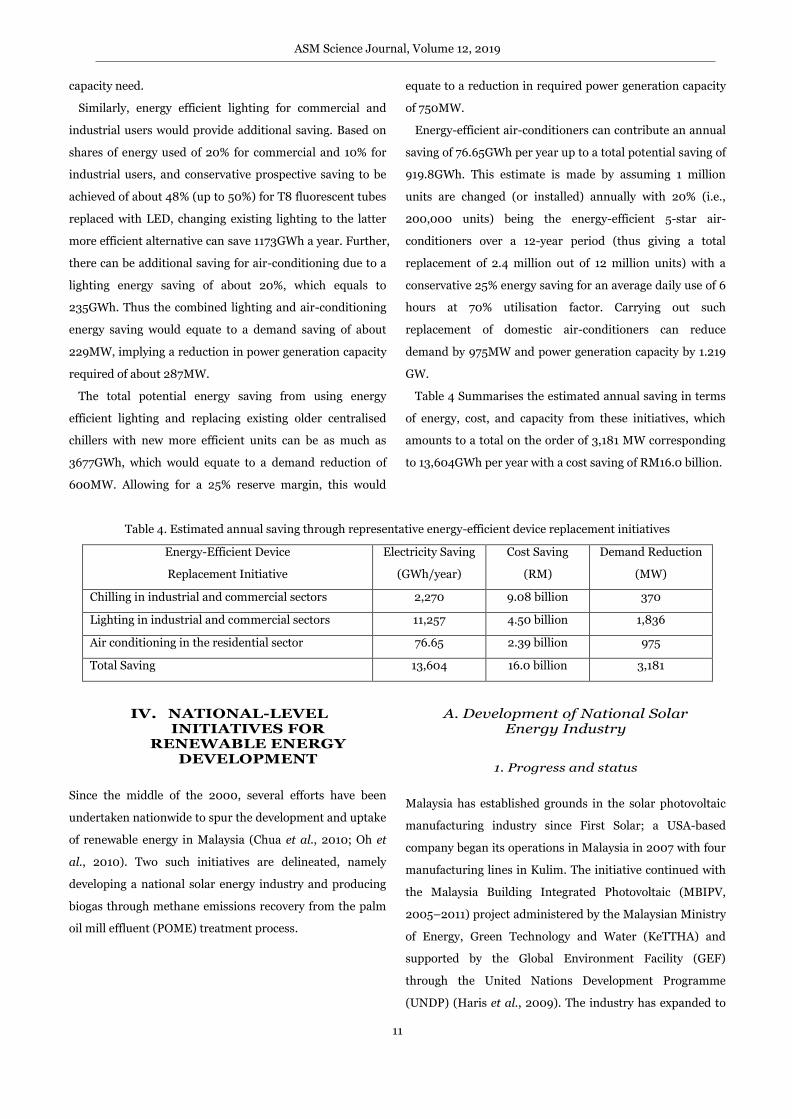
Table 4 Summarises the estimated annual saving in terms
of energy, cost, and capacity from these initiatives, which
amounts to a total on the order of 3,181 MW corresponding
to 13,604GWh per year with a cost saving of RM16.0 billion.
Table 4. Estimated annual saving through representative energy-efficient device replacement initiatives
Energy-Efficient Device
Replacement Initiative
Electricity Saving
(GWh/year)
Cost Saving
(RM)
Demand Reduction
(MW)
Chilling in industrial and commercial sectors 2,270 9.08 billion 370
Lighting in industrial and commercial sectors 11,257 4.50 billion 1,836
Air conditioning in the residential sector 76.65 2.39 billion 975
Total Saving 13,604 16.0 billion 3,181
IV. NATIONAL-LEVEL INITIATIVES FOR
RENEWABLE ENERGY DEVELOPMENT
Since the middle of the 2000, several efforts have been
undertaken nationwide to spur the development and uptake
of renewable energy in Malaysia (Chua et al., 2010; Oh et
al., 2010). Two such initiatives are delineated, namely
developing a national solar energy industry and producing
biogas through methane emissions recovery from the palm
oil mill effluent (POME) treatment process.
A. Development of National Solar Energy Industry
1. Progress and status
Malaysia has established grounds in the solar photovoltaic
manufacturing industry since First Solar; a USA-based
company began its operations in Malaysia in 2007 with four
manufacturing lines in Kulim. The initiative continued with
the Malaysia Building Integrated Photovoltaic (MBIPV,
2005–2011) project administered by the Malaysian Ministry
of Energy, Green Technology and Water (KeTTHA) and
supported by the Global Environment Facility (GEF)
through the United Nations Development Programme
(UNDP) (Haris et al., 2009). The industry has expanded to
ASM Science Journal, Volume 12, 2019
12
become a major economic development sector with
international market reach (Academy of Sciences Malaysia
2010). After First Solar, several other international
companies have set up solar PV manufacturing facilities in
Malaysia such as SunPower (USA) (SunPower Corporation
2014) and Hanwa Q Cells (Germany) (Hanwa Q Cells
GmBH 2014).
The ongoing Net Energy Metering (NEM) scheme allows
industrial, commercial, and residential consumers to install
rooftop solar PV systems for self-consumption and for the
excess electricity to be exported to the national grid at a set
selling rate or displaced cost. However, the overall response
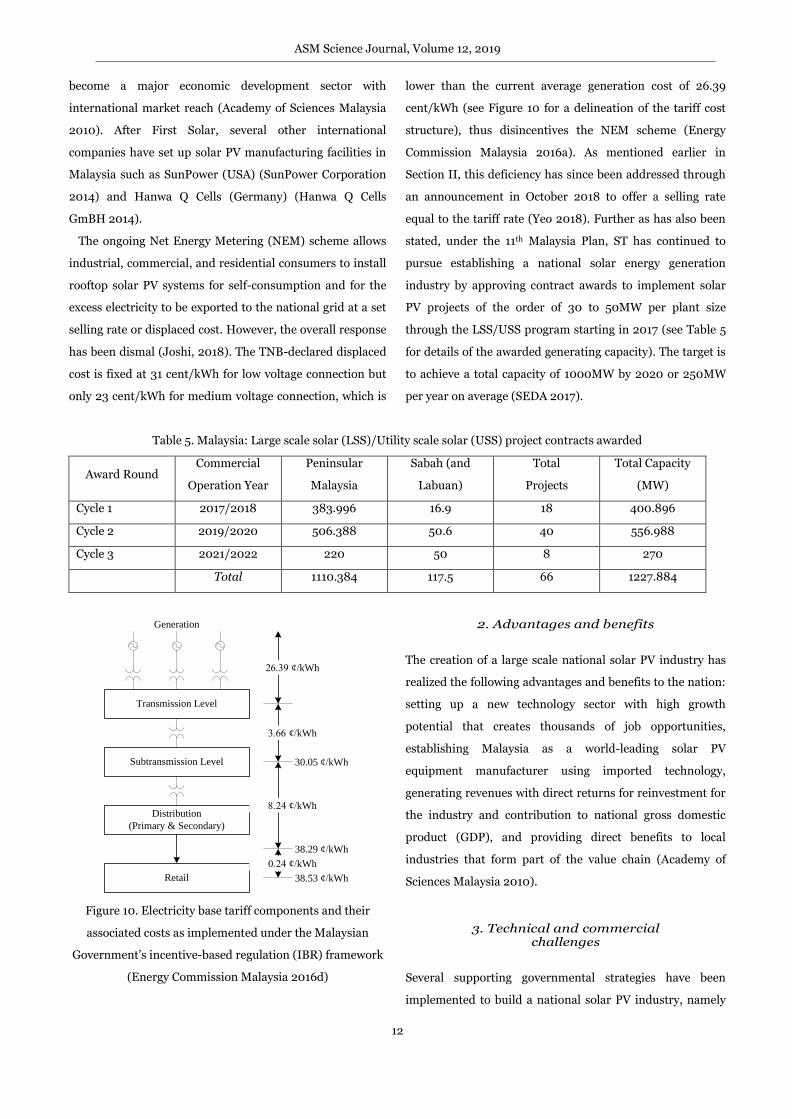
has been dismal (Joshi, 2018). The TNB-declared displaced
cost is fixed at 31 cent/kWh for low voltage connection but
only 23 cent/kWh for medium voltage connection, which is
lower than the current average generation cost of 26.39
cent/kWh (see Figure 10 for a delineation of the tariff cost
structure), thus disincentives the NEM scheme (Energy
Commission Malaysia 2016a). As mentioned earlier in
Section II, this deficiency has since been addressed through
an announcement in October 2018 to offer a selling rate
equal to the tariff rate (Yeo 2018). Further as has also been
stated, under the 11th Malaysia Plan, ST has continued to
pursue establishing a national solar energy generation
industry by approving contract awards to implement solar
PV projects of the order of 30 to 50MW per plant size
through the LSS/USS program starting in 2017 (see Table 5
for details of the awarded generating capacity). The target is
to achieve a total capacity of 1000MW by 2020 or 250MW
per year on average (SEDA 2017).
Table 5. Malaysia: Large scale solar (LSS)/Utility scale solar (USS) project contracts awarded
Award Round Commercial
Operation Year
Peninsular
Malaysia
Sabah (and
Labuan)
Total
Projects
Total Capacity
(MW)
Cycle 1 2017/2018 383.996 16.9 18 400.896
Cycle 2 2019/2020 506.388 50.6 40 556.988
Cycle 3 2021/2022 220 50 8 270
Total 1110.384 117.5 66 1227.884
Transmission Level
Subtransmission Level
Distribution
(Primary & Secondary)
Retail
26.39 ¢/kWh
Generation
30.05 ¢/kWh
38.29 ¢/kWh
38.53 ¢/kWh
3.66 ¢/kWh
8.24 ¢/kWh
0.24 ¢/kWh
Figure 10. Electricity base tariff components and their
associated costs as implemented under the Malaysian
Government’s incentive-based regulation (IBR) framework
(Energy Commission Malaysia 2016d)
2. Advantages and benefits
The creation of a large scale national solar PV industry has
realized the following advantages and benefits to the nation:
setting up a new technology sector with high growth
potential that creates thousands of job opportunities,
establishing Malaysia as a world-leading solar PV
equipment manufacturer using imported technology,
generating revenues with direct returns for reinvestment for
the industry and contribution to national gross domestic
product (GDP), and providing direct benefits to local
industries that form part of the value chain (Academy of
Sciences Malaysia 2010).
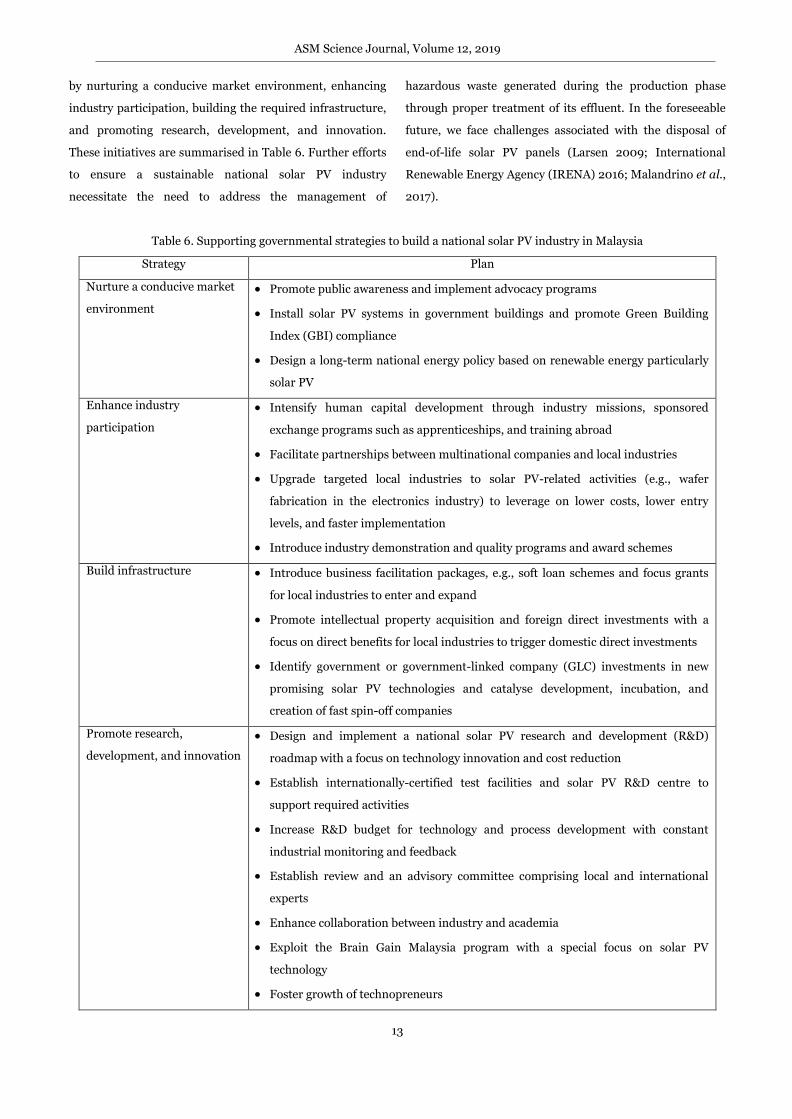
3. Technical and commercial challenges
Several supporting governmental strategies have been
implemented to build a national solar PV industry, namely
ASM Science Journal, Volume 12, 2019
13
by nurturing a conducive market environment, enhancing
industry participation, building the required infrastructure,
and promoting research, development, and innovation.
These initiatives are summarised in Table 6. Further efforts
to ensure a sustainable national solar PV industry
necessitate the need to address the management of
hazardous waste generated during the production phase
through proper treatment of its effluent. In the foreseeable
future, we face challenges associated with the disposal of
end-of-life solar PV panels (Larsen 2009; International
Renewable Energy Agency (IRENA) 2016; Malandrino et al.,
2017).
Table 6. Supporting governmental strategies to build a national solar PV industry in Malaysia
Strategy Plan
Nurture a conducive market
environment
Promote public awareness and implement advocacy programs
Install solar PV systems in government buildings and promote Green Building
Index (GBI) compliance
Design a long-term national energy policy based on renewable energy particularly
solar PV
Enhance industry
participation
Intensify human capital development through industry missions, sponsored
exchange programs such as apprenticeships, and training abroad
Facilitate partnerships between multinational companies and local industries
Upgrade targeted local industries to solar PV-related activities (e.g., wafer
fabrication in the electronics industry) to leverage on lower costs, lower entry
levels, and faster implementation
Introduce industry demonstration and quality programs and award schemes
Build infrastructure Introduce business facilitation packages, e.g., soft loan schemes and focus grants
for local industries to enter and expand
Promote intellectual property acquisition and foreign direct investments with a
focus on direct benefits for local industries to trigger domestic direct investments
Identify government or government-linked company (GLC) investments in new
promising solar PV technologies and catalyse development, incubation, and
creation of fast spin-off companies
Promote research,
development, and innovation
Design and implement a national solar PV research and development (R&D)
roadmap with a focus on technology innovation and cost reduction
Establish internationally-certified test facilities and solar PV R&D centre to
support required activities
Increase R&D budget for technology and process development with constant
industrial monitoring and feedback
Establish review and an advisory committee comprising local and international
experts
Enhance collaboration between industry and academia
Exploit the Brain Gain Malaysia program with a special focus on solar PV
technology
Foster growth of technopreneurs
ASM Science Journal, Volume 12, 2019
14
B. Methane Recovery and Biogas Production from Palm Oil Mill
Effluent Treatment
1. Progress and status
It is now mandated for all palm oil mills to recover or avoid
methane gas emissions in treating the wastewater discharge
of palm oil mill effluent (POME) to meet regulatory
discharge limits. There is potential to use the methane for
electricity and heat generation subject to appropriate
treatment and upgrade to suitable quality as biogas (Wu et
al., 2010).
The Malaysian Government’s Economic Transformation
Programme (ETP) under Entry Point Project 5 (EPP5)
requires palm oil mills to install facilities to generate biogas
or avoid methane emissions by 2020 (PEMANDU 2010).
The biogas can be used internally within a mill through co-
firing with biomass or replacing the fuel in a boiler to
generate steam and chilled water. In the former approach,
there is an opportunity to use fewer biomass sources such
as oil palm mesocarp fibres and make them available for
other downstream higher value uses. Another possibility is
to supply the captured biogas to local communities through
pipelines or in bottles (Malaysian Industry-Government
Group for High Technology (MIGHT) 2013). A mill can also
supply the biogas-generated electricity to the national grid
to get additional income under the Feed-in-Tariff scheme
(SEDA (Sustainable Energy Development Authority of
Malaysia) 2012). As of July 2017, biogas plants have been
constructed at 94 mills in Malaysia with another eight
facilities under construction while 144 sites are under such
planning (Astimar et al., 2017).
2. Advantages and benefits
Trapped biogas from palm oil milling sector to be used as
an energy source can potentially avoid about 17 million
tonnes (Mt) (1.7 x 10⁷) of CO2 equivalent (CO2e) (Astimar et
al., 2017). In particular, unrecovered methane emissions
from POME that escape to the atmosphere may contribute
towards greater global warming and climate change,
because methane is a more potent greenhouse gas that has
72 times the global warming potential of CO2 measured
over 20 years and 21 to 25 times over 100 years. This
problem has been exacerbated by an increasing number of
palm oil mills in Malaysia from just about 10 mills in 1960 to
454 operating mills in 2017 (Malaysian Palm Oil Board
2018), and oil palm has the largest agricultural plantation
acreage and production in the country compared with other
major crops (Department of Statistics Malaysia 2017).
A life cycle assessment study on Malaysian palm oil
milling reveals that uncaptured methane emissions from
POME contributes the highest environmental impact
towards climate change in the country and is responsible in
making the overall industry, not environmental friendly
(Subramaniam et al., 2008). The unrecovered and
unutilised methane-rich biogas from the aerobic
decomposition of the POME wastewater treatment process
has also been highlighted in a post-evaluation of the BioGen
project (Aldover et al., 2010). Additionally, the potential
revenue from generating bioenergy may be used to offset
POME treatment cost. Based on the reported amount of oil
palm fresh fruit bunch processed in 2015, an estimated
548MW of electricity can potentially be generated
(assuming power output at 40%) (Astimar et al., 2017).
3. Technical and commercial challenges
By 2020, it is not allowed by regulations to treat POME in
Malaysian palm oil mills through the current conventional
way of using open ponds or lagoons (i.e., open digesting
tanks) because valuable biomethane is released to the
atmosphere in such systems besides being a GHG emission
source (Loh et al., 2017). An alternative to converting the
bulk of POME to biomethane is to use a closed anaerobic
digester system in the first treatment stage to handle the
high organic matters in the wastes. A covered lagoon system
can be installed directly and cost-effectively using floating
plastic membranes on open ponds; in that way, the released
biomethane is captured and retained within the floating
covers (Lam et al., 2011). Such a biogas capture system has
been applied in Malaysia in flaring, as boiler fuel in power
and heat generation, and as feedstock in hydrogen
production (Tong et al., 2004; 2005; NOVAVIRO
Technology Sdn Bhd 2010). Moving forward, we can employ
ASM Science Journal, Volume 12, 2019
15
high-rate anaerobic digesting tank systems for optimal
biogas generation to produce electricity (Najafpour et al.,
2006; Poh et al., 2009; Ahmed et al., 2015). However, to
benefit from the FiT scheme incentive by connecting to the
national electricity grid, a constraint is the remote location
of most mills. In this regard, we advocate implementing a
smart grid for renewable resources remote from the
national grid (Electric Power Research Institute (EPRI)
2008). An example pertains to mills in Sabah, in which it is
expected to be costlier to subsidise diesel generation than to
put up a smart grid interconnection to a few such mills.
V. EMERGING RENEWABLE ENERGY OPTIONS FOR
ELECTRICITY GENERATION IN
MALAYSIA
Several electricity generation alternatives from low carbon
energy options are available or currently considered under
various development stages in Malaysia. They include the
following (in no particular order): small hydroelectricity
(Table 7), fuels and electricity from oil palm biomass,
municipal solid waste decomposition (Table 9), thorium-
based nuclear power (Table 10), ocean thermal energy
conversion (OTEC) (Table 11), and hydrogen using fuel cells
(Table 12). This section provides an overview of the
advantages or benefits within the Malaysian context and
delineates several challenges faced for these alternatives. A
summary of the potential of these options considered is
given in Table 13.
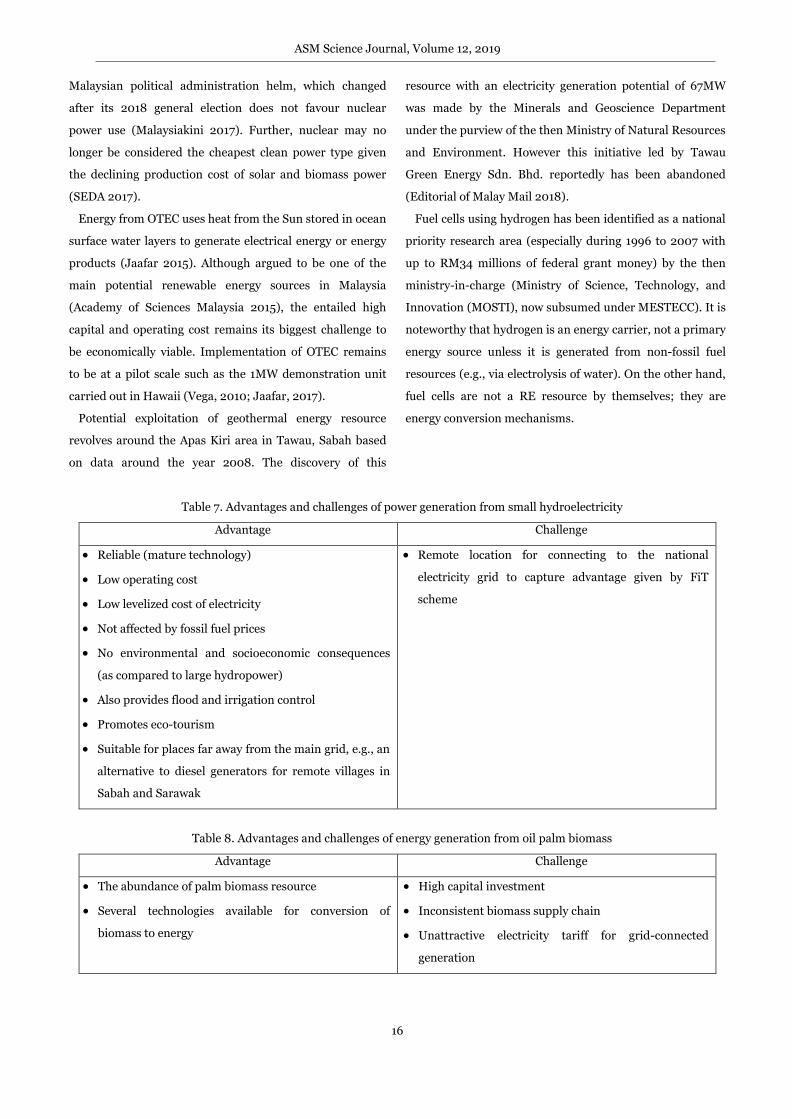
Small scale hydropower stations offer low operating cost
besides the reliability of employing a mature technology. A
small hydroelectric facility is especially suitable for
implementation in locations far away from the main
electricity grid that faces difficulty to receive grid-fed power
supply (Ong et al., 2011). According to SEDA statistics,
there are 60 applications with feed-in tariff approval for
small hydropower projects in 2017. The cumulative capacity
of 538.48MW of small hydropower projects are in progress
under the FiT scheme with a total commissioned installed
capacity of 30.30MW with annual energy generation of
64.60GWh in 2017 (SEDA 2018). An estimated 490–
500MW of small hydropower is potentially available in
Malaysia by 2020 (KeTTHA 2008a).
Second-generation fuels (such as bio-oil) derived from
palm oil biomass offers more advantages at least from an
ethical perspective in replacing fossil fuels by obviating
competition and conflict with human food supply and
animal feed. An estimate indicates the potential of
generating 1340MW grid-connected electricity from palm
biomass by 2030 (Haris et al., 2009) (Malaysian Industry-
Government Group for High Technology (MIGHT) 2013).
The Malaysian National Innovation Agency (AIM, now non-
operational) has created a biomass processing hub in the
East Malaysian state of Sarawak, which is billed as the first
of such a facility in Southeast Asia. The hub receives
investment from Brooke Renewables, a consortium of
international biofuel companies and includes a commercial
second-generation bioethanol plant supported by enzyme
technology from Beta Renewables, which operates the
world’s first second-generation bioethanol plant in Italy
(Crescentino) (PEMANDU (Performance Management &
Delivery Unit of Malaysian Government) 2013).
Apart from methane recovery from POME, biogas can also
be produced from landfills in Malaysia by decomposing
municipal solid waste (MSW). The captured landfill gas
(LFG) can be upgraded to pipeline-quality gas to produce
electricity or directly as fuels for powering homes, factories,
buildings, and vehicles. It is easier to design a new and
sanitary landfill for LFG utilisation than retrofitting at a
later stage as shown through the Bukit Tagar project by
KUB–Berjaya Enviro, which operates a 4-MW gas engine to
generate electricity and is reported to be in process of
connecting a larger capacity to the grid (as of end of 2018)
(KUB–Berjaya Enviro 2019). There is potential in
harnessing and further developing waste-to-energy options
using MSW to produce bioenergy forms in Malaysia (Chien
Bong et al., 2017).
As for nuclear energy, addressing its real and perceived
dangers is of the utmost importance for its deployment in
Malaysia, which may have generated greater concern in light
of the Fukushima Daiichi accident in 2011. In this regard,
use of thorium as a main fuel cycle for nuclear power shows
potential, particularly liquid fluoride thorium reactors
(LFTR) as compared to uranium which is the basic material
in today’s commercial technology. However, the present
ASM Science Journal, Volume 12, 2019
16
Malaysian political administration helm, which changed
after its 2018 general election does not favour nuclear
power use (Malaysiakini 2017). Further, nuclear may no
longer be considered the cheapest clean power type given
the declining production cost of solar and biomass power
(SEDA 2017).
Energy from OTEC uses heat from the Sun stored in ocean
surface water layers to generate electrical energy or energy
products (Jaafar 2015). Although argued to be one of the
main potential renewable energy sources in Malaysia
(Academy of Sciences Malaysia 2015), the entailed high
capital and operating cost remains its biggest challenge to
be economically viable. Implementation of OTEC remains
to be at a pilot scale such as the 1MW demonstration unit
carried out in Hawaii (Vega, 2010; Jaafar, 2017).
Potential exploitation of geothermal energy resource
revolves around the Apas Kiri area in Tawau, Sabah based
on data around the year 2008. The discovery of this
resource with an electricity generation potential of 67MW
was made by the Minerals and Geoscience Department
under the purview of the then Ministry of Natural Resources
and Environment. However this initiative led by Tawau
Green Energy Sdn. Bhd. reportedly has been abandoned
(Editorial of Malay Mail 2018).
Fuel cells using hydrogen has been identified as a national
priority research area (especially during 1996 to 2007 with
up to RM34 millions of federal grant money) by the then
ministry-in-charge (Ministry of Science, Technology, and
Innovation (MOSTI), now subsumed under MESTECC). It is
noteworthy that hydrogen is an energy carrier, not a primary
energy source unless it is generated from non-fossil fuel
resources (e.g., via electrolysis of water). On the other hand,
fuel cells are not a RE resource by themselves; they are
energy conversion mechanisms.
Table 7. Advantages and challenges of power generation from small hydroelectricity
Advantage Challenge
Reliable (mature technology)
Low operating cost
Low levelized cost of electricity
Not affected by fossil fuel prices
No environmental and socioeconomic consequences
(as compared to large hydropower)
Also provides flood and irrigation control
Promotes eco-tourism
Suitable for places far away from the main grid, e.g., an
alternative to diesel generators for remote villages in
Sabah and Sarawak
Remote location for connecting to the national
electricity grid to capture advantage given by FiT
scheme
Table 8. Advantages and challenges of energy generation from oil palm biomass
Advantage Challenge
The abundance of palm biomass resource
Several technologies available for conversion of
biomass to energy
High capital investment
Inconsistent biomass supply chain
Unattractive electricity tariff for grid-connected
generation
ASM Science Journal, Volume 12, 2019
17
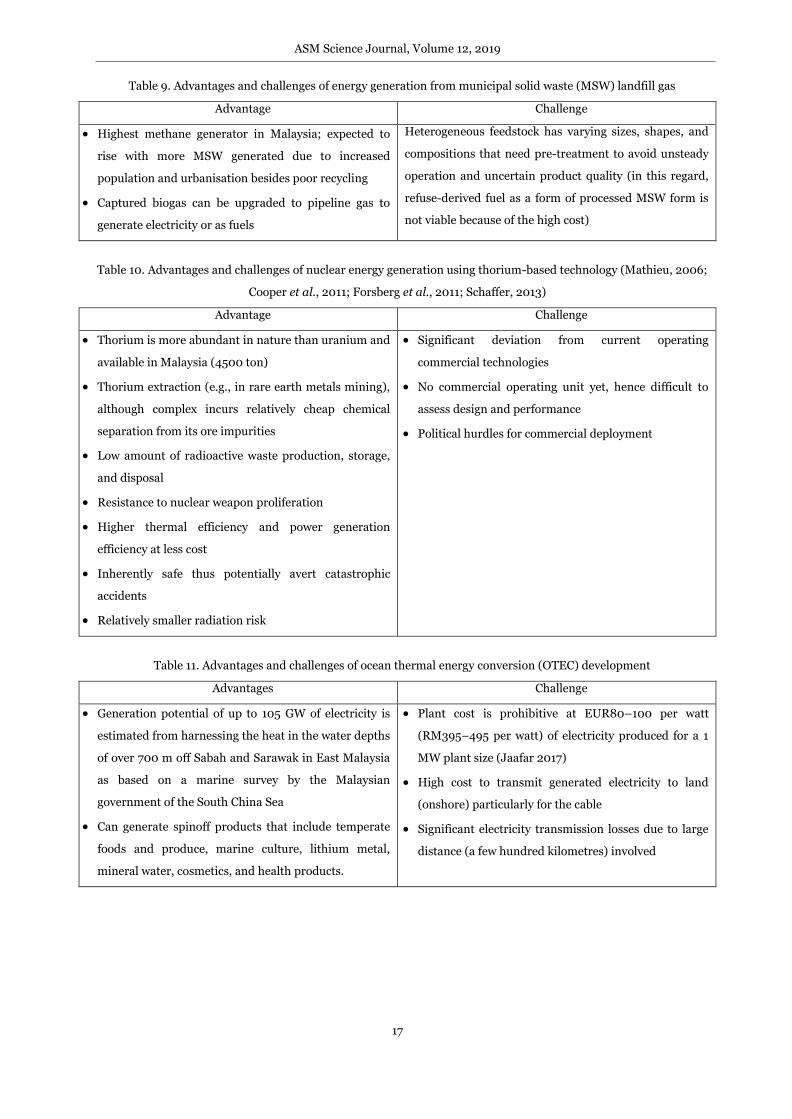
Table 9. Advantages and challenges of energy generation from municipal solid waste (MSW) landfill gas
Advantage Challenge
Highest methane generator in Malaysia; expected to
rise with more MSW generated due to increased
population and urbanisation besides poor recycling
Captured biogas can be upgraded to pipeline gas to
generate electricity or as fuels
Heterogeneous feedstock has varying sizes, shapes, and
compositions that need pre-treatment to avoid unsteady
operation and uncertain product quality (in this regard,
refuse-derived fuel as a form of processed MSW form is
not viable because of the high cost)
Table 10. Advantages and challenges of nuclear energy generation using thorium-based technology (Mathieu, 2006;
Cooper et al., 2011; Forsberg et al., 2011; Schaffer, 2013)
Advantage Challenge
Thorium is more abundant in nature than uranium and
available in Malaysia (4500 ton)
Thorium extraction (e.g., in rare earth metals mining),
although complex incurs relatively cheap chemical
separation from its ore impurities
Low amount of radioactive waste production, storage,
and disposal
Resistance to nuclear weapon proliferation
Higher thermal efficiency and power generation
efficiency at less cost
Inherently safe thus potentially avert catastrophic
accidents
Relatively smaller radiation risk
Significant deviation from current operating
commercial technologies
No commercial operating unit yet, hence difficult to
assess design and performance
Political hurdles for commercial deployment
Table 11. Advantages and challenges of ocean thermal energy conversion (OTEC) development
Advantages Challenge
Generation potential of up to 105 GW of electricity is
estimated from harnessing the heat in the water depths
of over 700 m off Sabah and Sarawak in East Malaysia
as based on a marine survey by the Malaysian
government of the South China Sea
Can generate spinoff products that include temperate
foods and produce, marine culture, lithium metal,
mineral water, cosmetics, and health products.
Plant cost is prohibitive at EUR80–100 per watt
(RM395–495 per watt) of electricity produced for a 1
MW plant size (Jaafar 2017)
High cost to transmit generated electricity to land
(onshore) particularly for the cable
Significant electricity transmission losses due to large
distance (a few hundred kilometres) involved
ASM Science Journal, Volume 12, 2019
18
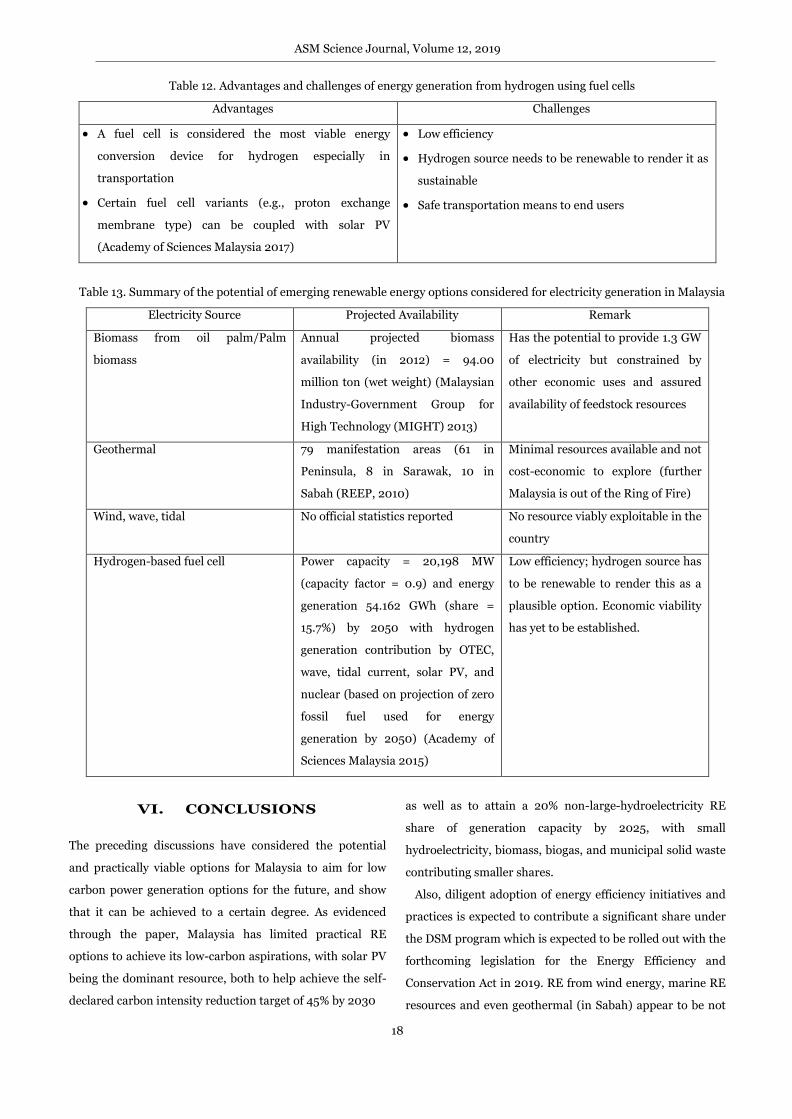
Table 12. Advantages and challenges of energy generation from hydrogen using fuel cells
Advantages Challenges
A fuel cell is considered the most viable energy
conversion device for hydrogen especially in
transportation
Certain fuel cell variants (e.g., proton exchange
membrane type) can be coupled with solar PV
(Academy of Sciences Malaysia 2017)
Low efficiency
Hydrogen source needs to be renewable to render it as
sustainable
Safe transportation means to end users
Table 13. Summary of the potential of emerging renewable energy options considered for electricity generation in Malaysia
Electricity Source Projected Availability Remark
Biomass from oil palm/Palm
biomass
Annual projected biomass
availability (in 2012) = 94.00
million ton (wet weight) (Malaysian
Industry-Government Group for
High Technology (MIGHT) 2013)
Has the potential to provide 1.3 GW
of electricity but constrained by
other economic uses and assured
availability of feedstock resources
Geothermal 79 manifestation areas (61 in
Peninsula, 8 in Sarawak, 10 in
Sabah (REEP, 2010)
Minimal resources available and not
cost-economic to explore (further
Malaysia is out of the Ring of Fire)
Wind, wave, tidal No official statistics reported No resource viably exploitable in the
country
Hydrogen-based fuel cell Power capacity = 20,198 MW
(capacity factor = 0.9) and energy
generation 54.162 GWh (share =
15.7%) by 2050 with hydrogen
generation contribution by OTEC,
wave, tidal current, solar PV, and
nuclear (based on projection of zero
fossil fuel used for energy
generation by 2050) (Academy of
Sciences Malaysia 2015)
Low efficiency; hydrogen source has
to be renewable to render this as a
plausible option. Economic viability
has yet to be established.
VI. CONCLUSIONS
The preceding discussions have considered the potential
and practically viable options for Malaysia to aim for low
carbon power generation options for the future, and show
that it can be achieved to a certain degree. As evidenced
through the paper, Malaysia has limited practical RE
options to achieve its low-carbon aspirations, with solar PV
being the dominant resource, both to help achieve the self-
declared carbon intensity reduction target of 45% by 2030
as well as to attain a 20% non-large-hydroelectricity RE
share of generation capacity by 2025, with small
hydroelectricity, biomass, biogas, and municipal solid waste
contributing smaller shares.
Also, diligent adoption of energy efficiency initiatives and
practices is expected to contribute a significant share under
the DSM program which is expected to be rolled out with the
forthcoming legislation for the Energy Efficiency and
Conservation Act in 2019. RE from wind energy, marine RE
resources and even geothermal (in Sabah) appear to be not
ASM Science Journal, Volume 12, 2019
19
available or viable for Malaysia to exploit, while the nuclear
option is avoided on safety and political considerations.
Solar PV in its various modes such as rooftop and ground-
mounted farms built to date and the approved LSS/USS
systems form the bulk of RE capacity. Similarly, anticipated
greater take-up of NEM and SelCo with the revised true net
energy metering as approved with effect from January 2019
can greatly enhance the share of the low carbon RE
generation capacity going forward.
Also as mentioned in the paper, the potential to harvest
the biomass and biogas generation capacity can be
significantly enhanced with the recommendation to develop
biomass–biogas grids to encourage and incentivize the
exploitation of these resources, especially to build up
adequate generation capacity in the east-coast region of
Sabah, where generation capacity shortfall has contributed
to poor supply reliability. With judicious strategies and cost-
effective incentivisation, the 20% RE share can be exceeded
by 2025 to enhance national energy security while
contributing to the global carbon emissions reduction
challenge.
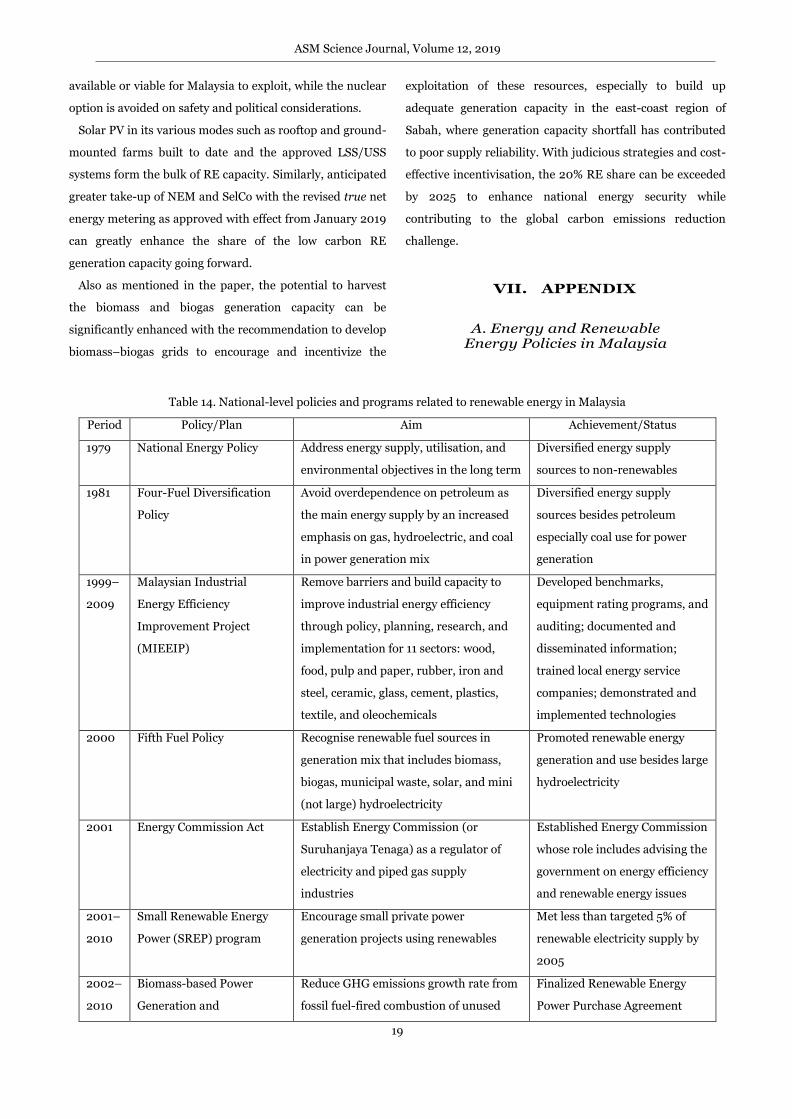
VII. APPENDIX
A. Energy and Renewable Energy Policies in Malaysia
Table 14. National-level policies and programs related to renewable energy in Malaysia
Period Policy/Plan Aim Achievement/Status
1979 National Energy Policy Address energy supply, utilisation, and
environmental objectives in the long term
Diversified energy supply
sources to non-renewables
1981 Four-Fuel Diversification
Policy
Avoid overdependence on petroleum as
the main energy supply by an increased
emphasis on gas, hydroelectric, and coal
in power generation mix
Diversified energy supply
sources besides petroleum
especially coal use for power
generation
1999–
2009
Malaysian Industrial
Energy Efficiency
Improvement Project
(MIEEIP)
Remove barriers and build capacity to
improve industrial energy efficiency
through policy, planning, research, and
implementation for 11 sectors: wood,
food, pulp and paper, rubber, iron and
steel, ceramic, glass, cement, plastics,
textile, and oleochemicals
Developed benchmarks,
equipment rating programs, and
auditing; documented and
disseminated information;
trained local energy service
companies; demonstrated and
implemented technologies
2000 Fifth Fuel Policy Recognise renewable fuel sources in
generation mix that includes biomass,
biogas, municipal waste, solar, and mini
(not large) hydroelectricity
Promoted renewable energy
generation and use besides large
hydroelectricity
2001 Energy Commission Act Establish Energy Commission (or
Suruhanjaya Tenaga) as a regulator of
electricity and piped gas supply
industries
Established Energy Commission
whose role includes advising the
government on energy efficiency
and renewable energy issues
2001–
2010
Small Renewable Energy
Power (SREP) program
Encourage small private power
generation projects using renewables
Met less than targeted 5% of
renewable electricity supply by
2005
2002–
2010
Biomass-based Power
Generation and
Reduce GHG emissions growth rate from
fossil fuel-fired combustion of unused
Finalized Renewable Energy
Power Purchase Agreement
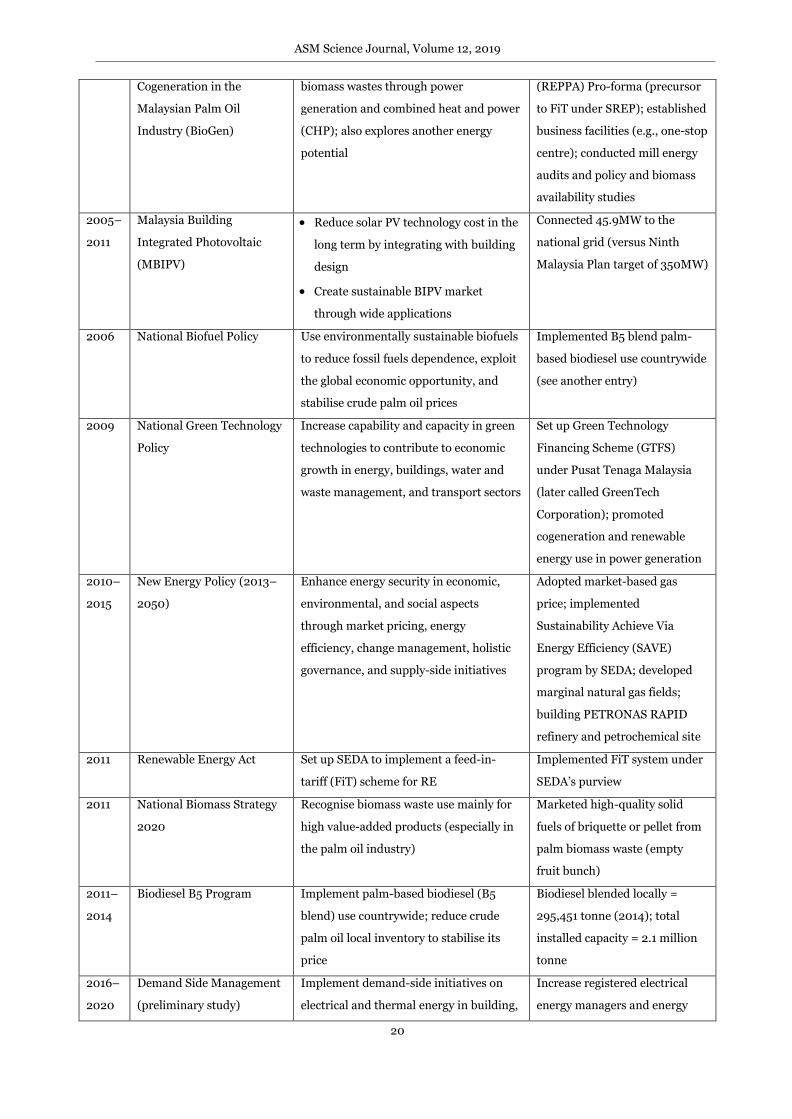
ASM Science Journal, Volume 12, 2019
20
Cogeneration in the
Malaysian Palm Oil
Industry (BioGen)
biomass wastes through power
generation and combined heat and power
(CHP); also explores another energy
potential
(REPPA) Pro-forma (precursor
to FiT under SREP); established
business facilities (e.g., one-stop
centre); conducted mill energy
audits and policy and biomass
availability studies
2005–
2011
Malaysia Building
Integrated Photovoltaic
(MBIPV)
Reduce solar PV technology cost in the
long term by integrating with building
design
Create sustainable BIPV market
through wide applications
Connected 45.9MW to the
national grid (versus Ninth
Malaysia Plan target of 350MW)
2006 National Biofuel Policy Use environmentally sustainable biofuels
to reduce fossil fuels dependence, exploit
the global economic opportunity, and
stabilise crude palm oil prices
Implemented B5 blend palm-
based biodiesel use countrywide
(see another entry)
2009 National Green Technology
Policy
Increase capability and capacity in green
technologies to contribute to economic
growth in energy, buildings, water and
waste management, and transport sectors
Set up Green Technology
Financing Scheme (GTFS)
under Pusat Tenaga Malaysia
(later called GreenTech
Corporation); promoted
cogeneration and renewable
energy use in power generation
2010–
2015
New Energy Policy (2013–
2050)
Enhance energy security in economic,
environmental, and social aspects
through market pricing, energy
efficiency, change management, holistic
governance, and supply-side initiatives
Adopted market-based gas
price; implemented
Sustainability Achieve Via
Energy Efficiency (SAVE)
program by SEDA; developed
marginal natural gas fields;
building PETRONAS RAPID
refinery and petrochemical site
2011 Renewable Energy Act Set up SEDA to implement a feed-in-
tariff (FiT) scheme for RE
Implemented FiT system under
SEDA’s purview
2011 National Biomass Strategy
2020
Recognise biomass waste use mainly for
high value-added products (especially in
the palm oil industry)
Marketed high-quality solid
fuels of briquette or pellet from
palm biomass waste (empty
fruit bunch)
2011–
2014
Biodiesel B5 Program Implement palm-based biodiesel (B5
blend) use countrywide; reduce crude
palm oil local inventory to stabilise its
price
Biodiesel blended locally =
295,451 tonne (2014); total
installed capacity = 2.1 million
tonne
2016–
2020
Demand Side Management
(preliminary study)
Implement demand-side initiatives on
electrical and thermal energy in building,
Increase registered electrical
energy managers and energy
ASM Science Journal, Volume 12, 2019
21
industry, household, and transport
sectors
service companies; implement
energy performance contracting
including to retrofit 100
government buildings;
introduce an enhanced time of
use electricity tariff (targets are
set to the year 2020)
2016–
2020
Net Energy Metering
(NEM) (and Self-
Consumption (SelCo,
2017))
Complement FiT by effecting electricity
self-consumption from solar PV and
allowing excess electricity generated to be
sold to TNB
Award 500MW quota over 5
years (annual maximum of
90MW for Peninsula and 10MW
for Sabah)
2017–
2020
Large Scale Solar (LSS) Develop solar PV plants that generate 1–
50MW electricity
Award projects quota of
1000MW over 4 years (annual
200MW for Peninsula and
10MW for Sabah)
2016 Biodiesel B7 and B10
programs
Increase to B7 and B10 biodiesel blends
including for commercial and power
generation use
Field trials for B10 palm
biodiesel (e.g., by MPOB)
showed good engine
performance with no
modification needed
Four-Fue
l Div
ersific
atio
n Pol
icy
Min
eral
Pol
icy
Fifth
Fuel P
olic
y
SREP, E
nerg
y Com
mission
Act
Gre
en T
echn
olog
y Pol
icy
Bio
fuel
Act
Bio
fuel
Pol
icy
New
Ene
rgy
Polic
y
Elect
ricity
Sup
ply
Act
Gas
Sup
ply
Act
Bio
mas
s Stra
tegy
202
0
Nat
iona
l Ene
rgy
Polic
y
2000
2001
1999
2010
Nat
iona
l Dep
letio
n Pol
icy
1979
1980
1981
2006
1993
1974
1975
Petro
leum
Dev
elop
men
t Act
Nat
iona
l Pet
role
um P
olic
y
2011
2012
2015
Dem
and
Side M
anag
emen
t
2016
1990
1998
Figure 11. Malaysia: Timeline of energy-related policies and initiatives
B. Energy Efficiency Saving Estimations for Electricity Use in
Cooling Load
The efficiency of older chillers = 1.2kW per ton of refrigeration.
The efficiency of newer chillers = 0.7 kW per ton of refrigeration.
Efficiency gain = (1.2 – 0.7) = 0.5 kW per ton of refrigeration.
Annual operating time = (10 hour/day) × (22 day/month) × (12 month/year) = 2640 hour/year.
Annual electricity saving = (0.5kW/ton refrigerant) × (2640 hour/year) = 1320kWh/ton refrigerant-year.
Commercial electricity tariff (average) = 0.40RM/kWh.
Annual electricity cost saving in commercial sector = (0.40RM/kWh) × (1320kWh/ton refrigerant-year) = 528RM/ton
refrigerant-year
ASM Science Journal, Volume 12, 2019
22
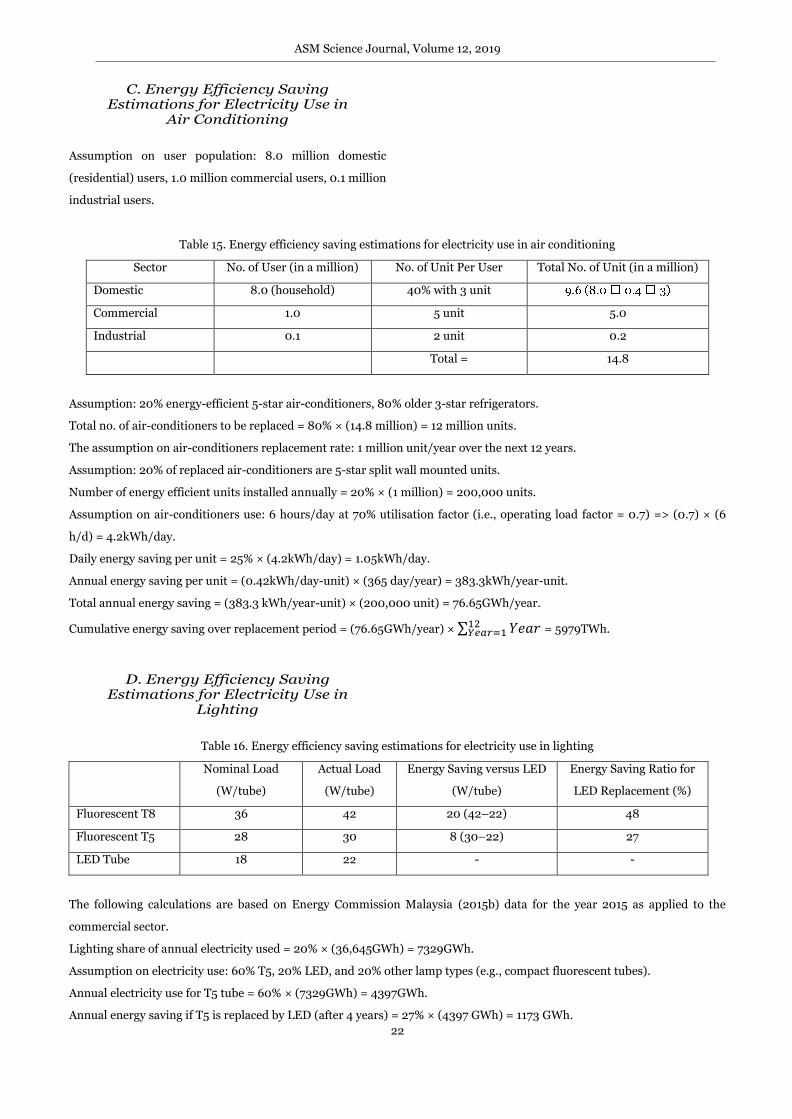
C. Energy Efficiency Saving Estimations for Electricity Use in
Air Conditioning
Assumption on user population: 8.0 million domestic
(residential) users, 1.0 million commercial users, 0.1 million
industrial users.
Table 15. Energy efficiency saving estimations for electricity use in air conditioning
Sector No. of User (in a million) No. of Unit Per User Total No. of Unit (in a million)
Domestic 8.0 (household) 40% with 3 unit
Commercial 1.0 5 unit 5.0
Industrial 0.1 2 unit 0.2
Total = 14.8
Assumption: 20% energy-efficient 5-star air-conditioners, 80% older 3-star refrigerators.
Total no. of air-conditioners to be replaced = 80% × (14.8 million) = 12 million units.
The assumption on air-conditioners replacement rate: 1 million unit/year over the next 12 years.
Assumption: 20% of replaced air-conditioners are 5-star split wall mounted units.
Number of energy efficient units installed annually = 20% × (1 million) = 200,000 units.
Assumption on air-conditioners use: 6 hours/day at 70% utilisation factor (i.e., operating load factor = 0.7) => (0.7) × (6
h/d) = 4.2kWh/day.
Daily energy saving per unit = 25% × (4.2kWh/day) = 1.05kWh/day.
Annual energy saving per unit = (0.42kWh/day-unit) × (365 day/year) = 383.3kWh/year-unit.
Total annual energy saving = (383.3 kWh/year-unit) × (200,000 unit) = 76.65GWh/year.
Cumulative energy saving over replacement period = (76.65GWh/year) × ∑ 𝑌𝑒𝑎𝑟12𝑌𝑒𝑎𝑟=1 = 5979TWh.
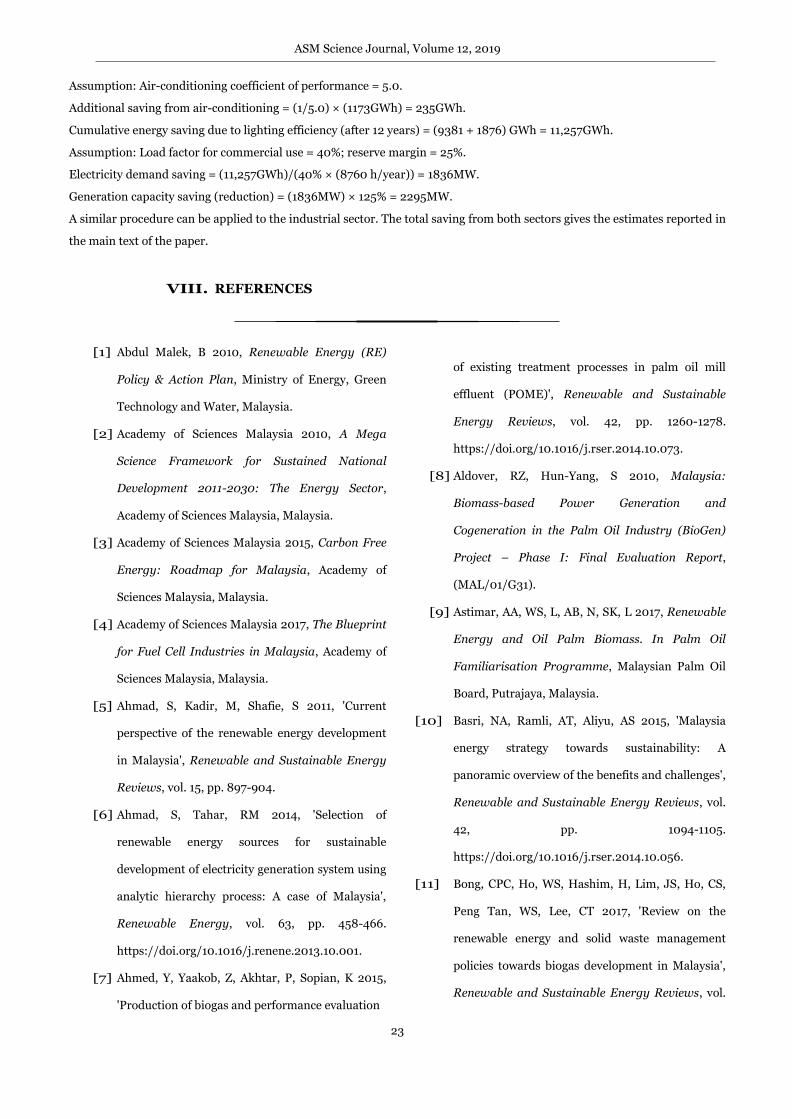
D. Energy Efficiency Saving Estimations for Electricity Use in
Lighting
Table 16. Energy efficiency saving estimations for electricity use in lighting
Nominal Load
(W/tube)
Actual Load
(W/tube)
Energy Saving versus LED
(W/tube)
Energy Saving Ratio for
LED Replacement (%)
Fluorescent T8 36 42 20 (42–22) 48
Fluorescent T5 28 30 8 (30–22) 27
LED Tube 18 22 - -
The following calculations are based on Energy Commission Malaysia (2015b) data for the year 2015 as applied to the
commercial sector.
Lighting share of annual electricity used = 20% × (36,645GWh) = 7329GWh.
Assumption on electricity use: 60% T5, 20% LED, and 20% other lamp types (e.g., compact fluorescent tubes).
Annual electricity use for T5 tube = 60% × (7329GWh) = 4397GWh.
Annual energy saving if T5 is replaced by LED (after 4 years) = 27% × (4397 GWh) = 1173 GWh.
ASM Science Journal, Volume 12, 2019
23
Assumption: Air-conditioning coefficient of performance = 5.0.
Additional saving from air-conditioning = (1/5.0) × (1173GWh) = 235GWh.
Cumulative energy saving due to lighting efficiency (after 12 years) = (9381 + 1876) GWh = 11,257GWh.
Assumption: Load factor for commercial use = 40%; reserve margin = 25%.
Electricity demand saving = (11,257GWh)/(40% × (8760 h/year)) = 1836MW.
Generation capacity saving (reduction) = (1836MW) × 125% = 2295MW.
A similar procedure can be applied to the industrial sector. The total saving from both sectors gives the estimates reported in
the main text of the paper.
VIII. REFERENCES
[1] Abdul Malek, B 2010, Renewable Energy (RE)
Policy & Action Plan, Ministry of Energy, Green
Technology and Water, Malaysia.
[2] Academy of Sciences Malaysia 2010, A Mega
Science Framework for Sustained National
Development 2011-2030: The Energy Sector,
Academy of Sciences Malaysia, Malaysia.
[3] Academy of Sciences Malaysia 2015, Carbon Free
Energy: Roadmap for Malaysia, Academy of
Sciences Malaysia, Malaysia.
[4] Academy of Sciences Malaysia 2017, The Blueprint
for Fuel Cell Industries in Malaysia, Academy of
Sciences Malaysia, Malaysia.
[5] Ahmad, S, Kadir, M, Shafie, S 2011, 'Current
perspective of the renewable energy development
in Malaysia', Renewable and Sustainable Energy
Reviews, vol. 15, pp. 897-904.
[6] Ahmad, S, Tahar, RM 2014, 'Selection of
renewable energy sources for sustainable
development of electricity generation system using
analytic hierarchy process: A case of Malaysia',
Renewable Energy, vol. 63, pp. 458-466.
https://doi.org/10.1016/j.renene.2013.10.001.
[7] Ahmed, Y, Yaakob, Z, Akhtar, P, Sopian, K 2015,
'Production of biogas and performance evaluation
of existing treatment processes in palm oil mill
effluent (POME)', Renewable and Sustainable
Energy Reviews, vol. 42, pp. 1260-1278.
https://doi.org/10.1016/j.rser.2014.10.073.
[8] Aldover, RZ, Hun-Yang, S 2010, Malaysia:
Biomass-based Power Generation and
Cogeneration in the Palm Oil Industry (BioGen)
Project – Phase I: Final Evaluation Report,
(MAL/01/G31).
[9] Astimar, AA, WS, L, AB, N, SK, L 2017, Renewable
Energy and Oil Palm Biomass. In Palm Oil
Familiarisation Programme, Malaysian Palm Oil
Board, Putrajaya, Malaysia.
[10] Basri, NA, Ramli, AT, Aliyu, AS 2015, 'Malaysia
energy strategy towards sustainability: A
panoramic overview of the benefits and challenges',
Renewable and Sustainable Energy Reviews, vol.
42, pp. 1094-1105.
https://doi.org/10.1016/j.rser.2014.10.056.
[11] Bong, CPC, Ho, WS, Hashim, H, Lim, JS, Ho, CS,
Peng Tan, WS, Lee, CT 2017, 'Review on the
renewable energy and solid waste management
policies towards biogas development in Malaysia',
Renewable and Sustainable Energy Reviews, vol.
ASM Science Journal, Volume 12, 2019
24
70, pp. 988-998.
https://doi.org/10.1016/j.rser.2016.12.004.
[12] Chin, D, Lalchand, G, Khor, CS 2013, Sustainable
Energy Options for Electric Power Generation in
Peninsular Malaysia to 2030, (1/2013), Kuala
Lumpur, Malaysia.
[13] Chua, SC, Oh, TH 2010, 'Review on Malaysia’s
national energy developments: Key policies,
agencies, programmes and international
involvements', Renewable and Sustainable
Energy Reviews, vol. 14, pp. 2916-2925.
[14] Cooper, N, Minakata, D, Begovic, M, Crittenden, J
2011, 'Should We Consider Using Liquid Fluoride
Thorium Reactors for Power Generation?',
Environmental Science & Technology, vol. 45, pp.
6237-6238.
[15] Danish Energy Agency 2018, Denmark’s Energy
and Climate Outlook 2018: Baseline Scenario
Projection Towards 2030 with Existing Measures
(Frozen Policy), Copenhagen, pp. 26.
[16] Department of Statistics Malaysia 2018, Selected
Agricultural Indicators, Malaysia, 2017, The
Office of Chief Statistician Malaysia, Department
of Statistics Malaysia 2017 [cited 10 May 2018].
[17] Economic Planning Unit of Malaysia 2018a,
Demand Side Management (DSM) Preliminary
Study, Putrajaya, pp. 47.
[18] Economic Planning Unit of Malaysia 2018b,
Demand Side Management (DSM) Preliminary
Study, Putrajaya, pp. 283–284.
[19] Editorial of Malay Mail 2018, Sabah geothermal
power plant project found abandoned, Dewan
Rakyat told, The Malay Mail.
[20] Electric Power Research Institute (EPRI) 2008,
The Green Grid: Energy Savings and Carbon
Emissions Reductions Enabled by a Smart Grid,
California, p. 64.
[21] Energy Commission Malaysia. 2015a, Performance
and Statistical Information on Electricity Supply
Industry in Malaysia 2015, p. 10.
[22] Energy Commission Malaysia. 2015b, Performance
and Statistical Information on Electricity Supply
Industry in Malaysia 2015, p. 11.
[23] Energy Commission Malaysia 2016a, Guidelines
for Solar Photovoltaic Installation on Net Energy
Metering Scheme [Electricity Supply Act
(Amendment) 2015 (Act A1501)], in P.U.(A) 120,
edited by MEC Department of Electricity Supply
Regulation, Kuala Lumpur, Government of
Malaysia.
[24] Energy Commission Malaysia 2016b, Malaysia
Energy Statistics Handbook 2016, p. 9.
[25] Energy Commission Malaysia 2016c, Malaysia
Energy Statistics Handbook 2016, p. 33.
[26] Energy Commission Malaysia 2016d, Peninsular
Malaysia Electricity Supply Industry Outlook
2016, p. 45.
[27] Energy Commission Malaysia 2017, Peninsular
Malaysia Electricity Supply Industry Outlook
2017, pp. 24, 32.
[28] Energy Commission Malaysia 2017, Peninsular
Malaysia Electricity Supply Industry Outlook
2017, p. 33.
[29] Forsberg, C, Kazimi, M, Moniz, E. 2011, Future of
the Nuclear Fuel Cycle.
[30] Hanwa Q Cells GmBH Hanwa Q Cells GmBH
2014, http://www.q-cells.com.
[31] Haris, AH, Ding, J 2009, Final Report on National
Renewable Energy Policy and Action Plan, edited
by MBIPV Project c/o Pusat Tenaga Malaysia.
ASM Science Journal, Volume 12, 2019
25
[32] Hashim, H, Ho, WS 2011, 'Renewable energy
policies and initiatives for a sustainable energy
future in Malaysia', Renewable and Sustainable
Energy Reviews, vol. 15, no. 9, pp. 4780-4787.
http://doi.org/10.1016/j.rser.2011.07.073.
[33] International Renewable Energy Agency (IRENA)
2018, End-of-Life Management: Solar
Photovoltaic Panels, IRENA 2016 [cited 10 May
2018].
[34] Jaafar, AB 2015, Future Energy: Is OTEC the
Solution?, myForesight,vol. 3, pp. 4-9.
[35] Jaafar, AB 2017, ‘Ocean Thermal Energy
Conversion (OTEC)’, in National Workshop on
Ocean Energy, Universiti Teknologi Malaysia
(UTM), Kuala Lumpur.
[36] Joshi, D 2018, Evaluating the Performance of the
Sustainable Energy Development Authority
(SEDA) and Renewable Energy Policy in
Malaysia, Kuala Lumpur, pp. 48.
[37] Kavalec, C, Gorin T 2009, California Energy
Demand 2010 ‐ 2020, Adopted Forecast,
California Energy Commission, CEC ‐ 200 ‐
2009‐012‐CMF, p. 7.
[38] KeTTHA 2008a, National Renewable Energy
Policy and Action Plan. Kuala Lumpur, pp. 32-33.
[39] KeTTHA 2008b, National Renewable Energy
Policy and Action Plan, Kuala Lumpur, p. 38.
[40] KeTTHA 2009, Laporan Hasil Kajian Audit
Tenaga di Bangunan MOF dan Bangunan EPU.
[41] KUB–Berjaya Enviro 2019, ‘Presentation on Bukit
Tagar Sanitary Landfill: Our Commitment towards
Environmental Protection’, in Advanced Training
of Trainers (ToT) on River Pollution Public
Outreach Programme Kuala Lumpur, Malaysia,
Malaysian Capacity Development Network for
Sustainable Water Management (MyCDNet).
[42] Lalchand, G 2012, ‘Electricity demand and supply
in Peninsular Malaysia: Energy efficiency,
renewable energy, or nuclear?’, in Malaysia's
Energy Challenges, edited by C Teh Boon Sung.
[43] Lam, MK, Lee, KT 2011, 'Renewable and
sustainable bioenergies production from palm oil
mill effluent (POME): Win–win strategies toward
better environmental protection', Biotechnology
Advances, vol. 29, pp. 124-141.
[44] Larsen, K 2017, End-of-life PV: then what? -
Recycling solar PV panels, Elsevier Renewable
Energy Focus 2009 [cited 11 July 2017].
http://www.renewableenergyfocus.com/view/300
5/end-of-life-pv-then-what-recycling-solar-pv-
panels/.
[45] Loh, SK, Nasrin, AB, Mohamad Azri, S, Nurul
Adela, B, Muzzammil, N, Daryl Jay, T, Stasha
Eleanor, RA, Lim, WS, Choo, YM, Kaltschmitt, M
2017, 'First Report on Malaysia’s experiences and
development in biogas capture and utilization from
palm oil mill effluent under the Economic
Transformation Programme: Current and future
perspectives', Renewable and Sustainable Energy
Reviews, vol. 74, no. Supplement C, pp. 1257-1274.
https://doi.org/10.1016/j.rser.2017.02.066.
[46] Malandrino, O, Sica, D, Testa, M, Supino, S 2017,
'Policies and Measures for Sustainable
Management of Solar Panel End-of-Life in Italy',
Sustainability, vol. 9, no. 4, pp. 481.
[47] Malaysia, EC, 2015, Performance and Statistical
Information on Electricity Supply Industry in
Malaysia 2015, pp. 10.
ASM Science Journal, Volume 12, 2019
26
[48] Malaysiakini 2018, Nuclear power too costly and
risky, says Harapan 2017 [cited June 16 2018].
[49] Malaysian Industry–Government Group for High
Technology (MIGHT) 2013, Malaysian Biomass
Industry Action Plan 2020: Driving SMEs
Towards Sustainable Future, Cyberjaya, Selangor,
pp. 2.
[50] Malaysian Palm Oil Board 2018, Number and
capacities of palm oil sectors in operation as at
december 2017 (tonnes/year), MPOB 2018 [cited
10 May 2018].
[51] Mathieu, LH, D.; Brissot, R.; Garzenne, C.; Le
Brun, C.; Lecarpentier, D.; Liatard, E.; Loiseaux,
J.-M.; Me´plan, O.; Merle-Lucotte, E.; Nuttin, A.;
Walle, E.; Wilson, J. 2006, 'The thorium molten
salt reactor: Moving on from the MSBR', Progress
in Nuclear Energy, vol. 48, no. 7, pp. 664-679.
10.1016/j.pnucene.2006.07.005.
[52] Mekhilef, S, Barimani, M, Safari, A, Salam, Z 2014,
'Malaysia’s renewable energy policies and
programs with green aspects', Renewable and
Sustainable Energy Reviews, vol. 40, pp. 497-504.
https://doi.org/10.1016/j.rser.2014.07.095.
[53] Najafpour, GD, Zinatizadeh, AAL, Mohamed, AR,
Hasnain Isa, M, Nasrollahzadeh, H 2006, 'High-
rate anaerobic digestion of palm oil mill effluent in
an upflow anaerobic sludge-fixed film bioreactor',
Process Biochemistry, vol. 41, no. 2, pp. 370-379.
https://doi.org/10.1016/j.procbio.2005.06.031.
[54] Nelson, J 2011, ‘Over the Limit: Strategies for High
Efficiency’, in The Physics of Solar Cells, Imperial
College Press.
[55] NOVAVIRO Technology Sdn Bhd NOVAVIRO
Technology Sdn Bhd, 23 August 2010 2010.
http://novaviro.com.my/.
[56] Oh, TH, Pang, SY, Chua, SC 2010, 'Energy policy
and alternative energy in Malaysia: Issues and
challenges for sustainable growth', Renewable and
Sustainable Energy Reviews, vol. 14, pp. 1241–
1252.
[57] Oh, TH, Hasanuzzaman, M, Selvaraj, J, Teo, SC,
Chua, SC 2018, 'Energy policy and alternative
energy in Malaysia: Issues and challenges for
sustainable growth – An update', Renewable and
Sustainable Energy Reviews, vol. 81, pp. 3021-
3031.
[58] Ong, HC, Mahlia, TMI, Masjuki, HH 2011, 'A
review on energy scenario and sustainable energy
in Malaysia', Renewable and Sustainable Energy
Reviews, vol. 15, pp. 639–647.
[59] PEMANDU 2010, Economic Transformation
Programme: A Roadmap for Malaysia,
http://etp.pemandu.gov.my/Download_Centre-@-
Download_Centre.aspx.
[60] PEMANDU (Performance Management & Delivery
Unit of Malaysian Government) 2017, Economic
Transformation Programme: Palm Oil & Rubber
2013 [cited 25 September 2017].
http://etp.pemandu.gov.my/Palm_Oil-@-
Palm_Oil_-%E2%97%98-_Rubber.aspx.
[61] Poh, PE, Chong, MF 2009, 'Development of
anaerobic digestion methods for palm oil mill
effluent (POME) treatment', Bioresource
Technology, vol. 100, no. 1, pp. 1-9.
https://doi.org/10.1016/j.biortech.2008.06.022.
[62] REEEP (Renewable Energy & Energy Efficiency
Partnership) 2010, Policy Database: Malaysia
(country profile). https://www.reeep.org/
[63] Schaffer, MB 2013, 'Abundant thorium as an
alternative nuclear fuel: important waste disposal
ASM Science Journal, Volume 12, 2019
27
and weapon proliferation advantages', Energy
Policy, vol. 60, pp. 4-12.
[64] Sustainable Energy Development Authority
(SEDA) Malaysia 2017, ‘Current Status and
Projections for RE Power Generation for Malaysia’,
in Half Day Workshop on Low Carbon Energy
Alternatives in Malaysia, edited by ARA Samah,
Wisma IEM (Institution of Engineers Malaysia),
Petaling Jaya, Selangor.
[65] Sustainable Energy Development Authority
(SEDA) Malaysia 2018, Annual Report 2017,
Putrajaya, pp. 39, 41, 42, 45.
[66] Sustainable Energy Development Authority
(SEDA) Malaysia 2012, ‘The Renewable Energy
Roadmap’, in National Energy Security 2012
Conference, Kuala Lumpur.
[67] Azah Ahmad 2019, Sustainable Energy
Development Authority (SEDA) Malaysia,
presented during the briefing on the New NEM,
Introduction to Self-Consumption (SelCo), and
RPVI (Registered Solar PV Investor) Directory
Application. Marriott Hotel, Putrajaya, 18 March
2019.
[68] SIRIM 2013, Renewable Energy Resource Map of
Malaysia (MYREMap), SIRIM, Shah Alam,
Selangor.
[69] Sovacool, B 2010, 'A comparative analysis of
renewable electricity support mechanisms for
Southeast Asia', Energy, vol. 35, no. 4, pp. 1779-
1793. 10.1016/j.energy.2009.12.030.
[70] Subramaniam, V, Ma, AN, Choo, YM, Sulaiman,
NMN 2008, 'Environmental performance of the
milling process of Malaysian palm oil using the life
cycle assessment approach', Am J Environ Sci, vol.
4, pp. 310-315.
[71] SunPower Corporation SunPower 2014,
http://us.sunpower.com.
[72] Swedish Energy Agency 2015, Energy in Sweden
2015.
[73] Tong, SL, Jaafar, AB 2004, ‘Waste to energy:
methane recovery from anaerobic digestion of palm
oil mill effluent’, Energy Smart, vol. 14, pp. 4-11.
[74] Tong, SL, Jaafar, AB. 2005, ‘POME biogas capture,
upgrading and utilisation’, in PIPOC 2005
International Palm Oil Congress, Petaling Jaya,
Selangor, Malaysia. p. 328-336.
[75] Vega, LA 2010, ‘Economics of Ocean Thermal
Energy Conversion (OTEC): An Update’, in
Offshore Technology Conference 2010, Houston,
Texas, USA.
[76] Wu, TY, Mohammad, AW, Jahim, JM, Anuar, N
2010, 'Pollution control technologies for the
treatment of palm oil mill effluent (POME) through
end-of-pipe processes', J Environ Manage, vol. 91,
pp. 1467-1490.
[77] Yeo, BY 2018, ‘Ministerial keynote address’, in
International GreenTech and Eco Products
Exhibition and Conference Malaysia (IGEM) 2018,
Kuala Lumpur, Malaysia.